Verdict - Nyligen optimerad för kontor och detaljhandel
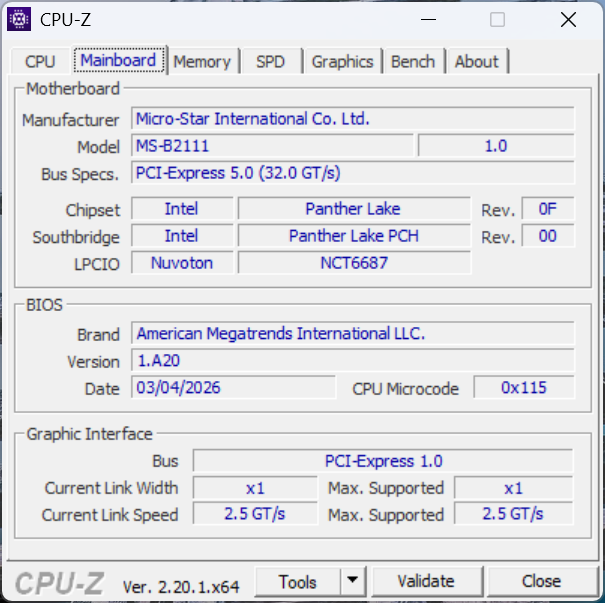
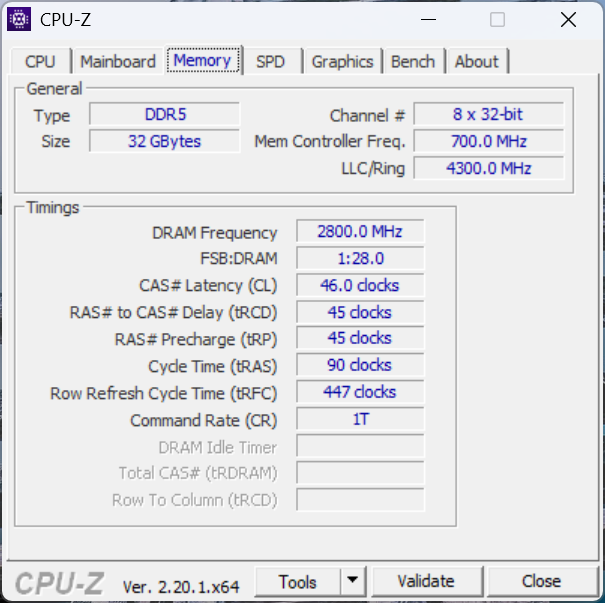
Det kanske inte ser så ut vid första anblicken, men Cubi NUC AI+ 3MG är ett betydande steg framåt jämfört med förra årets Cubi NUC AI+ 2MG. Det finns många förändringar under huven, inklusive ett reviderat moderkort med löstagbart RAM-minne, en ännu enklare serviceprocedur, fler användbara portar och en mycket mindre, diskret design för att bättre smälta in i mer professionella miljöer. Faktum är att detta är en av de minsta Intel mini PC-datorerna med stöd för upp till 128 GB flyttbart minne. Den betydande CPU-prestandaförbättringen tar också itu med en av de största farhågorna med den äldre Lunar Lake-modellen.
Å andra sidan innebär den mindre storleken vissa kompromisser. MicroSD-läsaren från förra årets modell är nu borta och det finns ingen integrerad högtalare som skulle ha gjort systemet mer mångsidigt. Kärntemperaturen är generellt sett varmare och fläktljudet är inte nödvändigtvis bättre eller sämre än tidigare. Den relativt stora strömkällan, som är nästan lika tung som själva minidatorn, kan vara svår att stoppa undan beroende på miljön. Och slutligen, även om den höga RAM-kapaciteten är en framträdande egenskap, har andra aspekter fått stå tillbaka, inklusive lokal lagring och GPU-prestanda, eftersom konkurrerande modeller som GMK EVO-X1 eller Asus NUC 15 Pro+ är alla snabbare maskiner med fler lagringsalternativ.
För
Emot
Pris och tillgänglighet
Newegg levererar för närvarande barebones MSI Cubi NUC AI + 3MG med Core Ultra 9 CPU för $ 830. Om den konfigureras med 32 GB RAM hoppar priset upp till 1220 $.
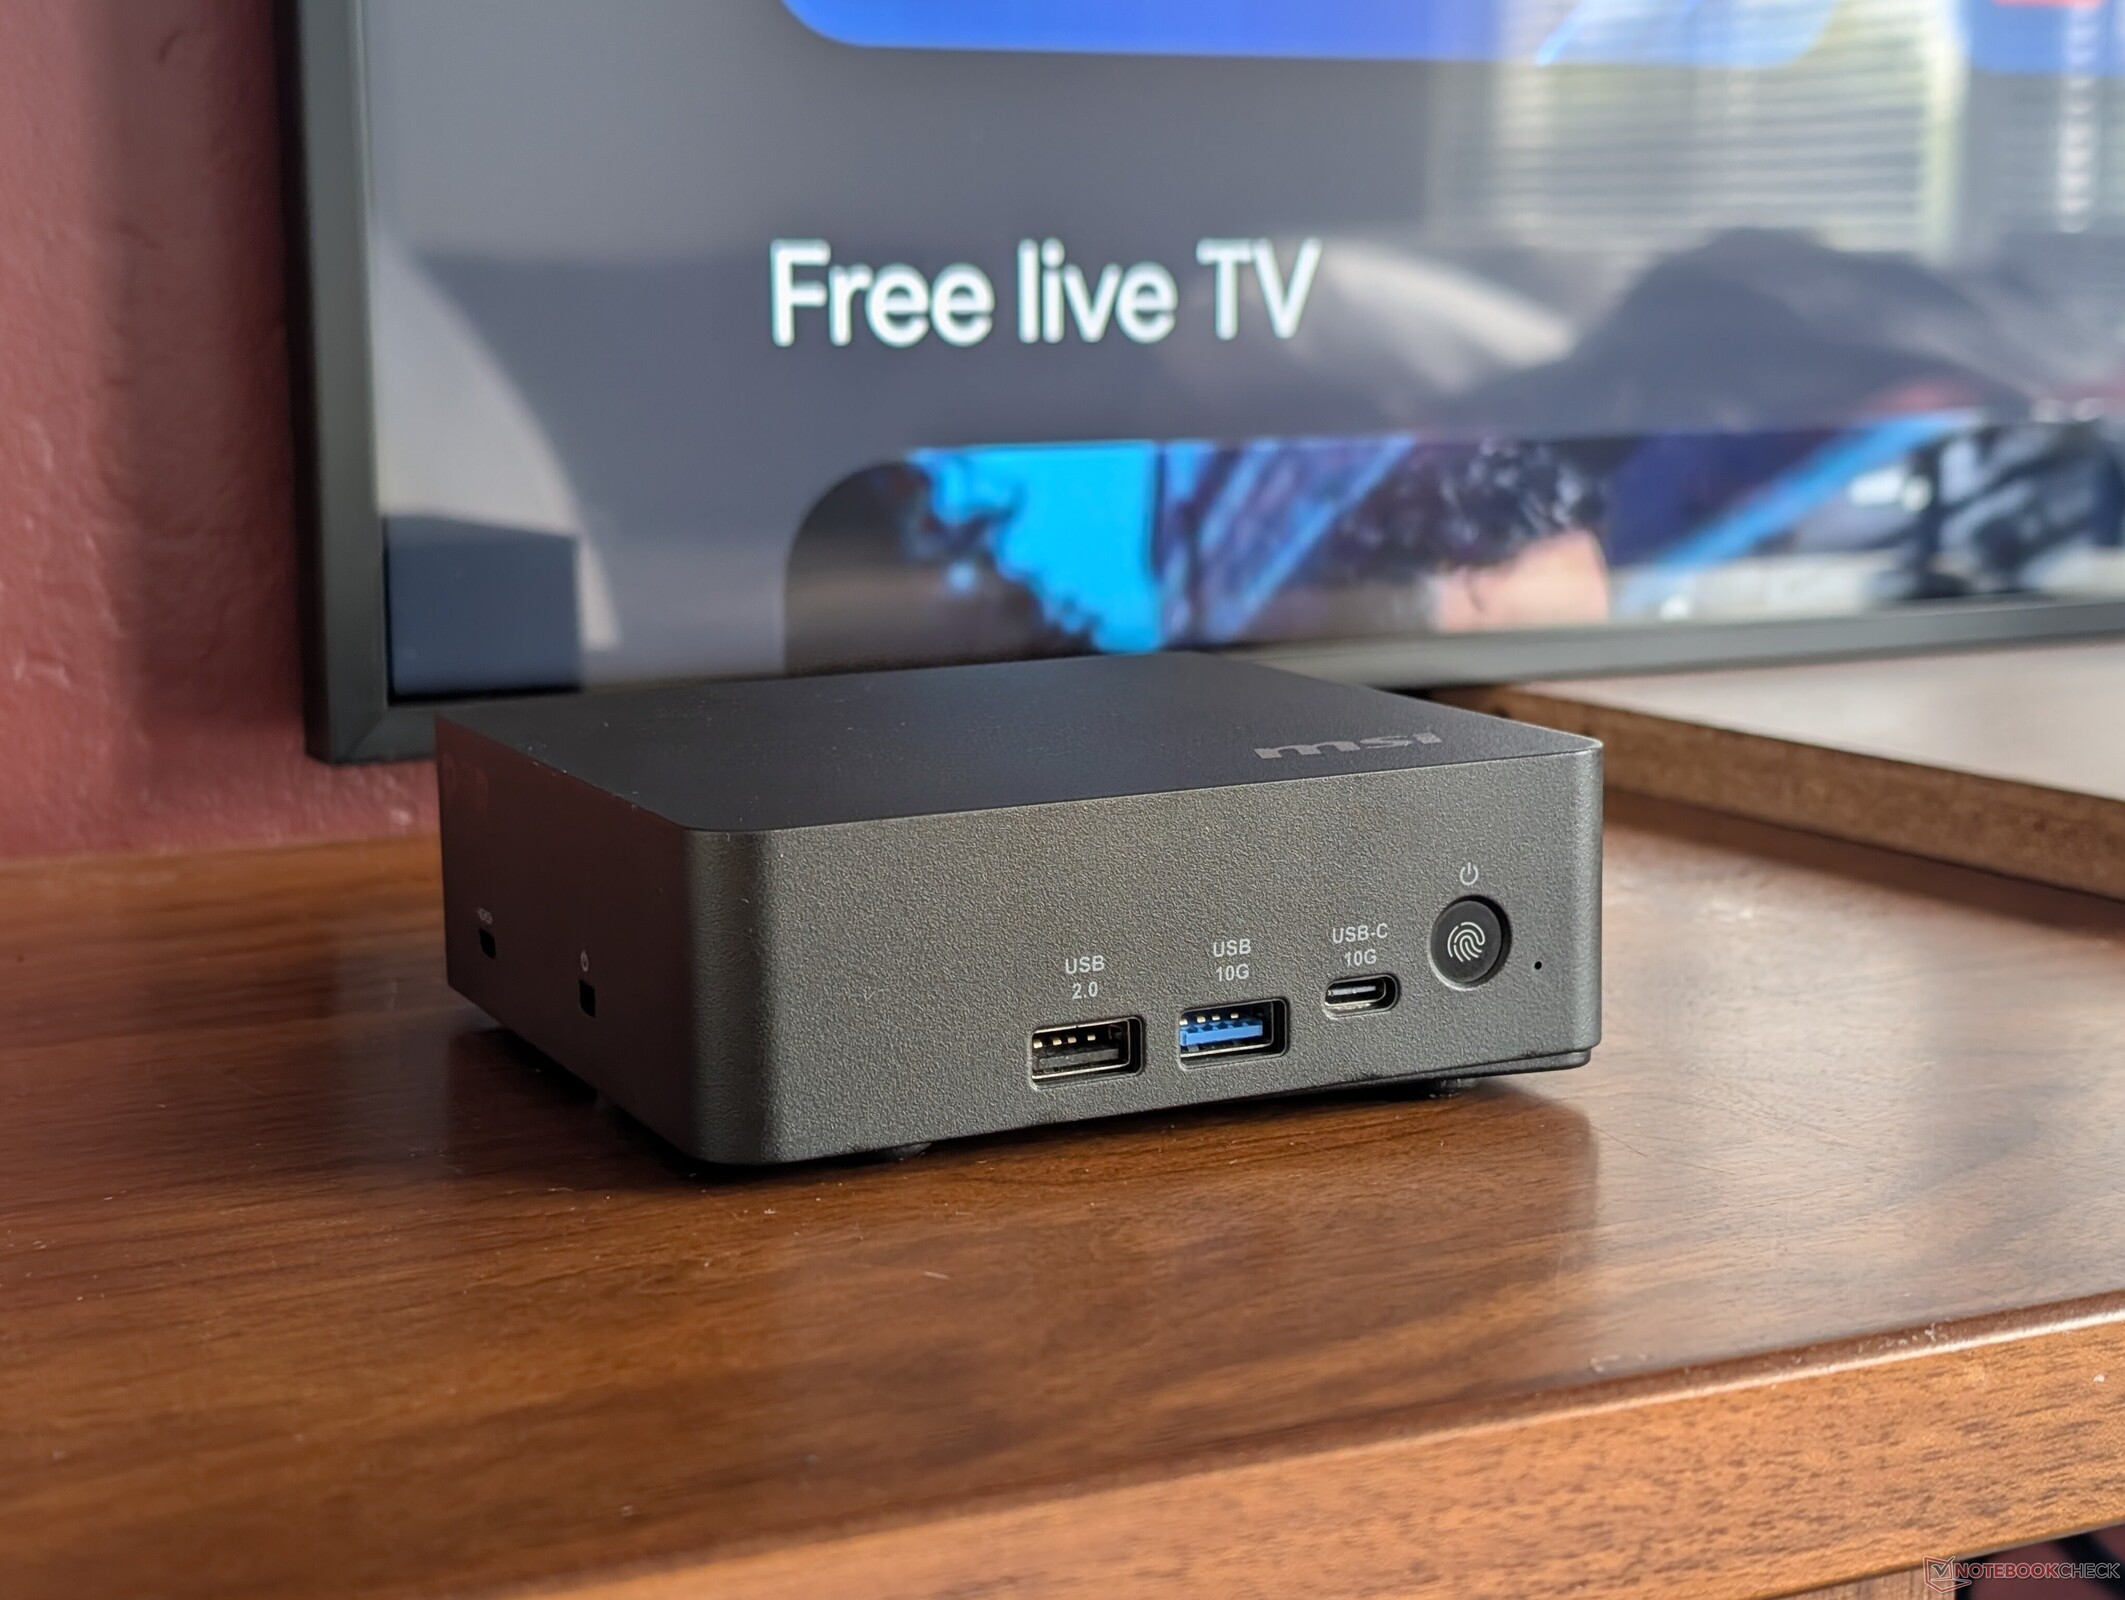
Cubi NUC AI+ 3MG är en efterföljare till förra årets Förra årets Cubi NUC AI+ 2MG genom att byta ut Intel Lunar Lake-processorn mot nyare Panther Lake-alternativ. Den externa designen har också ändrats och är nu märkbart mindre och lättare än tidigare.
Vår testenhet är en avancerad konfiguration med Core Ultra 9 386H CPU för cirka 1100 $ om den konfigureras med RAM och lagring. Tack och lov finns barebones-alternativ tillgängliga till lägre startpriser. SKU: er med Core Ultra 5 och Core Ultra 7 på ingångsnivå finns också tillgängliga.
Cubi NUC AI+ 3MG konkurrerar med andra företagscentrerade minidatorer för detaljhandel och kontor som GMK EVO-serien, Asus NUC 15 Pro+eller HP EliteBoard G1a AI.
Fler MSI-recensioner:
Specifikationer
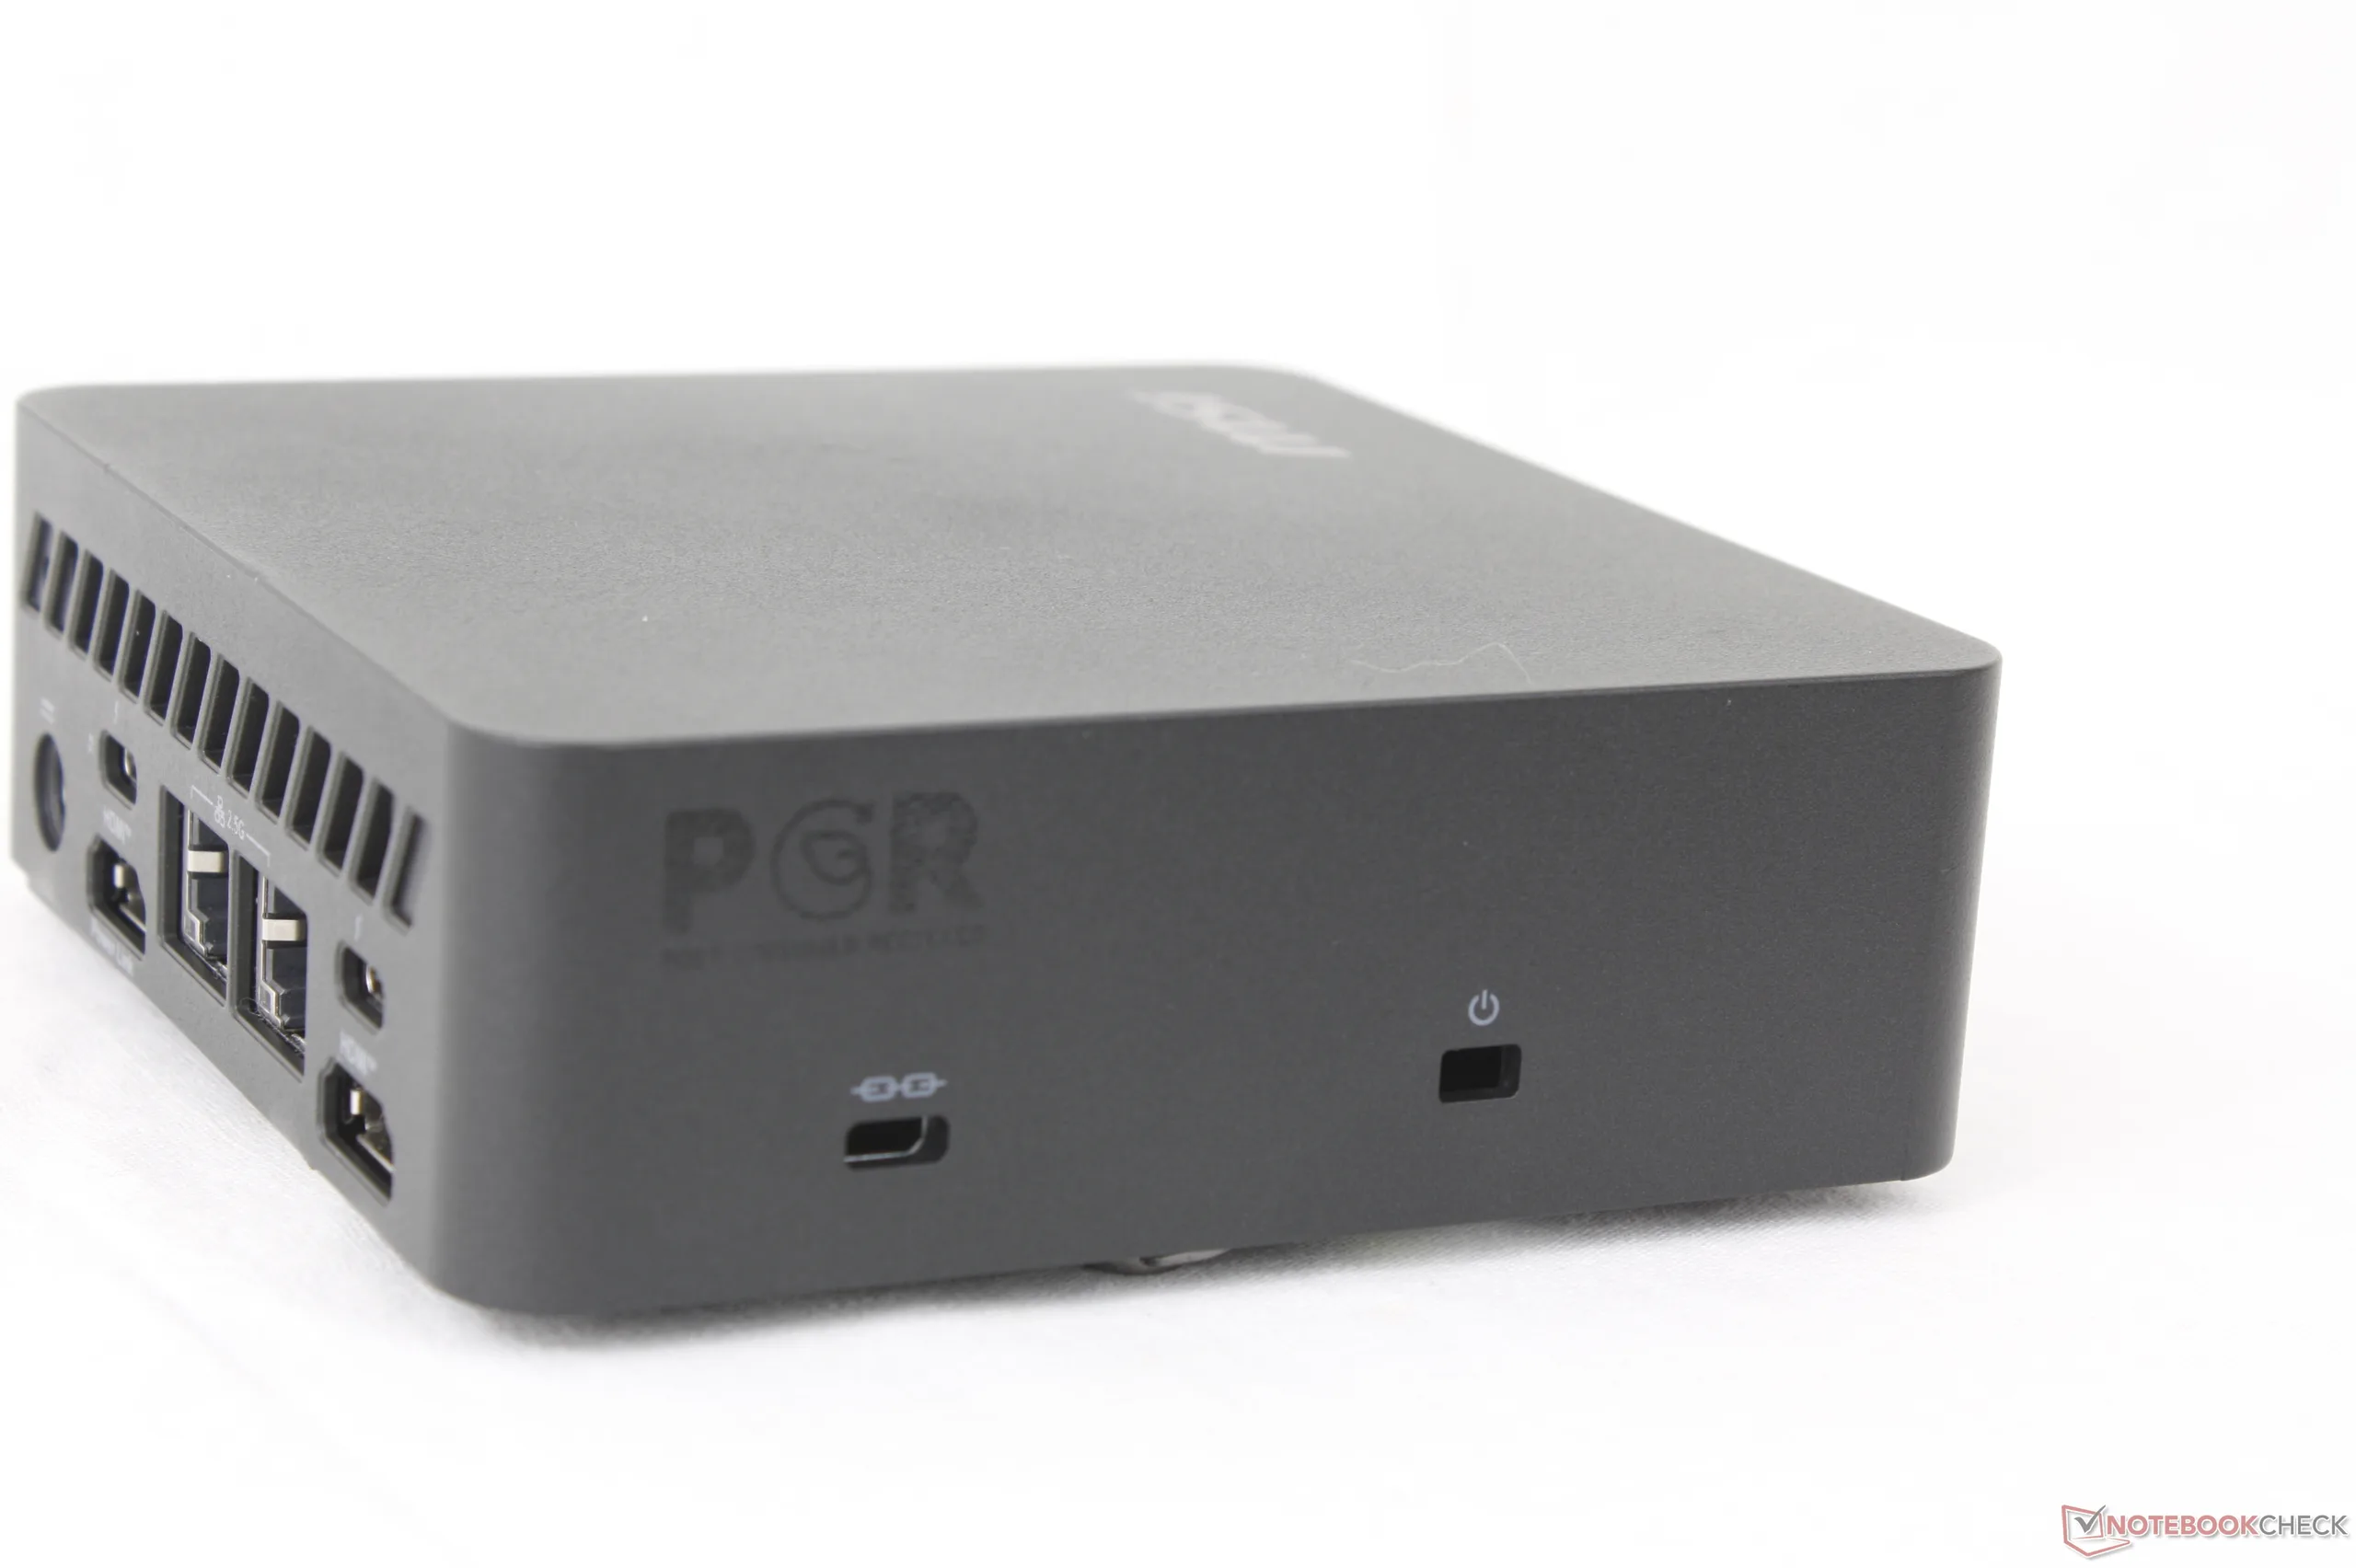
Fallet
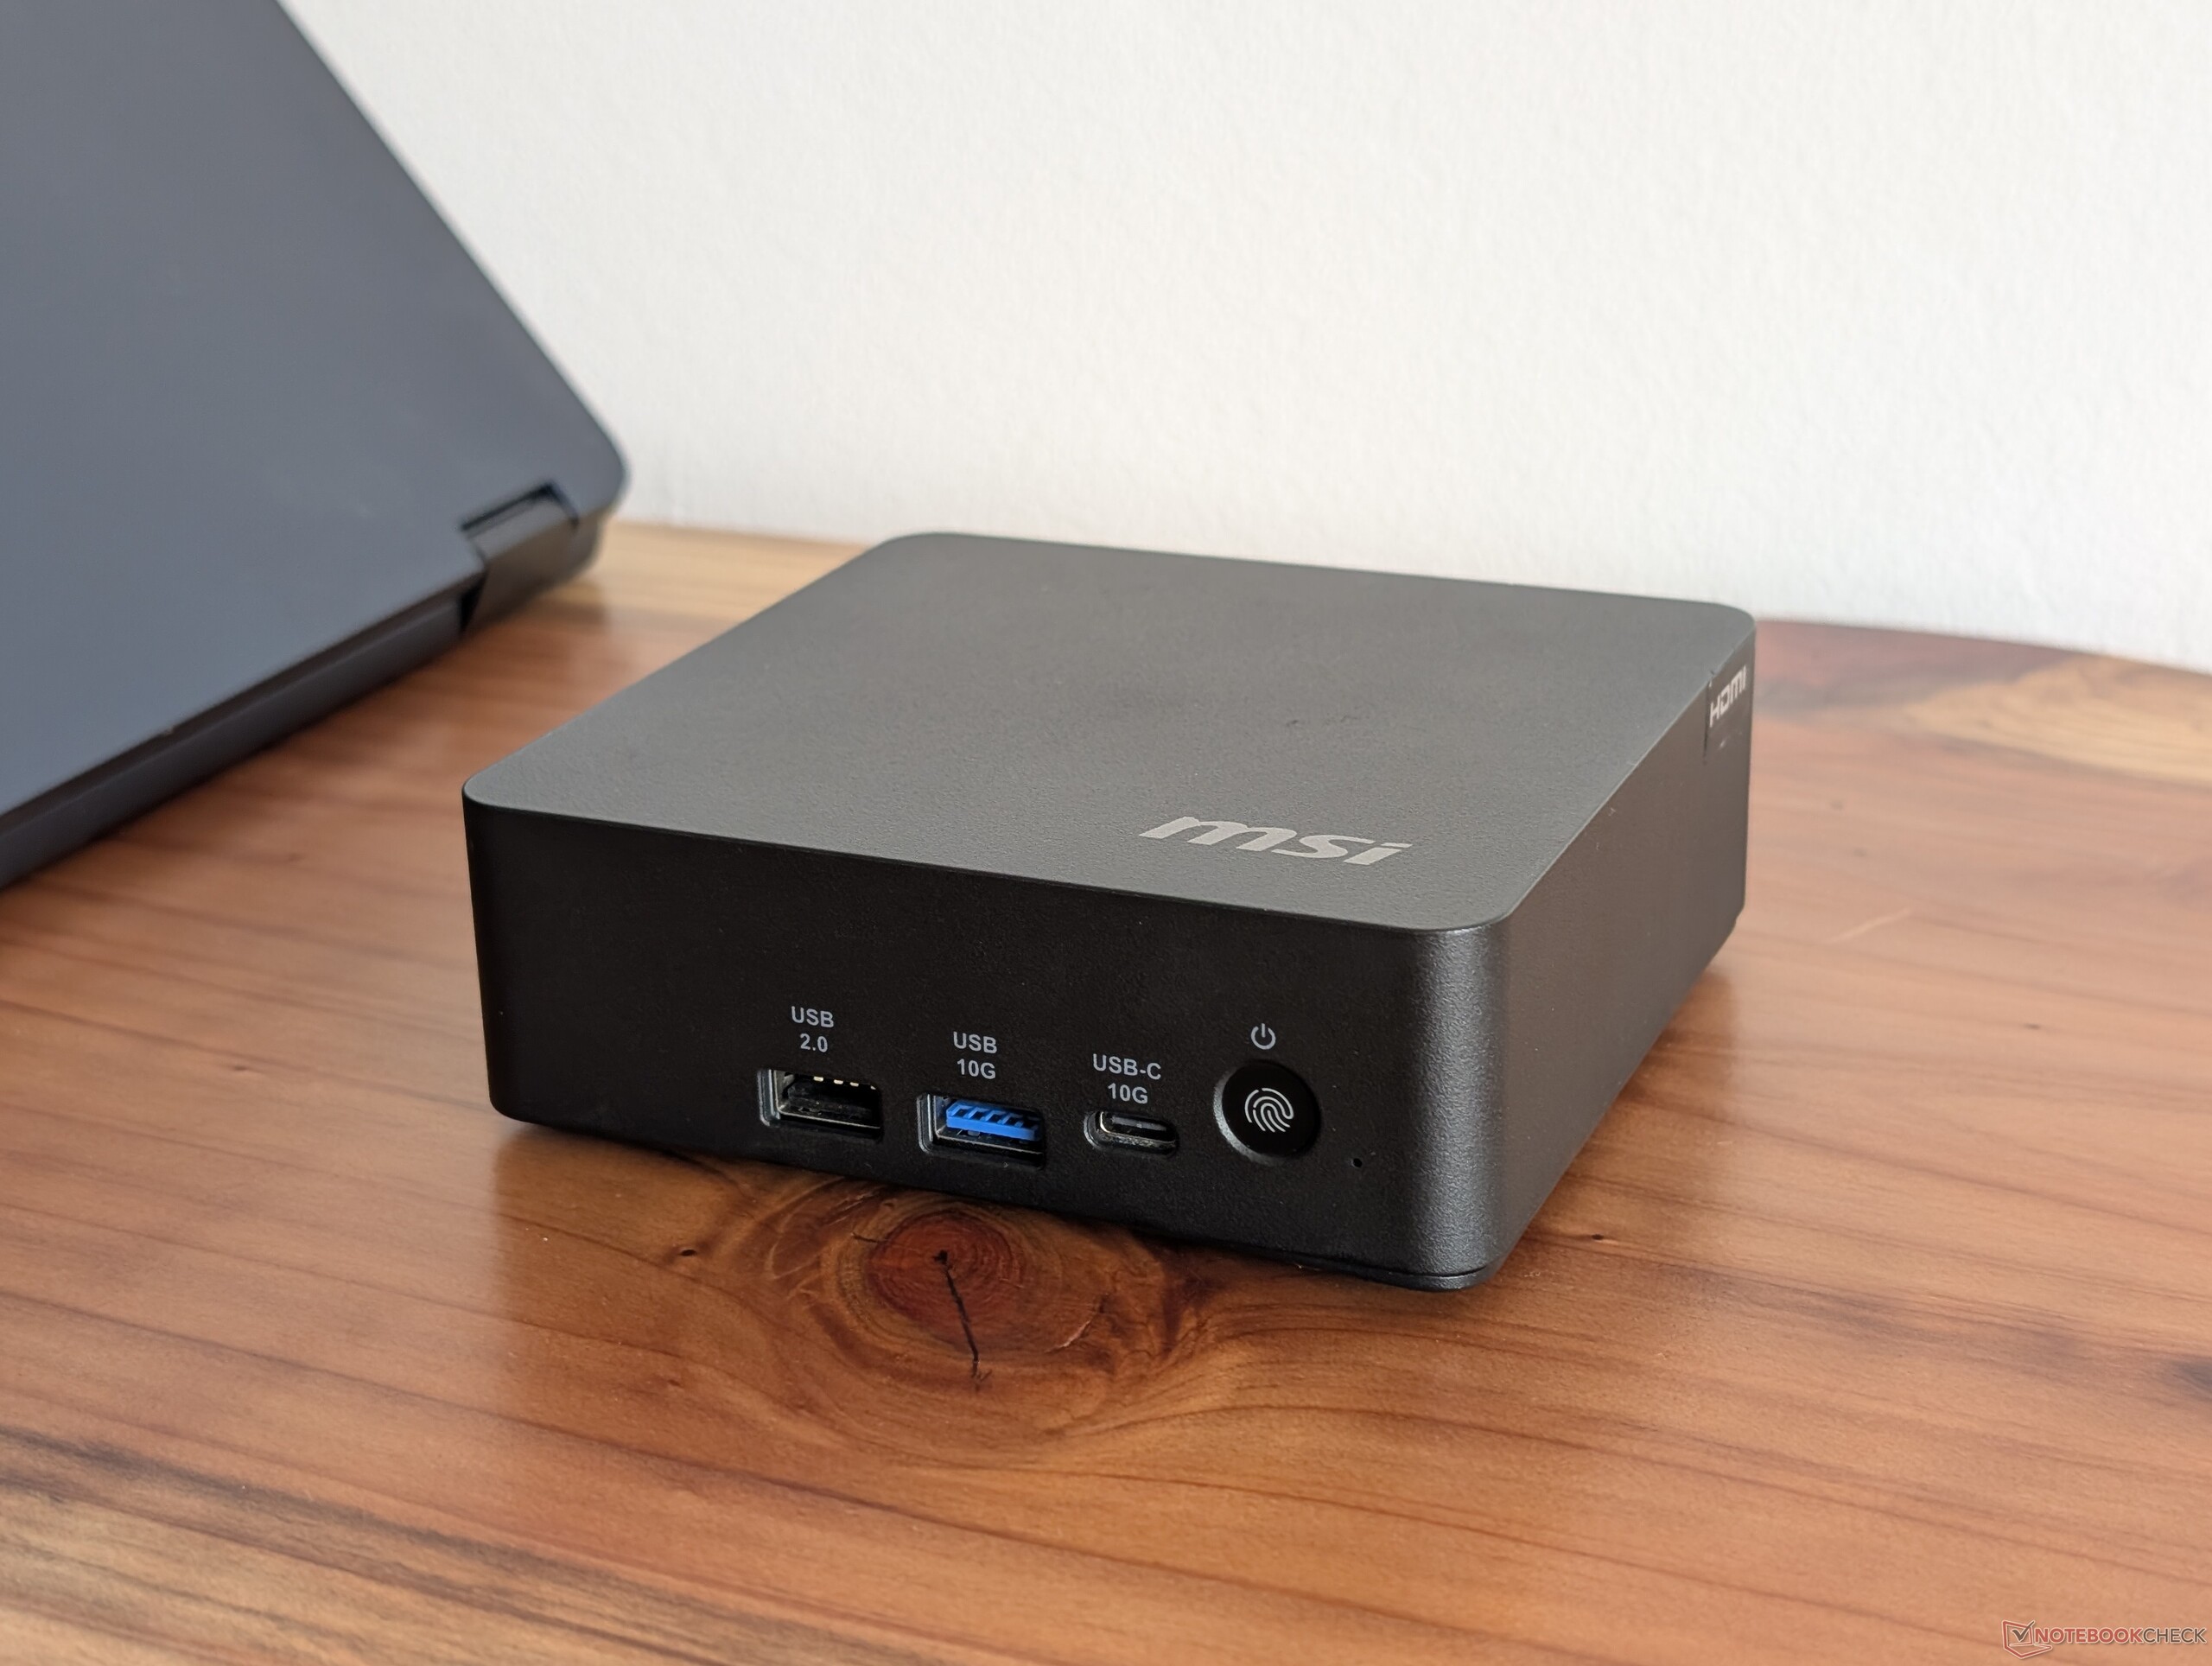
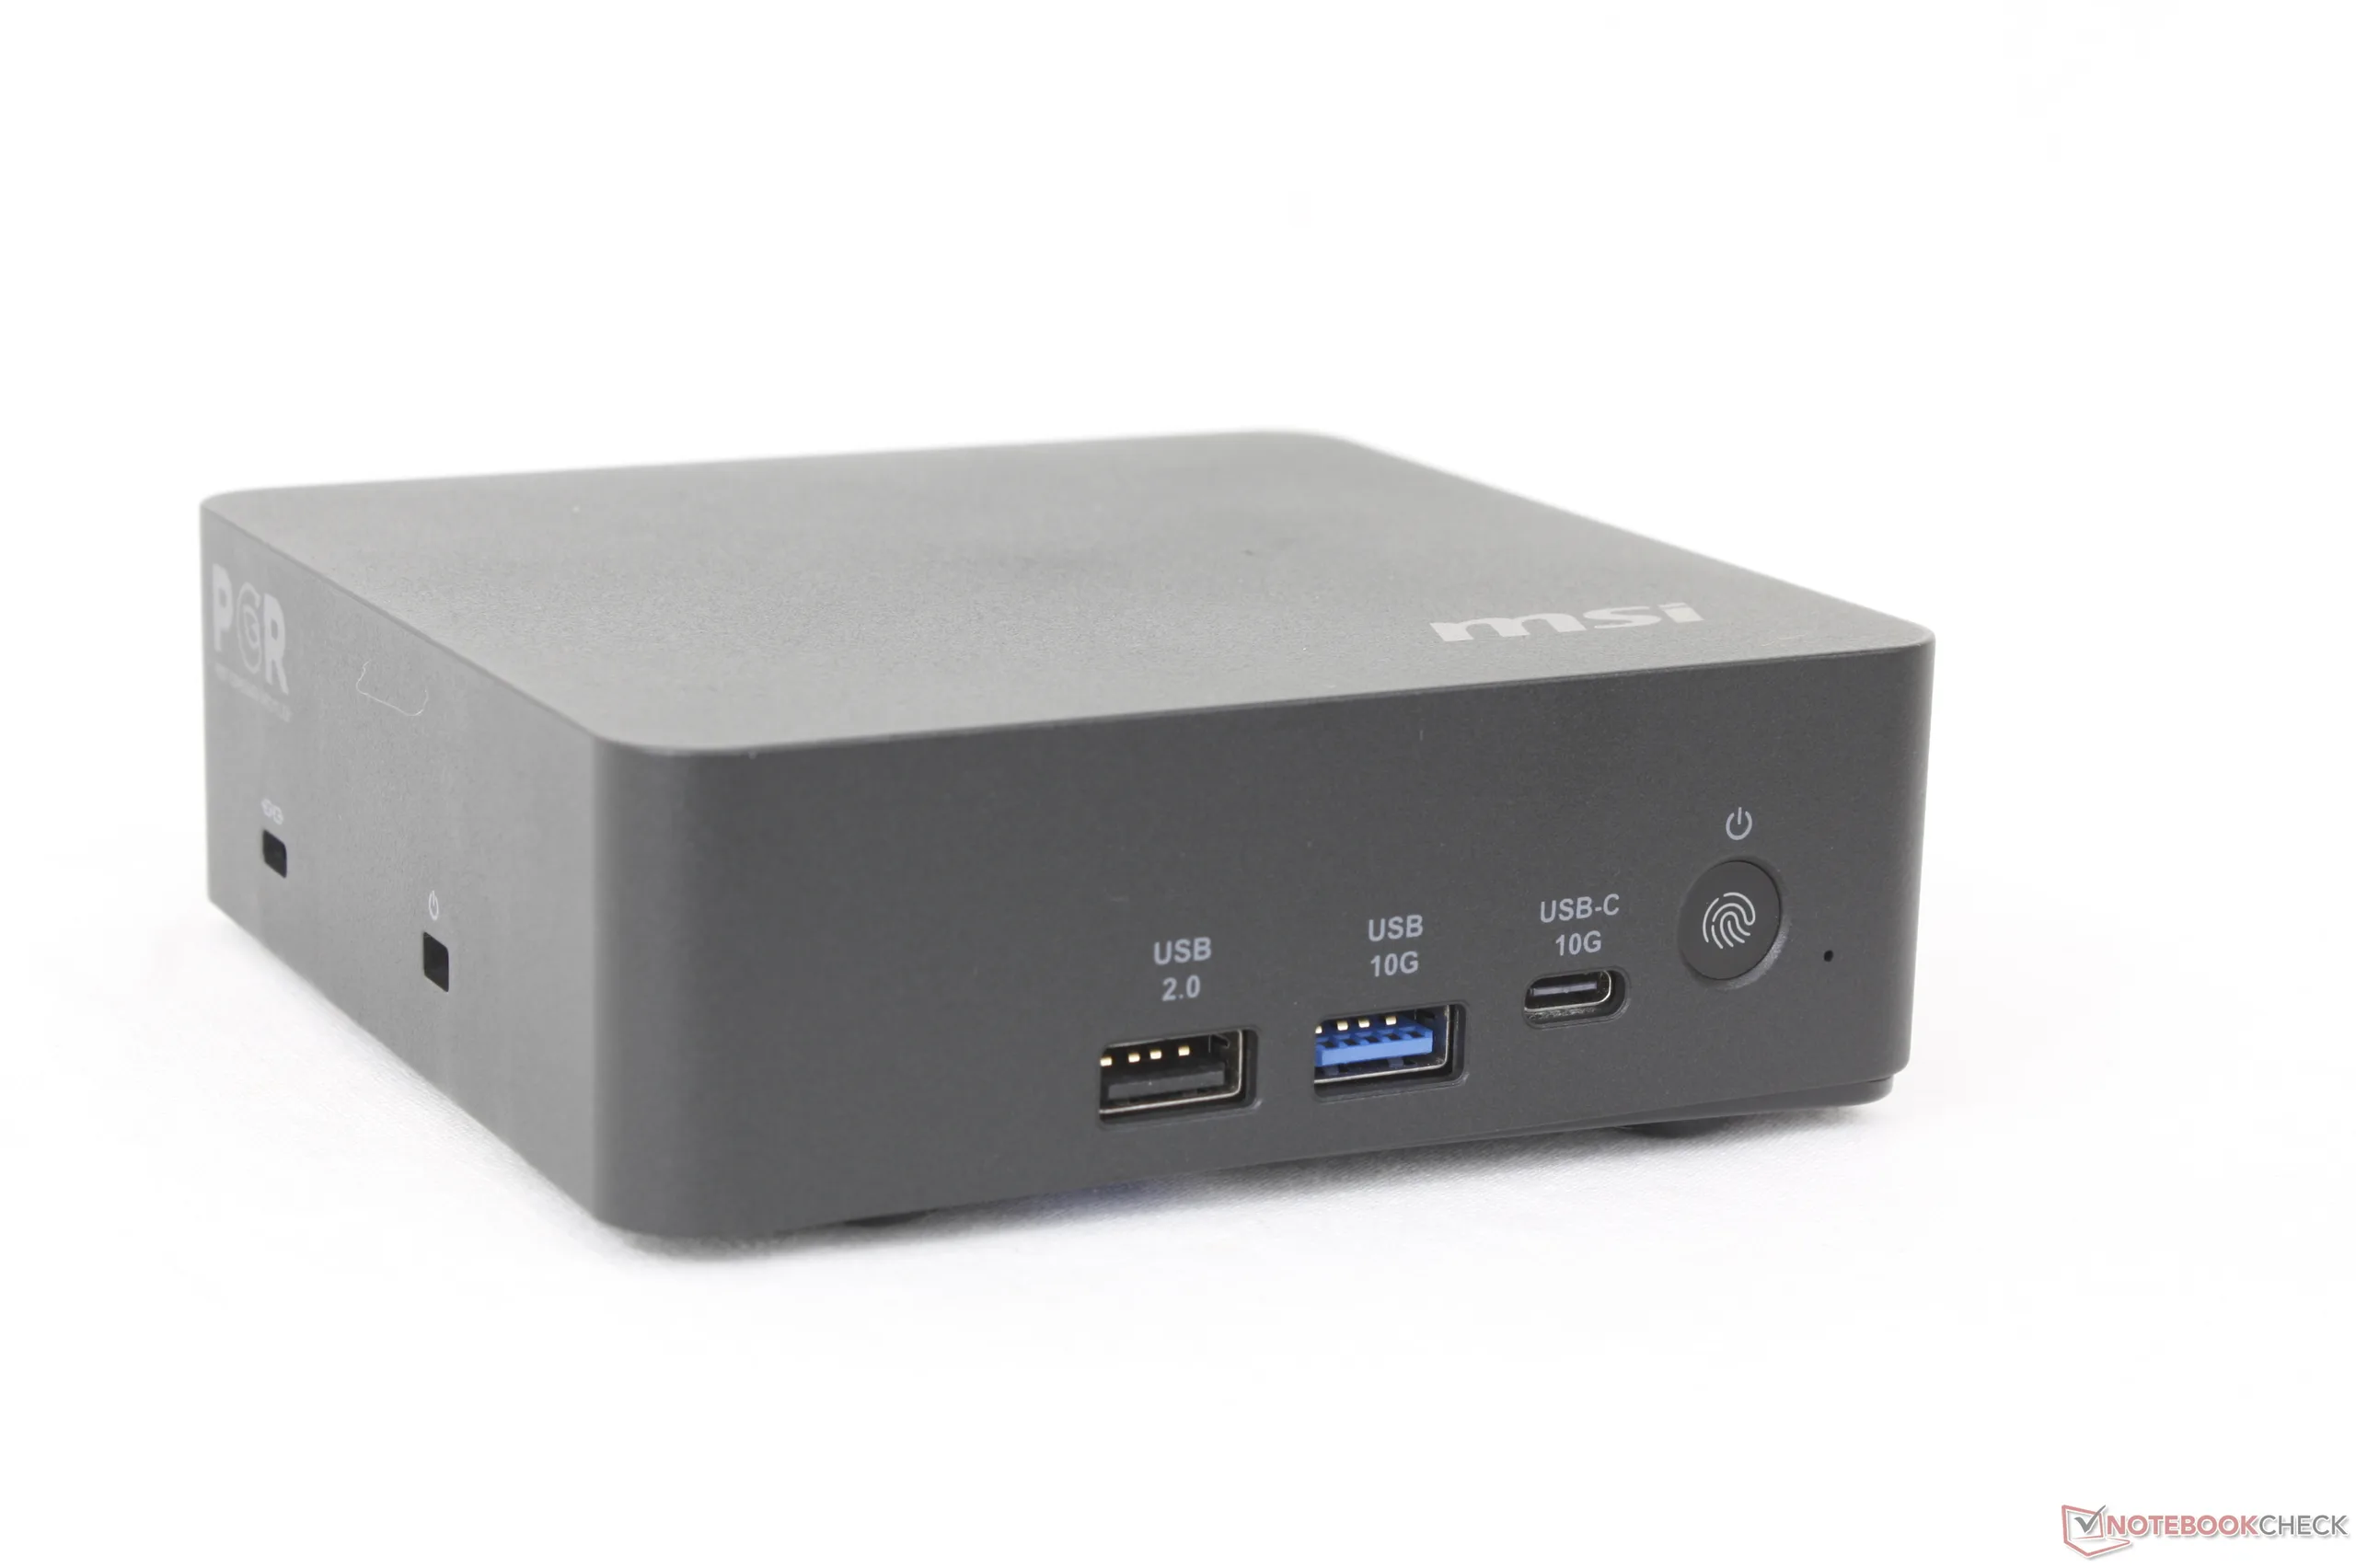
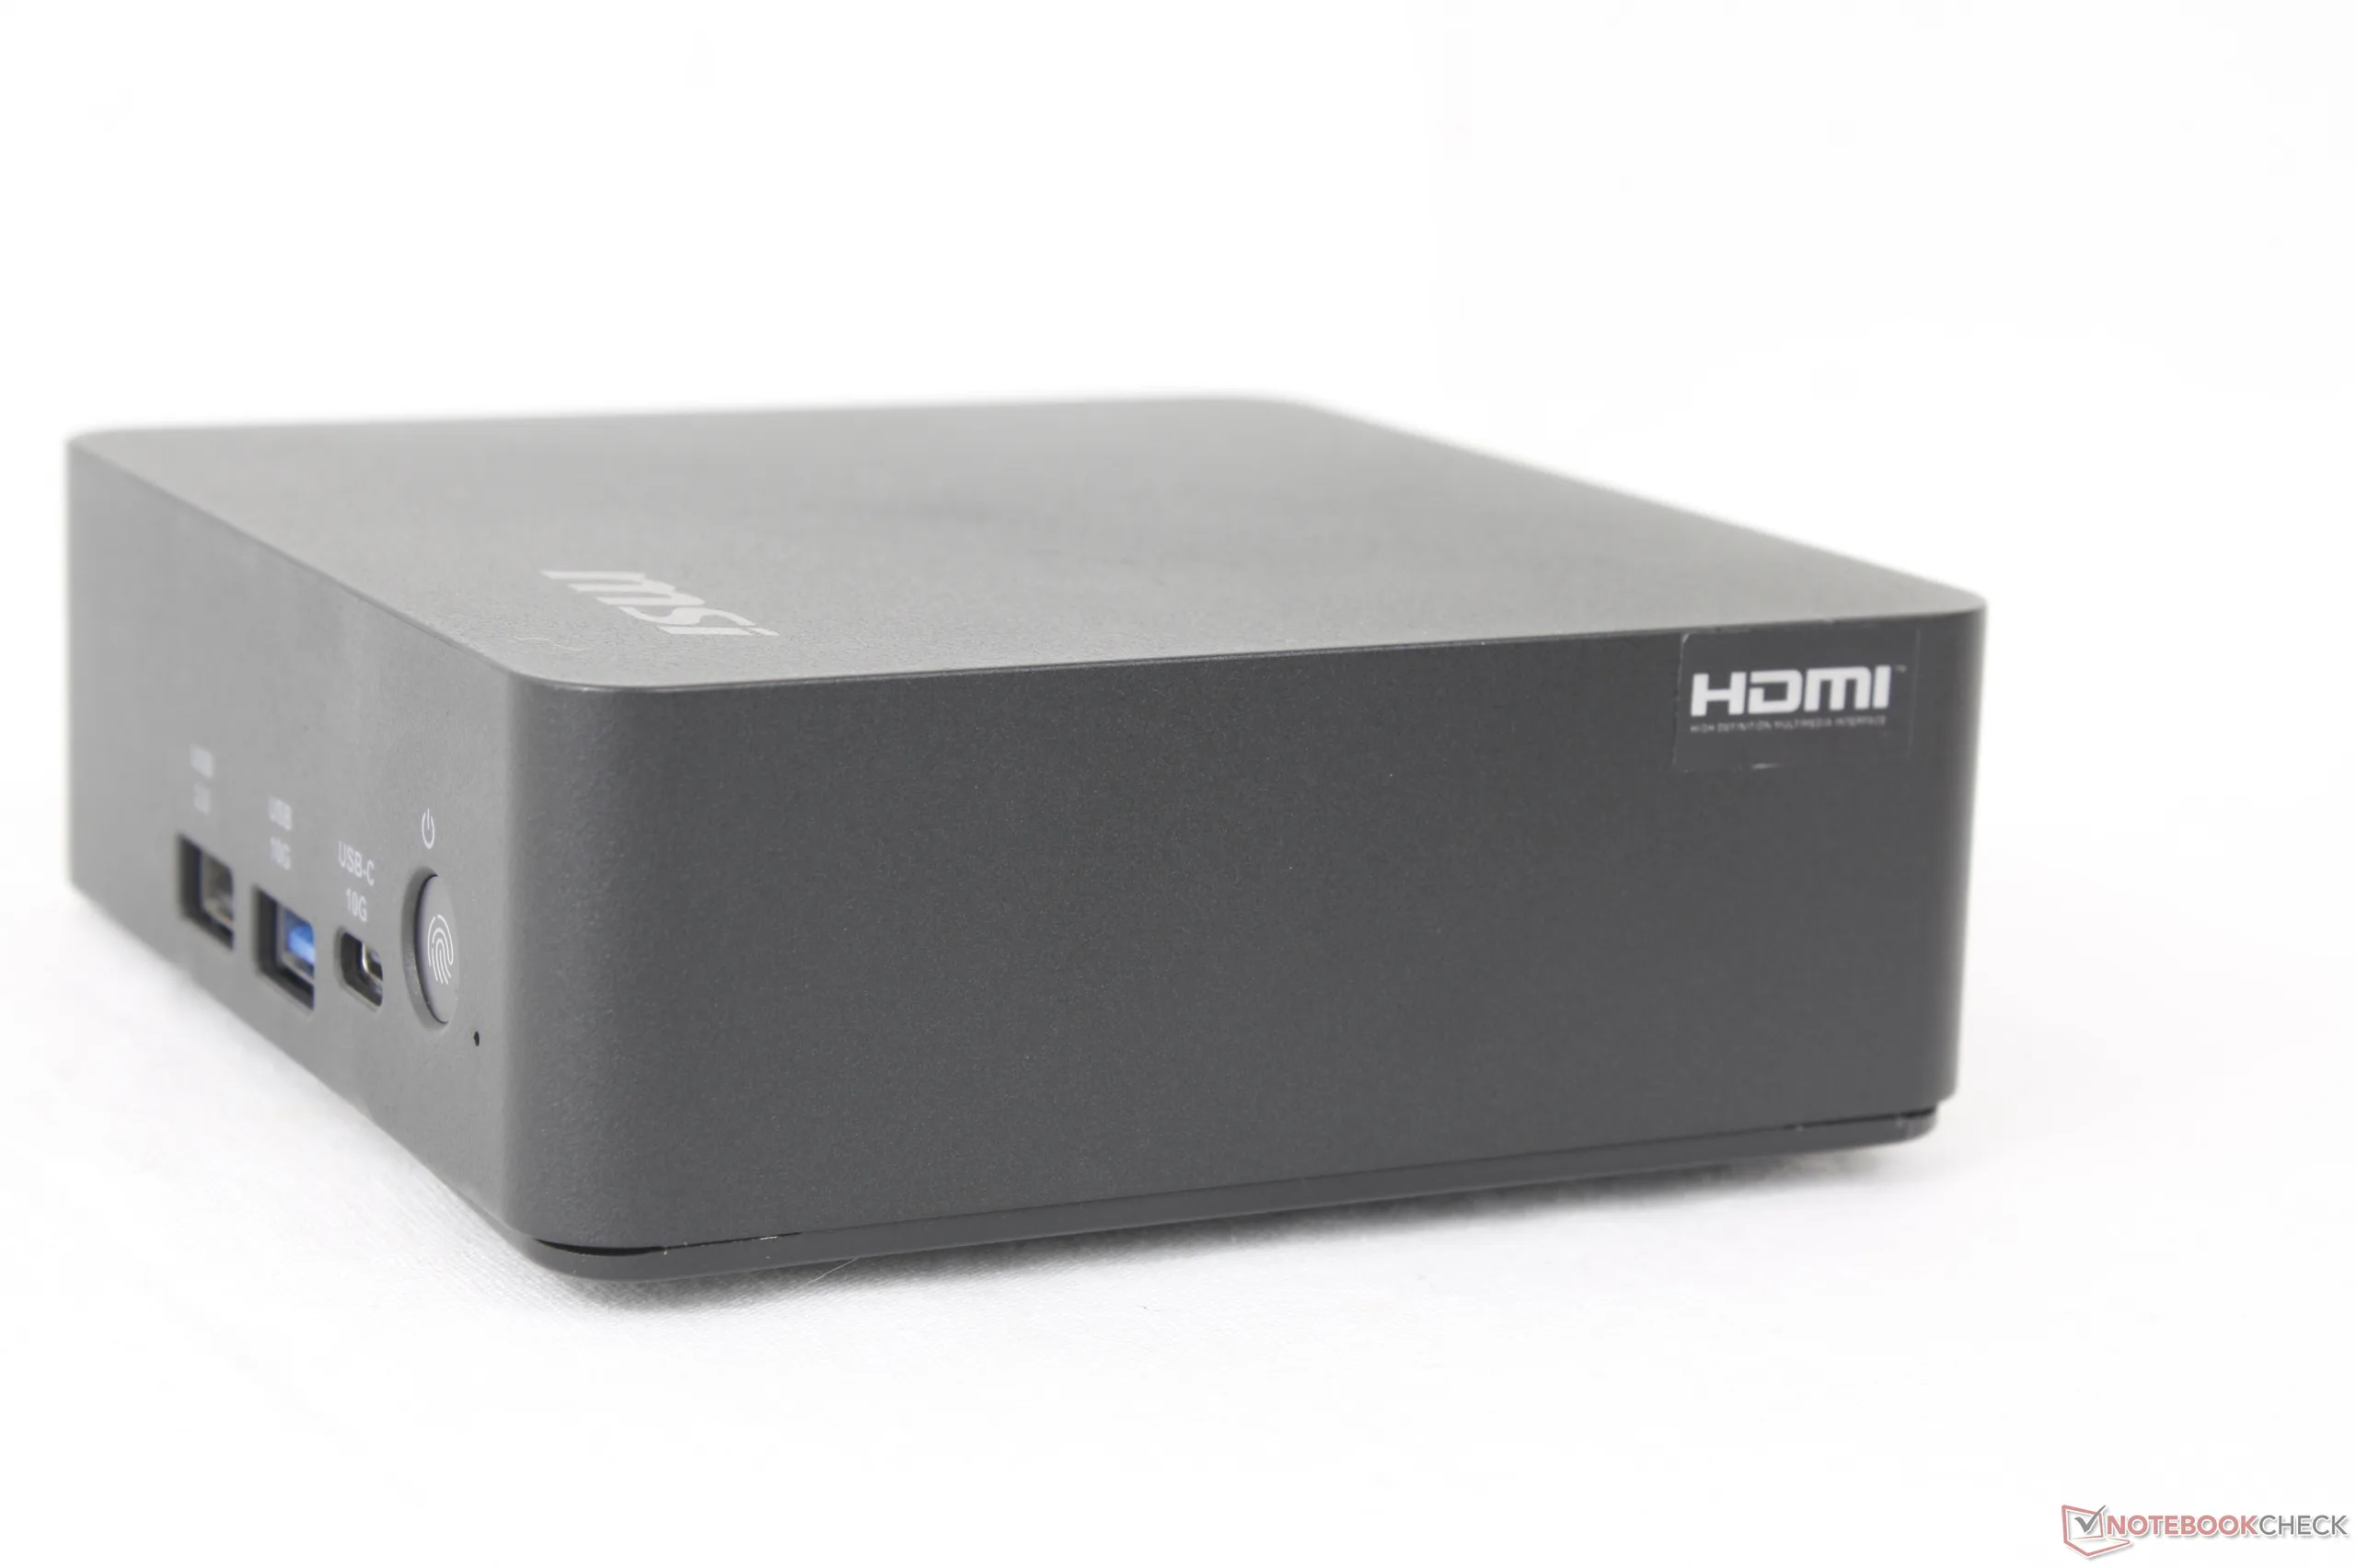
Chassit använder samma svarta plastmaterial för liknande intryck som tidigare, men är 17 procent lättare och 43 procent mindre i volym. Kanske ännu mer imponerande är att den mindre designen inte innebär fler ventilationsgaller eller några större externa revideringar.
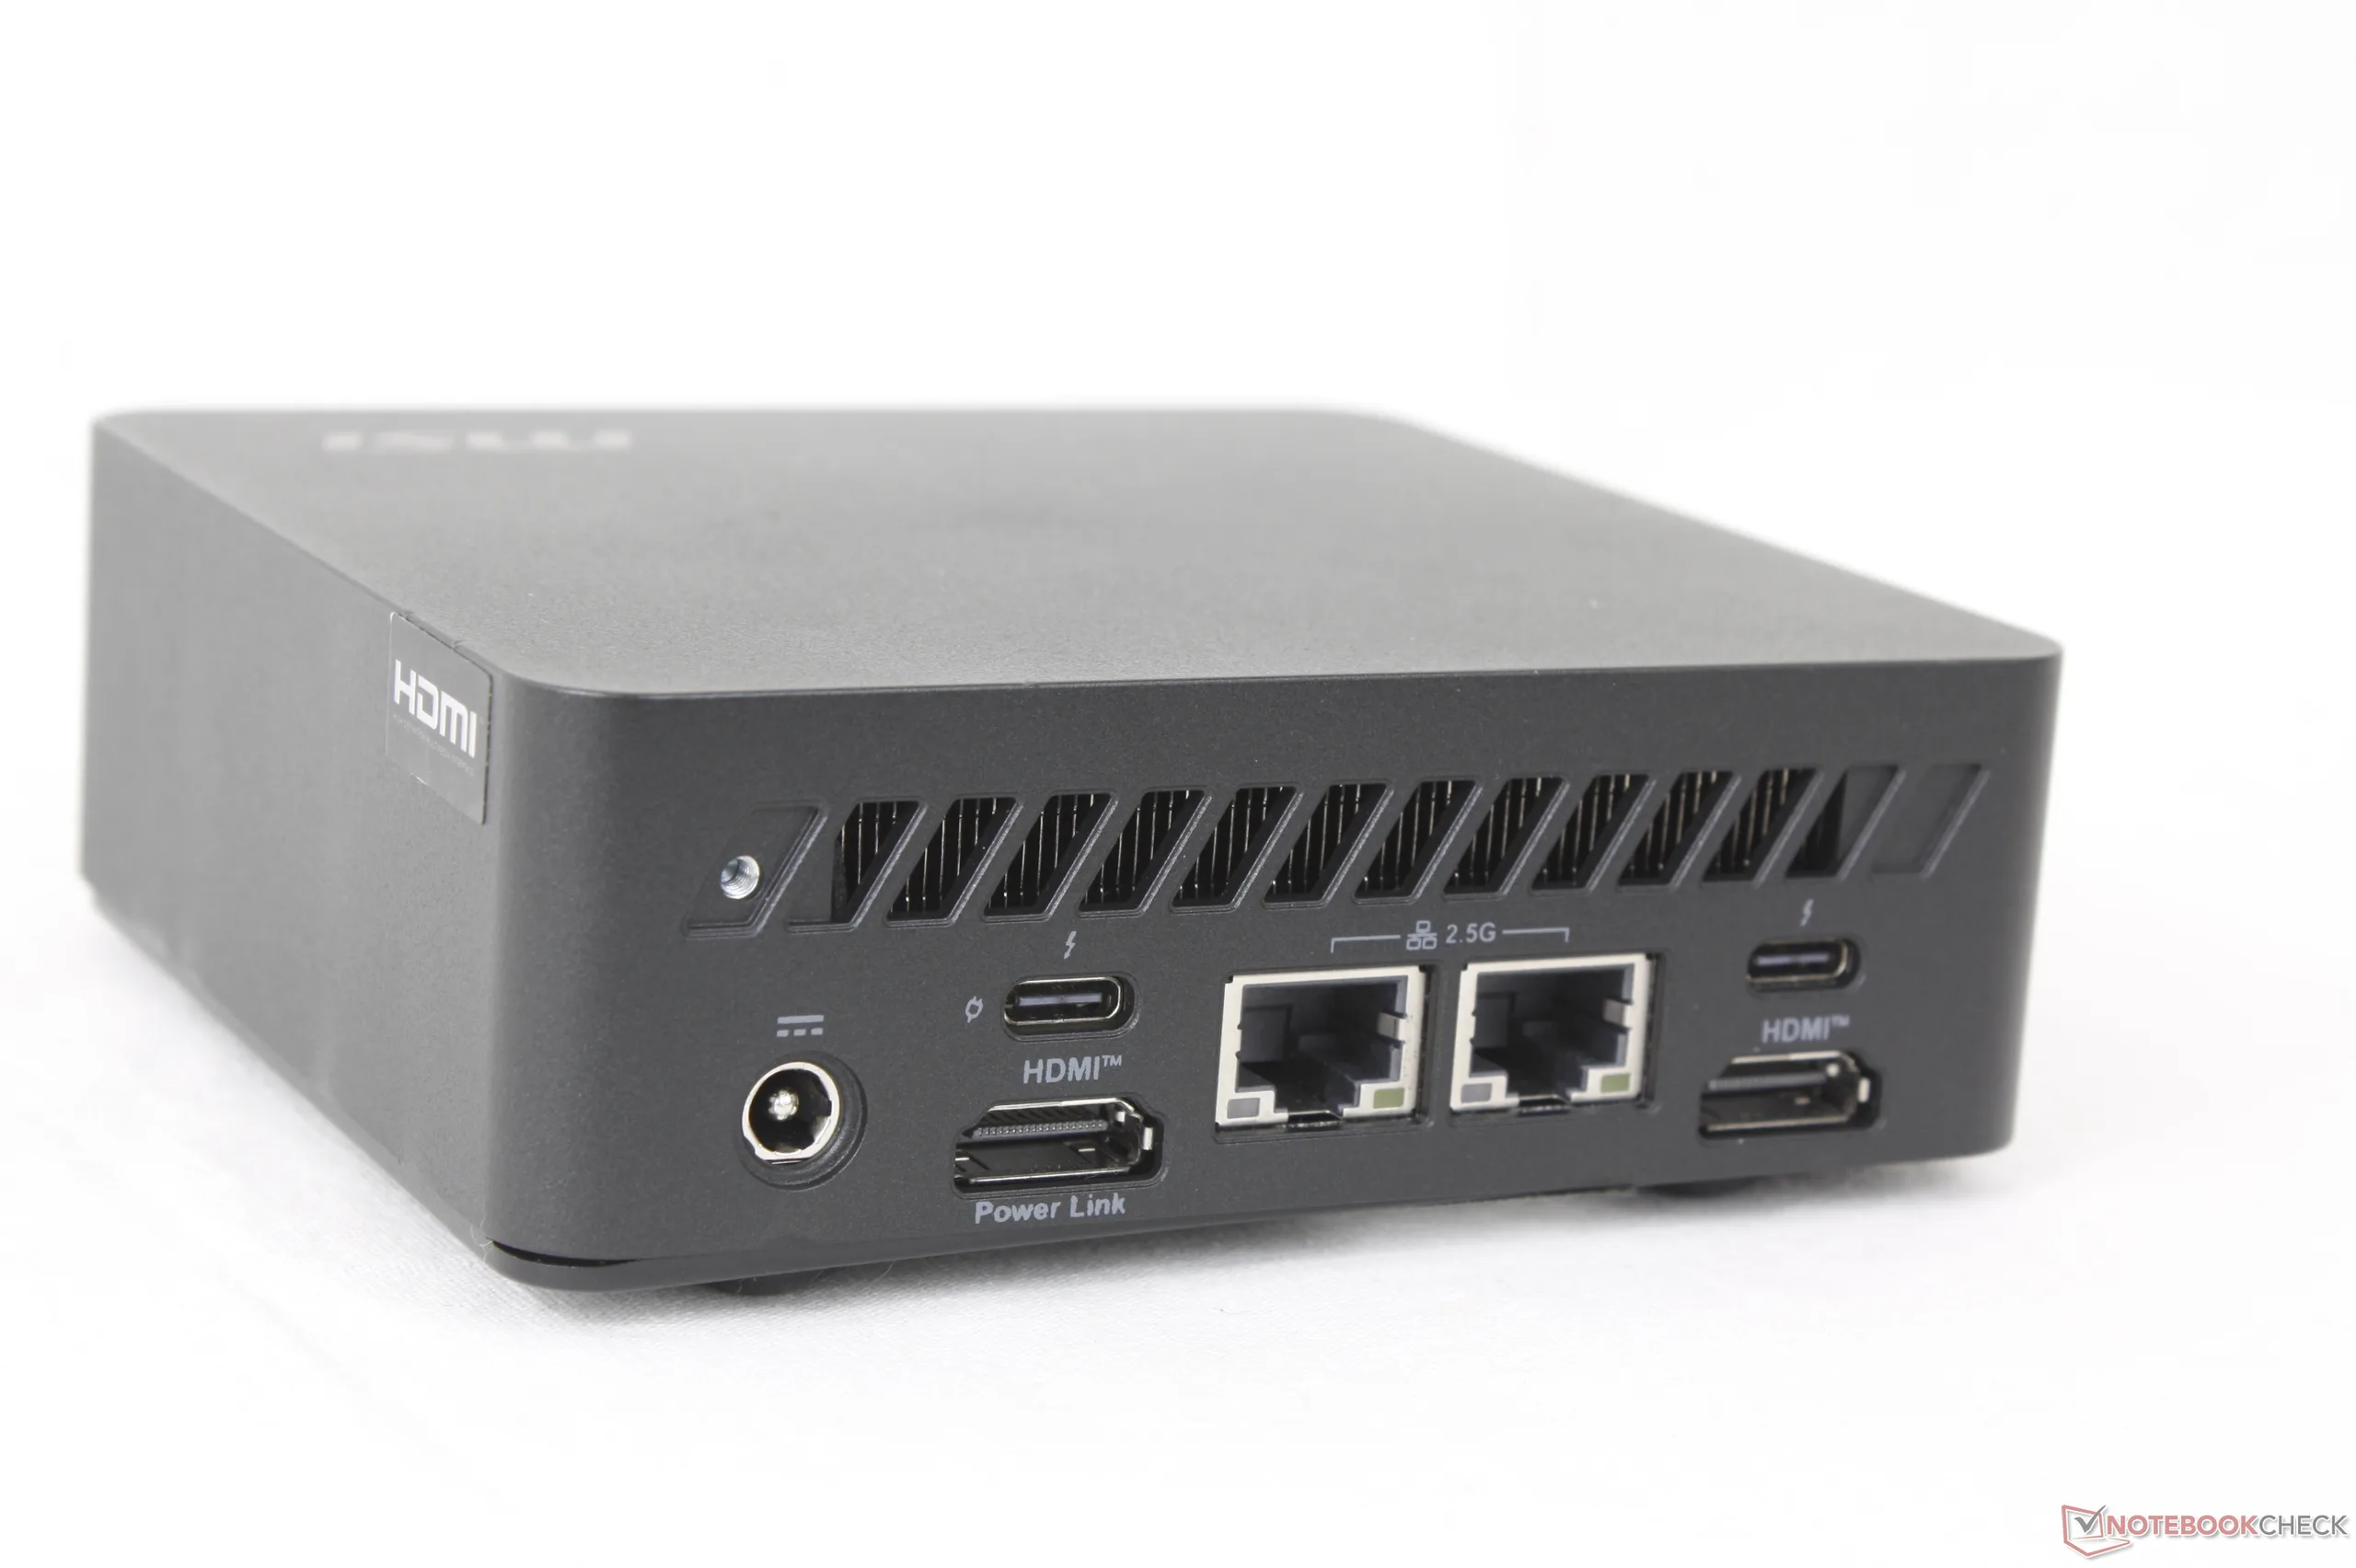
Anslutningsmöjligheter
Den mest anmärkningsvärda anslutningsfunktionen hos Cubi 3MG är dess externa strömbrytarstift på sidan av enheten. Porten ger möjlighet till en kabelansluten strömbrytare för att enkelt slå på eller stänga av systemet om minidatorn placeras på en svåråtkomlig plats, t.ex. under ett skrivbord eller bakom ett bord eller en bildskärm.
Portalternativen har reviderats avsevärt jämfört med förra årets modell. Det finns nu färre USB-A-portar och inte längre någon SD-kortläsare eller ljuduttag till förmån för fler HDMI-portar och USB-C-portar.
Tänk på att endast en av två Thunderbolt 4-portar stöder Power Delivery. Den här porten kan användas för att strömförsörja minidatorn om du har en kompatibel USB-C AC-adapter istället för den medföljande AC-adaptern.
Kommunikation
WLAN-modulen har uppgraderats från Wi-Fi 6E till Wi-Fi 7 med stöd för Bluetooth 6.0.
| Networking | |
| iperf3 transmit AXE11000 | |
| MSI Cubi NUC AI+ 3MG | |
| Asus NUC 15 Pro+ | |
| GMK EVO-T1 | |
| MSI Cubi NUC AI+ 2MG | |
| GMK NucBox K16 | |
| Geekom A5 Pro | |
| MSI Cubi NUC 1M | |
| iperf3 receive AXE11000 | |
| Asus NUC 15 Pro+ | |
| GMK EVO-T1 | |
| MSI Cubi NUC AI+ 3MG | |
| MSI Cubi NUC AI+ 2MG | |
| Geekom A5 Pro | |
| GMK NucBox K16 | |
| MSI Cubi NUC 1M | |
| iperf3 transmit AXE11000 6GHz | |
| GMK NucBox K16 | |
| MSI Cubi NUC AI+ 3MG | |
| Asus NUC 15 Pro+ | |
| MSI Cubi NUC 1M | |
| MSI Cubi NUC AI+ 2MG | |
| iperf3 receive AXE11000 6GHz | |
| GMK NucBox K16 | |
| MSI Cubi NUC AI+ 3MG | |
| MSI Cubi NUC AI+ 2MG | |
| Asus NUC 15 Pro+ | |
| MSI Cubi NUC 1M | |
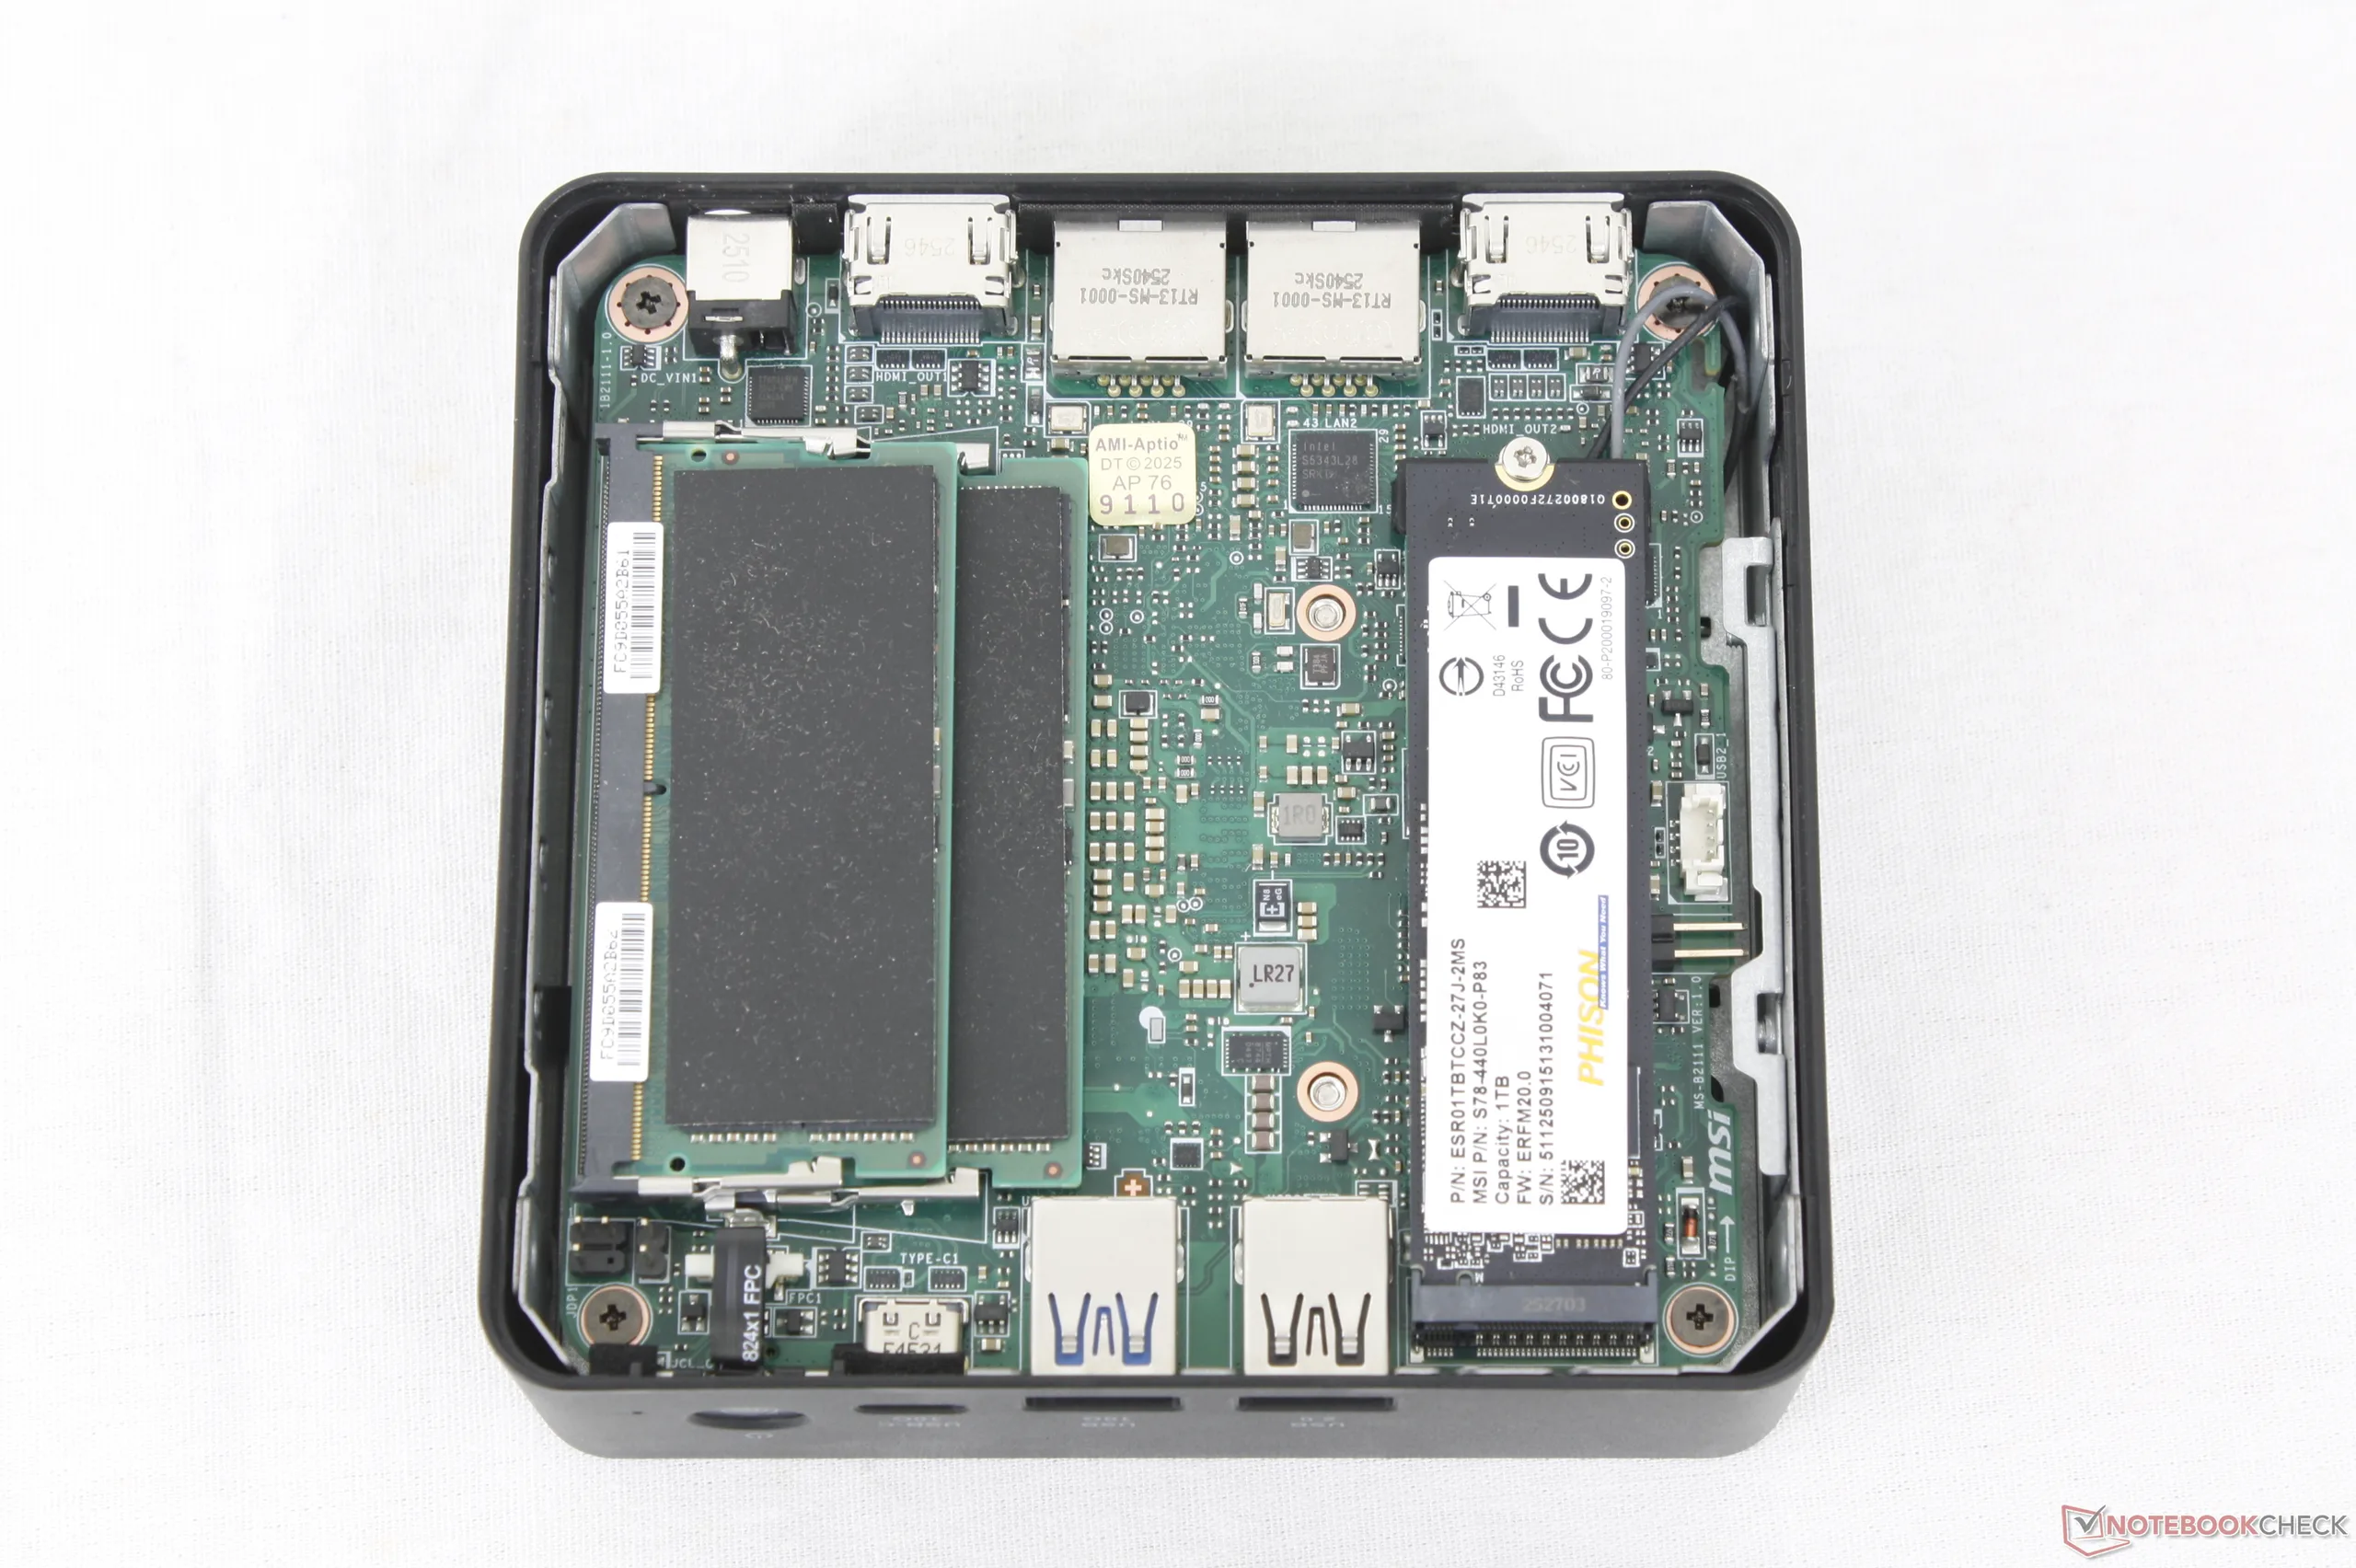
Underhåll
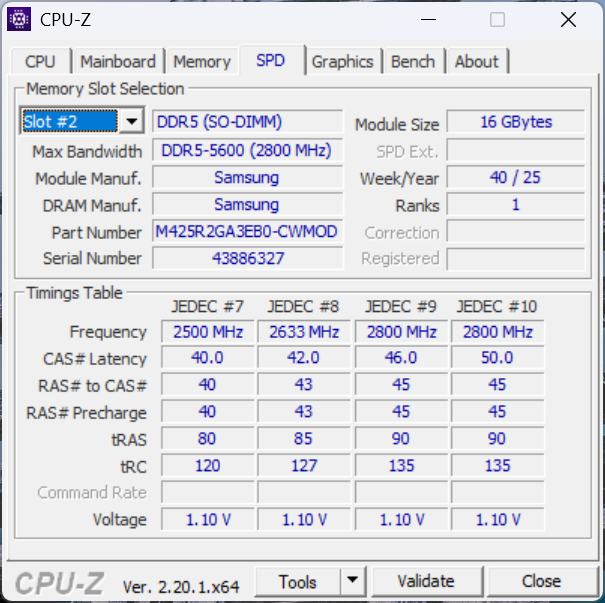
Bottenpanelen är säkrad med en enkel tumskruv för enkel service utan verktyg. Väl inne har användarna direkt tillgång till M.2 2280 SSD-platsen, den löstagbara M.2 WLAN-modulen och två DDR5 SODIMM-platser.
Tillbehör och garanti
I förpackningen ingår en extern strömbrytare för anslutning till det strömbrytarstift som nämns ovan. Den externa strömbrytaren är dock inte särskilt lång, bara ~47 cm.
Prestanda
Testförhållanden
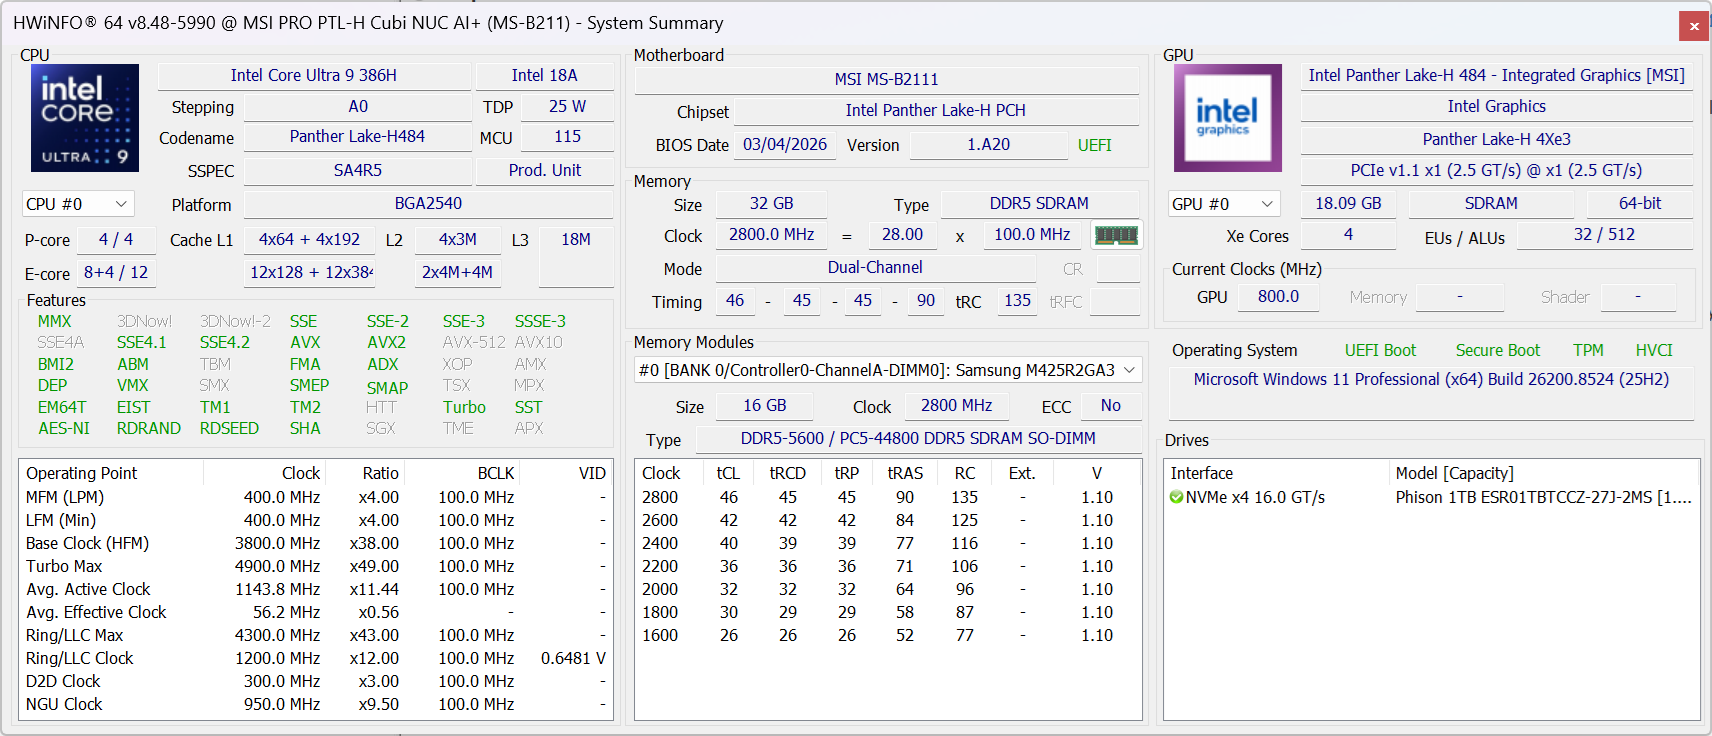
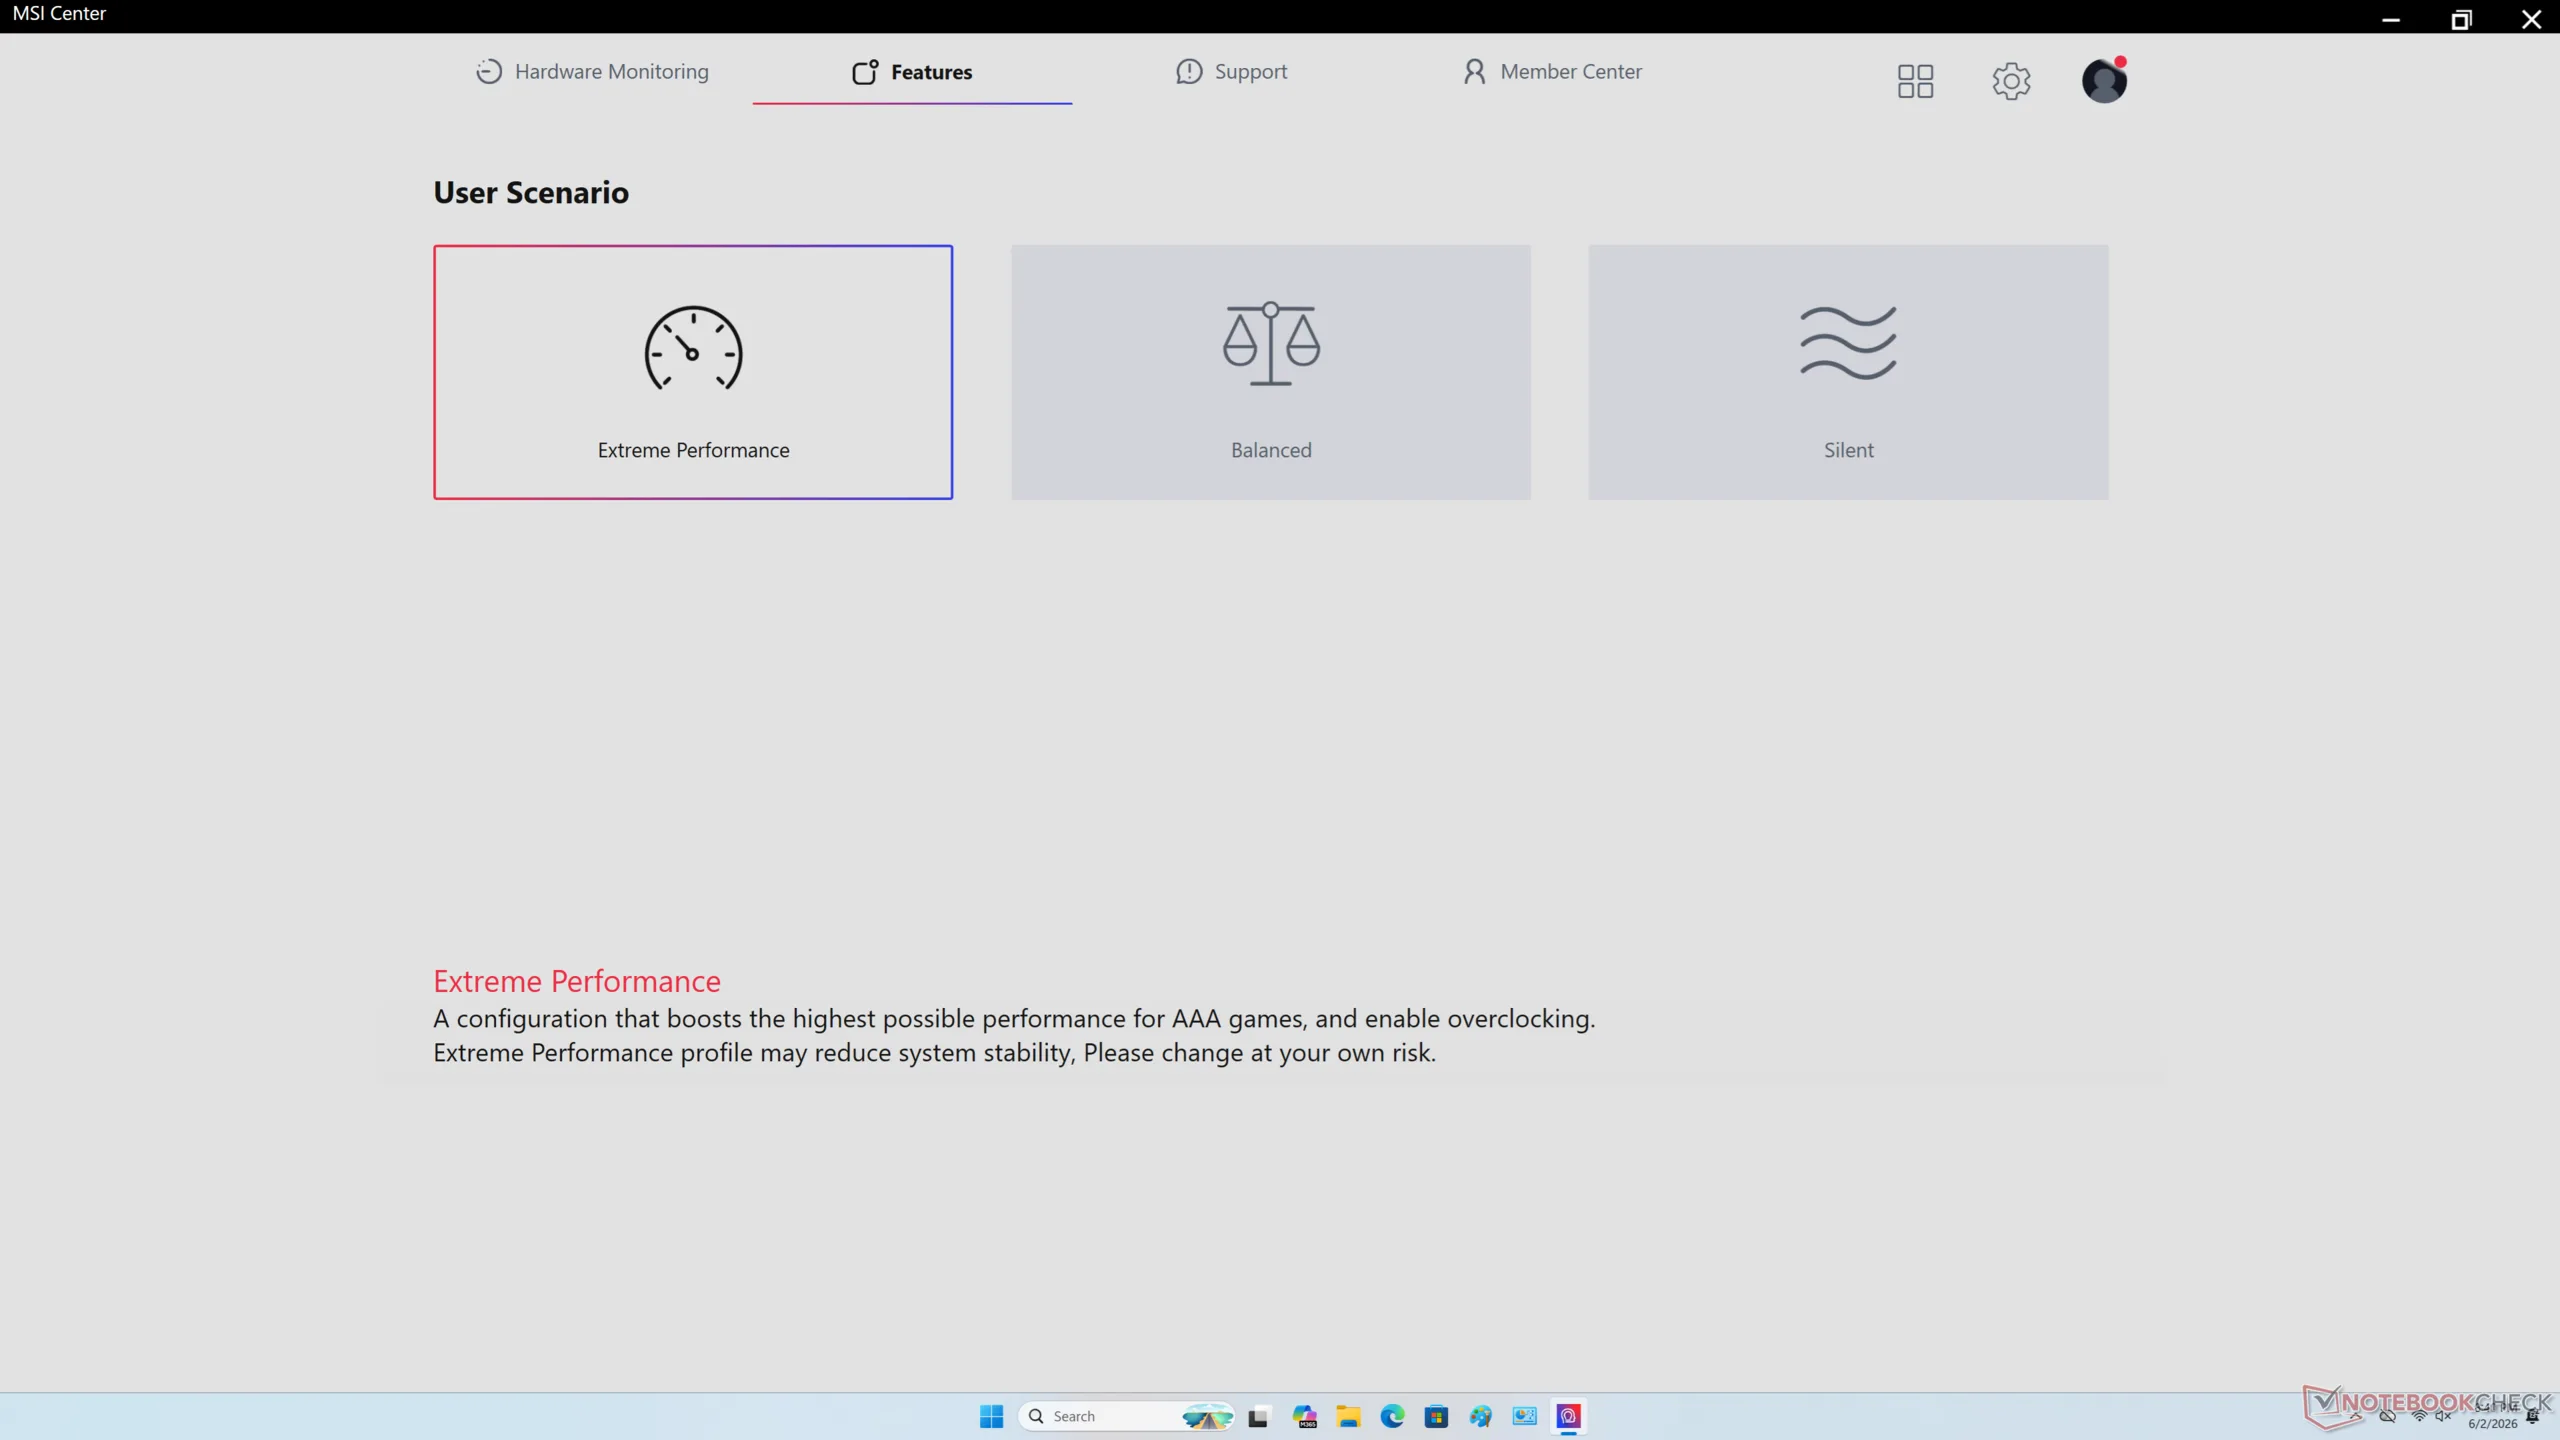
Vi ställde in MSI Center på Performance-läge innan vi körde nedanstående benchmarks.
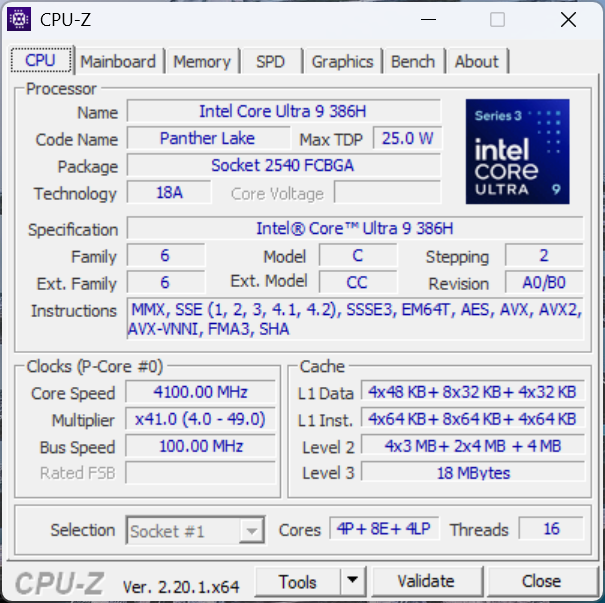
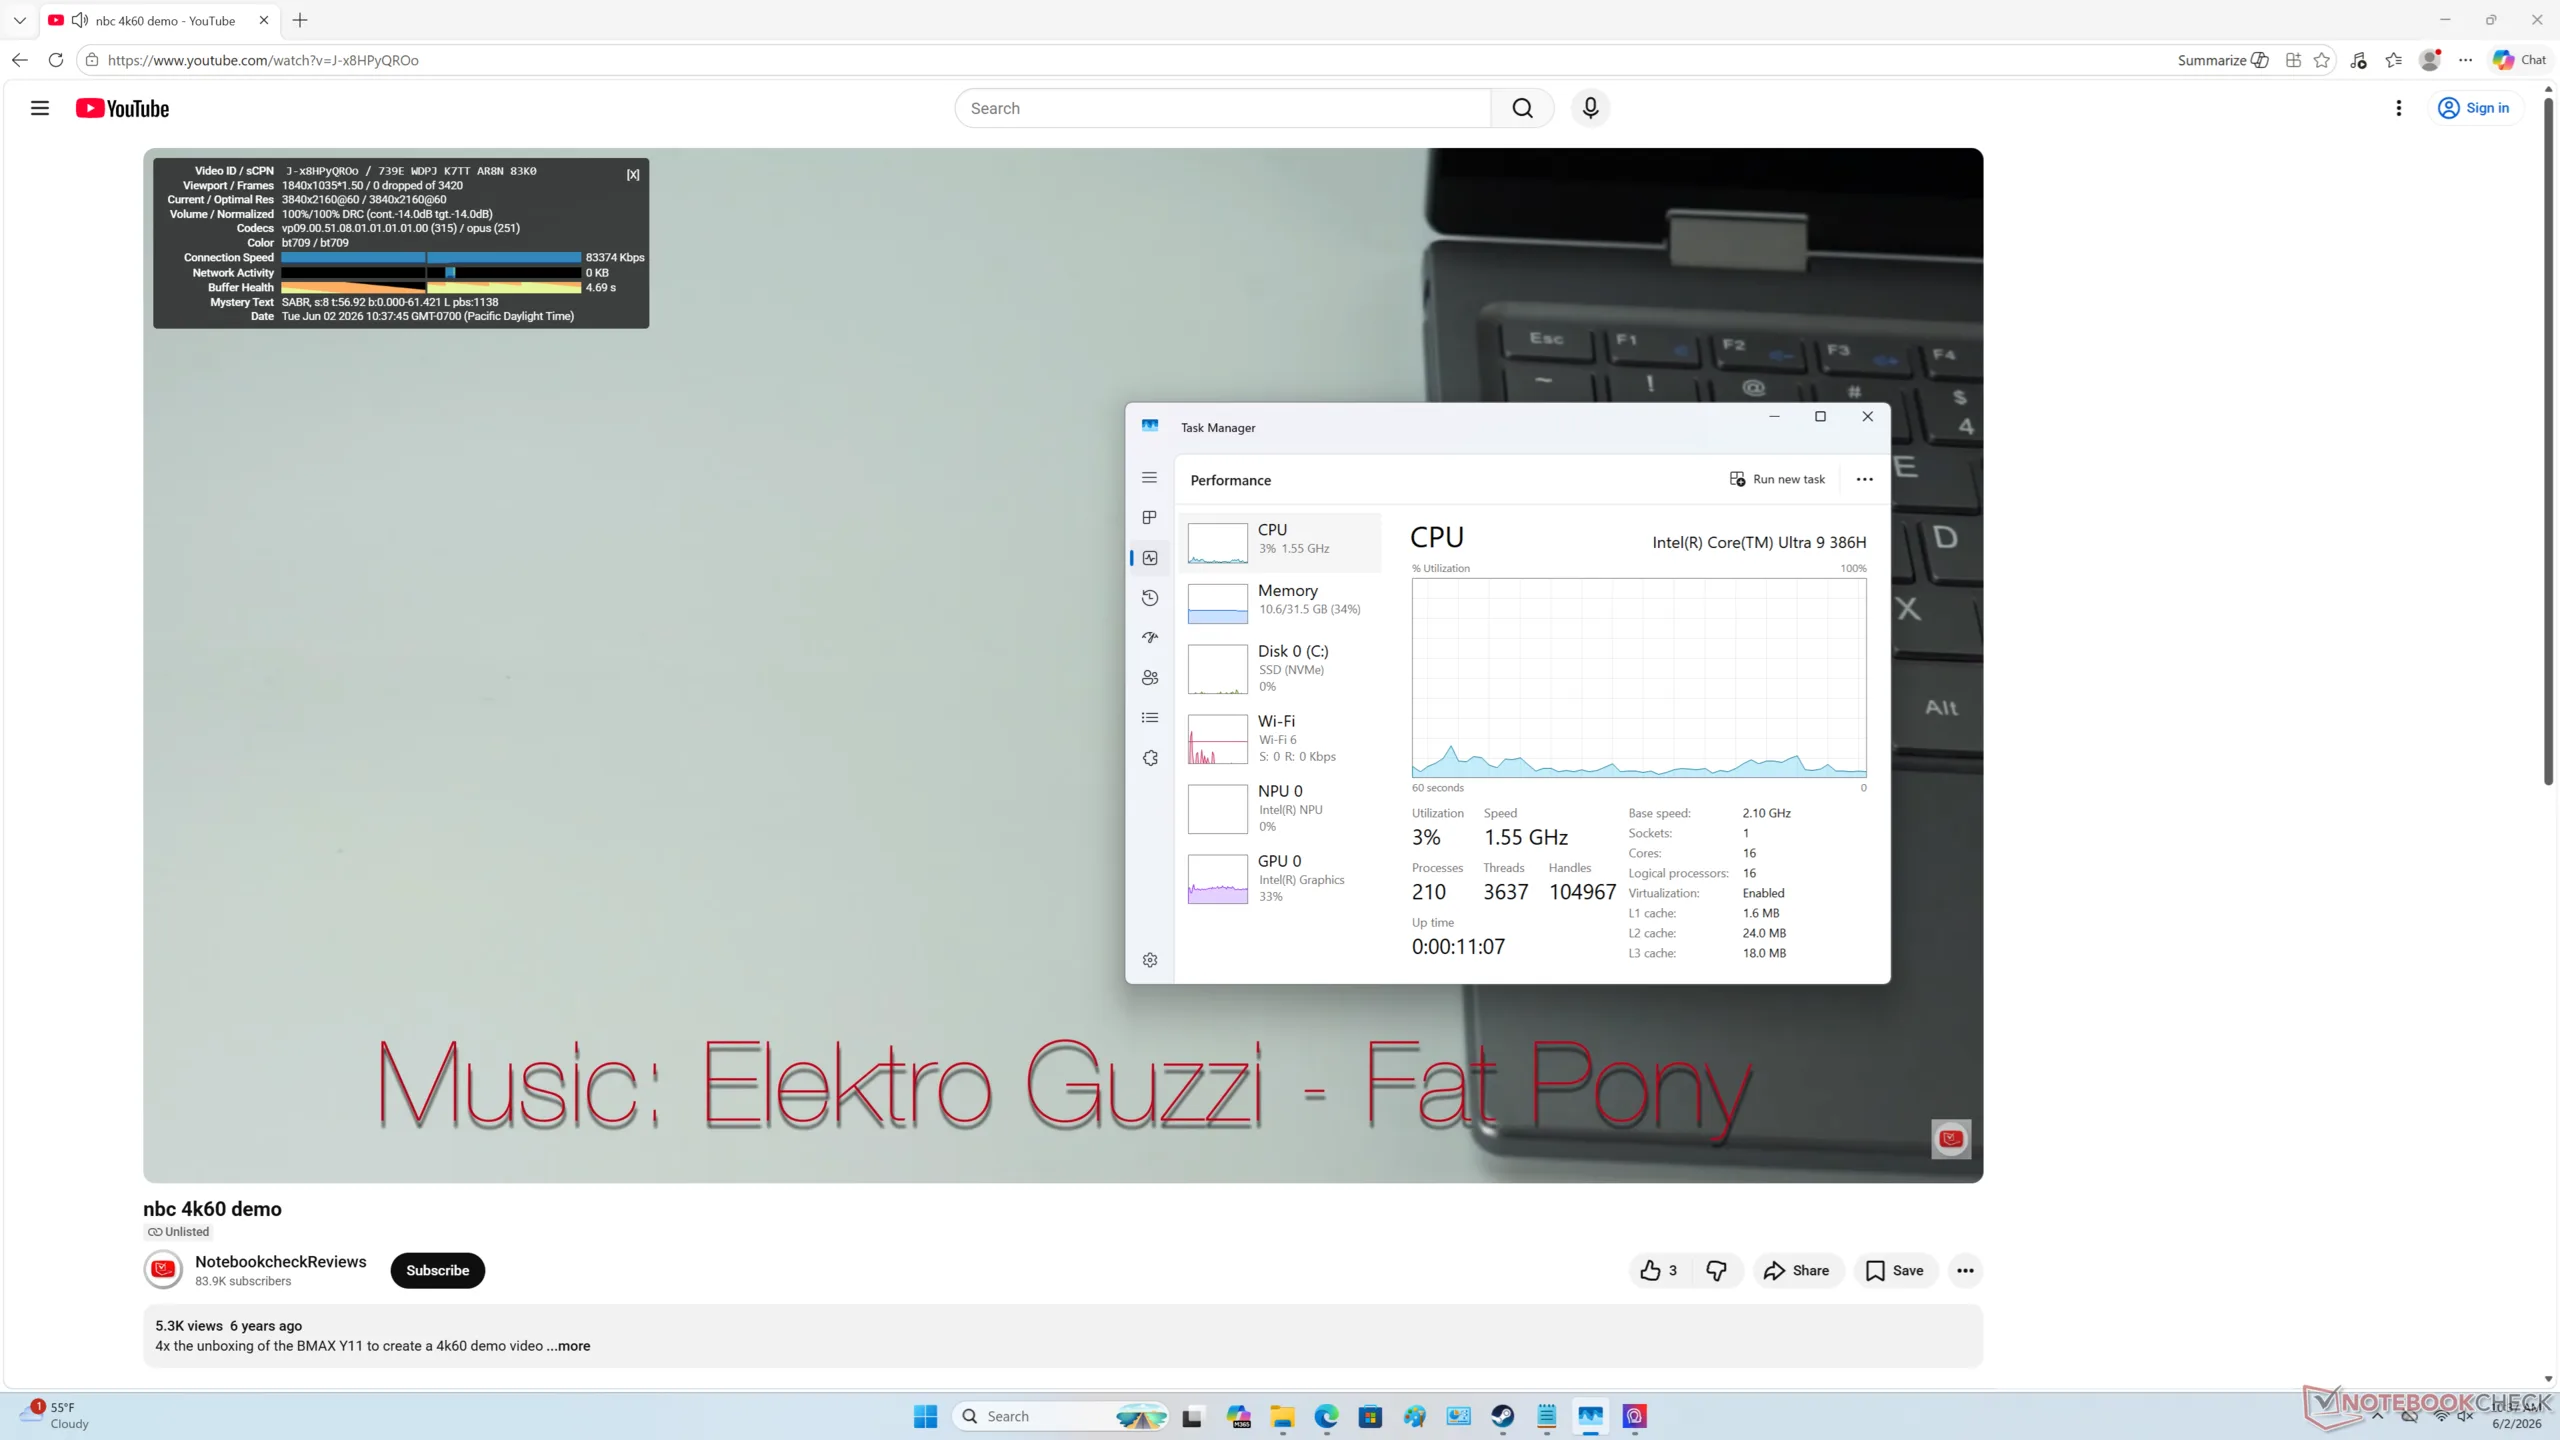
Processor
Cubi AI 3MG levereras med samma Core Ultra 9 386H CPU som finns på den senaste Razer Blade 16. Den råa flertrådsprestandan är dock cirka 18 procent långsammare på MSI på grund av begränsad Turbo Boost-potential. När man kör CineBench R15 xT i en loop, till exempel, skulle den ursprungliga poängen på 2792 poäng sjunka till 2380 poäng efter bara ett par omgångar, vilket visas i vårt jämförelsediagram nedan.
Råprestanda är ändå mycket snabbare än förra årets Cubi AI+ 2MG med 50 till 60 procent, även efter att ha tagit hänsyn till eventuell strypning.
Cinebench R15 Multi Loop
Cinebench R23: Multi Core | Single Core
Cinebench R20: CPU (Multi Core) | CPU (Single Core)
Cinebench R15: CPU Multi 64Bit | CPU Single 64Bit
Blender: v2.79 BMW27 CPU
7-Zip 18.03: 7z b 4 | 7z b 4 -mmt1
Geekbench 6.7: Multi-Core | Single-Core
Geekbench 5.5: Multi-Core | Single-Core
HWBOT x265 Benchmark v2.2: 4k Preset
LibreOffice : 20 Documents To PDF
R Benchmark 2.5: Overall mean
| CPU Performance rating | |
| Minisforum AI X1 Pro, HX 470 | |
| Asus NUC 15 Pro+ | |
| GMK EVO-T1 | |
| Genomsnitt Intel Core Ultra 9 386H | |
| Peladn HO5, AI 9 HX 370 | |
| MSI Cubi NUC AI+ 3MG | |
| HP EliteBoard G1a AI | |
| GMK NucBox K13 | |
| MSI Cubi NUC AI+ 2MG | |
| GMK NucBox K16 | |
| MSI Cubi NUC 1M | |
| Minix Elite EU512-AI -2! | |
| Geekom A5 Pro | |
| Cinebench R23 / Multi Core | |
| Minisforum AI X1 Pro, HX 470 | |
| Asus NUC 15 Pro+ | |
| GMK EVO-T1 | |
| Peladn HO5, AI 9 HX 370 | |
| Genomsnitt Intel Core Ultra 9 386H (12144 - 21186, n=8) | |
| MSI Cubi NUC AI+ 3MG | |
| Minix Elite EU512-AI | |
| GMK NucBox K16 | |
| HP EliteBoard G1a AI | |
| GMK NucBox K13 | |
| MSI Cubi NUC AI+ 2MG | |
| MSI Cubi NUC 1M | |
| Geekom A5 Pro | |
| Cinebench R23 / Single Core | |
| Asus NUC 15 Pro+ | |
| GMK EVO-T1 | |
| Minisforum AI X1 Pro, HX 470 | |
| Genomsnitt Intel Core Ultra 9 386H (2010 - 2101, n=8) | |
| MSI Cubi NUC AI+ 3MG | |
| Peladn HO5, AI 9 HX 370 | |
| MSI Cubi NUC AI+ 2MG | |
| GMK NucBox K13 | |
| MSI Cubi NUC 1M | |
| HP EliteBoard G1a AI | |
| Minix Elite EU512-AI | |
| GMK NucBox K16 | |
| Geekom A5 Pro | |
| Cinebench R20 / CPU (Multi Core) | |
| Minisforum AI X1 Pro, HX 470 | |
| Asus NUC 15 Pro+ | |
| GMK EVO-T1 | |
| Peladn HO5, AI 9 HX 370 | |
| Genomsnitt Intel Core Ultra 9 386H (4757 - 8405, n=8) | |
| MSI Cubi NUC AI+ 3MG | |
| Minix Elite EU512-AI | |
| GMK NucBox K16 | |
| HP EliteBoard G1a AI | |
| GMK NucBox K13 | |
| MSI Cubi NUC AI+ 2MG | |
| MSI Cubi NUC 1M | |
| Geekom A5 Pro | |
| Cinebench R20 / CPU (Single Core) | |
| Asus NUC 15 Pro+ | |
| Minisforum AI X1 Pro, HX 470 | |
| GMK EVO-T1 | |
| Genomsnitt Intel Core Ultra 9 386H (762 - 796, n=8) | |
| MSI Cubi NUC AI+ 3MG | |
| MSI Cubi NUC AI+ 2MG | |
| Peladn HO5, AI 9 HX 370 | |
| GMK NucBox K13 | |
| MSI Cubi NUC 1M | |
| HP EliteBoard G1a AI | |
| Minix Elite EU512-AI | |
| GMK NucBox K16 | |
| Geekom A5 Pro | |
| Cinebench R15 / CPU Multi 64Bit | |
| Minisforum AI X1 Pro, HX 470 | |
| Asus NUC 15 Pro+ | |
| GMK EVO-T1 | |
| Peladn HO5, AI 9 HX 370 | |
| Genomsnitt Intel Core Ultra 9 386H (2197 - 3347, n=8) | |
| MSI Cubi NUC AI+ 3MG | |
| Minix Elite EU512-AI | |
| GMK NucBox K16 | |
| HP EliteBoard G1a AI | |
| GMK NucBox K13 | |
| MSI Cubi NUC AI+ 2MG | |
| Geekom A5 Pro | |
| MSI Cubi NUC 1M | |
| Cinebench R15 / CPU Single 64Bit | |
| Asus NUC 15 Pro+ | |
| Minisforum AI X1 Pro, HX 470 | |
| GMK EVO-T1 | |
| Peladn HO5, AI 9 HX 370 | |
| MSI Cubi NUC AI+ 2MG | |
| Genomsnitt Intel Core Ultra 9 386H (249 - 314, n=8) | |
| GMK NucBox K13 | |
| HP EliteBoard G1a AI | |
| MSI Cubi NUC AI+ 3MG | |
| MSI Cubi NUC 1M | |
| GMK NucBox K16 | |
| Minix Elite EU512-AI | |
| Geekom A5 Pro | |
| Blender / v2.79 BMW27 CPU | |
| MSI Cubi NUC 1M | |
| Geekom A5 Pro | |
| MSI Cubi NUC AI+ 2MG | |
| GMK NucBox K13 | |
| HP EliteBoard G1a AI | |
| GMK NucBox K16 | |
| Minix Elite EU512-AI | |
| MSI Cubi NUC AI+ 3MG | |
| Genomsnitt Intel Core Ultra 9 386H (156 - 299, n=8) | |
| GMK EVO-T1 | |
| Asus NUC 15 Pro+ | |
| Peladn HO5, AI 9 HX 370 | |
| Minisforum AI X1 Pro, HX 470 | |
| 7-Zip 18.03 / 7z b 4 | |
| Peladn HO5, AI 9 HX 370 | |
| Minisforum AI X1 Pro, HX 470 | |
| Asus NUC 15 Pro+ | |
| Genomsnitt Intel Core Ultra 9 386H (44980 - 72882, n=8) | |
| GMK EVO-T1 | |
| MSI Cubi NUC AI+ 3MG | |
| GMK NucBox K16 | |
| HP EliteBoard G1a AI | |
| GMK NucBox K13 | |
| Geekom A5 Pro | |
| MSI Cubi NUC AI+ 2MG | |
| MSI Cubi NUC 1M | |
| Minix Elite EU512-AI | |
| 7-Zip 18.03 / 7z b 4 -mmt1 | |
| Minisforum AI X1 Pro, HX 470 | |
| Genomsnitt Intel Core Ultra 9 386H (5488 - 6493, n=8) | |
| Asus NUC 15 Pro+ | |
| GMK EVO-T1 | |
| Peladn HO5, AI 9 HX 370 | |
| MSI Cubi NUC 1M | |
| MSI Cubi NUC AI+ 2MG | |
| GMK NucBox K13 | |
| HP EliteBoard G1a AI | |
| MSI Cubi NUC AI+ 3MG | |
| Geekom A5 Pro | |
| GMK NucBox K16 | |
| Minix Elite EU512-AI | |
| Geekbench 6.7 / Multi-Core | |
| Asus NUC 15 Pro+ | |
| Genomsnitt Intel Core Ultra 9 386H (13776 - 17405, n=10) | |
| GMK EVO-T1 | |
| MSI Cubi NUC AI+ 3MG | |
| Peladn HO5, AI 9 HX 370 | |
| Minisforum AI X1 Pro, HX 470 | |
| HP EliteBoard G1a AI | |
| GMK NucBox K13 | |
| MSI Cubi NUC AI+ 2MG | |
| MSI Cubi NUC 1M | |
| Geekom A5 Pro | |
| GMK NucBox K16 | |
| Geekbench 6.7 / Single-Core | |
| Minisforum AI X1 Pro, HX 470 | |
| GMK EVO-T1 | |
| Genomsnitt Intel Core Ultra 9 386H (2778 - 2919, n=10) | |
| Peladn HO5, AI 9 HX 370 | |
| MSI Cubi NUC AI+ 3MG | |
| GMK NucBox K13 | |
| MSI Cubi NUC AI+ 2MG | |
| Asus NUC 15 Pro+ | |
| MSI Cubi NUC 1M | |
| HP EliteBoard G1a AI | |
| Geekom A5 Pro | |
| GMK NucBox K16 | |
| Geekbench 5.5 / Multi-Core | |
| Genomsnitt Intel Core Ultra 9 386H (13098 - 17557, n=8) | |
| Asus NUC 15 Pro+ | |
| GMK EVO-T1 | |
| Peladn HO5, AI 9 HX 370 | |
| MSI Cubi NUC AI+ 3MG | |
| Minisforum AI X1 Pro, HX 470 | |
| HP EliteBoard G1a AI | |
| Minix Elite EU512-AI | |
| GMK NucBox K13 | |
| MSI Cubi NUC 1M | |
| MSI Cubi NUC AI+ 2MG | |
| GMK NucBox K16 | |
| Geekom A5 Pro | |
| Geekbench 5.5 / Single-Core | |
| Genomsnitt Intel Core Ultra 9 386H (1992 - 2162, n=8) | |
| Peladn HO5, AI 9 HX 370 | |
| GMK EVO-T1 | |
| MSI Cubi NUC AI+ 2MG | |
| GMK NucBox K13 | |
| MSI Cubi NUC AI+ 3MG | |
| Minisforum AI X1 Pro, HX 470 | |
| HP EliteBoard G1a AI | |
| MSI Cubi NUC 1M | |
| Asus NUC 15 Pro+ | |
| Minix Elite EU512-AI | |
| Geekom A5 Pro | |
| GMK NucBox K16 | |
| HWBOT x265 Benchmark v2.2 / 4k Preset | |
| Asus NUC 15 Pro+ | |
| Peladn HO5, AI 9 HX 370 | |
| Minisforum AI X1 Pro, HX 470 | |
| GMK EVO-T1 | |
| Genomsnitt Intel Core Ultra 9 386H (13.2 - 25.1, n=8) | |
| MSI Cubi NUC AI+ 3MG | |
| HP EliteBoard G1a AI | |
| Minix Elite EU512-AI | |
| GMK NucBox K13 | |
| MSI Cubi NUC AI+ 2MG | |
| GMK NucBox K16 | |
| Geekom A5 Pro | |
| MSI Cubi NUC 1M | |
| LibreOffice / 20 Documents To PDF | |
| Minix Elite EU512-AI | |
| HP EliteBoard G1a AI | |
| Minisforum AI X1 Pro, HX 470 | |
| GMK NucBox K16 | |
| Geekom A5 Pro | |
| Peladn HO5, AI 9 HX 370 | |
| Asus NUC 15 Pro+ | |
| GMK EVO-T1 | |
| MSI Cubi NUC AI+ 3MG | |
| GMK NucBox K13 | |
| Genomsnitt Intel Core Ultra 9 386H (38.5 - 56.1, n=8) | |
| MSI Cubi NUC AI+ 2MG | |
| MSI Cubi NUC 1M | |
| R Benchmark 2.5 / Overall mean | |
| Minix Elite EU512-AI | |
| GMK NucBox K16 | |
| Geekom A5 Pro | |
| MSI Cubi NUC AI+ 2MG | |
| HP EliteBoard G1a AI | |
| GMK NucBox K13 | |
| MSI Cubi NUC 1M | |
| GMK EVO-T1 | |
| Asus NUC 15 Pro+ | |
| MSI Cubi NUC AI+ 3MG | |
| Genomsnitt Intel Core Ultra 9 386H (0.4055 - 0.4384, n=8) | |
| Peladn HO5, AI 9 HX 370 | |
| Minisforum AI X1 Pro, HX 470 | |
Cinebench R23: Multi Core | Single Core
Cinebench R20: CPU (Multi Core) | CPU (Single Core)
Cinebench R15: CPU Multi 64Bit | CPU Single 64Bit
Blender: v2.79 BMW27 CPU
7-Zip 18.03: 7z b 4 | 7z b 4 -mmt1
Geekbench 6.7: Multi-Core | Single-Core
Geekbench 5.5: Multi-Core | Single-Core
HWBOT x265 Benchmark v2.2: 4k Preset
LibreOffice : 20 Documents To PDF
R Benchmark 2.5: Overall mean
* ... mindre är bättre
AIDA64: FP32 Ray-Trace | FPU Julia | CPU SHA3 | CPU Queen | FPU SinJulia | FPU Mandel | CPU AES | CPU ZLib | FP64 Ray-Trace | CPU PhotoWorxx | CPU CheckMate
| Performance rating | |
| Asus NUC 15 Pro+ -1! | |
| Genomsnitt Intel Core Ultra 9 386H -1! | |
| GMK EVO-T1 | |
| MSI Cubi NUC AI+ 3MG -1! | |
| GMK NucBox K16 -1! | |
| MSI Cubi NUC AI+ 2MG -1! | |
| Geekom A5 Pro | |
| MSI Cubi NUC 1M -1! | |
| AIDA64 / FP32 Ray-Trace | |
| Asus NUC 15 Pro+ (v6.92.6600) | |
| GMK EVO-T1 (v6.92.6600) | |
| GMK EVO-T1 (v8.20.8100) | |
| Genomsnitt Intel Core Ultra 9 386H (10001 - 21727, n=8) | |
| GMK NucBox K16 (v8.20.8100) | |
| MSI Cubi NUC AI+ 3MG (v8.20.8100) | |
| MSI Cubi NUC AI+ 2MG (v6.92.6600) | |
| Geekom A5 Pro (v8.20.8100) | |
| Geekom A5 Pro (v6.92.6600) | |
| MSI Cubi NUC 1M (v6.92.6600) | |
| AIDA64 / FPU Julia | |
| Asus NUC 15 Pro+ (v6.92.6600) | |
| GMK EVO-T1 (v6.92.6600) | |
| GMK EVO-T1 (v8.20.8100) | |
| Genomsnitt Intel Core Ultra 9 386H (53370 - 113595, n=8) | |
| GMK NucBox K16 (v8.20.8100) | |
| MSI Cubi NUC AI+ 3MG (v8.20.8100) | |
| MSI Cubi NUC AI+ 2MG (v6.92.6600) | |
| Geekom A5 Pro (v8.20.8100) | |
| Geekom A5 Pro (v6.92.6600) | |
| MSI Cubi NUC 1M (v6.92.6600) | |
| AIDA64 / CPU SHA3 | |
| Asus NUC 15 Pro+ (v6.92.6600) | |
| GMK EVO-T1 (v6.92.6600) | |
| GMK EVO-T1 (v8.20.8100) | |
| Genomsnitt Intel Core Ultra 9 386H (2776 - 5604, n=8) | |
| MSI Cubi NUC AI+ 3MG (v8.20.8100) | |
| GMK NucBox K16 (v8.20.8100) | |
| MSI Cubi NUC AI+ 2MG (v6.92.6600) | |
| MSI Cubi NUC 1M (v6.92.6600) | |
| Geekom A5 Pro (v6.92.6600) | |
| Geekom A5 Pro (v8.20.8100) | |
| AIDA64 / CPU Queen | |
| Asus NUC 15 Pro+ (v6.92.6600) | |
| Geekom A5 Pro (v6.92.6600) | |
| MSI Cubi NUC 1M (v6.92.6600) | |
| GMK EVO-T1 (v6.92.6600) | |
| MSI Cubi NUC AI+ 2MG (v6.92.6600) | |
| AIDA64 / FPU SinJulia | |
| GMK NucBox K16 (v8.20.8100) | |
| Asus NUC 15 Pro+ (v6.92.6600) | |
| GMK EVO-T1 (v6.92.6600) | |
| GMK EVO-T1 (v8.20.8100) | |
| Geekom A5 Pro (v6.92.6600) | |
| Geekom A5 Pro (v8.20.8100) | |
| Genomsnitt Intel Core Ultra 9 386H (5314 - 7332, n=8) | |
| MSI Cubi NUC AI+ 3MG (v8.20.8100) | |
| MSI Cubi NUC AI+ 2MG (v6.92.6600) | |
| MSI Cubi NUC 1M (v6.92.6600) | |
| AIDA64 / FPU Mandel | |
| GMK EVO-T1 (v6.92.6600) | |
| GMK EVO-T1 (v8.20.8100) | |
| Asus NUC 15 Pro+ (v6.92.6600) | |
| GMK NucBox K16 (v8.20.8100) | |
| Genomsnitt Intel Core Ultra 9 386H (28414 - 61578, n=8) | |
| MSI Cubi NUC AI+ 3MG (v8.20.8100) | |
| MSI Cubi NUC AI+ 2MG (v6.92.6600) | |
| Geekom A5 Pro (v6.92.6600) | |
| Geekom A5 Pro (v8.20.8100) | |
| MSI Cubi NUC 1M (v6.92.6600) | |
| AIDA64 / CPU AES | |
| Asus NUC 15 Pro+ (v6.92.6600) | |
| GMK EVO-T1 (v6.92.6600) | |
| GMK EVO-T1 (v8.20.8100) | |
| Genomsnitt Intel Core Ultra 9 386H (46362 - 72112, n=8) | |
| GMK NucBox K16 (v8.20.8100) | |
| MSI Cubi NUC AI+ 3MG (v8.20.8100) | |
| MSI Cubi NUC AI+ 2MG (v6.92.6600) | |
| Geekom A5 Pro (v6.92.6600) | |
| Geekom A5 Pro (v8.20.8100) | |
| MSI Cubi NUC 1M (v6.92.6600) | |
| AIDA64 / CPU ZLib | |
| Asus NUC 15 Pro+ (v6.92.6600) | |
| GMK EVO-T1 (v6.92.6600) | |
| GMK EVO-T1 (v8.20.8100) | |
| Genomsnitt Intel Core Ultra 9 386H (669 - 1271, n=8) | |
| MSI Cubi NUC AI+ 3MG (v8.20.8100) | |
| GMK NucBox K16 (v8.20.8100) | |
| MSI Cubi NUC AI+ 2MG (v6.92.6600) | |
| MSI Cubi NUC 1M (v6.92.6600) | |
| Geekom A5 Pro (v6.92.6600) | |
| Geekom A5 Pro (v8.20.8100) | |
| AIDA64 / FP64 Ray-Trace | |
| Asus NUC 15 Pro+ (v6.92.6600) | |
| GMK EVO-T1 (v6.92.6600) | |
| GMK EVO-T1 (v8.20.8100) | |
| Genomsnitt Intel Core Ultra 9 386H (5138 - 11627, n=8) | |
| GMK NucBox K16 (v8.20.8100) | |
| MSI Cubi NUC AI+ 3MG (v8.20.8100) | |
| MSI Cubi NUC AI+ 2MG (v6.92.6600) | |
| Geekom A5 Pro (v8.20.8100) | |
| Geekom A5 Pro (v6.92.6600) | |
| MSI Cubi NUC 1M (v6.92.6600) | |
| AIDA64 / CPU PhotoWorxx | |
| Genomsnitt Intel Core Ultra 9 386H (54042 - 89891, n=8) | |
| GMK EVO-T1 (v8.20.8100) | |
| GMK EVO-T1 (v6.92.6600) | |
| Asus NUC 15 Pro+ (v6.92.6600) | |
| MSI Cubi NUC AI+ 2MG (v6.92.6600) | |
| MSI Cubi NUC AI+ 3MG (v8.20.8100) | |
| MSI Cubi NUC 1M (v6.92.6600) | |
| Geekom A5 Pro (v6.92.6600) | |
| Geekom A5 Pro (v8.20.8100) | |
| GMK NucBox K16 (v8.20.8100) | |
| AIDA64 / CPU CheckMate | |
| Genomsnitt Intel Core Ultra 9 386H (4051 - 4858, n=7) | |
| MSI Cubi NUC AI+ 3MG (v8.20.8100) | |
| GMK EVO-T1 (v8.20.8100) | |
| GMK NucBox K16 (v8.20.8100) | |
| Geekom A5 Pro (v8.20.8100) | |
Systemets prestanda
Geekbench AI: Quantized GPU 1.7 | Half Precision GPU 1.7 | Single Precision GPU 1.7
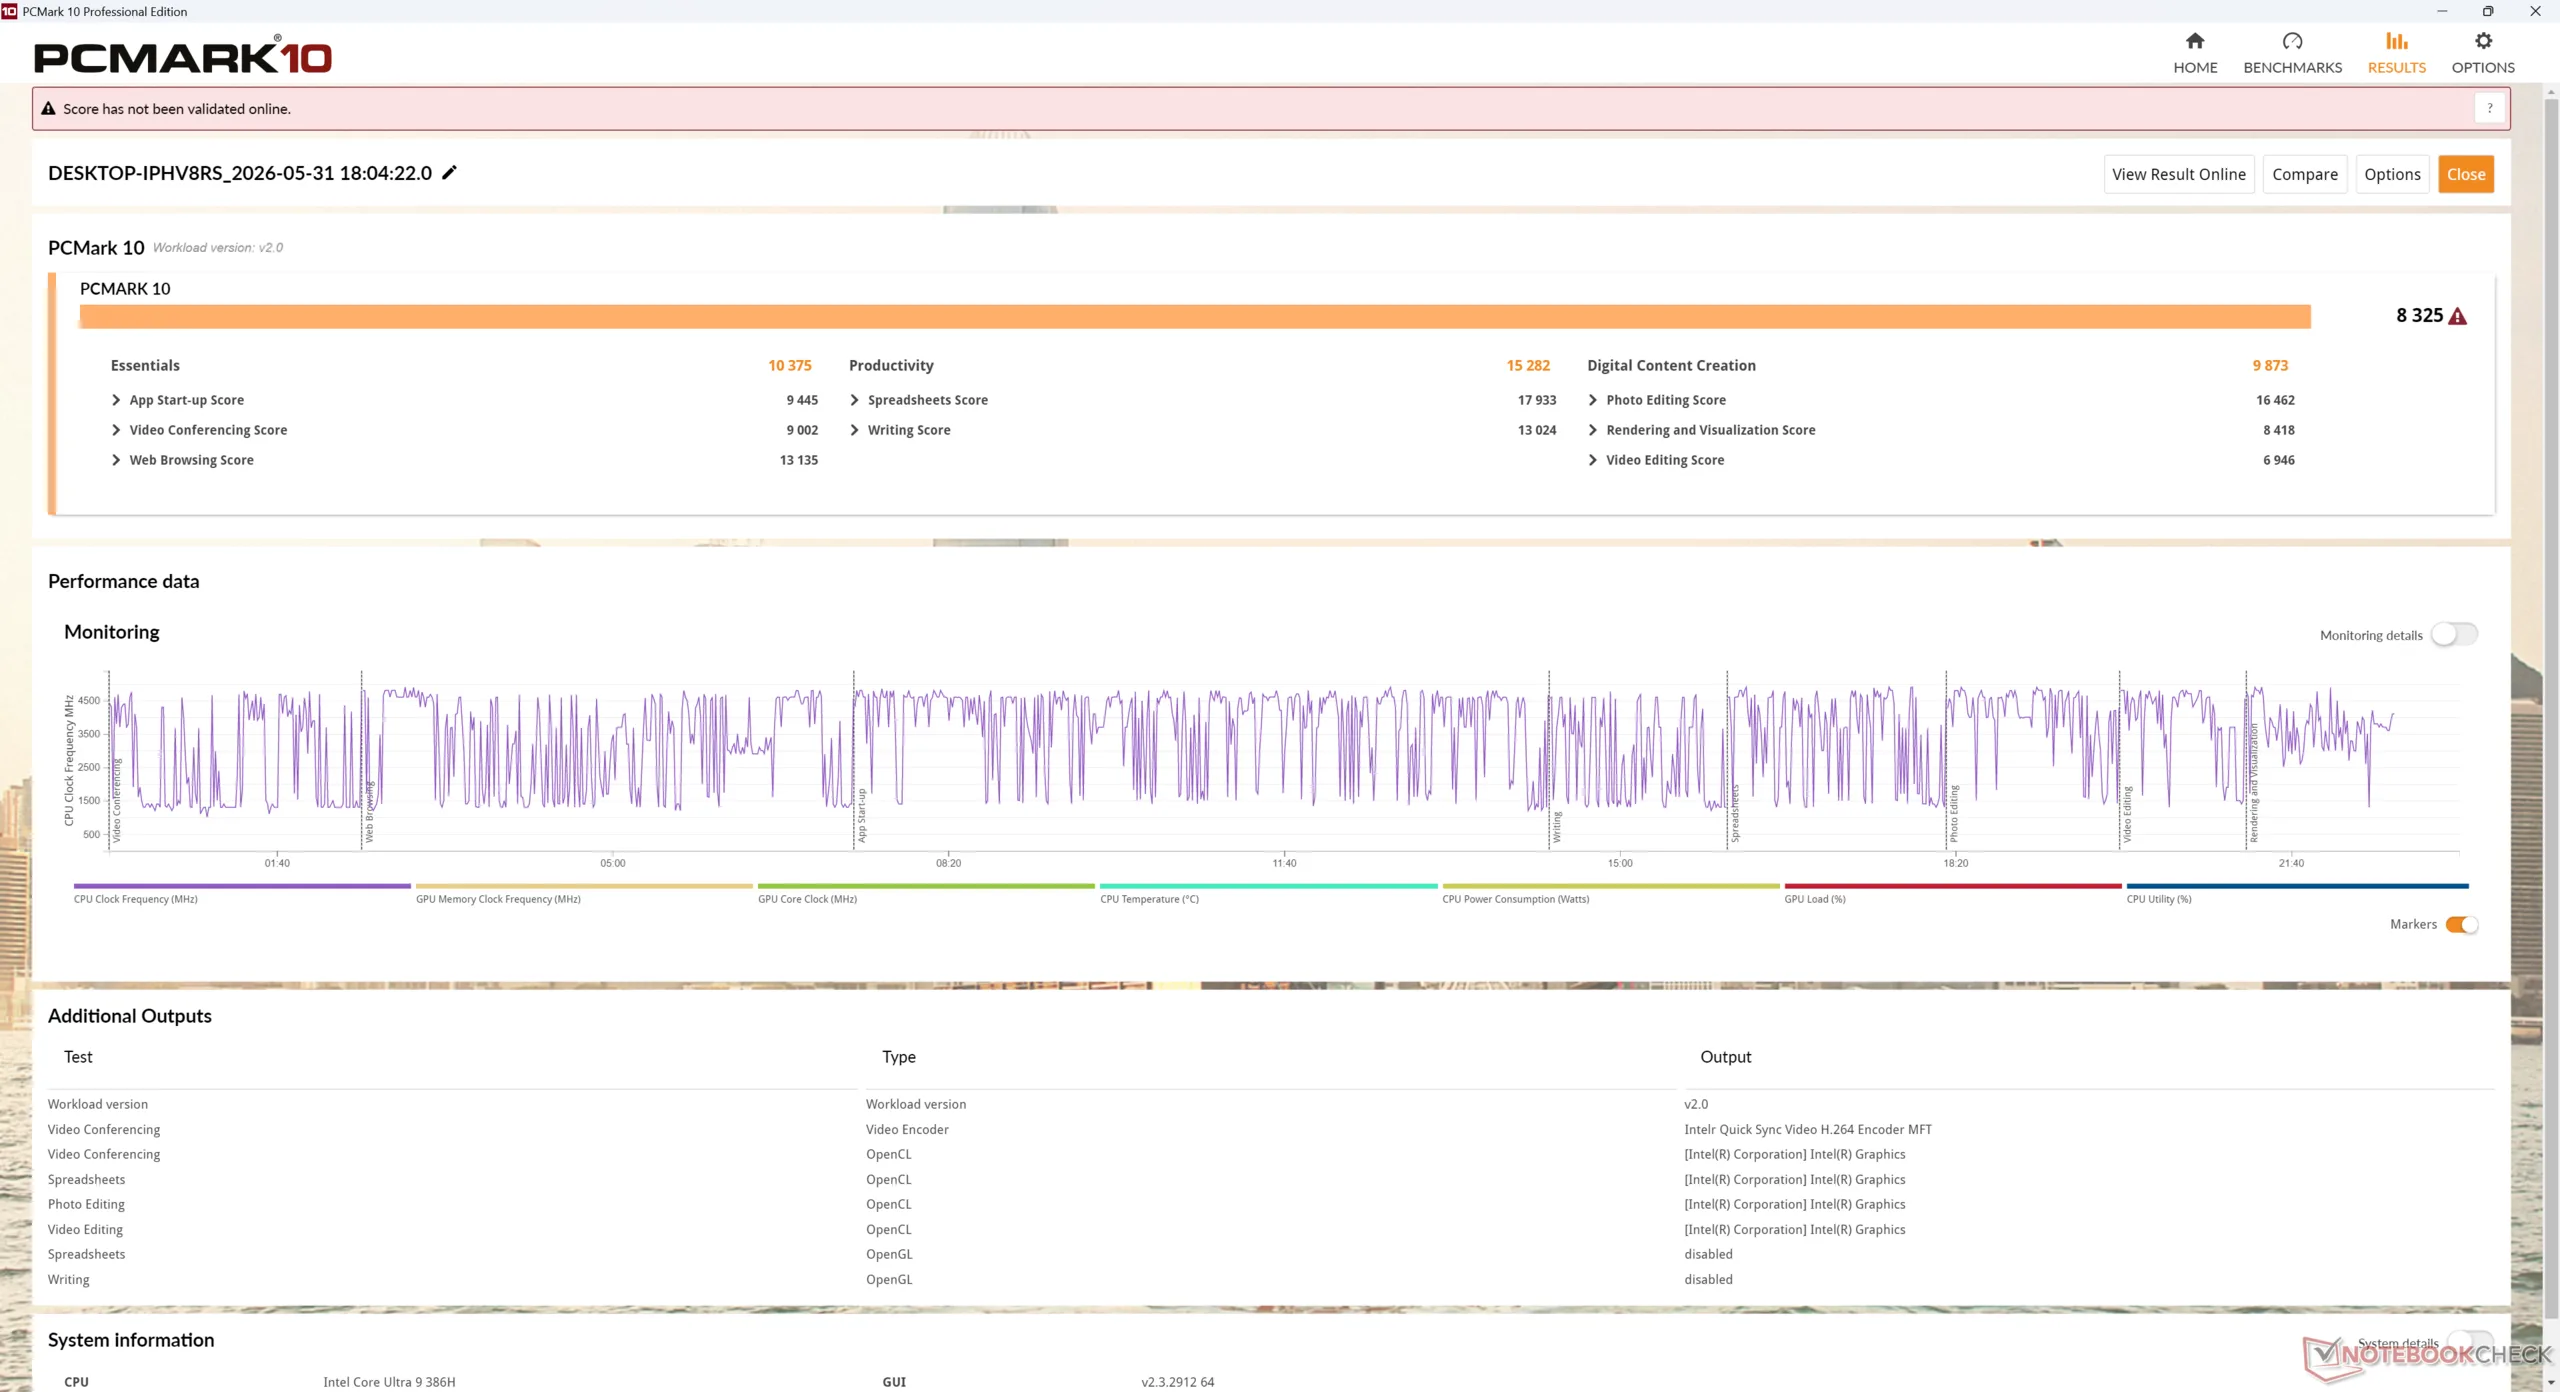
PCMark 10: Score | Essentials | Productivity | Digital Content Creation
CrossMark: Overall | Productivity | Creativity | Responsiveness
WebXPRT 3: Overall
WebXPRT 4: Overall
Mozilla Kraken 1.1: Total
| Performance rating | |
| GMK EVO-T1 | |
| MSI Cubi NUC AI+ 3MG | |
| MSI Cubi NUC AI+ 2MG | |
| Asus NUC 15 Pro+ | |
| MSI Cubi NUC 1M -3! | |
| GMK NucBox K16 -3! | |
| Geekom A5 Pro | |
| Geekbench AI / Quantized GPU 1.7 | |
| MSI Cubi NUC AI+ 2MG | |
| Asus NUC 15 Pro+ | |
| GMK EVO-T1 | |
| MSI Cubi NUC AI+ 3MG | |
| Geekom A5 Pro | |
| Geekbench AI / Half Precision GPU 1.7 | |
| MSI Cubi NUC AI+ 2MG | |
| MSI Cubi NUC AI+ 3MG | |
| GMK EVO-T1 | |
| Asus NUC 15 Pro+ | |
| Geekom A5 Pro | |
| Geekbench AI / Single Precision GPU 1.7 | |
| MSI Cubi NUC AI+ 2MG | |
| Asus NUC 15 Pro+ | |
| GMK EVO-T1 | |
| MSI Cubi NUC AI+ 3MG | |
| Geekom A5 Pro | |
| PCMark 10 / Score | |
| MSI Cubi NUC AI+ 3MG | |
| GMK EVO-T1 | |
| Asus NUC 15 Pro+ | |
| MSI Cubi NUC AI+ 2MG | |
| GMK NucBox K16 | |
| Geekom A5 Pro | |
| MSI Cubi NUC 1M | |
| PCMark 10 / Essentials | |
| MSI Cubi NUC 1M | |
| MSI Cubi NUC AI+ 3MG | |
| GMK EVO-T1 | |
| MSI Cubi NUC AI+ 2MG | |
| Asus NUC 15 Pro+ | |
| Geekom A5 Pro | |
| GMK NucBox K16 | |
| PCMark 10 / Productivity | |
| MSI Cubi NUC AI+ 3MG | |
| Geekom A5 Pro | |
| GMK NucBox K16 | |
| GMK EVO-T1 | |
| MSI Cubi NUC AI+ 2MG | |
| Asus NUC 15 Pro+ | |
| MSI Cubi NUC 1M | |
| PCMark 10 / Digital Content Creation | |
| GMK EVO-T1 | |
| Asus NUC 15 Pro+ | |
| MSI Cubi NUC AI+ 3MG | |
| MSI Cubi NUC AI+ 2MG | |
| GMK NucBox K16 | |
| MSI Cubi NUC 1M | |
| Geekom A5 Pro | |
| CrossMark / Overall | |
| GMK EVO-T1 | |
| MSI Cubi NUC AI+ 3MG | |
| Asus NUC 15 Pro+ | |
| MSI Cubi NUC 1M | |
| MSI Cubi NUC AI+ 2MG | |
| GMK NucBox K16 | |
| Geekom A5 Pro | |
| CrossMark / Productivity | |
| GMK EVO-T1 | |
| MSI Cubi NUC AI+ 3MG | |
| MSI Cubi NUC 1M | |
| Asus NUC 15 Pro+ | |
| MSI Cubi NUC AI+ 2MG | |
| GMK NucBox K16 | |
| Geekom A5 Pro | |
| CrossMark / Creativity | |
| MSI Cubi NUC AI+ 3MG | |
| GMK EVO-T1 | |
| Asus NUC 15 Pro+ | |
| MSI Cubi NUC AI+ 2MG | |
| MSI Cubi NUC 1M | |
| GMK NucBox K16 | |
| Geekom A5 Pro | |
| CrossMark / Responsiveness | |
| GMK EVO-T1 | |
| MSI Cubi NUC AI+ 3MG | |
| MSI Cubi NUC 1M | |
| Asus NUC 15 Pro+ | |
| MSI Cubi NUC AI+ 2MG | |
| GMK NucBox K16 | |
| Geekom A5 Pro | |
| WebXPRT 3 / Overall | |
| GMK EVO-T1 | |
| MSI Cubi NUC AI+ 2MG | |
| MSI Cubi NUC 1M | |
| MSI Cubi NUC AI+ 3MG | |
| Geekom A5 Pro | |
| Asus NUC 15 Pro+ | |
| GMK NucBox K16 | |
| WebXPRT 4 / Overall | |
| GMK EVO-T1 | |
| MSI Cubi NUC AI+ 3MG | |
| MSI Cubi NUC AI+ 2MG | |
| MSI Cubi NUC 1M | |
| Asus NUC 15 Pro+ | |
| Geekom A5 Pro | |
| GMK NucBox K16 | |
| Mozilla Kraken 1.1 / Total | |
| GMK NucBox K16 | |
| Geekom A5 Pro | |
| MSI Cubi NUC 1M | |
| MSI Cubi NUC AI+ 2MG | |
| Asus NUC 15 Pro+ | |
| GMK EVO-T1 | |
| MSI Cubi NUC AI+ 3MG | |
* ... mindre är bättre
| PCMark 10 Score | 8325 poäng | |
Hjälp | ||
| AIDA64 / Memory Copy | |
| Genomsnitt Intel Core Ultra 9 386H (75437 - 129946, n=8) | |
| MSI Cubi NUC AI+ 2MG | |
| Asus NUC 15 Pro+ | |
| GMK EVO-T1 | |
| GMK EVO-T1 | |
| MSI Cubi NUC AI+ 3MG | |
| MSI Cubi NUC 1M | |
| Geekom A5 Pro | |
| Geekom A5 Pro | |
| GMK NucBox K16 | |
| AIDA64 / Memory Read | |
| Genomsnitt Intel Core Ultra 9 386H (81021 - 118858, n=8) | |
| Asus NUC 15 Pro+ | |
| MSI Cubi NUC AI+ 2MG | |
| MSI Cubi NUC AI+ 3MG | |
| GMK EVO-T1 | |
| GMK EVO-T1 | |
| MSI Cubi NUC 1M | |
| Geekom A5 Pro | |
| Geekom A5 Pro | |
| GMK NucBox K16 | |
| AIDA64 / Memory Write | |
| MSI Cubi NUC AI+ 2MG | |
| Genomsnitt Intel Core Ultra 9 386H (75959 - 135096, n=8) | |
| Asus NUC 15 Pro+ | |
| GMK EVO-T1 | |
| GMK EVO-T1 | |
| MSI Cubi NUC AI+ 3MG | |
| MSI Cubi NUC 1M | |
| GMK NucBox K16 | |
| Geekom A5 Pro | |
| Geekom A5 Pro | |
| AIDA64 / Memory Latency | |
| GMK EVO-T1 | |
| GMK EVO-T1 | |
| MSI Cubi NUC AI+ 3MG | |
| GMK NucBox K16 | |
| Asus NUC 15 Pro+ | |
| Genomsnitt Intel Core Ultra 9 386H (87.2 - 116.9, n=8) | |
| Geekom A5 Pro | |
| Geekom A5 Pro | |
| MSI Cubi NUC AI+ 2MG | |
| MSI Cubi NUC 1M | |
* ... mindre är bättre
DPC-fördröjning
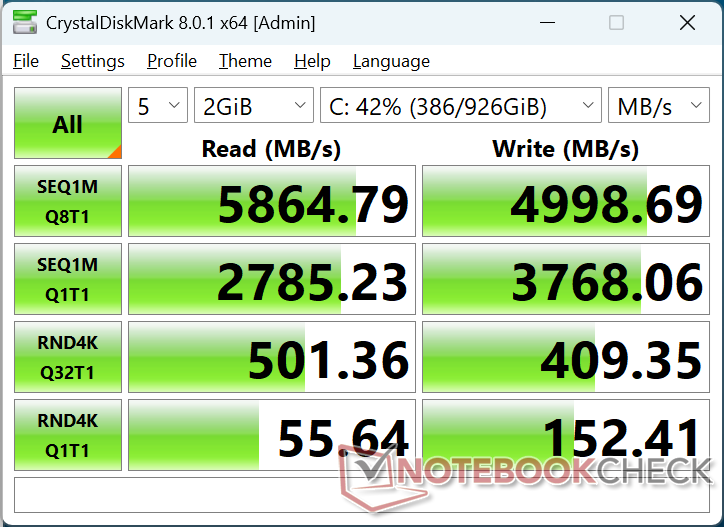
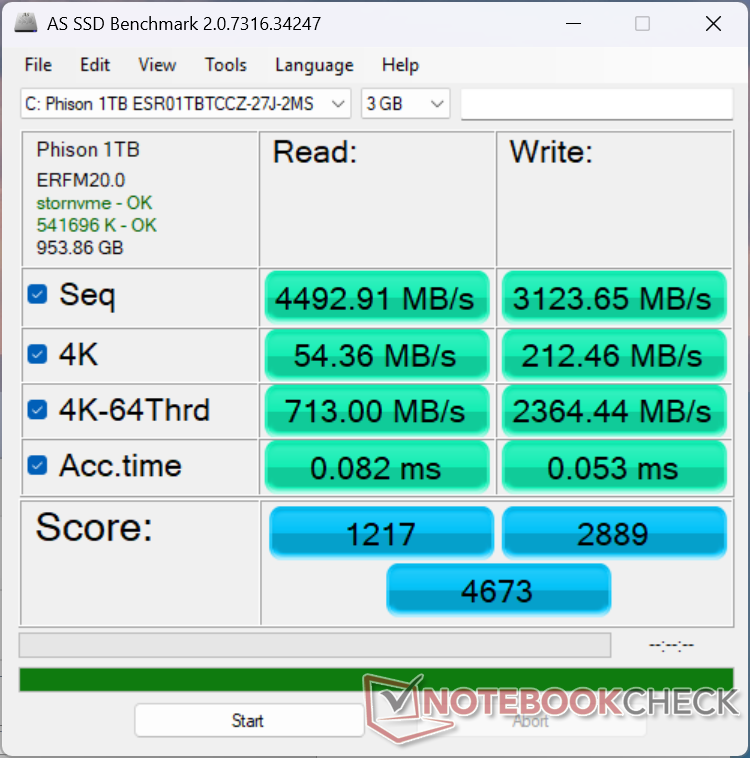
Lagringsenheter
Systemet levereras med samma Phison 1 TB ESR01TBTCCZ PCIe4 NVMe SSD som fanns på förra årets Cubi 2MG.

| Drive Performance rating - Percent | |
| GMK EVO-T1 | |
| Asus NUC 15 Pro+ | |
| MSI Cubi NUC AI+ 3MG | |
| MSI Cubi NUC 1M | |
| Geekom A5 Pro | |
| MSI Cubi NUC AI+ 2MG | |
| GMK NucBox K16 | |
* ... mindre är bättre
Diskbegränsning: DiskSpd läsloop, ködjup 8
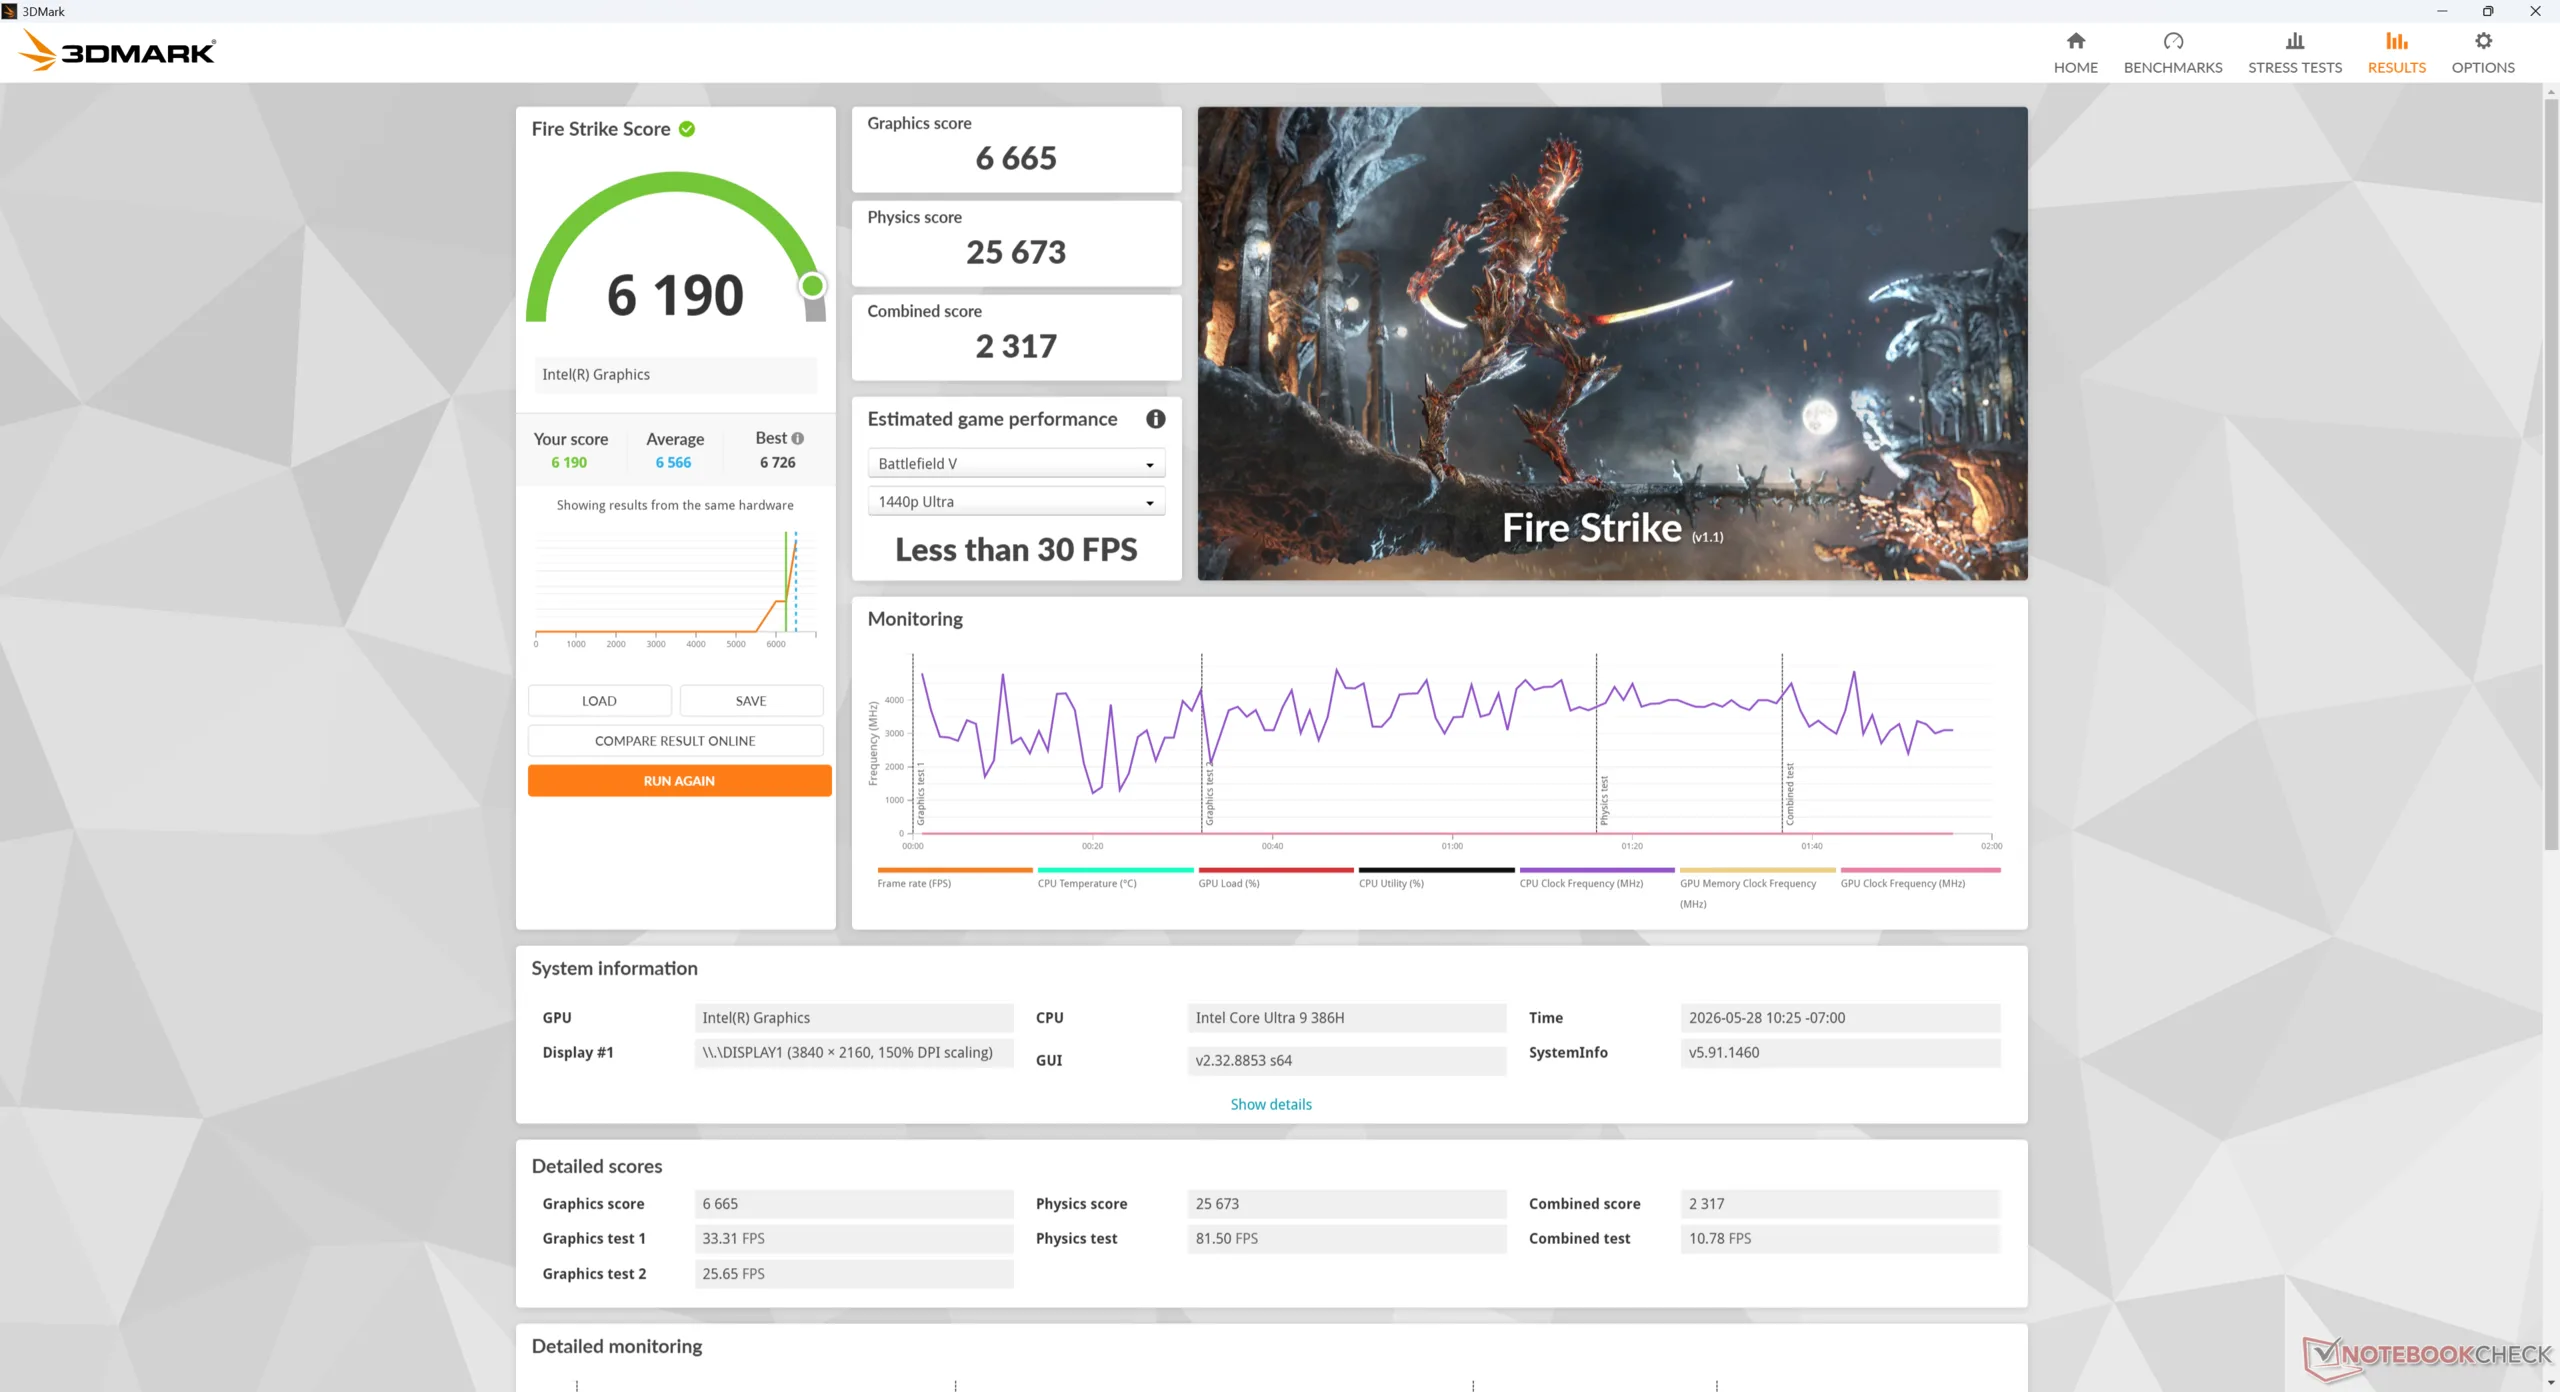
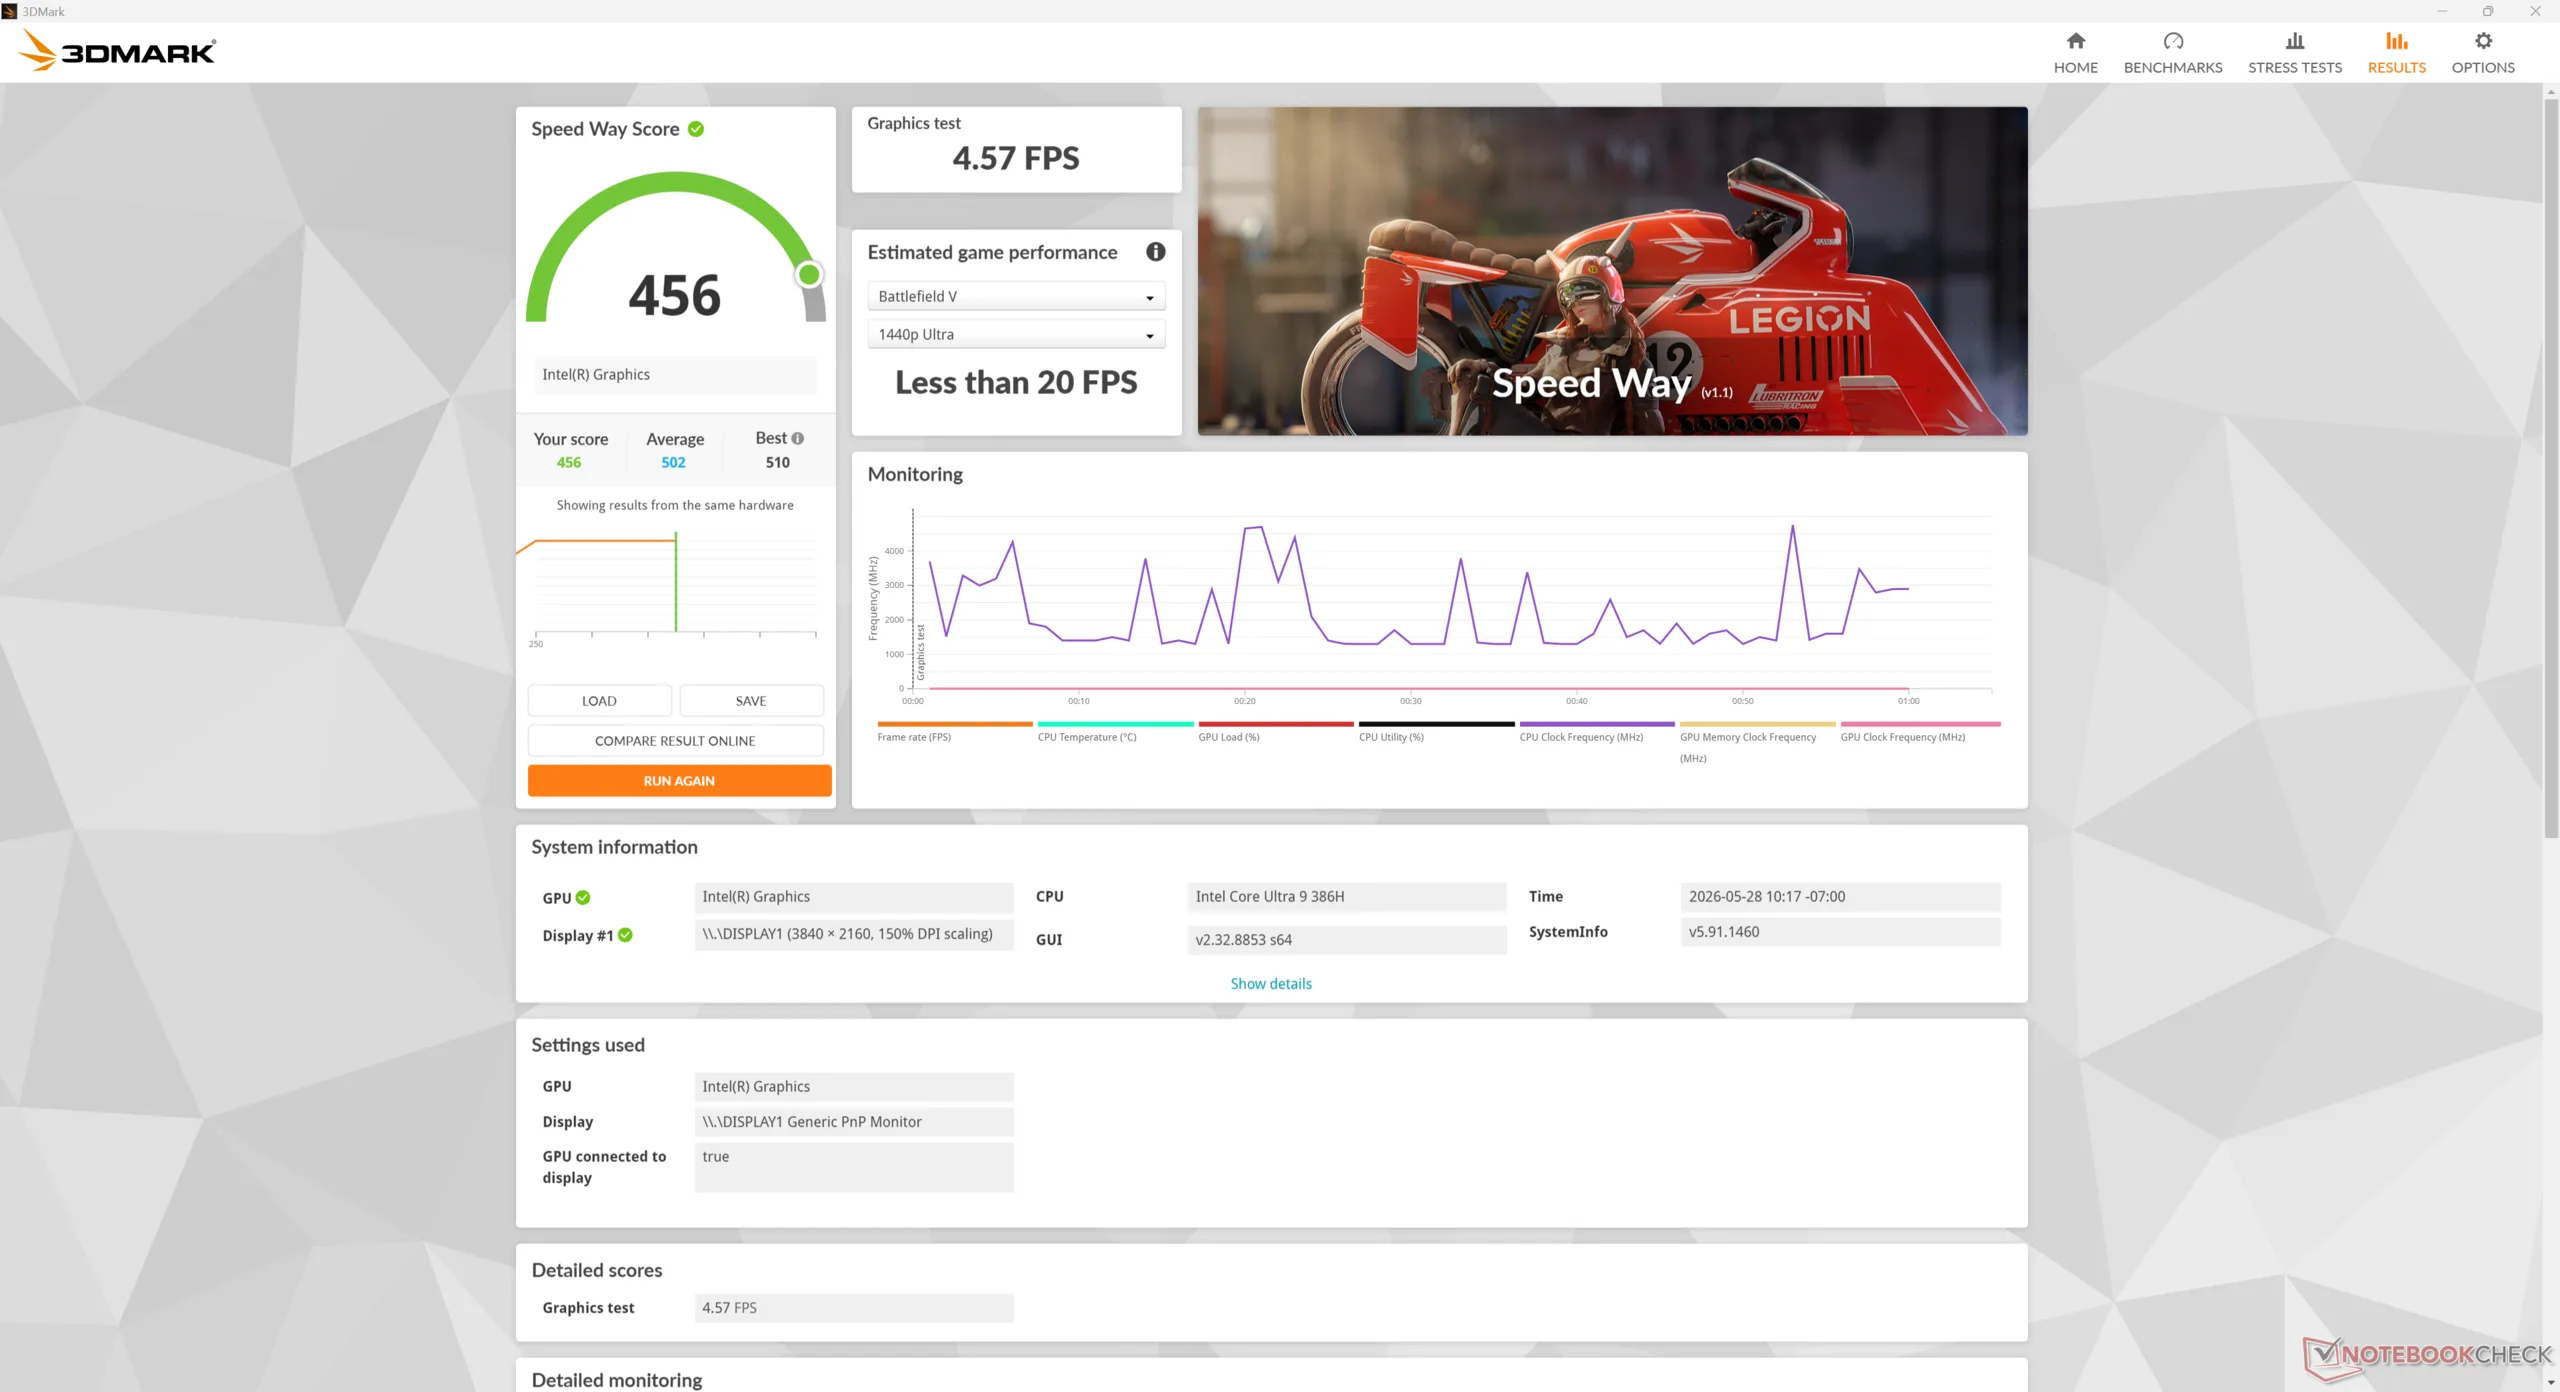
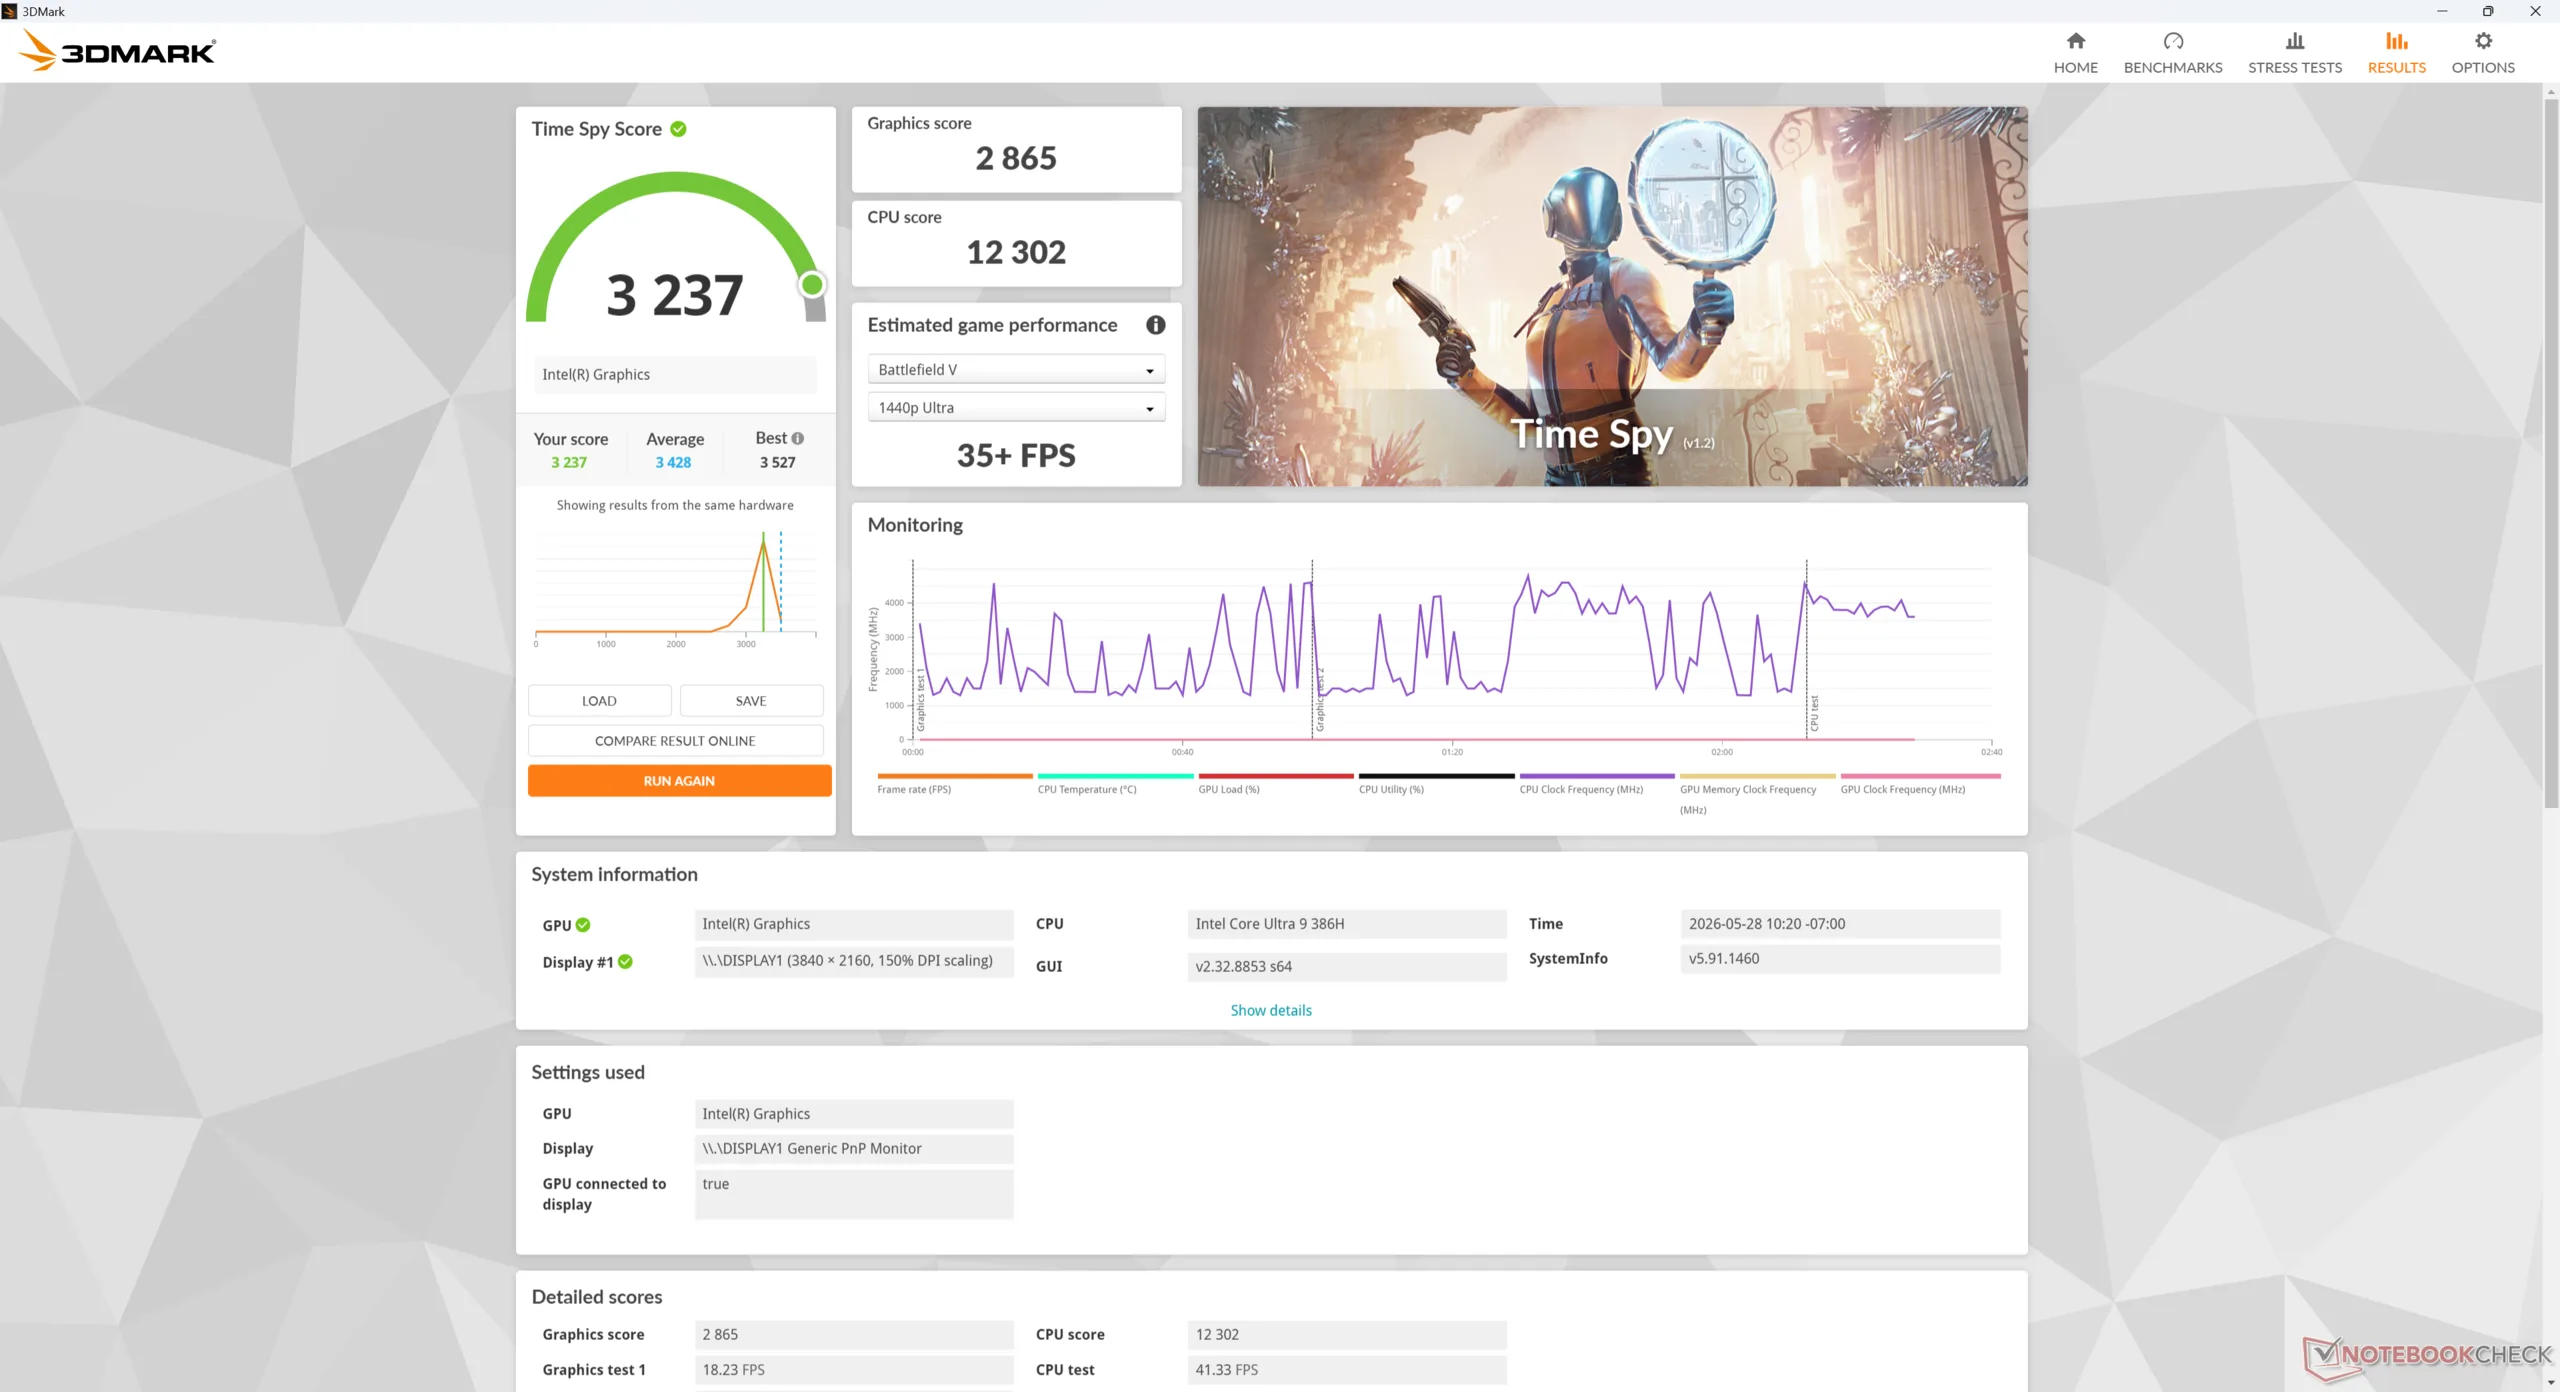
GPU-prestanda
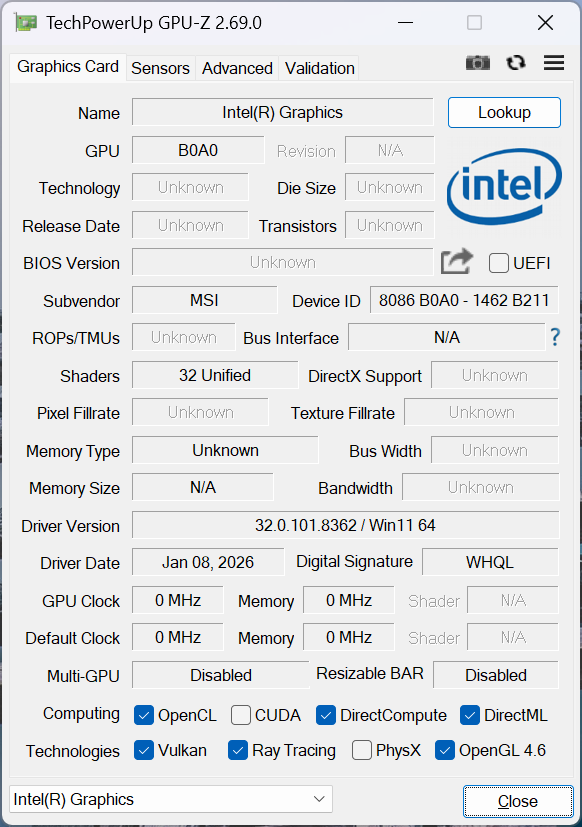
Den integrerade Graphics 4 Xe3 presterar mest likadant som förra årets Arc 140V om inte något snabbare med några procentenheter i genomsnitt. Core Ultra 9 386H har inte eliten Arc B390 i Panther Lake X7-serien och därför är grafikprestanda inte en primär funktion hos MSI Cubi.
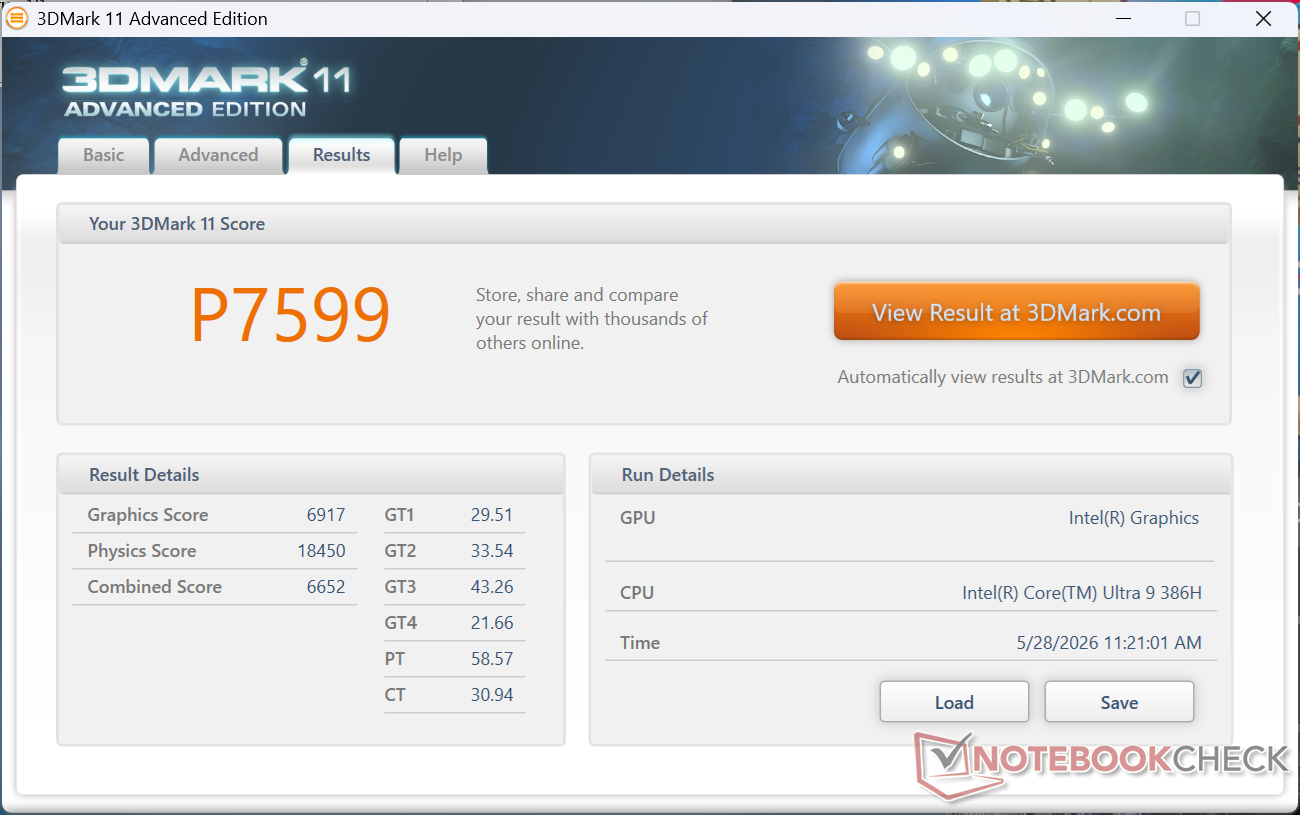
| 3DMark 11 Performance | 7599 poäng | |
| 3DMark Cloud Gate Standard Score | 30367 poäng | |
| 3DMark Fire Strike Score | 6190 poäng | |
| 3DMark Time Spy Score | 3237 poäng | |
Hjälp | ||
* ... mindre är bättre
| Performance rating - Percent | |
| Asus NUC 15 Pro+ | |
| GMK EVO-T1 -1! | |
| MSI Cubi NUC AI+ 2MG | |
| MSI Cubi NUC AI+ 3MG | |
| GMK NucBox K16 | |
| MSI Cubi NUC 1M -2! | |
| Geekom A5 Pro -2! | |
| Cyberpunk 2077 - 1920x1080 Ultra Preset (FSR off) | |
| Asus NUC 15 Pro+ | |
| GMK EVO-T1 | |
| MSI Cubi NUC AI+ 3MG | |
| MSI Cubi NUC AI+ 2MG | |
| GMK NucBox K16 | |
| MSI Cubi NUC 1M | |
| Geekom A5 Pro | |
| Baldur's Gate 3 - 1920x1080 Ultra Preset AA:T | |
| MSI Cubi NUC AI+ 2MG | |
| Asus NUC 15 Pro+ | |
| GMK EVO-T1 | |
| MSI Cubi NUC AI+ 3MG | |
| GMK NucBox K16 | |
| GTA V - 1920x1080 Highest AA:4xMSAA + FX AF:16x | |
| MSI Cubi NUC AI+ 2MG | |
| MSI Cubi NUC AI+ 3MG | |
| Asus NUC 15 Pro+ | |
| GMK EVO-T1 | |
| GMK NucBox K16 | |
| MSI Cubi NUC 1M | |
| Geekom A5 Pro | |
| Final Fantasy XV Benchmark - 1920x1080 High Quality | |
| GMK EVO-T1 | |
| Asus NUC 15 Pro+ | |
| MSI Cubi NUC AI+ 2MG | |
| MSI Cubi NUC AI+ 3MG | |
| MSI Cubi NUC 1M | |
| GMK NucBox K16 | |
| Geekom A5 Pro | |
| Strange Brigade - 1920x1080 ultra AA:ultra AF:16 | |
| MSI Cubi NUC AI+ 2MG | |
| Asus NUC 15 Pro+ | |
| MSI Cubi NUC AI+ 3MG | |
| GMK NucBox K16 | |
| MSI Cubi NUC 1M | |
| Dota 2 Reborn - 1920x1080 ultra (3/3) best looking | |
| Asus NUC 15 Pro+ | |
| GMK EVO-T1 | |
| MSI Cubi NUC AI+ 3MG | |
| MSI Cubi NUC AI+ 2MG | |
| MSI Cubi NUC 1M | |
| GMK NucBox K16 | |
| Geekom A5 Pro | |
| X-Plane 11.11 - 1920x1080 high (fps_test=3) | |
| Asus NUC 15 Pro+ | |
| GMK EVO-T1 | |
| MSI Cubi NUC AI+ 2MG | |
| GMK NucBox K16 | |
| MSI Cubi NUC AI+ 3MG | |
| Geekom A5 Pro | |
| F1 24 | |
| 1920x1080 Low Preset AA:T AF:16x | |
| GMK EVO-T1 | |
| Asus NUC 15 Pro+ | |
| MSI Cubi NUC AI+ 2MG | |
| MSI Cubi NUC AI+ 3MG | |
| Genomsnitt Intel Graphics 4 Xe3 Panther Lake iGPU (55.6 - 69.3, n=7) | |
| GMK NucBox K16 | |
| Geekom A5 Pro | |
| 1920x1080 Medium Preset AA:T AF:16x | |
| GMK EVO-T1 | |
| Asus NUC 15 Pro+ | |
| MSI Cubi NUC AI+ 3MG | |
| Genomsnitt Intel Graphics 4 Xe3 Panther Lake iGPU (52.7 - 64.3, n=7) | |
| GMK NucBox K16 | |
| Geekom A5 Pro | |
| 1920x1080 High Preset AA:T AF:16x | |
| GMK EVO-T1 | |
| Asus NUC 15 Pro+ | |
| MSI Cubi NUC AI+ 2MG | |
| MSI Cubi NUC AI+ 3MG | |
| Genomsnitt Intel Graphics 4 Xe3 Panther Lake iGPU (40.8 - 48, n=7) | |
| GMK NucBox K16 | |
| Geekom A5 Pro | |
| 1920x1080 Ultra High Preset AA:T AF:16x | |
| GMK EVO-T1 | |
| Asus NUC 15 Pro+ | |
| MSI Cubi NUC AI+ 2MG | |
| Genomsnitt Intel Graphics 4 Xe3 Panther Lake iGPU (13.2 - 15.1, n=7) | |
| MSI Cubi NUC AI+ 3MG | |
| GMK NucBox K16 | |
Cyberpunk 2077 ultra FPS-diagram
| låg | med. | hög | ultra | |
|---|---|---|---|---|
| GTA V (2015) | 157.9 | 149.5 | 51.1 | 20.4 |
| Dota 2 Reborn (2015) | 104.1 | 80.3 | 81.2 | 79.9 |
| Final Fantasy XV Benchmark (2018) | 64.3 | 34.6 | 25.1 | |
| X-Plane 11.11 (2018) | 41.7 | 33.2 | 28.6 | |
| Strange Brigade (2018) | 172.6 | 68 | 56.9 | 48.5 |
| Baldur's Gate 3 (2023) | 31.6 | 26.3 | 23.1 | 22.8 |
| Cyberpunk 2077 (2023) | 37.1 | 28.4 | 24.5 | 21.1 |
| F1 24 (2024) | 66.9 | 61.5 | 45.8 | 14.2 |
Utsläpp
Systembuller
Den interna fläkten är alltid aktiv oavsett belastningen på skärmen, ungefär som vi såg på äldre Cubi-modeller. Den är tillräckligt tyst utan några större strypningsproblem för att vara omärkbar på ett kontor eller i en butik, men den kan öka till mitten av 40 dB(A)-området när den kör mer krävande belastningar under längre perioder för att vara lika högljudd som vissa bärbara speldatorer.
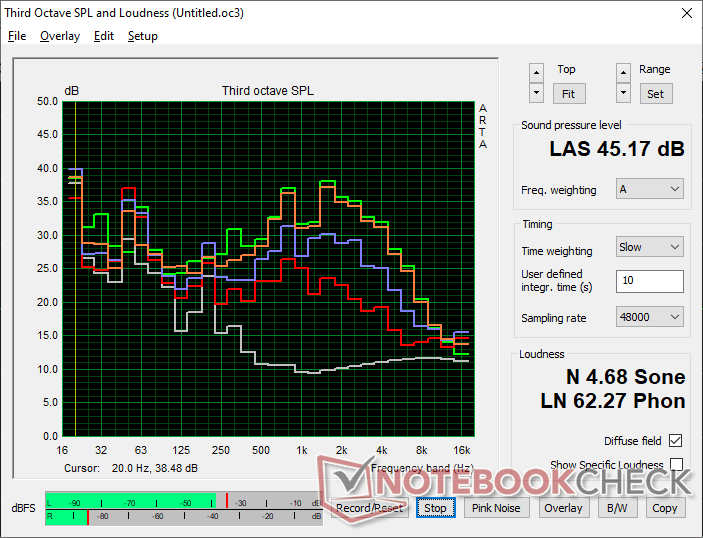
Ljudnivå
| Låg belastning |
| 28 / 33.2 / 33.5 dB(A) |
| Hög belastning |
| 39.1 / 45.2 dB(A) |
 | ||
30 dB tyst 40 dB(A) hörbar 50 dB(A) högt ljud |
||
min: | ||
| MSI Cubi NUC AI+ 3MG Ultra 9 386H, Intel Graphics 4 Xe3 PTL | GMK NucBox K16 R7 7735HS, Radeon 680M | GMK EVO-T1 Ultra 9 285H, Arc 140T | Geekom A5 Pro R5 7530U, Vega 7 | Asus NUC 15 Pro+ Ultra 9 285H, Arc 140T | MSI Cubi NUC AI+ 2MG Core Ultra 7 258V, Arc 140V | MSI Cubi NUC 1M Core 7 150U, Iris Xe G7 96EUs | |
|---|---|---|---|---|---|---|---|
| Noise | -6% | -20% | 15% | -3% | -2% | 6% | |
| av / miljö * (dB) | 23.6 | 23.6 -0% | 24.7 -5% | 25 -6% | 25.3 -7% | 24.8 -5% | 23.5 -0% |
| Idle Minimum * (dB) | 28 | 30.9 -10% | 38.7 -38% | 26.6 5% | 25.4 9% | 28 -0% | 29.9 -7% |
| Idle Average * (dB) | 33.2 | 31.6 5% | 38.8 -17% | 26.6 20% | 25.5 23% | 36.1 -9% | 29.9 10% |
| Idle Maximum * (dB) | 33.5 | 31.6 6% | 38.9 -16% | 26.7 20% | 37.3 -11% | 36.1 -8% | 32 4% |
| Load Average * (dB) | 39.1 | 45.3 -16% | 51.6 -32% | 33.5 14% | 44.4 -14% | 38.9 1% | 33.5 14% |
| Cyberpunk 2077 ultra * (dB) | 44.4 | 49.2 -11% | 52 -17% | 31.2 30% | 46.2 -4% | 37 17% | 39.1 12% |
| Load Maximum * (dB) | 45.2 | 51.7 -14% | 51.6 -14% | 33.8 25% | 52.7 -17% | 49.2 -9% | 40.5 10% |
| Witcher 3 ultra * (dB) | 38.7 | 31.2 | 47.7 |
* ... mindre är bättre
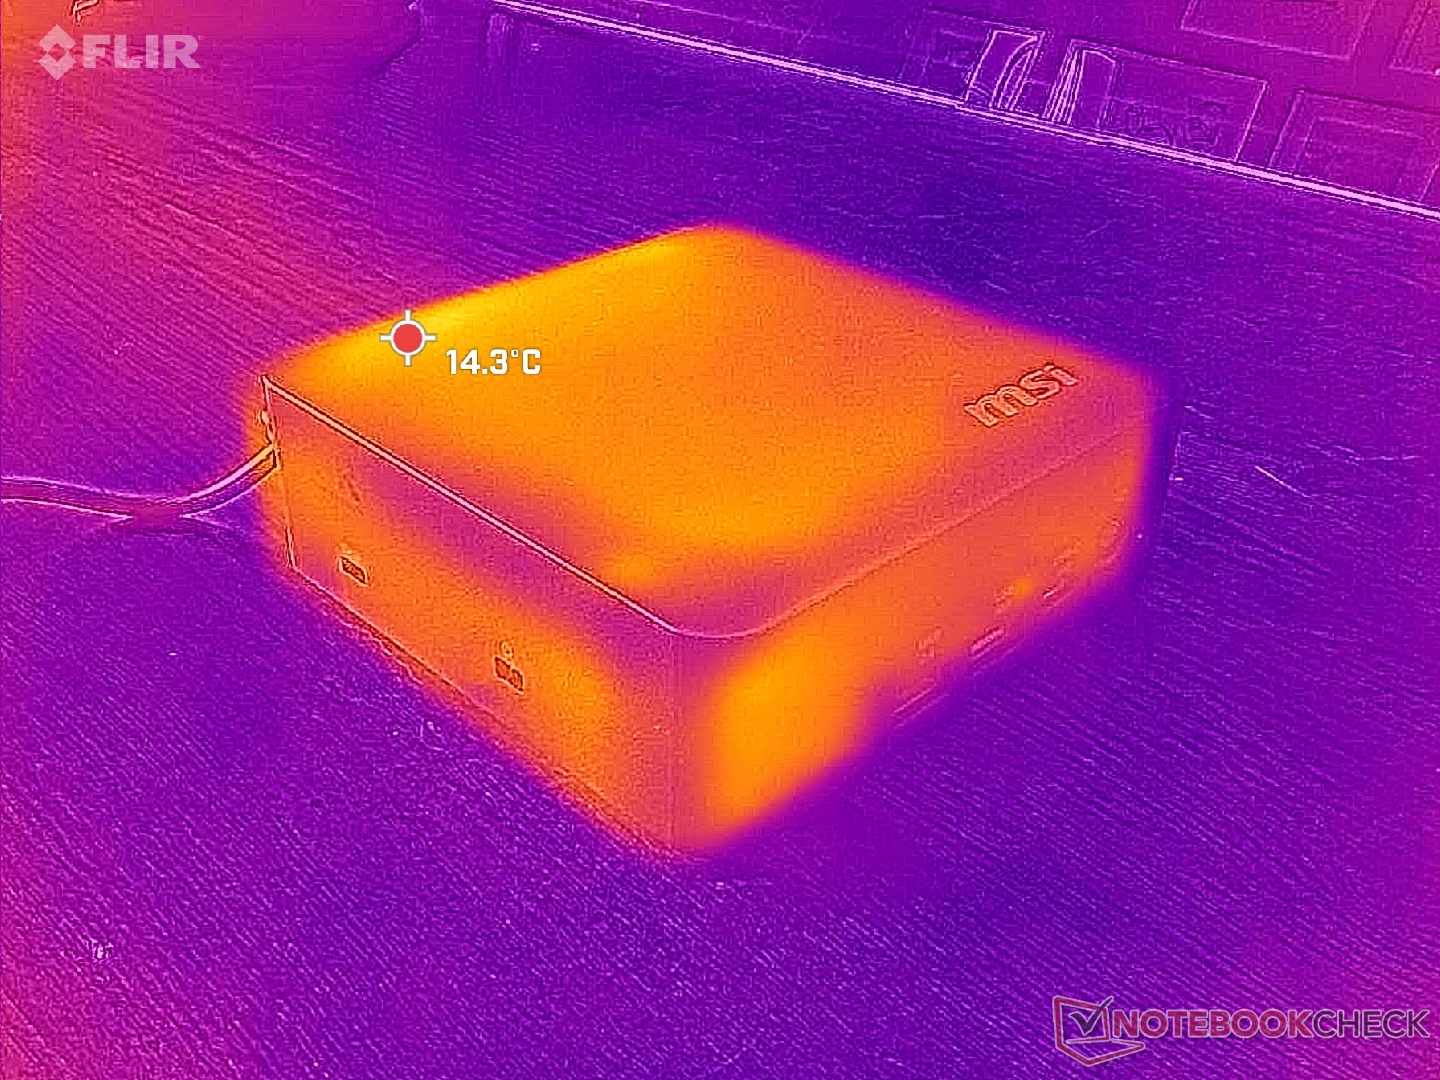
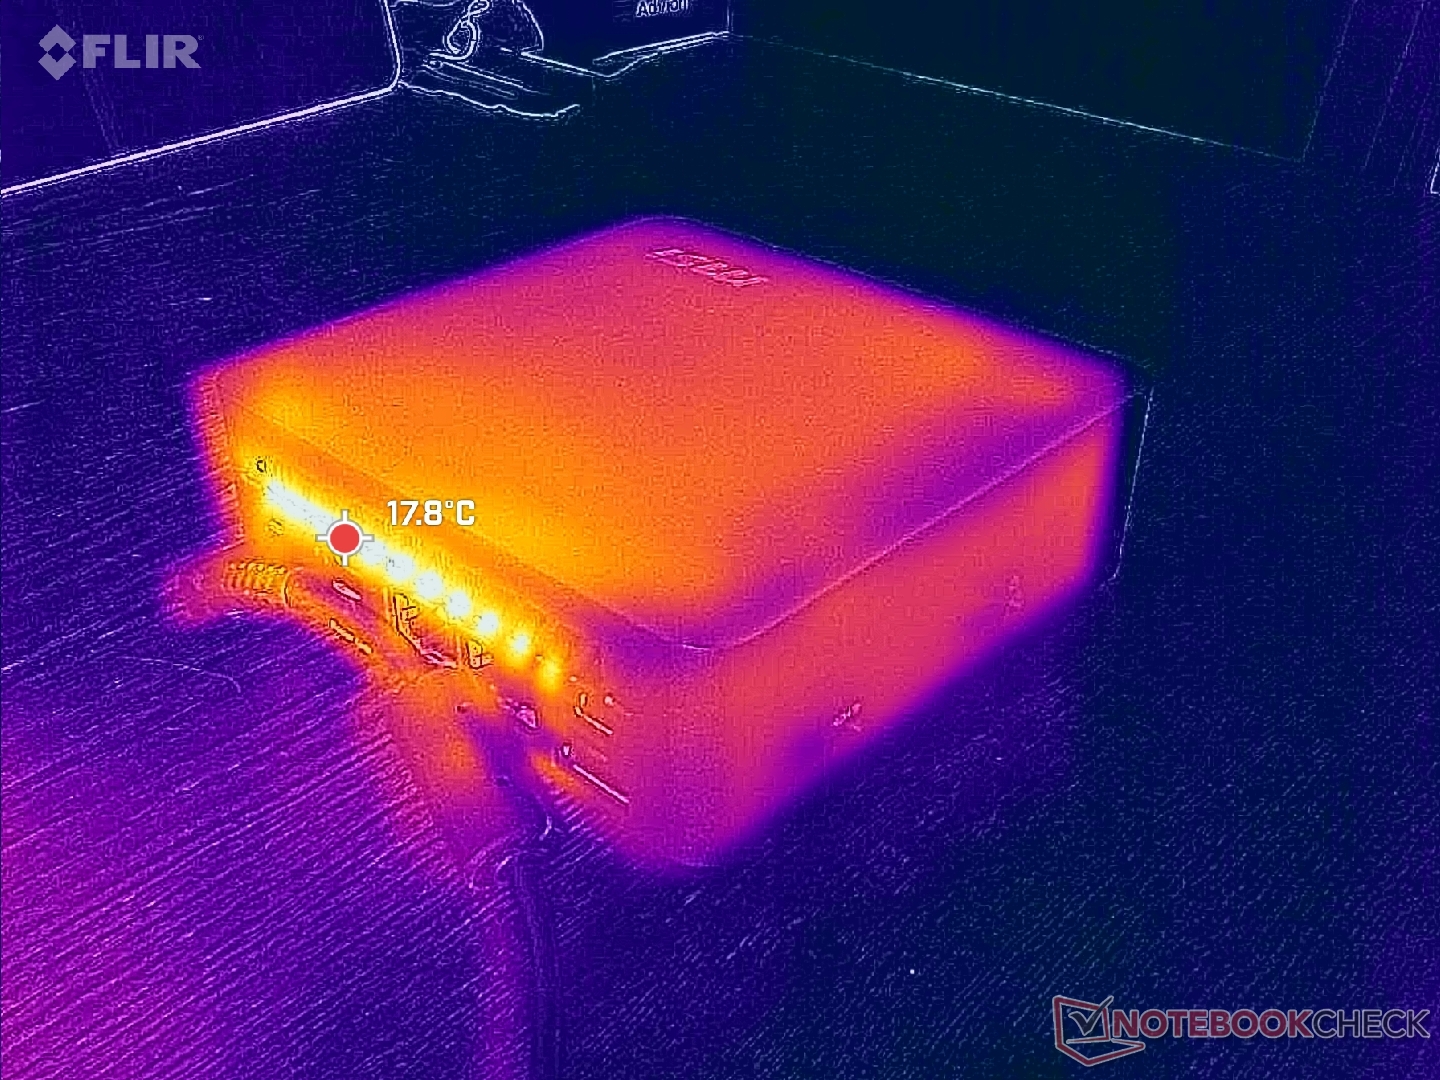
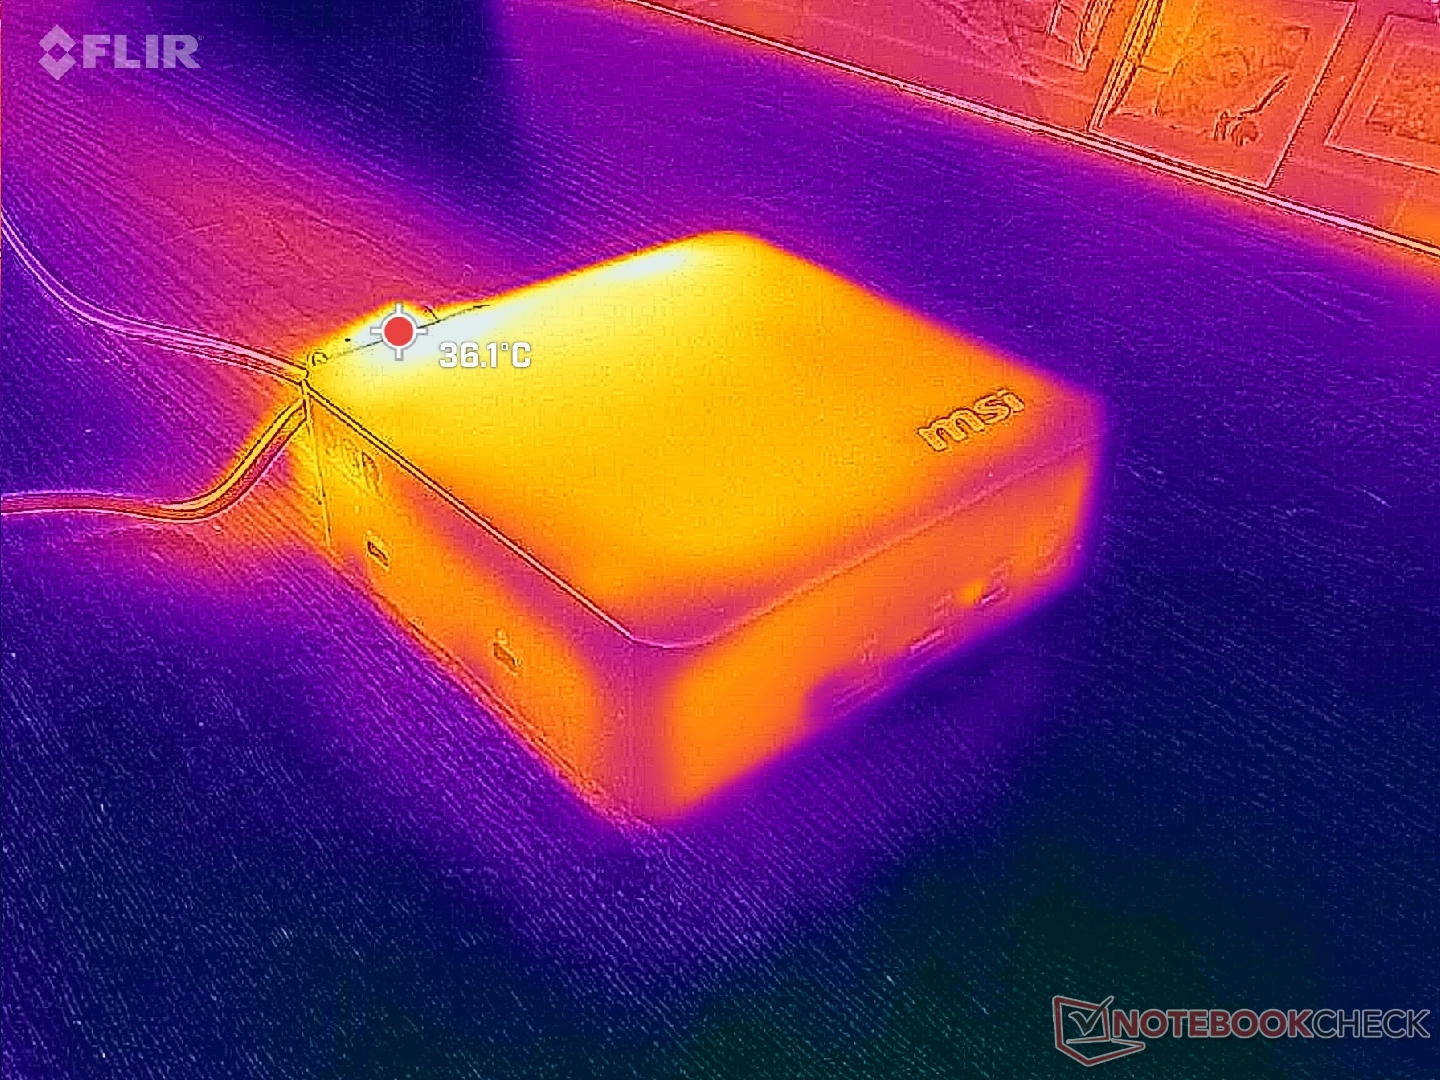
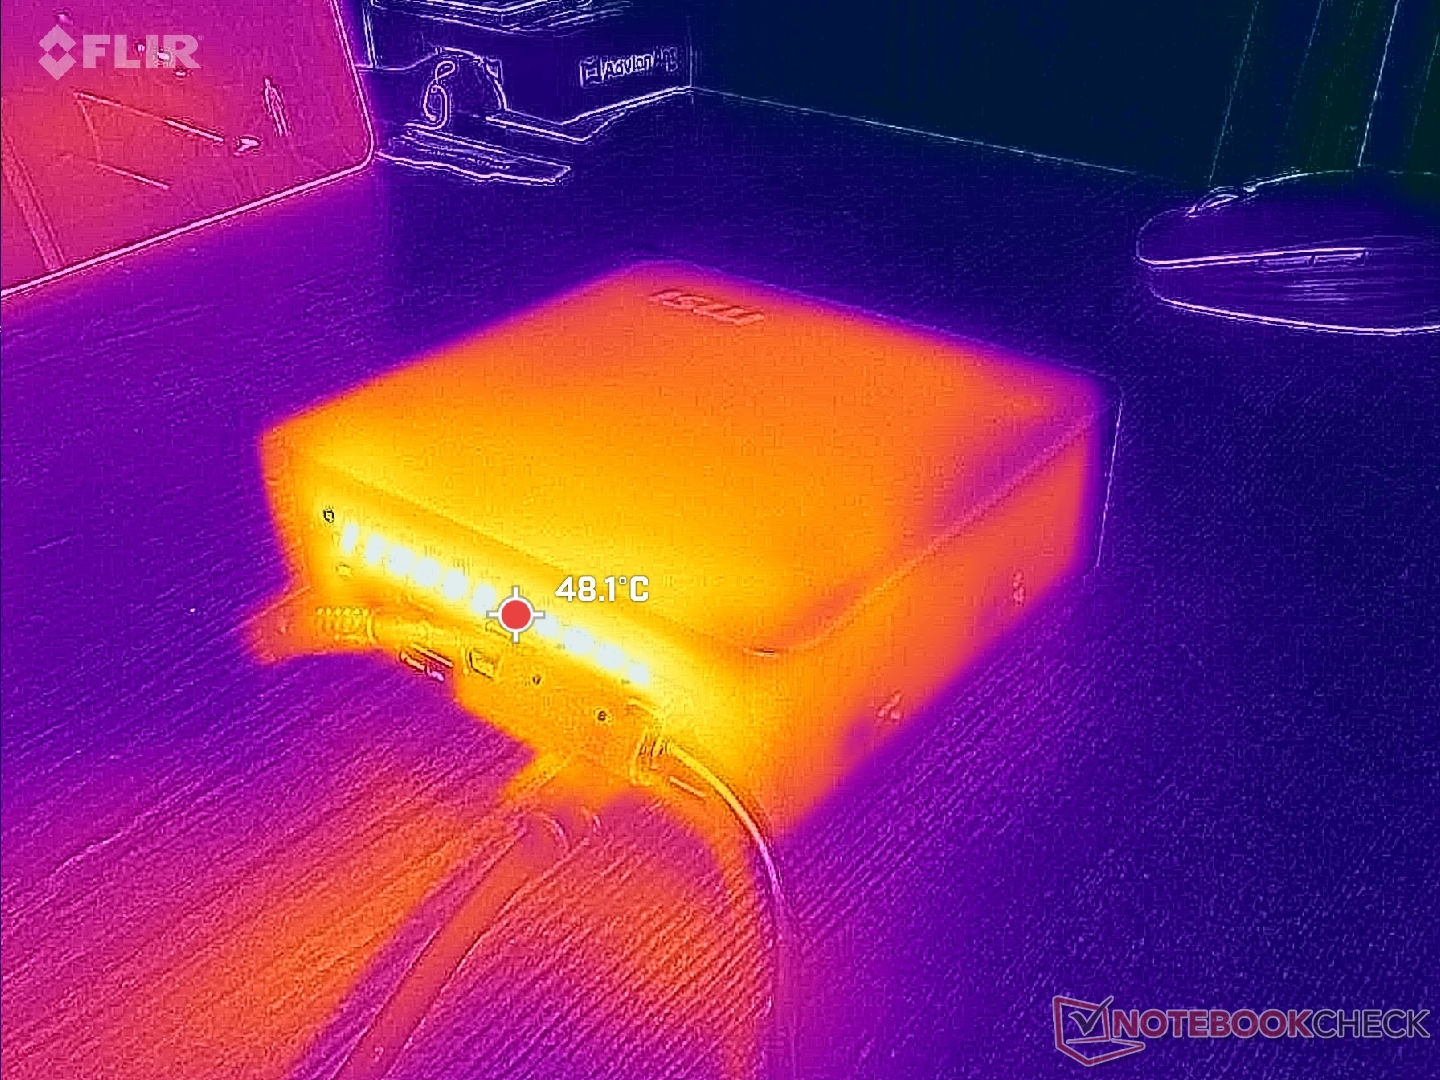
Temperatur
Yttemperaturerna är relativt svala, delvis på grund av plastchassit och den effektiva processorn. Baksidan blir något varmare än framsidan, vilket är väntat.
Ventilationsgallren hålls till ett minimum till skillnad från vissa alternativ som GMK EVO-serien.
(+) Den maximala temperaturen på ovansidan är 36.2 °C / 97 F, jämfört med genomsnittet av 35.4 °C / 96 F , allt från 20.6 till 69.5 °C för klassen Mini PC.
(+) Botten värms upp till maximalt 34.6 °C / 94 F, jämfört med genomsnittet av 36.1 °C / 97 F
(+) Vid tomgångsbruk är medeltemperaturen för ovansidan 22.8 °C / 73 F, jämfört med enhetsgenomsnittet på 32.1 °C / ### class_avg_f### F.
| MSI Cubi NUC AI+ 3MG Ultra 9 386H, Intel Graphics 4 Xe3 PTL | GMK NucBox K16 R7 7735HS, Radeon 680M | GMK EVO-T1 Ultra 9 285H, Arc 140T | Geekom A5 Pro R5 7530U, Vega 7 | Asus NUC 15 Pro+ Ultra 9 285H, Arc 140T | MSI Cubi NUC AI+ 2MG Core Ultra 7 258V, Arc 140V | |
|---|---|---|---|---|---|---|
| Heat | 8% | -26% | -8% | -25% | 3% | |
| Maximum Upper Side * (°C) | 36.2 | 28.4 22% | 36.4 -1% | 36.7 -1% | 42.2 -17% | 30.8 15% |
| Maximum Bottom * (°C) | 34.6 | 29.4 15% | 48.5 -40% | 40.5 -17% | 31.3 10% | 26.4 24% |
| Idle Upper Side * (°C) | 23.2 | 23.4 -1% | 29.6 -28% | 23.1 -0% | 34.9 -50% | 26.4 -14% |
| Idle Bottom * (°C) | 22.4 | 23.6 -5% | 30 -34% | 25.1 -12% | 32.2 -44% | 25.4 -13% |
* ... mindre är bättre
Stresstest
Processorn ökade till 3 GHz, 61 W och 92 C när Prime95-belastningen inleddes. Efter 20 sekunder sjönk den dock till endast 2,1 GHz och 30 W för att bibehålla en kärntemperatur på 88 C. Den begränsade Turbo Boost-potentialen stöder våra observationer av strömförbrukning och CineBench R15.
Kärntemperaturen stabiliserades på 80 C när Cyberpunk 2077 kördes, jämfört med endast 63 C på förra årets NUC 2MG.
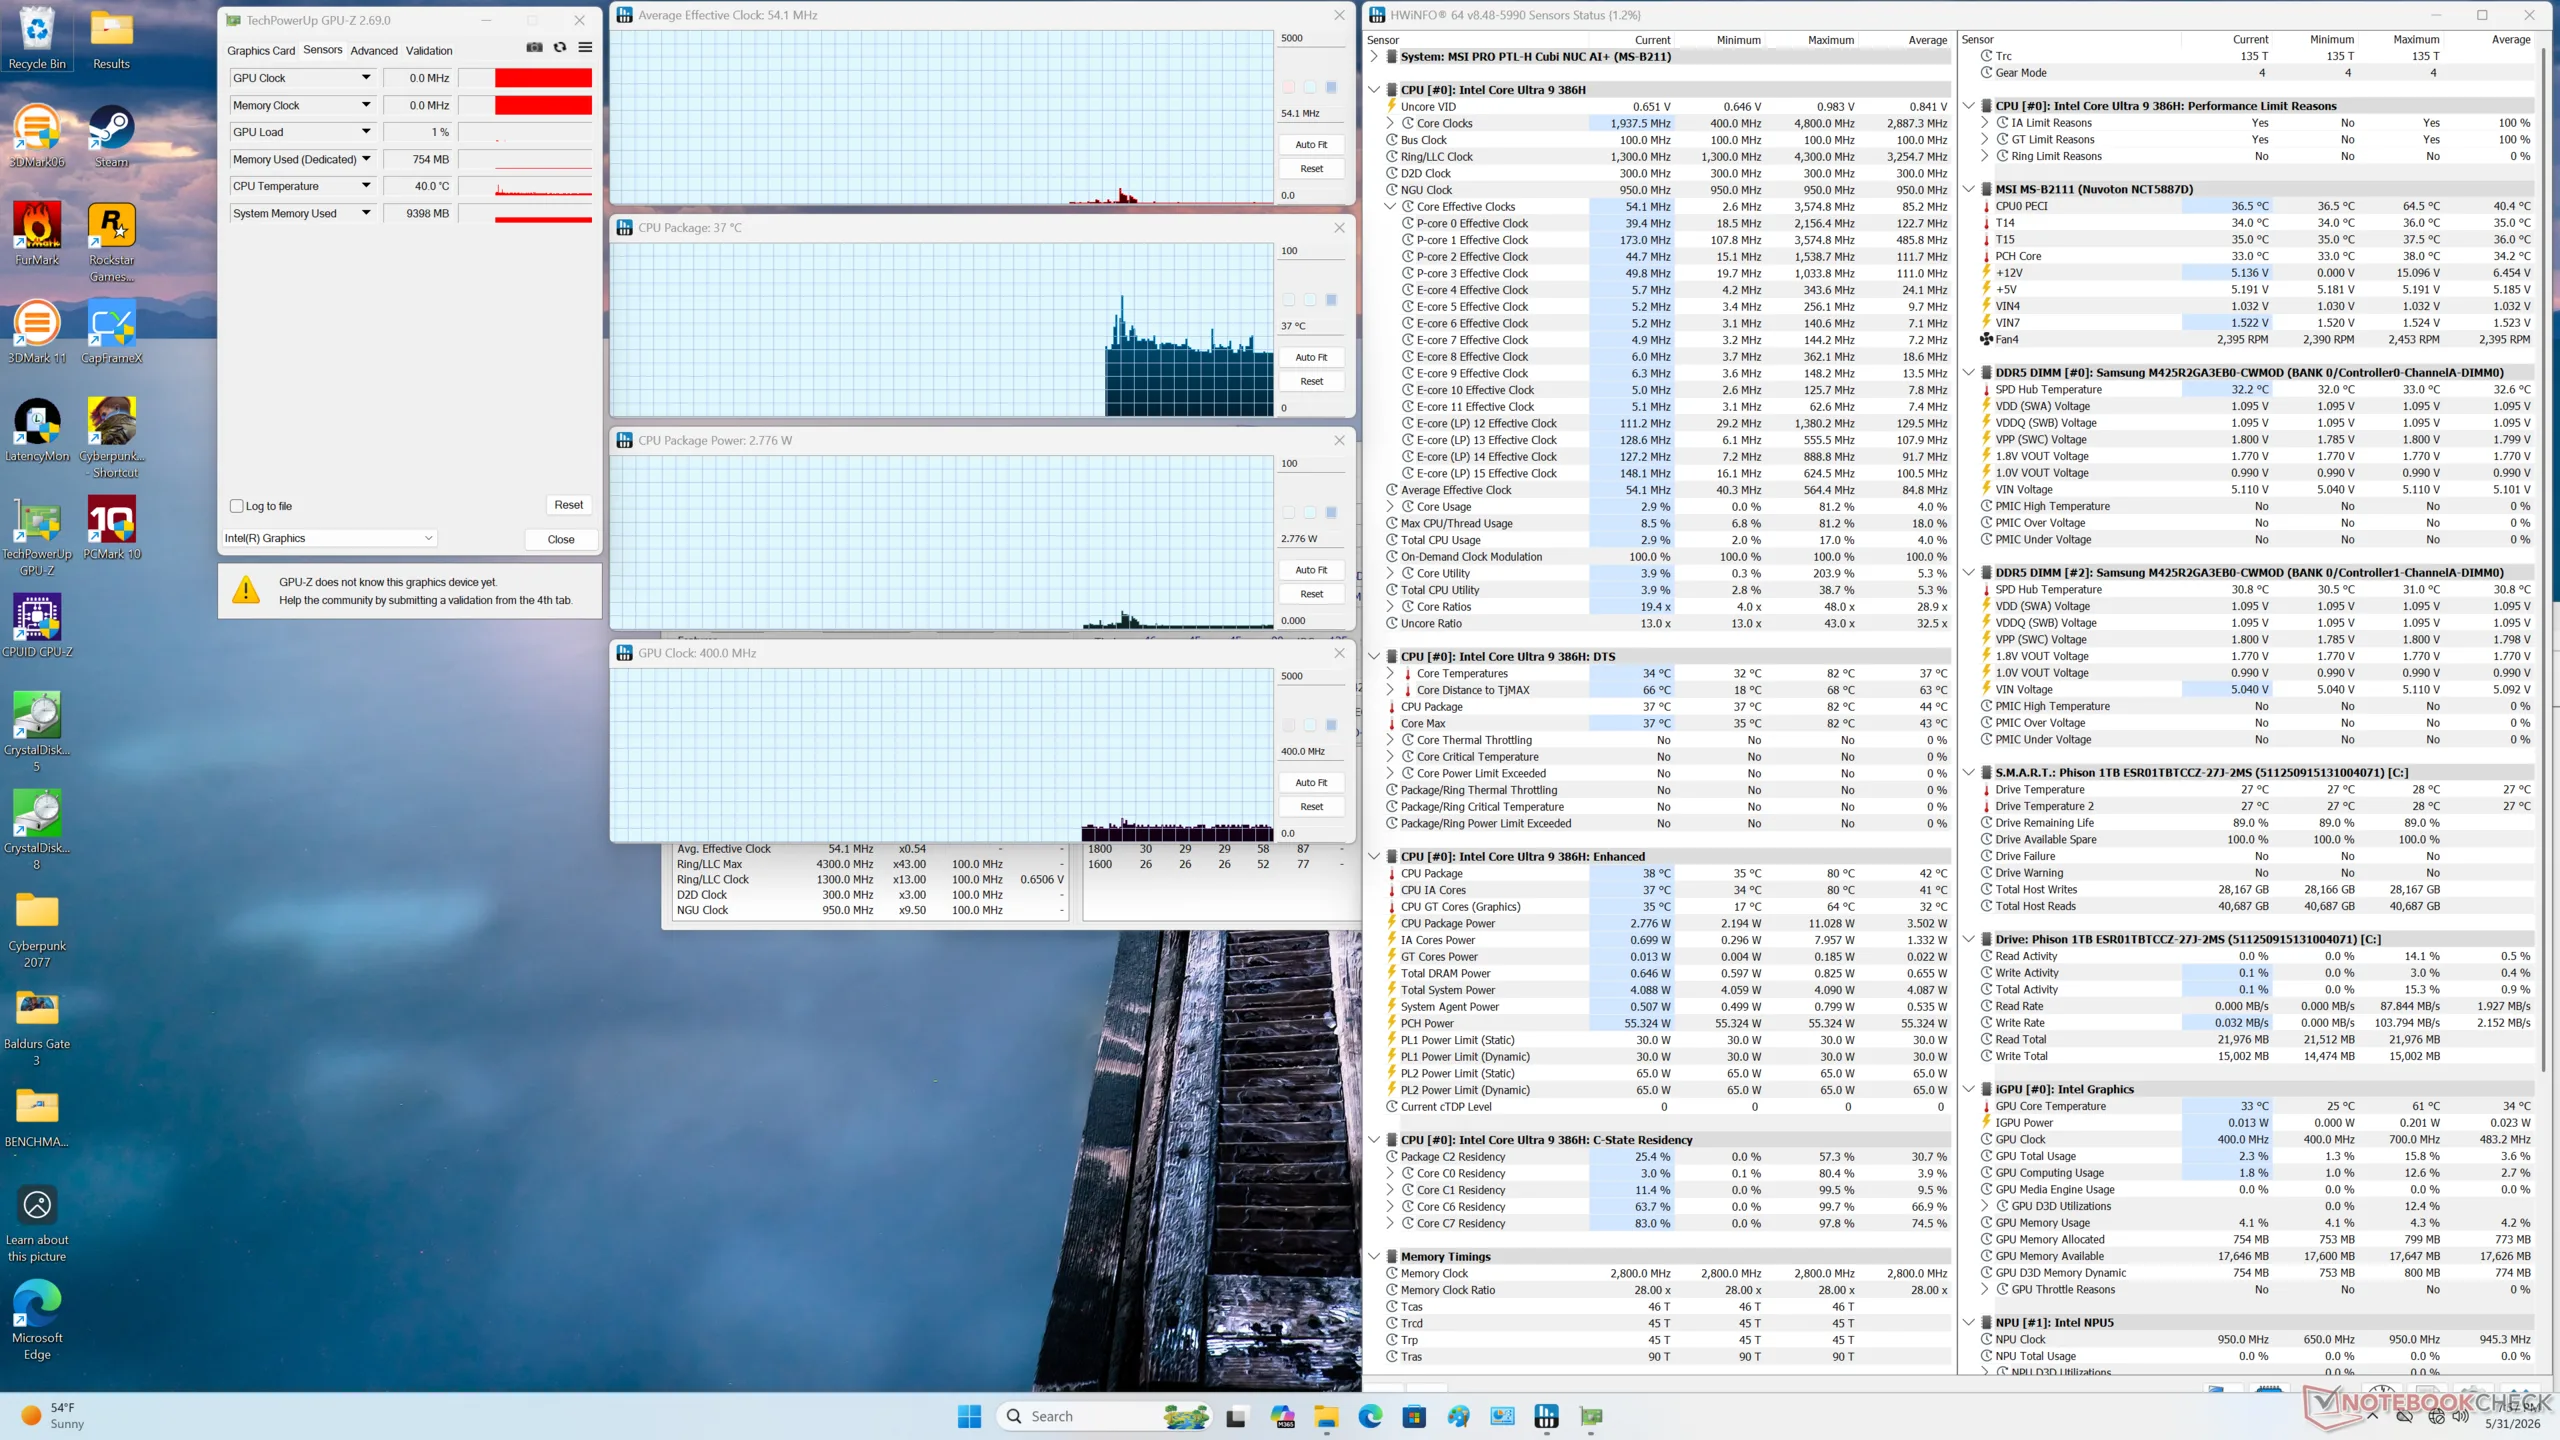
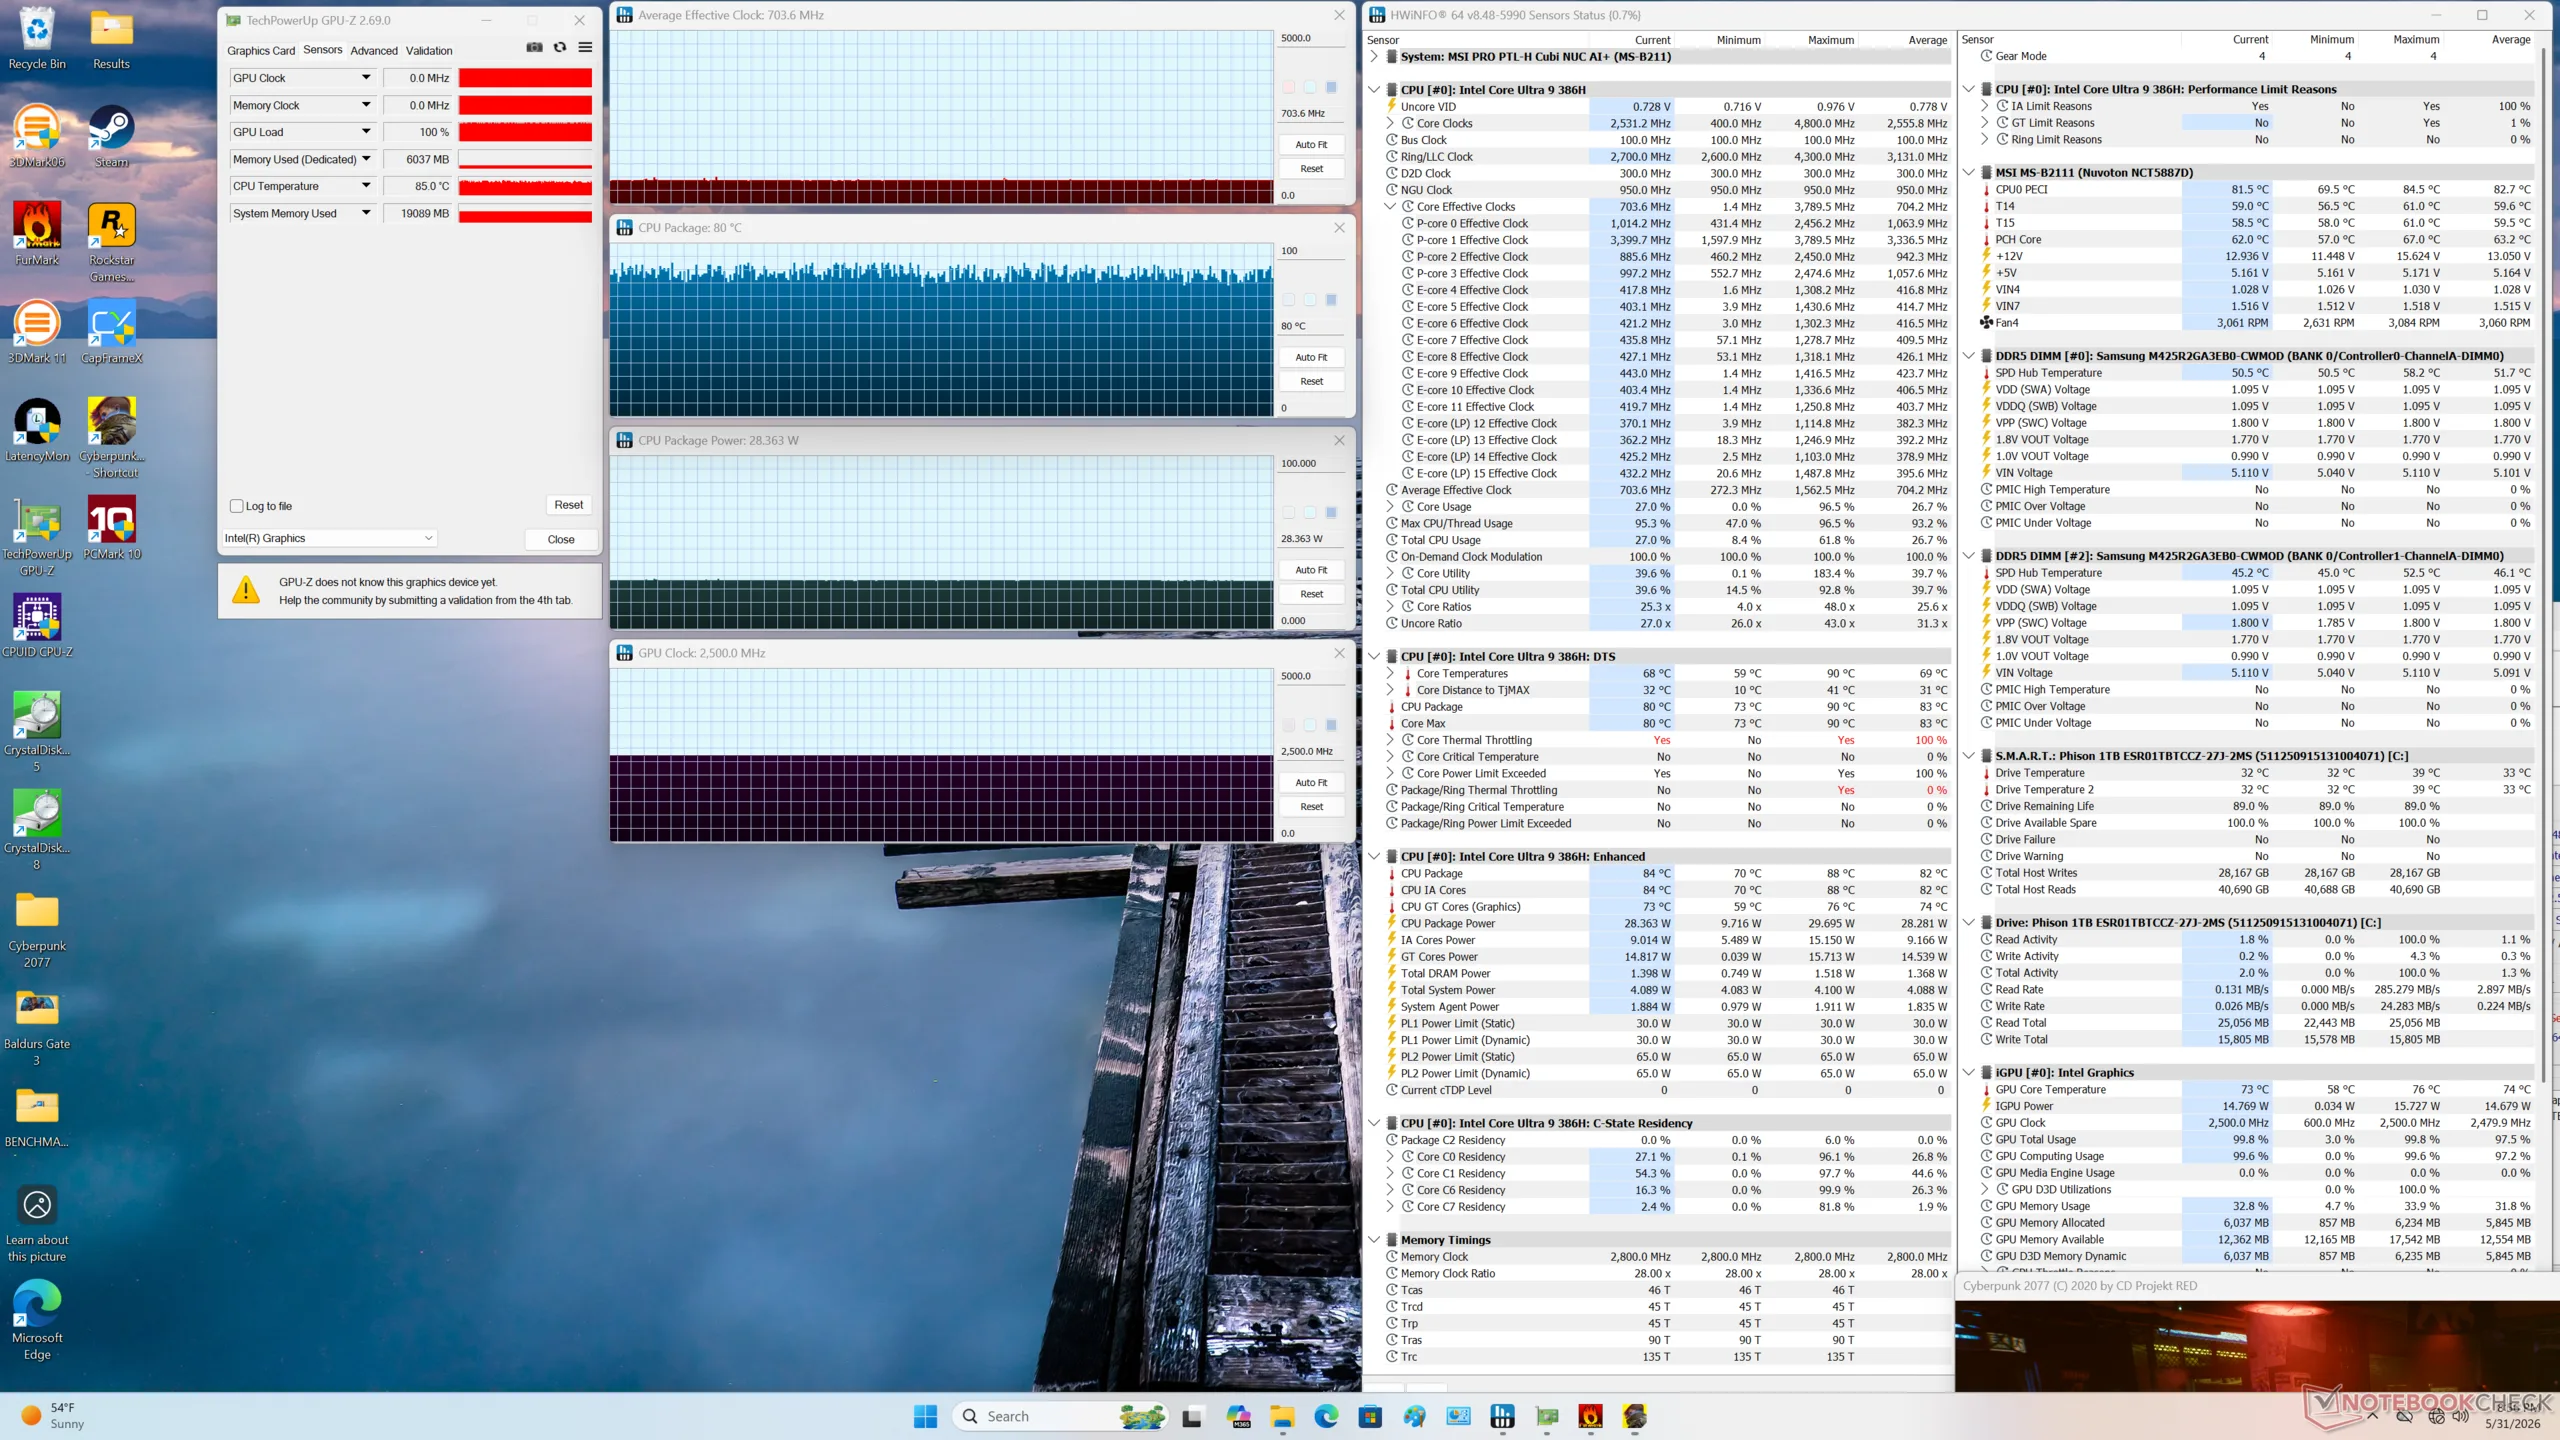
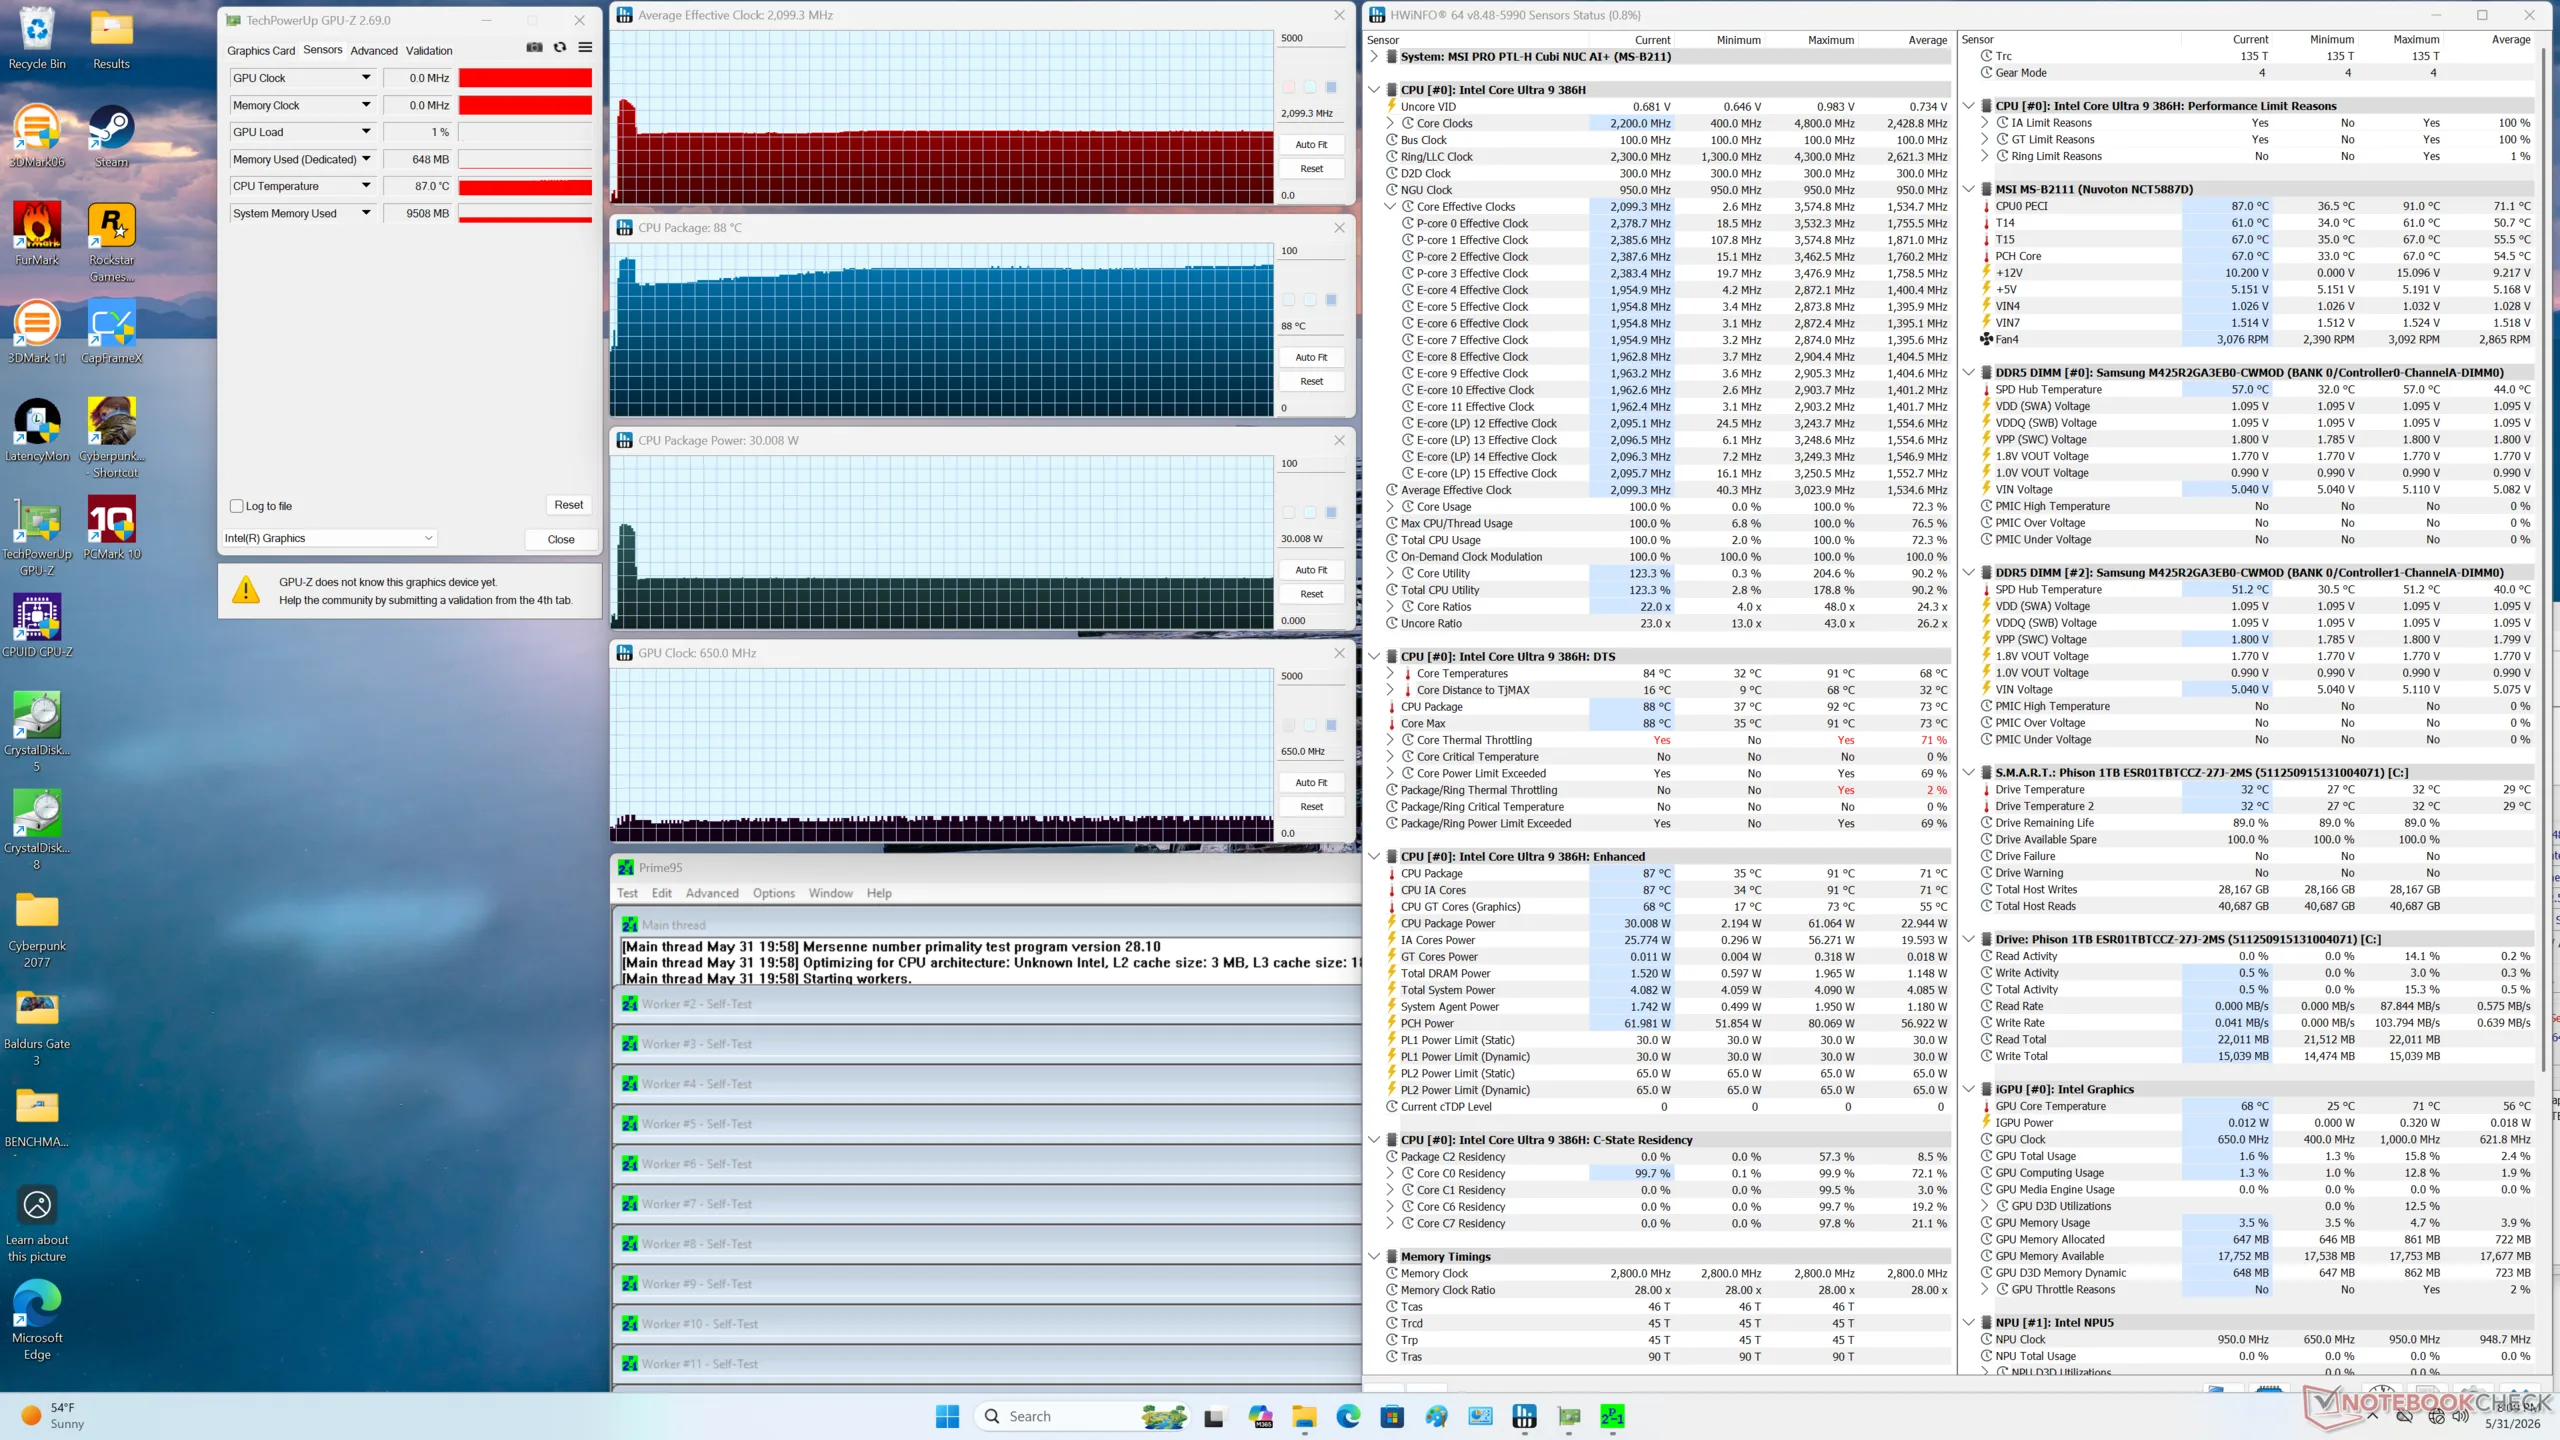
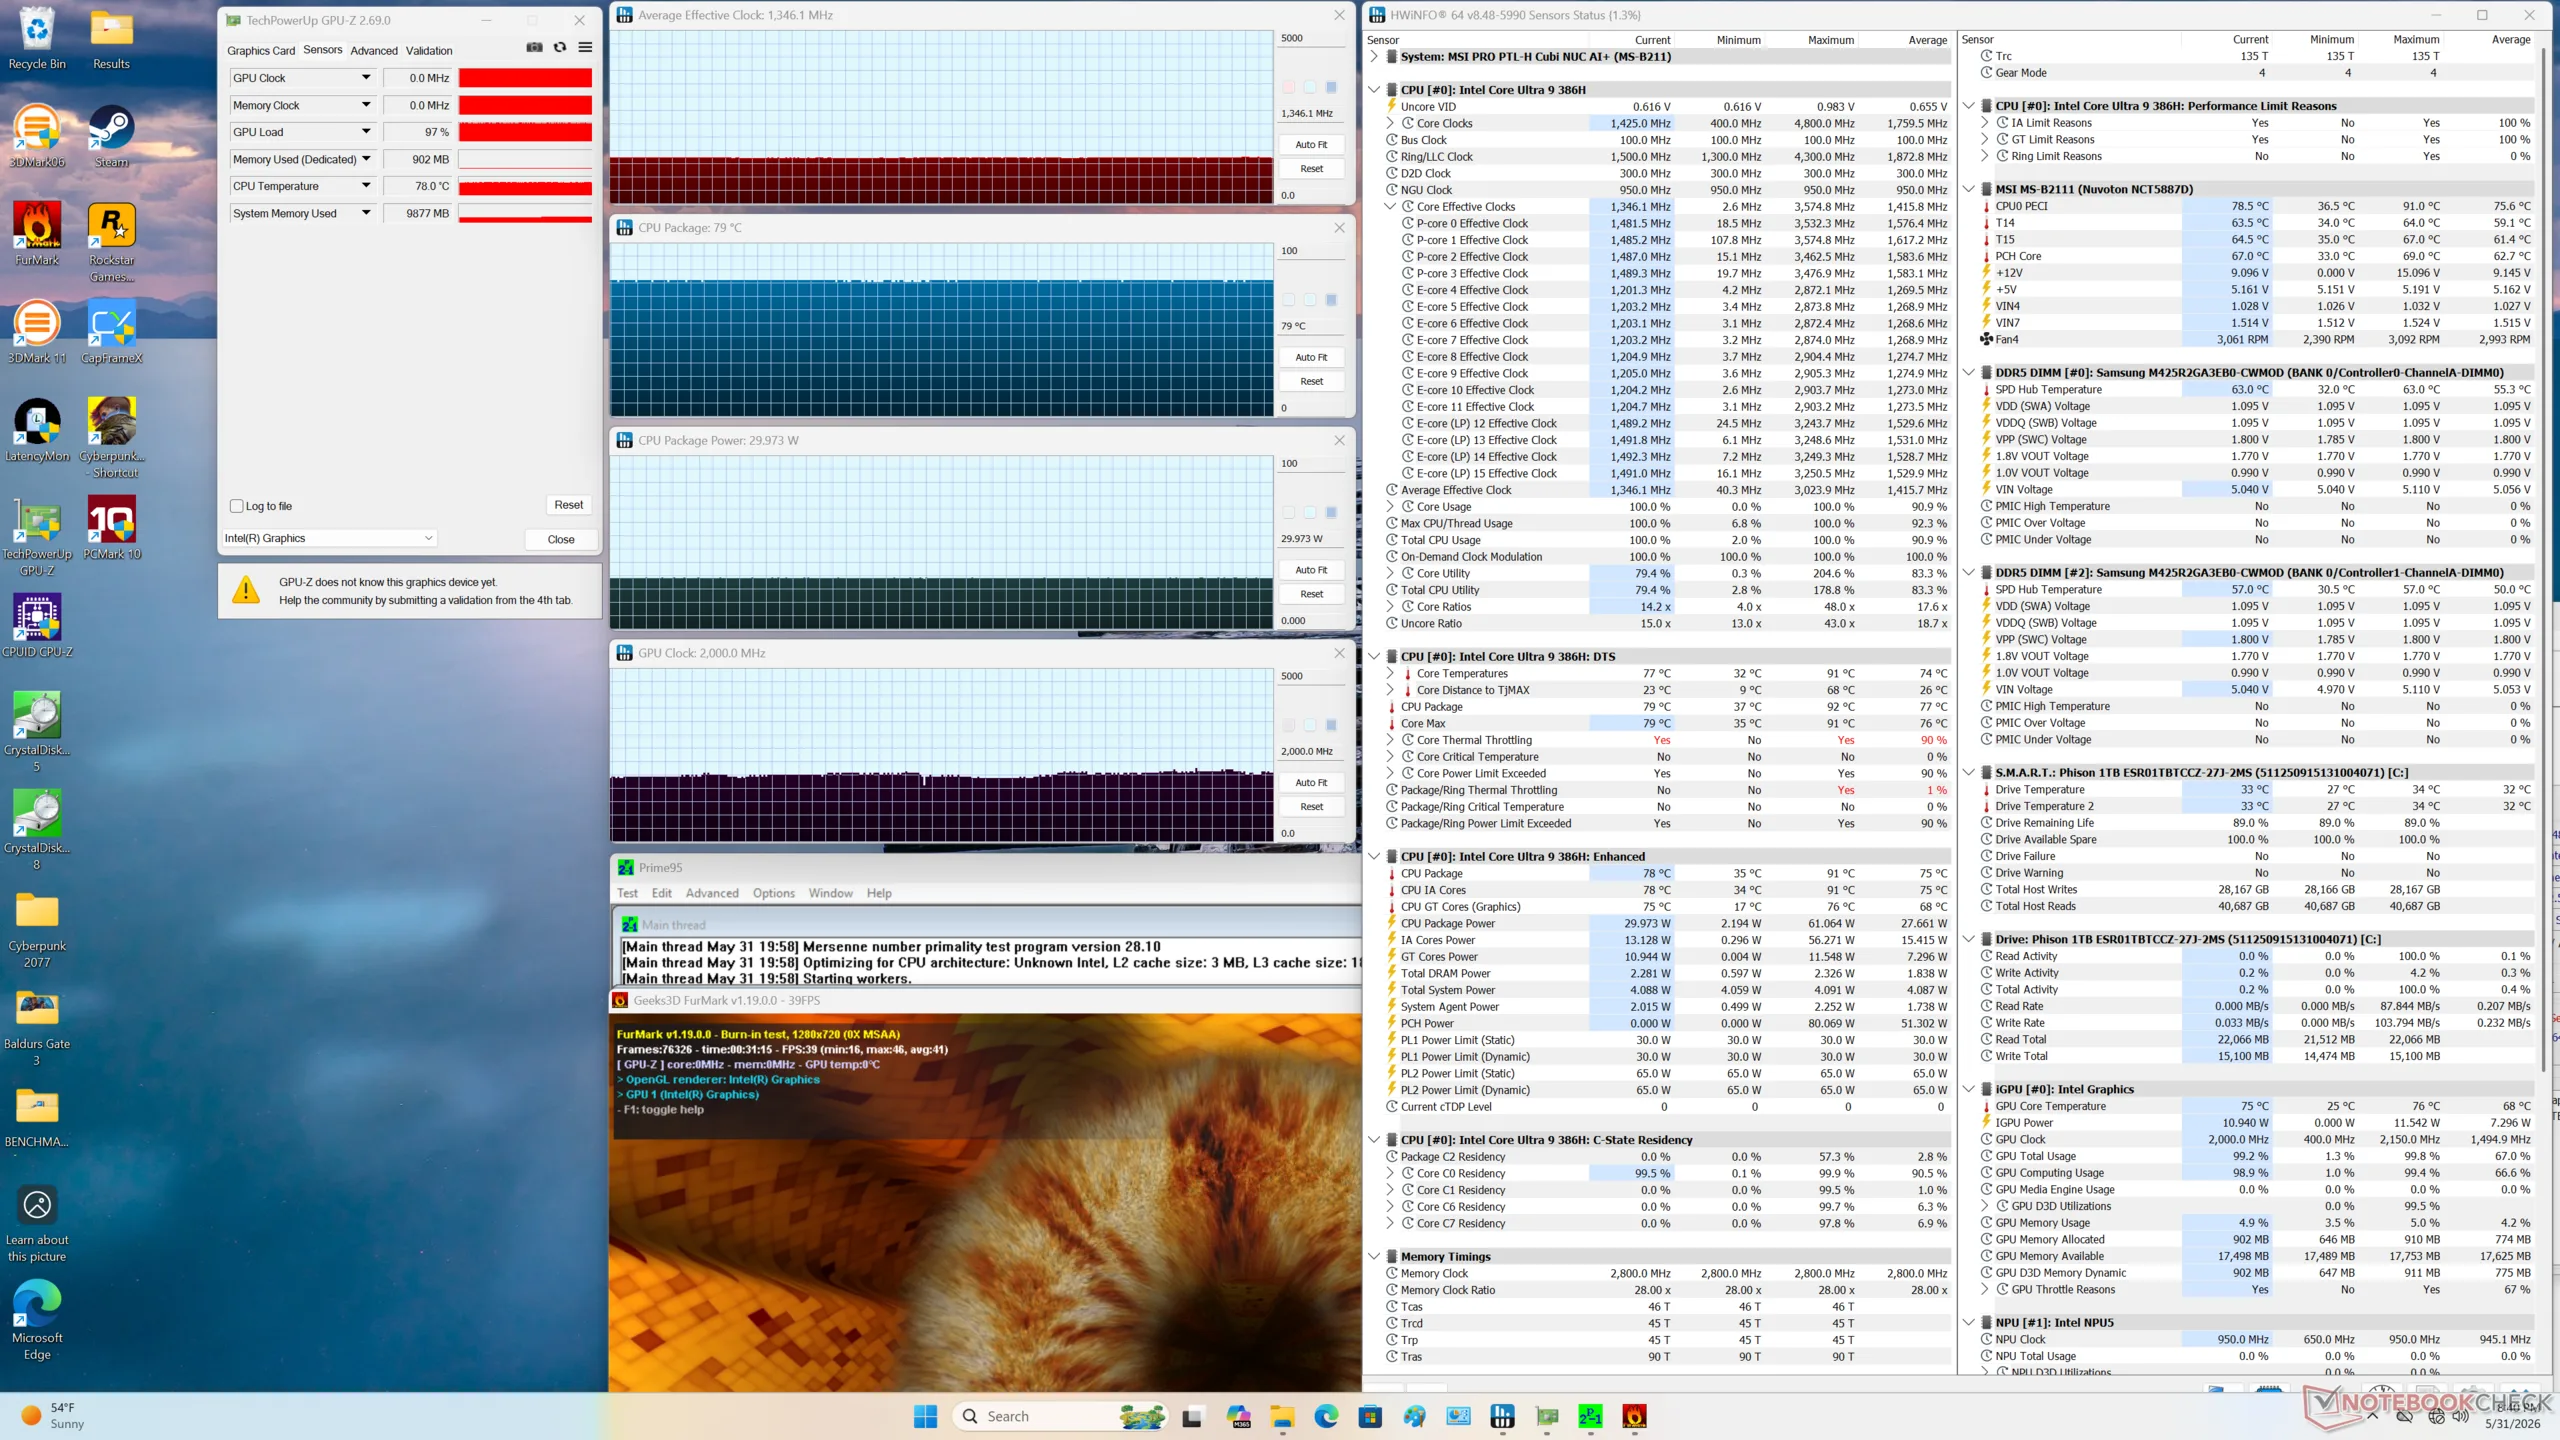
| Genomsnittlig CPU-klocka (GHz) | GPU-klocka (MHz) | Genomsnittlig CPU-temperatur (°C) | |
| System i viloläge | -- | -- | 37 |
| Prime95 Stress | 2.1 | -- | 88 |
| Prime95 + FurMark Stress | 1.4 | 2000 | 79 |
| Cyberpunk 2077 Stress | 0,7 | 2500 | ~80 |
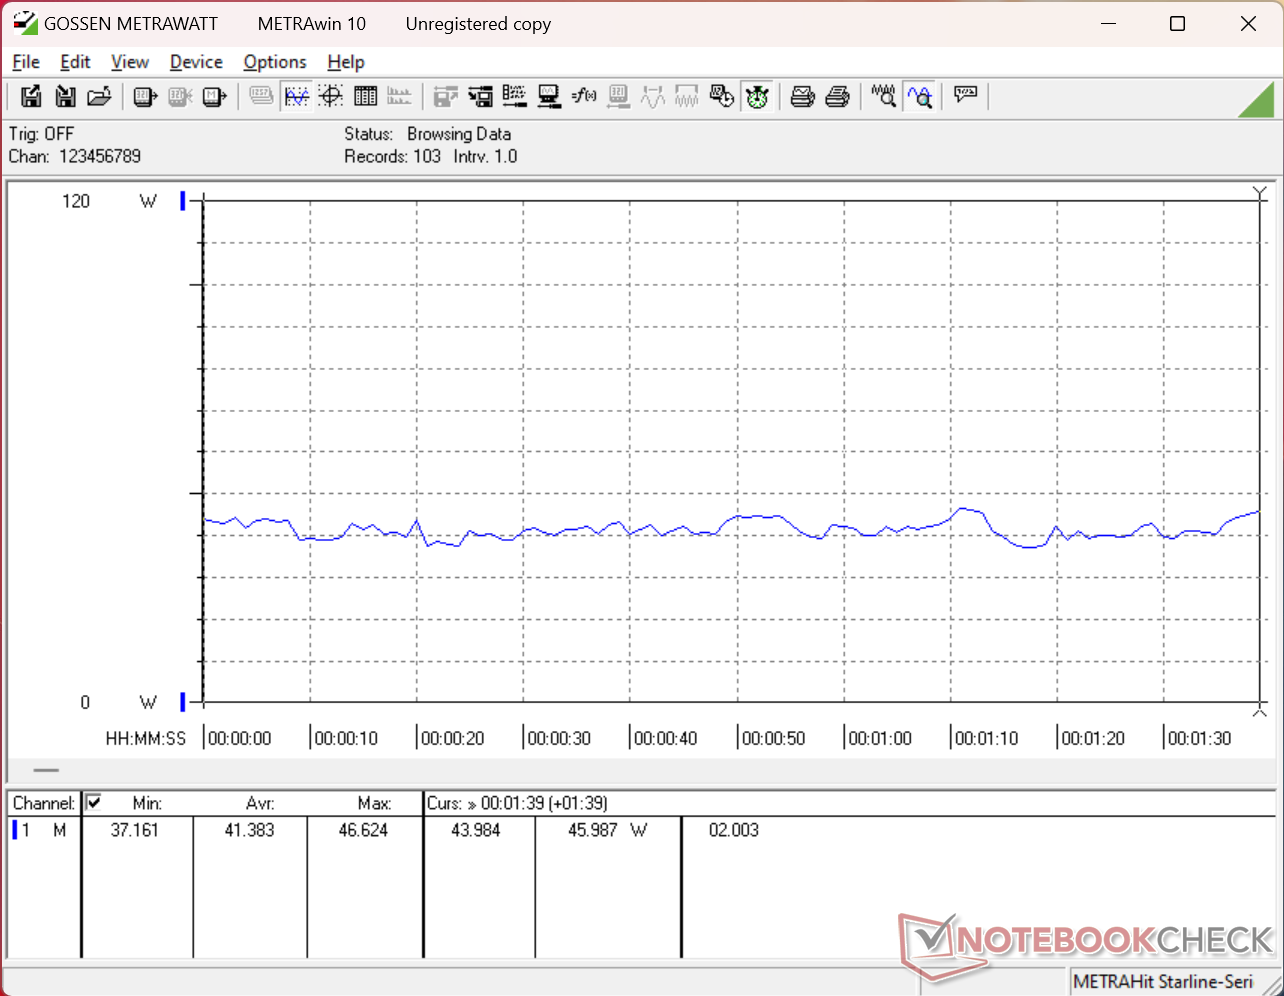
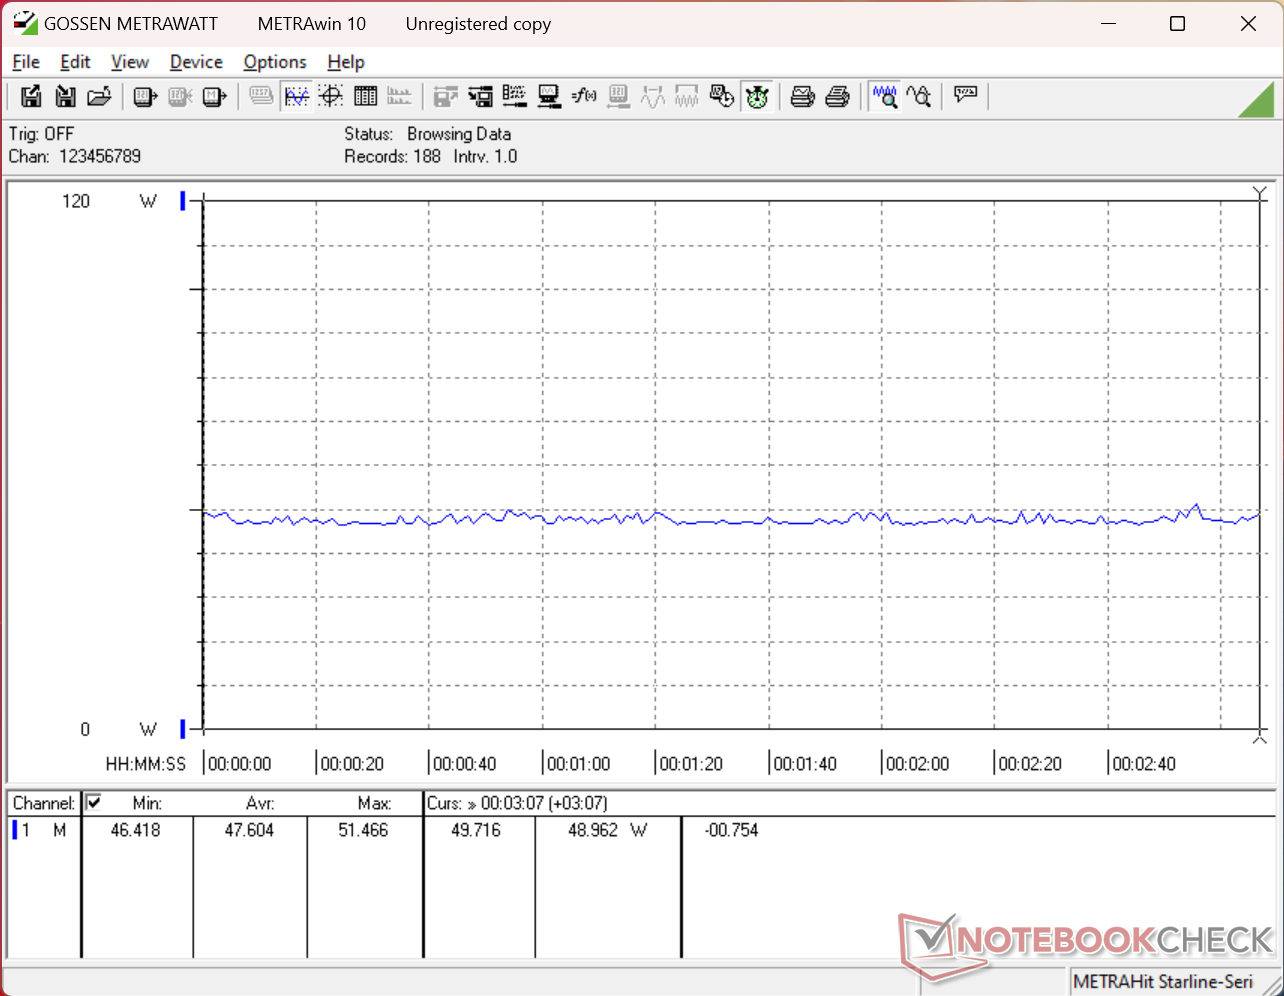
Energiförvaltning
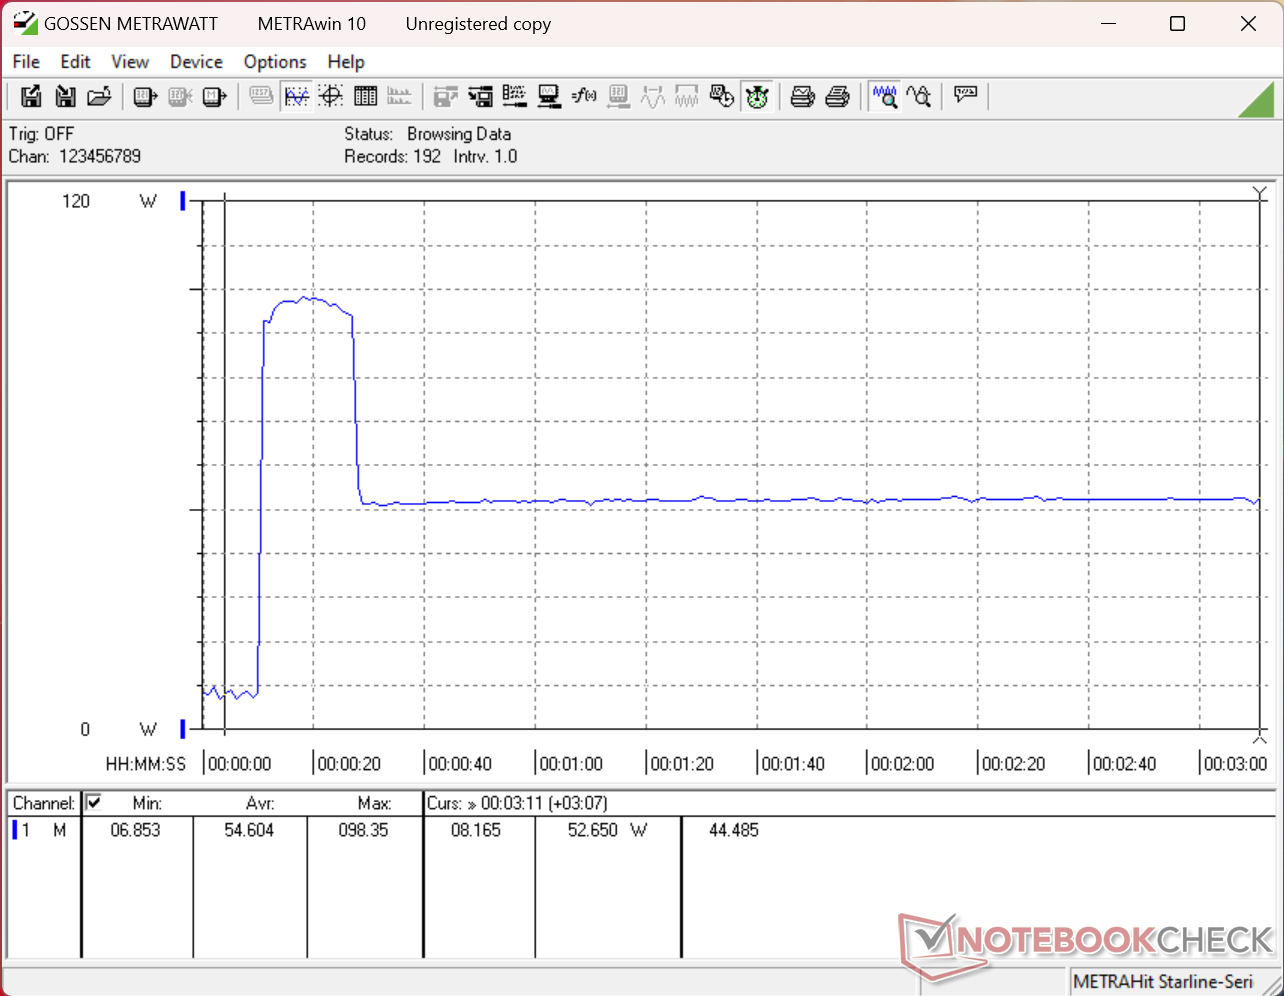
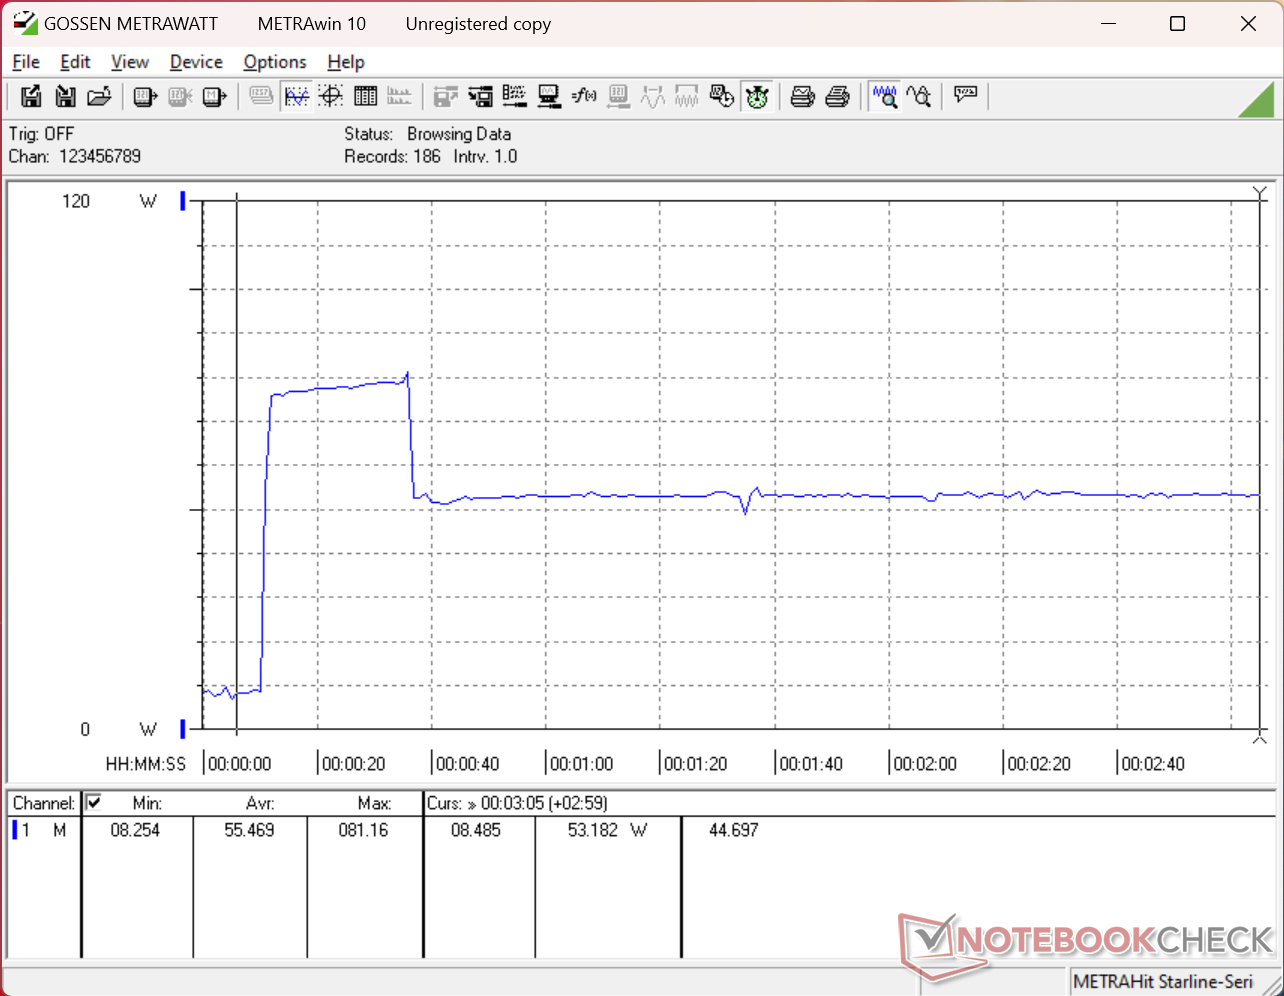
Strömförbrukning
Cubi AI+ 3MG är betydligt mer effektiv än förra årets Cubi AI+ 2MG särskilt när det gäller prestanda per watt. När man till exempel kör Prime95 stabiliseras förbrukningen på cirka 52 W jämfört med 49 W på den äldre modellen, trots den massiva ökningen på 60-65 procent i multithread-prestanda. Grafikprestanda per watt har också ökat, om än i mycket mindre omfattning.
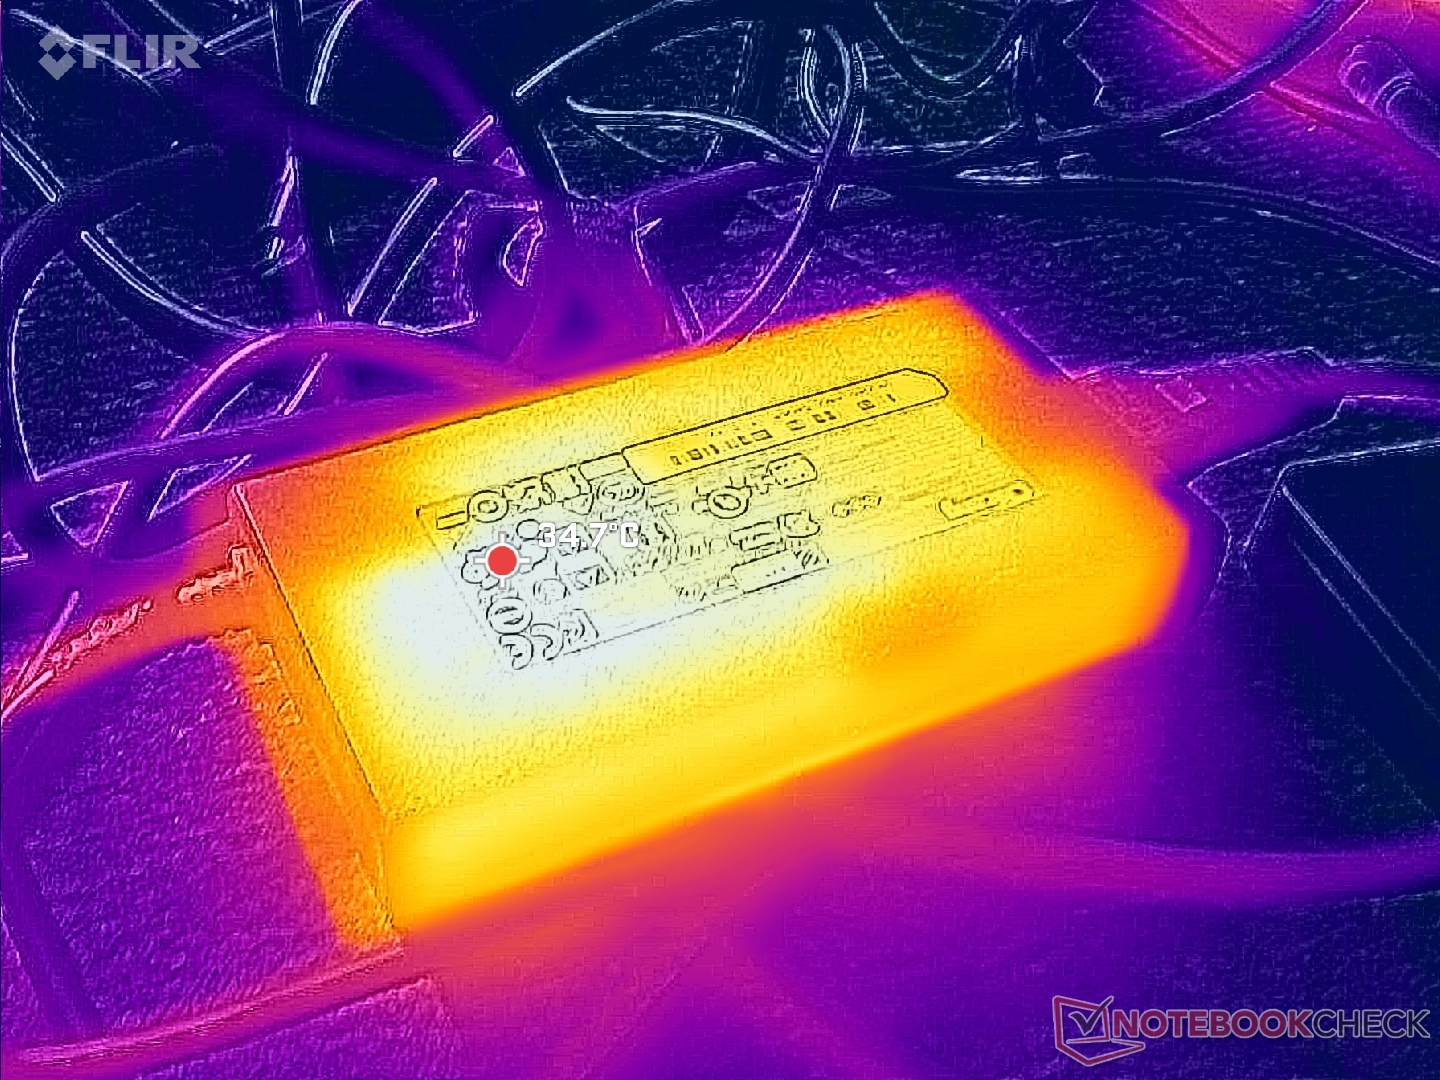
Observera att förbrukningen tillfälligt kan stiga till så mycket som 98 W innan den faller tillbaka på grund av CPU Turbo Boost-begränsningar. 120 W AC-adaptern (~13 x 6,9 x 2,5 cm) är mer än tillräcklig i detta avseende eftersom minidatorn i sig knappt har ett genomsnitt på mer än 50 W till 60 W när den är under belastning.
| Av/Standby | |
| Låg belastning | |
| Hög belastning |
|
Förklaring:
min: | |
| MSI Cubi NUC AI+ 3MG Ultra 9 386H, Intel Graphics 4 Xe3 PTL, Phison 1 TB ESR01TBTCCZ-27J, , x, | GMK NucBox K16 R7 7735HS, Radeon 680M, TWSC TSC3AN1T0-F6Q10S, , x, | GMK EVO-T1 Ultra 9 285H, Arc 140T, Crucial P3 Plus CT1000P3PSSD8, , x, | Geekom A5 Pro R5 7530U, Vega 7, Wodposit WPBSN4M8-1TGP, , x, | Asus NUC 15 Pro+ Ultra 9 285H, Arc 140T, Micron 3500 1TB MTFDKBA1T0TGD, , x, | MSI Cubi NUC AI+ 2MG Core Ultra 7 258V, Arc 140V, Phison 1 TB ESR01TBTCCZ-27J, , x, | MSI Cubi NUC 1M Core 7 150U, Iris Xe G7 96EUs, WD PC SN560 SDDPNQE-1T00, , x, | |
|---|---|---|---|---|---|---|---|
| Power Consumption | -10% | -27% | 42% | -12% | 20% | 8% | |
| Idle Minimum * (Watt) | 6.2 | 7.4 -19% | 6.1 2% | 3.2 48% | 3.9 37% | 2.9 53% | 6.4 -3% |
| Idle Average * (Watt) | 7.9 | 7.7 3% | 7.9 -0% | 4.3 46% | 6.1 23% | 5.7 28% | 8.3 -5% |
| Idle Maximum * (Watt) | 8.5 | 7.7 9% | 13.2 -55% | 5.1 40% | 8.2 4% | 10.2 -20% | 10.4 -22% |
| Load Average * (Watt) | 41.4 | 52 -26% | 60.7 -47% | 32.1 22% | 56.1 -36% | 38.7 7% | 38.5 7% |
| Cyberpunk 2077 ultra external monitor * (Watt) | 47.6 | 68 -43% | 67.4 -42% | 29.4 38% | 63.9 -34% | 41.1 14% | 36.1 24% |
| Load Maximum * (Watt) | 98 | 80.1 18% | 117.1 -19% | 43.5 56% | 160.6 -64% | 60 39% | 52.5 46% |
* ... mindre är bättre
Strömförbrukning Cyberpunk / Stresstest
Strömförbrukning extern monitor
Notebookcheck Betyg
MSI Cubi NUC AI+ 3MG är en av de minsta minidatorerna du kan hitta med en Panther Lake Core Ultra 9-processor. Ett par saknade funktioner hindrar den dock från att vara den ultimata lösningen för detaljhandeln eller kontoret.
MSI Cubi NUC AI+ 3MG
- 06/03/2026 v8
Allen Ngo
 Total Sustainability Score:
 Potentiella konkurrenter i jämförelse
Bild | Modell / recensioner | Pris | Vikt | Höjd | Skärm |
|---|---|---|---|---|---|
1. 76.9%  | MSI Cubi NUC AI+ 3MG Intel Core Ultra 9 386H ⎘ Intel Graphics 4 Xe3 Panther Lake iGPU ⎘ 32 GB Minne, 1000 GB SSD | Amazon: Listpris: 830 USD | 552 g | 37.5 mm | x |
2. 64.8%  | GMK NucBox K16 AMD Ryzen 7 7735HS ⎘ AMD Radeon 680M ⎘ 32 GB Minne, 1024 GB SSD | Amazon: 1. $639.97 GMKtec K16 Mini PC Gaming AM... Listpris: 650 USD | 567 g | 63 mm | x |
3. 75.4% 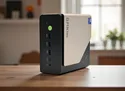 | GMK EVO-T1 Intel Core Ultra 9 285H ⎘ Intel Arc Graphics 140T ⎘ 64 GB Minne, 1024 GB SSD | Amazon: Listpris: 999€ | 946 g | 73.6 mm | x |
4. 72.6%  | Geekom A5 Pro AMD Ryzen 5 7530U ⎘ AMD Radeon RX Vega 7 ⎘ 16 GB Minne, 1024 GB SSD | Amazon: Listpris: 619€ | 423 g | 37 mm | x |
5. 77.5% 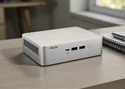 | Asus NUC 15 Pro+ Intel Core Ultra 9 285H ⎘ Intel Arc Graphics 140T ⎘ 32 GB Minne, 1024 GB SSD | Amazon: $1,240.00 Listpris: 991€ | 690 g | 42 mm | x |
6. 75.2% 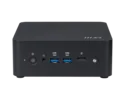 | MSI Cubi NUC AI+ 2MG Intel Core Ultra 7 258V ⎘ Intel Arc Graphics 140V ⎘ 32 GB Minne, 1000 GB SSD | Amazon: Listpris: 900 USD | 669 g | 50.1 mm | x |
7. 66.1%  | MSI Cubi NUC 1M Intel Core 7 150U ⎘ Intel Iris Xe Graphics G7 96EUs ⎘ 16 GB Minne, 1024 GB SSD | Amazon: Listpris: 950 USD | 660 g | 50.1 mm | x |
Genomskinlighet
Valet av enheter som ska granskas görs av vår redaktion. Testprovet gavs till författaren som ett lån av tillverkaren eller återförsäljaren för denna recension. Långivaren hade inget inflytande på denna recension och inte heller fick tillverkaren en kopia av denna recension innan publiceringen. Det fanns ingen skyldighet att publicera denna recension. Som ett oberoende medieföretag är Notebookcheck inte föremål för auktoritet från tillverkare, återförsäljare eller förlag.
This is how Notebookcheck is testingEvery year, Notebookcheck independently reviews hundreds of laptops and smartphones using standardized procedures to ensure that all results are comparable. We have continuously developed our test methods for around 20 years and set industry standards in the process. In our test labs, high-quality measuring equipment is utilized by experienced technicians and editors. These tests involve a multi-stage validation process. Our complex rating system is based on hundreds of well-founded measurements and benchmarks, which maintains objectivity.

