Notebookcheck Logo
Teaser

MSI Cubi NUC AI+ 2MG recension: Enkel mini-dator för företag

Inget för märkvärdigt.

Cubi 2MG prioriterar tillförlitlighet med generellt färre funktioner än konkurrenterna. För nästan 900 dollar är dock prestanda per dollar inte en av de starkaste egenskaperna.
Allen Ngo, 👁 Allen Ngo (översatt av DeepL / Ninh Duy) Publicerad 🇺🇸 🇫🇷 ...
Business Mini PC Lunar Lake

Utlåtande - Enkelt, men kanske för enkelt

Som en minidator för företag är Cubi NUC 2MG ett enkelt och pålitligt alternativ utan någon flashig estetik. Dess integrerade högtalare, mikrofoner, Co-Pilot+-stöd och Power Link-funktion kan komma väl till pass under vissa förhållanden eller användningsscenarier, medan Lunar Lake-V-processorn generellt är svalare och mer effektiv än den nuvarande skörden av AMD-alternativ. Vi uppskattar särskilt den snabba integrerade MicroSD-läsaren eftersom många andra mini-datorer saknar kortläsare.

Vår främsta invändning mot Cubi 2MG är dess relativt höga pris på 900 USD när snabbare AMD-minidatorer som Beelink SER9 Pro eller GMK NucBox K12 är lättillgängliga för hundratals dollar mindre. Sådana alternativ kommer också med användbara funktioner som flyttbart RAM-minne och stöd för fler interna SSD-enheter. MSI säger att de erbjuder bättre kundsupport och en längre treårig garanti som standard för att motivera det begärda priset, men prestanda per dollar är ändå relativt svag.

Fläktbeteendet kan också behöva förbättras. Om du inte är i tyst läge tenderar fläkten att pulsera och vara mer märkbar även när du kör krävande belastningar. De cyklande GPU-klockfrekvenserna, även om det inte är ett problem för de flesta professionella inställningar, är fortfarande konstigt att se när de flesta andra mini-datorer inte uppvisar samma problem.

För

+ 3 års tillverkargaranti som standard
+ relativt låga driftstemperaturer
+ dubbla 2,5 Gbps RJ-45
+ snabb microSD-läsare
+ lätt att serva

Emot

- den integrerade CoPilot-knappen kanske inte alltid är bekväm
- fläktljud är märkbart och tenderar att pulsera
- stöder bara en intern M.2 SSD
- dyrt för prestandan
- svag integrerad högtalare

Pris och tillgänglighet

Amazon Logo
$899.00
MSI Cubi NUC AI+ Barebones Mini PC: Intel Core Ultra 7-258V, 32GB Memory, WiFi 6E, BT 5.3, Thunderbolt 4, Type-C, Copilot Button: Black 2MG-003BUS

Cubi NUC 2MG är en efterföljare till förra årets Cubi NUC 1M från förra året. Den ersätter den äldre Raptor Lake-U Core Ultra 7 150U-processorn med nyare Lunar Lake-V-alternativ samtidigt som andra mindre ändringar görs. Cubi-serien är optimerad för företag och detaljhandelsmiljöer i motsats till hemmakontor eller HTPC-applikationer.

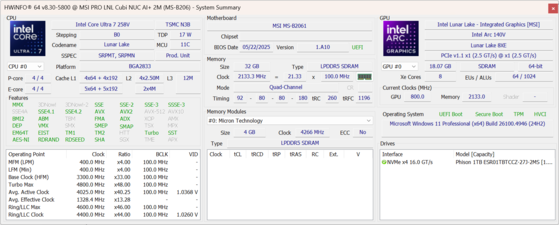
Vår testenhet är en mellanklasskonfiguration med Core Ultra 7 258V CPU, 32 GB lödd RAM och 1 TB SSD för cirka 900 USD. Mindre SKU:er börjar med Core Ultra 5 226V medan det mest avancerade alternativet levereras med Core Ultra 9 288V. En vit version finns tillgänglig i vissa regioner.

Fler MSI-recensioner:

Specifikationer

MSI Cubi NUC AI+ 2MG
Processor
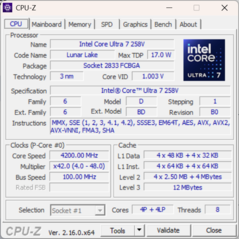
Intel Core Ultra 7 258V 8 x 2.2 - 4.8 GHz, 40 W PL2 / Short Burst, 38 W PL1 / Sustained, Lunar Lake
Grafikkort
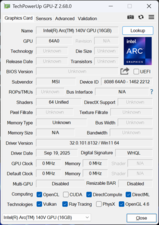
Intel Arc Graphics 140V, Kärna: 1950 MHz
Minne
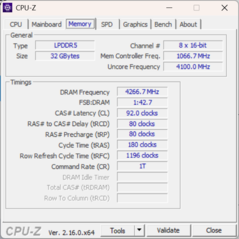
32 GB 
, LPDDR5x-8533, Soldered
Ljudkort
Intel Lunar Lake SOC - cAVS (Audio, Voice, Speech)
Anslutningar
2 USB 2.0, 2 USB 3.1 Gen2, 2 USB4 40 Gbps, 2 Thunderbolt 4, USB-C Power Delivery (PD), 1 HDMI, 2 DisplayPort, 1 Kensingtonlås, Ljudanslutningar: 3.5 mm combo, 1 Fingeravtrycksläsare
Nätverk
Intel Ethernet Controller I226-V (10/2500MBit/s), Intel Wi-Fi 6E AX211 (a/b/g/h/n = Wi-Fi 4/ac = Wi-Fi 5/ax = Wi-Fi 6/ Wi-Fi 6E 6 GHz), Bluetooth 5.3
Storlek
höjd x bredd x djup (i mm) 50.1 x 135.6 x 132.5
Operativsystem
Microsoft Windows 11 Pro
Övrigt
MSI Center, 36 Månader Garanti
Vikt
669 g, Strömförsörjning: 494 g
Pris
900 USD
Amazon
Obs: Tillverkaren kan använda komponenter från olika leverantörer inklusive bildskärmspaneler, enheter eller minnesstickor med liknande specifikationer.


Fallet

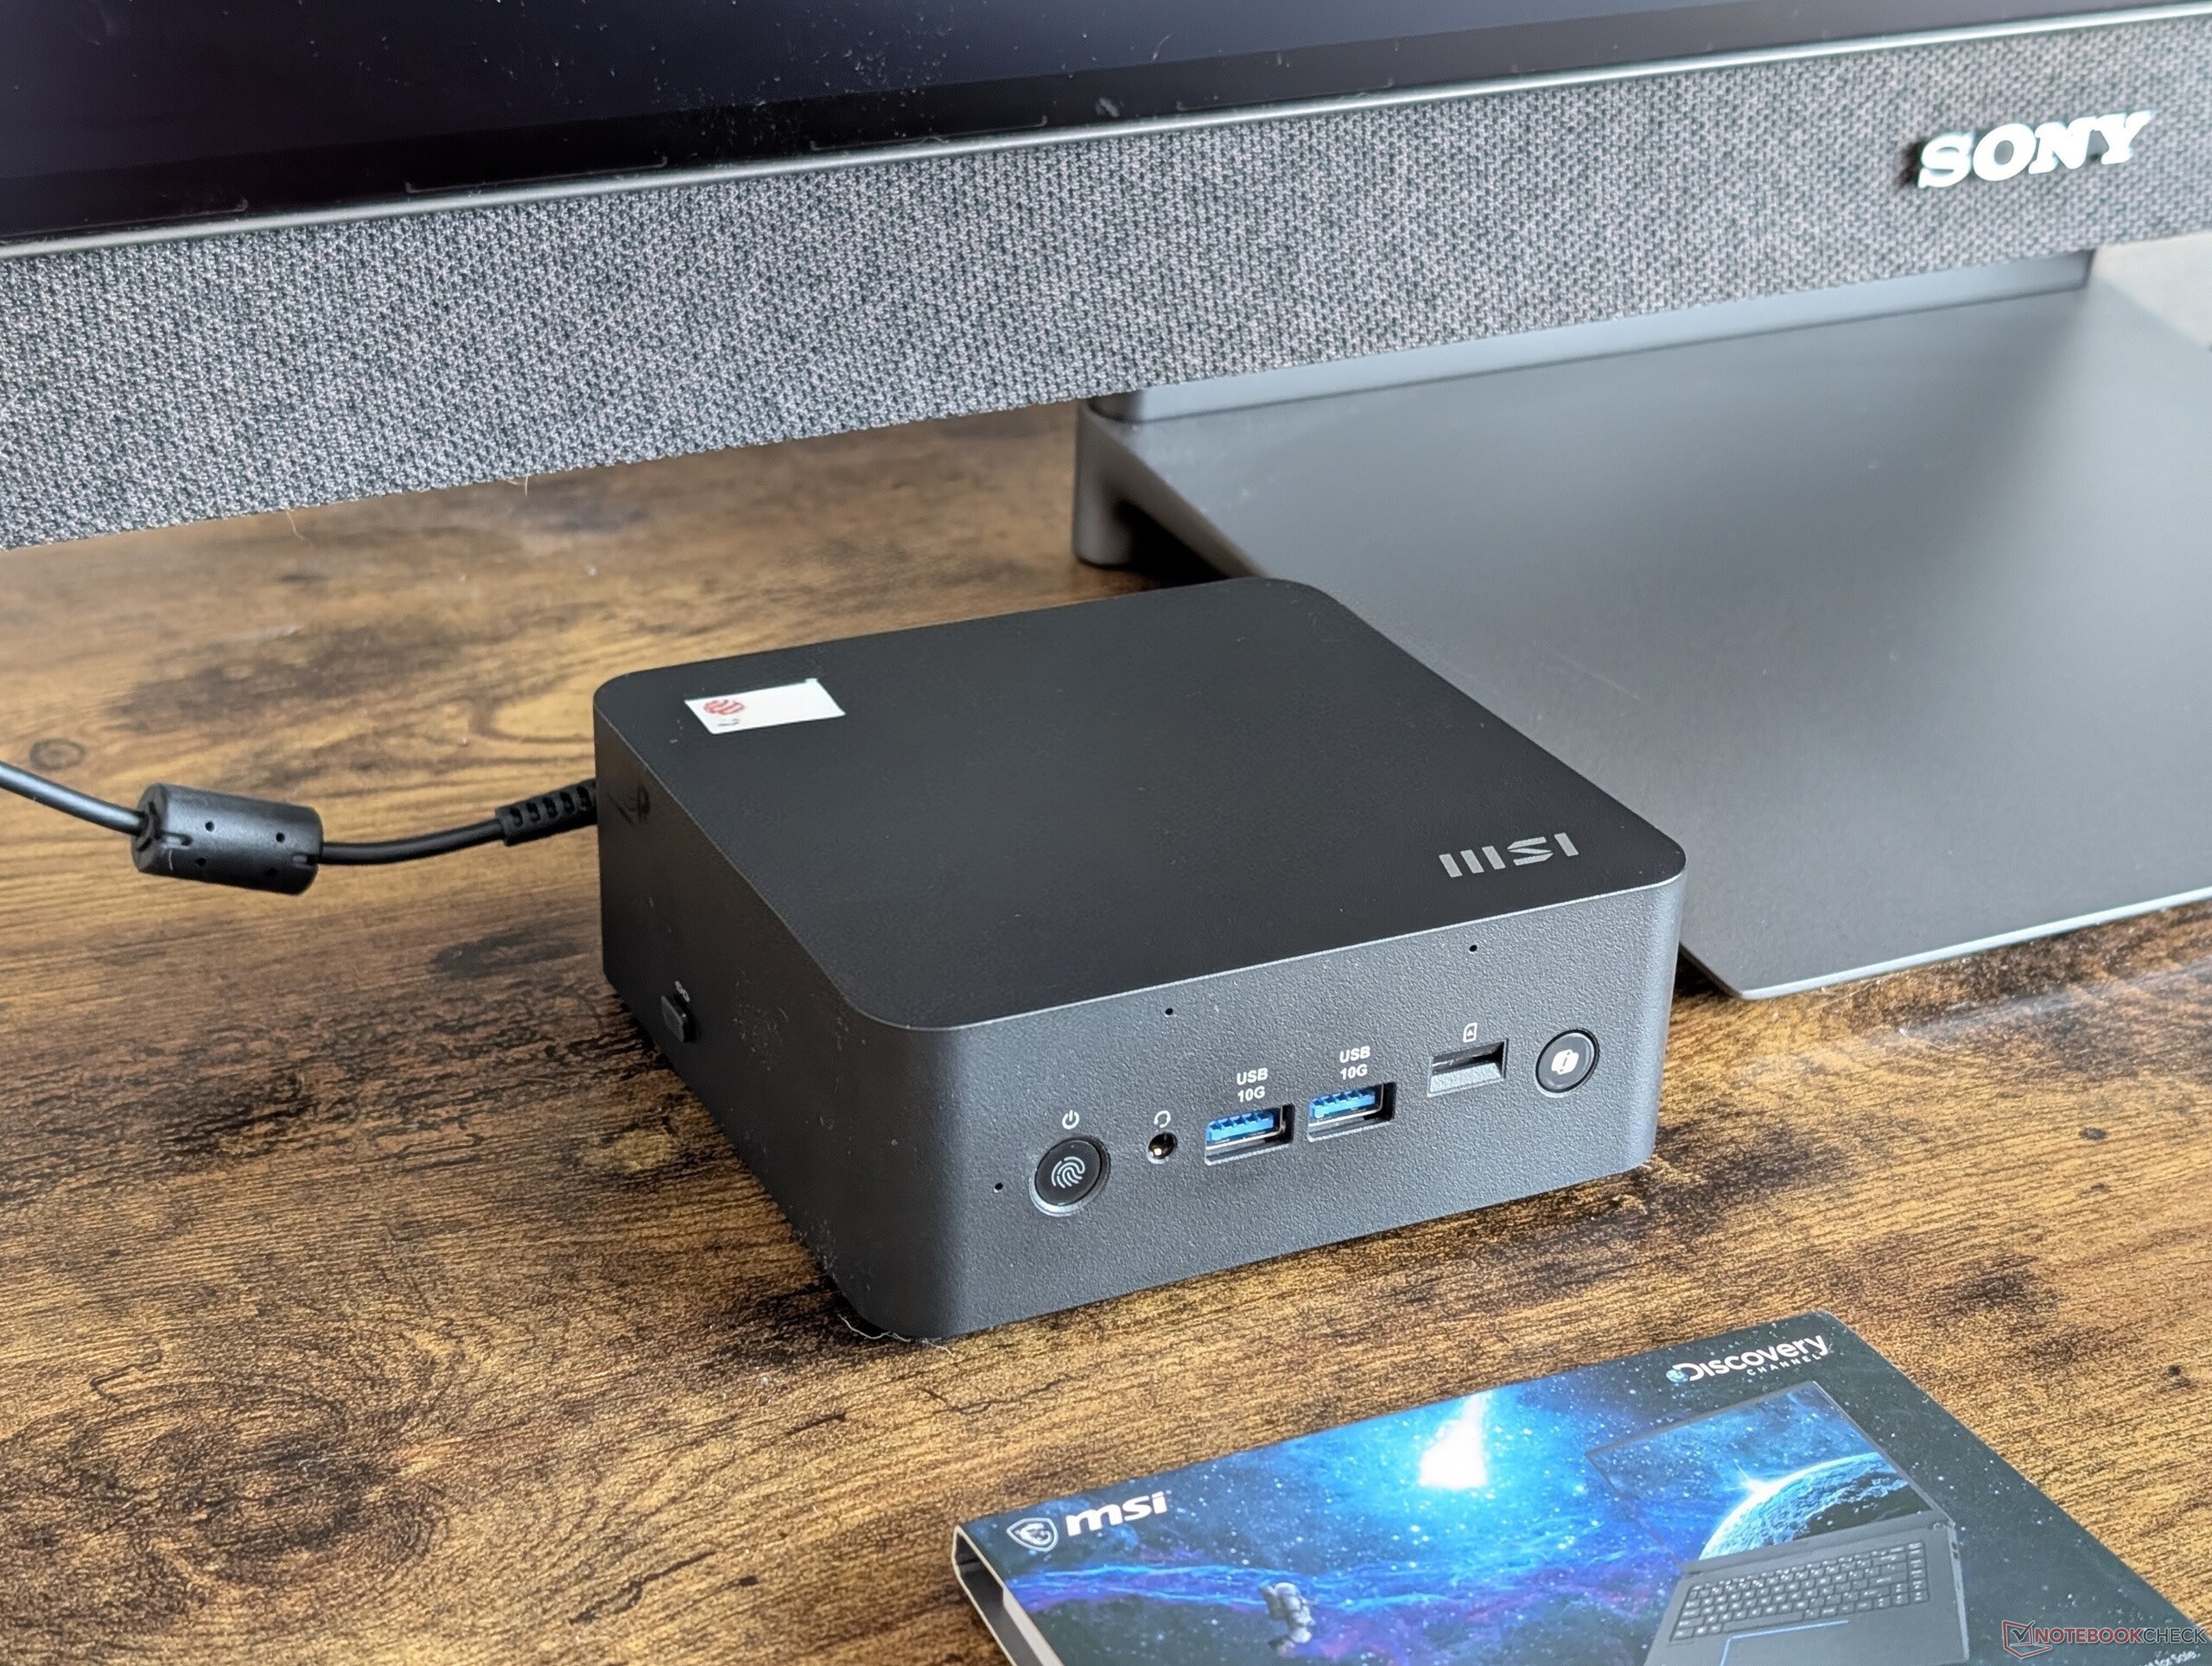
Chassi och mått är i stort sett oförändrade jämfört med Cubi 1M. Nytt för Cubi 2MG är dock den dedikerade CoPilot-knappen på enhetens framsida. Problemet med den här funktionen är att den fysiska knappen kan vara svår att komma åt beroende på hur du placerar systemet på skrivbordet.

För enkelhetens skull stöds Power Link för att slå på enheten via vissa MSI-skärmar. Listan över kompatibla bildskärmar finns på här. Tyvärr kräver Power Link fortfarande en nätadapter för minidatorn, så det är inte en riktig "en kabel"-lösning.

Jämförelse av storlek

155 mm 151 mm 78 mm 938 g135.6 mm 132.5 mm 50.1 mm 669 g135.6 mm 132.6 mm 50.1 mm 660 g135 mm 135 mm 44.7 mm 812 g110.19 mm 107.3 mm 63.2 mm 595 g116 mm 107 mm 36 mm 400 g297 mm 210 mm 1 mm 5.7 g

Anslutningsmöjligheter

Portalternativen har ändrats något jämfört med Cubi 1M. Det finns nu bara en HDMI-port istället för två tillsammans med färre USB 3.0-portar.

Observera att även om det finns två USB-C Thunderbolt 4-portar, stöder endast en av portarna Power Delivery-in på upp till 100 W om den huvudsakliga nätadaptern inte är tillgänglig.

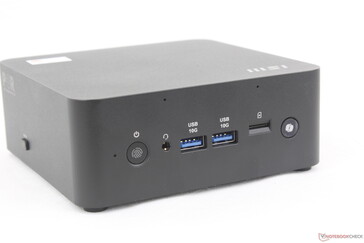
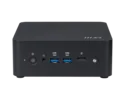
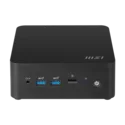
Framsida: Power-knapp med fingeravtrycksaktivering, 3,5 mm headset, 2x USB-A (10 Gbps), MicroSD-läsare, CoPilot-knapp
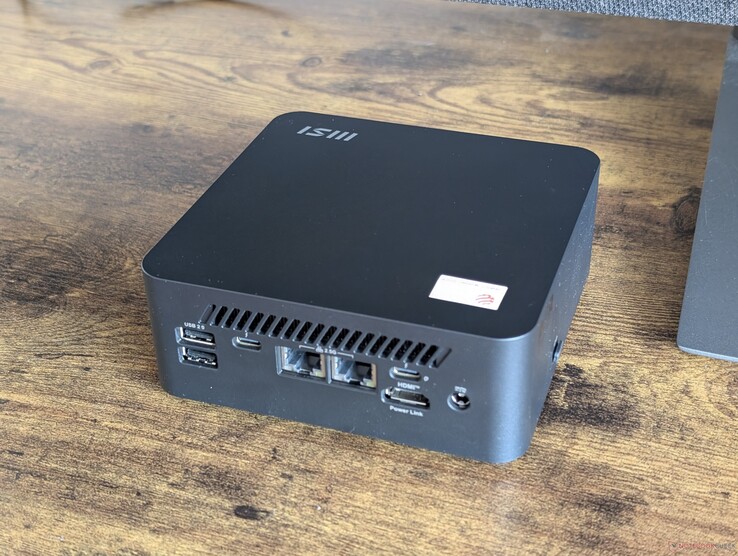
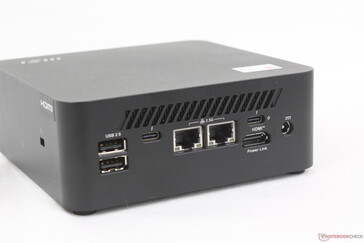
Baksida: 2x USB-A 2.0, USB-C Thunderbolt 4 med DisplayPort 2.1 + Power Delivery (15 W), 2x RJ-45 (2,5 Gbps), USB-C Thunderbolt 4 med DisplayPort 2.1 + Power Delivery (100 W), HDMI 2.1 med MSI Power Link, nätadapter

SD-kortläsare

SD Card Reader
average JPG Copy Test (av. of 3 runs)
MSI Cubi NUC 1M
Intel Core 7 150U (Angelbird AV Pro V60)
53 MB/s +13%
MSI Cubi NUC AI+ 2MG
Intel Core Ultra 7 258V (Angelbird AV Pro V60)
47.1 MB/s
maximum AS SSD Seq Read Test (1GB)
MSI Cubi NUC AI+ 2MG
Intel Core Ultra 7 258V (Angelbird AV Pro V60)
207.2 MB/s
MSI Cubi NUC 1M
Intel Core 7 150U (Angelbird AV Pro V60)
196.9 MB/s -5%

Kommunikation

Networking
iperf3 transmit AXE11000
MSI Cubi NUC AI+ 2MG
Intel Wi-Fi 6E AX211
1282 (1121min - 1470max) MBit/s
GMK NucBox K12
MediaTek Wi-Fi 6E MT7922 160MHz Wireless LAN Card
1193 (1001min - 1325max) MBit/s -7%
Minisforum MS-A1
Intel Wi-Fi 6E AX210
855 (438min - 894max) MBit/s -33%
MSI Cubi NUC 1M
Intel Wi-Fi 6E AX211
636 (430min - 784max) MBit/s -50%
Beelink SER9 Pro
 
580 (458min - 645max) MBit/s -55%
iperf3 receive AXE11000
MSI Cubi NUC AI+ 2MG
Intel Wi-Fi 6E AX211
1409 (1143min - 1606max) MBit/s
Minisforum MS-A1
Intel Wi-Fi 6E AX210
941 (873min - 964max) MBit/s -33%
Beelink SER9 Pro
 
851 (780min - 908max) MBit/s -40%
GMK NucBox K12
MediaTek Wi-Fi 6E MT7922 160MHz Wireless LAN Card
819 (705min - 979max) MBit/s -42%
MSI Cubi NUC 1M
Intel Wi-Fi 6E AX211
692 (506min - 872max) MBit/s -51%
iperf3 transmit AXE11000 6GHz
Minisforum MS-A1
Intel Wi-Fi 6E AX210
1597 (1554min - 1657max) MBit/s +45%
MSI Cubi NUC 1M
Intel Wi-Fi 6E AX211
1400 (1199min - 1463max) MBit/s +27%
MSI Cubi NUC AI+ 2MG
Intel Wi-Fi 6E AX211
1101 (868min - 1237max) MBit/s
GMK NucBox K12
MediaTek Wi-Fi 6E MT7922 160MHz Wireless LAN Card
999 (530min - 1123max) MBit/s -9%
iperf3 receive AXE11000 6GHz
Minisforum MS-A1
Intel Wi-Fi 6E AX210
1749 (1702min - 1767max) MBit/s +6%
MSI Cubi NUC AI+ 2MG
Intel Wi-Fi 6E AX211
1656 (1581min - 1726max) MBit/s
MSI Cubi NUC 1M
Intel Wi-Fi 6E AX211
1560 (1528min - 1585max) MBit/s -6%
GMK NucBox K12
MediaTek Wi-Fi 6E MT7922 160MHz Wireless LAN Card
860 (829min - 889max) MBit/s -48%
050100150200250300350400450500550600650700750800850900950100010501100115012001250130013501400145015001550160016501700Tooltip
MSI Cubi NUC AI+ 2MG; iperf3 transmit AXE11000 6GHz; iperf 3.1.3: Ø1102 (868-1237)
MSI Cubi NUC AI+ 2MG; iperf3 receive AXE11000 6GHz; iperf 3.1.3: Ø1656 (1581-1726)

Underhåll

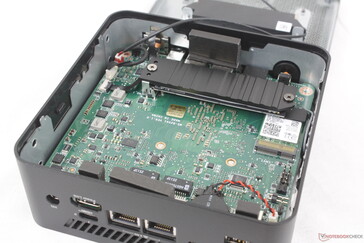
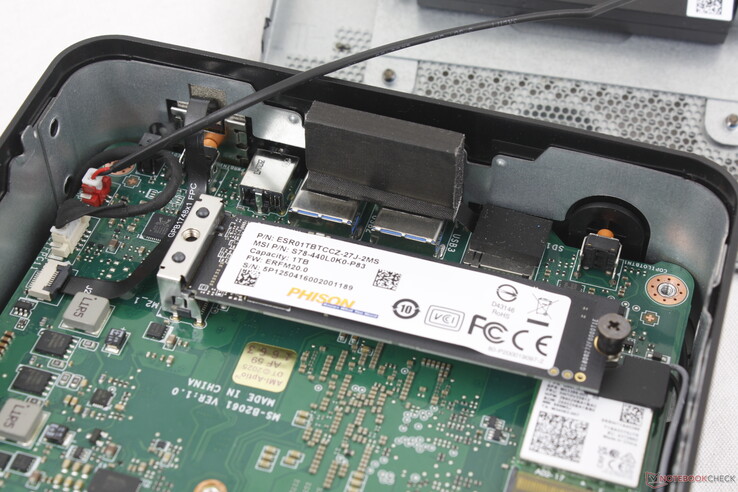
Bottenpanelen kan enkelt tas bort med en stjärnskruvmejsel för snabb service. Tyvärr stöds endast en intern PCIe4 x4 M.2 2280 SSD utan något löstagbart RAM-minne. I motsats till detta är NucBox K12 mini PC stöd för upp till tre M.2 SSD-enheter och två löstagbara SODIMM RAM-moduler.

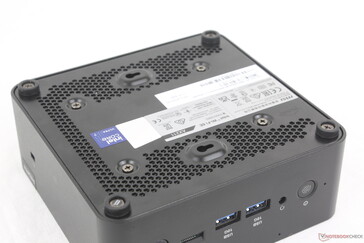
Undersidan visar ventilationsgaller, VESA-skruvar och gummifötter
Endast M.2 2280 SSD och WLAN-modulen är löstagbara

Hållbarhet

Chassit består av 37,25 procent återvunnen plast från konsumentledet medan innerförpackningen består av FSC-certifierade kartonger tillverkade av hållbart anskaffad trämassa.

Tillbehör och garanti

Lådan innehåller ett löstagbart VESA-monteringsfäste och en praktisk 19-tums strömbrytare med sladd för att slå på datorn om den är placerad på ett svåråtkomligt ställe.

En treårig begränsad tillverkargaranti ingår som standard, jämfört med ett år för de flesta andra minidatorer i USA.

Prestanda


Testförhållanden

Vi ställde in MSI Center på Performance-läge innan vi körde nedanstående benchmarks.

Processor

Core Core Ultra 7 258V är nästan 50 procent snabbare än den äldre Core 7 150U i förra årets Cubi NUC 1M när det gäller rå prestanda för flera trådar. Den har också en integrerad NPU, vilket NUC 1M inte hade, för stöd för Co-Pilot+.

Uppgradering till Core Ultra 9 288V SKU förväntas inte öka prestandan med någon betydande marginal medan nedgradering till Core Ultra 5 226V endast kommer att minska prestandan med några få procentenheter.

Cinebench R15 Multi Loop

0135270405540675810945108012151350148516201755189020252160229524302565Tooltip
MSI Cubi NUC AI+ 2MG Intel Core Ultra 7 258V: Ø1475 (1459.06-1488.32)
MSI Cubi NUC 1M Intel Core 7 150U: Ø971 (535.59-1039.66)
GMK NucBox K12 AMD Ryzen 7 H 255: Ø2505 (2493.14-2513.98)
Beelink SER9 Pro AMD Ryzen 7 H 255: Ø2565 (2544.37-2588.16)
Minisforum MS-A1 AMD Ryzen 7 8700G: Ø2666 (2561.48-2691.07)
CPU Performance rating: Percent
Cinebench R23: Multi Core | Single Core
Cinebench R20: CPU (Multi Core) | CPU (Single Core)
Cinebench R15: CPU Multi 64Bit | CPU Single 64Bit
Blender: v2.79 BMW27 CPU
7-Zip 18.03: 7z b 4 | 7z b 4 -mmt1
Geekbench 6.5: Multi-Core | Single-Core
Geekbench 5.5: Multi-Core | Single-Core
HWBOT x265 Benchmark v2.2: 4k Preset
LibreOffice : 20 Documents To PDF
R Benchmark 2.5: Overall mean
CPU Performance rating
Minisforum MS-A1
AMD Ryzen 7 8700G
90.4 pt
Asus NUC 14 Pro+
Intel Core Ultra 9 185H
86.8 pt
Beelink SER9 Pro
AMD Ryzen 7 H 255
84.6 pt
Intel NUC 13 Pro Kit NUC13ANK -2!
Intel Core i7-1360P
76.4 pt
MSI Cubi NUC AI+ 2MG
Intel Core Ultra 7 258V
72.1 pt
Genomsnitt Intel Core Ultra 7 258V
 
72 pt
MSI Cubi NUC 1M
Intel Core 7 150U
65.4 pt
Ninkear M7, (16+512)
AMD Ryzen 5 7430U
52.5 pt
GMK NucBox M5
AMD Ryzen 7 5700U
49.9 pt
Asus NUC 14 Essential
Intel Core 3 N355
37.8 pt
BMAX B4 Turbo
Intel Processor N150
26 pt
Cinebench R23 / Multi Core
Asus NUC 14 Pro+
Intel Core Ultra 9 185H
17615 Points +67%
Minisforum MS-A1
AMD Ryzen 7 8700G
17128 Points +63%
Beelink SER9 Pro
AMD Ryzen 7 H 255
16402 (16130.8min - 16402.1max) Points +56%
Intel NUC 13 Pro Kit NUC13ANK
Intel Core i7-1360P
12637 Points +20%
MSI Cubi NUC AI+ 2MG
Intel Core Ultra 7 258V
10524 (10414.4min - 10524.2max) Points
Genomsnitt Intel Core Ultra 7 258V
  (7920 - 11097, n=21)
10159 Points -3%
MSI Cubi NUC 1M
Intel Core 7 150U
7226 (6983.97min - 7226.42max) Points -31%
GMK NucBox M5
AMD Ryzen 7 5700U
6649 (6519.7min - 6648.75max) Points -37%
Ninkear M7, (16+512)
AMD Ryzen 5 7430U
6561 Points -38%
Asus NUC 14 Essential
Intel Core 3 N355
5262 Points -50%
BMAX B4 Turbo
Intel Processor N150
2428 (2385.1min - 2428.32max) Points -77%
Cinebench R23 / Single Core
MSI Cubi NUC AI+ 2MG
Intel Core Ultra 7 258V
1957 Points
Intel NUC 13 Pro Kit NUC13ANK
Intel Core i7-1360P
1909 Points -2%
MSI Cubi NUC 1M
Intel Core 7 150U
1878 Points -4%
Genomsnitt Intel Core Ultra 7 258V
  (1664 - 1957, n=21)
1857 Points -5%
Minisforum MS-A1
AMD Ryzen 7 8700G
1817 Points -7%
Asus NUC 14 Pro+
Intel Core Ultra 9 185H
1764 Points -10%
Beelink SER9 Pro
AMD Ryzen 7 H 255
1718 Points -12%
Ninkear M7, (16+512)
AMD Ryzen 5 7430U
1367 Points -30%
GMK NucBox M5
AMD Ryzen 7 5700U
1267 Points -35%
Asus NUC 14 Essential
Intel Core 3 N355
1039 Points -47%
BMAX B4 Turbo
Intel Processor N150
949 Points -52%
Cinebench R20 / CPU (Multi Core)
Asus NUC 14 Pro+
Intel Core Ultra 9 185H
6997 Points +70%
Minisforum MS-A1
AMD Ryzen 7 8700G
6736 Points +63%
Beelink SER9 Pro
AMD Ryzen 7 H 255
6480 Points +57%
Intel NUC 13 Pro Kit NUC13ANK
Intel Core i7-1360P
4887 Points +19%
MSI Cubi NUC AI+ 2MG
Intel Core Ultra 7 258V
4121 Points
Genomsnitt Intel Core Ultra 7 258V
  (3130 - 4314, n=21)
3945 Points -4%
Ninkear M7, (16+512)
AMD Ryzen 5 7430U
2902 Points -30%
MSI Cubi NUC 1M
Intel Core 7 150U
2821 Points -32%
GMK NucBox M5
AMD Ryzen 7 5700U
2580 Points -37%
Asus NUC 14 Essential
Intel Core 3 N355
2015 Points -51%
BMAX B4 Turbo
Intel Processor N150
933 Points -77%
Cinebench R20 / CPU (Single Core)
MSI Cubi NUC AI+ 2MG
Intel Core Ultra 7 258V
741 Points
Intel NUC 13 Pro Kit NUC13ANK
Intel Core i7-1360P
736 Points -1%
MSI Cubi NUC 1M
Intel Core 7 150U
718 Points -3%
Genomsnitt Intel Core Ultra 7 258V
  (643 - 749, n=21)
711 Points -4%
Minisforum MS-A1
AMD Ryzen 7 8700G
705 Points -5%
Asus NUC 14 Pro+
Intel Core Ultra 9 185H
702 Points -5%
Beelink SER9 Pro
AMD Ryzen 7 H 255
677 Points -9%
Ninkear M7, (16+512)
AMD Ryzen 5 7430U
535 Points -28%
GMK NucBox M5
AMD Ryzen 7 5700U
495 Points -33%
Asus NUC 14 Essential
Intel Core 3 N355
393 Points -47%
BMAX B4 Turbo
Intel Processor N150
362 Points -51%
Cinebench R15 / CPU Multi 64Bit
Asus NUC 14 Pro+
Intel Core Ultra 9 185H
2863 Points +92%
Minisforum MS-A1
AMD Ryzen 7 8700G
2693 Points +81%
Beelink SER9 Pro
AMD Ryzen 7 H 255
2588 (2544.37min - 2588.16max) Points +74%
Intel NUC 13 Pro Kit NUC13ANK
Intel Core i7-1360P
2030 Points +36%
Genomsnitt Intel Core Ultra 7 258V
  (1280 - 1656, n=21)
1568 Points +5%
MSI Cubi NUC AI+ 2MG
Intel Core Ultra 7 258V
1488 (1459.06min - 1488.32max) Points
Ninkear M7, (16+512)
AMD Ryzen 5 7430U
1271 Points -15%
GMK NucBox M5
AMD Ryzen 7 5700U
1130 (1041.59min - 1129.53max) Points -24%
MSI Cubi NUC 1M
Intel Core 7 150U
1040 (535.59min - 1039.66max) Points -30%
Asus NUC 14 Essential
Intel Core 3 N355
822 Points -45%
BMAX B4 Turbo
Intel Processor N150
402 (363.55min - 401.51max) Points -73%
Cinebench R15 / CPU Single 64Bit
MSI Cubi NUC AI+ 2MG
Intel Core Ultra 7 258V
297 Points
Minisforum MS-A1
AMD Ryzen 7 8700G
286 Points -4%
Genomsnitt Intel Core Ultra 7 258V
  (258 - 298, n=21)
284 Points -4%
Beelink SER9 Pro
AMD Ryzen 7 H 255
276 Points -7%
Intel NUC 13 Pro Kit NUC13ANK
Intel Core i7-1360P
271 Points -9%
Asus NUC 14 Pro+
Intel Core Ultra 9 185H
262 Points -12%
MSI Cubi NUC 1M
Intel Core 7 150U
258 Points -13%
Ninkear M7, (16+512)
AMD Ryzen 5 7430U
221 Points -26%
GMK NucBox M5
AMD Ryzen 7 5700U
188.1 Points -37%
Asus NUC 14 Essential
Intel Core 3 N355
168 Points -43%
BMAX B4 Turbo
Intel Processor N150
154.3 Points -48%
Blender / v2.79 BMW27 CPU
BMAX B4 Turbo
Intel Processor N150
1233 Seconds * -278%
Asus NUC 14 Essential
Intel Core 3 N355
574 Seconds * -76%
MSI Cubi NUC 1M
Intel Core 7 150U
451 Seconds * -38%
Ninkear M7, (16+512)
AMD Ryzen 5 7430U
447 Seconds * -37%
GMK NucBox M5
AMD Ryzen 7 5700U
427 Seconds * -31%
Genomsnitt Intel Core Ultra 7 258V
  (315 - 452, n=21)
358 Seconds * -10%
MSI Cubi NUC AI+ 2MG
Intel Core Ultra 7 258V
326 Seconds *
Intel NUC 13 Pro Kit NUC13ANK
Intel Core i7-1360P
275 Seconds * +16%
Beelink SER9 Pro
AMD Ryzen 7 H 255
194 Seconds * +40%
Minisforum MS-A1
AMD Ryzen 7 8700G
186 Seconds * +43%
Asus NUC 14 Pro+
Intel Core Ultra 9 185H
184 Seconds * +44%
7-Zip 18.03 / 7z b 4
Minisforum MS-A1
AMD Ryzen 7 8700G
75427 MIPS +118%
Beelink SER9 Pro
AMD Ryzen 7 H 255
69787 MIPS +101%
Asus NUC 14 Pro+
Intel Core Ultra 9 185H
69720 MIPS +101%
Intel NUC 13 Pro Kit NUC13ANK
Intel Core i7-1360P
52959 MIPS +53%
Ninkear M7, (16+512)
AMD Ryzen 5 7430U
37081 MIPS +7%
Genomsnitt Intel Core Ultra 7 258V
  (28482 - 36724, n=21)
34715 MIPS 0%
MSI Cubi NUC AI+ 2MG
Intel Core Ultra 7 258V
34645 MIPS
GMK NucBox M5
AMD Ryzen 7 5700U
34172 MIPS -1%
MSI Cubi NUC 1M
Intel Core 7 150U
31447 MIPS -9%
Asus NUC 14 Essential
Intel Core 3 N355
23225 MIPS -33%
BMAX B4 Turbo
Intel Processor N150
11171 MIPS -68%
7-Zip 18.03 / 7z b 4 -mmt1
Minisforum MS-A1
AMD Ryzen 7 8700G
6665 MIPS +15%
Beelink SER9 Pro
AMD Ryzen 7 H 255
6237 MIPS +7%
Intel NUC 13 Pro Kit NUC13ANK
Intel Core i7-1360P
5961 MIPS +2%
MSI Cubi NUC 1M
Intel Core 7 150U
5898 MIPS +1%
MSI Cubi NUC AI+ 2MG
Intel Core Ultra 7 258V
5816 MIPS
Asus NUC 14 Pro+
Intel Core Ultra 9 185H
5713 MIPS -2%
Genomsnitt Intel Core Ultra 7 258V
  (5265 - 5869, n=21)
5690 MIPS -2%
Ninkear M7, (16+512)
AMD Ryzen 5 7430U
5267 MIPS -9%
GMK NucBox M5
AMD Ryzen 7 5700U
4599 MIPS -21%
Asus NUC 14 Essential
Intel Core 3 N355
4044 MIPS -30%
BMAX B4 Turbo
Intel Processor N150
3859 MIPS -34%
Geekbench 6.5 / Multi-Core
Asus NUC 14 Pro+
Intel Core Ultra 9 185H
13848 Points +54%
Minisforum MS-A1
AMD Ryzen 7 8700G
13741 Points +53%
Beelink SER9 Pro
AMD Ryzen 7 H 255
12825 Points +43%
Genomsnitt Intel Core Ultra 7 258V
  (8964 - 11334, n=21)
10785 Points +20%
MSI Cubi NUC AI+ 2MG
Intel Core Ultra 7 258V
8964 Points
MSI Cubi NUC 1M
Intel Core 7 150U
8756 Points -2%
GMK NucBox M5
AMD Ryzen 7 5700U
6260 Points -30%
Ninkear M7, (16+512)
AMD Ryzen 5 7430U
5705 Points -36%
Asus NUC 14 Essential
Intel Core 3 N355
5088 Points -43%
BMAX B4 Turbo
Intel Processor N150
2980 Points -67%
Geekbench 6.5 / Single-Core
MSI Cubi NUC AI+ 2MG
Intel Core Ultra 7 258V
2748 Points
Genomsnitt Intel Core Ultra 7 258V
  (2593 - 2795, n=21)
2740 Points 0%
Minisforum MS-A1
AMD Ryzen 7 8700G
2711 Points -1%
MSI Cubi NUC 1M
Intel Core 7 150U
2646 Points -4%
Beelink SER9 Pro
AMD Ryzen 7 H 255
2546 Points -7%
Asus NUC 14 Pro+
Intel Core Ultra 9 185H
2465 Points -10%
Ninkear M7, (16+512)
AMD Ryzen 5 7430U
1849 Points -33%
GMK NucBox M5
AMD Ryzen 7 5700U
1625 Points -41%
Asus NUC 14 Essential
Intel Core 3 N355
1344 Points -51%
BMAX B4 Turbo
Intel Processor N150
1249 Points -55%
Geekbench 5.5 / Multi-Core
Asus NUC 14 Pro+
Intel Core Ultra 9 185H
13566 Points +79%
Minisforum MS-A1
AMD Ryzen 7 8700G
12618 Points +67%
Beelink SER9 Pro
AMD Ryzen 7 H 255
11614 Points +53%
Intel NUC 13 Pro Kit NUC13ANK
Intel Core i7-1360P
10574 Points +40%
Genomsnitt Intel Core Ultra 7 258V
  (7574 - 9864, n=21)
9422 Points +24%
MSI Cubi NUC 1M
Intel Core 7 150U
7788 Points +3%
MSI Cubi NUC AI+ 2MG
Intel Core Ultra 7 258V
7574 Points
GMK NucBox M5
AMD Ryzen 7 5700U
5593 Points -26%
Ninkear M7, (16+512)
AMD Ryzen 5 7430U
5343 Points -29%
Asus NUC 14 Essential
Intel Core 3 N355
4903 Points -35%
BMAX B4 Turbo
Intel Processor N150
2579 Points -66%
Geekbench 5.5 / Single-Core
MSI Cubi NUC AI+ 2MG
Intel Core Ultra 7 258V
2022 Points
Minisforum MS-A1
AMD Ryzen 7 8700G
2012 Points 0%
Genomsnitt Intel Core Ultra 7 258V
  (1891 - 2046, n=21)
1997 Points -1%
MSI Cubi NUC 1M
Intel Core 7 150U
1910 Points -6%
Intel NUC 13 Pro Kit NUC13ANK
Intel Core i7-1360P
1850 Points -9%
Beelink SER9 Pro
AMD Ryzen 7 H 255
1810 Points -10%
Asus NUC 14 Pro+
Intel Core Ultra 9 185H
1743 Points -14%
Ninkear M7, (16+512)
AMD Ryzen 5 7430U
1390 Points -31%
GMK NucBox M5
AMD Ryzen 7 5700U
1203 Points -41%
Asus NUC 14 Essential
Intel Core 3 N355
1082 Points -46%
BMAX B4 Turbo
Intel Processor N150
991 Points -51%
HWBOT x265 Benchmark v2.2 / 4k Preset
Minisforum MS-A1
AMD Ryzen 7 8700G
22.3 fps +68%
Beelink SER9 Pro
AMD Ryzen 7 H 255
20.4 fps +53%
Asus NUC 14 Pro+
Intel Core Ultra 9 185H
19.7 fps +48%
Intel NUC 13 Pro Kit NUC13ANK
Intel Core i7-1360P
14.2 fps +7%
MSI Cubi NUC AI+ 2MG
Intel Core Ultra 7 258V
13.3 fps
Genomsnitt Intel Core Ultra 7 258V
  (9.65 - 14.2, n=21)
12.4 fps -7%
MSI Cubi NUC 1M
Intel Core 7 150U
8.57 fps -36%
Ninkear M7, (16+512)
AMD Ryzen 5 7430U
8.47 fps -36%
GMK NucBox M5
AMD Ryzen 7 5700U
8.44 fps -37%
Asus NUC 14 Essential
Intel Core 3 N355
5.85 fps -56%
BMAX B4 Turbo
Intel Processor N150
2.81 fps -79%
LibreOffice / 20 Documents To PDF
Asus NUC 14 Essential
Intel Core 3 N355
86.4 s * -92%
BMAX B4 Turbo
Intel Processor N150
82.1 s * -82%
Ninkear M7, (16+512)
AMD Ryzen 5 7430U
67 s * -49%
GMK NucBox M5
AMD Ryzen 7 5700U
58 s * -29%
Asus NUC 14 Pro+
Intel Core Ultra 9 185H
51.8 s * -15%
Beelink SER9 Pro
AMD Ryzen 7 H 255
51 s * -13%
Genomsnitt Intel Core Ultra 7 258V
  (41.1 - 59.3, n=21)
48.3 s * -7%
Minisforum MS-A1
AMD Ryzen 7 8700G
45.5 s * -1%
MSI Cubi NUC AI+ 2MG
Intel Core Ultra 7 258V
45.1 s *
Intel NUC 13 Pro Kit NUC13ANK
Intel Core i7-1360P
43.7 s * +3%
MSI Cubi NUC 1M
Intel Core 7 150U
37.9 s * +16%
R Benchmark 2.5 / Overall mean
BMAX B4 Turbo
Intel Processor N150
0.88 sec * -95%
Asus NUC 14 Essential
Intel Core 3 N355
0.801 sec * -78%
Ninkear M7, (16+512)
AMD Ryzen 5 7430U
0.598 sec * -33%
GMK NucBox M5
AMD Ryzen 7 5700U
0.584 sec * -30%
Beelink SER9 Pro
AMD Ryzen 7 H 255
0.503 sec * -12%
Genomsnitt Intel Core Ultra 7 258V
  (0.443 - 0.4852, n=21)
0.4572 sec * -1%
MSI Cubi NUC AI+ 2MG
Intel Core Ultra 7 258V
0.4505 sec *
Asus NUC 14 Pro+
Intel Core Ultra 9 185H
0.4504 sec * -0%
Intel NUC 13 Pro Kit NUC13ANK
Intel Core i7-1360P
0.445 sec * +1%
MSI Cubi NUC 1M
Intel Core 7 150U
0.4438 sec * +1%
Minisforum MS-A1
AMD Ryzen 7 8700G
0.4285 sec * +5%

* ... mindre är bättre

Cinebench R15 CPU Multi 64Bit
1488 Points
Cinebench R15 OpenGL 64Bit
181.9 fps
Cinebench R15 Ref. Match 64Bit
97.8 %
Cinebench R15 CPU Single 64Bit
297 Points
Cinebench R20 CPU (Multi Core)
4121 Points
Cinebench R20 CPU (Single Core)
741 Points
Cinebench R23 Single Core
1957 Points
Cinebench R23 Multi Core
10524 Points
Cinebench 2024 CPU Single Core
120.8 Points
Cinebench 2024 CPU Multi Core
623 Points
Hjälp
Performance rating
Minisforum MS-A1
AMD Ryzen 7 8700G, Radeon 780M
97.4 pt
Beelink SER9 Pro
AMD Ryzen 7 H 255, Radeon 780M
88.4 pt
GMK NucBox K12
AMD Ryzen 7 H 255, Radeon 780M
85.9 pt
MSI Cubi NUC AI+ 2MG
Intel Core Ultra 7 258V, Arc 140V
49.4 pt
Genomsnitt Intel Core Ultra 7 258V
 
47.3 pt
Ninkear M7, (16+512)
AMD Ryzen 5 7430U, Vega 7
36.9 pt
MSI Cubi NUC 1M
Intel Core 7 150U, Iris Xe G7 96EUs
34.6 pt
AIDA64 / FP32 Ray-Trace
Minisforum MS-A1
AMD Ryzen 7 8700G, Radeon 780M
27384 KRay/s +126%
Beelink SER9 Pro
AMD Ryzen 7 H 255, Radeon 780M
26120 KRay/s +116%
GMK NucBox K12
AMD Ryzen 7 H 255, Radeon 780M
25404 KRay/s +110%
MSI Cubi NUC AI+ 2MG
Intel Core Ultra 7 258V, Arc 140V
12094 KRay/s
Genomsnitt Intel Core Ultra 7 258V
  (8454 - 12781, n=21)
11448 KRay/s -5%
Ninkear M7, (16+512)
AMD Ryzen 5 7430U, Vega 7
7219 KRay/s -40%
MSI Cubi NUC 1M
Intel Core 7 150U, Iris Xe G7 96EUs
6306 KRay/s -48%
AIDA64 / FPU Julia
Minisforum MS-A1
AMD Ryzen 7 8700G, Radeon 780M
116071 Points +91%
Beelink SER9 Pro
AMD Ryzen 7 H 255, Radeon 780M
106590 Points +75%
GMK NucBox K12
AMD Ryzen 7 H 255, Radeon 780M
104302 Points +71%
MSI Cubi NUC AI+ 2MG
Intel Core Ultra 7 258V, Arc 140V
60874 Points
Genomsnitt Intel Core Ultra 7 258V
  (40875 - 63401, n=21)
57031 Points -6%
Ninkear M7, (16+512)
AMD Ryzen 5 7430U, Vega 7
54504 Points -10%
MSI Cubi NUC 1M
Intel Core 7 150U, Iris Xe G7 96EUs
32582 Points -46%
AIDA64 / CPU SHA3
Minisforum MS-A1
AMD Ryzen 7 8700G, Radeon 780M
5092 MB/s +88%
Beelink SER9 Pro
AMD Ryzen 7 H 255, Radeon 780M
4764 MB/s +76%
GMK NucBox K12
AMD Ryzen 7 H 255, Radeon 780M
4604 MB/s +70%
MSI Cubi NUC AI+ 2MG
Intel Core Ultra 7 258V, Arc 140V
2705 MB/s
Genomsnitt Intel Core Ultra 7 258V
  (1930 - 2817, n=21)
2564 MB/s -5%
Ninkear M7, (16+512)
AMD Ryzen 5 7430U, Vega 7
1838 MB/s -32%
MSI Cubi NUC 1M
Intel Core 7 150U, Iris Xe G7 96EUs
1656 MB/s -39%
AIDA64 / CPU Queen
Minisforum MS-A1
AMD Ryzen 7 8700G, Radeon 780M
120159 Points +142%
Beelink SER9 Pro
AMD Ryzen 7 H 255, Radeon 780M
115748 Points +133%
GMK NucBox K12
AMD Ryzen 7 H 255, Radeon 780M
111673 Points +125%
Ninkear M7, (16+512)
AMD Ryzen 5 7430U, Vega 7
63855 Points +29%
MSI Cubi NUC 1M
Intel Core 7 150U, Iris Xe G7 96EUs
62280 Points +26%
Genomsnitt Intel Core Ultra 7 258V
  (49084 - 49818, n=21)
49682 Points 0%
MSI Cubi NUC AI+ 2MG
Intel Core Ultra 7 258V, Arc 140V
49605 Points
AIDA64 / FPU SinJulia
Minisforum MS-A1
AMD Ryzen 7 8700G, Radeon 780M
15698 Points +255%
Beelink SER9 Pro
AMD Ryzen 7 H 255, Radeon 780M
15123 Points +242%
GMK NucBox K12
AMD Ryzen 7 H 255, Radeon 780M
14626 Points +231%
Ninkear M7, (16+512)
AMD Ryzen 5 7430U, Vega 7
7413 Points +68%
MSI Cubi NUC AI+ 2MG
Intel Core Ultra 7 258V, Arc 140V
4425 Points
MSI Cubi NUC 1M
Intel Core 7 150U, Iris Xe G7 96EUs
4387 Points -1%
Genomsnitt Intel Core Ultra 7 258V
  (3817 - 4440, n=21)
4343 Points -2%
AIDA64 / FPU Mandel
Minisforum MS-A1
AMD Ryzen 7 8700G, Radeon 780M
62263 Points +97%
Beelink SER9 Pro
AMD Ryzen 7 H 255, Radeon 780M
57378 Points +82%
GMK NucBox K12
AMD Ryzen 7 H 255, Radeon 780M
56019 Points +77%
MSI Cubi NUC AI+ 2MG
Intel Core Ultra 7 258V, Arc 140V
31593 Points
Genomsnitt Intel Core Ultra 7 258V
  (21670 - 33565, n=21)
29966 Points -5%
Ninkear M7, (16+512)
AMD Ryzen 5 7430U, Vega 7
27917 Points -12%
MSI Cubi NUC 1M
Intel Core 7 150U, Iris Xe G7 96EUs
16042 Points -49%
AIDA64 / CPU AES
Minisforum MS-A1
AMD Ryzen 7 8700G, Radeon 780M
176002 MB/s +336%
Beelink SER9 Pro
AMD Ryzen 7 H 255, Radeon 780M
86090 MB/s +113%
GMK NucBox K12
AMD Ryzen 7 H 255, Radeon 780M
83999 MB/s +108%
MSI Cubi NUC AI+ 2MG
Intel Core Ultra 7 258V, Arc 140V
40408 MB/s
Genomsnitt Intel Core Ultra 7 258V
  (30957 - 40753, n=21)
38523 MB/s -5%
Ninkear M7, (16+512)
AMD Ryzen 5 7430U, Vega 7
37339 MB/s -8%
MSI Cubi NUC 1M
Intel Core 7 150U, Iris Xe G7 96EUs
33007 MB/s -18%
AIDA64 / CPU ZLib
Minisforum MS-A1
AMD Ryzen 7 8700G, Radeon 780M
1097 MB/s +84%
Beelink SER9 Pro
AMD Ryzen 7 H 255, Radeon 780M
1066 MB/s +79%
GMK NucBox K12
AMD Ryzen 7 H 255, Radeon 780M
1036 MB/s +74%
MSI Cubi NUC AI+ 2MG
Intel Core Ultra 7 258V, Arc 140V
596 MB/s
Genomsnitt Intel Core Ultra 7 258V
  (422 - 632, n=21)
582 MB/s -2%
MSI Cubi NUC 1M
Intel Core 7 150U, Iris Xe G7 96EUs
491 MB/s -18%
Ninkear M7, (16+512)
AMD Ryzen 5 7430U, Vega 7
491 MB/s -18%
AIDA64 / FP64 Ray-Trace
Minisforum MS-A1
AMD Ryzen 7 8700G, Radeon 780M
14519 KRay/s +116%
Beelink SER9 Pro
AMD Ryzen 7 H 255, Radeon 780M
13941 KRay/s +107%
GMK NucBox K12
AMD Ryzen 7 H 255, Radeon 780M
13694 KRay/s +103%
MSI Cubi NUC AI+ 2MG
Intel Core Ultra 7 258V, Arc 140V
6732 KRay/s
Genomsnitt Intel Core Ultra 7 258V
  (4258 - 6930, n=21)
6073 KRay/s -10%
Ninkear M7, (16+512)
AMD Ryzen 5 7430U, Vega 7
3768 KRay/s -44%
MSI Cubi NUC 1M
Intel Core 7 150U, Iris Xe G7 96EUs
3417 KRay/s -49%
AIDA64 / CPU PhotoWorxx
MSI Cubi NUC AI+ 2MG
Intel Core Ultra 7 258V, Arc 140V
54395 MPixel/s
Genomsnitt Intel Core Ultra 7 258V
  (44223 - 54971, n=21)
53150 MPixel/s -2%
Beelink SER9 Pro
AMD Ryzen 7 H 255, Radeon 780M
41649 MPixel/s -23%
Minisforum MS-A1
AMD Ryzen 7 8700G, Radeon 780M
40404 MPixel/s -26%
GMK NucBox K12
AMD Ryzen 7 H 255, Radeon 780M
40115 MPixel/s -26%
MSI Cubi NUC 1M
Intel Core 7 150U, Iris Xe G7 96EUs
37889 MPixel/s -30%
Ninkear M7, (16+512)
AMD Ryzen 5 7430U, Vega 7
12161 MPixel/s -78%

Stresstest

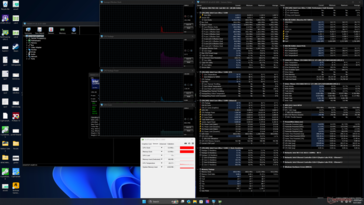
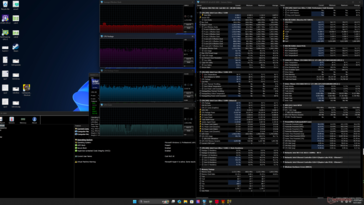
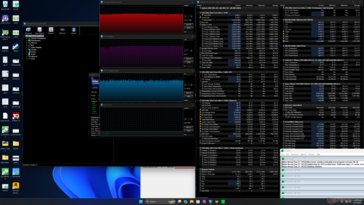
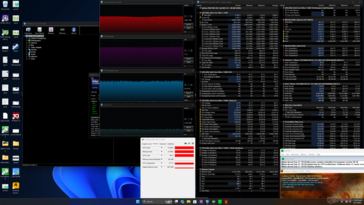
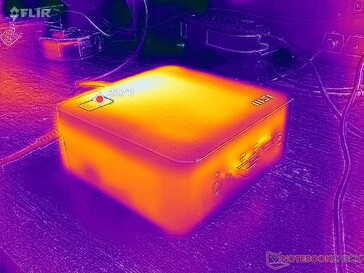
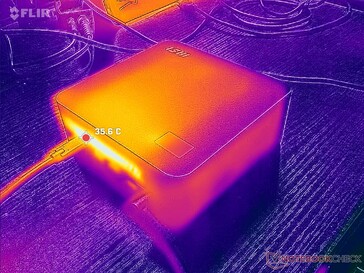
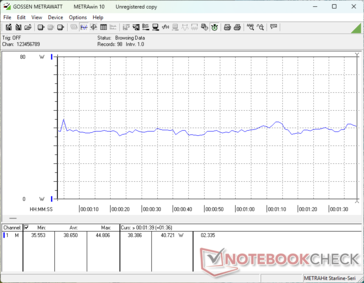
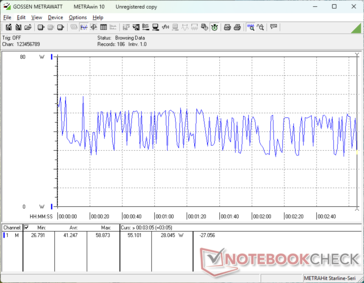
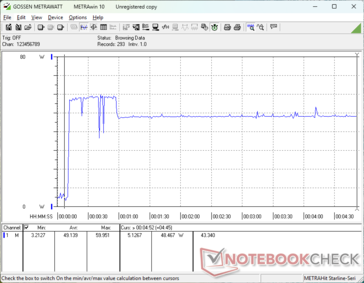
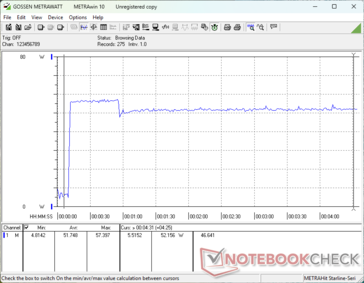
Processorn stabiliserades på 3,2 GHz, 66 C och cirka 38 W när Prime95-stress kördes. När Cyberpunk 2077 kördes för att representera typisk spelstress, växlade GPU-klockfrekvenserna mellan 800 MHz och 1950 MHz, vilket resulterade i instabila bildtider vid spel, vilket visas i avsnittet GPU-prestanda nedan, även om den genomsnittliga bildfrekvensen är normal. Detta stapplande beteende inträffade i både balanserat läge och prestandaläge.

System på tomgång
System på tomgång
Cyberpunk 2077 stress
Prime95 stress
Prime95 stress
Prime95+FurMark stress
Genomsnittlig CPU-klocka (GHz) GPU-klocka (MHz) Genomsnittlig CPU-temperatur (°C)
System i viloläge -- -- 33
Prime95 Stress 3.2 -- 66
Prime95 + FurMark Stress 2.9 1200 71
Cyberpunk 2077 Stress 1.3 800 - 1950 63

Systemets prestanda

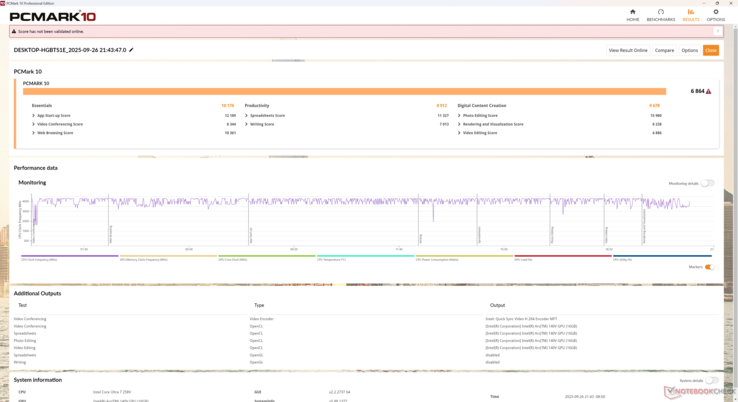
PCMark 10 Standard-poängen är högre än Cubi NUC 1M, särskilt i det GPU-tunga deltestet Digital Content Creation
Performance rating: Percent
PCMark 10: Score | Essentials | Productivity | Digital Content Creation
CrossMark: Overall | Productivity | Creativity | Responsiveness
WebXPRT 3: Overall
WebXPRT 4: Overall
Mozilla Kraken 1.1: Total
Performance rating
Minisforum MS-A1
Radeon 780M, R7 8700G, Kingston OM8PGP41024Q-A0
93.5 pt
Beelink SER9 Pro
Radeon 780M, Ryzen 7 H 255, Crucial P3 Plus CT1000P3PSSD8
84.8 pt
GMK NucBox K12
Radeon 780M, Ryzen 7 H 255, Crucial P3 Plus CT1000P3PSSD8
84.1 pt
Genomsnitt Intel Core Ultra 7 258V, Intel Arc Graphics 140V
 
83.5 pt
MSI Cubi NUC 1M
Iris Xe G7 96EUs, Core 7 150U, WD PC SN560 SDDPNQE-1T00
82.5 pt
MSI Cubi NUC AI+ 2MG
Arc 140V, Core Ultra 7 258V
81.9 pt
Ninkear M7, (16+512)
Vega 7, R5 7430U, Faspeed P8-512G-SE
59.5 pt
PCMark 10 / Score
Minisforum MS-A1
Radeon 780M, R7 8700G, Kingston OM8PGP41024Q-A0
7795 Points +14%
GMK NucBox K12
Radeon 780M, Ryzen 7 H 255, Crucial P3 Plus CT1000P3PSSD8
6959 Points +1%
Genomsnitt Intel Core Ultra 7 258V, Intel Arc Graphics 140V
  (6265 - 7314, n=20)
6941 Points +1%
Beelink SER9 Pro
Radeon 780M, Ryzen 7 H 255, Crucial P3 Plus CT1000P3PSSD8
6907 Points +1%
MSI Cubi NUC AI+ 2MG
Arc 140V, Core Ultra 7 258V
6864 Points
MSI Cubi NUC 1M
Iris Xe G7 96EUs, Core 7 150U, WD PC SN560 SDDPNQE-1T00
6080 Points -11%
Ninkear M7, (16+512)
Vega 7, R5 7430U, Faspeed P8-512G-SE
5134 Points -25%
PCMark 10 / Essentials
Minisforum MS-A1
Radeon 780M, R7 8700G, Kingston OM8PGP41024Q-A0
11450 Points +13%
MSI Cubi NUC 1M
Iris Xe G7 96EUs, Core 7 150U, WD PC SN560 SDDPNQE-1T00
10856 Points +7%
GMK NucBox K12
Radeon 780M, Ryzen 7 H 255, Crucial P3 Plus CT1000P3PSSD8
10502 Points +3%
Genomsnitt Intel Core Ultra 7 258V, Intel Arc Graphics 140V
  (9295 - 11467, n=20)
10401 Points +2%
Beelink SER9 Pro
Radeon 780M, Ryzen 7 H 255, Crucial P3 Plus CT1000P3PSSD8
10377 Points +2%
MSI Cubi NUC AI+ 2MG
Arc 140V, Core Ultra 7 258V
10176 Points
Ninkear M7, (16+512)
Vega 7, R5 7430U, Faspeed P8-512G-SE
9627 Points -5%
PCMark 10 / Productivity
Minisforum MS-A1
Radeon 780M, R7 8700G, Kingston OM8PGP41024Q-A0
11045 Points +24%
GMK NucBox K12
Radeon 780M, Ryzen 7 H 255, Crucial P3 Plus CT1000P3PSSD8
9440 Points +6%
Beelink SER9 Pro
Radeon 780M, Ryzen 7 H 255, Crucial P3 Plus CT1000P3PSSD8
9325 Points +5%
Genomsnitt Intel Core Ultra 7 258V, Intel Arc Graphics 140V
  (7357 - 9619, n=20)
8924 Points 0%
MSI Cubi NUC AI+ 2MG
Arc 140V, Core Ultra 7 258V
8912 Points
Ninkear M7, (16+512)
Vega 7, R5 7430U, Faspeed P8-512G-SE
8726 Points -2%
MSI Cubi NUC 1M
Iris Xe G7 96EUs, Core 7 150U, WD PC SN560 SDDPNQE-1T00
8387 Points -6%
PCMark 10 / Digital Content Creation
Minisforum MS-A1
Radeon 780M, R7 8700G, Kingston OM8PGP41024Q-A0
10164 Points +5%
Genomsnitt Intel Core Ultra 7 258V, Intel Arc Graphics 140V
  (8914 - 10216, n=20)
9796 Points +1%
MSI Cubi NUC AI+ 2MG
Arc 140V, Core Ultra 7 258V
9678 Points
Beelink SER9 Pro
Radeon 780M, Ryzen 7 H 255, Crucial P3 Plus CT1000P3PSSD8
9243 Points -4%
GMK NucBox K12
Radeon 780M, Ryzen 7 H 255, Crucial P3 Plus CT1000P3PSSD8
9227 Points -5%
MSI Cubi NUC 1M
Iris Xe G7 96EUs, Core 7 150U, WD PC SN560 SDDPNQE-1T00
6701 Points -31%
Ninkear M7, (16+512)
Vega 7, R5 7430U, Faspeed P8-512G-SE
4372 Points -55%
CrossMark / Overall
Minisforum MS-A1
Radeon 780M, R7 8700G, Kingston OM8PGP41024Q-A0
1902 Points +23%
Beelink SER9 Pro
Radeon 780M, Ryzen 7 H 255, Crucial P3 Plus CT1000P3PSSD8
1791 Points +15%
GMK NucBox K12
Radeon 780M, Ryzen 7 H 255, Crucial P3 Plus CT1000P3PSSD8
1769 Points +14%
MSI Cubi NUC 1M
Iris Xe G7 96EUs, Core 7 150U, WD PC SN560 SDDPNQE-1T00
1734 Points +12%
Genomsnitt Intel Core Ultra 7 258V, Intel Arc Graphics 140V
  (1551 - 1742, n=19)
1682 Points +8%
MSI Cubi NUC AI+ 2MG
Arc 140V, Core Ultra 7 258V
1551 Points
Ninkear M7, (16+512)
Vega 7, R5 7430U, Faspeed P8-512G-SE
1185 Points -24%
CrossMark / Productivity
Minisforum MS-A1
Radeon 780M, R7 8700G, Kingston OM8PGP41024Q-A0
1812 Points +23%
MSI Cubi NUC 1M
Iris Xe G7 96EUs, Core 7 150U, WD PC SN560 SDDPNQE-1T00
1778 Points +20%
Beelink SER9 Pro
Radeon 780M, Ryzen 7 H 255, Crucial P3 Plus CT1000P3PSSD8
1733 Points +17%
GMK NucBox K12
Radeon 780M, Ryzen 7 H 255, Crucial P3 Plus CT1000P3PSSD8
1709 Points +16%
Genomsnitt Intel Core Ultra 7 258V, Intel Arc Graphics 140V
  (1479 - 1684, n=19)
1624 Points +10%
MSI Cubi NUC AI+ 2MG
Arc 140V, Core Ultra 7 258V
1479 Points
Ninkear M7, (16+512)
Vega 7, R5 7430U, Faspeed P8-512G-SE
1257 Points -15%
CrossMark / Creativity
Minisforum MS-A1
Radeon 780M, R7 8700G, Kingston OM8PGP41024Q-A0
2095 Points +20%
Genomsnitt Intel Core Ultra 7 258V, Intel Arc Graphics 140V
  (1727 - 1977, n=19)
1898 Points +9%
Beelink SER9 Pro
Radeon 780M, Ryzen 7 H 255, Crucial P3 Plus CT1000P3PSSD8
1895 Points +8%
GMK NucBox K12
Radeon 780M, Ryzen 7 H 255, Crucial P3 Plus CT1000P3PSSD8
1887 Points +8%
MSI Cubi NUC AI+ 2MG
Arc 140V, Core Ultra 7 258V
1749 Points
MSI Cubi NUC 1M
Iris Xe G7 96EUs, Core 7 150U, WD PC SN560 SDDPNQE-1T00
1708 Points -2%
Ninkear M7, (16+512)
Vega 7, R5 7430U, Faspeed P8-512G-SE
1184 Points -32%
CrossMark / Responsiveness
MSI Cubi NUC 1M
Iris Xe G7 96EUs, Core 7 150U, WD PC SN560 SDDPNQE-1T00
1685 Points +35%
Beelink SER9 Pro
Radeon 780M, Ryzen 7 H 255, Crucial P3 Plus CT1000P3PSSD8
1666 Points +34%
Minisforum MS-A1
Radeon 780M, R7 8700G, Kingston OM8PGP41024Q-A0
1646 Points +32%
GMK NucBox K12
Radeon 780M, Ryzen 7 H 255, Crucial P3 Plus CT1000P3PSSD8
1617 Points +30%
Genomsnitt Intel Core Ultra 7 258V, Intel Arc Graphics 140V
  (1246 - 1411, n=19)
1300 Points +4%
MSI Cubi NUC AI+ 2MG
Arc 140V, Core Ultra 7 258V
1246 Points
Ninkear M7, (16+512)
Vega 7, R5 7430U, Faspeed P8-512G-SE
992 Points -20%
WebXPRT 3 / Overall
Minisforum MS-A1
Radeon 780M, R7 8700G, Kingston OM8PGP41024Q-A0
336 Points +6%
MSI Cubi NUC AI+ 2MG
Arc 140V, Core Ultra 7 258V
317 Points
MSI Cubi NUC 1M
Iris Xe G7 96EUs, Core 7 150U, WD PC SN560 SDDPNQE-1T00
311 Points -2%
Beelink SER9 Pro
Radeon 780M, Ryzen 7 H 255, Crucial P3 Plus CT1000P3PSSD8
300 Points -5%
GMK NucBox K12
Radeon 780M, Ryzen 7 H 255, Crucial P3 Plus CT1000P3PSSD8
290 Points -9%
Genomsnitt Intel Core Ultra 7 258V, Intel Arc Graphics 140V
  (219 - 317, n=19)
286 Points -10%
Ninkear M7, (16+512)
Vega 7, R5 7430U, Faspeed P8-512G-SE
230 Points -27%
WebXPRT 4 / Overall
MSI Cubi NUC AI+ 2MG
Arc 140V, Core Ultra 7 258V
276 Points
Minisforum MS-A1
Radeon 780M, R7 8700G, Kingston OM8PGP41024Q-A0
271 Points -2%
MSI Cubi NUC 1M
Iris Xe G7 96EUs, Core 7 150U, WD PC SN560 SDDPNQE-1T00
271 Points -2%
Genomsnitt Intel Core Ultra 7 258V, Intel Arc Graphics 140V
  (199.5 - 291, n=19)
270 Points -2%
Beelink SER9 Pro
Radeon 780M, Ryzen 7 H 255, Crucial P3 Plus CT1000P3PSSD8
245 Points -11%
GMK NucBox K12
Radeon 780M, Ryzen 7 H 255, Crucial P3 Plus CT1000P3PSSD8
245 Points -11%
Ninkear M7, (16+512)
Vega 7, R5 7430U, Faspeed P8-512G-SE
186.5 Points -32%
Mozilla Kraken 1.1 / Total
Ninkear M7, (16+512)
Vega 7, R5 7430U, Faspeed P8-512G-SE
717 ms * -49%
GMK NucBox K12
Radeon 780M, Ryzen 7 H 255, Crucial P3 Plus CT1000P3PSSD8
577 ms * -20%
Beelink SER9 Pro
Radeon 780M, Ryzen 7 H 255, Crucial P3 Plus CT1000P3PSSD8
566 ms * -17%
MSI Cubi NUC 1M
Iris Xe G7 96EUs, Core 7 150U, WD PC SN560 SDDPNQE-1T00
489 ms * -1%
Minisforum MS-A1
Radeon 780M, R7 8700G, Kingston OM8PGP41024Q-A0
486 ms * -1%
Genomsnitt Intel Core Ultra 7 258V, Intel Arc Graphics 140V
  (468 - 559, n=21)
484 ms * -0%
MSI Cubi NUC AI+ 2MG
Arc 140V, Core Ultra 7 258V
482 ms *

* ... mindre är bättre

PCMark 10 Score
6864 poäng
Hjälp
AIDA64 / Memory Copy
Genomsnitt Intel Core Ultra 7 258V
  (104408 - 114336, n=21)
108286 MB/s 0%
MSI Cubi NUC AI+ 2MG
Intel Core Ultra 7 258V, Arc 140V
107843 MB/s
Beelink SER9 Pro
AMD Ryzen 7 H 255, Radeon 780M
74184 MB/s -31%
GMK NucBox K12
AMD Ryzen 7 H 255, Radeon 780M
67673 MB/s -37%
Minisforum MS-A1
AMD Ryzen 7 8700G, Radeon 780M
64990 MB/s -40%
MSI Cubi NUC 1M
Intel Core 7 150U, Iris Xe G7 96EUs
59609 MB/s -45%
Ninkear M7, (16+512)
AMD Ryzen 5 7430U, Vega 7
21231 MB/s -80%
AIDA64 / Memory Read
MSI Cubi NUC AI+ 2MG
Intel Core Ultra 7 258V, Arc 140V
87541 MB/s
Genomsnitt Intel Core Ultra 7 258V
  (82846 - 89417, n=21)
87197 MB/s 0%
MSI Cubi NUC 1M
Intel Core 7 150U, Iris Xe G7 96EUs
68780 MB/s -21%
Minisforum MS-A1
AMD Ryzen 7 8700G, Radeon 780M
61504 MB/s -30%
GMK NucBox K12
AMD Ryzen 7 H 255, Radeon 780M
61129 MB/s -30%
Beelink SER9 Pro
AMD Ryzen 7 H 255, Radeon 780M
58305 MB/s -33%
Ninkear M7, (16+512)
AMD Ryzen 5 7430U, Vega 7
23386 MB/s -73%
AIDA64 / Memory Write
MSI Cubi NUC AI+ 2MG
Intel Core Ultra 7 258V, Arc 140V
117886 MB/s
Genomsnitt Intel Core Ultra 7 258V
  (108842 - 117935, n=21)
116823 MB/s -1%
Beelink SER9 Pro
AMD Ryzen 7 H 255, Radeon 780M
106026 MB/s -10%
GMK NucBox K12
AMD Ryzen 7 H 255, Radeon 780M
85497 MB/s -27%
Minisforum MS-A1
AMD Ryzen 7 8700G, Radeon 780M
79329 MB/s -33%
MSI Cubi NUC 1M
Intel Core 7 150U, Iris Xe G7 96EUs
60626 MB/s -49%
Ninkear M7, (16+512)
AMD Ryzen 5 7430U, Vega 7
23408 MB/s -80%
AIDA64 / Memory Latency
Beelink SER9 Pro
AMD Ryzen 7 H 255, Radeon 780M
103.9 ns * -9%
Genomsnitt Intel Core Ultra 7 258V
  (95 - 101.1, n=21)
97.7 ns * -2%
MSI Cubi NUC AI+ 2MG
Intel Core Ultra 7 258V, Arc 140V
95.5 ns *
Ninkear M7, (16+512)
AMD Ryzen 5 7430U, Vega 7
94.2 ns * +1%
GMK NucBox K12
AMD Ryzen 7 H 255, Radeon 780M
93.7 ns * +2%
Minisforum MS-A1
AMD Ryzen 7 8700G, Radeon 780M
88.5 ns * +7%
MSI Cubi NUC 1M
Intel Core 7 150U, Iris Xe G7 96EUs
74.5 ns * +22%

* ... mindre är bättre

DPC-fördröjning

LatencyMon
LatencyMon
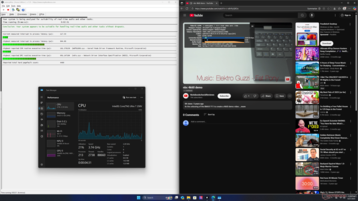
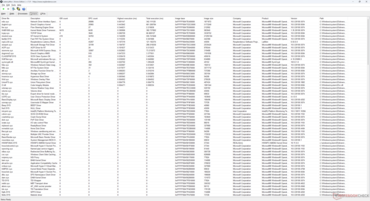
Lista över förare
Lista över förare
DPC Latencies / LatencyMon - interrupt to process latency (max), Web, Youtube, Prime95
MSI Cubi NUC 1M
Iris Xe G7 96EUs, Core 7 150U, WD PC SN560 SDDPNQE-1T00
4103.1 μs * -386%
Minisforum MS-A1
Radeon 780M, R7 8700G, Kingston OM8PGP41024Q-A0
1806 μs * -114%
GMK NucBox K12
Radeon 780M, Ryzen 7 H 255, Crucial P3 Plus CT1000P3PSSD8
1124 μs * -33%
MSI Cubi NUC AI+ 2MG
Arc 140V, Core Ultra 7 258V
844.8 μs *
Beelink SER9 Pro
Radeon 780M, Ryzen 7 H 255, Crucial P3 Plus CT1000P3PSSD8
790.7 μs * +6%

* ... mindre är bättre

Lagringsenheter

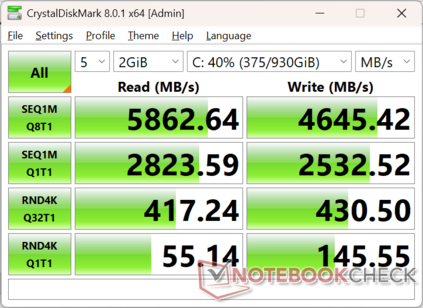
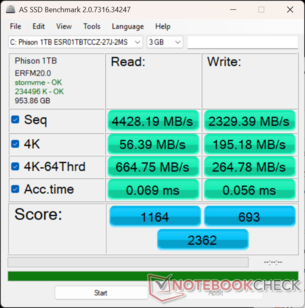
SSD-överföringshastigheter med primära 1 TB Phison ligger stabilt på nästan 5900 MB/s även under långvarig stress, vilket är en liten förbättring jämfört med WD SSD i den ursprungliga Cubi 1M.

CDM 8
CDM 8
AS SSD
AS SSD
M.2 2280 SSD med kylfläns borttagen
CDM 5/6 Read Seq Q32T1: 5844 MB/s
CDM 5/6 Write Seq Q32T1: 4229 MB/s
CDM 5/6 Read 4K Q32T1: 419.9 MB/s
CDM 5/6 Write 4K Q32T1: 434.7 MB/s
CDM 5 Read Seq: 2704 MB/s
CDM 5 Write Seq: 2485 MB/s
CDM 5/6 Read 4K: 57.3 MB/s
CDM 5/6 Write 4K: 145.9 MB/s
Drive Performance rating - Percent
Minisforum MS-A1
Kingston OM8PGP41024Q-A0
86.8 pt
MSI Cubi NUC 1M
WD PC SN560 SDDPNQE-1T00
59.6 pt
Beelink SER9 Pro
Crucial P3 Plus CT1000P3PSSD8
54.5 pt
MSI Cubi NUC AI+ 2MG
 
53.1 pt
GMK NucBox K12
Crucial P3 Plus CT1000P3PSSD8
51.8 pt
Ninkear M7, (16+512)
Faspeed P8-512G-SE
33.8 pt
DiskSpd
seq read
MSI Cubi NUC 1M
WD PC SN560 SDDPNQE-1T00
4128 (4092.8min - 4128.38max) MB/s +41%
MSI Cubi NUC AI+ 2MG
 
2932 (2911.11min - 2931.83max) MB/s
Minisforum MS-A1
Kingston OM8PGP41024Q-A0
2596 (2580.13min - 2596.06max) MB/s -11%
GMK NucBox K12
Crucial P3 Plus CT1000P3PSSD8
2149 (2136.58min - 2148.64max) MB/s -27%
Beelink SER9 Pro
Crucial P3 Plus CT1000P3PSSD8
2112 (2077.27min - 2111.8max) MB/s -28%
Ninkear M7, (16+512)
Faspeed P8-512G-SE
863 (860.21min - 862.77max) MB/s -71%
seq write
Minisforum MS-A1
Kingston OM8PGP41024Q-A0
3913 (3872.62min - 3912.8max) MB/s +56%
MSI Cubi NUC 1M
WD PC SN560 SDDPNQE-1T00
3215 (3133.8min - 3214.8max) MB/s +28%
MSI Cubi NUC AI+ 2MG
 
2508 (2473.89min - 2508max) MB/s
GMK NucBox K12
Crucial P3 Plus CT1000P3PSSD8
1810 (450.26min - 1810.21max) MB/s -28%
Beelink SER9 Pro
Crucial P3 Plus CT1000P3PSSD8
1808 (844.51min - 1808.37max) MB/s -28%
Ninkear M7, (16+512)
Faspeed P8-512G-SE
752 (746.8min - 751.62max) MB/s -70%
seq q8 t1 read
MSI Cubi NUC AI+ 2MG
 
5875 (4751.87min - 5875.38max) MB/s
MSI Cubi NUC 1M
WD PC SN560 SDDPNQE-1T00
4987 (4558.37min - 4987.33max) MB/s -15%
Beelink SER9 Pro
Crucial P3 Plus CT1000P3PSSD8
4942 (4516.62min - 4941.52max) MB/s -16%
GMK NucBox K12
Crucial P3 Plus CT1000P3PSSD8
4915 (4300min - 4915.3max) MB/s -16%
Minisforum MS-A1
Kingston OM8PGP41024Q-A0
4819 (3762.53min - 4819.05max) MB/s -18%
Ninkear M7, (16+512)
Faspeed P8-512G-SE
996 (973.5min - 996.04max) MB/s -83%
seq q8 t1 write
MSI Cubi NUC AI+ 2MG
 
4973 (4947.14min - 4972.98max) MB/s
Minisforum MS-A1
Kingston OM8PGP41024Q-A0
3927 (3923.26min - 3927.45max) MB/s -21%
MSI Cubi NUC 1M
WD PC SN560 SDDPNQE-1T00
3308 (3211.45min - 3307.84max) MB/s -33%
Beelink SER9 Pro
Crucial P3 Plus CT1000P3PSSD8
1803 (883.02min - 1802.5max) MB/s -64%
GMK NucBox K12
Crucial P3 Plus CT1000P3PSSD8
1799 (640.89min - 1798.7max) MB/s -64%
Ninkear M7, (16+512)
Faspeed P8-512G-SE
839 (834.46min - 839.07max) MB/s -83%
4k q1 t1 read
MSI Cubi NUC 1M
WD PC SN560 SDDPNQE-1T00
73.3 (72.01min - 73.31max) MB/s +28%
Minisforum MS-A1
Kingston OM8PGP41024Q-A0
63.3 (62.78min - 63.25max) MB/s +10%
MSI Cubi NUC AI+ 2MG
 
57.3 (57.09min - 57.31max) MB/s
GMK NucBox K12
Crucial P3 Plus CT1000P3PSSD8
54.4 (53.83min - 54.44max) MB/s -5%
Beelink SER9 Pro
Crucial P3 Plus CT1000P3PSSD8
50.5 (49.98min - 50.45max) MB/s -12%
Ninkear M7, (16+512)
Faspeed P8-512G-SE
30.3 (30.14min - 30.32max) MB/s -47%
4k q1 t1 write
MSI Cubi NUC 1M
WD PC SN560 SDDPNQE-1T00
282 (265.11min - 281.58max) MB/s +95%
Beelink SER9 Pro
Crucial P3 Plus CT1000P3PSSD8
261 (259.05min - 260.68max) MB/s +81%
GMK NucBox K12
Crucial P3 Plus CT1000P3PSSD8
251 (216.59min - 251.05max) MB/s +74%
Minisforum MS-A1
Kingston OM8PGP41024Q-A0
206 (204.82min - 206.03max) MB/s +43%
MSI Cubi NUC AI+ 2MG
 
144.3 (142.64min - 144.32max) MB/s
Ninkear M7, (16+512)
Faspeed P8-512G-SE
40 (39.82min - 40max) MB/s -72%
4k q32 t16 read
Minisforum MS-A1
Kingston OM8PGP41024Q-A0
2980 (2975.03min - 2979.83max) MB/s +314%
MSI Cubi NUC 1M
WD PC SN560 SDDPNQE-1T00
1533 (1419.74min - 1533.25max) MB/s +113%
MSI Cubi NUC AI+ 2MG
 
719 (619.26min - 718.65max) MB/s
GMK NucBox K12
Crucial P3 Plus CT1000P3PSSD8
698 (696.34min - 698.49max) MB/s -3%
Beelink SER9 Pro
Crucial P3 Plus CT1000P3PSSD8
696 (692.86min - 696.3max) MB/s -3%
Ninkear M7, (16+512)
Faspeed P8-512G-SE
369 (367.06min - 369.29max) MB/s -49%
4k q32 t16 write
Minisforum MS-A1
Kingston OM8PGP41024Q-A0
3784 (3750.18min - 3783.56max) MB/s +818%
MSI Cubi NUC 1M
WD PC SN560 SDDPNQE-1T00
2010 (1622.95min - 2010.14max) MB/s +388%
GMK NucBox K12
Crucial P3 Plus CT1000P3PSSD8
1786 (636.51min - 1786.33max) MB/s +333%
Beelink SER9 Pro
Crucial P3 Plus CT1000P3PSSD8
1780 (805.06min - 1780.2max) MB/s +332%
MSI Cubi NUC AI+ 2MG
 
412 (409.29min - 411.67max) MB/s
Ninkear M7, (16+512)
Faspeed P8-512G-SE
313 (289.5min - 313.33max) MB/s -24%
AS SSD
Score Total
Minisforum MS-A1
Kingston OM8PGP41024Q-A0
8405 Points +256%
Ninkear M7, (16+512)
Faspeed P8-512G-SE
4136 Points +75%
Beelink SER9 Pro
Crucial P3 Plus CT1000P3PSSD8
3778 Points +60%
GMK NucBox K12
Crucial P3 Plus CT1000P3PSSD8
3482 Points +47%
MSI Cubi NUC 1M
WD PC SN560 SDDPNQE-1T00
2750 Points +16%
MSI Cubi NUC AI+ 2MG
 
2362 Points
Score Read
Minisforum MS-A1
Kingston OM8PGP41024Q-A0
2901 Points +149%
Ninkear M7, (16+512)
Faspeed P8-512G-SE
1771 Points +52%
MSI Cubi NUC 1M
WD PC SN560 SDDPNQE-1T00
1443 Points +24%
MSI Cubi NUC AI+ 2MG
 
1164 Points
Beelink SER9 Pro
Crucial P3 Plus CT1000P3PSSD8
1127 Points -3%
GMK NucBox K12
Crucial P3 Plus CT1000P3PSSD8
1095 Points -6%
Score Write
Minisforum MS-A1
Kingston OM8PGP41024Q-A0
4040 Points +483%
Beelink SER9 Pro
Crucial P3 Plus CT1000P3PSSD8
2146 Points +210%
GMK NucBox K12
Crucial P3 Plus CT1000P3PSSD8
1928 Points +178%
Ninkear M7, (16+512)
Faspeed P8-512G-SE
1471 Points +112%
MSI Cubi NUC AI+ 2MG
 
693 Points
MSI Cubi NUC 1M
WD PC SN560 SDDPNQE-1T00
651 Points -6%
Seq Read
MSI Cubi NUC AI+ 2MG
 
4428.19 MB/s
MSI Cubi NUC 1M
WD PC SN560 SDDPNQE-1T00
4327.67 MB/s -2%
Minisforum MS-A1
Kingston OM8PGP41024Q-A0
4159 MB/s -6%
GMK NucBox K12
Crucial P3 Plus CT1000P3PSSD8
3916.9 MB/s -12%
Beelink SER9 Pro
Crucial P3 Plus CT1000P3PSSD8
3870.26 MB/s -13%
Ninkear M7, (16+512)
Faspeed P8-512G-SE
3031 MB/s -32%
Seq Write
Minisforum MS-A1
Kingston OM8PGP41024Q-A0
3688 MB/s +58%
Ninkear M7, (16+512)
Faspeed P8-512G-SE
2676 MB/s +15%
MSI Cubi NUC 1M
WD PC SN560 SDDPNQE-1T00
2606.84 MB/s +12%
MSI Cubi NUC AI+ 2MG
 
2329.39 MB/s
Beelink SER9 Pro
Crucial P3 Plus CT1000P3PSSD8
2185.55 MB/s -6%
GMK NucBox K12
Crucial P3 Plus CT1000P3PSSD8
1648.2 MB/s -29%
4K Read
Minisforum MS-A1
Kingston OM8PGP41024Q-A0
75.7 MB/s +34%
MSI Cubi NUC AI+ 2MG
 
56.39 MB/s
Ninkear M7, (16+512)
Faspeed P8-512G-SE
53.1 MB/s -6%
Beelink SER9 Pro
Crucial P3 Plus CT1000P3PSSD8
52.09 MB/s -8%
GMK NucBox K12
Crucial P3 Plus CT1000P3PSSD8
50 MB/s -11%
MSI Cubi NUC 1M
WD PC SN560 SDDPNQE-1T00
42.24 MB/s -25%
4K Write
Beelink SER9 Pro
Crucial P3 Plus CT1000P3PSSD8
219.87 MB/s +13%
MSI Cubi NUC 1M
WD PC SN560 SDDPNQE-1T00
217.48 MB/s +11%
MSI Cubi NUC AI+ 2MG
 
195.18 MB/s
GMK NucBox K12
Crucial P3 Plus CT1000P3PSSD8
190.38 MB/s -2%
Minisforum MS-A1
Kingston OM8PGP41024Q-A0
178.8 MB/s -8%
Ninkear M7, (16+512)
Faspeed P8-512G-SE
96.3 MB/s -51%
4K-64 Read
Minisforum MS-A1
Kingston OM8PGP41024Q-A0
2409 MB/s +262%
Ninkear M7, (16+512)
Faspeed P8-512G-SE
1415 MB/s +113%
MSI Cubi NUC 1M
WD PC SN560 SDDPNQE-1T00
967.82 MB/s +46%
Beelink SER9 Pro
Crucial P3 Plus CT1000P3PSSD8
688.04 MB/s +4%
MSI Cubi NUC AI+ 2MG
 
664.75 MB/s
GMK NucBox K12
Crucial P3 Plus CT1000P3PSSD8
653.44 MB/s -2%
4K-64 Write
Minisforum MS-A1
Kingston OM8PGP41024Q-A0
3492 MB/s +1219%
Beelink SER9 Pro
Crucial P3 Plus CT1000P3PSSD8
1707.34 MB/s +545%
GMK NucBox K12
Crucial P3 Plus CT1000P3PSSD8
1572.62 MB/s +494%
Ninkear M7, (16+512)
Faspeed P8-512G-SE
1107 MB/s +318%
MSI Cubi NUC AI+ 2MG
 
264.78 MB/s
MSI Cubi NUC 1M
WD PC SN560 SDDPNQE-1T00
172.85 MB/s -35%
Access Time Read
Ninkear M7, (16+512)
Faspeed P8-512G-SE
0.084 ms * -22%
MSI Cubi NUC 1M
WD PC SN560 SDDPNQE-1T00
0.072 ms * -4%
MSI Cubi NUC AI+ 2MG
 
0.069 ms *
Minisforum MS-A1
Kingston OM8PGP41024Q-A0
0.066 ms * +4%
Beelink SER9 Pro
Crucial P3 Plus CT1000P3PSSD8
0.049 ms * +29%
GMK NucBox K12
Crucial P3 Plus CT1000P3PSSD8
0.048 ms * +30%
Access Time Write
Ninkear M7, (16+512)
Faspeed P8-512G-SE
0.102 ms * -82%
GMK NucBox K12
Crucial P3 Plus CT1000P3PSSD8
0.097 ms * -73%
MSI Cubi NUC 1M
WD PC SN560 SDDPNQE-1T00
0.088 ms * -57%
Beelink SER9 Pro
Crucial P3 Plus CT1000P3PSSD8
0.088 ms * -57%
MSI Cubi NUC AI+ 2MG
 
0.056 ms *
Minisforum MS-A1
Kingston OM8PGP41024Q-A0
0.032 ms * +43%

* ... mindre är bättre

Diskbegränsning: DiskSpd läsloop, ködjup 8

02955908851180147517702065236026552950324535403835413044254720501553105605Tooltip
MSI Cubi NUC AI+ 2MG  ; diskspd 2.0.17 f: Ø5848 (4659.57-5878.32)
MSI Cubi NUC 1M WD PC SN560 SDDPNQE-1T00; diskspd 2.0.17 f: Ø4962 (4554.8-4986.07)

GPU-prestanda

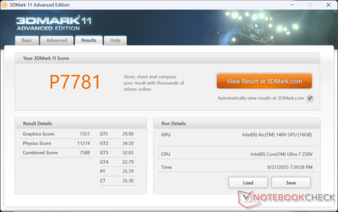
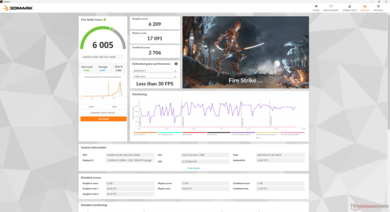
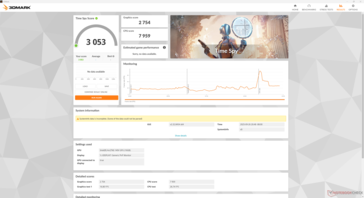
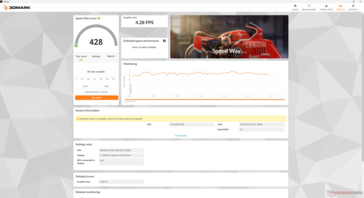
Bågen Arc 140V i Cubi 2MG presterar under genomsnittet med cirka 35 procent enligt 3DMark benchmarks. De nedslående resultaten beror på de cyklande GPU-klockfrekvenserna och stuttering som nämns i vårt avsnitt om stresstest ovan.

I GPU-arbetsbelastningar där stabila bildfrekvenser kanske inte spelar någon roll, t.ex. med renderingsprogram eller oneAPI, presterar Cubi 2MG som förväntat i förhållande till andra datorer med samma CPU och GPU. Stamningen bör därför vara en icke-fråga för de flesta professionella målgrupper.

3DMark 11
3DMark 11
Fire Strike
Fire Strike
Time Spy
Time Spy
Speed Way
Speed Way
3DMark Performance rating - Percent
Genomsnitt Intel Arc Graphics 140V
 
94.2 pt
Beelink SER9 Pro
AMD Radeon 780M, AMD Ryzen 7 H 255
93 pt
Asus NUC 14 Pro+
Intel Arc 8-Core iGPU, Intel Core Ultra 9 185H
88.8 pt
Minisforum MS-A1
AMD Radeon 780M, AMD Ryzen 7 8700G
85.1 pt
MSI Cubi NUC AI+ 2MG
Intel Arc Graphics 140V, Intel Core Ultra 7 258V
70.2 pt
Intel NUC 13 Pro Kit NUC13ANK
Intel Iris Xe Graphics G7 96EUs, Intel Core i7-1360P
49.5 pt
MSI Cubi NUC 1M
Intel Iris Xe Graphics G7 96EUs, Intel Core 7 150U
46.4 pt
GMK NucBox M5
AMD Radeon RX Vega 8 (Ryzen 4000/5000), AMD Ryzen 7 5700U
37.9 pt
Ninkear M7, (16+512)
AMD Radeon RX Vega 7, AMD Ryzen 5 7430U
26.2 pt
Asus NUC 14 Essential
Intel UHD Graphics 32EUs (Alder Lake), Intel Core 3 N355
21.2 pt
BMAX B4 Turbo
Intel UHD Graphics 24EUs (Alder Lake-N), Intel Processor N150
14.2 pt
3DMark 11 - 1280x720 Performance GPU
Beelink SER9 Pro
AMD Radeon 780M, AMD Ryzen 7 H 255
14312 Points +95%
Minisforum MS-A1
AMD Radeon 780M, AMD Ryzen 7 8700G
13248 Points +80%
Asus NUC 14 Pro+
Intel Arc 8-Core iGPU, Intel Core Ultra 9 185H
13163 Points +79%
Genomsnitt Intel Arc Graphics 140V
  (7351 - 12772, n=34)
11309 Points +54%
MSI Cubi NUC AI+ 2MG
Intel Arc Graphics 140V, Intel Core Ultra 7 258V
7351 Points
Intel NUC 13 Pro Kit NUC13ANK
Intel Iris Xe Graphics G7 96EUs, Intel Core i7-1360P
7143 Points -3%
MSI Cubi NUC 1M
Intel Iris Xe Graphics G7 96EUs, Intel Core 7 150U
6282 Points -15%
GMK NucBox M5
AMD Radeon RX Vega 8 (Ryzen 4000/5000), AMD Ryzen 7 5700U
5388 Points -27%
Ninkear M7, (16+512)
AMD Radeon RX Vega 7, AMD Ryzen 5 7430U
4273 Points -42%
Asus NUC 14 Essential
Intel UHD Graphics 32EUs (Alder Lake), Intel Core 3 N355
2901 Points -61%
BMAX B4 Turbo
Intel UHD Graphics 24EUs (Alder Lake-N), Intel Processor N150
1872 Points -75%
3DMark
1280x720 Cloud Gate Standard Graphics
Beelink SER9 Pro
AMD Radeon 780M, AMD Ryzen 7 H 255
54549 Points +7%
Genomsnitt Intel Arc Graphics 140V
  (38542 - 61591, n=17)
53397 Points +5%
MSI Cubi NUC AI+ 2MG
Intel Arc Graphics 140V, Intel Core Ultra 7 258V
51042 Points
Minisforum MS-A1
AMD Radeon 780M, AMD Ryzen 7 8700G
48717 Points -5%
Asus NUC 14 Pro+
Intel Arc 8-Core iGPU, Intel Core Ultra 9 185H
47040 Points -8%
MSI Cubi NUC 1M
Intel Iris Xe Graphics G7 96EUs, Intel Core 7 150U
29301 Points -43%
Intel NUC 13 Pro Kit NUC13ANK
Intel Iris Xe Graphics G7 96EUs, Intel Core i7-1360P
27511 Points -46%
GMK NucBox M5
AMD Radeon RX Vega 8 (Ryzen 4000/5000), AMD Ryzen 7 5700U
25003 Points -51%
Ninkear M7, (16+512)
AMD Radeon RX Vega 7, AMD Ryzen 5 7430U
16820 Points -67%
Asus NUC 14 Essential
Intel UHD Graphics 32EUs (Alder Lake), Intel Core 3 N355
14227 Points -72%
BMAX B4 Turbo
Intel UHD Graphics 24EUs (Alder Lake-N), Intel Processor N150
10356 Points -80%
1920x1080 Fire Strike Graphics
Genomsnitt Intel Arc Graphics 140V
  (6209 - 10476, n=34)
9484 Points +53%
Beelink SER9 Pro
AMD Radeon 780M, AMD Ryzen 7 H 255
8875 Points +43%
Asus NUC 14 Pro+
Intel Arc 8-Core iGPU, Intel Core Ultra 9 185H
8396 Points +35%
Minisforum MS-A1
AMD Radeon 780M, AMD Ryzen 7 8700G
8061 Points +30%
MSI Cubi NUC AI+ 2MG
Intel Arc Graphics 140V, Intel Core Ultra 7 258V
6209 Points
Intel NUC 13 Pro Kit NUC13ANK
Intel Iris Xe Graphics G7 96EUs, Intel Core i7-1360P
5229 Points -16%
MSI Cubi NUC 1M
Intel Iris Xe Graphics G7 96EUs, Intel Core 7 150U
4899 Points -21%
GMK NucBox M5
AMD Radeon RX Vega 8 (Ryzen 4000/5000), AMD Ryzen 7 5700U
3653 Points -41%
Ninkear M7, (16+512)
AMD Radeon RX Vega 7, AMD Ryzen 5 7430U
2404 Points -61%
Asus NUC 14 Essential
Intel UHD Graphics 32EUs (Alder Lake), Intel Core 3 N355
2139 Points -66%
BMAX B4 Turbo
Intel UHD Graphics 24EUs (Alder Lake-N), Intel Processor N150
1367 Points -78%
2560x1440 Time Spy Graphics
Genomsnitt Intel Arc Graphics 140V
  (2754 - 4415, n=37)
3922 Points +42%
Asus NUC 14 Pro+
Intel Arc 8-Core iGPU, Intel Core Ultra 9 185H
3476 Points +26%
Beelink SER9 Pro
AMD Radeon 780M, AMD Ryzen 7 H 255
3077 Points +12%
Minisforum MS-A1
AMD Radeon 780M, AMD Ryzen 7 8700G
2890 Points +5%
MSI Cubi NUC AI+ 2MG
Intel Arc Graphics 140V, Intel Core Ultra 7 258V
2754 Points
Intel NUC 13 Pro Kit NUC13ANK
Intel Iris Xe Graphics G7 96EUs, Intel Core i7-1360P
1673 Points -39%
MSI Cubi NUC 1M
Intel Iris Xe Graphics G7 96EUs, Intel Core 7 150U
1428 Points -48%
GMK NucBox M5
AMD Radeon RX Vega 8 (Ryzen 4000/5000), AMD Ryzen 7 5700U
1162 Points -58%
Ninkear M7, (16+512)
AMD Radeon RX Vega 7, AMD Ryzen 5 7430U
741 Points -73%
Asus NUC 14 Essential
Intel UHD Graphics 32EUs (Alder Lake), Intel Core 3 N355
625 Points -77%
BMAX B4 Turbo
Intel UHD Graphics 24EUs (Alder Lake-N), Intel Processor N150
401 Points -85%
3DMark 11 Performance
7781 poäng
3DMark Cloud Gate Standard Score
31534 poäng
3DMark Fire Strike Score
6005 poäng
3DMark Time Spy Score
3053 poäng
Hjälp
Blender
v3.3 Classroom CPU
BMAX B4 Turbo
Intel UHD Graphics 24EUs (Alder Lake-N), Intel Processor N150
2429 Seconds *
Asus NUC 14 Essential
Intel UHD Graphics 32EUs (Alder Lake), Intel Core 3 N355
1121 Seconds *
Ninkear M7, (16+512)
AMD Radeon RX Vega 7, AMD Ryzen 5 7430U
854 Seconds *
MSI Cubi NUC 1M
Intel Iris Xe Graphics G7 96EUs, Intel Core 7 150U
829 Seconds *
GMK NucBox M5
AMD Radeon RX Vega 8 (Ryzen 4000/5000), AMD Ryzen 7 5700U
758 Seconds *
Genomsnitt Intel Arc Graphics 140V
  (506 - 772, n=33)
592 Seconds *
Intel NUC 13 Pro Kit NUC13ANK
Intel Iris Xe Graphics G7 96EUs, Intel Core i7-1360P
464 Seconds *
Asus NUC 14 Pro+
Intel Arc 8-Core iGPU, Intel Core Ultra 9 185H
326 Seconds *
Beelink SER9 Pro
AMD Radeon 780M, AMD Ryzen 7 H 255
315 Seconds *
Minisforum MS-A1
AMD Radeon 780M, AMD Ryzen 7 8700G
300 Seconds *
v3.3 Classroom oneAPI/Intel
MSI Cubi NUC AI+ 2MG
Intel Arc Graphics 140V, Intel Core Ultra 7 258V
278 Seconds *
Genomsnitt Intel Arc Graphics 140V
  (195 - 405, n=21)
246 Seconds * +12%
Asus NUC 14 Pro+
Intel Arc 8-Core iGPU, Intel Core Ultra 9 185H
215 Seconds * +23%
v4.3 Barbershop CPU
BMAX B4 Turbo
Intel UHD Graphics 24EUs (Alder Lake-N), Intel Processor N150
12596 Seconds * -360%
Ninkear M7, (16+512)
AMD Radeon RX Vega 7, AMD Ryzen 5 7430U
4229 Seconds * -54%
Genomsnitt Intel Arc Graphics 140V
  (2608 - 3811, n=12)
3060 Seconds * -12%
MSI Cubi NUC AI+ 2MG
Intel Arc Graphics 140V, Intel Core Ultra 7 258V
2741 Seconds *
Beelink SER9 Pro
AMD Radeon 780M, AMD Ryzen 7 H 255
1528 Seconds * +44%
Minisforum MS-A1
AMD Radeon 780M, AMD Ryzen 7 8700G
1449 Seconds * +47%
v4.3 Barbershop oneAPI
MSI Cubi NUC AI+ 2MG
Intel Arc Graphics 140V, Intel Core Ultra 7 258V
914 Seconds *
Genomsnitt Intel Arc Graphics 140V
  (760 - 962, n=16)
862 Seconds * +6%

* ... mindre är bättre

Performance rating - Percent
Beelink SER9 Pro
AMD Ryzen 7 H 255, AMD Radeon 780M
95.5 pt
Minisforum MS-A1 -1!
AMD Ryzen 7 8700G, AMD Radeon 780M
95.1 pt
GMK NucBox K12
AMD Ryzen 7 H 255, AMD Radeon 780M
93.9 pt
MSI Cubi NUC AI+ 2MG
Intel Core Ultra 7 258V, Intel Arc Graphics 140V
90 pt
MSI Cubi NUC 1M -2!
Intel Core 7 150U, Intel Iris Xe Graphics G7 96EUs
47.9 pt
Ninkear M7, (16+512) -2!
AMD Ryzen 5 7430U, AMD Radeon RX Vega 7
30.4 pt
Cyberpunk 2077 2.2 Phantom Liberty - 1920x1080 Ultra Preset (FSR off)
GMK NucBox K12
AMD Ryzen 7 H 255, AMD Radeon 780M
23.6 (19.9min, 16.3P1) fps +22%
Minisforum MS-A1
AMD Ryzen 7 8700G, AMD Radeon 780M
23.4 (19.7min) fps +21%
Beelink SER9 Pro
AMD Ryzen 7 H 255, AMD Radeon 780M
22.6 (18.8min, 6.53P1) fps +16%
MSI Cubi NUC AI+ 2MG
Intel Core Ultra 7 258V, Intel Arc Graphics 140V
19.4 (11min, 10.1P1) fps
MSI Cubi NUC 1M
Intel Core 7 150U, Intel Iris Xe Graphics G7 96EUs
9.46 (7.99min) fps -51%
Ninkear M7, (16+512)
AMD Ryzen 5 7430U, AMD Radeon RX Vega 7
4.95 (4.26min) fps -74%
Baldur's Gate 3 - 1920x1080 Ultra Preset AA:T
Beelink SER9 Pro
AMD Ryzen 7 H 255, AMD Radeon 780M
26.9 fps +1%
GMK NucBox K12
AMD Ryzen 7 H 255, AMD Radeon 780M
26.7 fps 0%
MSI Cubi NUC AI+ 2MG
Intel Core Ultra 7 258V, Intel Arc Graphics 140V
26.7 fps
Minisforum MS-A1
AMD Ryzen 7 8700G, AMD Radeon 780M
26 (13.8min, 14.3P0.1, 22.5P1) fps -3%
GTA V - 1920x1080 Highest Settings possible AA:4xMSAA + FX AF:16x
Beelink SER9 Pro
AMD Ryzen 7 H 255, AMD Radeon 780M
29.1 (7.19min, 20.4P1) fps +9%
GMK NucBox K12
AMD Ryzen 7 H 255, AMD Radeon 780M
27.8 (3.22min, 18.9P1) fps +5%
MSI Cubi NUC AI+ 2MG
Intel Core Ultra 7 258V, Intel Arc Graphics 140V
26.6 (9.34min, 11.4P1) fps
Minisforum MS-A1
AMD Ryzen 7 8700G, AMD Radeon 780M
24.6 (1.758min, 16.9P1) fps -8%
MSI Cubi NUC 1M
Intel Core 7 150U, Intel Iris Xe Graphics G7 96EUs
9.98 (4.2min, 6.21P1) fps -62%
Ninkear M7, (16+512)
AMD Ryzen 5 7430U, AMD Radeon RX Vega 7
7.06 (4.22min, 5.1P1) fps -73%
Final Fantasy XV Benchmark - 1920x1080 High Quality
Beelink SER9 Pro
AMD Ryzen 7 H 255, AMD Radeon 780M
30.5 fps +6%
MSI Cubi NUC AI+ 2MG
Intel Core Ultra 7 258V, Intel Arc Graphics 140V
28.7 fps
Minisforum MS-A1
AMD Ryzen 7 8700G, AMD Radeon 780M
27.6 fps -4%
GMK NucBox K12
AMD Ryzen 7 H 255, AMD Radeon 780M
27.6 fps -4%
MSI Cubi NUC 1M
Intel Core 7 150U, Intel Iris Xe Graphics G7 96EUs
16.6 fps -42%
Ninkear M7, (16+512)
AMD Ryzen 5 7430U, AMD Radeon RX Vega 7
7.62 fps -73%
Strange Brigade - 1920x1080 ultra AA:ultra AF:16
MSI Cubi NUC AI+ 2MG
Intel Core Ultra 7 258V, Intel Arc Graphics 140V
57.3 (18min, 27.8P1) fps
Beelink SER9 Pro
AMD Ryzen 7 H 255, AMD Radeon 780M
53.4 (33.1min, 40.4P1) fps -7%
GMK NucBox K12
AMD Ryzen 7 H 255, AMD Radeon 780M
49.5 (33.1min, 38.6P1) fps -14%
MSI Cubi NUC 1M
Intel Core 7 150U, Intel Iris Xe Graphics G7 96EUs
25.2 (5.3min, 6.89P1) fps -56%
Dota 2 Reborn - 1920x1080 ultra (3/3) best looking
Minisforum MS-A1
AMD Ryzen 7 8700G, AMD Radeon 780M
86.5 (77.2min) fps +31%
GMK NucBox K12
AMD Ryzen 7 H 255, AMD Radeon 780M
81.5 (71.5min) fps +24%
Beelink SER9 Pro
AMD Ryzen 7 H 255, AMD Radeon 780M
78.1 (66.9min) fps +19%
MSI Cubi NUC AI+ 2MG
Intel Core Ultra 7 258V, Intel Arc Graphics 140V
65.8 (32.9min) fps
MSI Cubi NUC 1M
Intel Core 7 150U, Intel Iris Xe Graphics G7 96EUs
57.8 (39.9min) fps -12%
Ninkear M7, (16+512)
AMD Ryzen 5 7430U, AMD Radeon RX Vega 7
32.5 (29.2min) fps -51%
X-Plane 11.11 - 1920x1080 high (fps_test=3)
Minisforum MS-A1
AMD Ryzen 7 8700G, AMD Radeon 780M
41.5 fps +15%
GMK NucBox K12
AMD Ryzen 7 H 255, AMD Radeon 780M
38 fps +6%
Beelink SER9 Pro
AMD Ryzen 7 H 255, AMD Radeon 780M
37 fps +3%
MSI Cubi NUC AI+ 2MG
Intel Core Ultra 7 258V, Intel Arc Graphics 140V
36 fps
Ninkear M7, (16+512)
AMD Ryzen 5 7430U, AMD Radeon RX Vega 7
18.3 fps -49%
Baldur's Gate 3
1280x720 Low Preset AA:SM
Minisforum MS-A1
AMD Ryzen 7 8700G, AMD Radeon 780M
65.9 (33.4min, 33.9P0.1, 36.6P1) fps +14%
Beelink SER9 Pro
AMD Ryzen 7 H 255, AMD Radeon 780M
61 fps +6%
Genomsnitt Intel Arc Graphics 140V
  (49.3 - 73.3, n=17)
59.6 fps +3%
MSI Cubi NUC AI+ 2MG
Intel Core Ultra 7 258V, Intel Arc Graphics 140V
57.6 fps
Asus NUC 14 Pro+
Intel Core Ultra 9 185H, Intel Arc 8-Core iGPU
56.4 (29min, 30.5P0.1, 37.9P1) fps -2%
MSI Cubi NUC 1M
Intel Core 7 150U, Intel Iris Xe Graphics G7 96EUs
22.9 fps -60%
GMK NucBox M5
AMD Ryzen 7 5700U, AMD Radeon RX Vega 8 (Ryzen 4000/5000)
22.5 fps -61%
Ninkear M7, (16+512)
AMD Ryzen 5 7430U, AMD Radeon RX Vega 7
16.1 (11.9min, 12.3P0.1, 13.1P1) fps -72%
1920x1080 Low Preset AA:SM
Minisforum MS-A1
AMD Ryzen 7 8700G, AMD Radeon 780M
42.5 (20.1min, 21.1P0.1, 35.7P1) fps +18%
Beelink SER9 Pro
AMD Ryzen 7 H 255, AMD Radeon 780M
40.8 fps +13%
Genomsnitt Intel Arc Graphics 140V
  (23.7 - 47, n=34)
39.2 fps +9%
Asus NUC 14 Pro+
Intel Core Ultra 9 185H, Intel Arc 8-Core iGPU
37.9 (22.7min, 23.2P0.1, 26.9P1) fps +5%
MSI Cubi NUC AI+ 2MG
Intel Core Ultra 7 258V, Intel Arc Graphics 140V
36.1 fps
MSI Cubi NUC 1M
Intel Core 7 150U, Intel Iris Xe Graphics G7 96EUs
15.3 fps -58%
GMK NucBox M5
AMD Ryzen 7 5700U, AMD Radeon RX Vega 8 (Ryzen 4000/5000)
14.2 fps -61%
Ninkear M7, (16+512)
AMD Ryzen 5 7430U, AMD Radeon RX Vega 7
9.77 (7.8min, 7.81P0.1, 8.12P1) fps -73%
1920x1080 Medium Preset AA:T
Beelink SER9 Pro
AMD Ryzen 7 H 255, AMD Radeon 780M
33.5 fps +14%
Minisforum MS-A1
AMD Ryzen 7 8700G, AMD Radeon 780M
32.7 (16.3min, 16.7P0.1, 17.9P1) fps +11%
Genomsnitt Intel Arc Graphics 140V
  (19.6 - 37, n=35)
31.5 fps +7%
Asus NUC 14 Pro+
Intel Core Ultra 9 185H, Intel Arc 8-Core iGPU
29.7 (17.5min, 18.4P0.1, 19.7P1) fps +1%
MSI Cubi NUC AI+ 2MG
Intel Core Ultra 7 258V, Intel Arc Graphics 140V
29.5 fps
Ninkear M7, (16+512)
AMD Ryzen 5 7430U, AMD Radeon RX Vega 7
7.12 (5.44min, 5.53P0.1, 5.83P1) fps -76%
1920x1080 High Preset AA:T
MSI Cubi NUC AI+ 2MG
Intel Core Ultra 7 258V, Intel Arc Graphics 140V
29 fps
Genomsnitt Intel Arc Graphics 140V
  (17 - 32.9, n=35)
28 fps -3%
Beelink SER9 Pro
AMD Ryzen 7 H 255, AMD Radeon 780M
27.1 fps -7%
Minisforum MS-A1
AMD Ryzen 7 8700G, AMD Radeon 780M
27 (14min, 14.4P0.1, 22.7P1) fps -7%
Asus NUC 14 Pro+
Intel Core Ultra 9 185H, Intel Arc 8-Core iGPU
25.2 (14.5min, 14.6P0.1, 16.2P1) fps -13%
Ninkear M7, (16+512)
AMD Ryzen 5 7430U, AMD Radeon RX Vega 7
5.93 (4.67min, 4.68P0.1, 4.95P1) fps -80%
1920x1080 Ultra Preset AA:T
Genomsnitt Intel Arc Graphics 140V
  (16.6 - 32.2, n=35)
27 fps +1%
Beelink SER9 Pro
AMD Ryzen 7 H 255, AMD Radeon 780M
26.9 fps +1%
MSI Cubi NUC AI+ 2MG
Intel Core Ultra 7 258V, Intel Arc Graphics 140V
26.7 fps
Minisforum MS-A1
AMD Ryzen 7 8700G, AMD Radeon 780M
26 (13.8min, 14.3P0.1, 22.5P1) fps -3%
Asus NUC 14 Pro+
Intel Core Ultra 9 185H, Intel Arc 8-Core iGPU
24.4 (8.14min, 11.8P0.1, 15.7P1) fps -9%
GTA V
1024x768 Lowest Settings possible
Minisforum MS-A1
AMD Ryzen 7 8700G, AMD Radeon 780M
164.1 (4.56min, 100P1) fps +2%
Asus NUC 14 Pro+
Intel Core Ultra 9 185H, Intel Arc 8-Core iGPU
162.9 (3.78min, 111.1P1) fps +2%
MSI Cubi NUC AI+ 2MG
Intel Core Ultra 7 258V, Intel Arc Graphics 140V
160.4 (4.6min, 100P1) fps
Beelink SER9 Pro
AMD Ryzen 7 H 255, AMD Radeon 780M
158.4 (4.27min, 90.9P1) fps -1%
Genomsnitt Intel Arc Graphics 140V
  (110.5 - 167.4, n=31)
149.2 fps -7%
Intel NUC 13 Pro Kit NUC13ANK
Intel Core i7-1360P, Intel Iris Xe Graphics G7 96EUs
126.2 (50.6min, 76.9P1) fps -21%
MSI Cubi NUC 1M
Intel Core 7 150U, Intel Iris Xe Graphics G7 96EUs
100.3 (39.9min, 62.5P1) fps -37%
Asus NUC 14 Essential
Intel Core 3 N355, Intel UHD Graphics 32EUs (Alder Lake)
69.6 (9.06min, 41.7P1) fps -57%
Ninkear M7, (16+512)
AMD Ryzen 5 7430U, AMD Radeon RX Vega 7
66.5 (14.7min, 45.5P1) fps -59%
BMAX B4 Turbo
Intel Processor N150, Intel UHD Graphics 24EUs (Alder Lake-N)
51.6 (0.815min, 26.3P1) fps -68%
1920x1080 Lowest Settings possible
MSI Cubi NUC AI+ 2MG
Intel Core Ultra 7 258V, Intel Arc Graphics 140V
151 (4.26min, 58.8P1) fps
Genomsnitt Intel Arc Graphics 140V
  (110.7 - 158.4, n=16)
140.1 fps -7%
Beelink SER9 Pro
AMD Ryzen 7 H 255, AMD Radeon 780M
129.9 (25min, 83.3P1) fps -14%
Asus NUC 14 Pro+
Intel Core Ultra 9 185H, Intel Arc 8-Core iGPU
124.8 (38.5min, 83.3P1) fps -17%
Minisforum MS-A1
AMD Ryzen 7 8700G, AMD Radeon 780M
119.9 (4.07min, 76.9P1) fps -21%
Intel NUC 13 Pro Kit NUC13ANK
Intel Core i7-1360P, Intel Iris Xe Graphics G7 96EUs
86.4 (9.46min, 58.8P1) fps -43%
MSI Cubi NUC 1M
Intel Core 7 150U, Intel Iris Xe Graphics G7 96EUs
78.6 (26min, 50P1) fps -48%
Asus NUC 14 Essential
Intel Core 3 N355, Intel UHD Graphics 32EUs (Alder Lake)
44.2 (9.37min, 32.3P1) fps -71%
Ninkear M7, (16+512)
AMD Ryzen 5 7430U, AMD Radeon RX Vega 7
36.7 (11.9min, 25.6P1) fps -76%
1366x768 Normal/Off AF:4x
Asus NUC 14 Pro+
Intel Core Ultra 9 185H, Intel Arc 8-Core iGPU
154.1 (4.46min, 100P1) fps +1%
Minisforum MS-A1
AMD Ryzen 7 8700G, AMD Radeon 780M
152.6 (5.62min, 100P1) fps 0%
MSI Cubi NUC AI+ 2MG
Intel Core Ultra 7 258V, Intel Arc Graphics 140V
152.4 (3.6min, 90.9P1) fps
Beelink SER9 Pro
AMD Ryzen 7 H 255, AMD Radeon 780M
144.9 (6.19min, 83.3P1) fps -5%
Genomsnitt Intel Arc Graphics 140V
  (91.1 - 155.6, n=30)
139.2 fps -9%
Intel NUC 13 Pro Kit NUC13ANK
Intel Core i7-1360P, Intel Iris Xe Graphics G7 96EUs
107.3 (19min, 62.5P1) fps -30%
MSI Cubi NUC 1M
Intel Core 7 150U, Intel Iris Xe Graphics G7 96EUs
86.1 (7.7min, 50P1) fps -44%
Asus NUC 14 Essential
Intel Core 3 N355, Intel UHD Graphics 32EUs (Alder Lake)
59.8 (12.2min, 35.7P1) fps -61%
Ninkear M7, (16+512)
AMD Ryzen 5 7430U, AMD Radeon RX Vega 7
57.5 (12.1min, 37P1) fps -62%
1920x1080 Normal/Off AF:4x
MSI Cubi NUC AI+ 2MG
Intel Core Ultra 7 258V, Intel Arc Graphics 140V
145 (4.16min, 58.8P1) fps
Genomsnitt Intel Arc Graphics 140V
  (104.4 - 152, n=17)
130 fps -10%
Beelink SER9 Pro
AMD Ryzen 7 H 255, AMD Radeon 780M
127.5 (23min, 76.9P1) fps -12%
Minisforum MS-A1
AMD Ryzen 7 8700G, AMD Radeon 780M
124 (11.3min, 83.3P1) fps -14%
Asus NUC 14 Pro+
Intel Core Ultra 9 185H, Intel Arc 8-Core iGPU
112.9 (17.1min, 76.9P1) fps -22%
Intel NUC 13 Pro Kit NUC13ANK
Intel Core i7-1360P, Intel Iris Xe Graphics G7 96EUs
75.9 (6.19min, 50P1) fps -48%
MSI Cubi NUC 1M
Intel Core 7 150U, Intel Iris Xe Graphics G7 96EUs
71 (6.44min, 40P1) fps -51%
Asus NUC 14 Essential
Intel Core 3 N355, Intel UHD Graphics 32EUs (Alder Lake)
41 (9.08min, 30.3P1) fps -72%
Ninkear M7, (16+512)
AMD Ryzen 5 7430U, AMD Radeon RX Vega 7
38.2 (11.4min, 26.3P1) fps -74%
1920x1080 High/On (Advanced Graphics Off) AA:2xMSAA + FX AF:8x
Beelink SER9 Pro
AMD Ryzen 7 H 255, AMD Radeon 780M
69.4 (9.45min, 47.6P1) fps +9%
MSI Cubi NUC AI+ 2MG
Intel Core Ultra 7 258V, Intel Arc Graphics 140V
63.6 (8.99min, 25.6P1) fps
Minisforum MS-A1
AMD Ryzen 7 8700G, AMD Radeon 780M
61.9 (2.97min, 41.7P1) fps -3%
Genomsnitt Intel Arc Graphics 140V
  (32 - 76.3, n=28)
60.9 fps -4%
Asus NUC 14 Pro+
Intel Core Ultra 9 185H, Intel Arc 8-Core iGPU
40.6 (3.3min, 30.3P1) fps -36%
MSI Cubi NUC 1M
Intel Core 7 150U, Intel Iris Xe Graphics G7 96EUs
23.6 (8.96min, 17.2P1) fps -63%
Intel NUC 13 Pro Kit NUC13ANK
Intel Core i7-1360P, Intel Iris Xe Graphics G7 96EUs
20.7 (9.05min, 15.9P1) fps -67%
Ninkear M7, (16+512)
AMD Ryzen 5 7430U, AMD Radeon RX Vega 7
14.6 (4.62min, 10.3P1) fps -77%
Asus NUC 14 Essential
Intel Core 3 N355, Intel UHD Graphics 32EUs (Alder Lake)
9.86 (3.77min, 7.52P1) fps -84%
1920x1080 Highest Settings possible AA:4xMSAA + FX AF:16x
Beelink SER9 Pro
AMD Ryzen 7 H 255, AMD Radeon 780M
29.1 (7.19min, 20.4P1) fps +9%
MSI Cubi NUC AI+ 2MG
Intel Core Ultra 7 258V, Intel Arc Graphics 140V
26.6 (9.34min, 11.4P1) fps
Genomsnitt Intel Arc Graphics 140V
  (15.4 - 29, n=29)
25.9 fps -3%
Minisforum MS-A1
AMD Ryzen 7 8700G, AMD Radeon 780M
24.6 (1.758min, 16.9P1) fps -8%
Asus NUC 14 Pro+
Intel Core Ultra 9 185H, Intel Arc 8-Core iGPU
15.8 (3.06min, 12P1) fps -41%
MSI Cubi NUC 1M
Intel Core 7 150U, Intel Iris Xe Graphics G7 96EUs
9.98 (4.2min, 6.21P1) fps -62%
Ninkear M7, (16+512)
AMD Ryzen 5 7430U, AMD Radeon RX Vega 7
7.06 (4.22min, 5.1P1) fps -73%
Asus NUC 14 Essential
Intel Core 3 N355, Intel UHD Graphics 32EUs (Alder Lake)
4.42 (2.04min, 2.78P1) fps -83%
Dota 2 Reborn
1280x720 min (0/3) fastest
Minisforum MS-A1
AMD Ryzen 7 8700G, AMD Radeon 780M
164.8 (145.3min) fps +68%
Beelink SER9 Pro
AMD Ryzen 7 H 255, AMD Radeon 780M
134.5 (121.1min) fps +37%
Intel NUC 13 Pro Kit NUC13ANK
Intel Core i7-1360P, Intel Iris Xe Graphics G7 96EUs
123.8 (98min) fps +26%
Asus NUC 14 Pro+
Intel Core Ultra 9 185H, Intel Arc 8-Core iGPU
104.7 (61.7min) fps +7%
Ninkear M7, (16+512)
AMD Ryzen 5 7430U, AMD Radeon RX Vega 7
101.5 (86.1min) fps +3%
GMK NucBox M5
AMD Ryzen 7 5700U, AMD Radeon RX Vega 8 (Ryzen 4000/5000)
99.7 (85.3min) fps +2%
Genomsnitt Intel Arc Graphics 140V
  (86.2 - 116.9, n=38)
99.1 fps +1%
MSI Cubi NUC AI+ 2MG
Intel Core Ultra 7 258V, Intel Arc Graphics 140V
98.1 (63.6min) fps
MSI Cubi NUC 1M
Intel Core 7 150U, Intel Iris Xe Graphics G7 96EUs
97.7 (57.3min) fps 0%
Asus NUC 14 Essential
Intel Core 3 N355, Intel UHD Graphics 32EUs (Alder Lake)
70.4 (52.2min) fps -28%
BMAX B4 Turbo
Intel Processor N150, Intel UHD Graphics 24EUs (Alder Lake-N)
58.3 (44.4min) fps -41%
1366x768 med (1/3)
Minisforum MS-A1
AMD Ryzen 7 8700G, AMD Radeon 780M
130.2 (106.6min) fps +62%
Beelink SER9 Pro
AMD Ryzen 7 H 255, AMD Radeon 780M
102 (87.3min) fps +27%
Intel NUC 13 Pro Kit NUC13ANK
Intel Core i7-1360P, Intel Iris Xe Graphics G7 96EUs
93.9 (77.2min) fps +17%
Genomsnitt Intel Arc Graphics 140V
  (55.8 - 101.7, n=38)
82.2 fps +2%
GMK NucBox M5
AMD Ryzen 7 5700U, AMD Radeon RX Vega 8 (Ryzen 4000/5000)
80.6 (61.8min) fps 0%
MSI Cubi NUC AI+ 2MG
Intel Core Ultra 7 258V, Intel Arc Graphics 140V
80.4 (44.8min) fps
Asus NUC 14 Pro+
Intel Core Ultra 9 185H, Intel Arc 8-Core iGPU
78 (58.5min) fps -3%
Ninkear M7, (16+512)
AMD Ryzen 5 7430U, AMD Radeon RX Vega 7
71.6 (59.8min) fps -11%
MSI Cubi NUC 1M
Intel Core 7 150U, Intel Iris Xe Graphics G7 96EUs
61.9 (45.9min) fps -23%
Asus NUC 14 Essential
Intel Core 3 N355, Intel UHD Graphics 32EUs (Alder Lake)
39.7 (26.3min) fps -51%
BMAX B4 Turbo
Intel Processor N150, Intel UHD Graphics 24EUs (Alder Lake-N)
32.2 (20.1min) fps -60%
1920x1080 high (2/3)
Minisforum MS-A1
AMD Ryzen 7 8700G, AMD Radeon 780M
95.9 (85.7min) fps +60%
Beelink SER9 Pro
AMD Ryzen 7 H 255, AMD Radeon 780M
90 (79min) fps +50%
Genomsnitt Intel Arc Graphics 140V
  (41.1 - 88.5, n=38)
71 fps +19%
Intel NUC 13 Pro Kit NUC13ANK
Intel Core i7-1360P, Intel Iris Xe Graphics G7 96EUs
67.6 (59.9min) fps +13%
MSI Cubi NUC 1M
Intel Core 7 150U, Intel Iris Xe Graphics G7 96EUs
62.5 (42.1min) fps +4%
MSI Cubi NUC AI+ 2MG
Intel Core Ultra 7 258V, Intel Arc Graphics 140V
59.9 (22.6min) fps
Asus NUC 14 Pro+
Intel Core Ultra 9 185H, Intel Arc 8-Core iGPU
54.8 (35.3min) fps -9%
GMK NucBox M5
AMD Ryzen 7 5700U, AMD Radeon RX Vega 8 (Ryzen 4000/5000)
50.5 (43.1min) fps -16%
Ninkear M7, (16+512)
AMD Ryzen 5 7430U, AMD Radeon RX Vega 7
36 (32.1min) fps -40%
Asus NUC 14 Essential
Intel Core 3 N355, Intel UHD Graphics 32EUs (Alder Lake)
34.9 (23.4min) fps -42%
BMAX B4 Turbo
Intel Processor N150, Intel UHD Graphics 24EUs (Alder Lake-N)
13.2 (4.8min) fps -78%
1920x1080 ultra (3/3) best looking
Minisforum MS-A1
AMD Ryzen 7 8700G, AMD Radeon 780M
86.5 (77.2min) fps +31%
Beelink SER9 Pro
AMD Ryzen 7 H 255, AMD Radeon 780M
78.1 (66.9min) fps +19%
Asus NUC 14 Pro+
Intel Core Ultra 9 185H, Intel Arc 8-Core iGPU
76 (33.1min) fps +16%
Genomsnitt Intel Arc Graphics 140V
  (33.3 - 93, n=38)
75.4 fps +15%
MSI Cubi NUC AI+ 2MG
Intel Core Ultra 7 258V, Intel Arc Graphics 140V
65.8 (32.9min) fps
Intel NUC 13 Pro Kit NUC13ANK
Intel Core i7-1360P, Intel Iris Xe Graphics G7 96EUs
61.6 (54.6min) fps -6%
MSI Cubi NUC 1M
Intel Core 7 150U, Intel Iris Xe Graphics G7 96EUs
57.8 (39.9min) fps -12%
GMK NucBox M5
AMD Ryzen 7 5700U, AMD Radeon RX Vega 8 (Ryzen 4000/5000)
47.6 (40.4min) fps -28%
Ninkear M7, (16+512)
AMD Ryzen 5 7430U, AMD Radeon RX Vega 7
32.5 (29.2min) fps -51%
Asus NUC 14 Essential
Intel Core 3 N355, Intel UHD Graphics 32EUs (Alder Lake)
32.1 (21.7min) fps -51%
BMAX B4 Turbo
Intel Processor N150, Intel UHD Graphics 24EUs (Alder Lake-N)
22.9 (14.8min) fps -65%
Final Fantasy XV Benchmark
1280x720 Lite Quality
Beelink SER9 Pro
AMD Ryzen 7 H 255, AMD Radeon 780M
84.9 fps +19%
Genomsnitt Intel Arc Graphics 140V
  (54.1 - 97.1, n=37)
82 fps +15%
Minisforum MS-A1
AMD Ryzen 7 8700G, AMD Radeon 780M
75.8 fps +6%
Asus NUC 14 Pro+
Intel Core Ultra 9 185H, Intel Arc 8-Core iGPU
75.3 fps +6%
MSI Cubi NUC AI+ 2MG
Intel Core Ultra 7 258V, Intel Arc Graphics 140V
71.3 fps
MSI Cubi NUC 1M
Intel Core 7 150U, Intel Iris Xe Graphics G7 96EUs
40.9 fps -43%
GMK NucBox M5
AMD Ryzen 7 5700U, AMD Radeon RX Vega 8 (Ryzen 4000/5000)
35.2 fps -51%
Ninkear M7, (16+512)
AMD Ryzen 5 7430U, AMD Radeon RX Vega 7
22.3 fps -69%
Asus NUC 14 Essential
Intel Core 3 N355, Intel UHD Graphics 32EUs (Alder Lake)
21.6 fps -70%
BMAX B4 Turbo
Intel Processor N150, Intel UHD Graphics 24EUs (Alder Lake-N)
15 fps -79%
1920x1080 Standard Quality
Genomsnitt Intel Arc Graphics 140V
  (31.6 - 87.6, n=38)
46.5 fps +19%
Beelink SER9 Pro
AMD Ryzen 7 H 255, AMD Radeon 780M
42.3 fps +8%
Asus NUC 14 Pro+
Intel Core Ultra 9 185H, Intel Arc 8-Core iGPU
40.2 fps +3%
MSI Cubi NUC AI+ 2MG
Intel Core Ultra 7 258V, Intel Arc Graphics 140V
39.1 fps
Minisforum MS-A1
AMD Ryzen 7 8700G, AMD Radeon 780M
37.4 fps -4%
MSI Cubi NUC 1M
Intel Core 7 150U, Intel Iris Xe Graphics G7 96EUs
23 fps -41%
GMK NucBox M5
AMD Ryzen 7 5700U, AMD Radeon RX Vega 8 (Ryzen 4000/5000)
18 fps -54%
Asus NUC 14 Essential
Intel Core 3 N355, Intel UHD Graphics 32EUs (Alder Lake)
11.6 fps -70%
Ninkear M7, (16+512)
AMD Ryzen 5 7430U, AMD Radeon RX Vega 7
11.2 fps -71%
BMAX B4 Turbo
Intel Processor N150, Intel UHD Graphics 24EUs (Alder Lake-N)
7.5 fps -81%
1920x1080 High Quality
Genomsnitt Intel Arc Graphics 140V
  (23 - 37.2, n=37)
32.9 fps +15%
Beelink SER9 Pro
AMD Ryzen 7 H 255, AMD Radeon 780M
30.5 fps +6%
MSI Cubi NUC AI+ 2MG
Intel Core Ultra 7 258V, Intel Arc Graphics 140V
28.7 fps
Asus NUC 14 Pro+
Intel Core Ultra 9 185H, Intel Arc 8-Core iGPU
28.6 fps 0%
Minisforum MS-A1
AMD Ryzen 7 8700G, AMD Radeon 780M
27.6 fps -4%
MSI Cubi NUC 1M
Intel Core 7 150U, Intel Iris Xe Graphics G7 96EUs
16.6 fps -42%
GMK NucBox M5
AMD Ryzen 7 5700U, AMD Radeon RX Vega 8 (Ryzen 4000/5000)
13.1 fps -54%
Asus NUC 14 Essential
Intel Core 3 N355, Intel UHD Graphics 32EUs (Alder Lake)
7.81 fps -73%
Ninkear M7, (16+512)
AMD Ryzen 5 7430U, AMD Radeon RX Vega 7
7.62 fps -73%
BMAX B4 Turbo
Intel Processor N150, Intel UHD Graphics 24EUs (Alder Lake-N)
5.3 fps -82%
X-Plane 11.11
1280x720 low (fps_test=1)
Minisforum MS-A1
AMD Ryzen 7 8700G, AMD Radeon 780M
69.1 fps +33%
Asus NUC 14 Pro+
Intel Core Ultra 9 185H, Intel Arc 8-Core iGPU
65.5 fps +26%
Beelink SER9 Pro
AMD Ryzen 7 H 255, AMD Radeon 780M
60.3 fps +16%
MSI Cubi NUC AI+ 2MG
Intel Core Ultra 7 258V, Intel Arc Graphics 140V
51.8 fps
Genomsnitt Intel Arc Graphics 140V
  (38.9 - 57, n=39)
47.4 fps -8%
GMK NucBox M5
AMD Ryzen 7 5700U, AMD Radeon RX Vega 8 (Ryzen 4000/5000)
40.4 fps -22%
Ninkear M7, (16+512)
AMD Ryzen 5 7430U, AMD Radeon RX Vega 7
29.2 fps -44%
1920x1080 med (fps_test=2)
Asus NUC 14 Pro+
Intel Core Ultra 9 185H, Intel Arc 8-Core iGPU
49.8 fps +19%
Minisforum MS-A1
AMD Ryzen 7 8700G, AMD Radeon 780M
48.9 fps +17%
Beelink SER9 Pro
AMD Ryzen 7 H 255, AMD Radeon 780M
44.5 fps +7%
MSI Cubi NUC AI+ 2MG
Intel Core Ultra 7 258V, Intel Arc Graphics 140V
41.7 fps
Genomsnitt Intel Arc Graphics 140V
  (34.1 - 44.3, n=39)
38.3 fps -8%
GMK NucBox M5
AMD Ryzen 7 5700U, AMD Radeon RX Vega 8 (Ryzen 4000/5000)
27.3 fps -35%
Ninkear M7, (16+512)
AMD Ryzen 5 7430U, AMD Radeon RX Vega 7
21.1 fps -49%
1920x1080 high (fps_test=3)
Asus NUC 14 Pro+
Intel Core Ultra 9 185H, Intel Arc 8-Core iGPU
42.2 fps +17%
Minisforum MS-A1
AMD Ryzen 7 8700G, AMD Radeon 780M
41.5 fps +15%
Beelink SER9 Pro
AMD Ryzen 7 H 255, AMD Radeon 780M
37 fps +3%
MSI Cubi NUC AI+ 2MG
Intel Core Ultra 7 258V, Intel Arc Graphics 140V
36 fps
Genomsnitt Intel Arc Graphics 140V
  (28.5 - 37.9, n=39)
33.7 fps -6%
GMK NucBox M5
AMD Ryzen 7 5700U, AMD Radeon RX Vega 8 (Ryzen 4000/5000)
25.1 fps -30%
Ninkear M7, (16+512)
AMD Ryzen 5 7430U, AMD Radeon RX Vega 7
18.3 fps -49%
Strange Brigade
1280x720 lowest AF:1
MSI Cubi NUC AI+ 2MG
Intel Core Ultra 7 258V, Intel Arc Graphics 140V
240 (45.1min, 113.4P1) fps
Genomsnitt Intel Arc Graphics 140V
  (138.1 - 251, n=34)
218 fps -9%
Beelink SER9 Pro
AMD Ryzen 7 H 255, AMD Radeon 780M
185.2 (125.5min, 161.9P1) fps -23%
Intel NUC 13 Pro Kit NUC13ANK
Intel Core i7-1360P, Intel Iris Xe Graphics G7 96EUs
95.4 (19.5min, 37.2P1) fps -60%
MSI Cubi NUC 1M
Intel Core 7 150U, Intel Iris Xe Graphics G7 96EUs
88.2 (20min, 29.9P1) fps -63%
GMK NucBox M5
AMD Ryzen 7 5700U, AMD Radeon RX Vega 8 (Ryzen 4000/5000)
79.8 (20.7min, 69.9P1) fps -67%
BMAX B4 Turbo
Intel Processor N150, Intel UHD Graphics 24EUs (Alder Lake-N)
31 (6.8min, 8.12P1) fps -87%
1920x1080 medium AA:medium AF:4
Genomsnitt Intel Arc Graphics 140V
  (55.5 - 87, n=34)
78.1 fps +9%
Beelink SER9 Pro
AMD Ryzen 7 H 255, AMD Radeon 780M
73.7 (60.8min, 62.9P1) fps +3%
MSI Cubi NUC AI+ 2MG
Intel Core Ultra 7 258V, Intel Arc Graphics 140V
71.8 (20.2min, 27P1) fps
MSI Cubi NUC 1M
Intel Core 7 150U, Intel Iris Xe Graphics G7 96EUs
38.9 (14.7min, 28.5P1) fps -46%
Intel NUC 13 Pro Kit NUC13ANK
Intel Core i7-1360P, Intel Iris Xe Graphics G7 96EUs
37.3 (12min, 16.1P1) fps -48%
GMK NucBox M5
AMD Ryzen 7 5700U, AMD Radeon RX Vega 8 (Ryzen 4000/5000)
32.4 (15.3min, 28.3P1) fps -55%
1920x1080 high AA:high AF:8
Genomsnitt Intel Arc Graphics 140V
  (45.3 - 73.2, n=34)
65.8 fps +10%
Beelink SER9 Pro
AMD Ryzen 7 H 255, AMD Radeon 780M
62.6 (43.8min, 48.8P1) fps +5%
MSI Cubi NUC AI+ 2MG
Intel Core Ultra 7 258V, Intel Arc Graphics 140V
59.7 (18.9min, 25.9P1) fps
MSI Cubi NUC 1M
Intel Core 7 150U, Intel Iris Xe Graphics G7 96EUs
31.1 (8.7min, 16.3P1) fps -48%
Intel NUC 13 Pro Kit NUC13ANK
Intel Core i7-1360P, Intel Iris Xe Graphics G7 96EUs
31 (8.5min, 12P1) fps -48%
GMK NucBox M5
AMD Ryzen 7 5700U, AMD Radeon RX Vega 8 (Ryzen 4000/5000)
26.8 (14.8min, 19.1P1) fps -55%
1920x1080 ultra AA:ultra AF:16
MSI Cubi NUC AI+ 2MG
Intel Core Ultra 7 258V, Intel Arc Graphics 140V
57.3 (18min, 27.8P1) fps
Genomsnitt Intel Arc Graphics 140V
  (39 - 62.5, n=34)
56.8 fps -1%
Beelink SER9 Pro
AMD Ryzen 7 H 255, AMD Radeon 780M
53.4 (33.1min, 40.4P1) fps -7%
Intel NUC 13 Pro Kit NUC13ANK
Intel Core i7-1360P, Intel Iris Xe Graphics G7 96EUs
25.2 (5.1min, 6.91P1) fps -56%
MSI Cubi NUC 1M
Intel Core 7 150U, Intel Iris Xe Graphics G7 96EUs
25.2 (5.3min, 6.89P1) fps -56%
GMK NucBox M5
AMD Ryzen 7 5700U, AMD Radeon RX Vega 8 (Ryzen 4000/5000)
22.7 (11.3min, 12.5P1) fps -60%
Cyberpunk 2077 2.2 Phantom Liberty
1280x720 Low Preset (FSR off)
Beelink SER9 Pro
AMD Ryzen 7 H 255, AMD Radeon 780M
73.6 (61min, 58P1) fps +18%
Minisforum MS-A1
AMD Ryzen 7 8700G, AMD Radeon 780M
69.1 (58.9min) fps +11%
Genomsnitt Intel Arc Graphics 140V
  (51 - 77.2, n=22)
65.2 fps +4%
MSI Cubi NUC AI+ 2MG
Intel Core Ultra 7 258V, Intel Arc Graphics 140V
62.5 (32.9min, 26.7P1) fps
Asus NUC 14 Pro+
Intel Core Ultra 9 185H, Intel Arc 8-Core iGPU
48.5 (39.4min) fps -22%
MSI Cubi NUC 1M
Intel Core 7 150U, Intel Iris Xe Graphics G7 96EUs
25.5 (19.8min) fps -59%
GMK NucBox M5
AMD Ryzen 7 5700U, AMD Radeon RX Vega 8 (Ryzen 4000/5000)
24.4 (12.7min) fps -61%
Ninkear M7, (16+512)
AMD Ryzen 5 7430U, AMD Radeon RX Vega 7
15.9 (12.9min) fps -75%
Asus NUC 14 Essential
Intel Core 3 N355, Intel UHD Graphics 32EUs (Alder Lake)
13.8 (10.8min) fps -78%
1920x1080 Low Preset (FSR off)
Beelink SER9 Pro
AMD Ryzen 7 H 255, AMD Radeon 780M
44.5 (37.8min, 36.5P1) fps +31%
Genomsnitt Intel Arc Graphics 140V
  (30.5 - 49.1, n=39)
43.4 fps +28%
Minisforum MS-A1
AMD Ryzen 7 8700G, AMD Radeon 780M
41 (35.2min) fps +21%
Asus NUC 14 Pro+
Intel Core Ultra 9 185H, Intel Arc 8-Core iGPU
34.7 (30.4min) fps +2%
MSI Cubi NUC AI+ 2MG
Intel Core Ultra 7 258V, Intel Arc Graphics 140V
33.9 (19.2min, 16.7P1) fps
MSI Cubi NUC 1M
Intel Core 7 150U, Intel Iris Xe Graphics G7 96EUs
15.4 (12.1min) fps -55%
GMK NucBox M5
AMD Ryzen 7 5700U, AMD Radeon RX Vega 8 (Ryzen 4000/5000)
13.8 (6.57min) fps -59%
Ninkear M7, (16+512)
AMD Ryzen 5 7430U, AMD Radeon RX Vega 7
9.3 (7.42min) fps -73%
Asus NUC 14 Essential
Intel Core 3 N355, Intel UHD Graphics 32EUs (Alder Lake)
7.81 (5.93min) fps -77%
1920x1080 Medium Preset (FSR off)
Genomsnitt Intel Arc Graphics 140V
  (24.3 - 39.7, n=38)
35.7 fps +34%
Beelink SER9 Pro
AMD Ryzen 7 H 255, AMD Radeon 780M
34.3 (30.1min, 28.2P1) fps +29%
Minisforum MS-A1
AMD Ryzen 7 8700G, AMD Radeon 780M
33.4 (29.1min) fps +26%
Asus NUC 14 Pro+
Intel Core Ultra 9 185H, Intel Arc 8-Core iGPU
28.9 (25.6min) fps +9%
MSI Cubi NUC AI+ 2MG
Intel Core Ultra 7 258V, Intel Arc Graphics 140V
26.6 (15.5min, 13.9P1) fps
MSI Cubi NUC 1M
Intel Core 7 150U, Intel Iris Xe Graphics G7 96EUs
12.4 (10.3min) fps -53%
GMK NucBox M5
AMD Ryzen 7 5700U, AMD Radeon RX Vega 8 (Ryzen 4000/5000)
10.9 (8.08min) fps -59%
Ninkear M7, (16+512)
AMD Ryzen 5 7430U, AMD Radeon RX Vega 7
7.07 (6.05min) fps -73%
Asus NUC 14 Essential
Intel Core 3 N355, Intel UHD Graphics 32EUs (Alder Lake)
6 (4.82min) fps -77%
1920x1080 High Preset (FSR off)
Genomsnitt Intel Arc Graphics 140V
  (20 - 34.4, n=39)
30.2 fps +30%
Minisforum MS-A1
AMD Ryzen 7 8700G, AMD Radeon 780M
26.7 (22.9min) fps +15%
Beelink SER9 Pro
AMD Ryzen 7 H 255, AMD Radeon 780M
26.4 (22.9min, 7.08P1) fps +14%
Asus NUC 14 Pro+
Intel Core Ultra 9 185H, Intel Arc 8-Core iGPU
24.1 (21.1min) fps +4%
MSI Cubi NUC AI+ 2MG
Intel Core Ultra 7 258V, Intel Arc Graphics 140V
23.2 (12.6min, 11.3P1) fps
MSI Cubi NUC 1M
Intel Core 7 150U, Intel Iris Xe Graphics G7 96EUs
10.8 (8.83min) fps -53%
GMK NucBox M5
AMD Ryzen 7 5700U, AMD Radeon RX Vega 8 (Ryzen 4000/5000)
9.17 (6.25min) fps -60%
Ninkear M7, (16+512)
AMD Ryzen 5 7430U, AMD Radeon RX Vega 7
5.82 (5.02min) fps -75%
1920x1080 Ultra Preset (FSR off)
Genomsnitt Intel Arc Graphics 140V
  (17.5 - 30.1, n=39)
26 fps +34%
Minisforum MS-A1
AMD Ryzen 7 8700G, AMD Radeon 780M
23.4 (19.7min) fps +21%
Beelink SER9 Pro
AMD Ryzen 7 H 255, AMD Radeon 780M
22.6 (18.8min, 6.53P1) fps +16%
Asus NUC 14 Pro+
Intel Core Ultra 9 185H, Intel Arc 8-Core iGPU
22 (18.9min) fps +13%
MSI Cubi NUC AI+ 2MG
Intel Core Ultra 7 258V, Intel Arc Graphics 140V
19.4 (11min, 10.1P1) fps
MSI Cubi NUC 1M
Intel Core 7 150U, Intel Iris Xe Graphics G7 96EUs
9.46 (7.99min) fps -51%
Ninkear M7, (16+512)
AMD Ryzen 5 7430U, AMD Radeon RX Vega 7
4.95 (4.26min) fps -74%
F1 24
1280x720 Ultra Low Preset AA:T
MSI Cubi NUC AI+ 2MG
Intel Core Ultra 7 258V, Intel Arc Graphics 140V
77.3 (53min, 31P1) fps
Genomsnitt Intel Arc Graphics 140V
  (n=1)
77.3 fps 0%
1920x1080 Low Preset AA:T AF:16x
Minisforum MS-A1
AMD Ryzen 7 8700G, AMD Radeon 780M
92.1 (76min, 65P1) fps +28%
Beelink SER9 Pro
AMD Ryzen 7 H 255, AMD Radeon 780M
83.6 (64min, 53P1) fps +16%
Genomsnitt Intel Arc Graphics 140V
  (54 - 99, n=24)
82 fps +14%
MSI Cubi NUC AI+ 2MG
Intel Core Ultra 7 258V, Intel Arc Graphics 140V
72 (52min, 30P1) fps
Asus NUC 14 Pro+
Intel Core Ultra 9 185H, Intel Arc 8-Core iGPU
71.8 (59min, 46P1) fps 0%
Ninkear M7, (16+512)
AMD Ryzen 5 7430U, AMD Radeon RX Vega 7
18.1 (13min, 13P1) fps -75%
1920x1080 Medium Preset AA:T AF:16x
Minisforum MS-A1
AMD Ryzen 7 8700G, AMD Radeon 780M
78.2 (65min, 62P1) fps
Genomsnitt Intel Arc Graphics 140V
  (49.2 - 88.2, n=23)
76.2 fps
Beelink SER9 Pro
AMD Ryzen 7 H 255, AMD Radeon 780M
75.6 (53min, 50P1) fps
Asus NUC 14 Pro+
Intel Core Ultra 9 185H, Intel Arc 8-Core iGPU
64.7 (52min, 41P1) fps
Ninkear M7, (16+512)
AMD Ryzen 5 7430U, AMD Radeon RX Vega 7
16.4 (12P1) fps
1920x1080 High Preset AA:T AF:16x
Genomsnitt Intel Arc Graphics 140V
  (34.4 - 66.4, n=25)
57.3 fps +7%
Minisforum MS-A1
AMD Ryzen 7 8700G, AMD Radeon 780M
57 (47min, 39P1) fps +6%
Beelink SER9 Pro
AMD Ryzen 7 H 255, AMD Radeon 780M
55.8 (41min, 40P1) fps +4%
MSI Cubi NUC AI+ 2MG
Intel Core Ultra 7 258V, Intel Arc Graphics 140V
53.8 (38min, 22P1) fps
Asus NUC 14 Pro+
Intel Core Ultra 9 185H, Intel Arc 8-Core iGPU
48.4 (40min, 36P1) fps -10%
Ninkear M7, (16+512)
AMD Ryzen 5 7430U, AMD Radeon RX Vega 7
11.8 (1min, 9P1) fps -78%
1920x1080 Ultra High Preset AA:T AF:16x
Genomsnitt Intel Arc Graphics 140V
  (15.3 - 22, n=23)
19 fps +14%
MSI Cubi NUC AI+ 2MG
Intel Core Ultra 7 258V, Intel Arc Graphics 140V
16.6 (10min, 7P1) fps
Minisforum MS-A1
AMD Ryzen 7 8700G, AMD Radeon 780M
13.9 (9min, 9P1) fps -16%
Beelink SER9 Pro
AMD Ryzen 7 H 255, AMD Radeon 780M
13 (5min, 9P1) fps -22%

Bildfrekvensen vid tomgångskörning på Cyberpunk 2077 vid 1080p Ultra-inställningar varierade mellan 18 och 26 medan upprepning av detta test på NucBox K12 skulle resultera i en stabilare genomsnittlig bildfrekvens på 23. Detta stammar skulle inträffa när du kör andra spel i vårt test också.

Cyberpunk 2077 ultra FPS-diagram

0510152025Tooltip
MSI Cubi NUC AI+ 2MG Core Ultra 7 258V, Arc 140V: Ø23.1 (15.7-27.6)
GMK NucBox K12 Ryzen 7 H 255, Radeon 780M: Ø22.8 (21.4-23.2)
lågmed.högultra
GTA V (2015) 160.4 152.4 63.6 26.6
Dota 2 Reborn (2015) 98.1 80.4 59.9 65.8
Final Fantasy XV Benchmark (2018) 71.3 39.1 28.7
X-Plane 11.11 (2018) 51.8 41.7 36
Strange Brigade (2018) 240 71.8 59.7 57.3
Baldur's Gate 3 (2023) 36.1 29.5 29 26.7
Cyberpunk 2077 2.2 Phantom Liberty (2023) 33.9 26.6 23.2 19.4
F1 24 (2024) 72 53.8 16.6

Utsläpp

Systembuller

Fläktljudet ligger runt 25 dB(A) i Silent-läget och på relativt höga 36 dB(A) i Performance-läget. Systemet är generellt sett mer högljutt än vad vi observerade på den äldre Cubi 1M.

Fläktens ljudprofil (Vit: Bakgrund, Röd: System i viloläge, Blå: 3DMark 06, Orange: Cyberpunk 2077, Grön: Prime95 stress)

Ljudnivå

Låg belastning
28 / 36.1 / 36.1 dB(A)
Hög belastning
38.9 / 49.2 dB(A)
  red to green bar
 
 
30 dB
tyst
40 dB(A)
hörbar
50 dB(A)
högt ljud
 
min: dark, med: mid, max: light   Earthworks M23R, Arta (15 cm avstånd)   omgivningsljud: 24.8 dB(A)
dB(A) 0102030405060708090Deep BassMiddle BassHigh BassLower RangeMidsHigher MidsLower HighsMid HighsUpper HighsSuper Highs2032.430.232.342.534.22523.925.630.232.826.13127.929.928.933.827.54027.829.728.829.329.85031.629.830.432.934.6633128.329.631.629.78028.228.329.929.730.410026.827.327.827.83012532.231.831.132.433.316023.223.122.419.527.220023.822.72218.128.225022.323.322.517.329.231522.824.322.217.829.640025.125.924.115.232.250026.728.22713.234.963028.529.728.311.337.880025.126.625.21134.6100024.525.824.110.233.6125031.131.528.49.937.2160027.430.82710.44220002527.824.710.643.2250022.125.121.910.834.8315023.826.923.911.337.5400020.922.819.911.734.1500019.220.718.412.130.3630016.217.614.912.228.5800015.317.514.712.128.6100001417.113.212.222.21250013.61713.112.218.1160001720.614.811.316.1SPL3738.936.124.849.2N2.52.92.30.76.2median 23.8median 25.1median 22.5median 12.1median 32.2Delta3.83.553.23.8hearing rangehide median Fan NoiseMSI Cubi NUC AI+ 2MG
MSI Cubi NUC AI+ 2MG
Arc 140V, Core Ultra 7 258V
MSI Cubi NUC 1M
Iris Xe G7 96EUs, Core 7 150U, WD PC SN560 SDDPNQE-1T00
GMK NucBox K12
Radeon 780M, Ryzen 7 H 255, Crucial P3 Plus CT1000P3PSSD8
Beelink SER9 Pro
Radeon 780M, Ryzen 7 H 255, Crucial P3 Plus CT1000P3PSSD8
Ninkear M7, (16+512)
Vega 7, R5 7430U, Faspeed P8-512G-SE
Minisforum MS-A1
Radeon 780M, R7 8700G, Kingston OM8PGP41024Q-A0
Noise
7%
-4%
12%
19%
-3%
av / miljö * (dB)
24.8
23.5
5%
23.5
5%
23
7%
24.8
-0%
24.8
-0%
Idle Minimum * (dB)
28
29.9
-7%
35.4
-26%
29.1
-4%
25.3
10%
33.9
-21%
Idle Average * (dB)
36.1
29.9
17%
35.4
2%
30.1
17%
25.7
29%
34
6%
Idle Maximum * (dB)
36.1
32
11%
39
-8%
31.7
12%
25.7
29%
34
6%
Load Average * (dB)
38.9
33.5
14%
42.4
-9%
33.7
13%
33.6
14%
41.1
-6%
Cyberpunk 2077 ultra * (dB)
37
39.1
-6%
40.4
-9%
33.8
9%
28.7
22%
42.2
-14%
Load Maximum * (dB)
49.2
40.5
18%
41.4
16%
35.2
28%
34.3
30%
46.2
6%
Witcher 3 ultra * (dB)
28.8

* ... mindre är bättre

Temperatur

(~13 x 6,8 x 2,6 cm) AC-adapter

Yttemperaturen är knappt varm, endast 31 C, även när krävande applikationer körs, vilket till stor del beror på plastkonstruktionen och den strömsnåla Intel-processorn.

Den lilla 120 W AC-adaptern skulle förbli relativt sval vid under 35 C under belastning.

System på tomgång (framsida)
System i viloläge (bakre delen)
Prime95 påfrestning (framsida)
Prime95 påkänning (bak)

Högtalare

Den integrerade monohögtalaren har låg maxvolym och räcker inte till för att fylla ett litet till medelstort konferensrum
dB(A) 0102030405060708090Deep BassMiddle BassHigh BassLower RangeMidsHigher MidsLower HighsMid HighsUpper HighsSuper Highs2031.532.331.5252230.2223122.928.922.9402128.8215024.630.424.6632529.6258025.529.925.510024.627.824.612530.431.130.416042.422.442.420049.52249.52505122.55131552.122.252.140057.924.157.950066.12766.163066.128.366.18006125.261100048.924.148.9125057.328.457.3160054.72754.7200050.324.750.325005021.950315055.223.955.2400056.619.956.6500055.618.455.6630062.114.962.1800057.914.757.9100005113.2511250043.113.143.11600033.814.833.8SPL70.536.170.5N27.52.327.5median 52.1median 22.5median 52.1Delta6.956.926.325.821.422.12624.925.127.622.532.523.448.72655.818.860.922.167.2267019.372.317.674.217.774.319.575.31571.711.871.311.27410.574.21072.710.17210.67210.97511.374.811.671.71269.71269.612.371.112.669.61270.111.269.824.784.70.666.6median 12median 71.73.42.2hearing rangehide median Pink NoiseMSI Cubi NUC AI+ 2MGApple MacBook Pro 16 2021 M1 Pro
Frekvensdiagram (kryssrutor kan markeras och avmarkeras för att jämföra enheter)
MSI Cubi NUC AI+ 2MG ljudanalys

(-) | inte särskilt höga högtalare (70.5 dB)
Bas 100 - 315 Hz
(±) | reducerad bas - i genomsnitt 10.4% lägre än medianen
(-) | basen är inte linjär (16% delta till föregående frekvens)
Mellan 400 - 2000 Hz
(±) | högre mellan - i genomsnitt 6.9% högre än median
(-) | mids är inte linjära (19.7% delta till föregående frekvens)
Högsta 2 - 16 kHz
(+) | balanserade toppar - endast 4.3% från medianen
(±) | linjäriteten för toppar är genomsnittlig (12.2% delta till föregående frekvens)
Totalt 100 - 16 000 Hz
(±) | linjäriteten för det totala ljudet är genomsnittlig (29.5% skillnad mot median)
Jämfört med samma klass
» 70% av alla testade enheter i den här klassen var bättre, 13% liknande, 17% sämre
» Den bästa hade ett delta på 13%, genomsnittet var 25%, sämst var 64%
Jämfört med alla testade enheter
» 87% av alla testade enheter var bättre, 3% liknande, 10% sämre
» Den bästa hade ett delta på 4%, genomsnittet var 24%, sämst var 134%

Apple MacBook Pro 16 2021 M1 Pro ljudanalys

(+) | högtalare kan spela relativt högt (84.7 dB)
Bas 100 - 315 Hz
(+) | bra bas - bara 3.8% från medianen
(+) | basen är linjär (5.2% delta till föregående frekvens)
Mellan 400 - 2000 Hz
(+) | balanserad mellan - endast 1.3% från medianen
(+) | mids är linjära (2.1% delta till föregående frekvens)
Högsta 2 - 16 kHz
(+) | balanserade toppar - endast 1.9% från medianen
(+) | toppar är linjära (2.7% delta till föregående frekvens)
Totalt 100 - 16 000 Hz
(+) | det totala ljudet är linjärt (4.6% skillnad mot median)
Jämfört med samma klass
» 0% av alla testade enheter i den här klassen var bättre, 0% liknande, 100% sämre
» Den bästa hade ett delta på 5%, genomsnittet var 18%, sämst var 45%
Jämfört med alla testade enheter
» 0% av alla testade enheter var bättre, 0% liknande, 100% sämre
» Den bästa hade ett delta på 4%, genomsnittet var 24%, sämst var 134%

Energiförvaltning

Strömförbrukning

Den totala förbrukningen är märkbart lägre än för en AMD H-serie minidator som GMK NucBox K12 även om vår integrerade Arc 140V är ungefär jämförbar med den konkurrerande integrerade Radeon 780M när du spelar. Prestanda per watt gynnar i allmänhet MSI Cubi, om än på bekostnad av rå processorprestanda jämfört med många AMD Zen 4- eller Zen 5-alternativ.

Förbrukningen när Cyberpunk 2077 kördes skulle cykla mellan 28 W och 49 W till synes utan anledning, vilket överensstämmer med våra instabila bildhastigheter och GPU-klockfrekvenser som nämns ovan.

3DMark 06 förbrukning
Cyberpunk 2077 1080p Ultra-förbrukning. Notera den fluktuerande efterfrågan även när du bara går på tomgång i spelet
Förbrukningen ökade till 60 W när Prime95-belastningen inleddes, för att sedan sjunka och stabiliseras på 49 W cirka 50 sekunder senare
Prime95+FurMark stress initierad vid 10 sekunders markering
Strömförbrukning
Av/Standbydarklight 0.63 / 2.1 Watt
Låg belastningdarkmidlight 2.9 / 5.7 / 10.2 Watt
Hög belastning midlight 38.7 / 60 Watt
 color bar
Förklaring: min: dark, med: mid, max: light        Metrahit Energy
MSI Cubi NUC AI+ 2MG
Core Ultra 7 258V, Arc 140V, , , x,
MSI Cubi NUC 1M
Core 7 150U, Iris Xe G7 96EUs, WD PC SN560 SDDPNQE-1T00, , x,
GMK NucBox K12
Ryzen 7 H 255, Radeon 780M, Crucial P3 Plus CT1000P3PSSD8, , x,
Beelink SER9 Pro
Ryzen 7 H 255, Radeon 780M, Crucial P3 Plus CT1000P3PSSD8, , x,
Ninkear M7, (16+512)
R5 7430U, Vega 7, Faspeed P8-512G-SE, , x,
Minisforum MS-A1
R7 8700G, Radeon 780M, Kingston OM8PGP41024Q-A0, , x,
Power Consumption
-24%
-99%
-56%
-47%
-121%
Idle Minimum * (Watt)
2.9
6.4
-121%
9.9
-241%
7
-141%
9.3
-221%
8.8
-203%
Idle Average * (Watt)
5.7
8.3
-46%
10.1
-77%
7.1
-25%
10.7
-88%
12.6
-121%
Idle Maximum * (Watt)
10.2
10.4
-2%
13.1
-28%
7.5
26%
12.6
-24%
14
-37%
Load Average * (Watt)
38.7
38.5
1%
69.8
-80%
62.3
-61%
37.7
3%
93.2
-141%
Cyberpunk 2077 ultra external monitor * (Watt)
41.1
36.1
12%
86.3
-110%
80.1
-95%
32.3
21%
102.1
-148%
Load Maximum * (Watt)
60
52.5
12%
92.8
-55%
82.9
-38%
43.4
28%
105.4
-76%

* ... mindre är bättre

Strömförbrukning Cyberpunk / Stresstest

0510152025303540455055Tooltip
MSI Cubi NUC AI+ 2MG Core Ultra 7 258V, Arc 140V: Ø52.6 (47.9-57.4)
MSI Cubi NUC 1M Core 7 150U, Iris Xe G7 96EUs: Ø40.2 (37.4-52.6)

Strömförbrukning extern monitor

051015202530354045505560Tooltip
MSI Cubi NUC AI+ 2MG Core Ultra 7 258V, Arc 140V; Prime95 V2810 Stress (external Monitor): Ø49.7 (36.7-60)
MSI Cubi NUC 1M Core 7 150U, Iris Xe G7 96EUs; Prime95 V2810 Stress (external Monitor): Ø40.6 (37.7-53.5)
MSI Cubi NUC AI+ 2MG Core Ultra 7 258V, Arc 140V; Cinebench R15 Multi (external Monitor): Ø54 (32.3-58)
MSI Cubi NUC 1M Core 7 150U, Iris Xe G7 96EUs; Cinebench R15 Multi (external Monitor): Ø45 (33.5-48.5)
MSI Cubi NUC AI+ 2MG Core Ultra 7 258V, Arc 140V; 1280x720 FurMark 1.19 GPU Stress Test (external Monitor): Ø34 (20.7-43)
MSI Cubi NUC 1M Core 7 150U, Iris Xe G7 96EUs; 1280x720 FurMark 1.19 GPU Stress Test (external Monitor): Ø35.6 (32.5-49.3)
MSI Cubi NUC AI+ 2MG Core Ultra 7 258V, Arc 140V; Idle 1min (external Monitor): Ø5.74 (2.88-10.2)
MSI Cubi NUC 1M Core 7 150U, Iris Xe G7 96EUs; Idle 1min (external Monitor): Ø10.5 (6.41-13.6)
MSI Cubi NUC AI+ 2MG Core Ultra 7 258V, Arc 140V; Cyberpunk 2077 FHD ultra no FSR (external Monitor): Ø41.1 (26.8-58.9)
MSI Cubi NUC 1M Core 7 150U, Iris Xe G7 96EUs; Cyberpunk 2077 FHD ultra no FSR (external Monitor): Ø36.1 (35.5-37.1)

Notebookcheck Betyg

Enkel och pålitlig minidator för företag, men den är förmodligen för enkel med tanke på det höga priset.

MSI Cubi NUC AI+ 2MG - 09/29/2025 v8
Allen Ngo

Design
76 / 98 → 77%
Anslutningar
68 / 81 → 84%
Vikt
80%
Spelprestanda
52 / 80 → 65%
Programprestanda
83 / 92 → 90%
AI Performance
90%
Temperatur
95%
Ljudnivå
65%
Audio
48%
Medel
63%
75%
Mini PC - Vägt medel
CO2 Emissions
No Data
Materials
50%
Packaging
100%
Power Use
72.9%
Repairability
40%
Software Updates
39%
Recycle Logo Total Sustainability Score: 50.3%

Potentiella konkurrenter i jämförelse

Bild
Modell / recensioner
Pris
Vikt
Höjd
Skärm
1.
75.2%
MSI Cubi NUC AI+ 2MG
Intel Core Ultra 7 258V ⎘
Intel Arc Graphics 140V ⎘
32 GB Minne
Amazon: $899.00
Listpris: 900 USD
669 g50.1 mmx
2.
66.1%
MSI Cubi NUC 1M
MSI Cubi NUC 1M
Intel Core 7 150U ⎘
Intel Iris Xe Graphics G7 96EUs ⎘
16 GB Minne, 1024 GB SSD
Amazon: $599.00
Listpris: 950 USD
660 g50.1 mmx
3.
73.7%
GMK NucBox K12
GMK NucBox K12
AMD Ryzen 7 H 255 ⎘
AMD Radeon 780M ⎘
32 GB Minne, 1024 GB SSD
Amazon: $549.98
938 g78 mmx
4.
80.2%
Beelink SER9 Pro
Beelink SER9 Pro
AMD Ryzen 7 H 255 ⎘
AMD Radeon 780M ⎘
32 GB Minne, 1024 GB SSD
Amazon: $649.00
Listpris: 520 USD
812 g44.7 mmx
5.
Ninkear M7, (16+512)
AMD Ryzen 5 7430U ⎘
AMD Radeon RX Vega 7 ⎘
16 GB Minne, 512 GB SSD
Amazon: $349.99
Listpris: 399€
400 g36 mmx
6.
76.7%
Minisforum MS-A1
Minisforum MS-A1
AMD Ryzen 7 8700G ⎘
AMD Radeon 780M ⎘
32 GB Minne, 1024 GB SSD
Amazon:
1. $239.99
MINISFORUM MS-A1 Mini Workst...
2. $687.90
MINISFORUM MS-A1 Mini Workst...
3. $638.00
MINISFORUM Mini PC MS-01-S13...
Listpris: 829 EUR
1.7 kg48 mmx

Genomskinlighet

Valet av enheter som ska granskas görs av vår redaktion. Testprovet gavs till författaren som ett lån av tillverkaren eller återförsäljaren för denna recension. Långivaren hade inget inflytande på denna recension och inte heller fick tillverkaren en kopia av denna recension innan publiceringen. Det fanns ingen skyldighet att publicera denna recension. Som ett oberoende medieföretag är Notebookcheck inte föremål för auktoritet från tillverkare, återförsäljare eller förlag.

This is how Notebookcheck is testing

Every year, Notebookcheck independently reviews hundreds of laptops and smartphones using standardized procedures to ensure that all results are comparable. We have continuously developed our test methods for around 20 years and set industry standards in the process. In our test labs, high-quality measuring equipment is utilized by experienced technicians and editors. These tests involve a multi-stage validation process. Our complex rating system is based on hundreds of well-founded measurements and benchmarks, which maintains objectivity.

Please share our article, every link counts!
Mail Logo
> Bärbara datorer, laptops - tester och nyheter > Tester > MSI Cubi NUC AI+ 2MG recension: Enkel mini-dator för företag
Allen Ngo, 2025-10- 9 (Update: 2025-10- 9)