Lenovo Yoga Pro 9i 16 laptop recension: Fantastisk mini-LED-panel, men onödiga kostnadsbesparande åtgärder
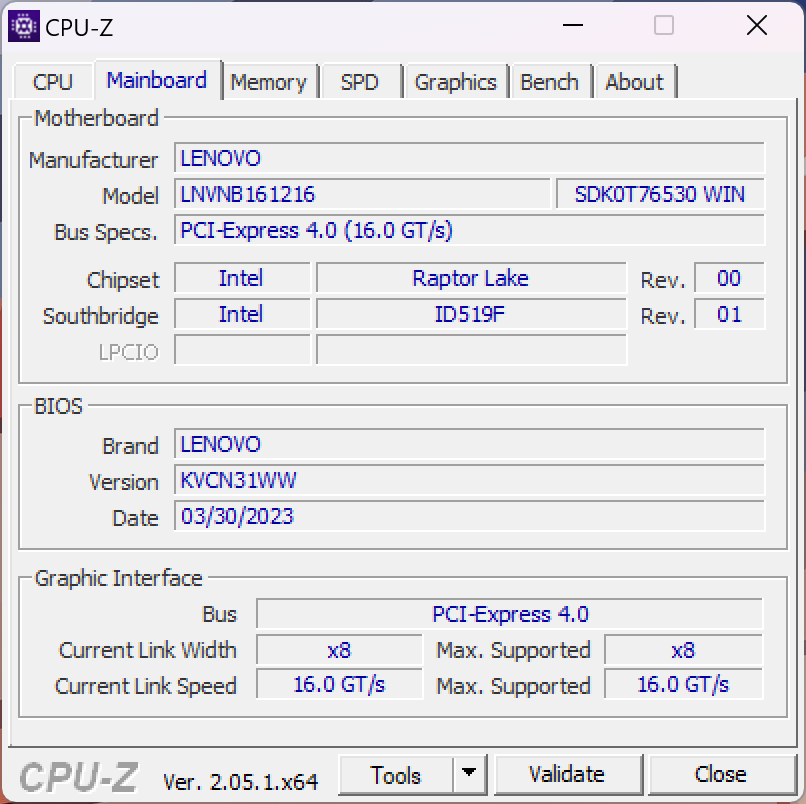
Efter att ha tittat närmare på 14-tumsversionen av den nya Lenovo Yoga Pro 9i, tar vi nu en titt på 16-tumsversionen. De tekniska specifikationerna (bortsett från storleken) är i grunden identiska, eftersom en 3,2K mini-LED-pekskärm med 165 Hz och AdobeRGB-täckning också används här. Under huven finns de senaste Raptor Lake H-processorerna från Intel och Nvidia GPU: er som sträcker sig från RTX 4050 till RTX 4070. I detalj finns det dock vissa skillnader som vi också tar en titt på.
Vår testenhet är modellen 83BY0016GE och kostar 2 399 EUR(Översättarens anmärkning: modeller i USA är betydligt billigare - se "Pris och tillgänglighet" i slutet av denna recension) med en 3,2K mini LED-panel (165 Hz), en Core i7-processor, enGeForce RTX 4060, 16 GB LPDDR5X 6400 RAM-minne och en 1 TB PCIe 4.0 SSD. Vi kunde också köra några riktmärken på en mer kraftfull konfiguration (Core i9, RTX 4070 laptop, 64 GB RAM).
Potentiella konkurrenter i jämförelse
Gradering | Datum | Modell | Vikt | Höjd | Storlek | Upplösning | Pris |
|---|---|---|---|---|---|---|---|
| 88.4 % v7 (old) | 08/2023 | Lenovo Yoga Pro 9 16-IRP G8 i7-13705H, GeForce RTX 4060 Laptop GPU | 2.2 kg | 18.2 mm | 16.00" | 3200x2000 | |
| 88.6 % v7 (old) | 07/2023 | Schenker VISION 16 Pro (M23) i7-13700H, GeForce RTX 4070 Laptop GPU | 1.6 kg | 17.1 mm | 16.00" | 2560x1600 | |
| 86.2 % v7 (old) | 07/2023 | Asus Vivobook Pro 16X K6604JV-MX016W i9-13980HX, GeForce RTX 4060 Laptop GPU | 2.1 kg | 22.8 mm | 16.00" | 3200x2000 | |
| 86.1 % v7 (old) | 06/2023 | Asus ProArt Studiobook 16 OLED H7604 i9-13980HX, GeForce RTX 4070 Laptop GPU | 2.4 kg | 23.9 mm | 16.00" | 3200x2000 | |
| 88.8 % v7 (old) | 07/2023 | MSI Stealth 16 Studio A13VG i7-13700H, GeForce RTX 4070 Laptop GPU | 2 kg | 19.95 mm | 16.00" | 2560x1600 | |
| 93.7 % v7 (old) | 03/2023 | Apple MacBook Pro 16 2023 M2 Max M2 Max, M2 Max 38-Core GPU | 2.2 kg | 16.8 mm | 16.20" | 3456x2234 |
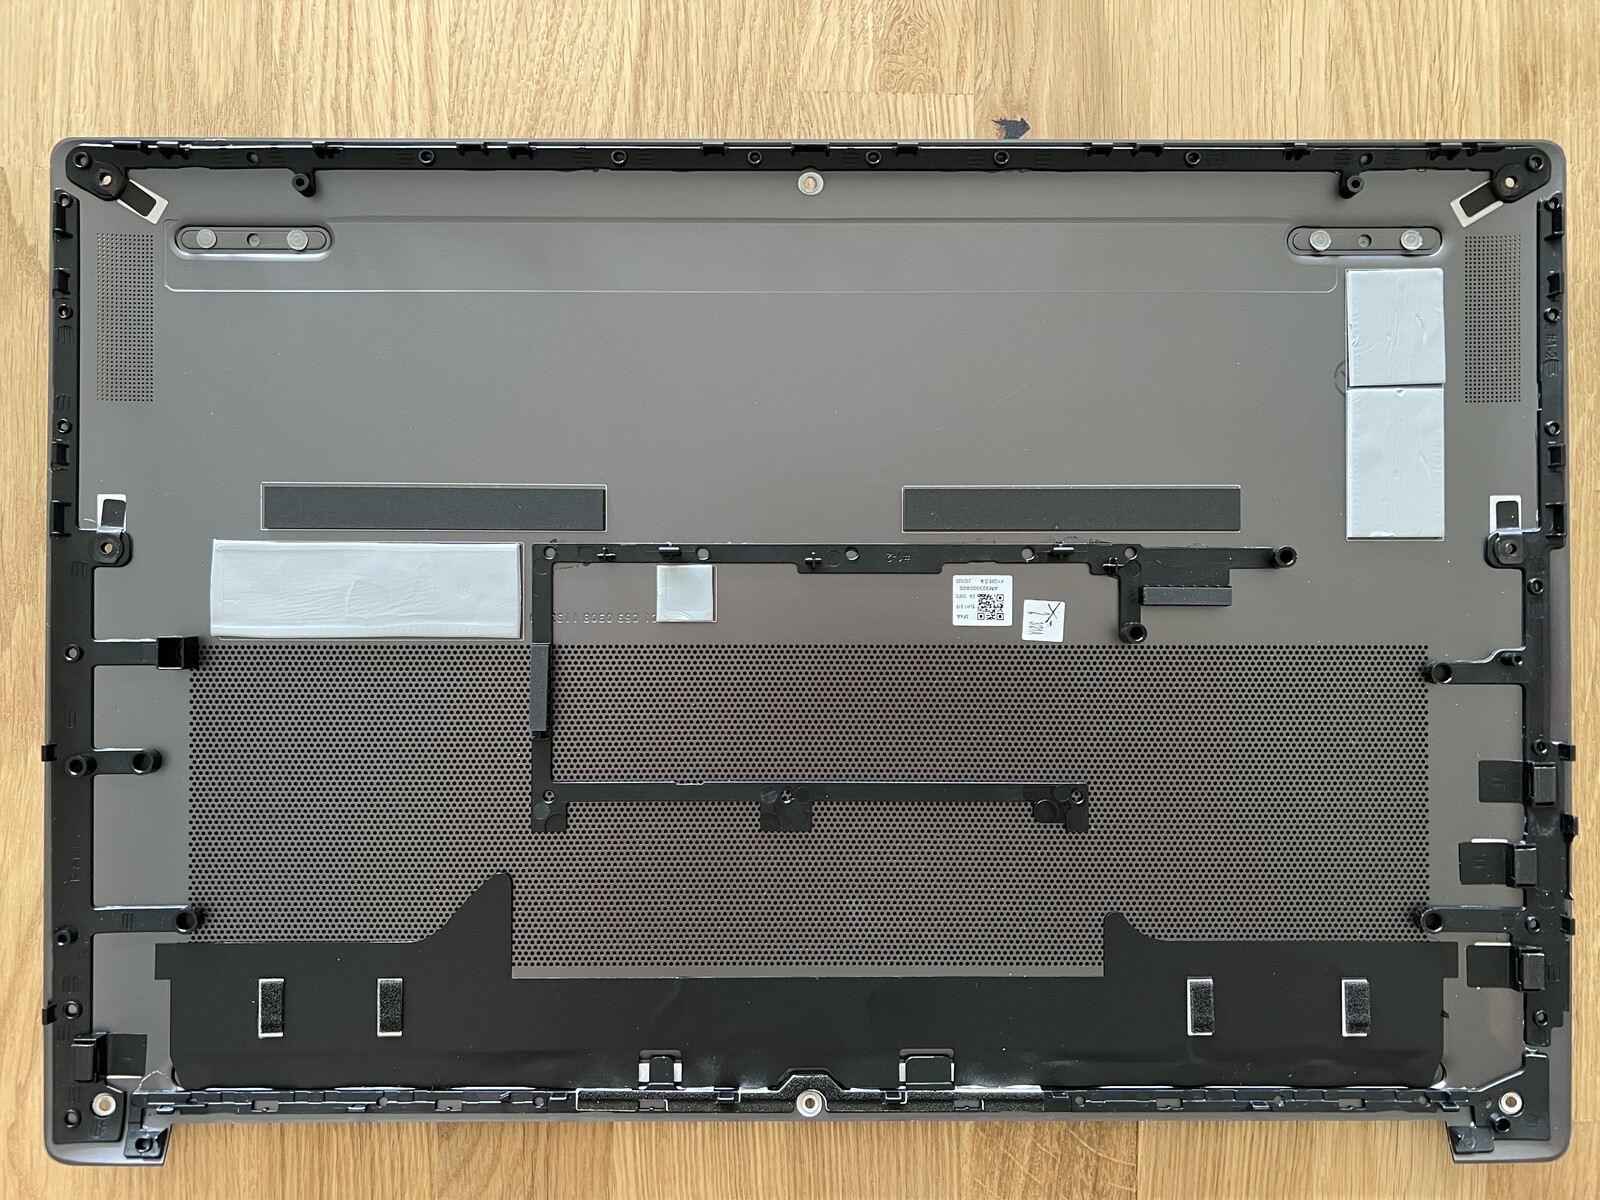
Hölje - Aluminiumhölje med en knarrig bottenplatta
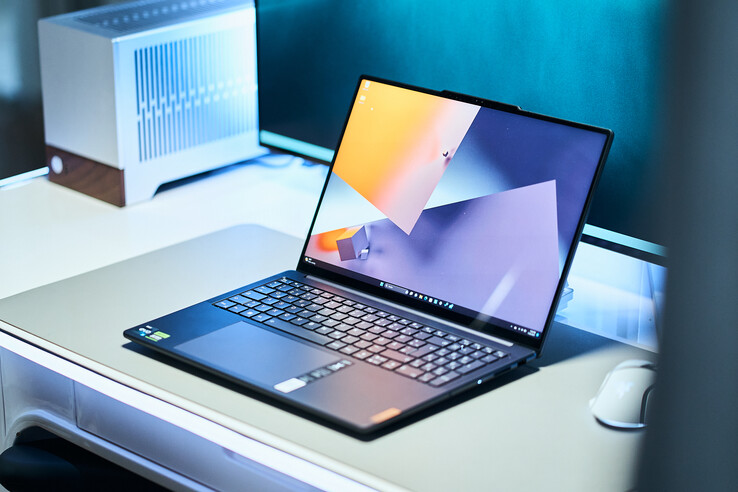
Fodralet har samma design som det mindre Yoga Pro 9i 14, dvs. en aluminiumkonstruktion används. 16-tumsmodellen har dock en svag punkt: bottenplattan är mycket tunn och avger obehagliga knakande ljud när den hanteras, vilket inte alls är passande för en premiumenhet. Problemet var också närvarande (om än mindre uttalat) i den andra testenheten, så detta kan vara ett allmänt problem. Detta är synd eftersom det inte finns några andra defekter när det gäller utförande eller stabilitet. Basenheten kan bara tryckas in minimalt i det centrala området, men kan praktiskt taget inte vridas alls. Locket är lite mer flexibelt än den mindre 14-tums modellen, men inga problem dyker upp här heller. De två gångjärnen är väljusterade (endast minimal vridning) och håller skärmen säkert på plats, även vid små öppningsvinklar. Samtidigt är det möjligt att öppna skärmen med en hand och den maximala öppningsvinkeln är 180 grader.
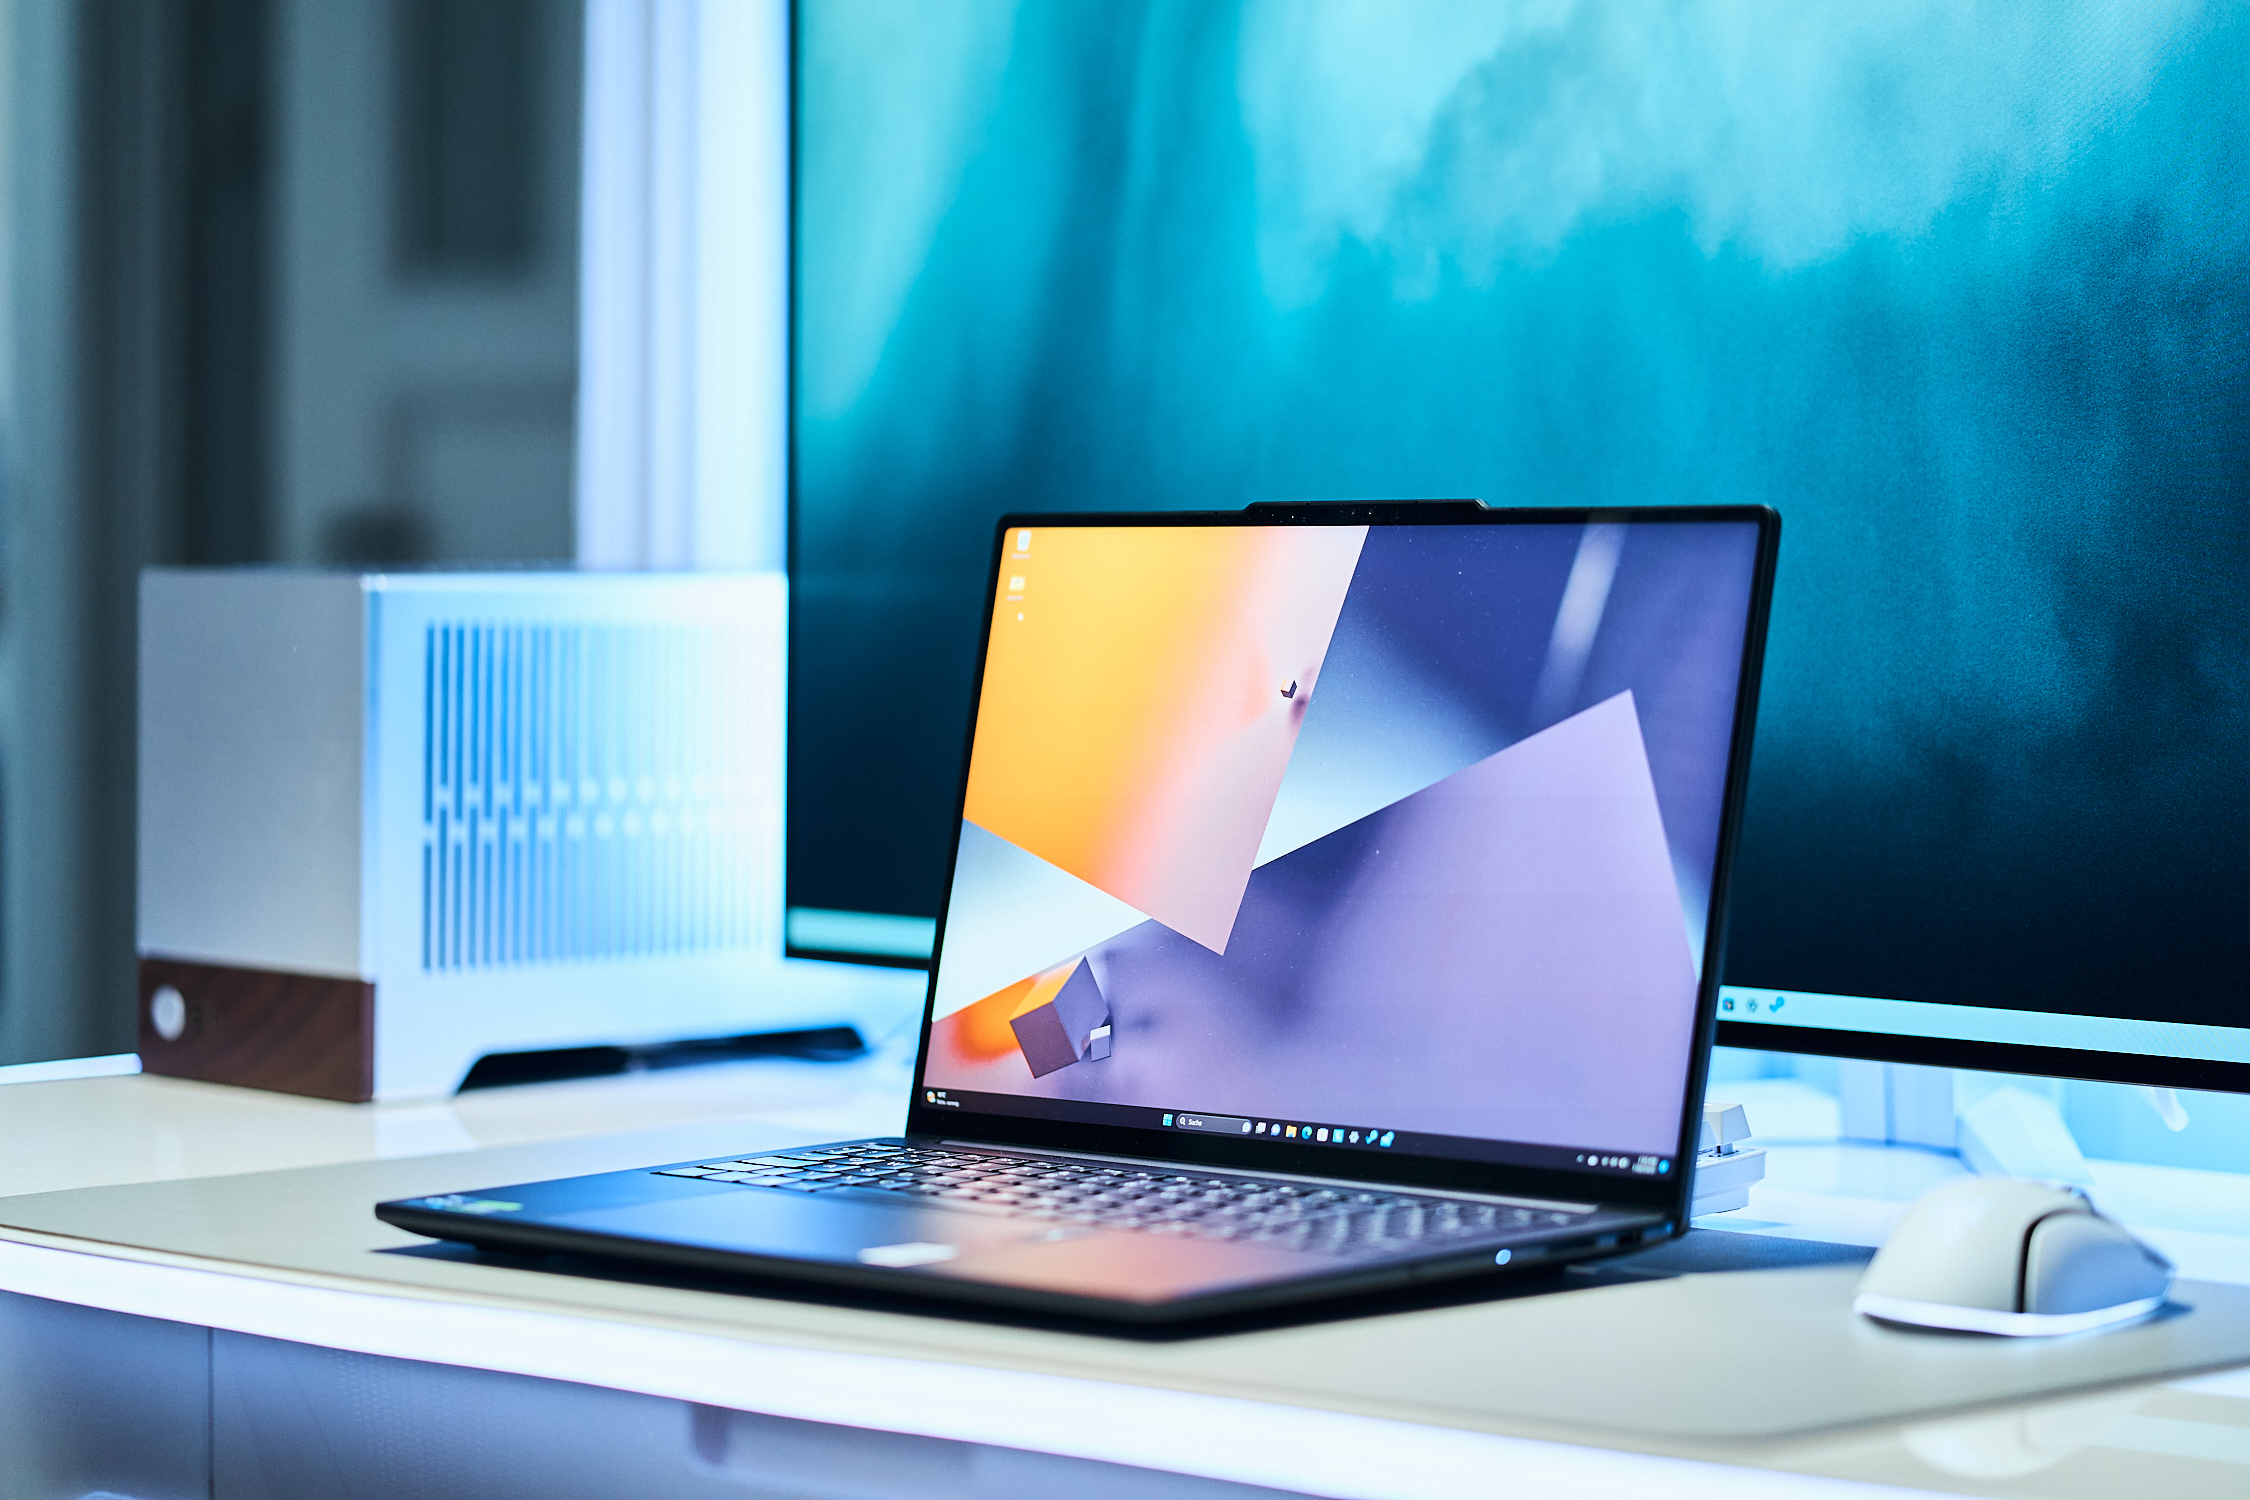
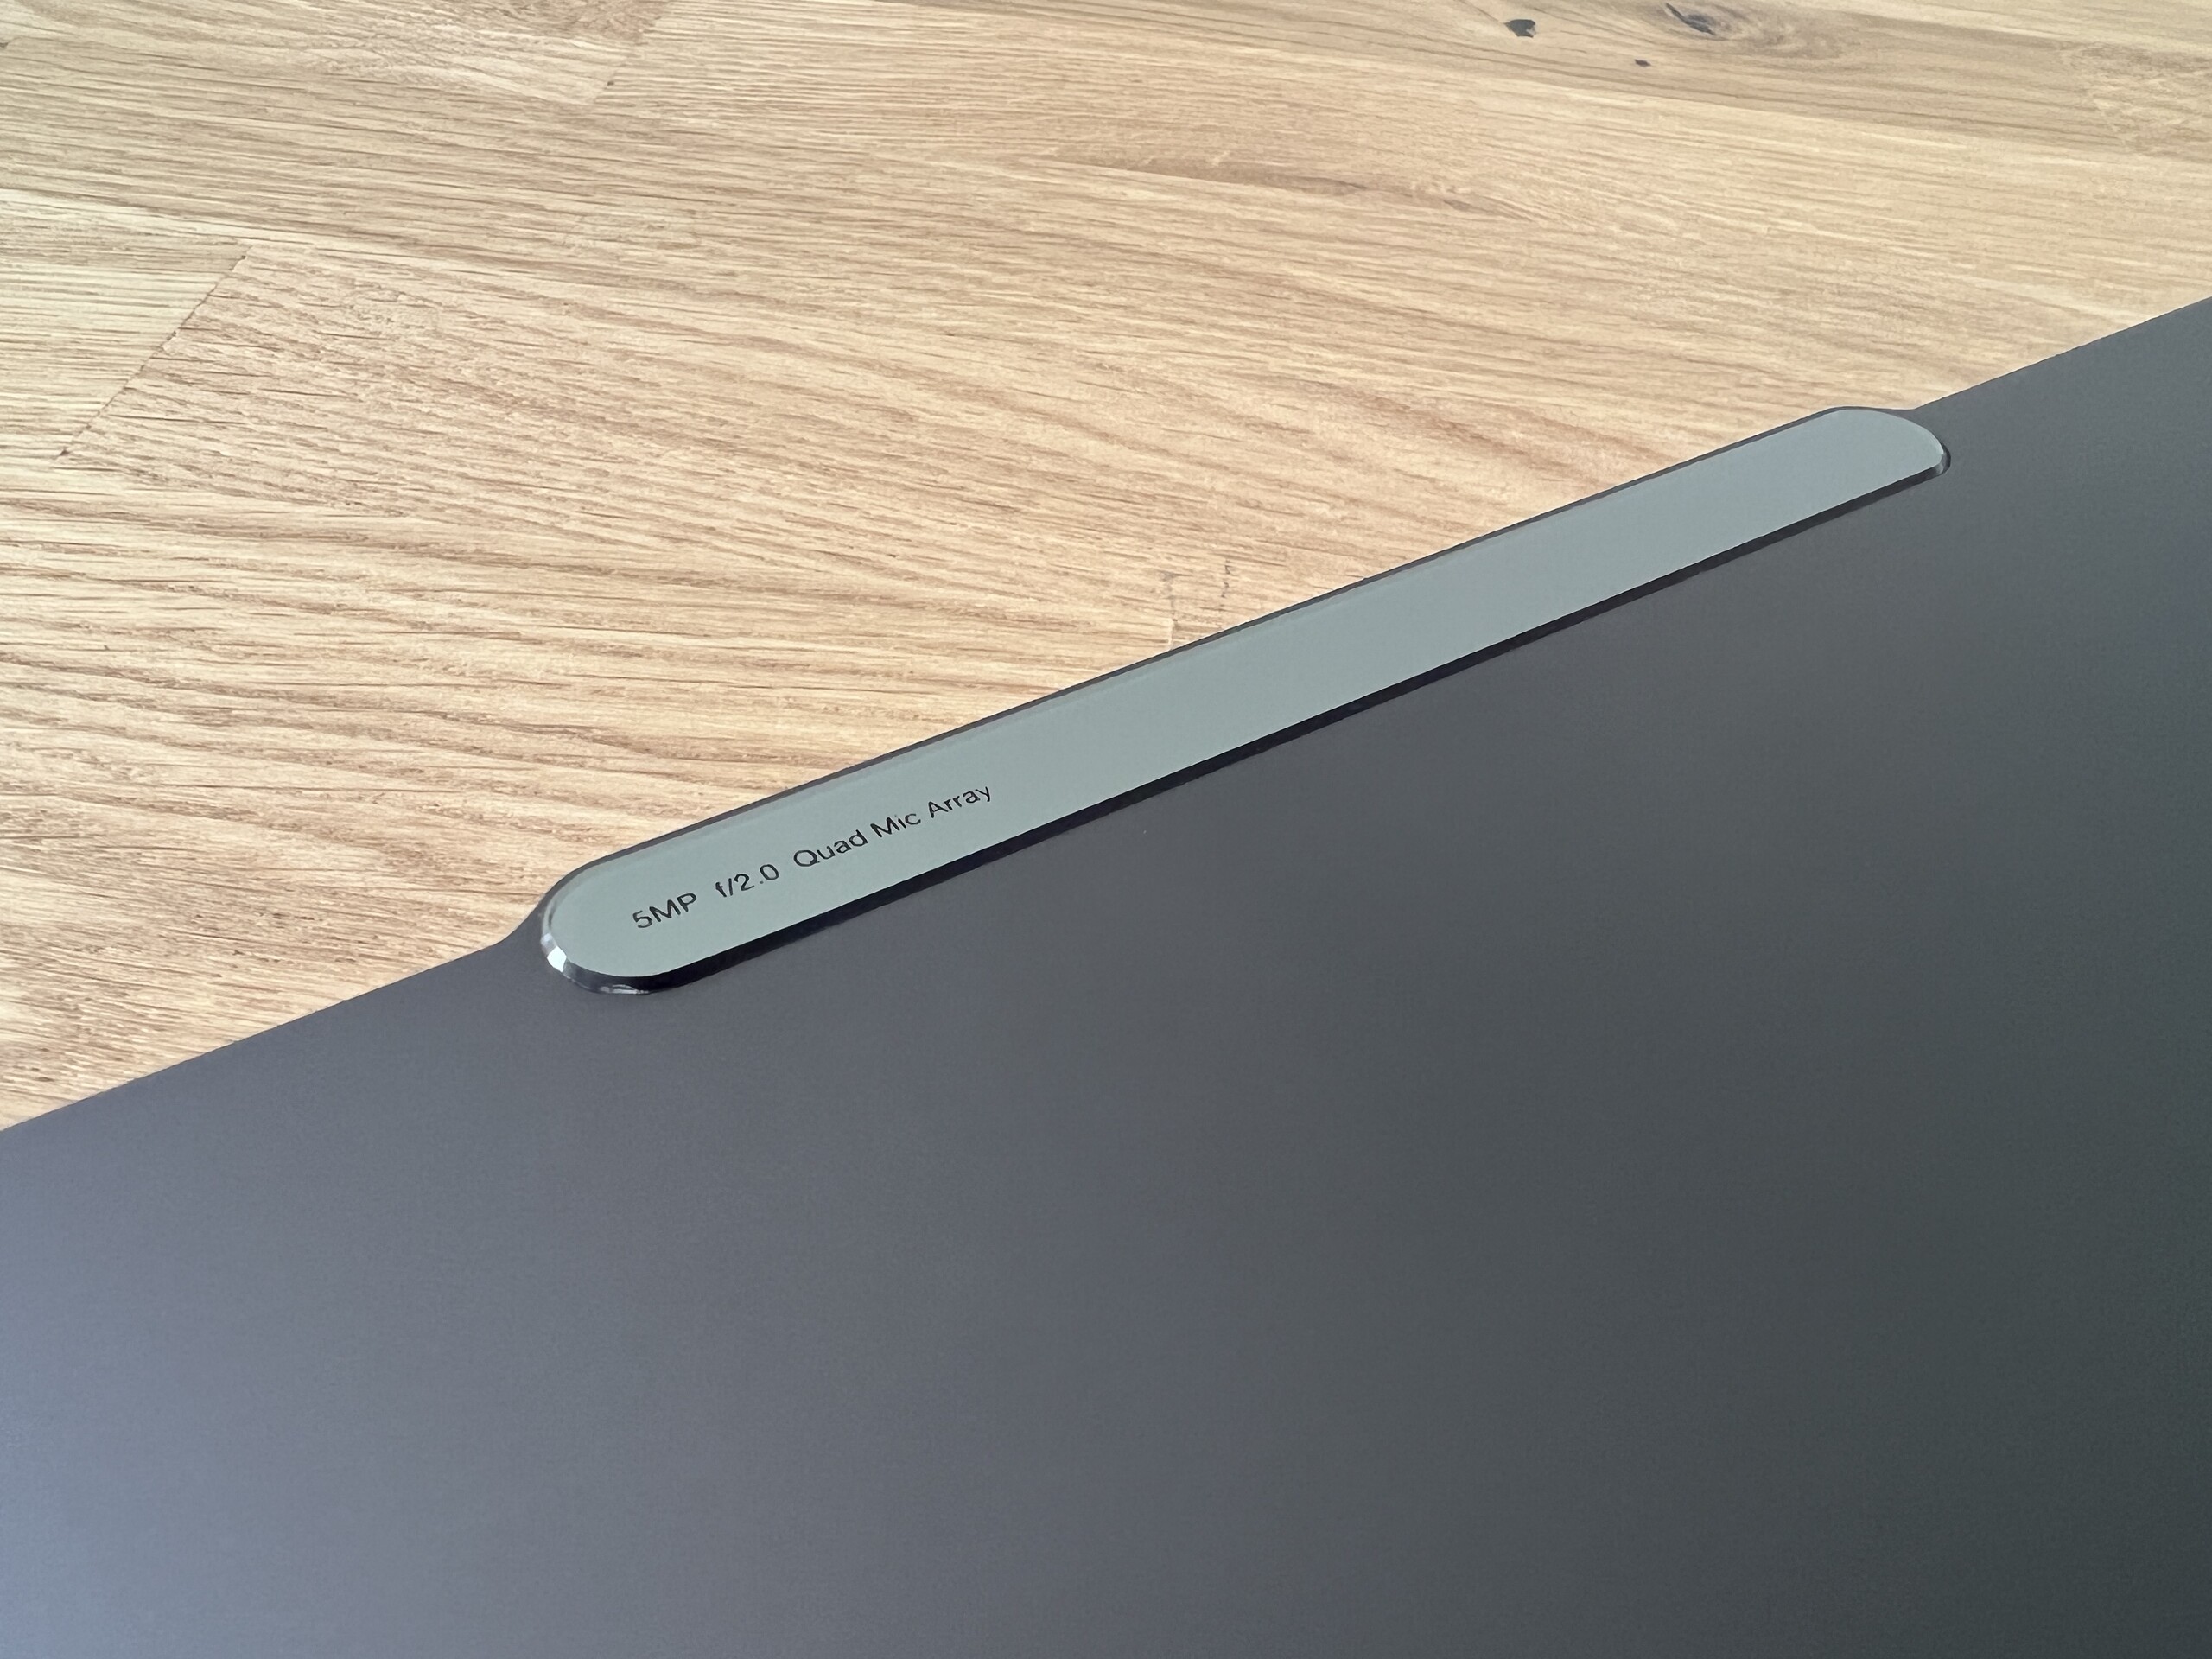
Vår testenhet är Strom Grey-varianten , som är mycket diskret och passar in på kontoret utan att väcka uppmärksamhet. De som vill ha det mer färgstarkt kan välja färgvarianten Tidal Teal (turkosgrön). Överlag ser designen väldigt modern ut och skärmens kanter är ganska smala, men kamerapuckeln är något irriterande eftersom den sitter lite djupare än resten av skärmlocket.
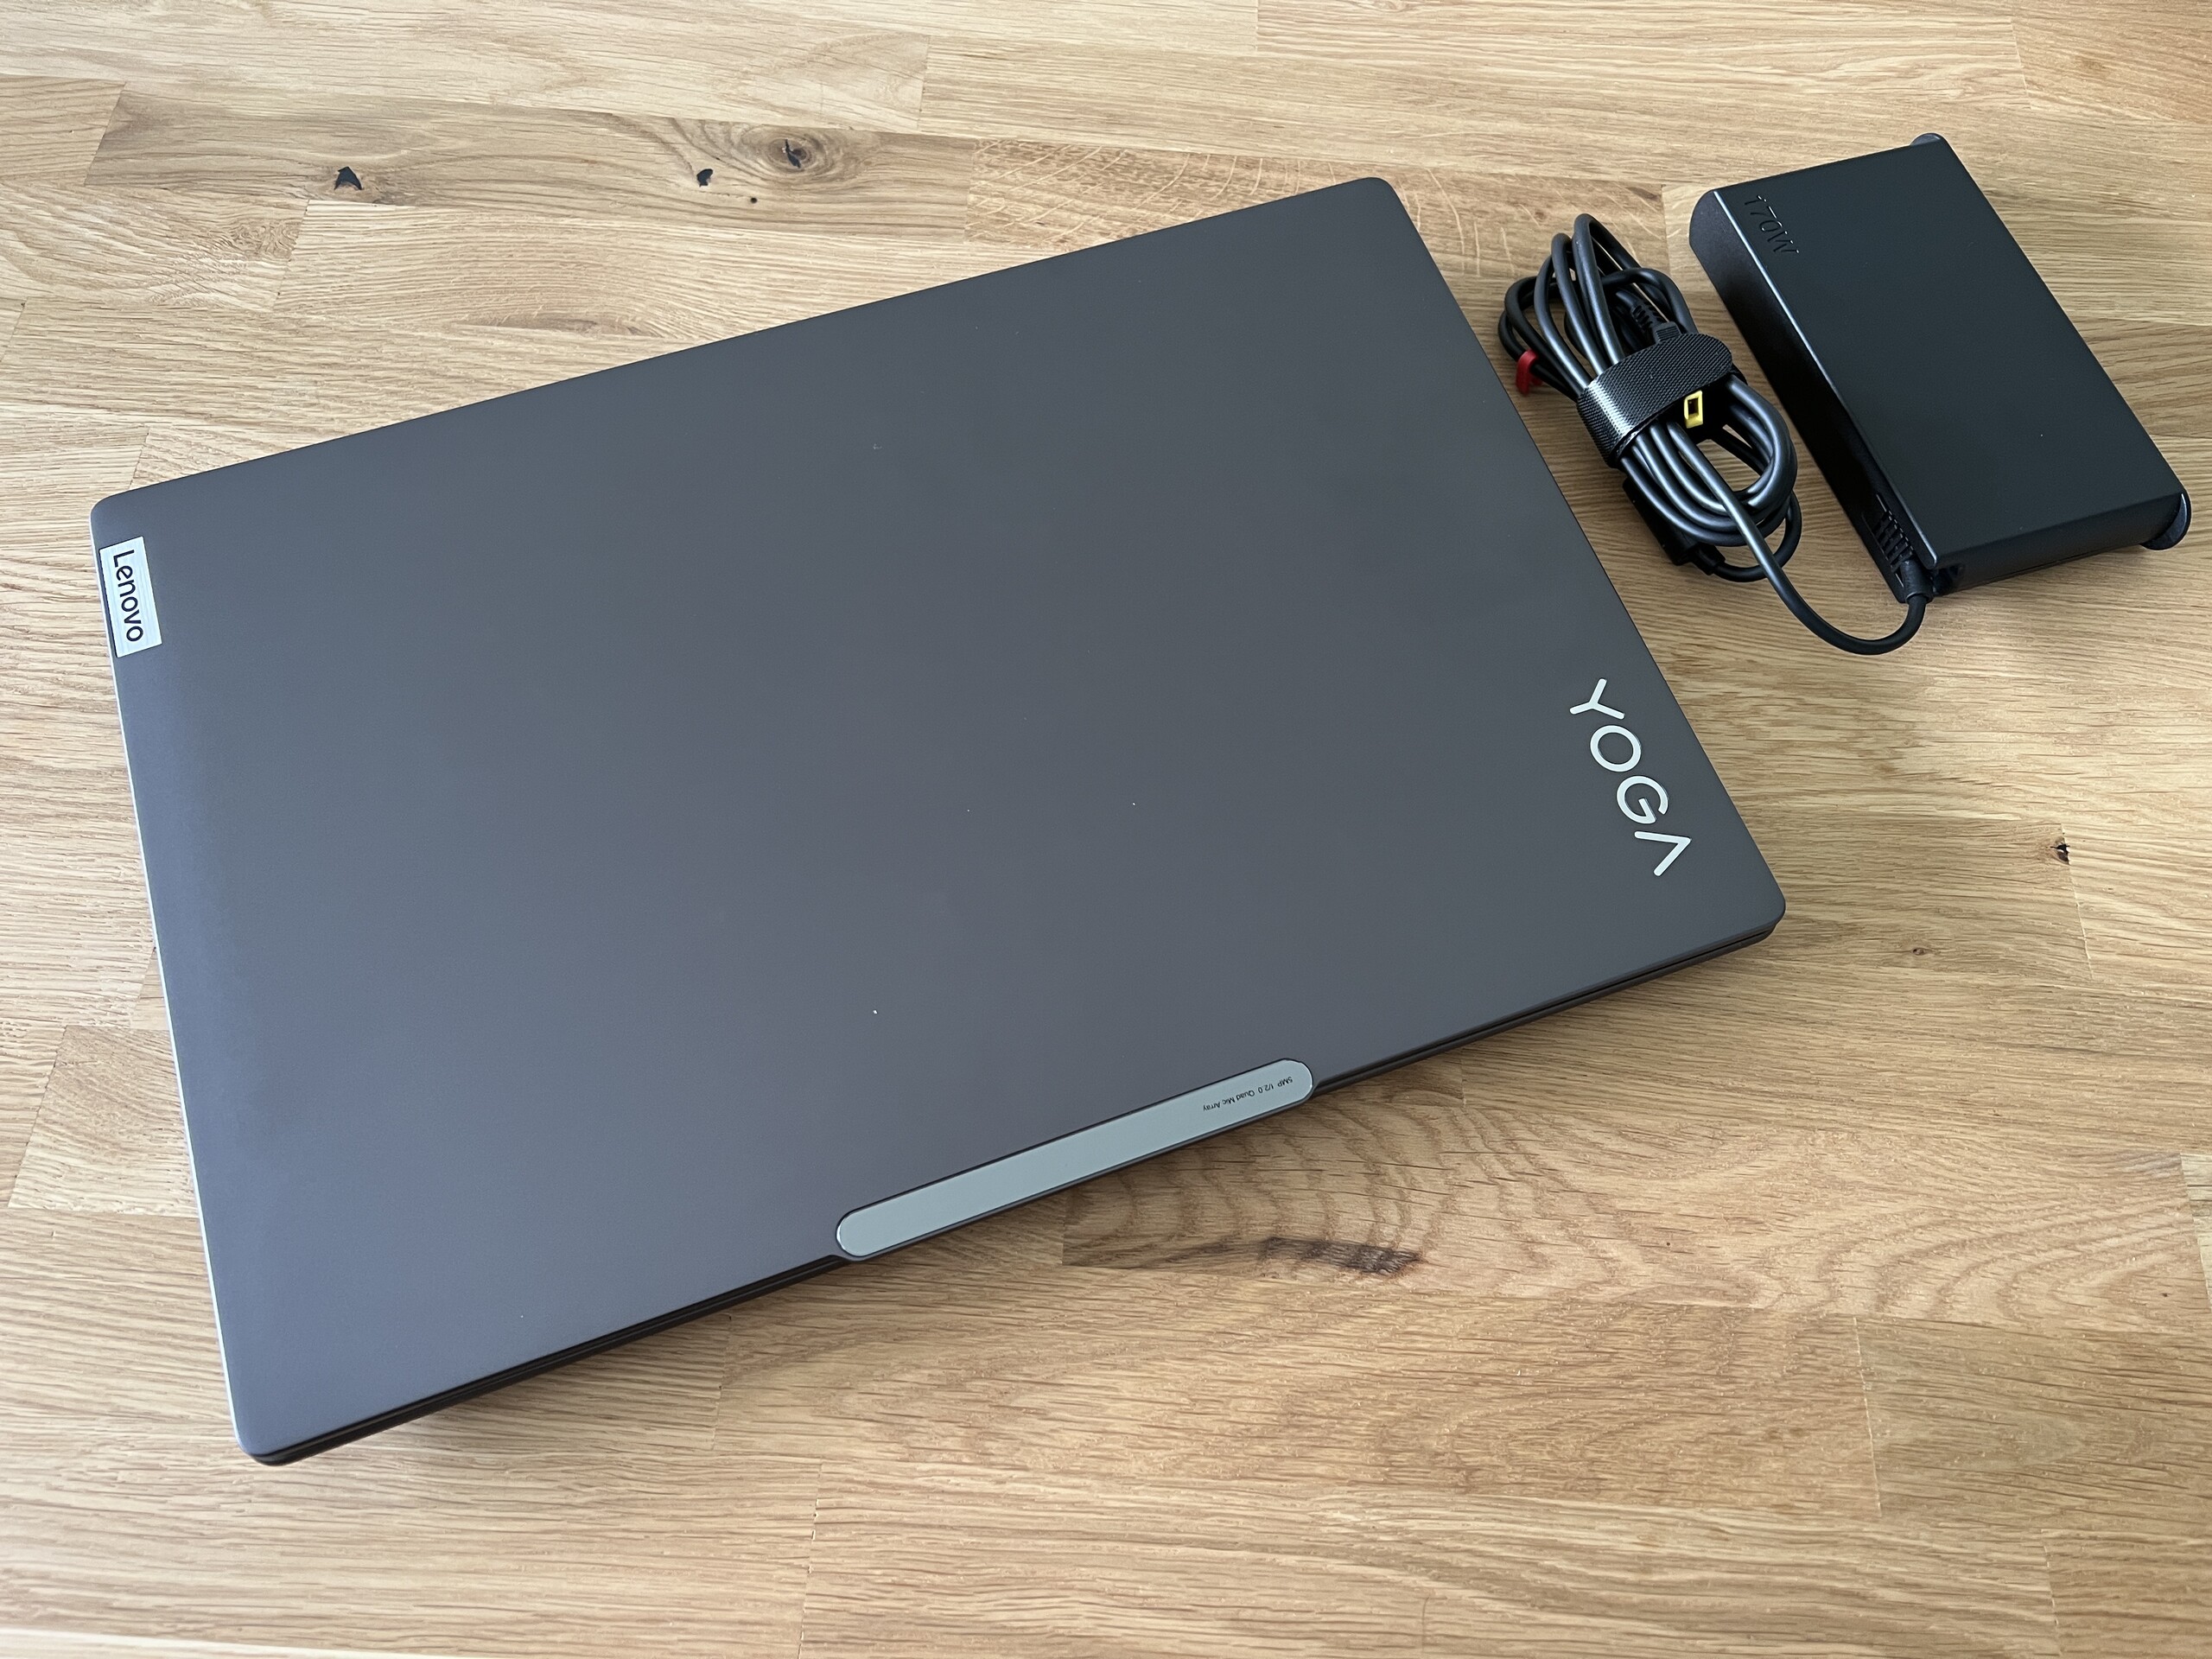
Tillsammans med Schenker Vision 16 Pro ochApple MacBook Pro 16har Yoga Pro 9i 16 det minsta fotavtrycket i jämförelsefältet, men är också en av de tyngre modellerna på drygt 2,2 kg, även om skillnaderna här inte är enorma. Det enda undantaget är Vision 16 Pro på bara 1,6 kg. Den medföljande nätadaptern på 170 watt väger ca 570 gram.
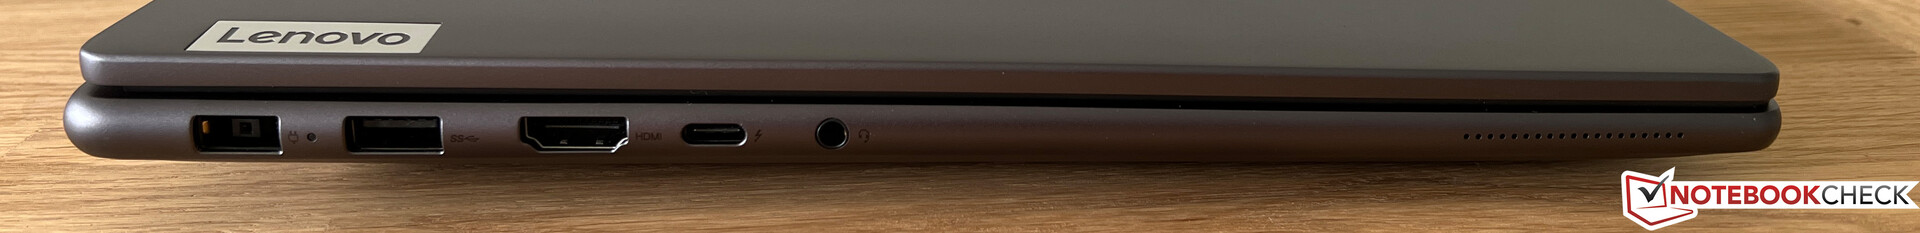
Utrustning - 16-tums Yoga Pro med endast HDMI 1.4b
Skillnader mot den mindre modellen finns i portarna. Endast en USB-C-port är installerad här, som åtminstone också stöder Thunderbolt 4 och kan användas för laddning vid behov (detta fungerade utan problem med en 65-watts strömförsörjning). Eftersom det finns en dedikerad strömförsörjning (SlimTip) här kan bristen på en andra USB-port förbises, men vi förstår inte varför HMDI-utgången i 16-tumsversionen bara stöder 1.4b-standarden, varför 4K bara kan matas ut vid 30 Hz.
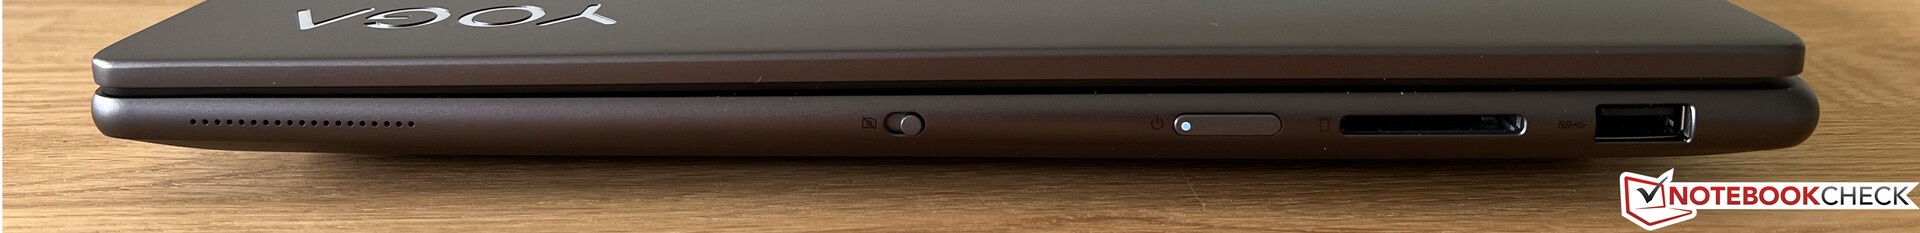
SD-kortläsare
Kortläsaren till höger tar vanliga SD-kort, som sticker ut ca 2 cm från enheten. Överföringshastigheten i kombination med vårt referenskort Angelbird AV Pro V60 är ca 80 MB/s. Detta är ett medelvärde som klart överträffas av vissa konkurrenter.
| SD Card Reader | |
| average JPG Copy Test (av. of 3 runs) | |
| Apple MacBook Pro 16 2023 M2 Max (Angelbird AV Pro V60) | |
| MSI Stealth 16 Studio A13VG | |
| Genomsnitt av klass Multimedia (23 - 531, n=36, senaste 2 åren) | |
| Asus Vivobook Pro 16X K6604JV-MX016W | |
| Lenovo Yoga Pro 9 16-IRP G8 (Angelibird AV Pro V60) | |
| Asus ProArt Studiobook 16 OLED H7604 (Angelibird AV Pro V60) | |
| Schenker VISION 16 Pro (M23) (Angelbird AV Pro V60) | |
| maximum AS SSD Seq Read Test (1GB) | |
| Apple MacBook Pro 16 2023 M2 Max (Angelbird AV Pro V60) | |
| Genomsnitt av klass Multimedia (37.3 - 1455, n=35, senaste 2 åren) | |
| MSI Stealth 16 Studio A13VG | |
| Asus Vivobook Pro 16X K6604JV-MX016W | |
| Asus ProArt Studiobook 16 OLED H7604 (Angelibird AV Pro V60) | |
| Lenovo Yoga Pro 9 16-IRP G8 (Angelibird AV Pro V60) | |
| Schenker VISION 16 Pro (M23) (Angelbird AV Pro V60) | |
Kommunikation
En port för trådbundna nätverksanslutningar finns inte, men detta kan implementeras via en USB-adapter som tillval. Intels AX211-modul, som också stöder den nuvarande Wi-Fi 6E-standarden, är ansvarig för trådlösa anslutningar. Vi uppmätte höga och stabila överföringshastigheter med vår Asus referensrouter. Inga problem uppstod heller i praktiken, varken vid stora dataöverföringar eller nedladdningar.
| Networking | |
| Lenovo Yoga Pro 9 16-IRP G8 | |
| iperf3 transmit AXE11000 | |
| iperf3 receive AXE11000 | |
| Schenker VISION 16 Pro (M23) | |
| iperf3 transmit AXE11000 | |
| iperf3 receive AXE11000 | |
| Asus Vivobook Pro 16X K6604JV-MX016W | |
| iperf3 transmit AXE11000 | |
| iperf3 receive AXE11000 | |
| iperf3 transmit AXE11000 6GHz | |
| iperf3 receive AXE11000 6GHz | |
| Asus ProArt Studiobook 16 OLED H7604 | |
| iperf3 transmit AXE11000 | |
| iperf3 receive AXE11000 | |
| MSI Stealth 16 Studio A13VG | |
| iperf3 transmit AXE11000 | |
| iperf3 receive AXE11000 | |
| iperf3 transmit AXE11000 6GHz | |
| iperf3 receive AXE11000 6GHz | |
| Apple MacBook Pro 16 2023 M2 Max | |
| iperf3 transmit AXE11000 6GHz | |
| iperf3 receive AXE11000 6GHz | |
Webbkamera
Den något tjockare kamerapuckeln rymmer en 5 MP-kamera som ger bra bildkvalitet, både för bilder och videor. Därmed behövs ingen extern webbkamera, särskilt inte för videokonferenser. En IR-sensor är också installerad, vilket möjliggör ansiktsigenkänning via Windows Hello. Kameran kan avaktiveras via ett litet skjutreglage på höger sida av höljet (e-shutter).


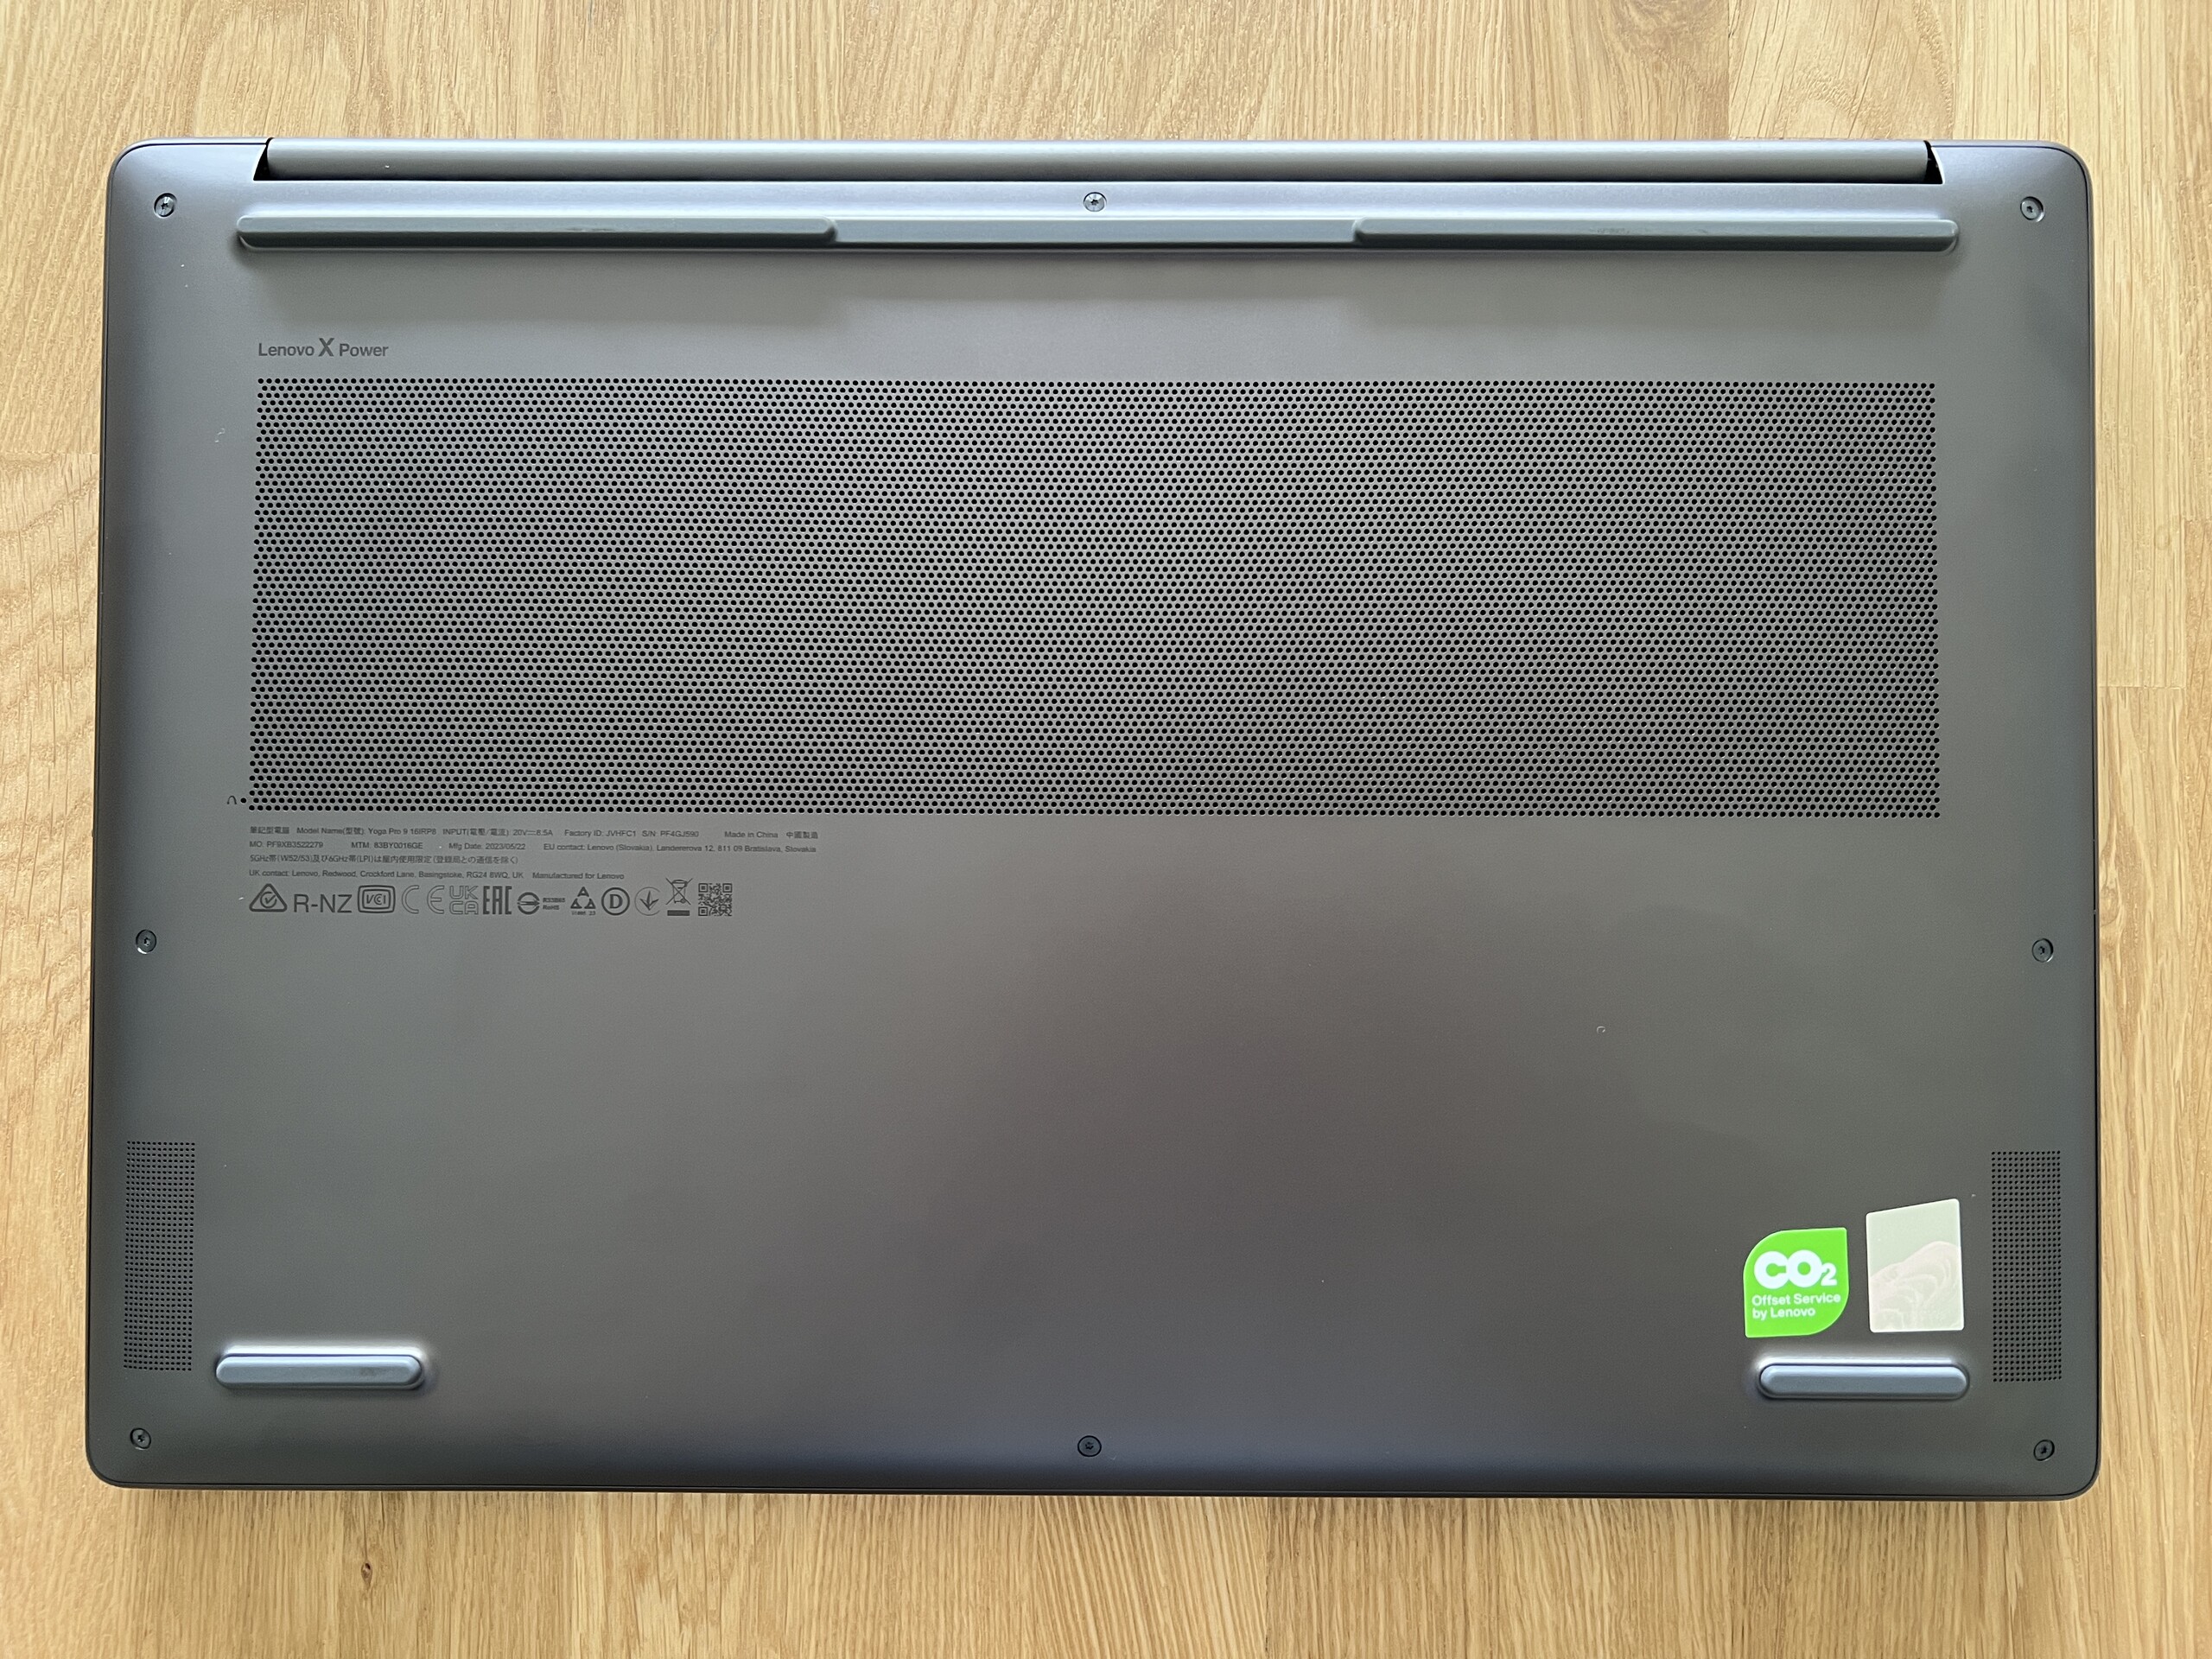
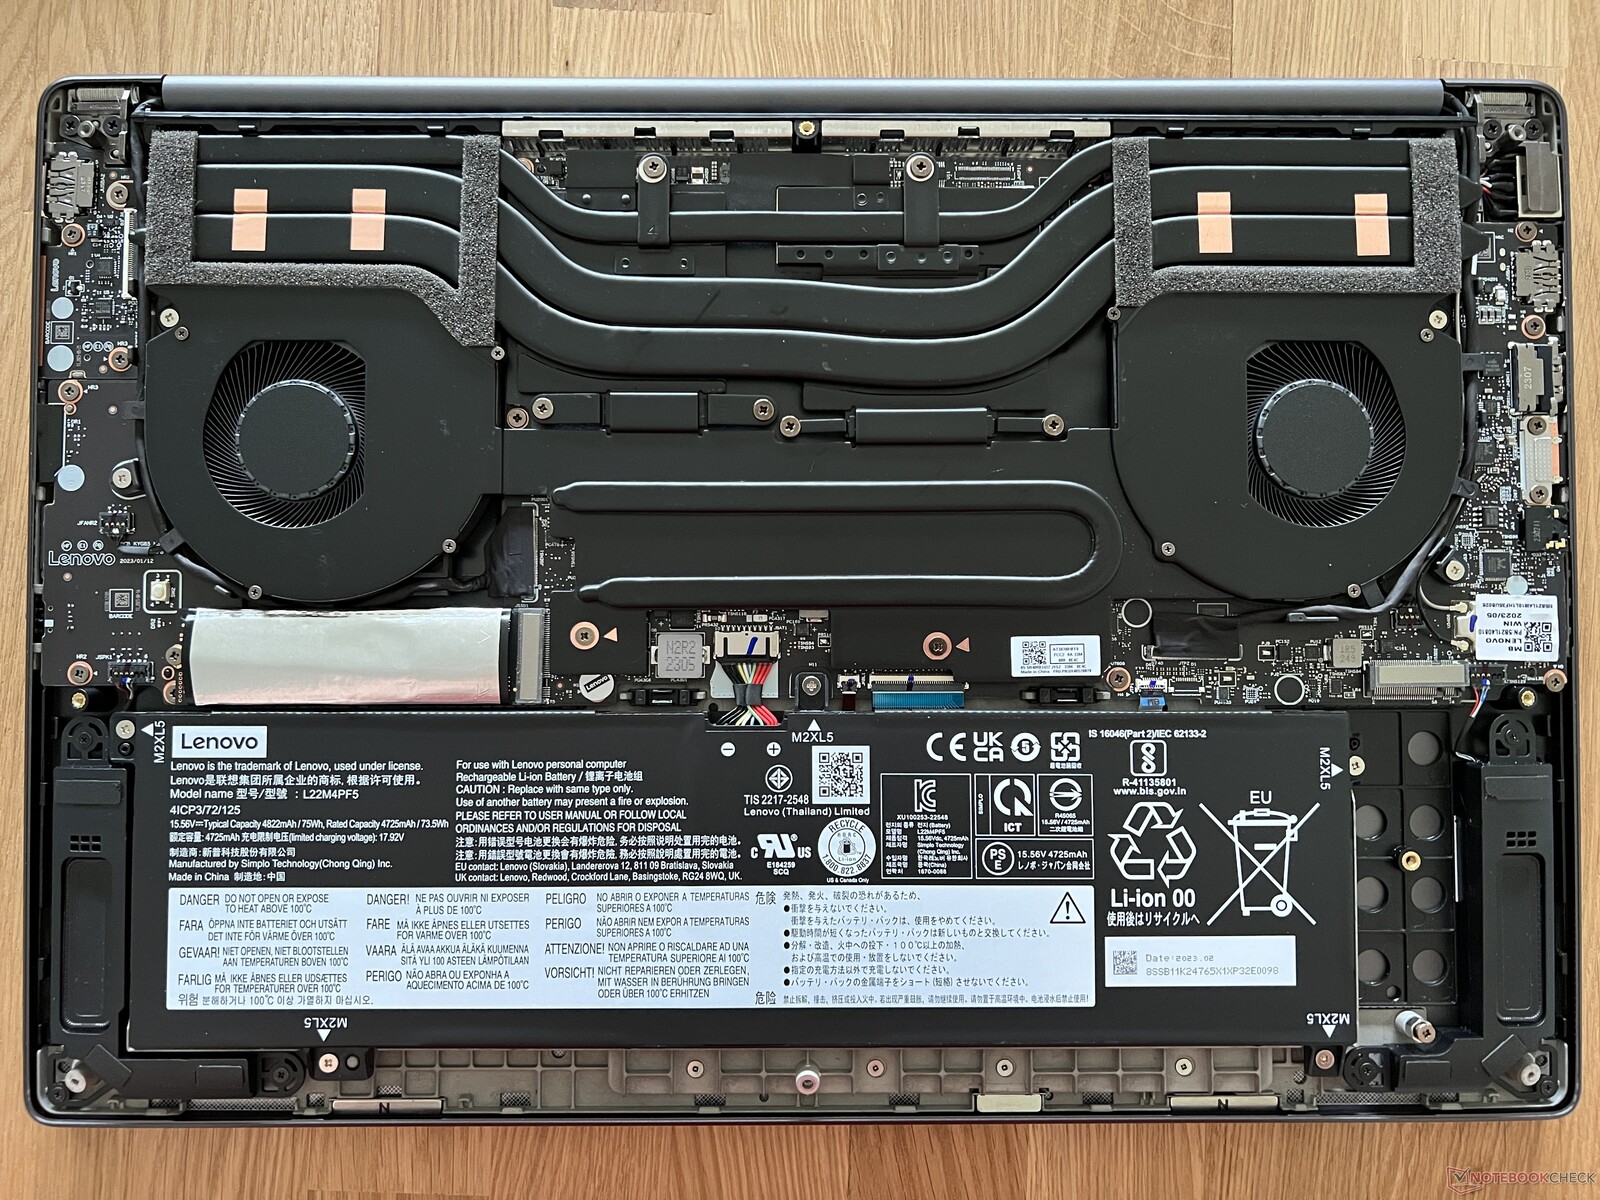
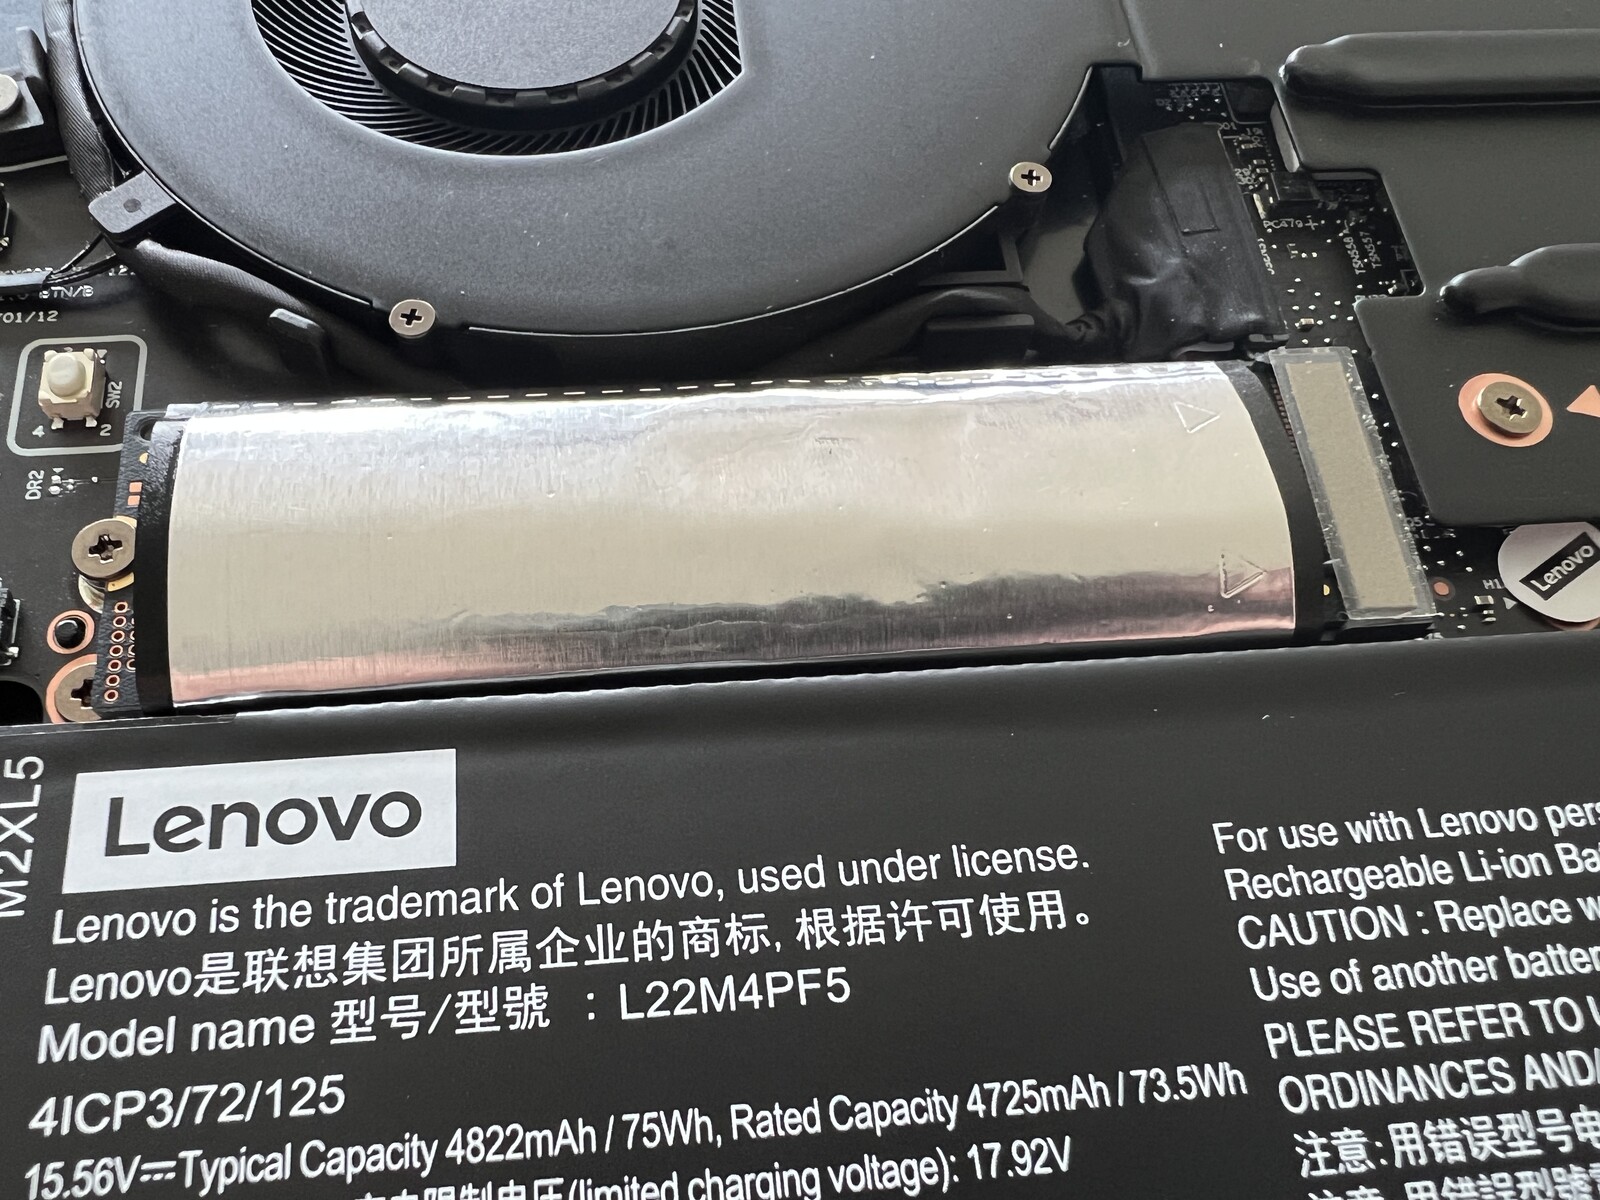
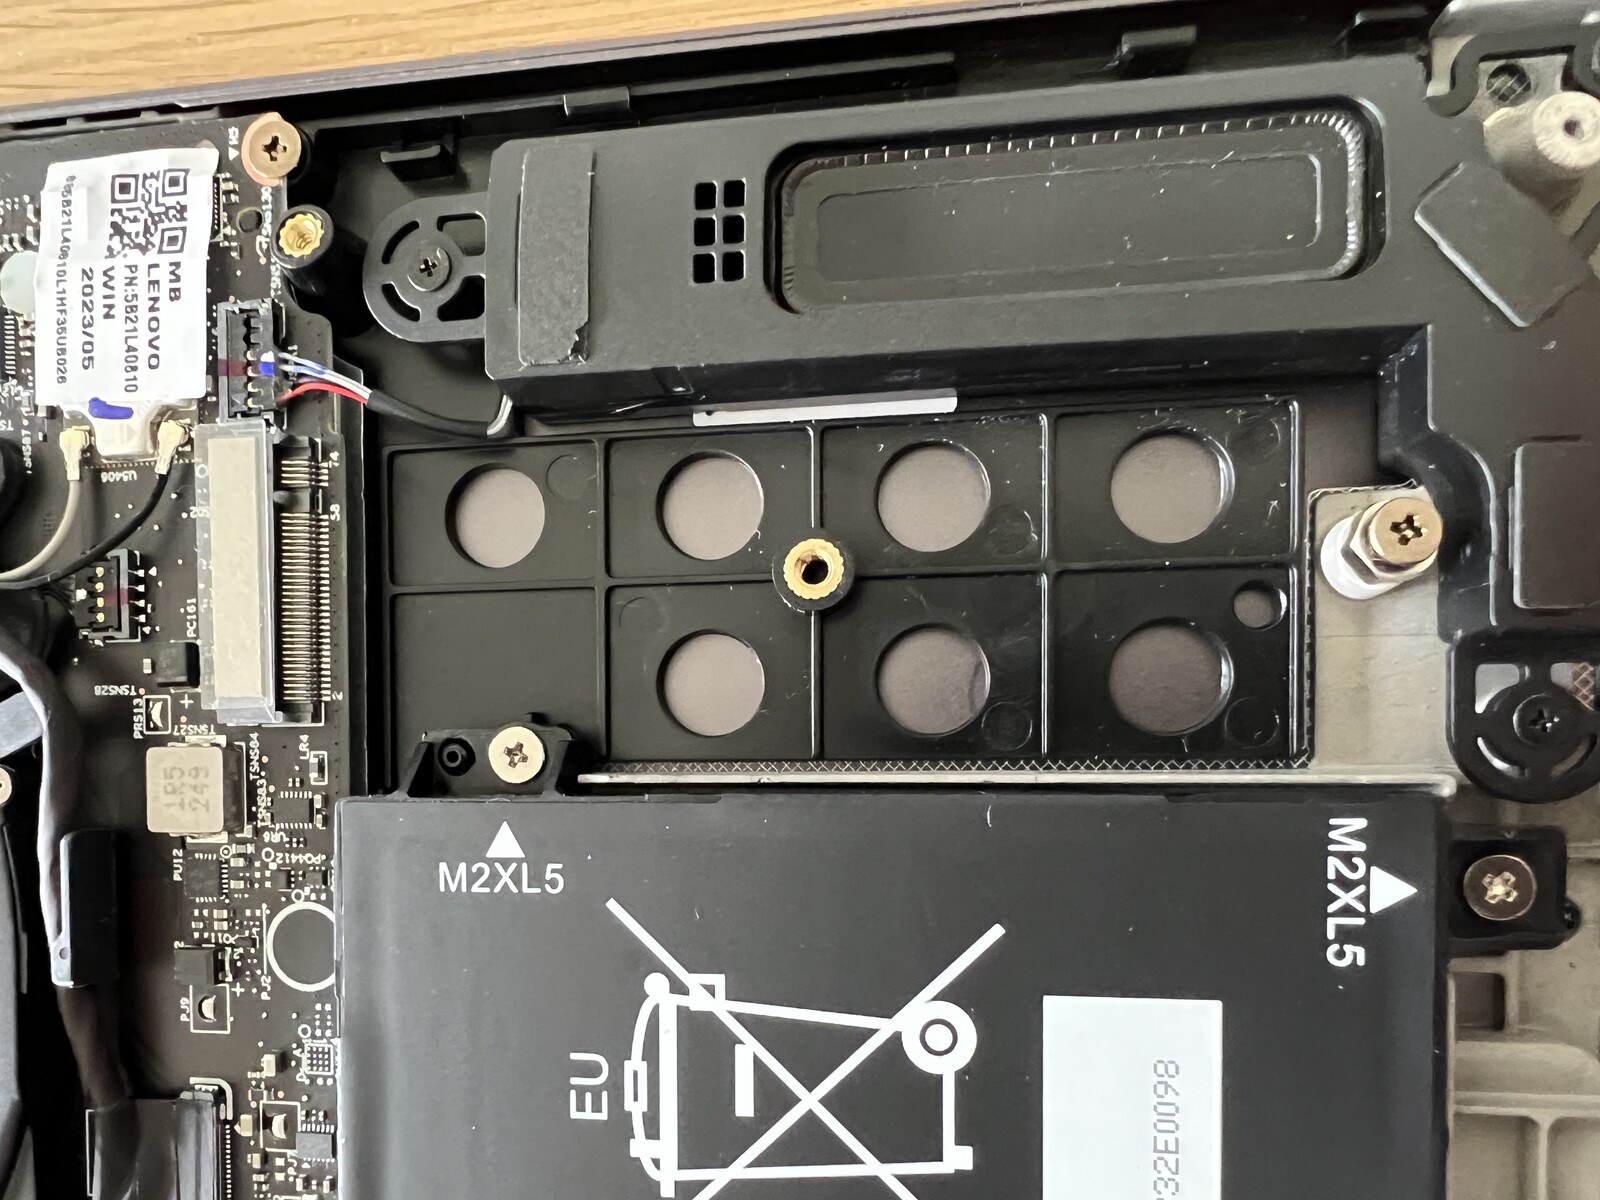
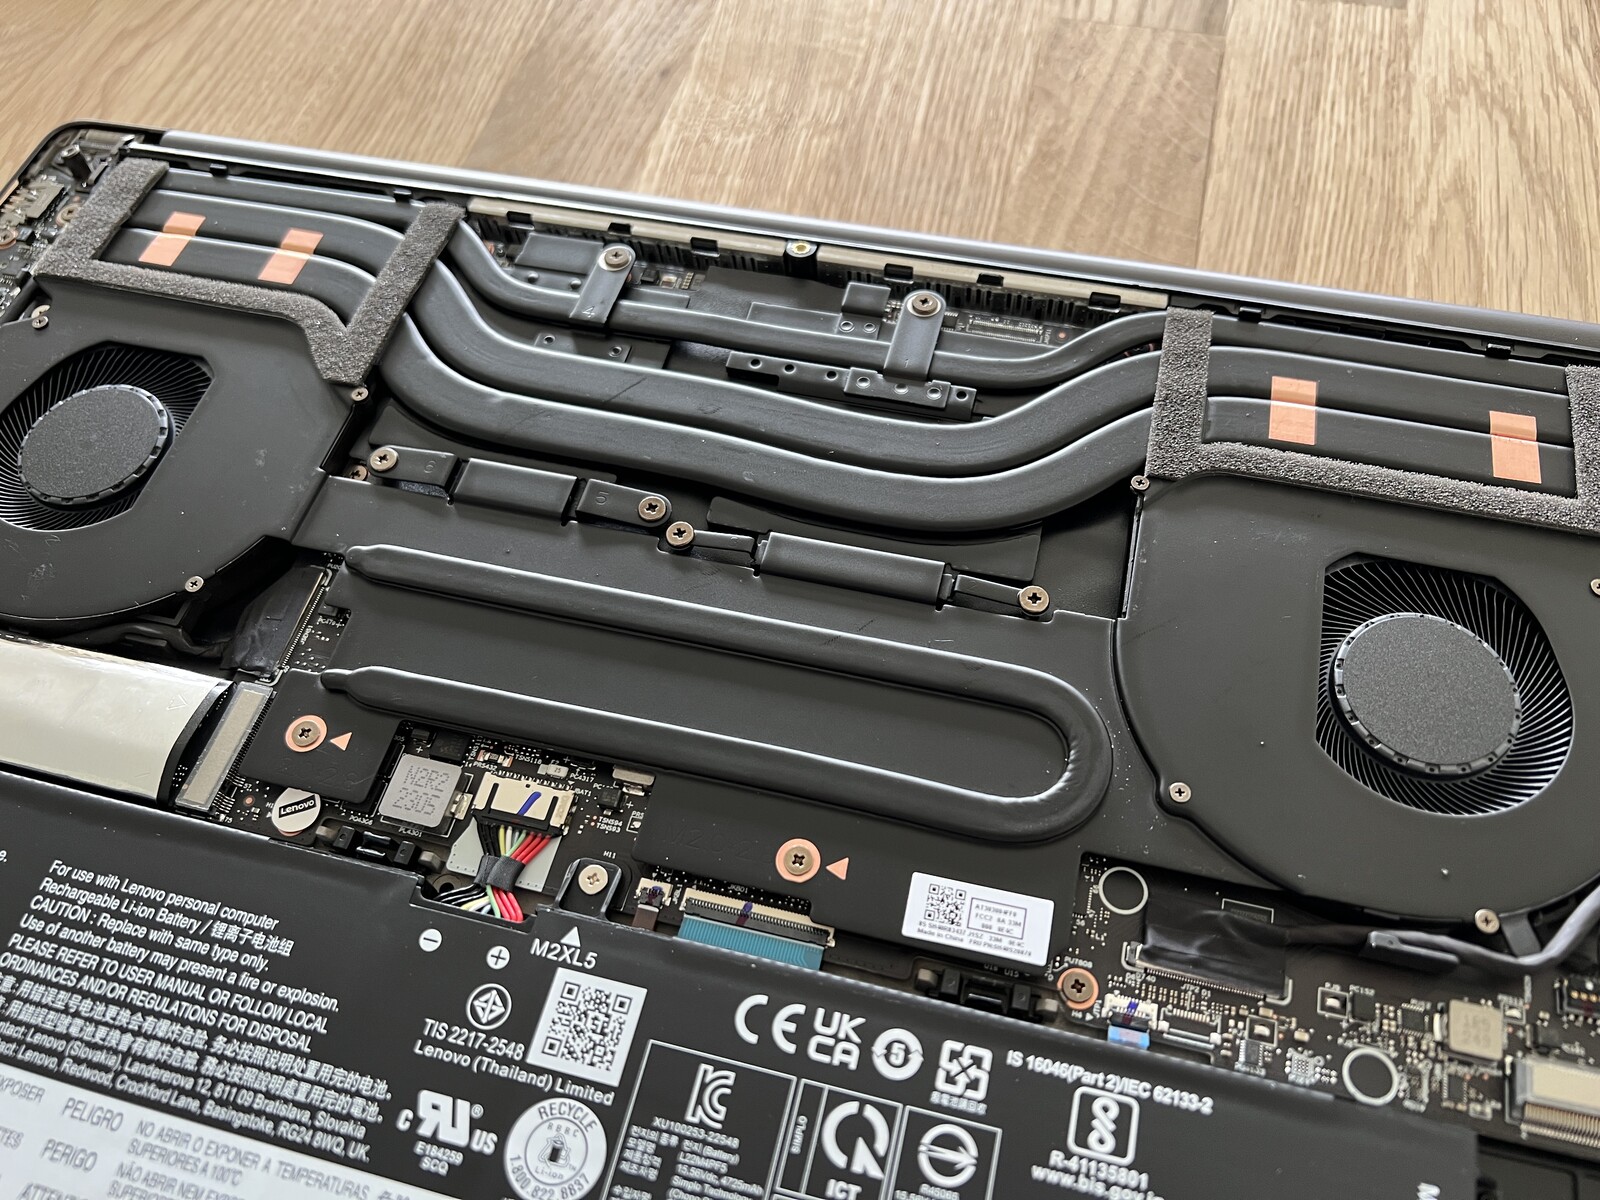
Underhåll
Basplattan är fäst med några Torx-skruvar (T5) och kan enkelt tas bort. Du har då tillgång till de två fläktarna, batteriet och de två platserna för M.2-2280 SSD-enheter. RAM-minnet och WLAN-modulen är dock lödda.
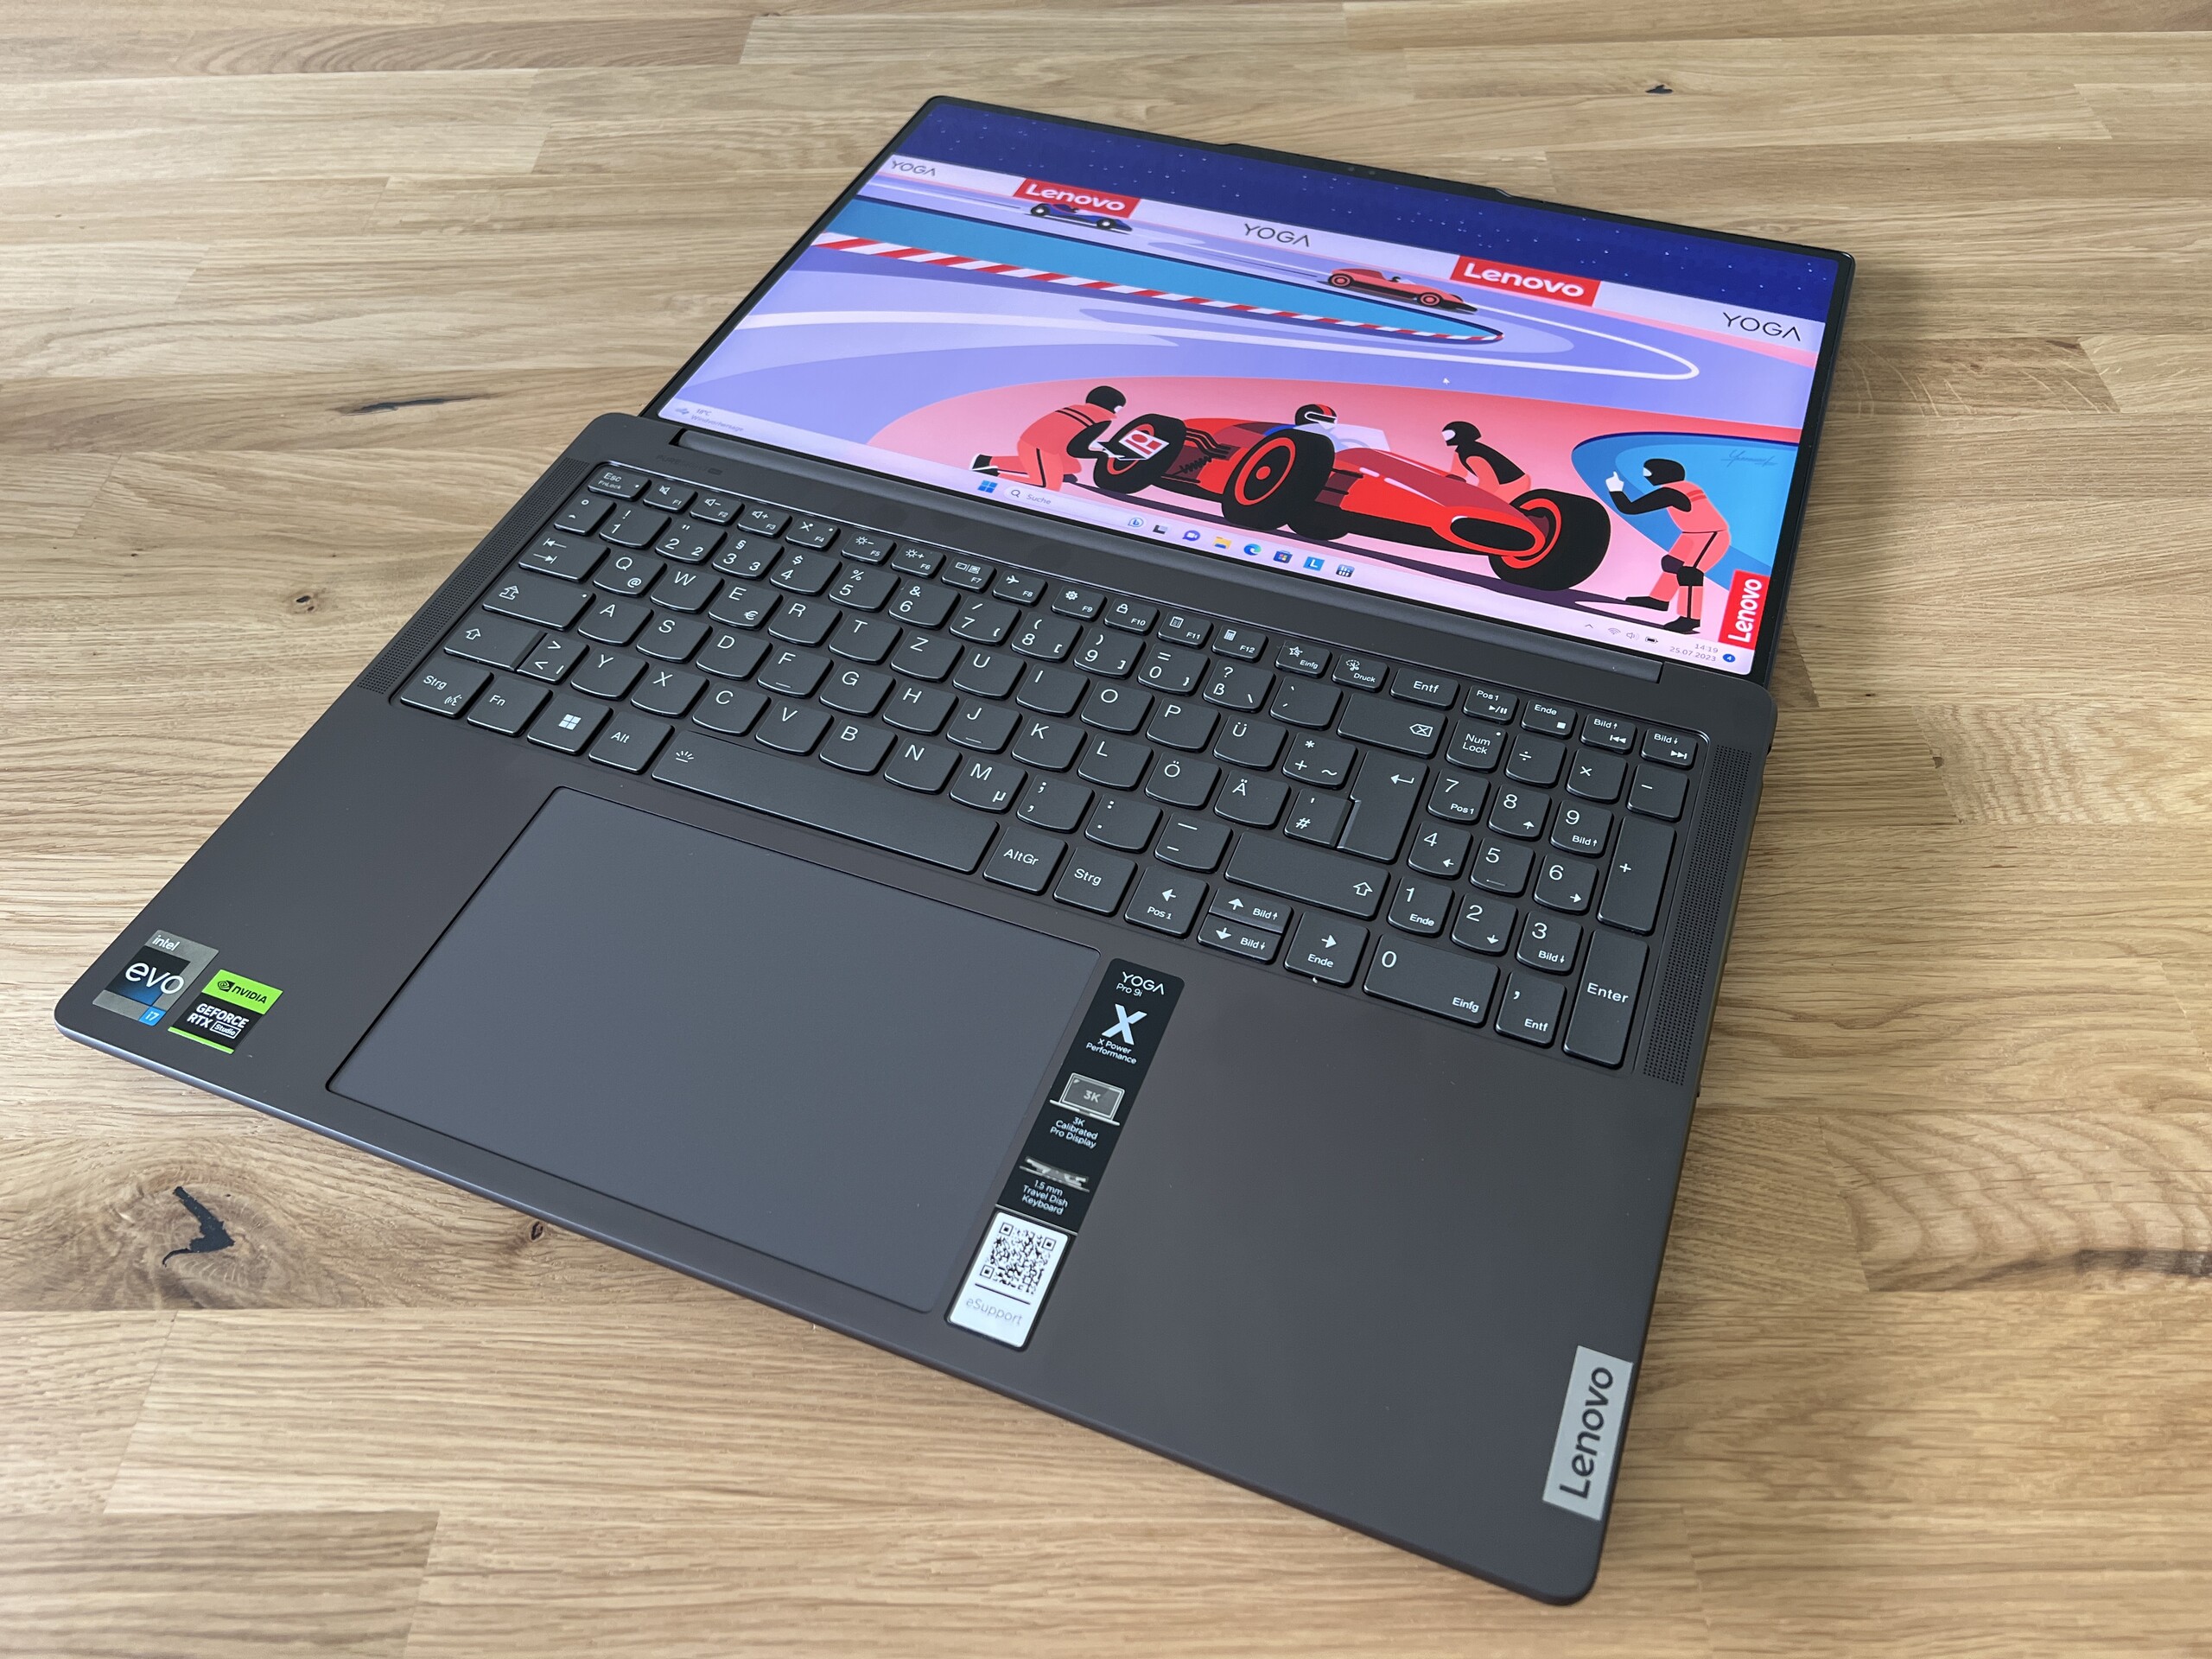
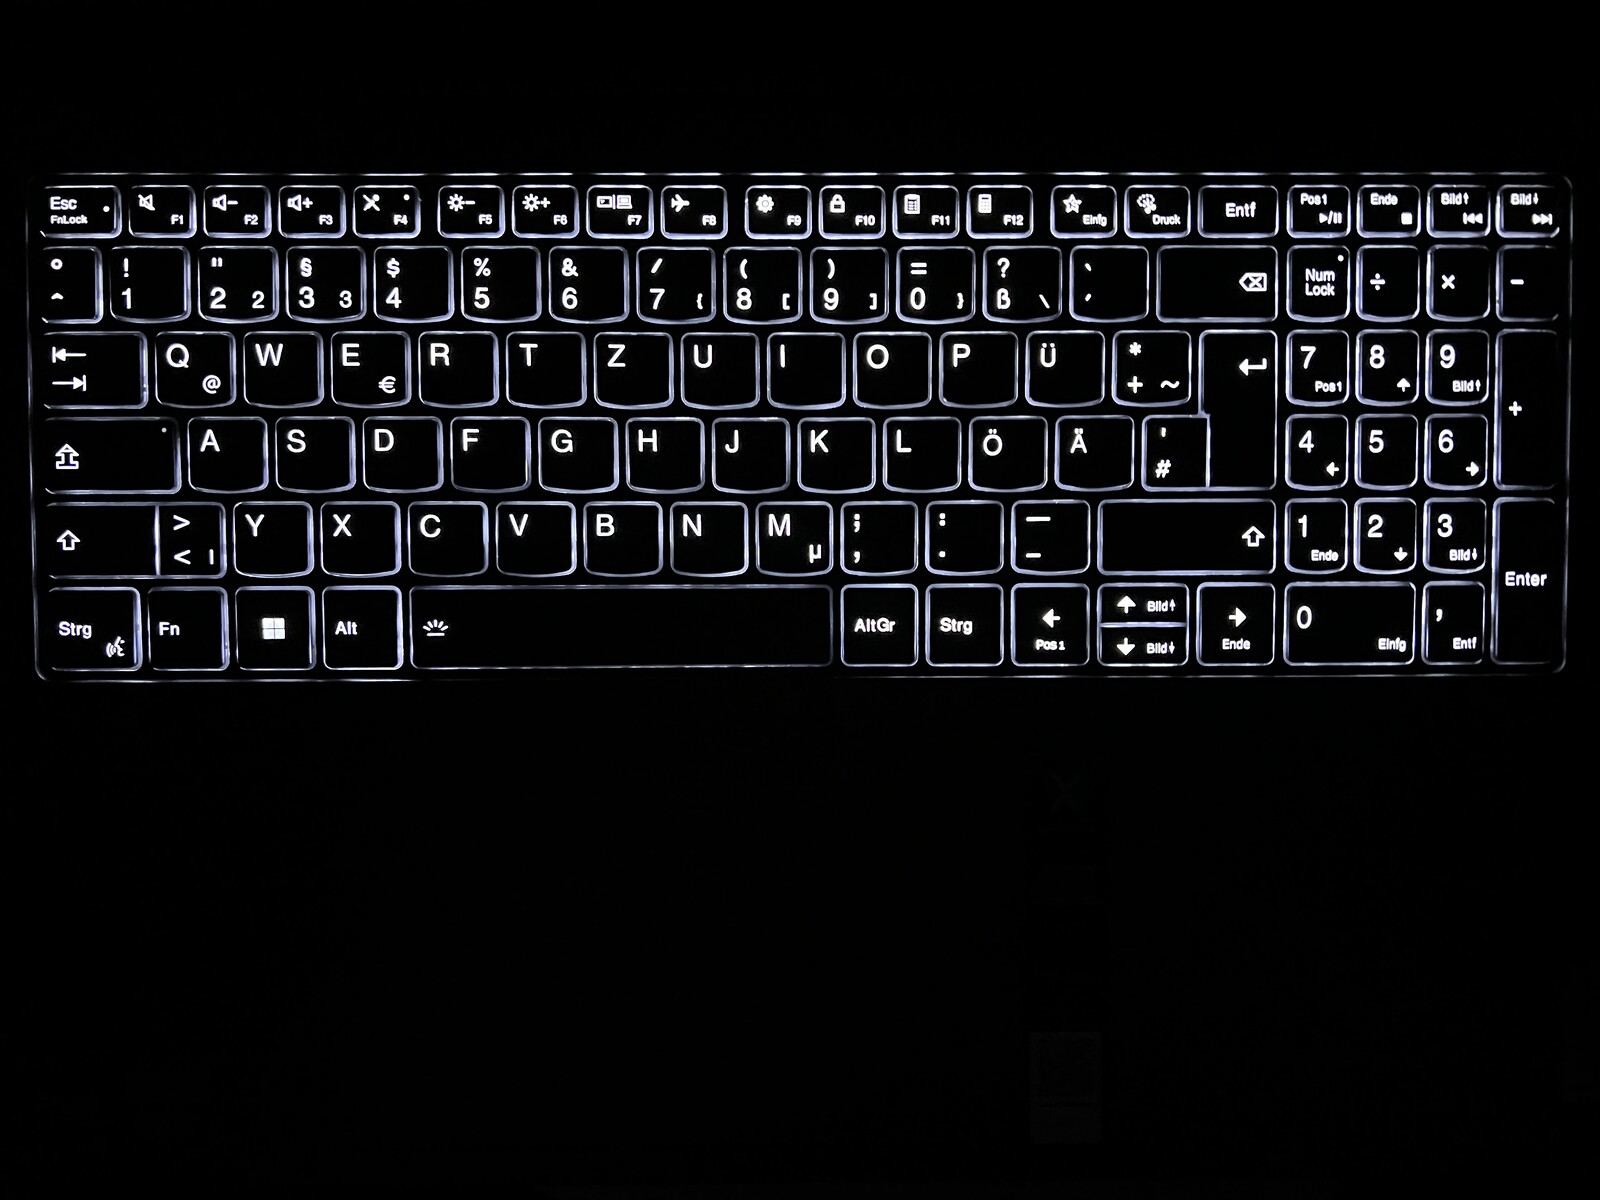
Inmatningsenheter - Lenovo installerar ett bra tangentbord med numpad
Lenovo har inte lämnat den extra bredden oanvänd och lägger till en dedikerad sifferknapp till tangentbordet. Precis som i den mindre Yoga Pro 9i 14installerar tillverkaren ett bekvämt och exakt tangentbord som också erbjuder tillräcklig tangentresa på 1,5 mm. Längre texter kan också skrivas utan ansträngning. En tvåstegs vit bakgrundsbelysning som kan aktiveras automatiskt via sensor hjälper till i mörka miljöer.
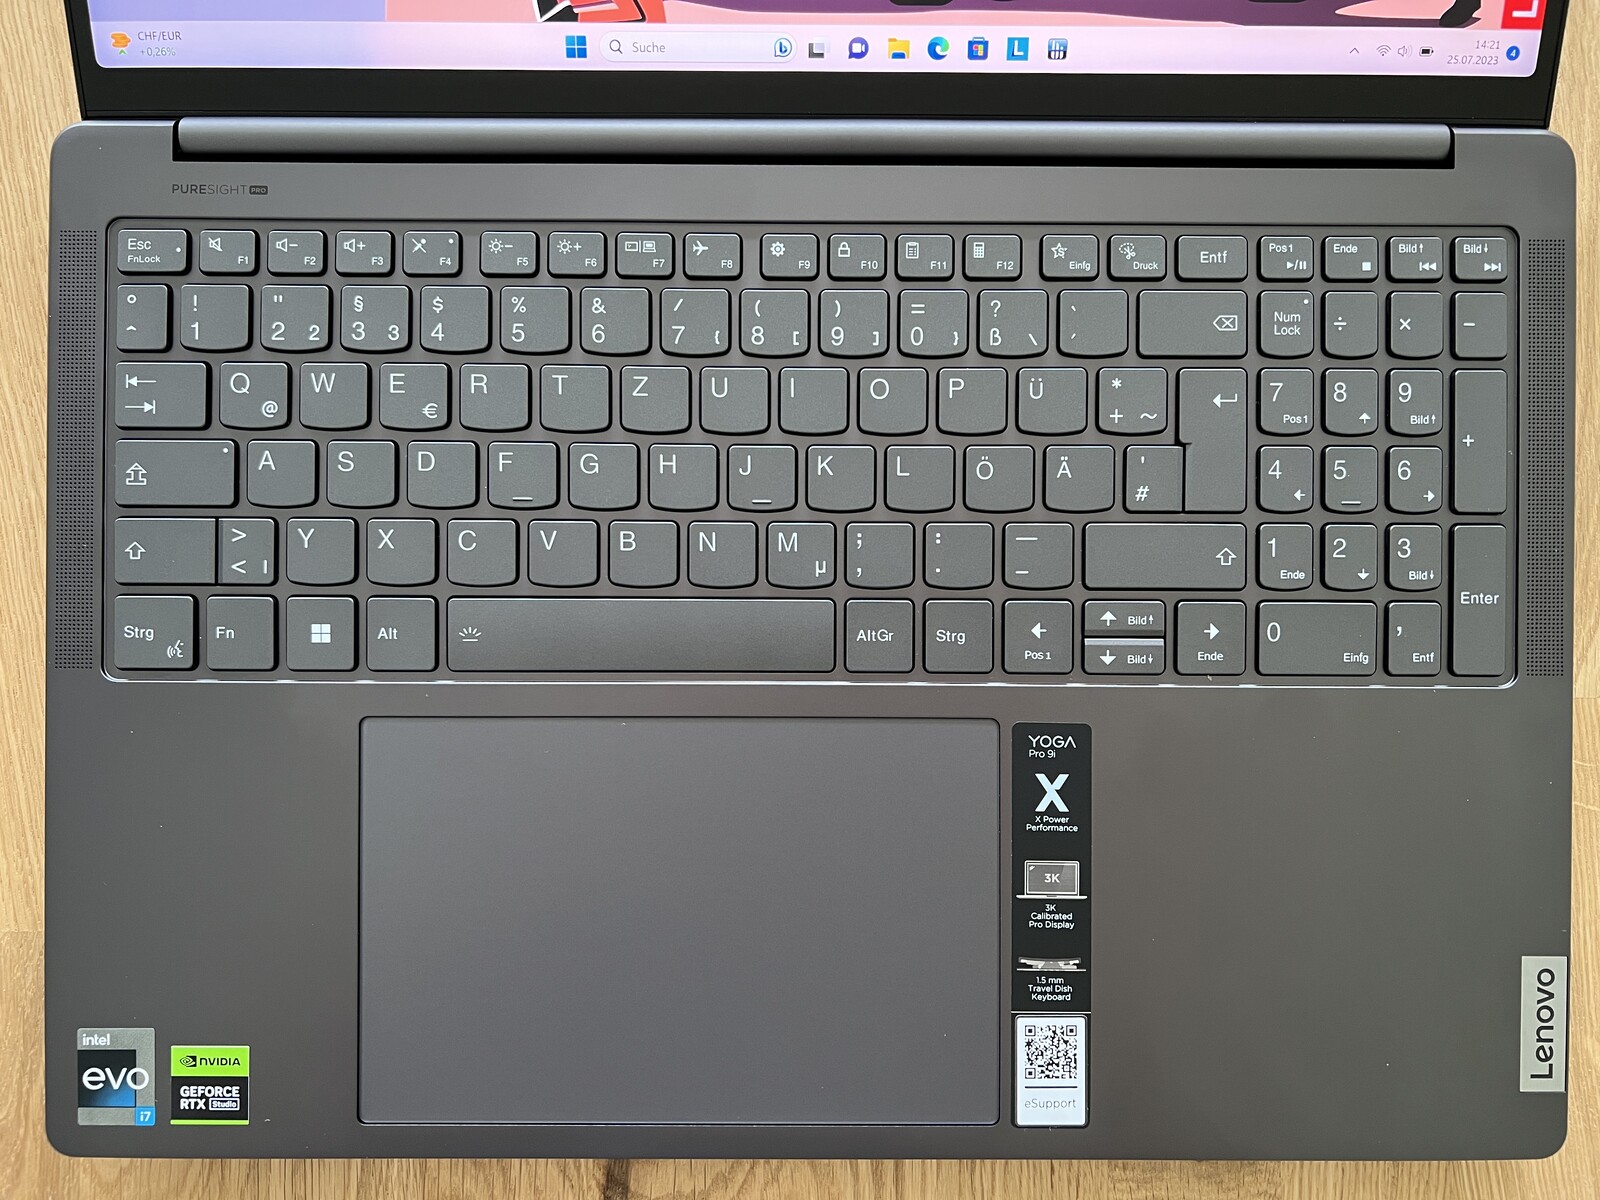
Pekplattan på 16-tums Yoga är ännu större och erbjuder med 15 x 9,5 cm mycket utrymme för pekarkontroll och gester med upp till fyra fingrar, som också fungerar mycket bra och pålitligt tack vare goda glidegenskaper. Den nedre halvan kan också tryckas ner, vilket kännetecknas av ett mycket högt och billigt klickljud. Vi rekommenderar att du bara knackar på dynan för inmatning här. Till skillnad från den mindre 14-tums modellen är pekplattan inte i mitten av fodralet utan är förskjuten något till vänster.
Display - Mini LED vid 165 Hz
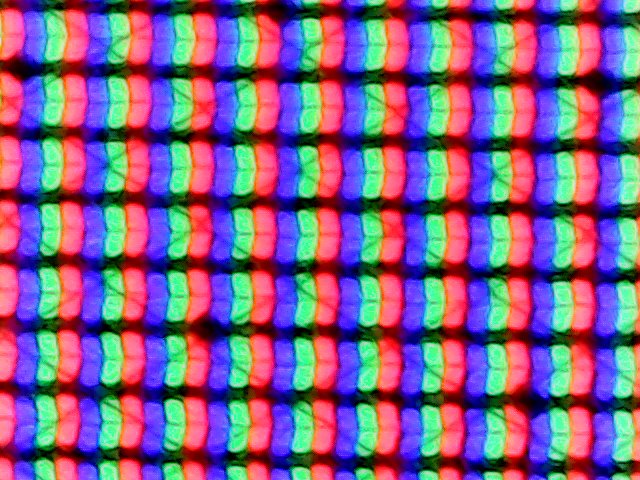
Specifikationerna för skärmen skiljer sig bara från sitt mindre syskon i skärmdiagonalen, eftersom Yoga Pro 9i 16 också använder en mini LED-skärm med en upplösning på 3 200 x 2 000 (16:10) och en frekvens på 165 Hz. Den blanka panelen stöder också pekinmatning. Det subjektiva bildintrycket är utmärkt, särskilt med HDR-innehåll. Förutom mini-LED-skärmen erbjuder Lenovo också en vanlig IPS-panel (3200x2000 pixlar, 165 Hz, sRGB).
Det finns återigen en stor skillnad mellan SDR- och HDR-lägena: i normalt SDR-läge är mini-LED-bakgrundsbelysningen inte aktiv och panelen beter sig som en vanlig IPS-modell. Svart innehåll är därför inte helt svart och små halos är också synliga. Till skillnad från 14-tumsmodellen är PWM-kontrollen dock annorlunda, varför vi inte kunde bestämma svarstider exakt. Flimmer vid 5,8 kHz förekommer vid alla ljusstyrkenivåer, men bör inte vara ett problem för de allra flesta användare.
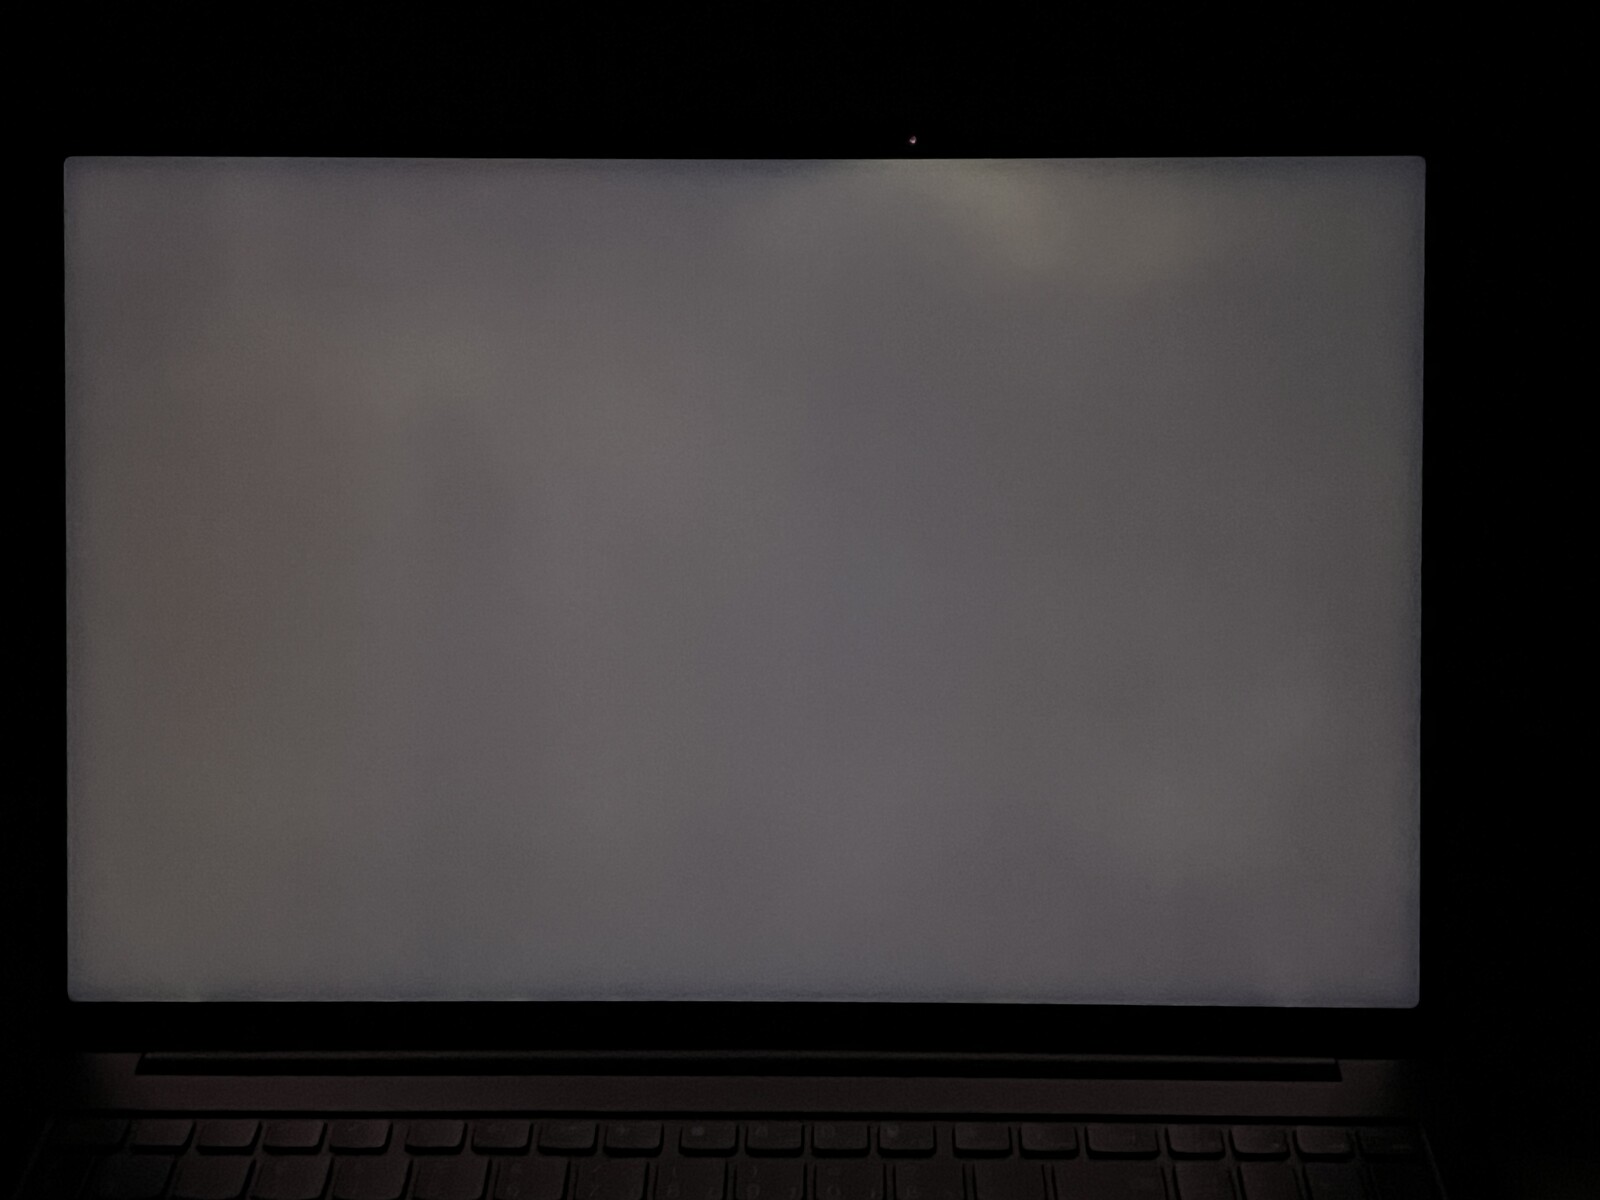
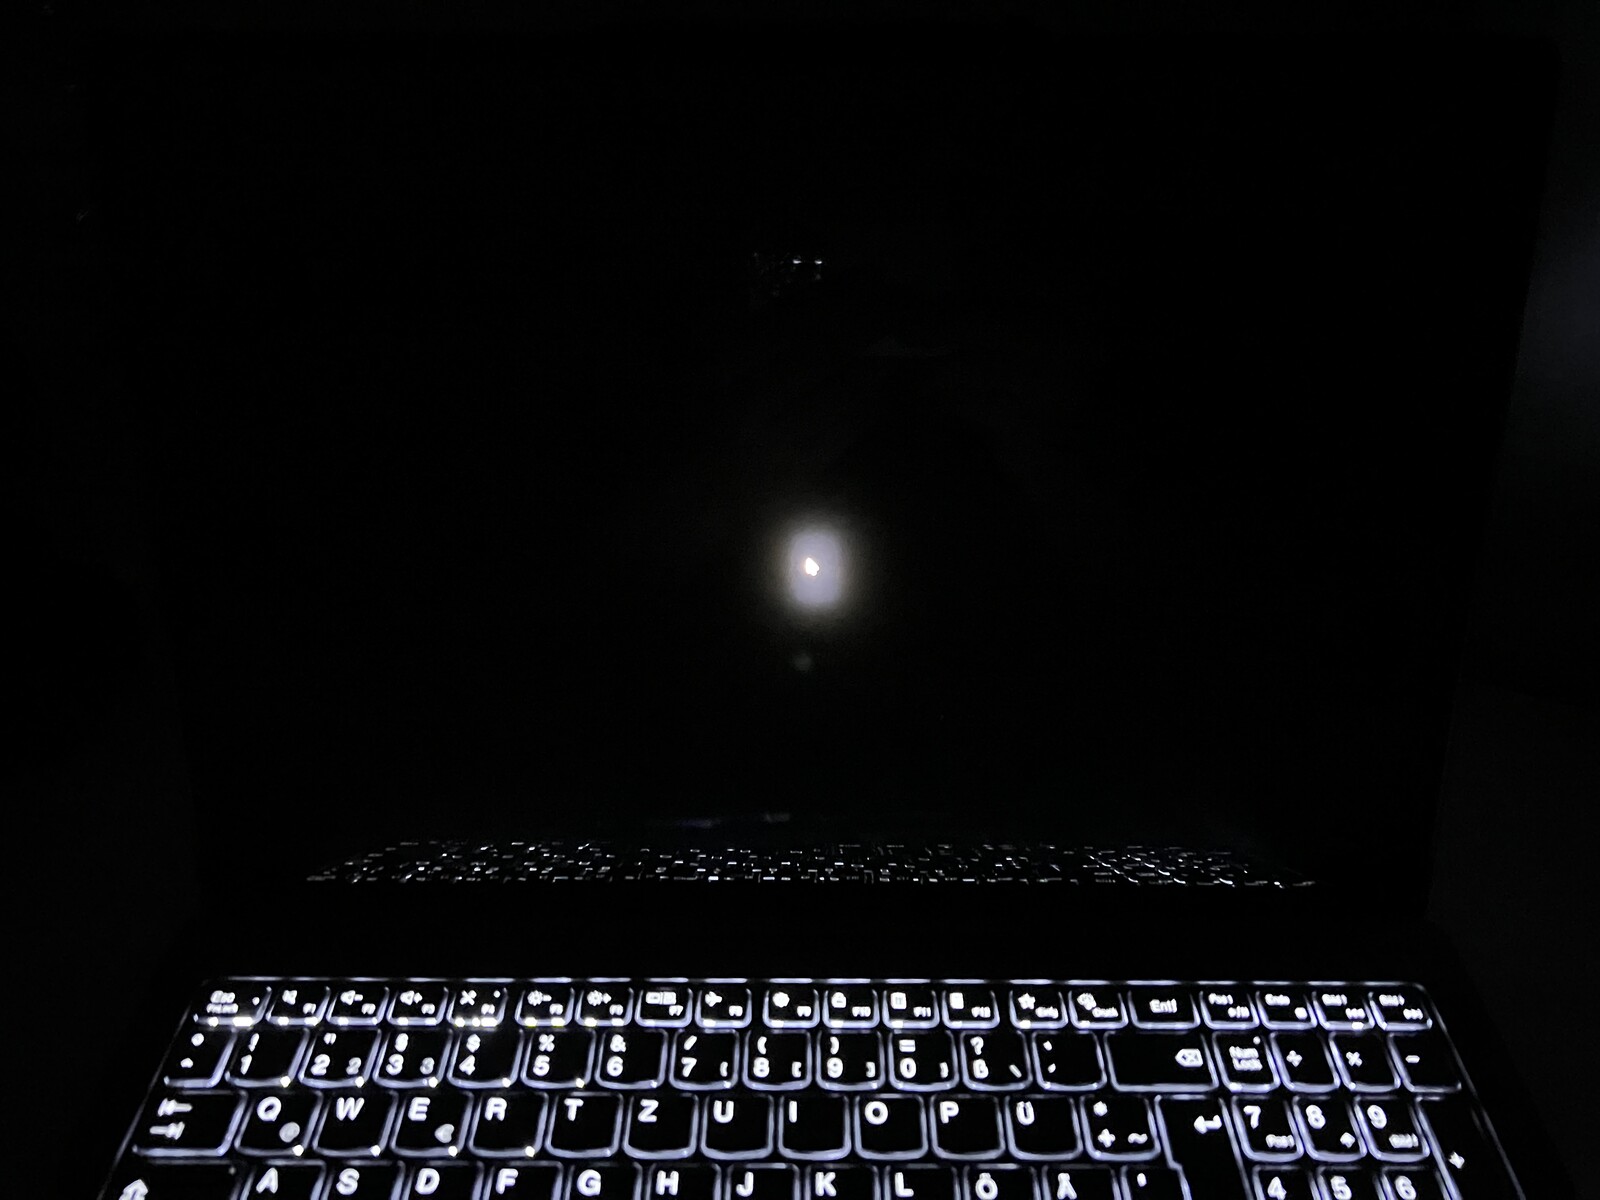
I SDR-läge når 16-tums mini-LED-skärmen en lägre ljusstyrka på bara cirka 550 cd/m² (~700 cd/m² för 14-tumspanelen), vilket är ungefär i nivå medMacBook Pro 16svartvärdet är 0,18 cd/m² i SDR-läge, vilket är anledningen till att kontrastförhållandet "bara" är ~3 000:1. Detta är lågt jämfört med andra mini-LED- eller OLED-paneler, men fortfarande mycket bra jämfört med vanliga IPS-skärmar.
Svartvärdet är bara 0 i HDR-läget, vilket är anledningen till att kontrastförhållandet också är extremt högt. Svart innehåll är verkligen svart här och du kan se skillnaden mycket tydligt i de två jämförelsebilderna ovan. Med HDR-innehåll är den maximala ljusstyrkan strax under 1 100 cd/m², vilket är betydligt lägre än för 14-tums Yoga och även lägre än tillverkarens specifikation på 1 200 cd/m². HDR-läget resulterar också i synlig blomning på grund av mini-LED-zonerna, även om effekten inte är särskilt uttalad här.
Tyvärr lämnar Windows HDR-implementering fortfarande mycket att önska eftersom HDR-läget först måste aktiveras manuellt. Detta innebär i sin tur att Windows inte längre erbjuder några färgprofiler och HDR-läget är effektivt begränsat till sRGB-färgrymden.
| |||||||||||||||||||||||||
Distribution av ljusstyrkan: 96 %
Mitt på batteriet: 545 cd/m²
Kontrast: 2994:1 (Svärta: 0.18 cd/m²)
ΔE ColorChecker Calman: 1.4 | ∀{0.5-29.43 Ø4.71}
ΔE Greyscale Calman: 2.2 | ∀{0.09-98 Ø4.96}
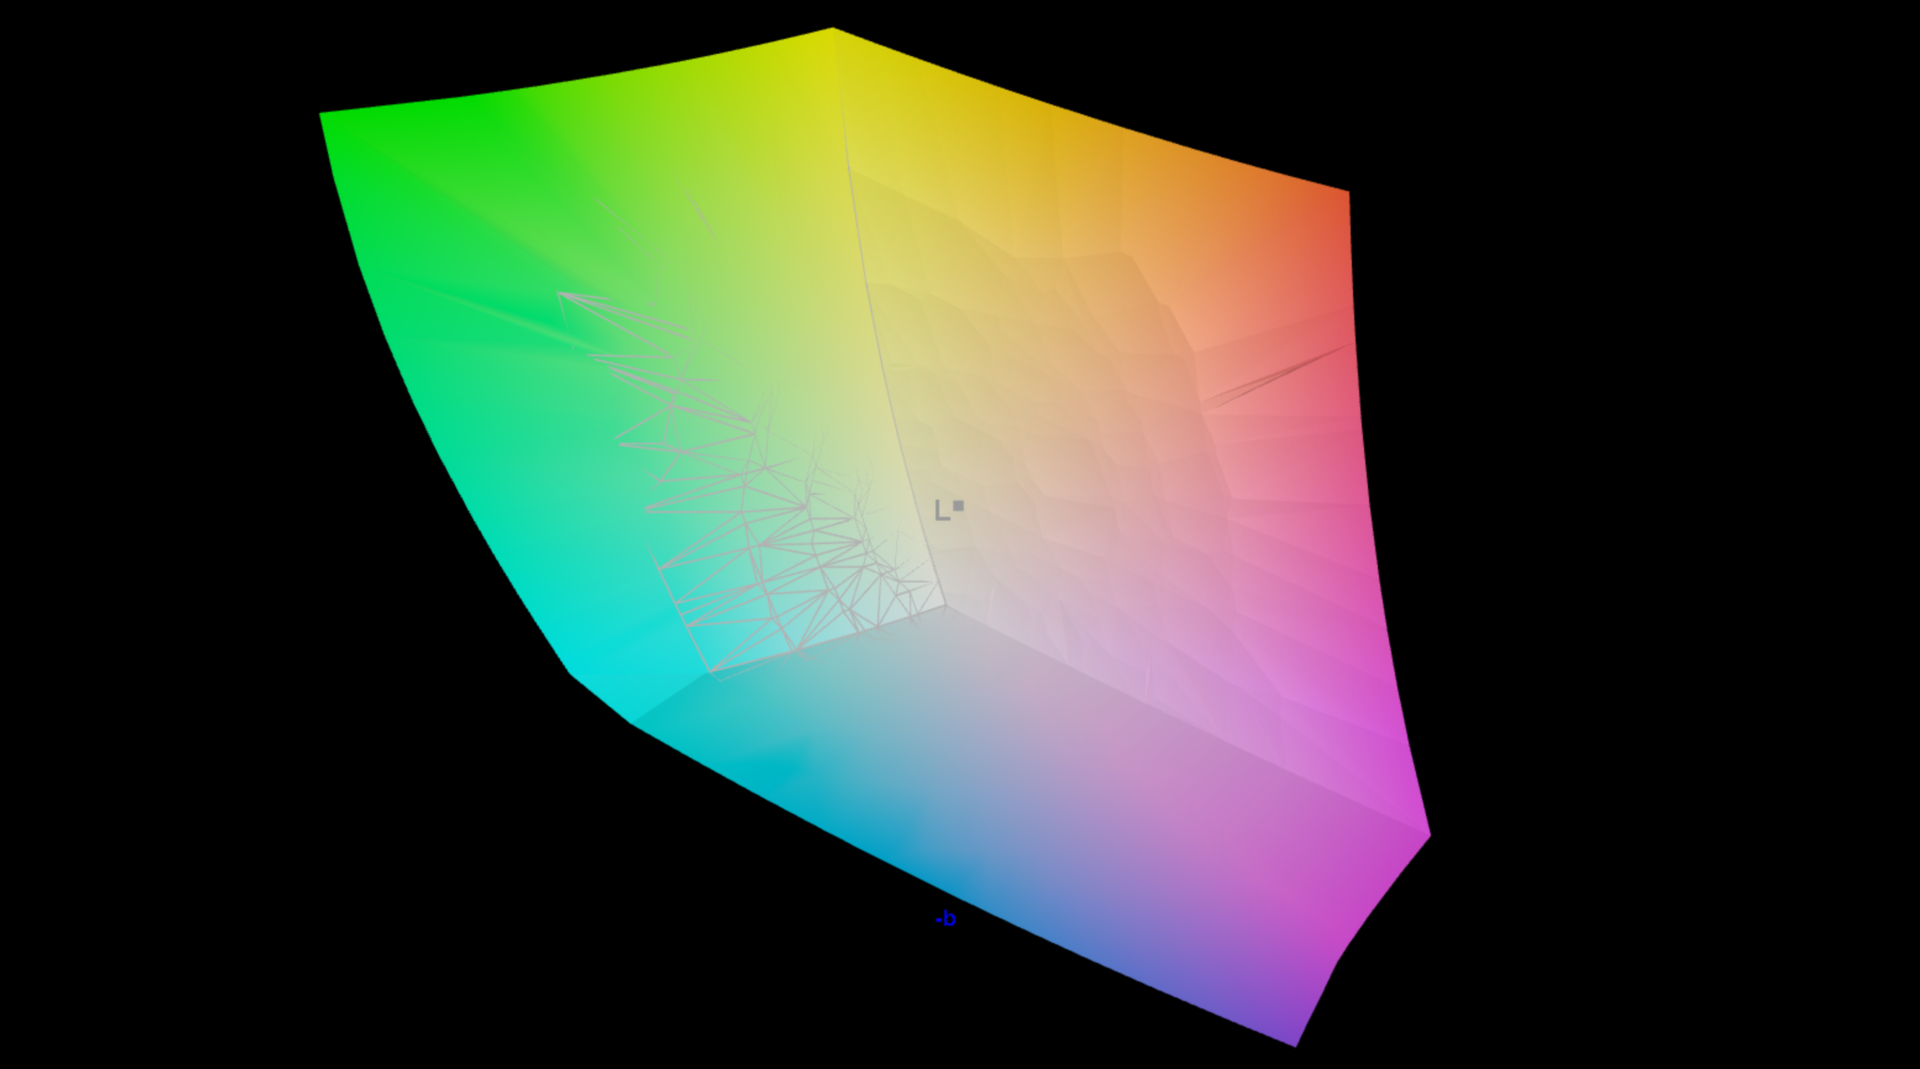
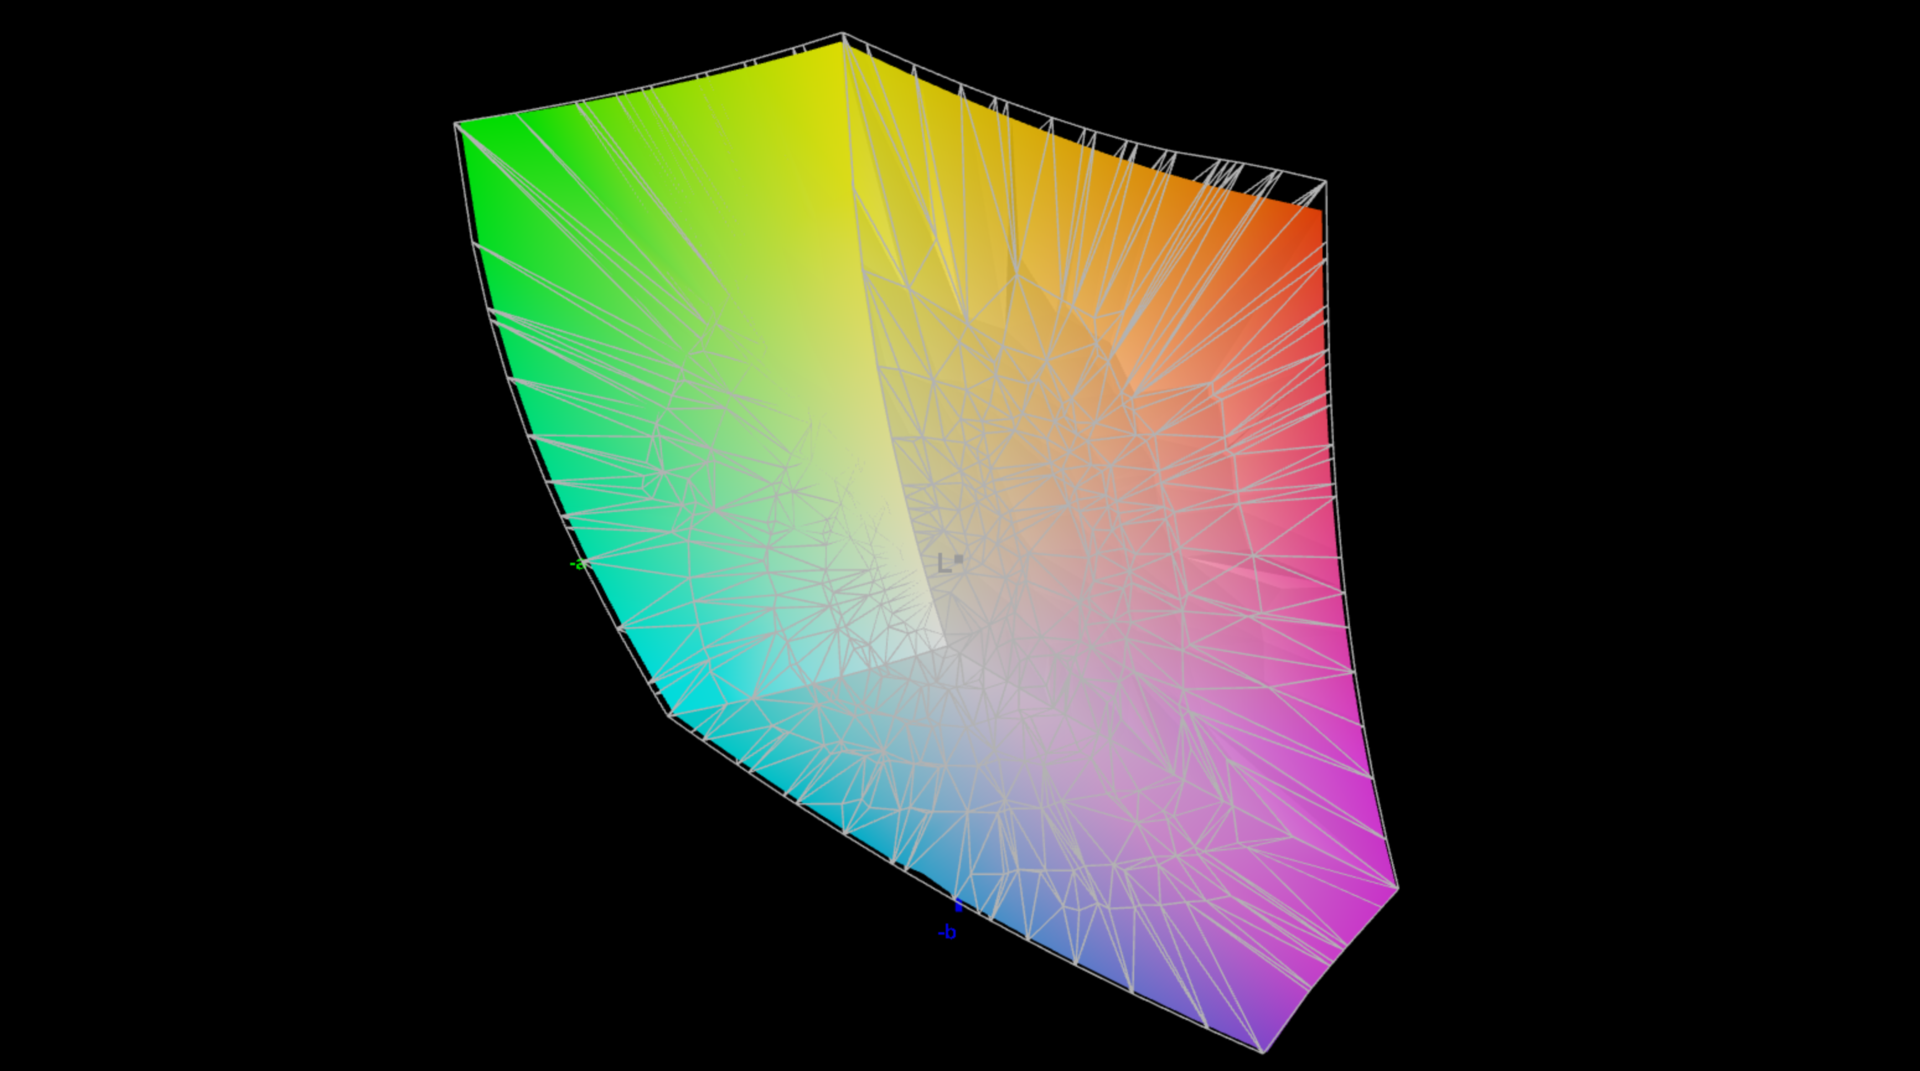
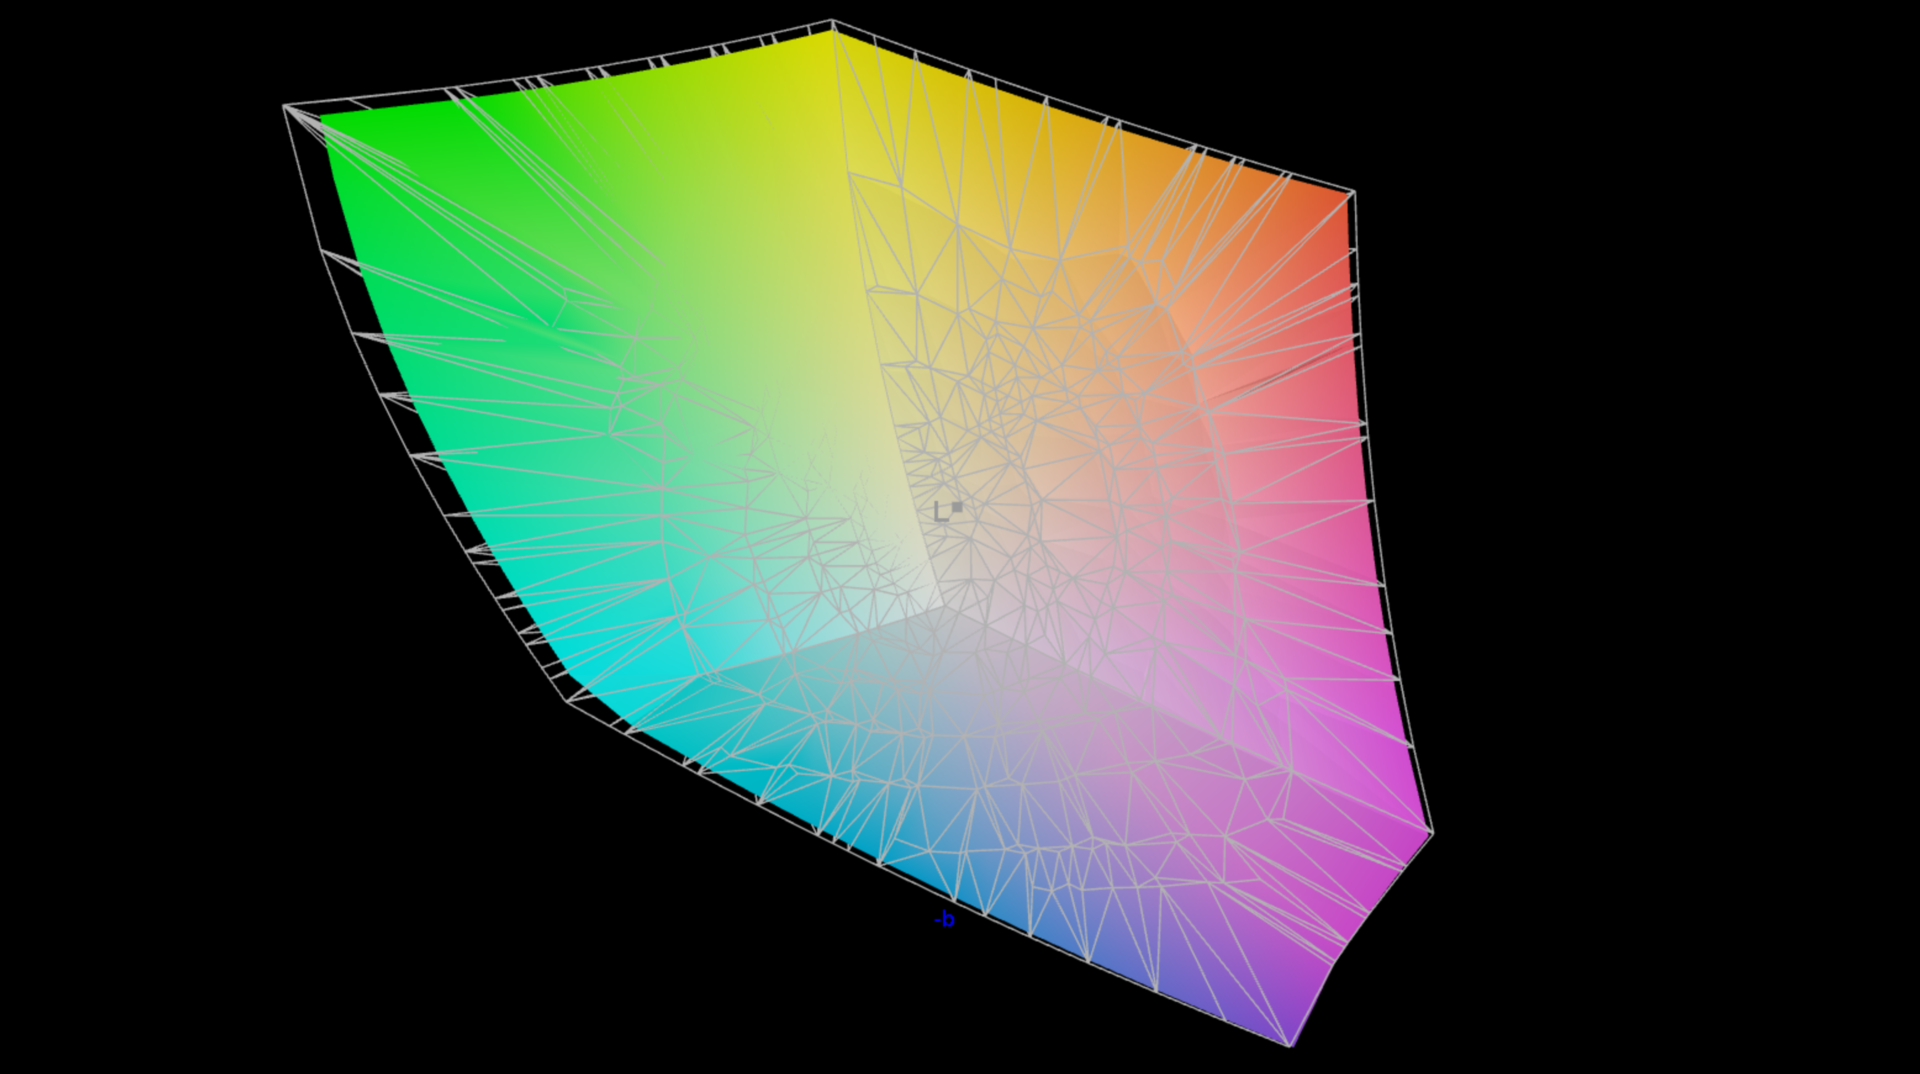
95.1% AdobeRGB 1998 (Argyll 3D)
99.8% sRGB (Argyll 3D)
97% Display P3 (Argyll 3D)
Gamma: 2.19
CCT: 6479 K
| Lenovo Yoga Pro 9 16-IRP G8 LEN160-3.2K, Mini-LED, 3200x2000, 16" | Schenker VISION 16 Pro (M23) NE160QDM-NZ1, IPS, 2560x1600, 16" | Asus Vivobook Pro 16X K6604JV-MX016W Samsung SDC4178 ATNA60BX01-1, OLED, 3200x2000, 16" | Asus ProArt Studiobook 16 OLED H7604 ATNA60BX01-1, OLED, 3200x2000, 16" | MSI Stealth 16 Studio A13VG AUO26A9, IPS, 2560x1600, 16" | Apple MacBook Pro 16 2023 M2 Max Mini-LED, 3456x2234, 16.2" | |
|---|---|---|---|---|---|---|
| Display | -19% | 1% | -1% | -4% | -2% | |
| Display P3 Coverage (%) | 97 | 68.8 -29% | 98.4 1% | 99.6 3% | 96.4 -1% | 99 2% |
| sRGB Coverage (%) | 99.8 | 98.8 -1% | 99.7 0% | 100 0% | 99.7 0% | 100 0% |
| AdobeRGB 1998 Coverage (%) | 95.1 | 70 -26% | 95.8 1% | 89.4 -6% | 84.8 -11% | 88.5 -7% |
| Response Times | 7% | 87% | 94% | 54% | -444% | |
| Response Time Grey 50% / Grey 80% * (ms) | 14 ? | 13.7 ? 2% | 1.6 ? 89% | 0.59 ? 96% | 4.4 ? 69% | 80.5 ? -475% |
| Response Time Black / White * (ms) | 9.2 ? | 8.1 ? 12% | 1.4 ? 85% | 0.79 ? 91% | 5.6 ? 39% | 47.2 ? -413% |
| PWM Frequency (Hz) | 5800 ? | 120 ? | 240 ? | 14880 ? | ||
| Screen | -91% | 4% | 42% | -87% | 2094% | |
| Brightness middle (cd/m²) | 539 | 384 -29% | 347 -36% | 349 -35% | 424 -21% | 504 -6% |
| Brightness (cd/m²) | 546 | 371 -32% | 346 -37% | 350 -36% | 411 -25% | 487 -11% |
| Brightness Distribution (%) | 96 | 88 -8% | 97 1% | 95 -1% | 88 -8% | 94 -2% |
| Black Level * (cd/m²) | 0.18 | 0.3 -67% | 0.06 67% | 0.02 89% | 0.37 -106% | 0.001 99% |
| Contrast (:1) | 2994 | 1280 -57% | 5783 93% | 17450 483% | 1146 -62% | 504000 16734% |
| Colorchecker dE 2000 * | 1.4 | 3.4 -143% | 1.89 -35% | 2.1 -50% | 3.04 -117% | 1.5 -7% |
| Colorchecker dE 2000 max. * | 2.1 | 9.2 -338% | 3.26 -55% | 5.5 -162% | 7.5 -257% | 3.3 -57% |
| Greyscale dE 2000 * | 2.2 | 3.4 -55% | 1.55 30% | 1.2 45% | 4.34 -97% | 2.1 5% |
| Gamma | 2.19 100% | 2.16 102% | 2.39 92% | 2.19 100% | 2.32 95% | 2.25 98% |
| CCT | 6479 100% | 7462 87% | 6458 101% | 6545 99% | 6952 93% | 6882 94% |
| Colorchecker dE 2000 calibrated * | 1.3 | 1.97 | 2.1 | 3.04 | ||
| Totalt genomsnitt (program/inställningar) | -34% /
-59% | 31% /
16% | 45% /
40% | -12% /
-46% | 549% /
1220% |
* ... mindre är bättre
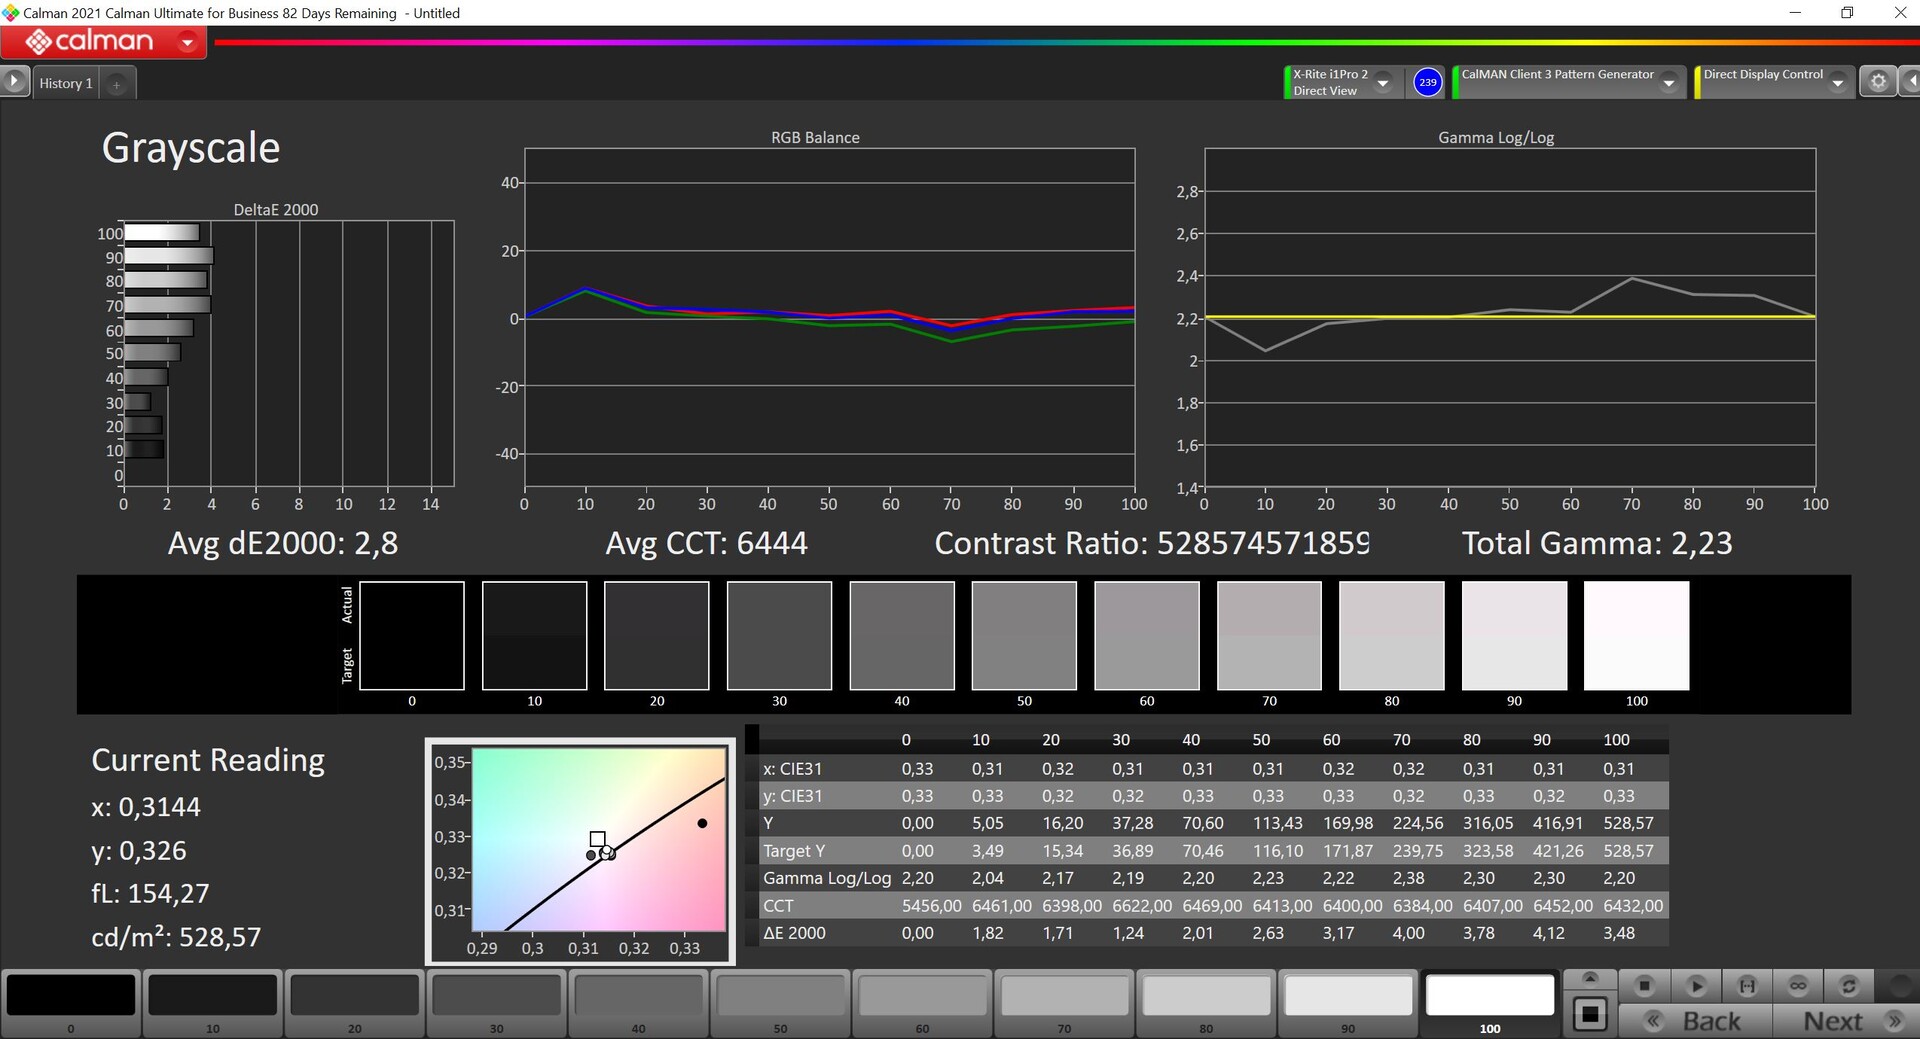
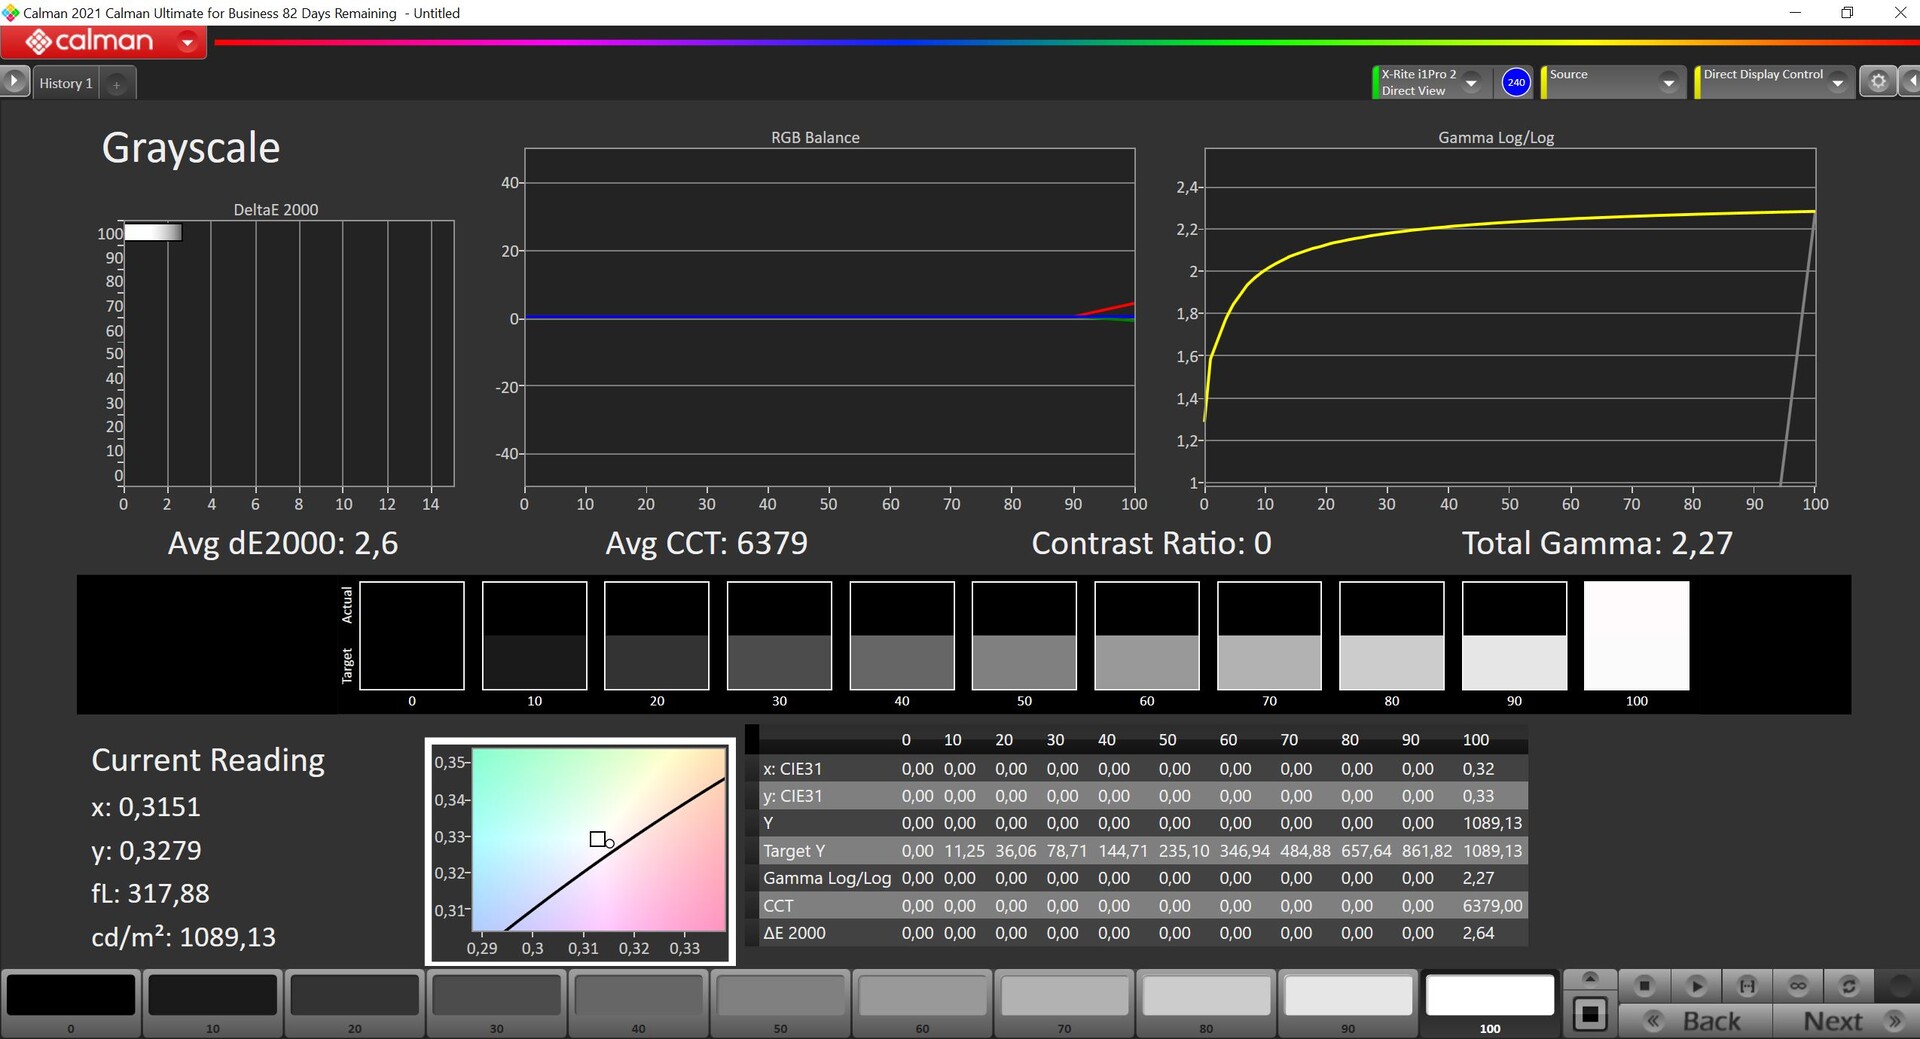
Vi mätte panelen med hjälp av den professionella CalMAN-programvaran. I den förinstallerade Lenovo Vantage-programvaran kan du välja mellan färgprofilerna sRGB, Display P3 och AdobeRGB. Eftersom Lenovo annonserar full AdobeRGB-täckning använde vi också denna profil för våra mätningar.
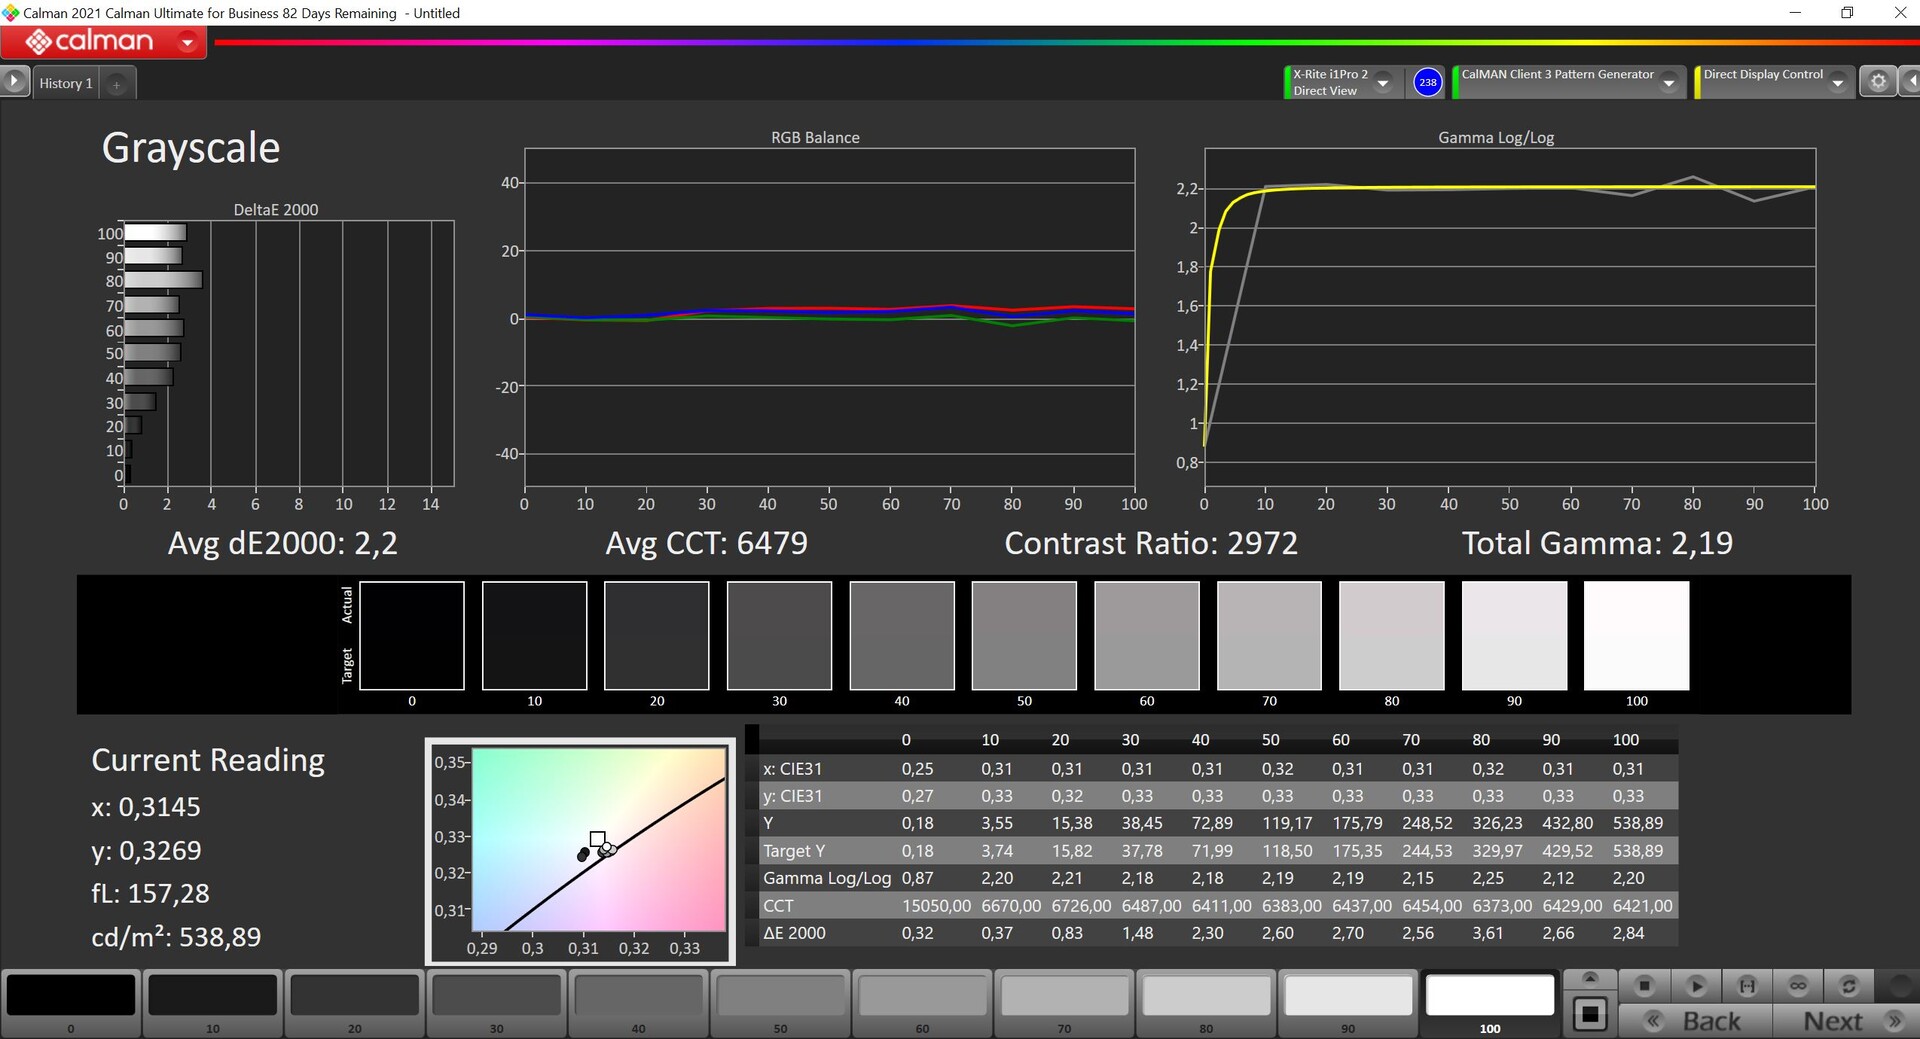
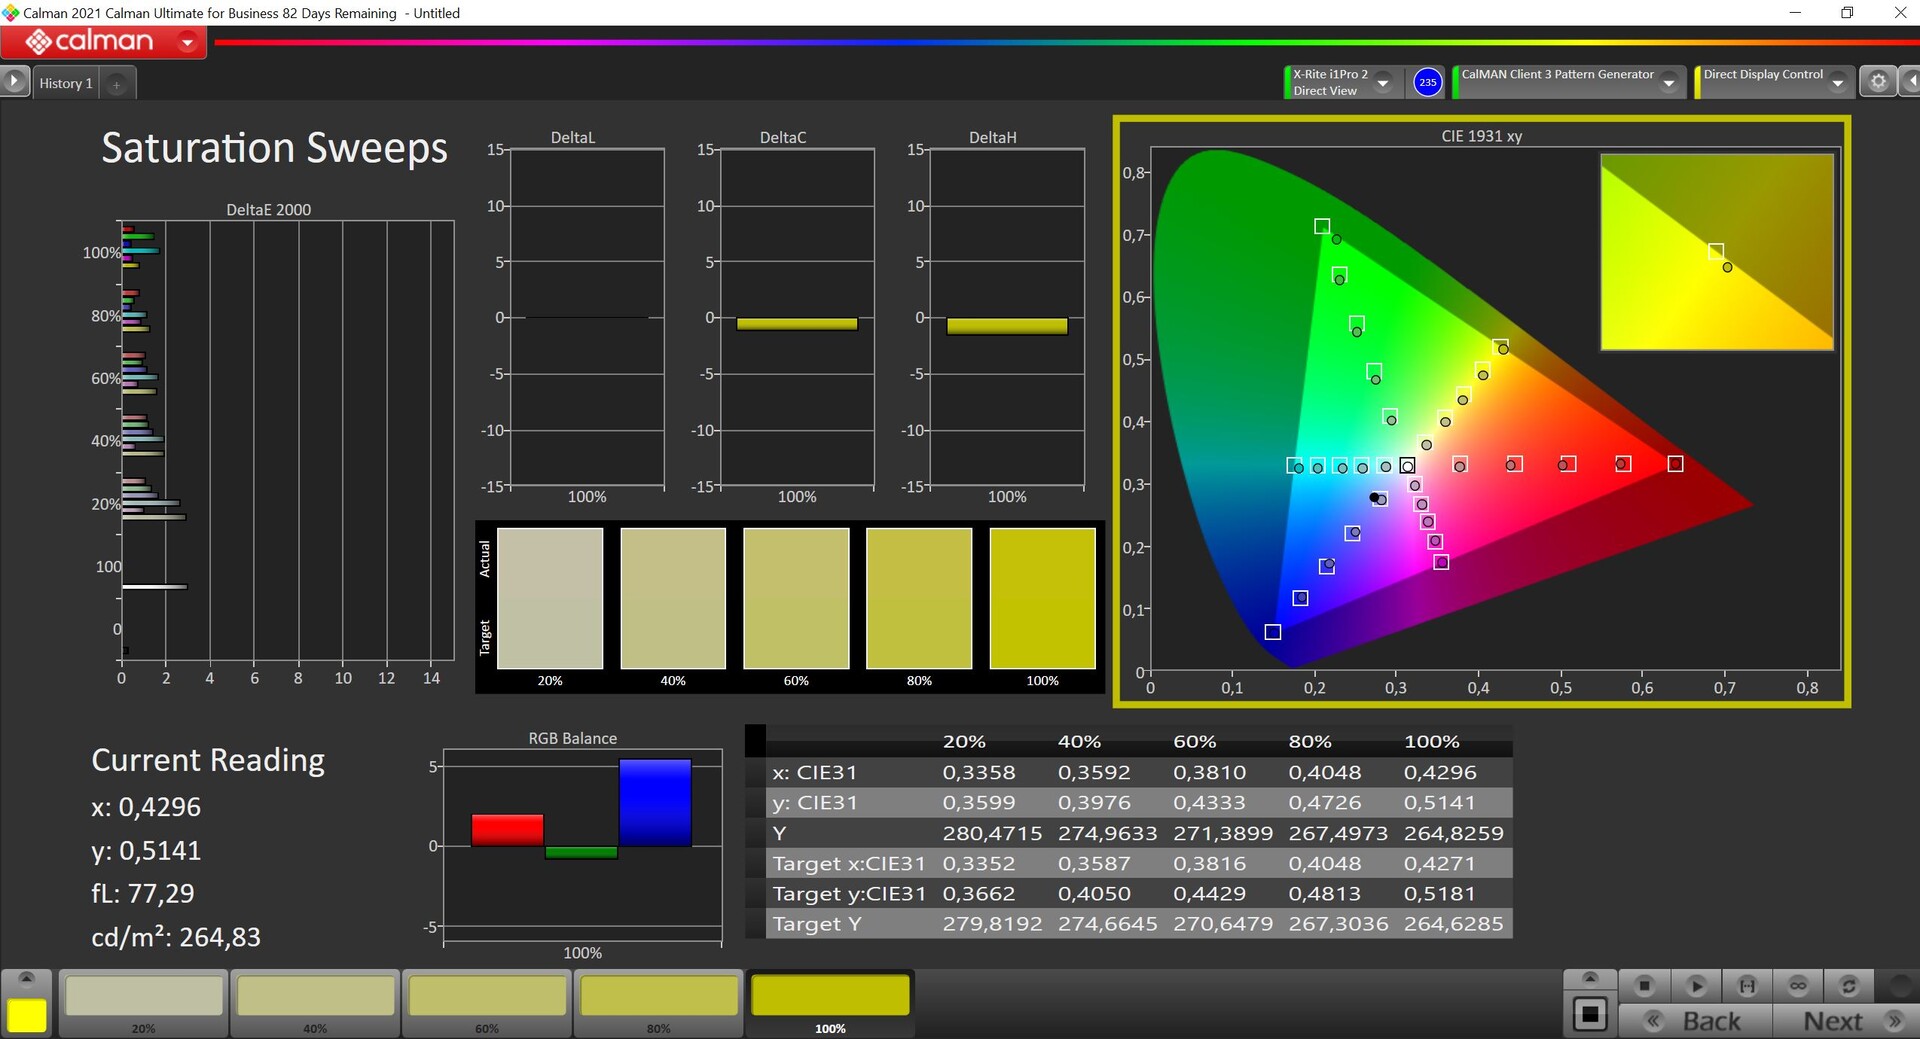
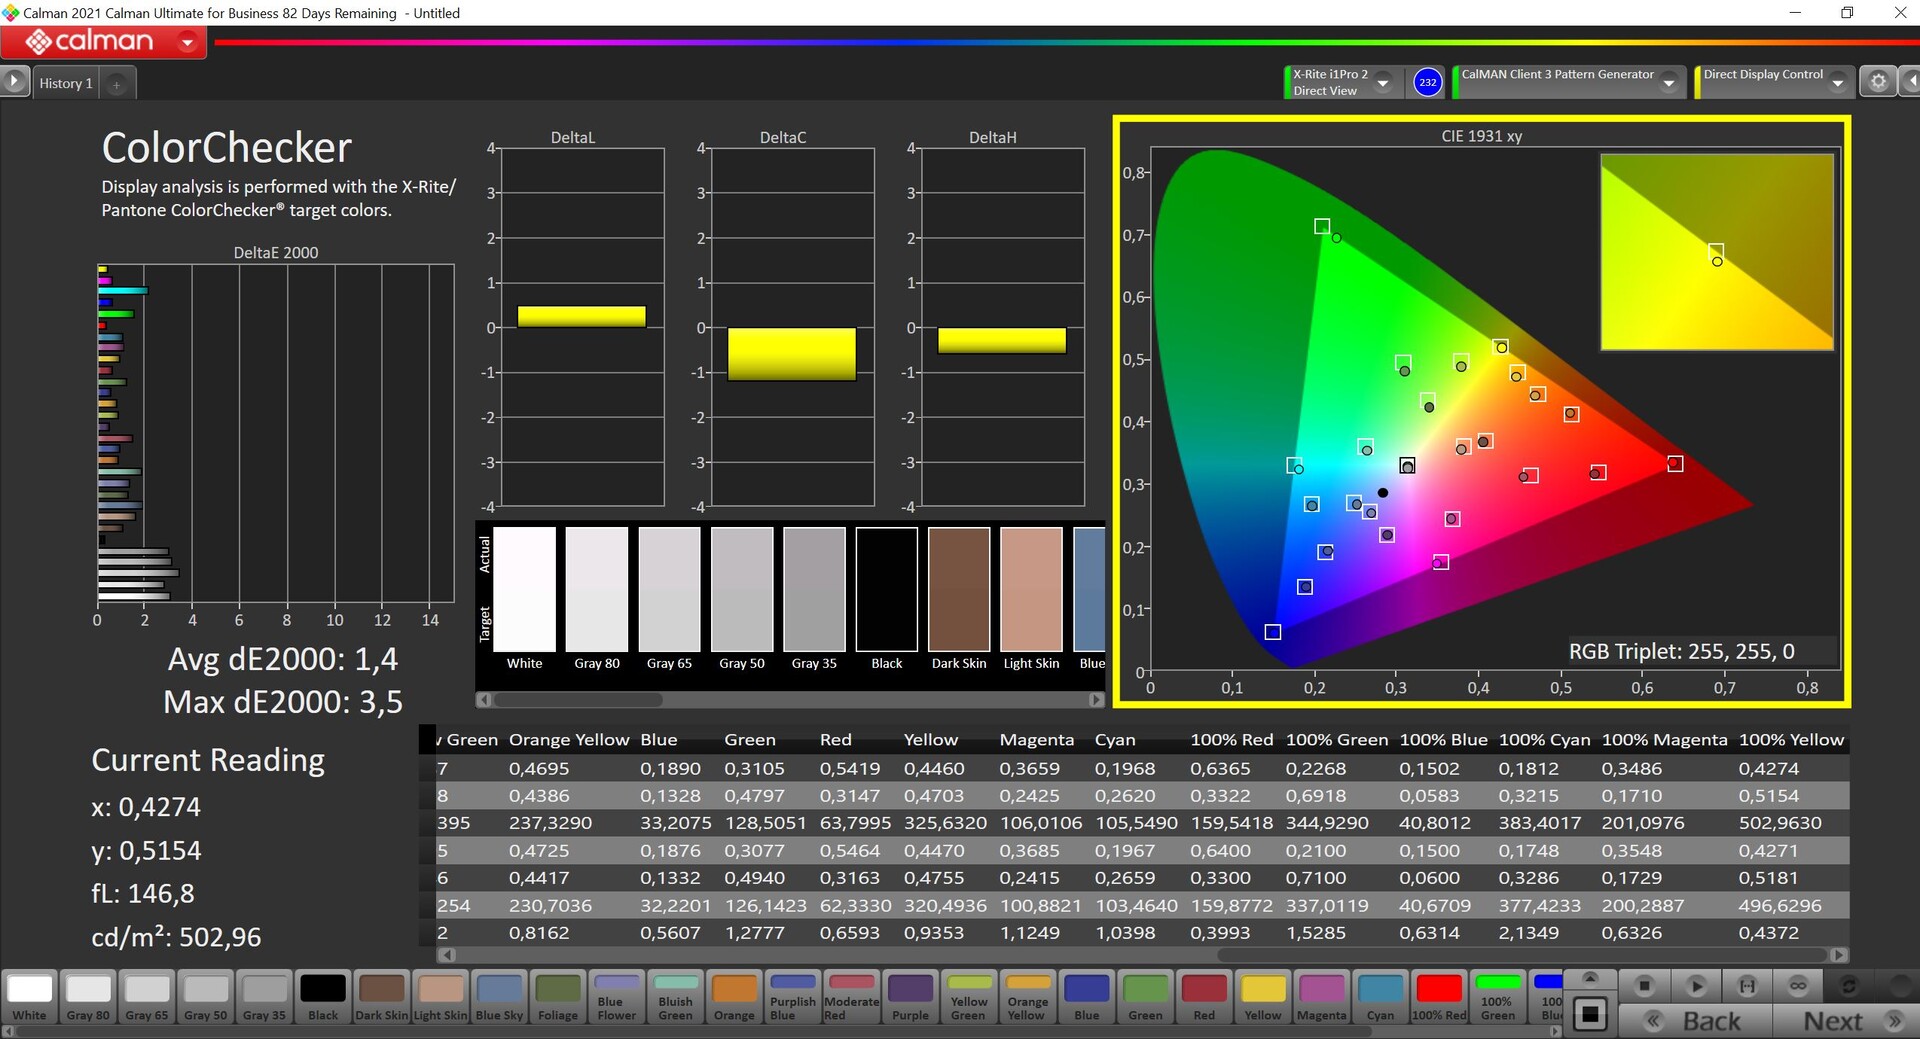
Panelens standardkalibrering visar sig vara mycket bättre än 14-tumsmodellen och den genomsnittliga DeltaE-2000-avvikelsen är redan under 3, både för gråskala och färger (inga outliers här heller). Vi kunde inte bekräfta det annonserade DeltaE-värdet på <1, men en efterföljande kalibrering är inte riktigt nödvändig här och vi kan inte förbättra skärmen med vår egen kalibrering, vilket är anledningen till att vi inte erbjuder en färgprofil för nedladdning vid denna tidpunkt. Panelen täcker nästan helt både P3 och AdobeRGB färgrymderna.
Visa svarstider
| ↔ Svarstid svart till vitt | ||
|---|---|---|
| 9.2 ms ... stiga ↗ och falla ↘ kombinerat | ↗ 2.2 ms stiga | 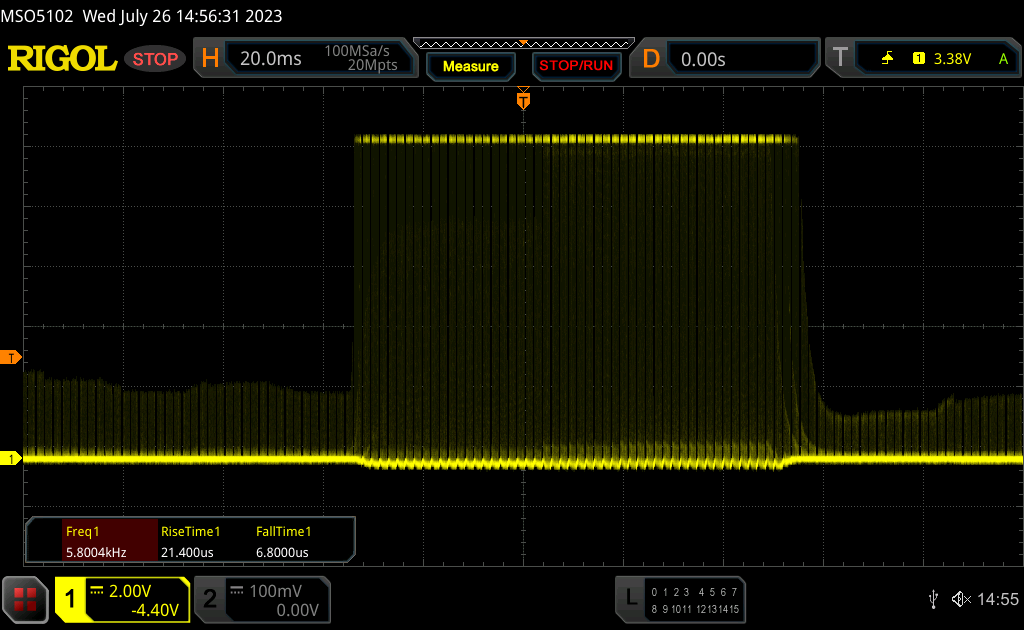 |
| ↘ 7 ms hösten | ||
| Skärmen visar snabba svarsfrekvenser i våra tester och bör passa för spel. I jämförelse sträcker sig alla testade enheter från 0.1 (minst) till 240 (maximalt) ms. » 26 % av alla enheter är bättre. Det betyder att den uppmätta svarstiden är bättre än genomsnittet av alla testade enheter (19.8 ms). | ||
| ↔ Svarstid 50 % grått till 80 % grått | ||
| 14 ms ... stiga ↗ och falla ↘ kombinerat | ↗ 7.5 ms stiga | 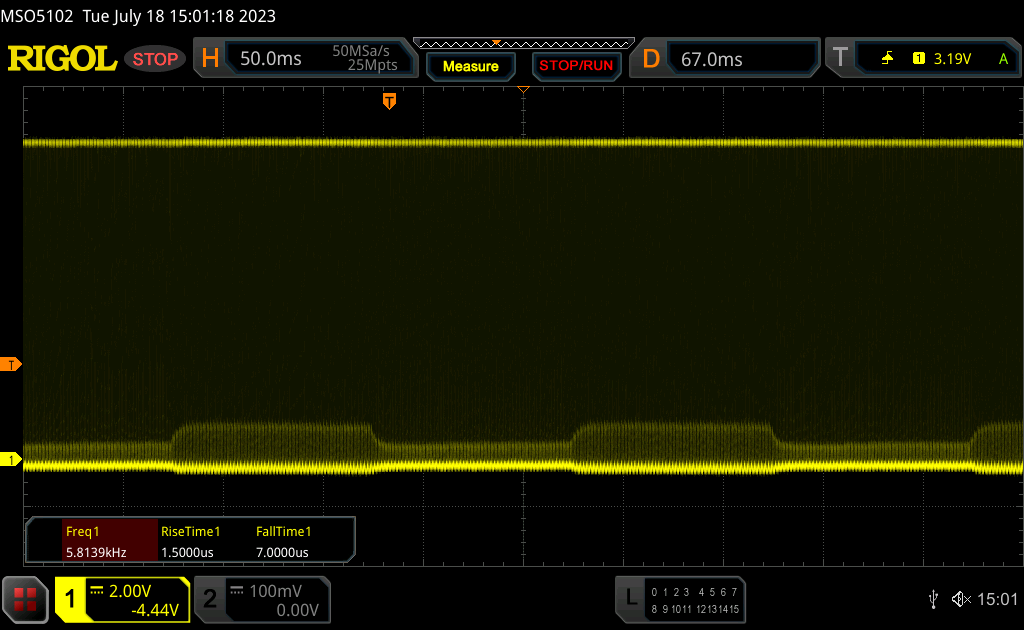 |
| ↘ 6.5 ms hösten | ||
| Skärmen visar bra svarsfrekvens i våra tester, men kan vara för långsam för konkurrenskraftiga spelare. I jämförelse sträcker sig alla testade enheter från 0.165 (minst) till 636 (maximalt) ms. » 28 % av alla enheter är bättre. Det betyder att den uppmätta svarstiden är bättre än genomsnittet av alla testade enheter (30.9 ms). | ||
Skärmflimmer / PWM (Puls-Width Modulation)
| Skärmflimmer / PWM upptäckt | 5800 Hz | ≤ 100 % ljusstyrka inställning | 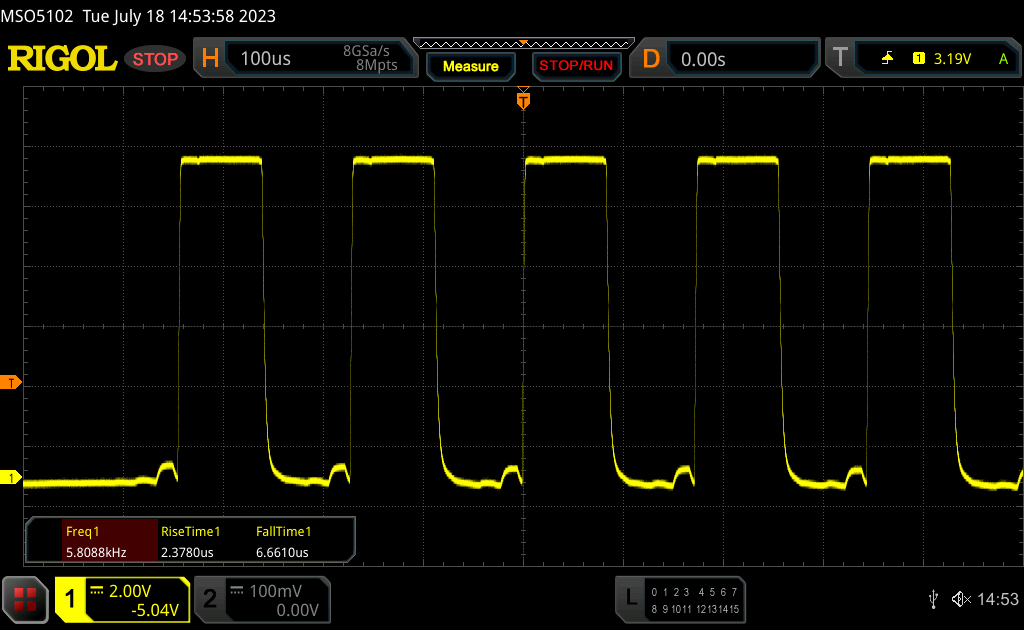 |
Displayens bakgrundsbelysning flimrar vid 5800 Hz (i värsta fall, t.ex. med PWM) Flimrande upptäckt vid en ljusstyrkeinställning på 100 % och lägre. Det ska inte finnas något flimmer eller PWM över denna ljusstyrkeinställning. Frekvensen för 5800 Hz är ganska hög, så de flesta användare som är känsliga för PWM bör inte märka något flimmer. Som jämförelse: 52 % av alla testade enheter använder inte PWM för att dämpa skärmen. Om PWM upptäcktes mättes ett medelvärde av 7744 (minst: 5 - maximum: 343500) Hz. | |||
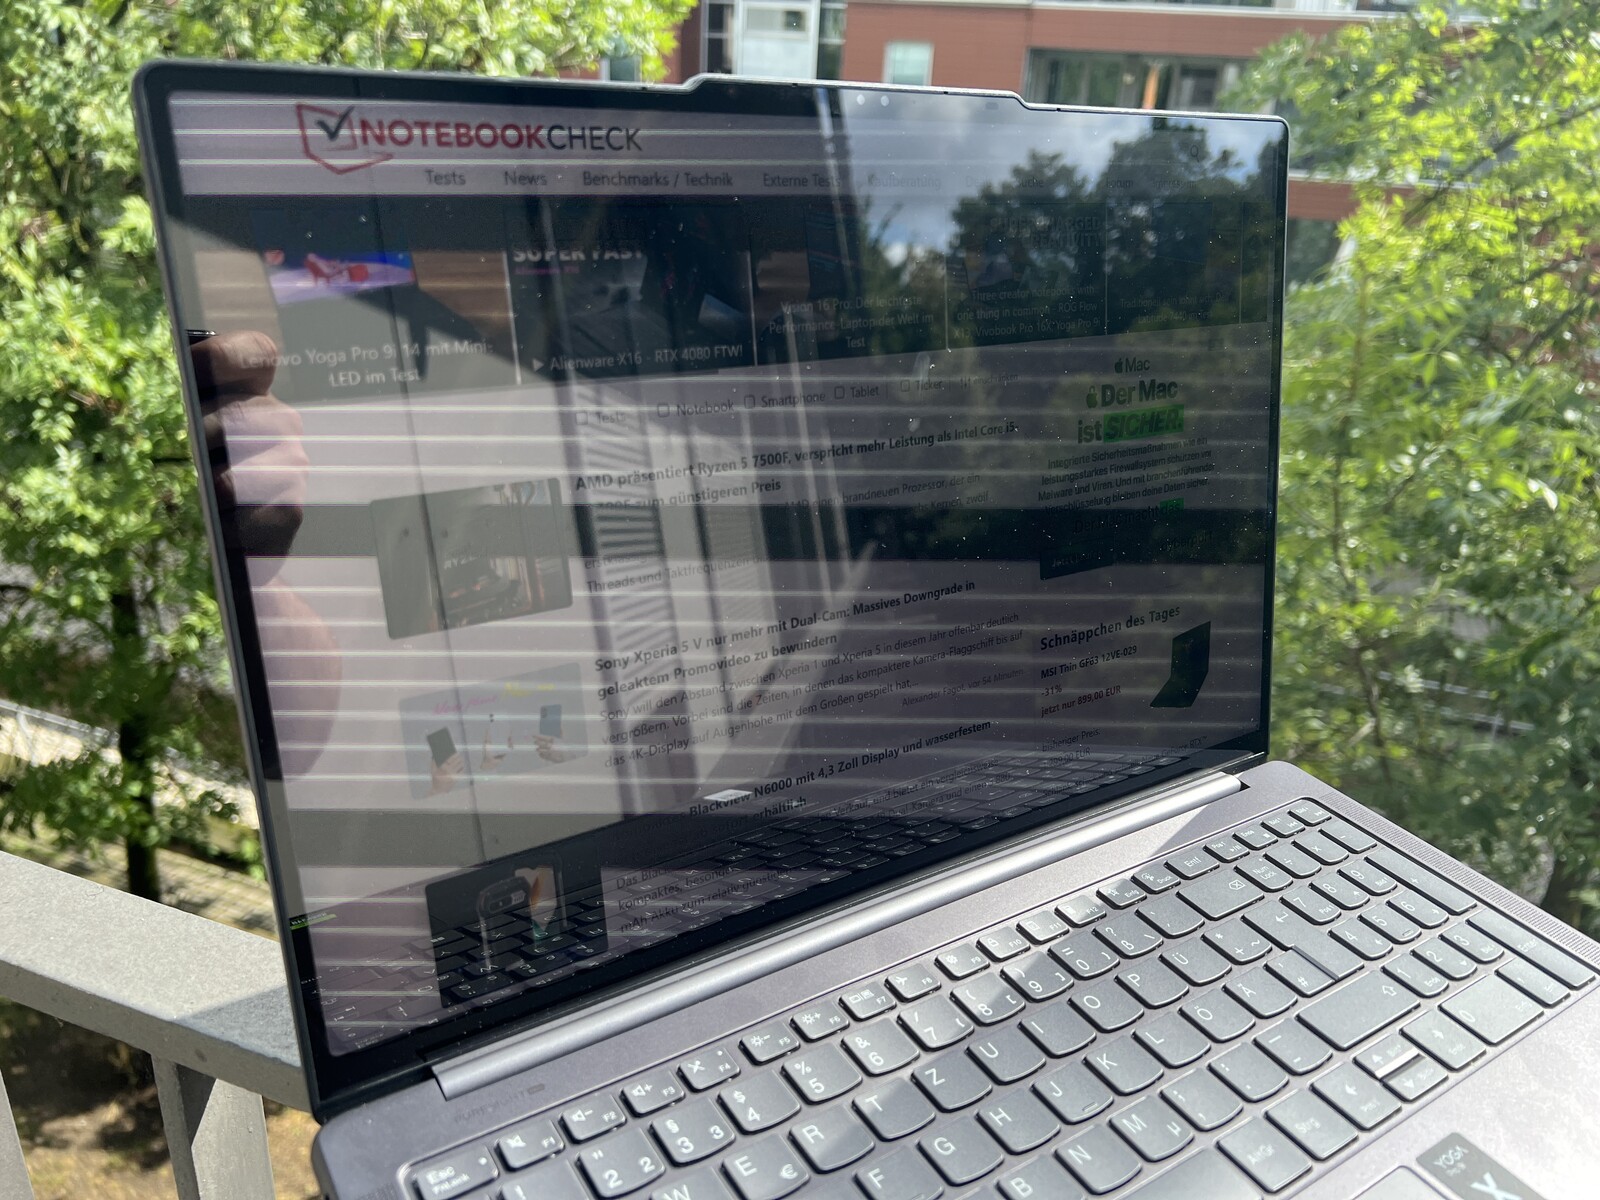
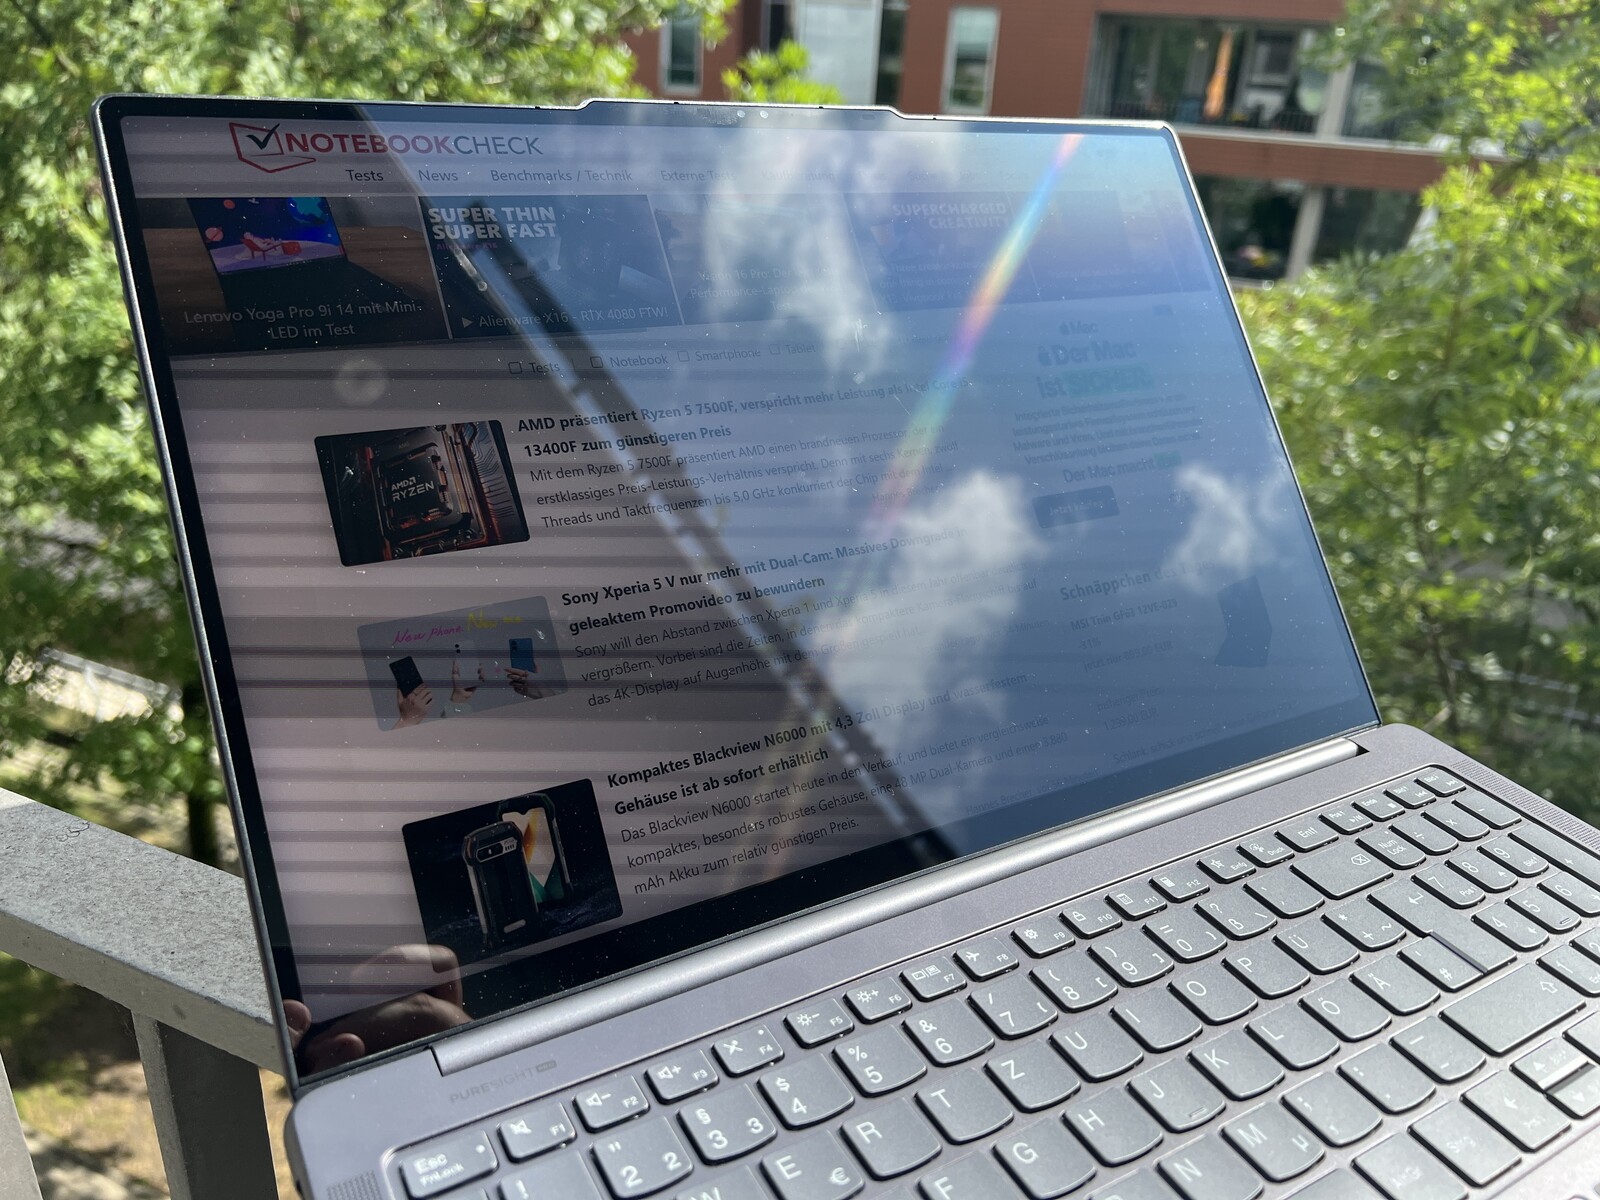
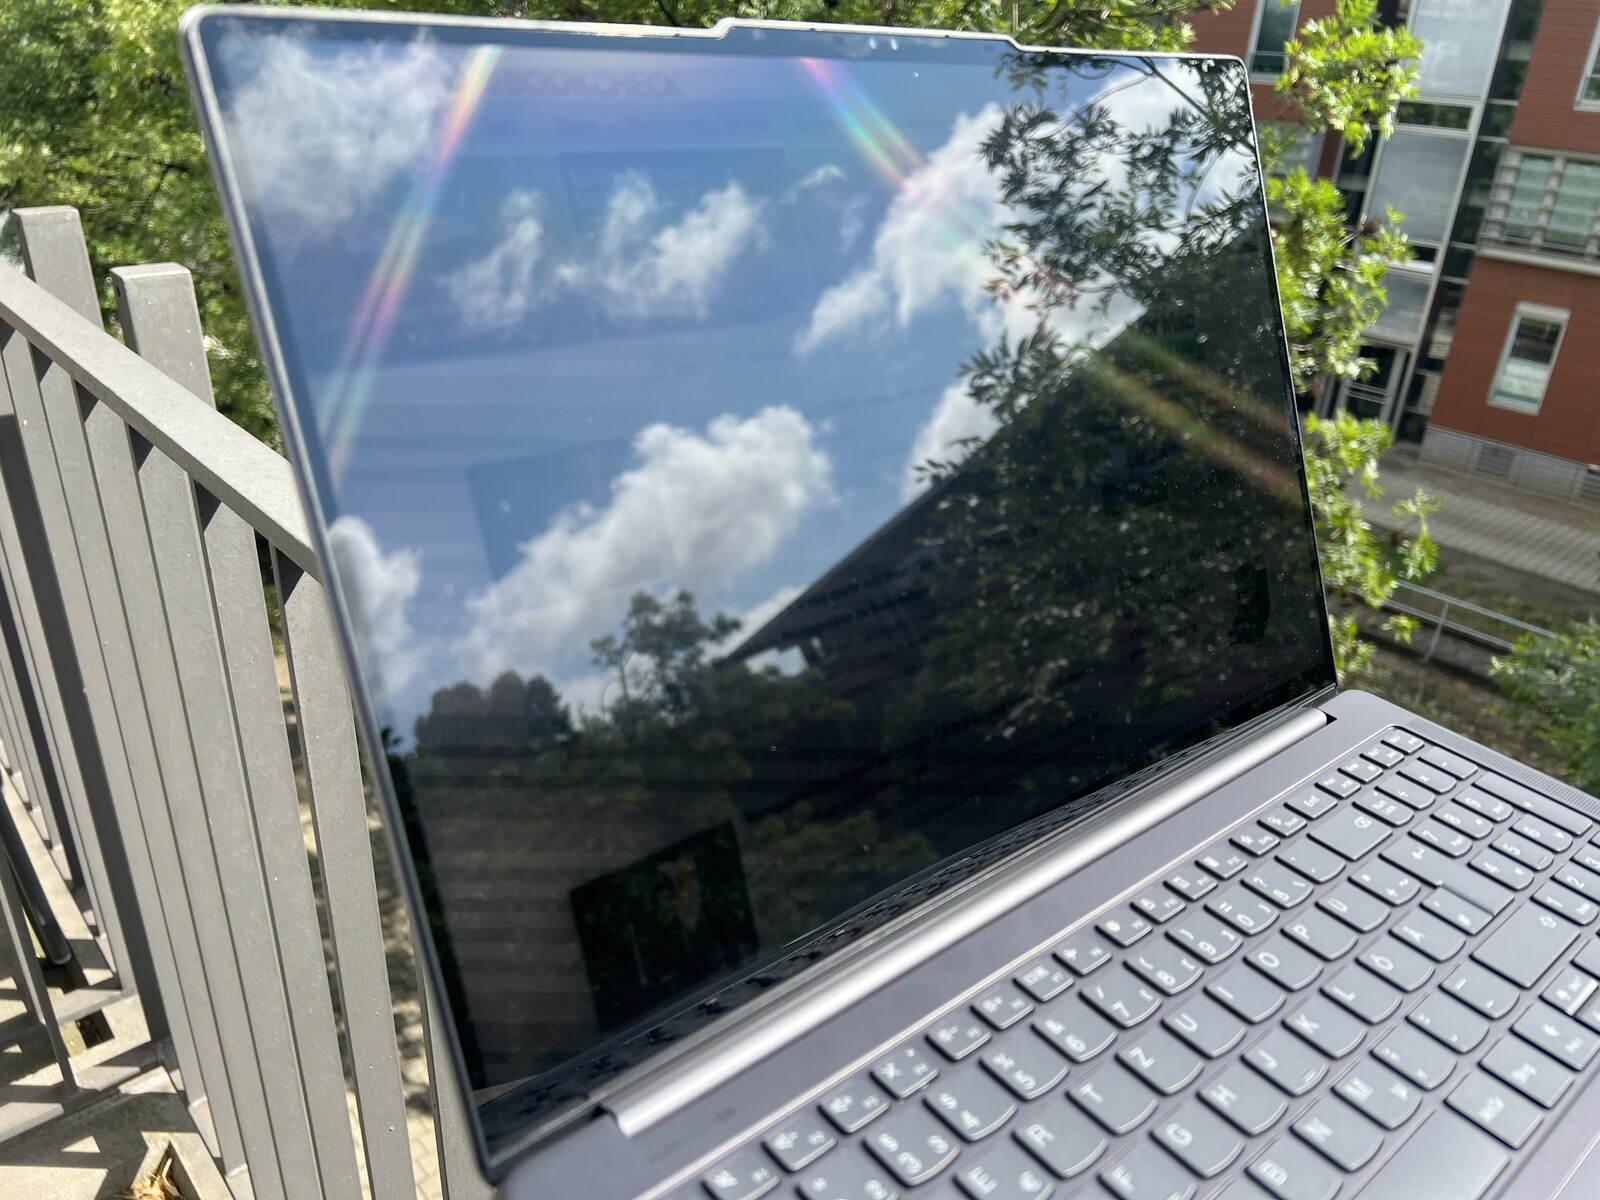
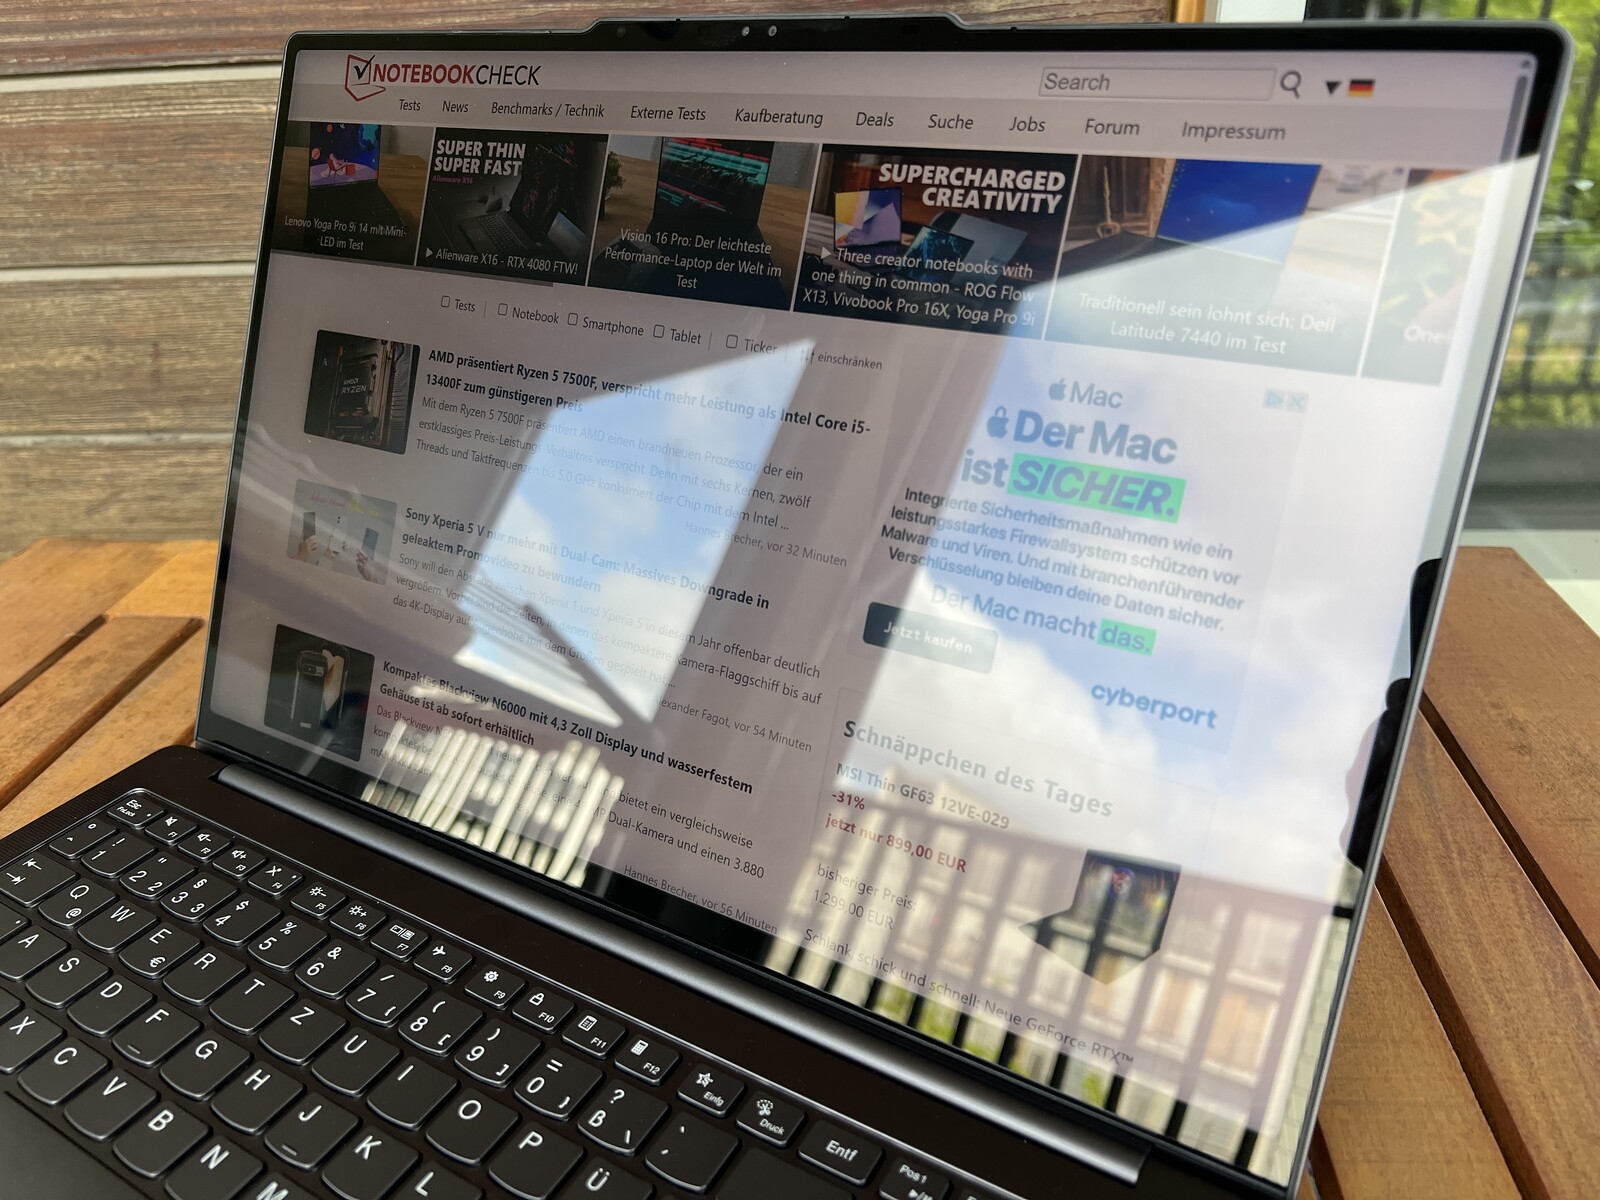
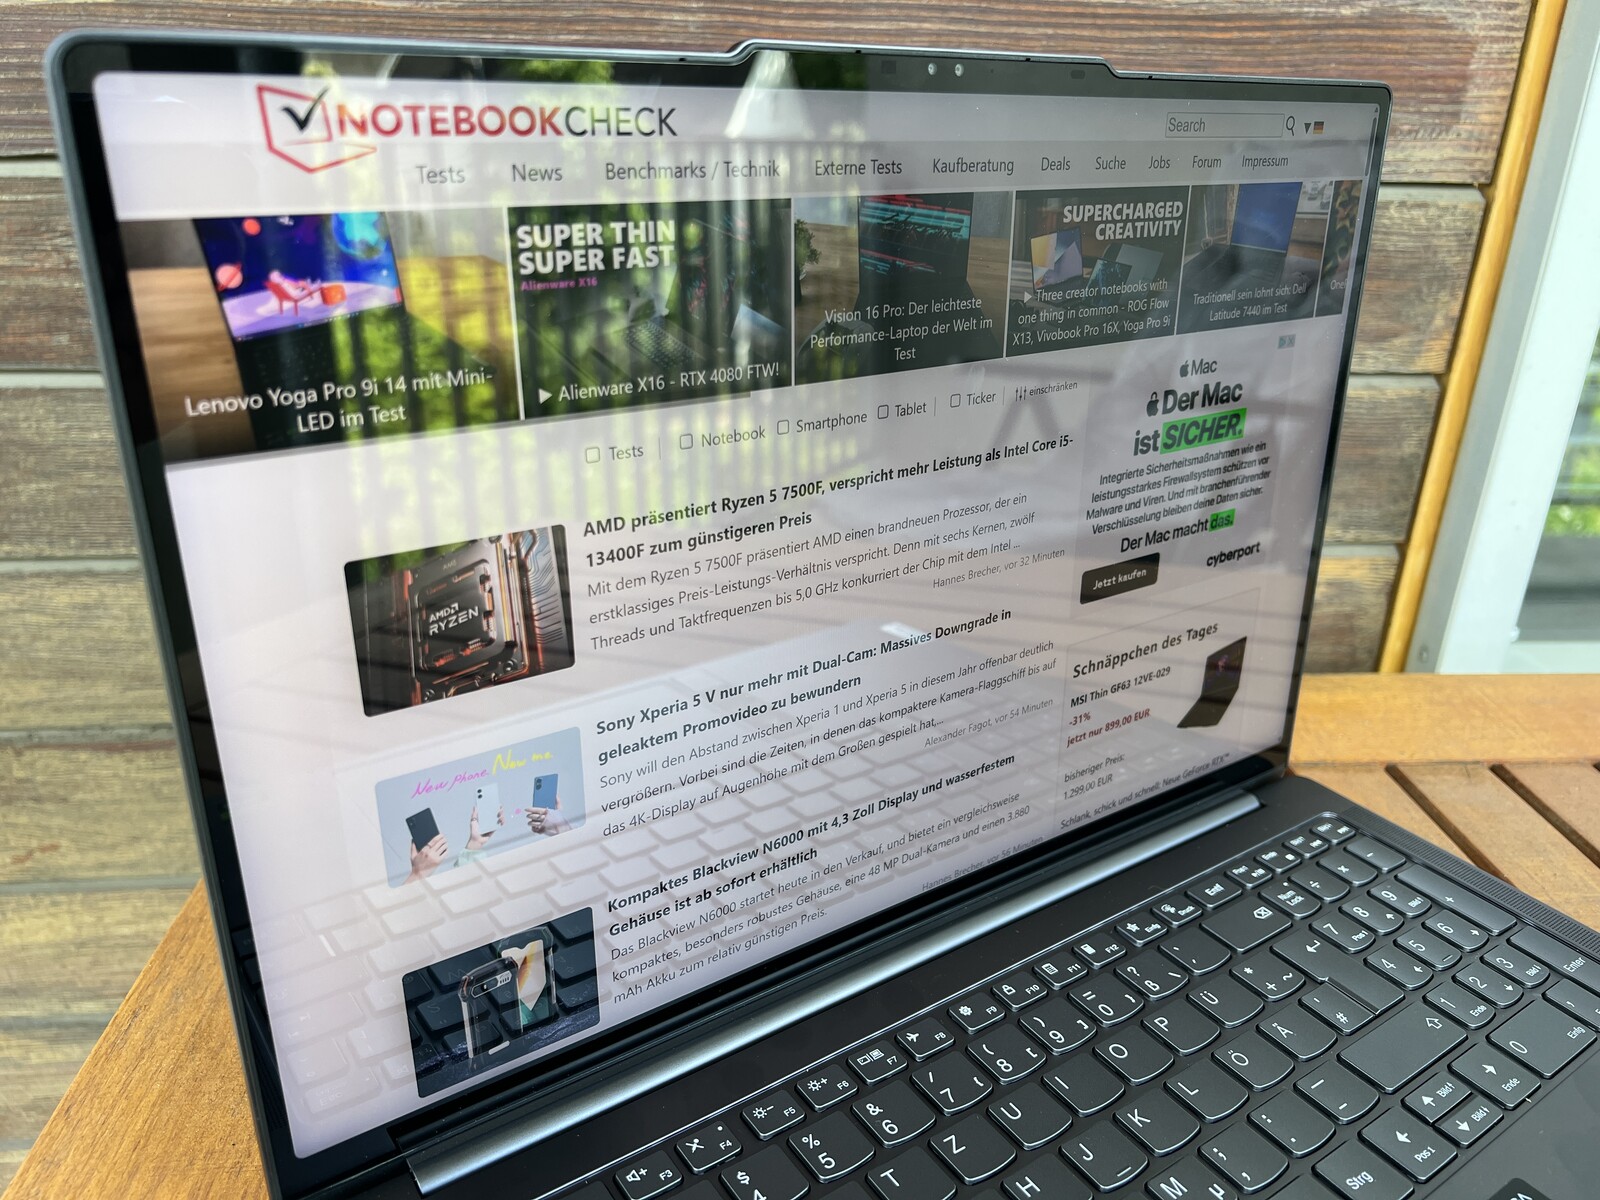
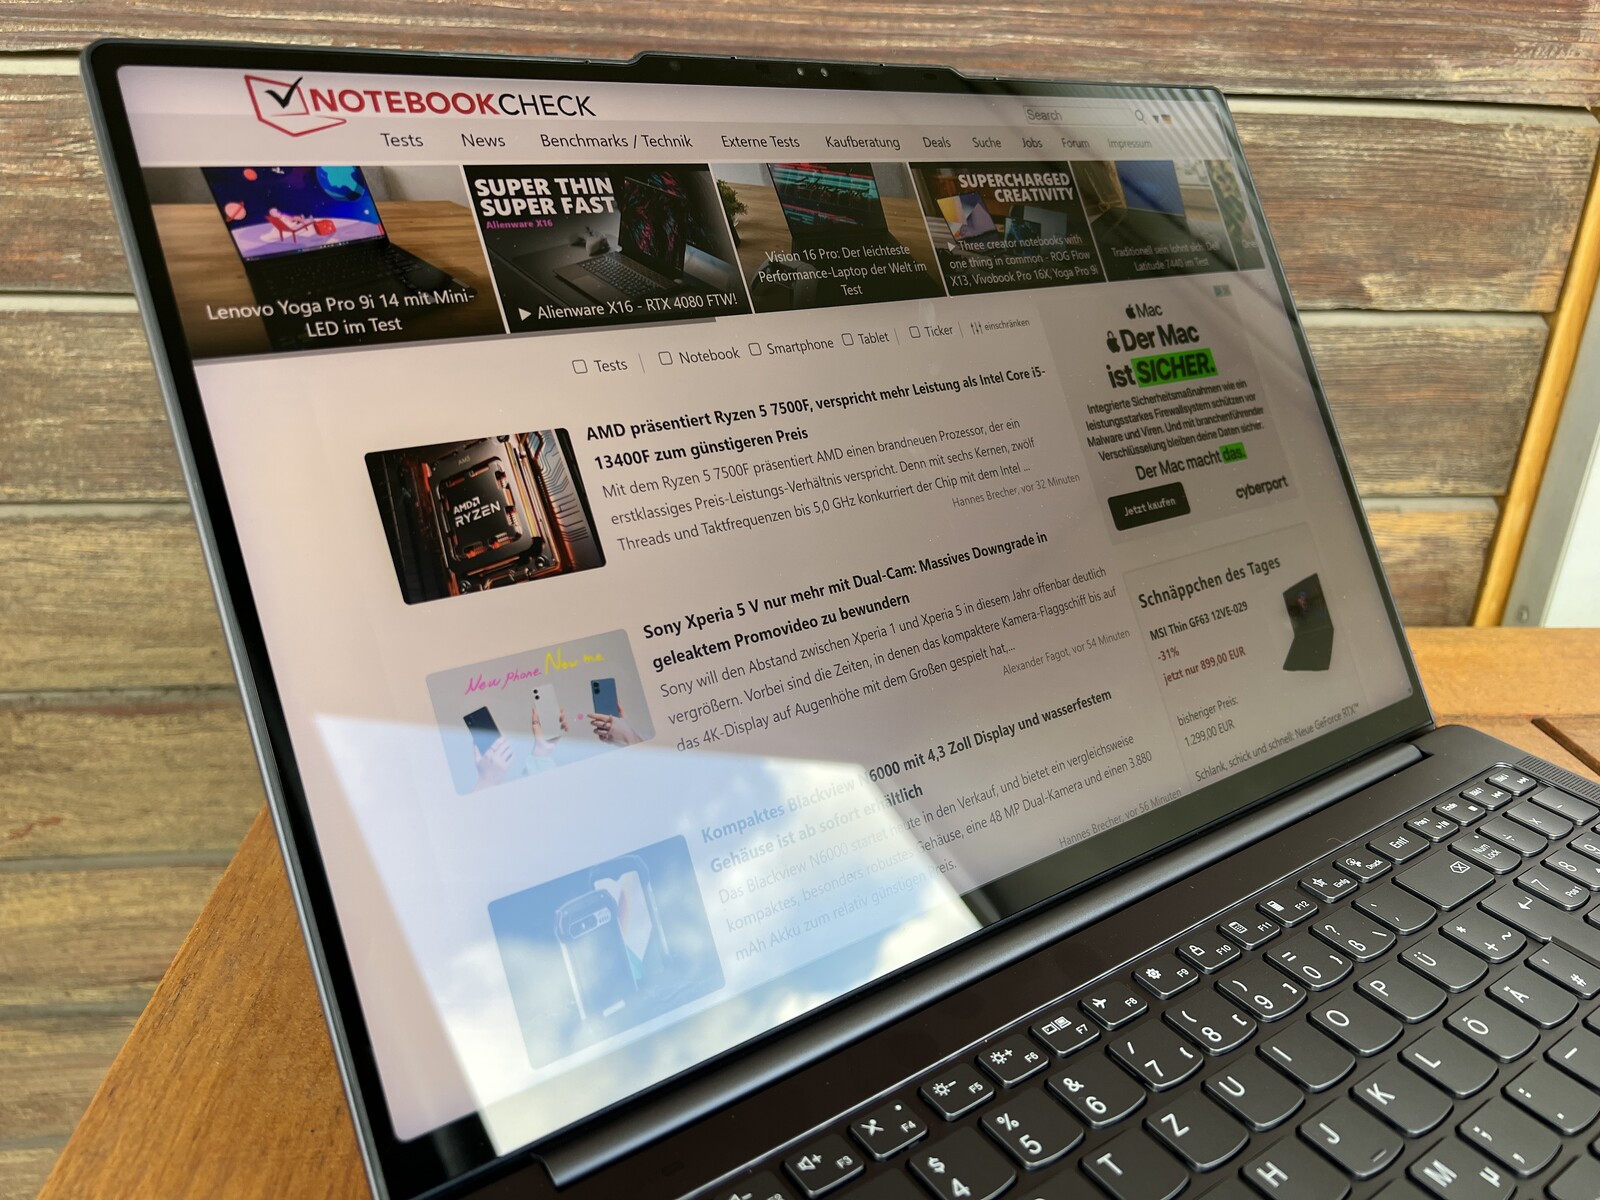
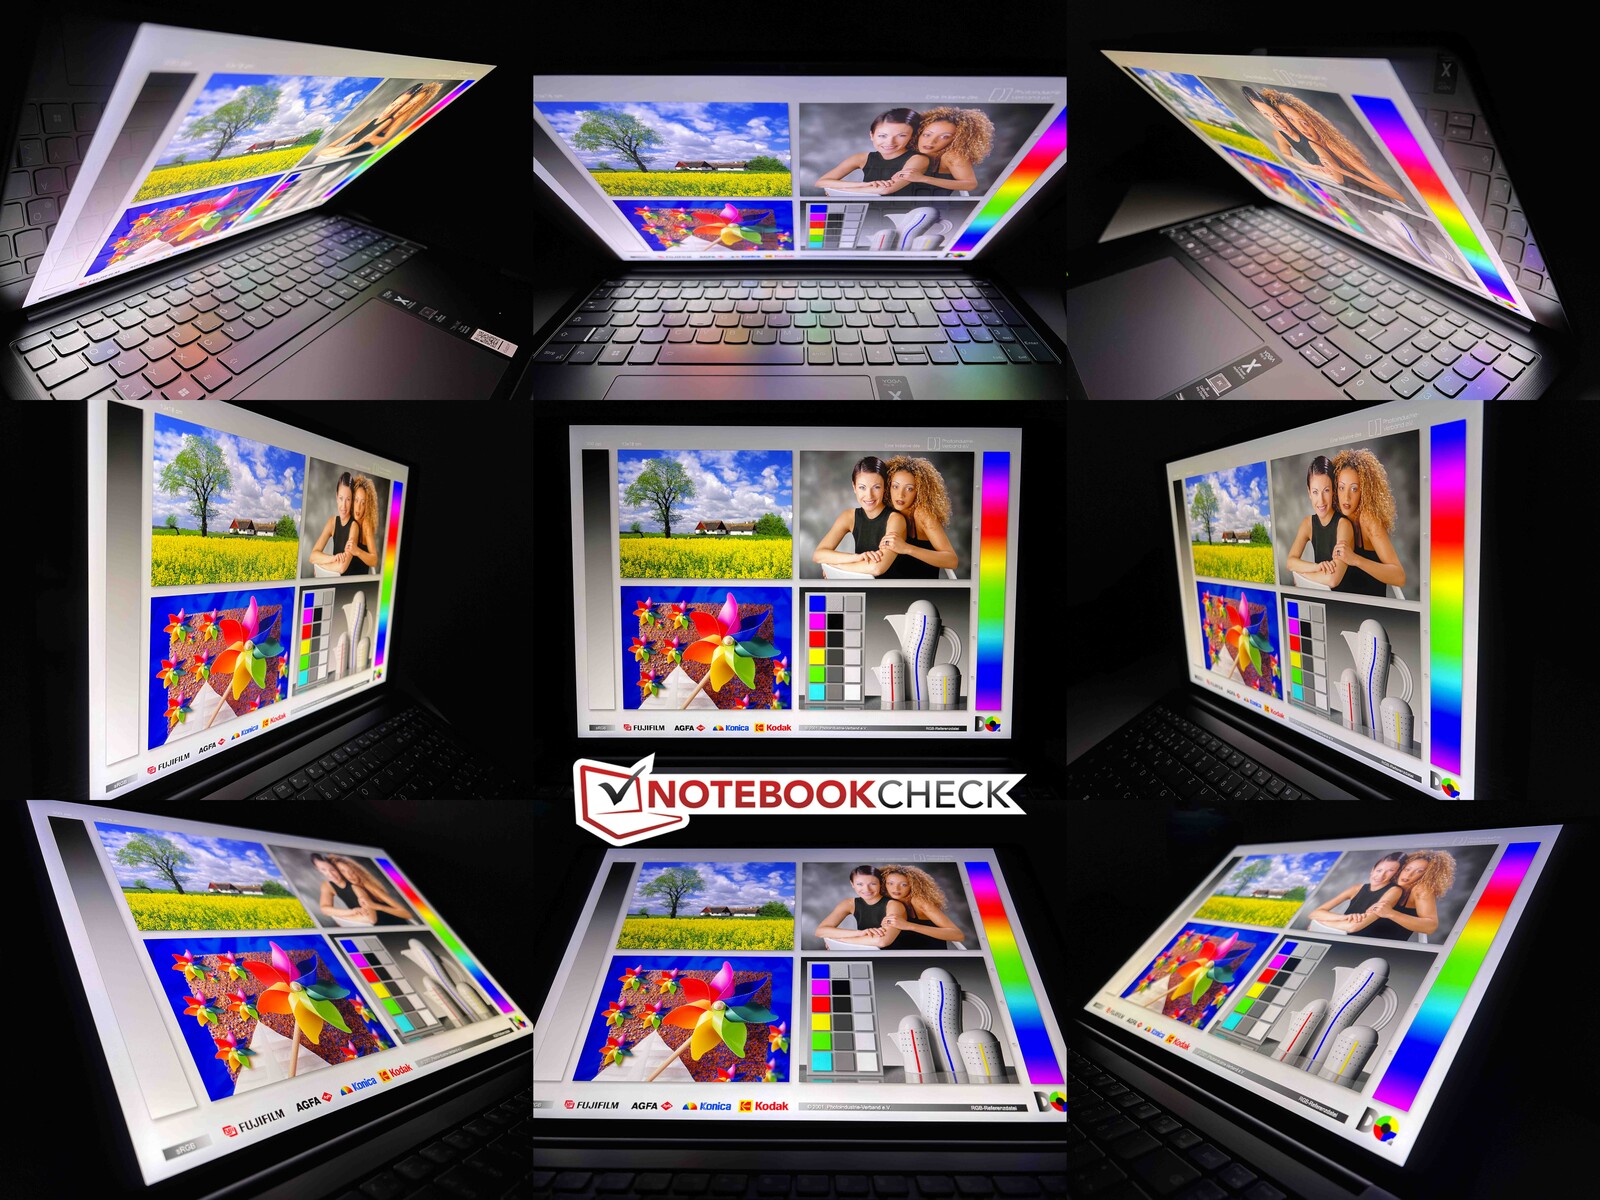
Pekskärmen är mycket reflekterande och irriterande reflexer uppstår även inomhus. På soliga dagar är det inte lätt att hitta en lämplig position för att kunna känna igen skärminnehållet ordentligt. Betraktningsvinkelns stabilitet är mycket bra.
Prestanda - RTX 4060 med 100 watt
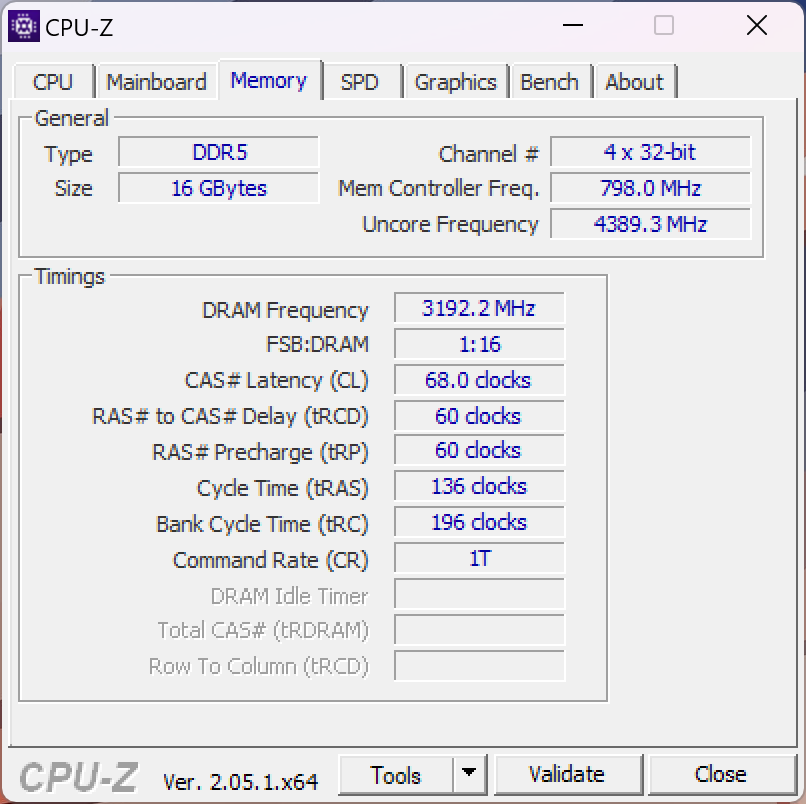
Som tidigare nämnts kommer Yoga Pro 9i 16 med antingen en Core i7- eller Core i9-processor samt GeForce RTX 4050,RTX 4060 eller RTX 4070 grafikkort (100 watt TGP i varje fall). Arbetsminnet består av snabbare LPDDR5X-6400 RAM, men detta är lödat och kan inte utökas.
Villkor för testning
Den förinstallerade Lenovo Vantage-appen erbjuder tre olika prestandaprofiler som enkelt kan bytas när som helst via tangentkombinationen Fn+Q. Vi har listat respektive TDP/TGP värden i tabellen nedan. Vi använde High Performance-läget som standard för våra riktmärken och mätningar.
| Läge | CPU-belastning | GPU-belastning | Stresstest | Max. fläktvolym |
|---|---|---|---|---|
| Batteri | 40 -> 25 watt | 22 watt | CPU: 25 watt GPU: 22 watt |
31,4 dB(A) |
| Smart kylning | 75 -> 65 watt | 55 watt | CPU: 30 watt GPU: 45 watt |
44,5 dB(A) |
| Hög prestanda | 125 -> 80 watt | 100 watt | CPU: 30 watt GPU: 100 watt |
53,2 dB(A) |
Processor
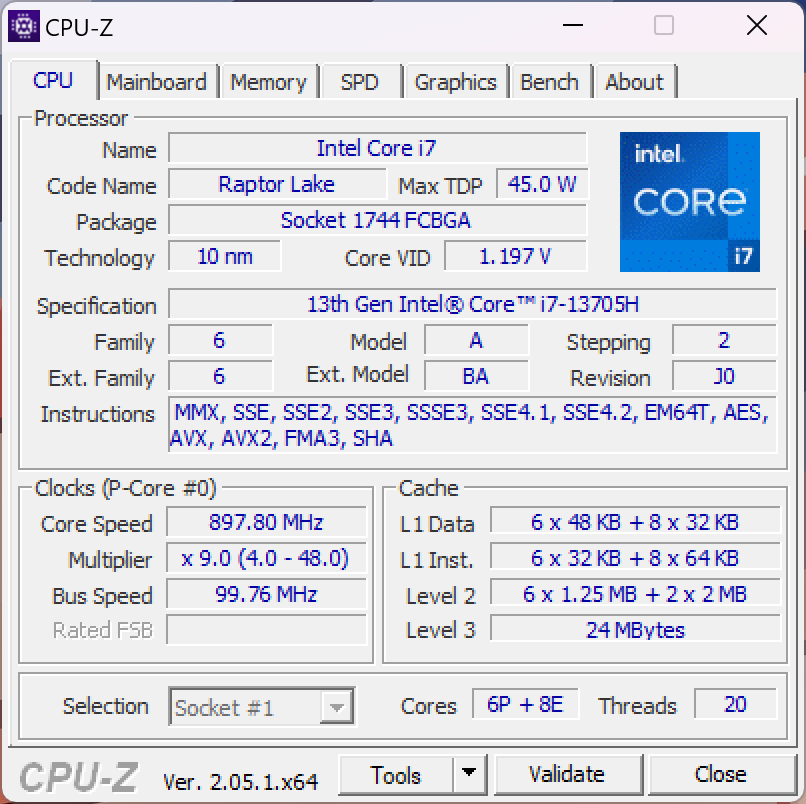
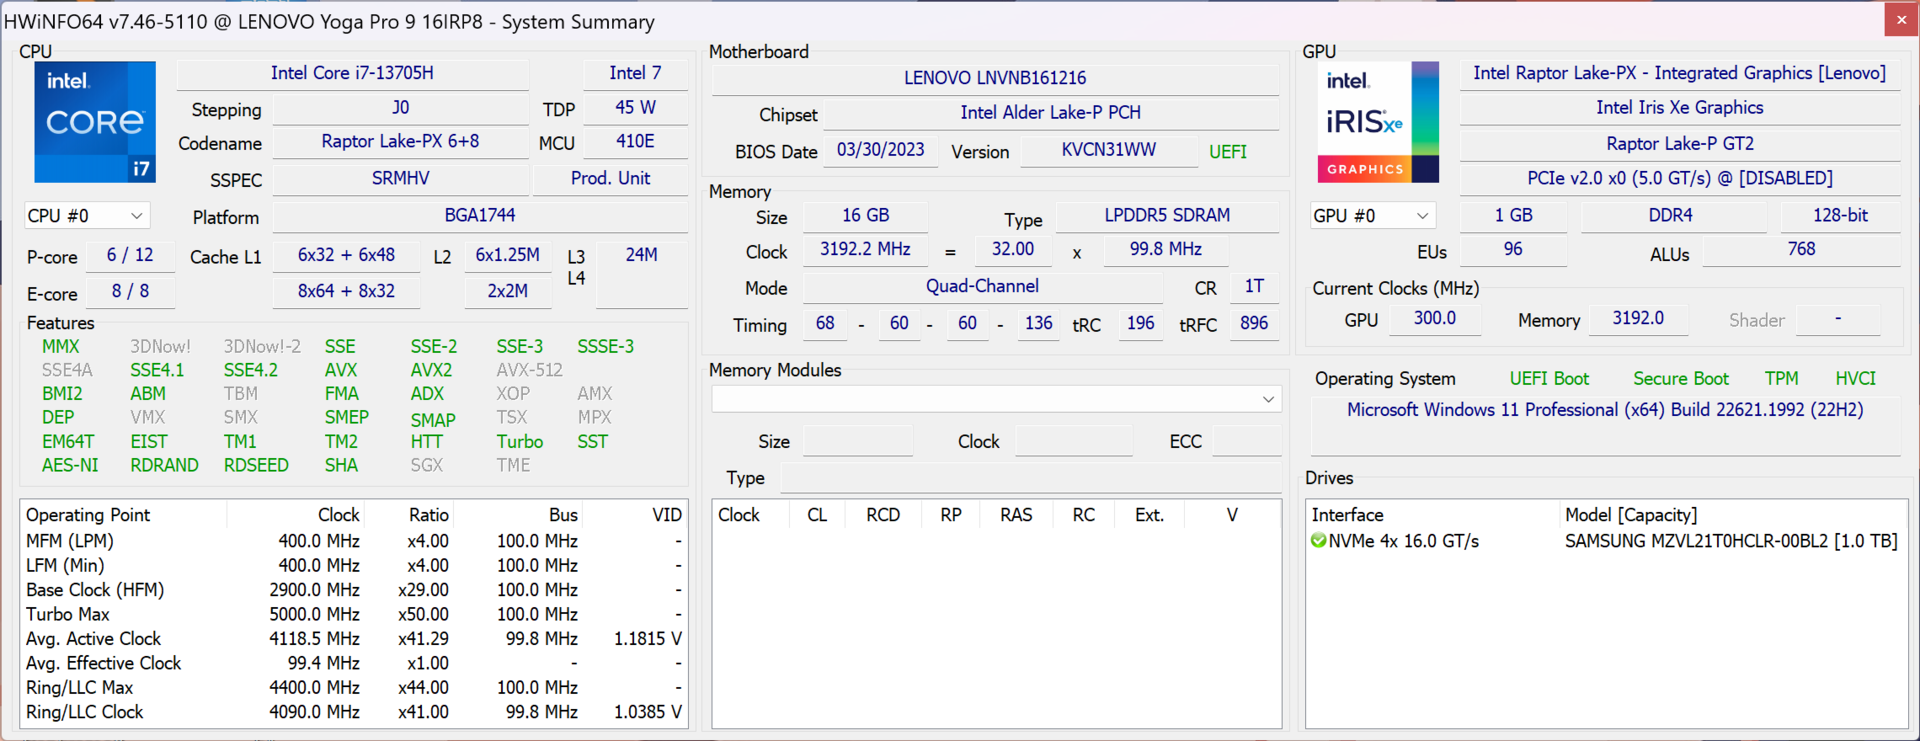
16-tumsmodellen av Yoga Pro 9i använder också Core i7-13705Hvilket är samma som den vanliga Core i7-13700H bortsett från vPro-funktionerna. I High Performance-läget kan processorn förbruka upp till 125 watt under korta perioder och 80 watt permanent, vilket ger mycket bra resultat. Intressant nog presterar den valfria Core i9-13905H något sämre, så uppgraderingen är inte värd det. Inom vår jämförelsegrupp måste Yoga bara erkänna sig besegrad av konkurrenter med betydligt snabbare HX-processorer.
Processorn kan förbruka maximalt 85 watt i batteriläge, vilket leder till en prestandaminskning på cirka 20% i flerkärniga tester. Fler CPU-riktmärken finns tillgängliga i vår teknikavdelning.
Cinebench R15 Multi Sustained Load
Cinebench R23: Multi Core | Single Core
Cinebench R20: CPU (Multi Core) | CPU (Single Core)
Cinebench R15: CPU Multi 64Bit | CPU Single 64Bit
Blender: v2.79 BMW27 CPU
7-Zip 18.03: 7z b 4 | 7z b 4 -mmt1
Geekbench 5.5: Multi-Core | Single-Core
HWBOT x265 Benchmark v2.2: 4k Preset
LibreOffice : 20 Documents To PDF
R Benchmark 2.5: Overall mean
| CPU Performance rating | |
| Asus ProArt Studiobook 16 OLED H7604 | |
| Asus Vivobook Pro 16X K6604JV-MX016W | |
| Apple MacBook Pro 16 2023 M2 Max -6! | |
| Lenovo Yoga Pro 9 16-IRP G8 | |
| Genomsnitt Intel Core i7-13705H | |
| MSI Stealth 16 Studio A13VG | |
| Genomsnitt av klass Multimedia | |
| Schenker VISION 16 Pro (M23) | |
| Cinebench R23 / Multi Core | |
| Asus ProArt Studiobook 16 OLED H7604 | |
| Asus Vivobook Pro 16X K6604JV-MX016W | |
| MSI Stealth 16 Studio A13VG | |
| Lenovo Yoga Pro 9 16-IRP G8 | |
| Genomsnitt Intel Core i7-13705H (17855 - 19675, n=2) | |
| Genomsnitt av klass Multimedia (4861 - 33362, n=65, senaste 2 åren) | |
| Apple MacBook Pro 16 2023 M2 Max | |
| Schenker VISION 16 Pro (M23) | |
| Cinebench R23 / Single Core | |
| Asus ProArt Studiobook 16 OLED H7604 | |
| Genomsnitt av klass Multimedia (1128 - 2459, n=64, senaste 2 åren) | |
| Schenker VISION 16 Pro (M23) | |
| Lenovo Yoga Pro 9 16-IRP G8 | |
| Genomsnitt Intel Core i7-13705H (1869 - 1879, n=2) | |
| MSI Stealth 16 Studio A13VG | |
| Asus Vivobook Pro 16X K6604JV-MX016W | |
| Apple MacBook Pro 16 2023 M2 Max | |
| Cinebench R20 / CPU (Multi Core) | |
| Asus ProArt Studiobook 16 OLED H7604 | |
| Asus Vivobook Pro 16X K6604JV-MX016W | |
| MSI Stealth 16 Studio A13VG | |
| Lenovo Yoga Pro 9 16-IRP G8 | |
| Genomsnitt Intel Core i7-13705H (6868 - 7529, n=2) | |
| Genomsnitt av klass Multimedia (1887 - 12912, n=56, senaste 2 åren) | |
| Schenker VISION 16 Pro (M23) | |
| Apple MacBook Pro 16 2023 M2 Max | |
| Cinebench R20 / CPU (Single Core) | |
| Asus ProArt Studiobook 16 OLED H7604 | |
| Lenovo Yoga Pro 9 16-IRP G8 | |
| Schenker VISION 16 Pro (M23) | |
| Genomsnitt Intel Core i7-13705H (723 - 732, n=2) | |
| Genomsnitt av klass Multimedia (425 - 853, n=56, senaste 2 åren) | |
| MSI Stealth 16 Studio A13VG | |
| Asus Vivobook Pro 16X K6604JV-MX016W | |
| Apple MacBook Pro 16 2023 M2 Max | |
| Cinebench R15 / CPU Multi 64Bit | |
| Asus Vivobook Pro 16X K6604JV-MX016W | |
| Asus ProArt Studiobook 16 OLED H7604 | |
| Lenovo Yoga Pro 9 16-IRP G8 | |
| Genomsnitt Intel Core i7-13705H (2750 - 2987, n=2) | |
| MSI Stealth 16 Studio A13VG | |
| Genomsnitt av klass Multimedia (856 - 5224, n=60, senaste 2 åren) | |
| Schenker VISION 16 Pro (M23) | |
| Apple MacBook Pro 16 2023 M2 Max | |
| Cinebench R15 / CPU Single 64Bit | |
| Asus ProArt Studiobook 16 OLED H7604 | |
| Asus Vivobook Pro 16X K6604JV-MX016W | |
| Genomsnitt av klass Multimedia (184.8 - 326, n=58, senaste 2 åren) | |
| Schenker VISION 16 Pro (M23) | |
| Lenovo Yoga Pro 9 16-IRP G8 | |
| Genomsnitt Intel Core i7-13705H (273 - 274, n=2) | |
| MSI Stealth 16 Studio A13VG | |
| Apple MacBook Pro 16 2023 M2 Max | |
| Blender / v2.79 BMW27 CPU | |
| Genomsnitt av klass Multimedia (100 - 557, n=57, senaste 2 åren) | |
| Schenker VISION 16 Pro (M23) | |
| Genomsnitt Intel Core i7-13705H (172 - 190, n=2) | |
| Lenovo Yoga Pro 9 16-IRP G8 | |
| MSI Stealth 16 Studio A13VG | |
| Asus Vivobook Pro 16X K6604JV-MX016W | |
| Asus ProArt Studiobook 16 OLED H7604 | |
| 7-Zip 18.03 / 7z b 4 | |
| Asus ProArt Studiobook 16 OLED H7604 | |
| Asus Vivobook Pro 16X K6604JV-MX016W | |
| Lenovo Yoga Pro 9 16-IRP G8 | |
| MSI Stealth 16 Studio A13VG | |
| Genomsnitt Intel Core i7-13705H (71884 - 78446, n=2) | |
| Schenker VISION 16 Pro (M23) | |
| Genomsnitt av klass Multimedia (26062 - 130368, n=54, senaste 2 åren) | |
| 7-Zip 18.03 / 7z b 4 -mmt1 | |
| Asus ProArt Studiobook 16 OLED H7604 | |
| Asus Vivobook Pro 16X K6604JV-MX016W | |
| Schenker VISION 16 Pro (M23) | |
| MSI Stealth 16 Studio A13VG | |
| Genomsnitt Intel Core i7-13705H (5924 - 6075, n=2) | |
| Lenovo Yoga Pro 9 16-IRP G8 | |
| Genomsnitt av klass Multimedia (3666 - 7545, n=55, senaste 2 åren) | |
| Geekbench 5.5 / Multi-Core | |
| Asus ProArt Studiobook 16 OLED H7604 | |
| Asus Vivobook Pro 16X K6604JV-MX016W | |
| Apple MacBook Pro 16 2023 M2 Max | |
| Lenovo Yoga Pro 9 16-IRP G8 | |
| Genomsnitt Intel Core i7-13705H (14124 - 14521, n=2) | |
| MSI Stealth 16 Studio A13VG | |
| Genomsnitt av klass Multimedia (4652 - 20422, n=55, senaste 2 åren) | |
| Schenker VISION 16 Pro (M23) | |
| Geekbench 5.5 / Single-Core | |
| Asus ProArt Studiobook 16 OLED H7604 | |
| Asus Vivobook Pro 16X K6604JV-MX016W | |
| Apple MacBook Pro 16 2023 M2 Max | |
| Genomsnitt av klass Multimedia (805 - 2974, n=55, senaste 2 åren) | |
| Schenker VISION 16 Pro (M23) | |
| Genomsnitt Intel Core i7-13705H (1791 - 1891, n=2) | |
| MSI Stealth 16 Studio A13VG | |
| Lenovo Yoga Pro 9 16-IRP G8 | |
| HWBOT x265 Benchmark v2.2 / 4k Preset | |
| Asus ProArt Studiobook 16 OLED H7604 | |
| Asus Vivobook Pro 16X K6604JV-MX016W | |
| Lenovo Yoga Pro 9 16-IRP G8 | |
| Genomsnitt Intel Core i7-13705H (18.9 - 21.3, n=2) | |
| MSI Stealth 16 Studio A13VG | |
| Genomsnitt av klass Multimedia (5.26 - 36.1, n=55, senaste 2 åren) | |
| Schenker VISION 16 Pro (M23) | |
| LibreOffice / 20 Documents To PDF | |
| MSI Stealth 16 Studio A13VG | |
| Asus Vivobook Pro 16X K6604JV-MX016W | |
| Genomsnitt av klass Multimedia (23.9 - 146.7, n=56, senaste 2 åren) | |
| Lenovo Yoga Pro 9 16-IRP G8 | |
| Schenker VISION 16 Pro (M23) | |
| Genomsnitt Intel Core i7-13705H (47.4 - 47.7, n=2) | |
| Asus ProArt Studiobook 16 OLED H7604 | |
| R Benchmark 2.5 / Overall mean | |
| Genomsnitt av klass Multimedia (0.3604 - 0.947, n=55, senaste 2 åren) | |
| Lenovo Yoga Pro 9 16-IRP G8 | |
| MSI Stealth 16 Studio A13VG | |
| Genomsnitt Intel Core i7-13705H (0.4305 - 0.4571, n=2) | |
| Schenker VISION 16 Pro (M23) | |
| Asus Vivobook Pro 16X K6604JV-MX016W | |
| Asus ProArt Studiobook 16 OLED H7604 | |
* ... mindre är bättre
AIDA64: FP32 Ray-Trace | FPU Julia | CPU SHA3 | CPU Queen | FPU SinJulia | FPU Mandel | CPU AES | CPU ZLib | FP64 Ray-Trace | CPU PhotoWorxx
| Performance rating | |
| Asus ProArt Studiobook 16 OLED H7604 | |
| Asus Vivobook Pro 16X K6604JV-MX016W | |
| Lenovo Yoga Pro 9 16-IRP G8 | |
| Genomsnitt Intel Core i7-13705H | |
| MSI Stealth 16 Studio A13VG | |
| Genomsnitt av klass Multimedia | |
| Schenker VISION 16 Pro (M23) | |
| AIDA64 / FP32 Ray-Trace | |
| Asus ProArt Studiobook 16 OLED H7604 | |
| Asus Vivobook Pro 16X K6604JV-MX016W | |
| MSI Stealth 16 Studio A13VG | |
| Lenovo Yoga Pro 9 16-IRP G8 | |
| Genomsnitt av klass Multimedia (2214 - 50388, n=53, senaste 2 åren) | |
| Genomsnitt Intel Core i7-13705H (16297 - 17568, n=2) | |
| Schenker VISION 16 Pro (M23) | |
| AIDA64 / FPU Julia | |
| Asus ProArt Studiobook 16 OLED H7604 | |
| Asus Vivobook Pro 16X K6604JV-MX016W | |
| Lenovo Yoga Pro 9 16-IRP G8 | |
| Genomsnitt Intel Core i7-13705H (80950 - 92250, n=2) | |
| MSI Stealth 16 Studio A13VG | |
| Genomsnitt av klass Multimedia (12867 - 201874, n=53, senaste 2 åren) | |
| Schenker VISION 16 Pro (M23) | |
| AIDA64 / CPU SHA3 | |
| Asus ProArt Studiobook 16 OLED H7604 | |
| Asus Vivobook Pro 16X K6604JV-MX016W | |
| Lenovo Yoga Pro 9 16-IRP G8 | |
| MSI Stealth 16 Studio A13VG | |
| Genomsnitt Intel Core i7-13705H (3673 - 4189, n=2) | |
| Genomsnitt av klass Multimedia (626 - 8623, n=53, senaste 2 åren) | |
| Schenker VISION 16 Pro (M23) | |
| AIDA64 / CPU Queen | |
| Asus ProArt Studiobook 16 OLED H7604 | |
| Asus Vivobook Pro 16X K6604JV-MX016W | |
| Lenovo Yoga Pro 9 16-IRP G8 | |
| Genomsnitt Intel Core i7-13705H (106151 - 106736, n=2) | |
| MSI Stealth 16 Studio A13VG | |
| Schenker VISION 16 Pro (M23) | |
| Genomsnitt av klass Multimedia (13483 - 181505, n=40, senaste 2 åren) | |
| AIDA64 / FPU SinJulia | |
| Asus ProArt Studiobook 16 OLED H7604 | |
| Asus Vivobook Pro 16X K6604JV-MX016W | |
| Lenovo Yoga Pro 9 16-IRP G8 | |
| MSI Stealth 16 Studio A13VG | |
| Genomsnitt Intel Core i7-13705H (10635 - 11077, n=2) | |
| Schenker VISION 16 Pro (M23) | |
| Genomsnitt av klass Multimedia (886 - 28794, n=53, senaste 2 åren) | |
| AIDA64 / FPU Mandel | |
| Asus ProArt Studiobook 16 OLED H7604 | |
| Asus Vivobook Pro 16X K6604JV-MX016W | |
| MSI Stealth 16 Studio A13VG | |
| Genomsnitt av klass Multimedia (6395 - 105740, n=53, senaste 2 åren) | |
| Lenovo Yoga Pro 9 16-IRP G8 | |
| Genomsnitt Intel Core i7-13705H (40508 - 42686, n=2) | |
| Schenker VISION 16 Pro (M23) | |
| AIDA64 / CPU AES | |
| Asus ProArt Studiobook 16 OLED H7604 | |
| Asus Vivobook Pro 16X K6604JV-MX016W | |
| Lenovo Yoga Pro 9 16-IRP G8 | |
| MSI Stealth 16 Studio A13VG | |
| Genomsnitt Intel Core i7-13705H (75651 - 85118, n=2) | |
| Schenker VISION 16 Pro (M23) | |
| Genomsnitt av klass Multimedia (8171 - 126790, n=53, senaste 2 åren) | |
| AIDA64 / CPU ZLib | |
| Asus ProArt Studiobook 16 OLED H7604 | |
| Asus Vivobook Pro 16X K6604JV-MX016W | |
| Lenovo Yoga Pro 9 16-IRP G8 | |
| Genomsnitt Intel Core i7-13705H (1126 - 1226, n=2) | |
| MSI Stealth 16 Studio A13VG | |
| Genomsnitt av klass Multimedia (143.8 - 2022, n=53, senaste 2 åren) | |
| Schenker VISION 16 Pro (M23) | |
| AIDA64 / FP64 Ray-Trace | |
| Asus ProArt Studiobook 16 OLED H7604 | |
| Asus Vivobook Pro 16X K6604JV-MX016W | |
| MSI Stealth 16 Studio A13VG | |
| Genomsnitt av klass Multimedia (1014 - 26875, n=53, senaste 2 åren) | |
| Lenovo Yoga Pro 9 16-IRP G8 | |
| Genomsnitt Intel Core i7-13705H (8846 - 9166, n=2) | |
| Schenker VISION 16 Pro (M23) | |
| AIDA64 / CPU PhotoWorxx | |
| Lenovo Yoga Pro 9 16-IRP G8 | |
| Genomsnitt Intel Core i7-13705H (51796 - 52257, n=2) | |
| Genomsnitt av klass Multimedia (8187 - 88154, n=53, senaste 2 åren) | |
| Asus ProArt Studiobook 16 OLED H7604 | |
| MSI Stealth 16 Studio A13VG | |
| Schenker VISION 16 Pro (M23) | |
| Asus Vivobook Pro 16X K6604JV-MX016W | |
Systemets prestanda
Prestandavärdena i de syntetiska riktmärkena är mycket bra, även om konkurrerande bärbara datorer också ligger på en mycket liknande nivå totalt sett. Vid daglig användning är den bärbara datorn alltid smidig och responsiv. Inga problem uppstod heller under testningen.
CrossMark: Overall | Productivity | Creativity | Responsiveness
| PCMark 10 / Score | |
| Genomsnitt av klass Multimedia (4325 - 10386, n=51, senaste 2 åren) | |
| Asus ProArt Studiobook 16 OLED H7604 | |
| Schenker VISION 16 Pro (M23) | |
| MSI Stealth 16 Studio A13VG | |
| Lenovo Yoga Pro 9 16-IRP G8 | |
| Genomsnitt Intel Core i7-13705H, NVIDIA GeForce RTX 4060 Laptop GPU (n=1) | |
| Asus Vivobook Pro 16X K6604JV-MX016W | |
| PCMark 10 / Essentials | |
| Lenovo Yoga Pro 9 16-IRP G8 | |
| Genomsnitt Intel Core i7-13705H, NVIDIA GeForce RTX 4060 Laptop GPU (n=1) | |
| Asus ProArt Studiobook 16 OLED H7604 | |
| Schenker VISION 16 Pro (M23) | |
| Asus Vivobook Pro 16X K6604JV-MX016W | |
| Genomsnitt av klass Multimedia (8025 - 11664, n=50, senaste 2 åren) | |
| MSI Stealth 16 Studio A13VG | |
| PCMark 10 / Productivity | |
| Genomsnitt av klass Multimedia (7323 - 18233, n=50, senaste 2 åren) | |
| Asus ProArt Studiobook 16 OLED H7604 | |
| Schenker VISION 16 Pro (M23) | |
| MSI Stealth 16 Studio A13VG | |
| Asus Vivobook Pro 16X K6604JV-MX016W | |
| Lenovo Yoga Pro 9 16-IRP G8 | |
| Genomsnitt Intel Core i7-13705H, NVIDIA GeForce RTX 4060 Laptop GPU (n=1) | |
| PCMark 10 / Digital Content Creation | |
| MSI Stealth 16 Studio A13VG | |
| Lenovo Yoga Pro 9 16-IRP G8 | |
| Genomsnitt Intel Core i7-13705H, NVIDIA GeForce RTX 4060 Laptop GPU (n=1) | |
| Schenker VISION 16 Pro (M23) | |
| Asus ProArt Studiobook 16 OLED H7604 | |
| Genomsnitt av klass Multimedia (3651 - 16240, n=50, senaste 2 åren) | |
| Asus Vivobook Pro 16X K6604JV-MX016W | |
| CrossMark / Overall | |
| Asus ProArt Studiobook 16 OLED H7604 | |
| Asus Vivobook Pro 16X K6604JV-MX016W | |
| Apple MacBook Pro 16 2023 M2 Max | |
| Schenker VISION 16 Pro (M23) | |
| Genomsnitt av klass Multimedia (866 - 2728, n=59, senaste 2 åren) | |
| Lenovo Yoga Pro 9 16-IRP G8 | |
| Genomsnitt Intel Core i7-13705H, NVIDIA GeForce RTX 4060 Laptop GPU (n=1) | |
| MSI Stealth 16 Studio A13VG | |
| CrossMark / Productivity | |
| Asus ProArt Studiobook 16 OLED H7604 | |
| Asus Vivobook Pro 16X K6604JV-MX016W | |
| Schenker VISION 16 Pro (M23) | |
| Genomsnitt av klass Multimedia (931 - 2489, n=59, senaste 2 åren) | |
| MSI Stealth 16 Studio A13VG | |
| Lenovo Yoga Pro 9 16-IRP G8 | |
| Genomsnitt Intel Core i7-13705H, NVIDIA GeForce RTX 4060 Laptop GPU (n=1) | |
| Apple MacBook Pro 16 2023 M2 Max | |
| CrossMark / Creativity | |
| Apple MacBook Pro 16 2023 M2 Max | |
| Asus ProArt Studiobook 16 OLED H7604 | |
| Asus Vivobook Pro 16X K6604JV-MX016W | |
| Genomsnitt av klass Multimedia (907 - 3465, n=59, senaste 2 åren) | |
| Lenovo Yoga Pro 9 16-IRP G8 | |
| Genomsnitt Intel Core i7-13705H, NVIDIA GeForce RTX 4060 Laptop GPU (n=1) | |
| Schenker VISION 16 Pro (M23) | |
| MSI Stealth 16 Studio A13VG | |
| CrossMark / Responsiveness | |
| Asus ProArt Studiobook 16 OLED H7604 | |
| Schenker VISION 16 Pro (M23) | |
| Asus Vivobook Pro 16X K6604JV-MX016W | |
| MSI Stealth 16 Studio A13VG | |
| Lenovo Yoga Pro 9 16-IRP G8 | |
| Genomsnitt Intel Core i7-13705H, NVIDIA GeForce RTX 4060 Laptop GPU (n=1) | |
| Genomsnitt av klass Multimedia (605 - 2024, n=59, senaste 2 åren) | |
| Apple MacBook Pro 16 2023 M2 Max | |
| PCMark 10 Score | 7301 poäng | |
Hjälp | ||
| AIDA64 / Memory Copy | |
| Genomsnitt av klass Multimedia (11299 - 132135, n=53, senaste 2 åren) | |
| Genomsnitt Intel Core i7-13705H (78047 - 79495, n=2) | |
| Lenovo Yoga Pro 9 16-IRP G8 | |
| Asus ProArt Studiobook 16 OLED H7604 | |
| MSI Stealth 16 Studio A13VG | |
| Asus Vivobook Pro 16X K6604JV-MX016W | |
| Schenker VISION 16 Pro (M23) | |
| AIDA64 / Memory Read | |
| Genomsnitt av klass Multimedia (11624 - 174586, n=53, senaste 2 åren) | |
| Lenovo Yoga Pro 9 16-IRP G8 | |
| Asus ProArt Studiobook 16 OLED H7604 | |
| Asus Vivobook Pro 16X K6604JV-MX016W | |
| Genomsnitt Intel Core i7-13705H (72741 - 77976, n=2) | |
| MSI Stealth 16 Studio A13VG | |
| Schenker VISION 16 Pro (M23) | |
| AIDA64 / Memory Write | |
| Lenovo Yoga Pro 9 16-IRP G8 | |
| Genomsnitt Intel Core i7-13705H (90999 - 95196, n=2) | |
| Genomsnitt av klass Multimedia (11755 - 134998, n=53, senaste 2 åren) | |
| Asus ProArt Studiobook 16 OLED H7604 | |
| MSI Stealth 16 Studio A13VG | |
| Asus Vivobook Pro 16X K6604JV-MX016W | |
| Schenker VISION 16 Pro (M23) | |
| AIDA64 / Memory Latency | |
| Genomsnitt av klass Multimedia (7 - 535, n=52, senaste 2 åren) | |
| Lenovo Yoga Pro 9 16-IRP G8 | |
| Genomsnitt Intel Core i7-13705H (93.9 - 115, n=2) | |
| Asus Vivobook Pro 16X K6604JV-MX016W | |
| MSI Stealth 16 Studio A13VG | |
| Asus ProArt Studiobook 16 OLED H7604 | |
| Schenker VISION 16 Pro (M23) | |
* ... mindre är bättre
DPC-fördröjning
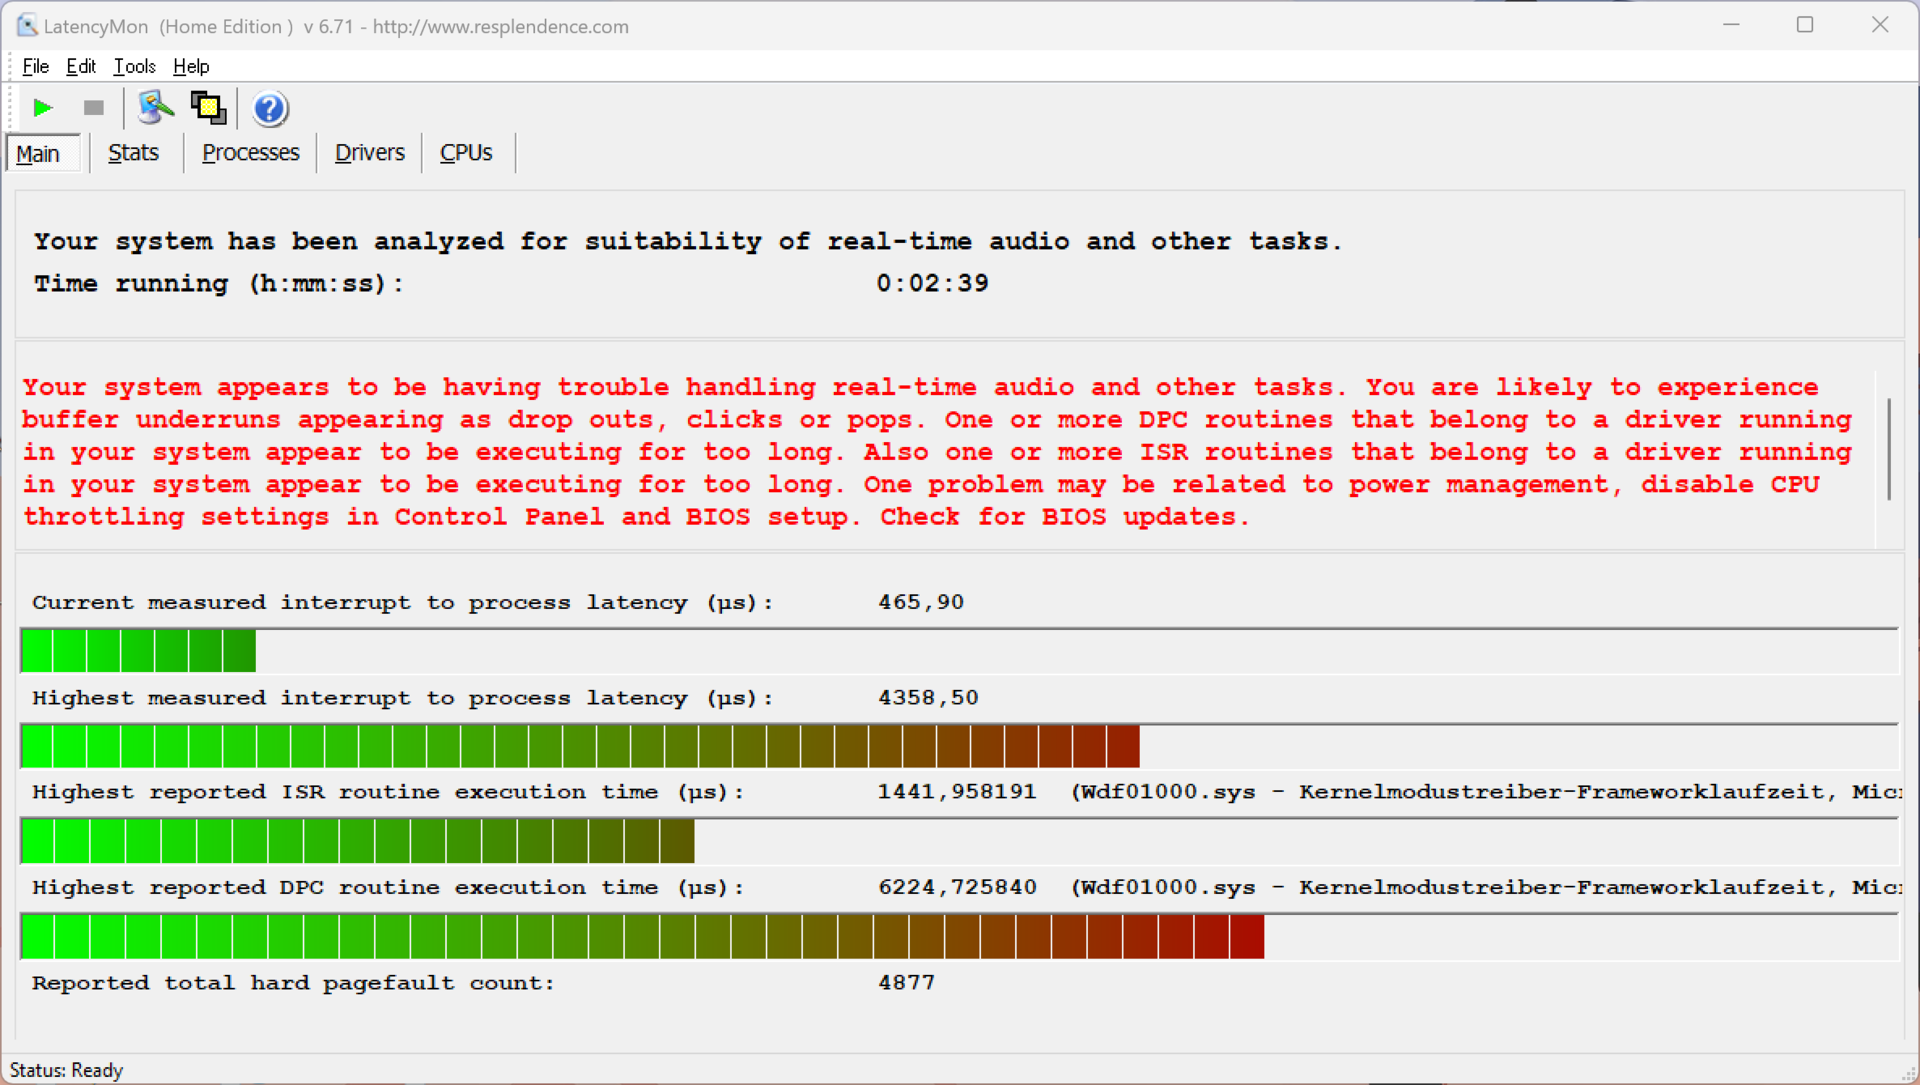
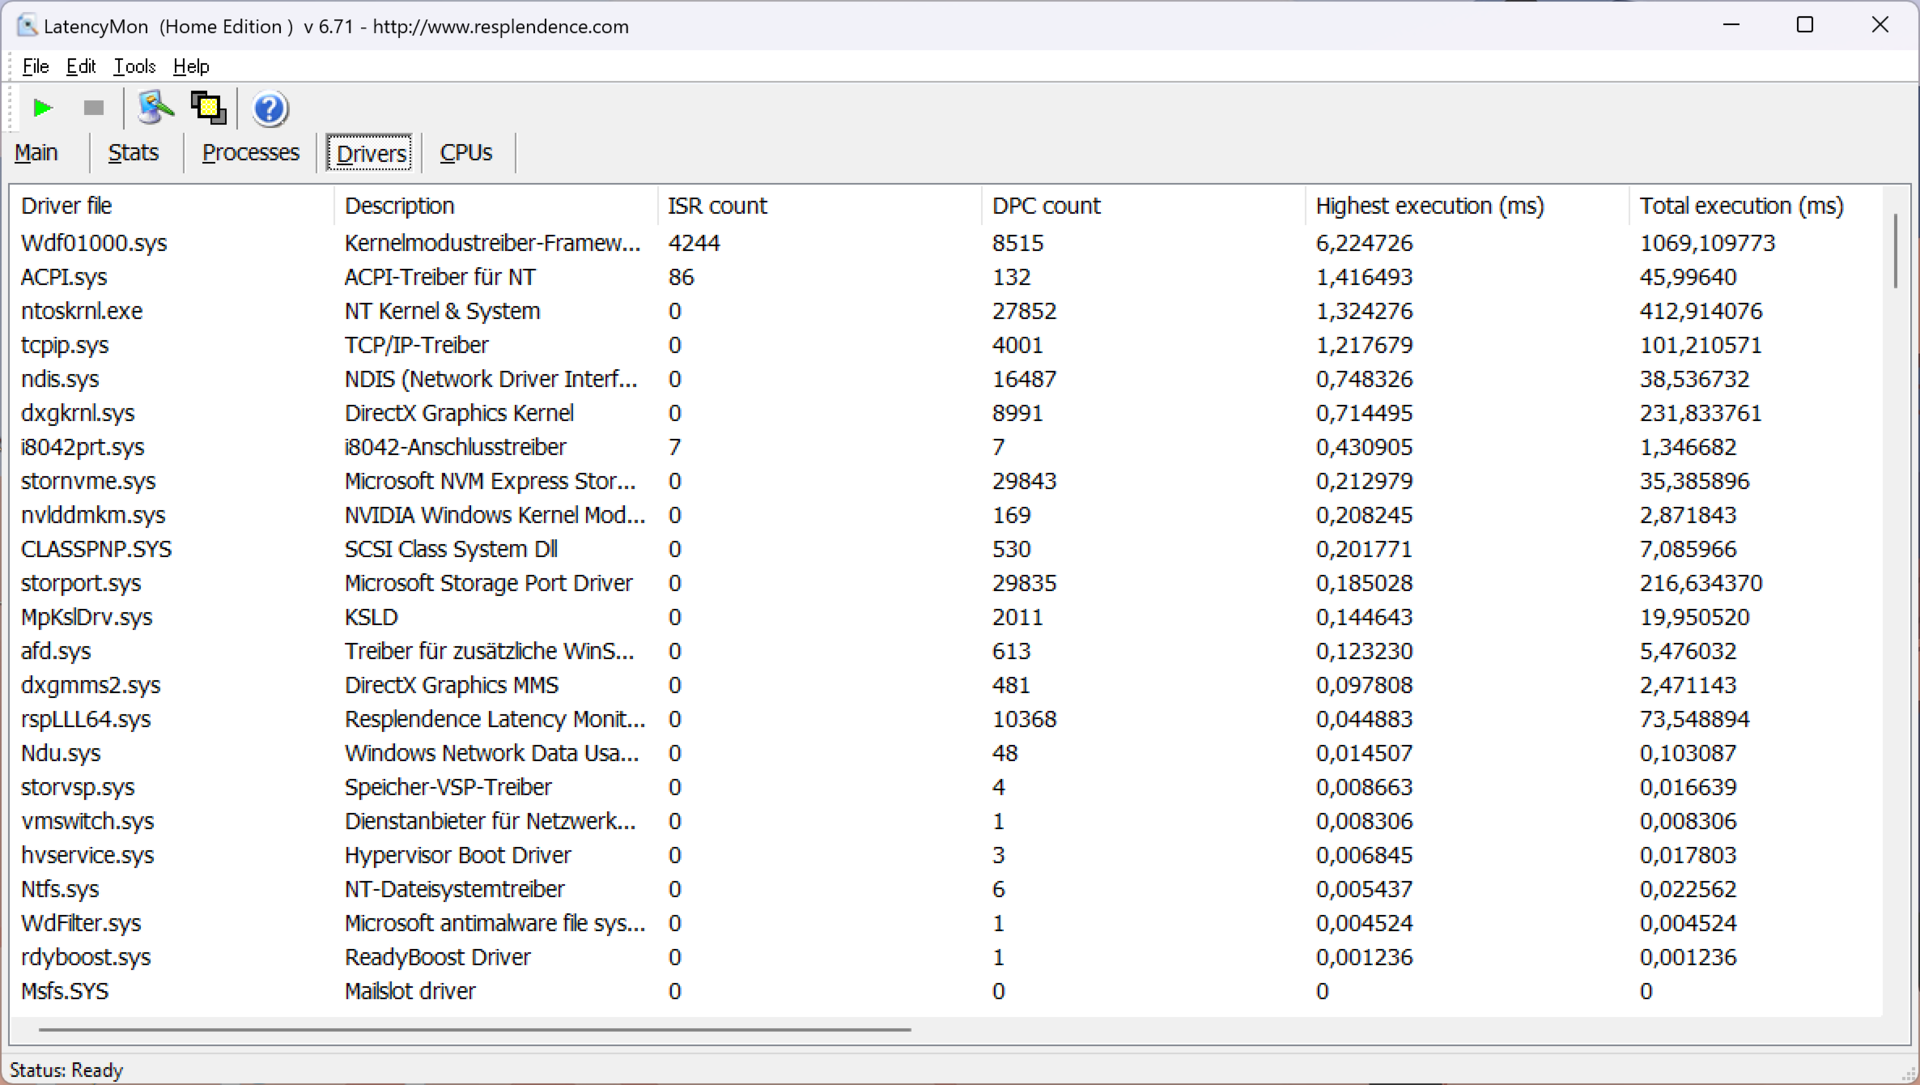
Vår testenhet uppvisade betydande begränsningar i vårt standardiserade latens-test (webbsurfning, 4K YouTube-uppspelning, CPU-belastning) med den nuvarande BIOS-versionen och är därför olämplig för ljudapplikationer i realtid.
| DPC Latencies / LatencyMon - interrupt to process latency (max), Web, Youtube, Prime95 | |
| MSI Stealth 16 Studio A13VG | |
| Lenovo Yoga Pro 9 16-IRP G8 | |
| Asus Vivobook Pro 16X K6604JV-MX016W | |
| Asus ProArt Studiobook 16 OLED H7604 | |
| Schenker VISION 16 Pro (M23) | |
* ... mindre är bättre
Lagringsenheter
Lenovo använder det extra utrymmet i 16-tums chassit för en andra M.2-plats, som dock endast stöder PCIe 3.0 x4. Den primära platsen är ansluten via PCIe-4.0, och 1 TB-versionen av Samsung PM9A1 (OEM-version av 980 Pro) är installerad i vår testenhet. Efter den första uppstarten har användaren 891 GB tillgängligt. Överföringshastigheterna är mycket bra totalt sett och prestandan förblir stabil under långvarig belastning, vilket inte alltid garanteras med moderna enheter. Men 990 Pro efterträdare (seSchenker Vision 16 Pro) erbjuder återigen betydande fördelar vid slumpmässiga åtkomster. Fler SSD-riktmärken finns tillgängliga här.

* ... mindre är bättre
Sustained Read Performance: DiskSpd Read Loop, Queue Depth 8
Grafikkort
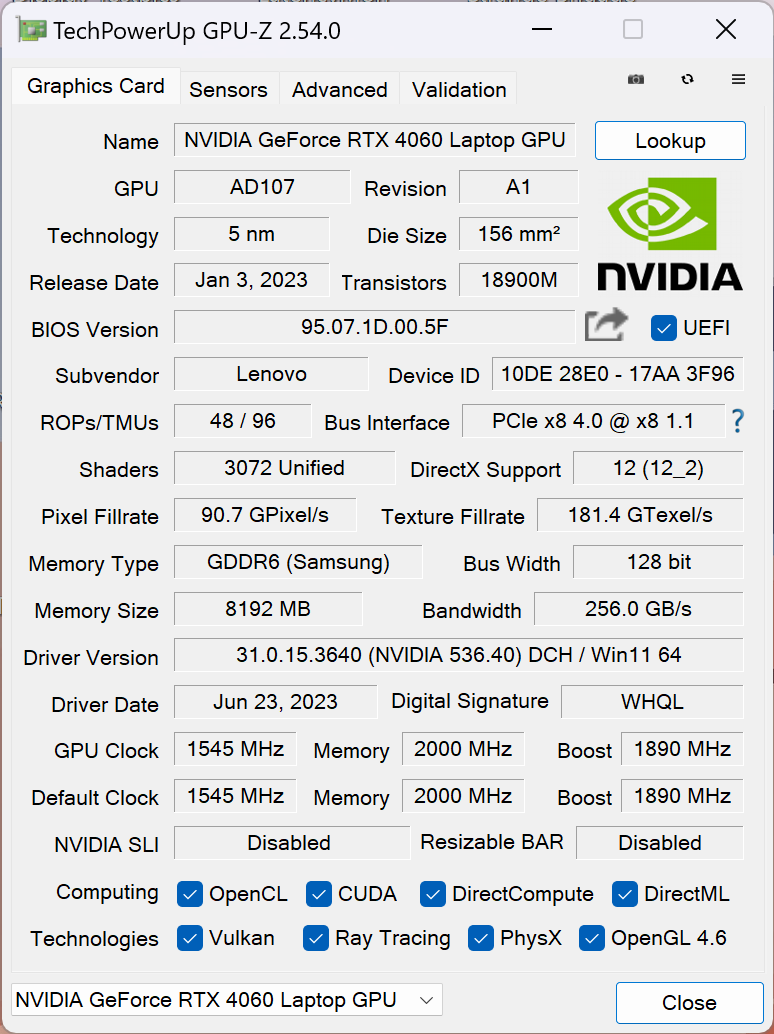
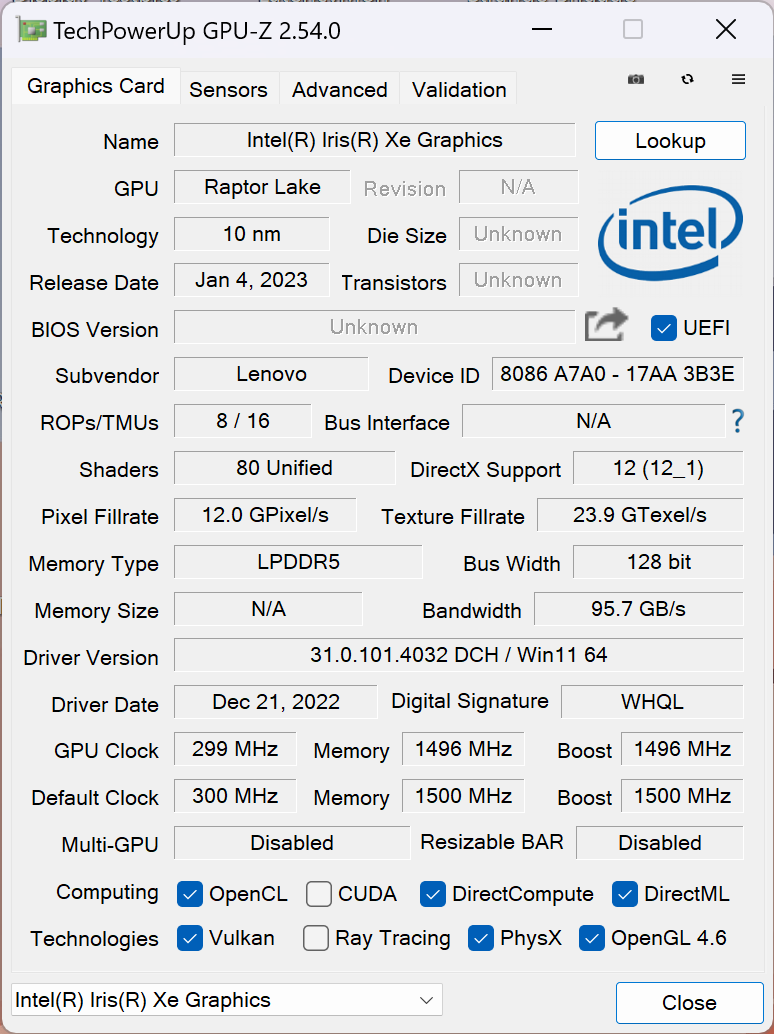
Processorns integreradeIris Xe-grafik G7hanterar grafikbearbetning för enkla uppgifter, och den dedikerade GeForce GPU tar bara över vid mer krävande uppgifter (t.ex. spel). I motsats till Yoga Pro 9i 14gör Lenovo utan Advanced Optimus här och det finns ingen MUX-omkopplare för att kringgå iGPU helt. Detta är inte ovanligt för en multimedia-laptop, men vi är förvånade över skillnaden jämfört med dess mindre syskon, som är bättre utrustat i detta avseende.
Vår testenhet är utrustad medGeForce RTX 4060vilket är 100-wattsversionen. Teoretiskt sett finns det mycket snabbare modeller, men du måste vara försiktig här eftersom 4060 enligt vårt test ändå bara förbrukar högst ~ 105 watt under spel. Endast i syntetiska tester som Furmark är förbrukningen högre. Därför ger en RTX 4060 med en 140-watts TGP inte riktigt några fördelar jämfört med 100-wattsversionen i Yoga Pro 9i när du spelar, till exempel, och inte heller den valfria RTX 4070.
Sammantaget är resultaten mycket bra och Yoga ligger också strax före de genomsnittliga resultaten för RTX 4060 i vår databas. GPU: n kan till och med överklockas i Vantage-appen. De som väljer Yoga med RTX 4070 kan förvänta sig en prestandaökning på cirka 15-20%. Under ihållande belastning förblir GPU-prestandan stabil. När den är urkopplad (max. 68-watts TGP) är prestandan cirka 18% lägre. Fler GPU-riktmärken listas här.
| Geekbench 6.7 - GPU OpenCL | |
| Genomsnitt NVIDIA GeForce RTX 4060 Laptop GPU (76525 - 100831, n=39) | |
| Lenovo Yoga Pro 9 16-IRP G8 | |
| Genomsnitt av klass Multimedia (9994 - 187922, n=65, senaste 2 åren) | |
| 3DMark 11 Performance | 30821 poäng | |
| 3DMark Fire Strike Score | 23225 poäng | |
| 3DMark Time Spy Score | 10393 poäng | |
Hjälp | ||
| Blender / v3.3 Classroom OPTIX/RTX | |
| Genomsnitt av klass Multimedia (12 - 105, n=21, senaste 2 åren) | |
| Asus Vivobook Pro 16X K6604JV-MX016W | |
| Lenovo Yoga Pro 9 16-IRP G8 | |
| MSI Stealth 16 Studio A13VG | |
| Schenker VISION 16 Pro (M23) | |
| Genomsnitt NVIDIA GeForce RTX 4060 Laptop GPU (19 - 28, n=53) | |
| Asus ProArt Studiobook 16 OLED H7604 | |
| Lenovo Yoga Pro 9i RTX4070 | |
| Blender / v3.3 Classroom CUDA | |
| Genomsnitt av klass Multimedia (20 - 186, n=21, senaste 2 åren) | |
| Asus Vivobook Pro 16X K6604JV-MX016W | |
| Lenovo Yoga Pro 9 16-IRP G8 | |
| Genomsnitt NVIDIA GeForce RTX 4060 Laptop GPU (39 - 53, n=53) | |
| MSI Stealth 16 Studio A13VG | |
| Asus ProArt Studiobook 16 OLED H7604 | |
| Schenker VISION 16 Pro (M23) | |
| Blender / v3.3 Classroom METAL | |
| Apple MacBook Pro 16 2023 M2 Max | |
| Genomsnitt av klass Multimedia (17.8 - 68, n=5, senaste 2 åren) | |
| Blender / v3.3 Classroom CPU | |
| Genomsnitt av klass Multimedia (134.5 - 1042, n=61, senaste 2 åren) | |
| Schenker VISION 16 Pro (M23) | |
| Apple MacBook Pro 16 2023 M2 Max | |
| Genomsnitt NVIDIA GeForce RTX 4060 Laptop GPU (189 - 452, n=53) | |
| Lenovo Yoga Pro 9 16-IRP G8 | |
| Lenovo Yoga Pro 9i RTX4070 | |
| MSI Stealth 16 Studio A13VG | |
| Asus Vivobook Pro 16X K6604JV-MX016W | |
| Asus ProArt Studiobook 16 OLED H7604 | |
* ... mindre är bättre
Spelprestanda
Spelprestandan är ganska mycket i linje med våra förväntningar, så Yoga Pro 9i 16 kan köra moderna titlar mycket bra och du kan vanligtvis välja QHD-upplösningen med maximala detaljer. Endast mycket krävande titlar som Star Wars Jedi Survivor eller F1 2023 (där ray tracing redan är aktivt) får den bärbara datorn att kämpa. Här måste du antingen minska detaljerna eller använda uppsampling (t.ex. DLSS) för att öka bildfrekvensen. Prestandan förblir helt stabil under långa spelsessioner.
| The Witcher 3 - 1920x1080 Ultra Graphics & Postprocessing (HBAO+) | |
| Lenovo Yoga Pro 9i RTX4070 | |
| MSI Stealth 16 Studio A13VG | |
| Asus ProArt Studiobook 16 OLED H7604 | |
| Schenker VISION 16 Pro (M23) | |
| Asus Vivobook Pro 16X K6604JV-MX016W | |
| Lenovo Yoga Pro 9 16-IRP G8 | |
| Genomsnitt av klass Multimedia (11 - 107, n=5, senaste 2 åren) | |
| F1 23 | |
| 1920x1080 Ultra High Preset AA:T AF:16x | |
| MSI Stealth 16 Studio A13VG | |
| Genomsnitt NVIDIA GeForce RTX 4060 Laptop GPU (43.8 - 119.9, n=13) | |
| Lenovo Yoga Pro 9 16-IRP G8 | |
| Asus Vivobook Pro 16X K6604JV-MX016W | |
| Genomsnitt av klass Multimedia (11 - 12.6, n=2, senaste 2 åren) | |
| 2560x1440 Ultra High Preset AA:T AF:16x | |
| MSI Stealth 16 Studio A13VG | |
| Genomsnitt NVIDIA GeForce RTX 4060 Laptop GPU (29 - 39.4, n=10) | |
| Lenovo Yoga Pro 9 16-IRP G8 | |
| Asus Vivobook Pro 16X K6604JV-MX016W | |
Witcher 3 FPS chart
| låg | med. | hög | ultra | QHD | |
|---|---|---|---|---|---|
| GTA V (2015) | 175.9 | 169.4 | 107.4 | 84.1 | |
| The Witcher 3 (2015) | 203 | 90.8 | |||
| Dota 2 Reborn (2015) | 170.8 | 156.4 | 148.5 | 142.3 | |
| Final Fantasy XV Benchmark (2018) | 186 | 134.6 | 95.7 | 70.6 | |
| X-Plane 11.11 (2018) | 145.9 | 127.4 | 98.3 | ||
| Far Cry 5 (2018) | 166 | 146 | 136 | 127 | 97 |
| Strange Brigade (2018) | 265 | 214 | 184.1 | 123.7 | |
| F1 2021 (2021) | 274 | 221 | 123.2 | 92.4 | |
| Cyberpunk 2077 1.6 (2022) | 114 | 94 | 82 | 75 | 54 |
| F1 22 (2022) | 220 | 218 | 160 | 62.7 | 40 |
| Star Wars Jedi Survivor (2023) | 75 | 68 | 62 | 60 | 38 |
| F1 23 (2023) | 227 | 225 | 172.7 | 54.1 | 34.2 |
Utsläpp - utmärkta högtalare i Yoga Pro 9i 16
Buller
Volymen på de två fläktarna beror till stor del på det valda prestandaläget. Vi rekommenderar alltid att du använder batterisparläget för vardagliga uppgifter, eftersom fläktarna vanligtvis är inaktiverade här. Fläktarna startar mycket snabbt, särskilt i högprestandaläget, vilket kan vara irriterande vid daglig användning. Det blir också snabbt högljutt under belastning och vi uppmätte mellan 44,5 dB(A) (Smart Cooling) och 53,2 dB(A) (High Performance) under spel, vilket är mycket tydligt hörbart. I båda lägena är hörlurar verkligen att föredra, även om andra Windows-konkurrenter inte är bättre här heller. Fläktarna pulserar åtminstone inte i onödan och inga andra elektroniska ljud upptäcktes.
| Scenario | Batteri | Smart kylning | Hög prestanda |
|---|---|---|---|
| 3DMark 06 | 31,4 dB(A) | 35,4 dB(A) | 39,7 dB(A) |
| Witcher 3 | 31.4dB(A) | 44,5dB(A) | 53,2dB(A) |
| Stresstest | 31,4 dB(A) | 35,4 dB(A) | 53,2 dB(A) |
Ljudnivå
| Låg belastning |
| 24.7 / 26.2 / 26.2 dB(A) |
| Hög belastning |
| 39.7 / 53.2 dB(A) |
 | ||
30 dB tyst 40 dB(A) hörbar 50 dB(A) högt ljud |
||
min: | ||
| Lenovo Yoga Pro 9 16-IRP G8 GeForce RTX 4060 Laptop GPU, i7-13705H, Samsung PM9A1 MZVL21T0HCLR | Schenker VISION 16 Pro (M23) GeForce RTX 4070 Laptop GPU, i7-13700H, Samsung 990 Pro 1 TB | Asus Vivobook Pro 16X K6604JV-MX016W GeForce RTX 4060 Laptop GPU, i9-13980HX, Solidigm P41 Plus SSDPFKNU010TZ | Asus ProArt Studiobook 16 OLED H7604 GeForce RTX 4070 Laptop GPU, i9-13980HX, Phison EM2804TBMTCB47 | MSI Stealth 16 Studio A13VG GeForce RTX 4070 Laptop GPU, i7-13700H, Micron 3400 2TB MTFDKBA2T0TFH | Apple MacBook Pro 16 2023 M2 Max M2 Max 38-Core GPU, M2 Max, Apple SSD AP2048Z | |
|---|---|---|---|---|---|---|
| Noise | -7% | -11% | -3% | 8% | 12% | |
| av / miljö * (dB) | 24.7 | 25.9 -5% | 25.2 -2% | 24.5 1% | 24 3% | 23.9 3% |
| Idle Minimum * (dB) | 24.7 | 25.9 -5% | 26.6 -8% | 24.5 1% | 24 3% | 23.9 3% |
| Idle Average * (dB) | 26.2 | 25.9 1% | 26.6 -2% | 24.5 6% | 24 8% | 23.9 9% |
| Idle Maximum * (dB) | 26.2 | 32 -22% | 29.2 -11% | 24.5 6% | 24 8% | 23.9 9% |
| Load Average * (dB) | 39.7 | 47.2 -19% | 53.4 -35% | 47.6 -20% | 34.81 12% | 36.6 8% |
| Witcher 3 ultra * (dB) | 53.2 | 53.1 -0% | 55.9 -5% | 44.05 17% | 35.1 34% | |
| Load Maximum * (dB) | 53.2 | 53.1 -0% | 56.9 -7% | 56.7 -7% | 51.57 3% | 43.2 19% |
* ... mindre är bättre
Temperatur
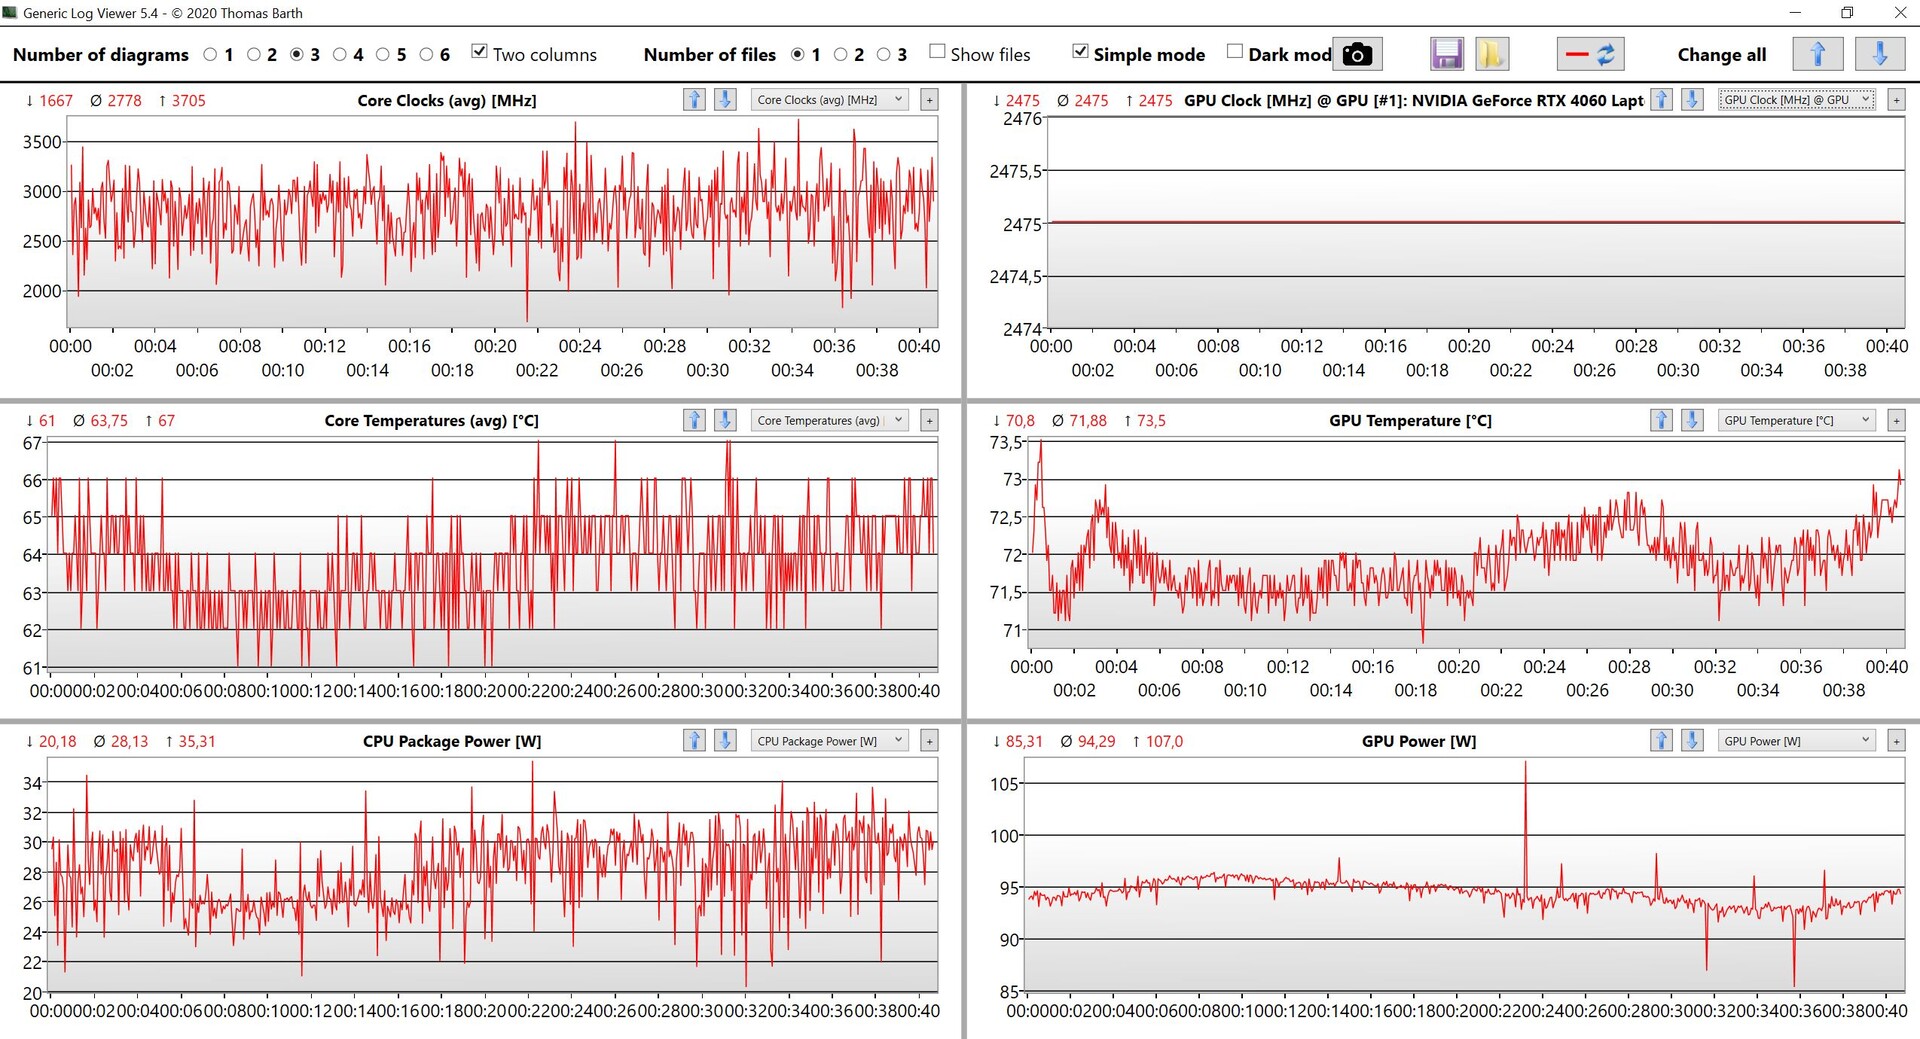
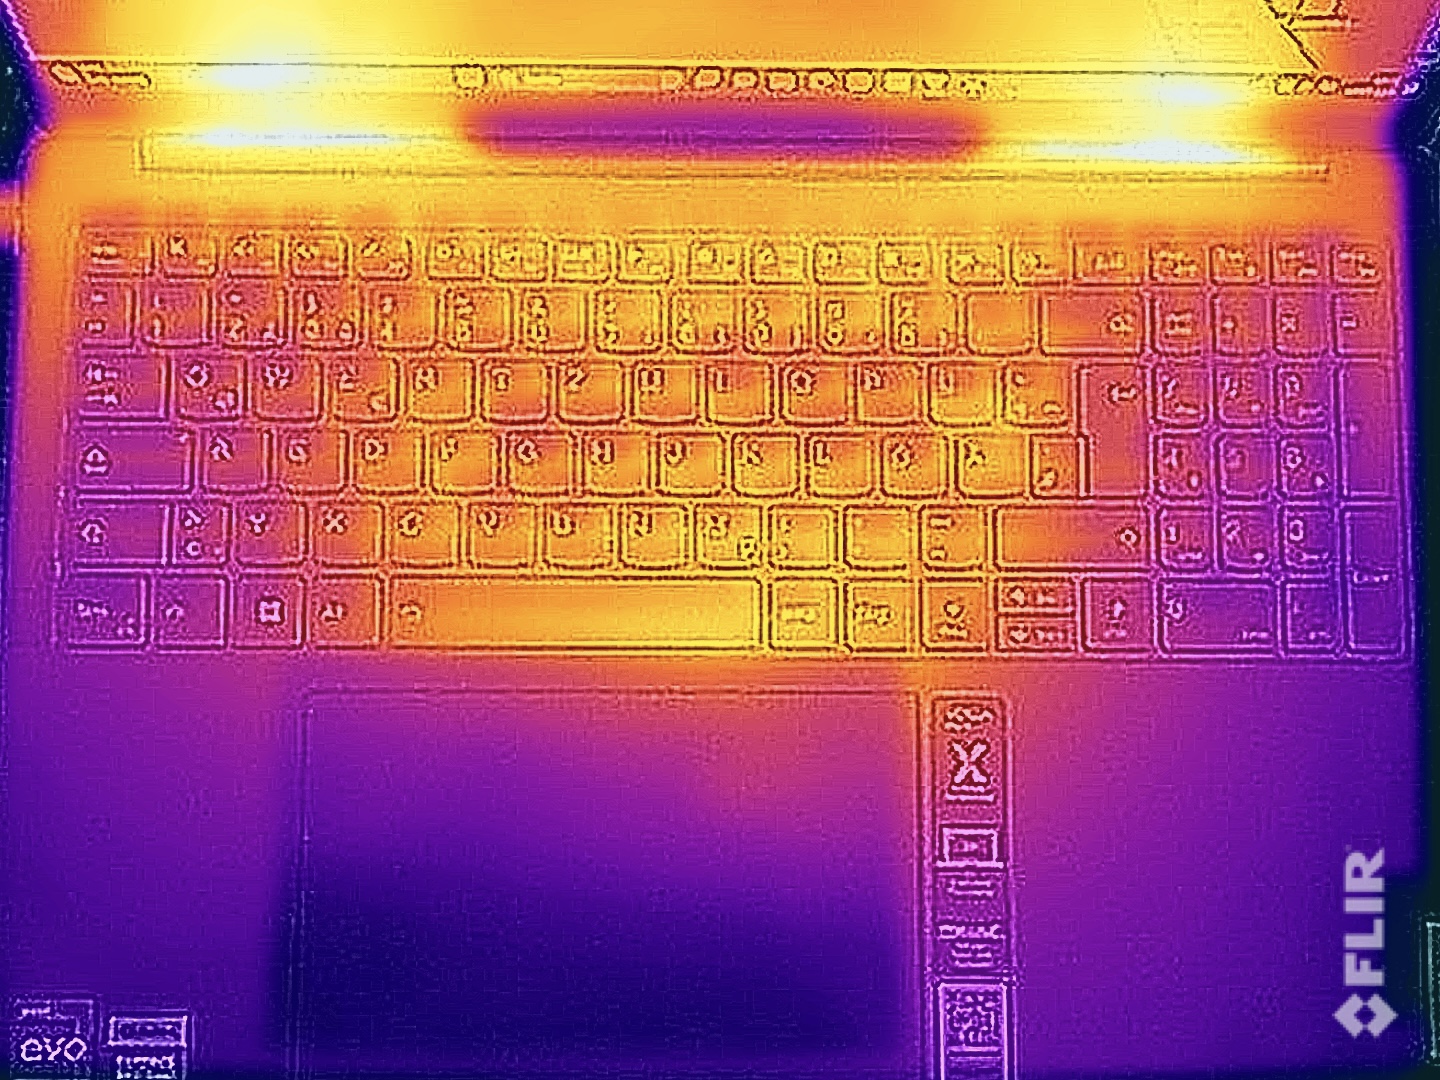
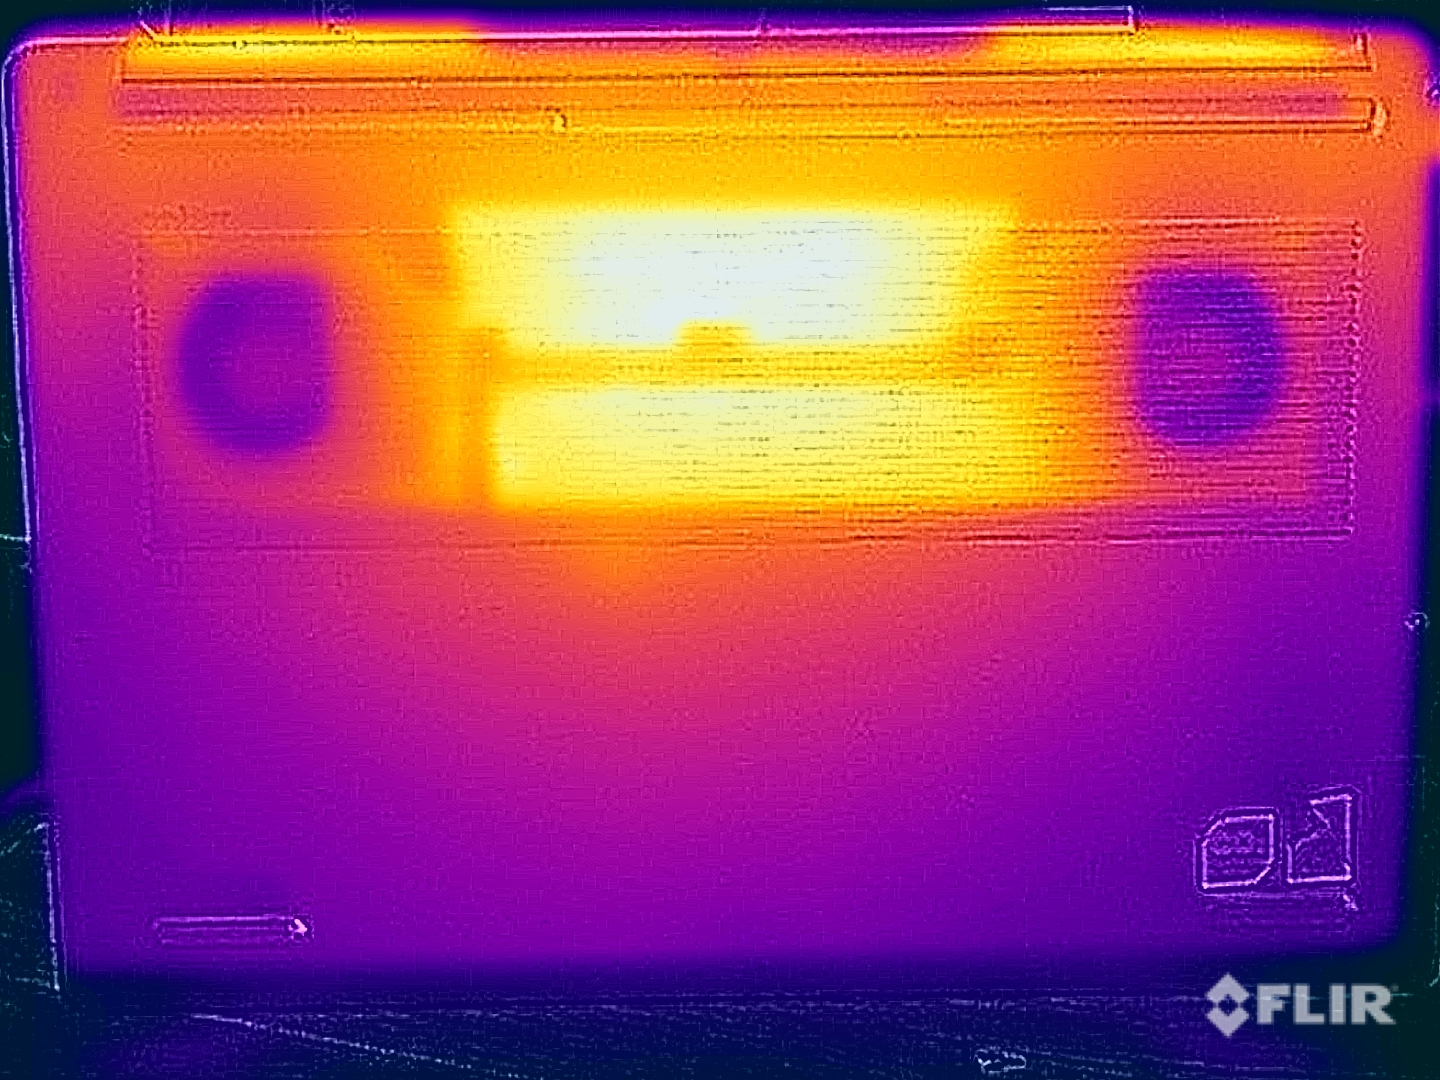
Det finns inga problem alls med yttemperaturer vid daglig användning, men du bör inte placera enheten i ditt knä under belastning eller när du spelar spel. Vi uppmätte upp till 50 °C på undersidan, vilket kan vara obehagligt om det kommer i kontakt med huden. Resultaten är dock inte på något sätt kritiska och överlag presterar 16-tumsmodellen bättre här än den mindre Yoga Pro 9i 14 och de flesta Windows-konkurrenter. Tangentbordet håller sig även betydligt svalare vid 35-40 °C, så det finns inga begränsningar för användningen här.
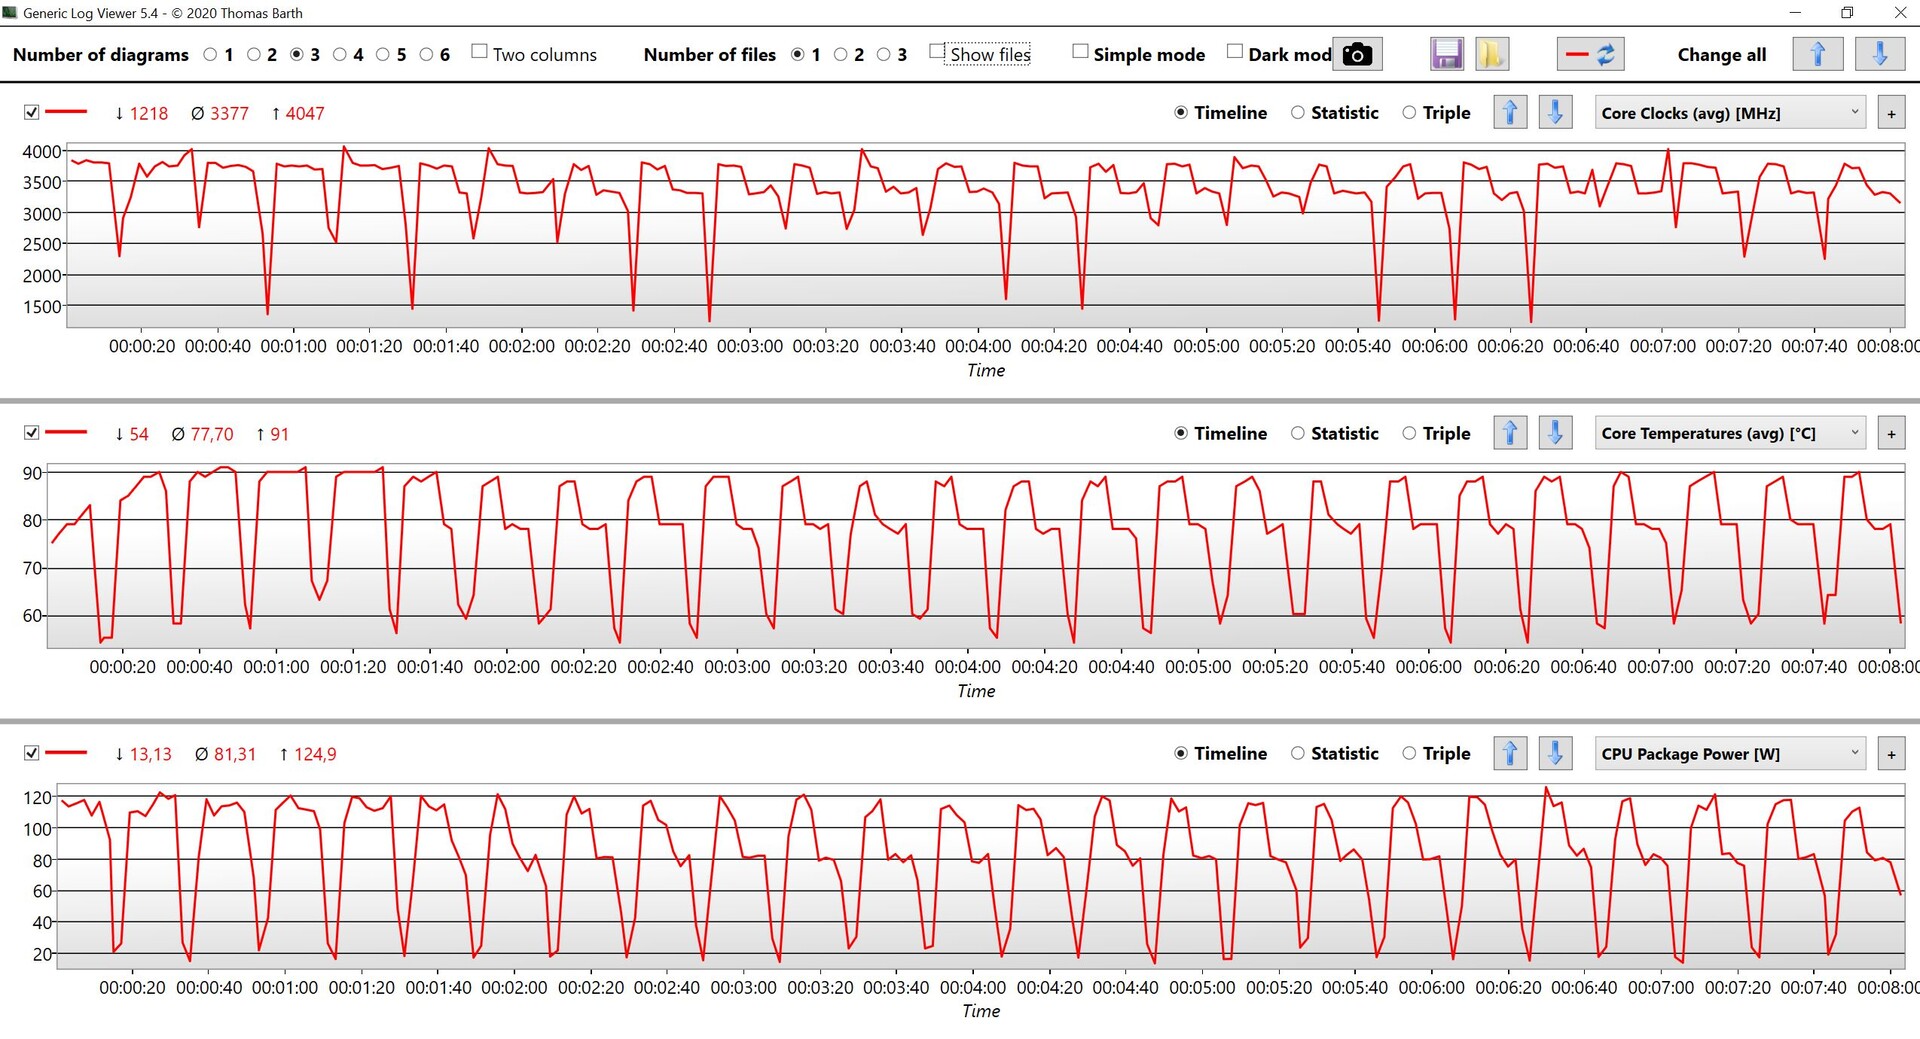
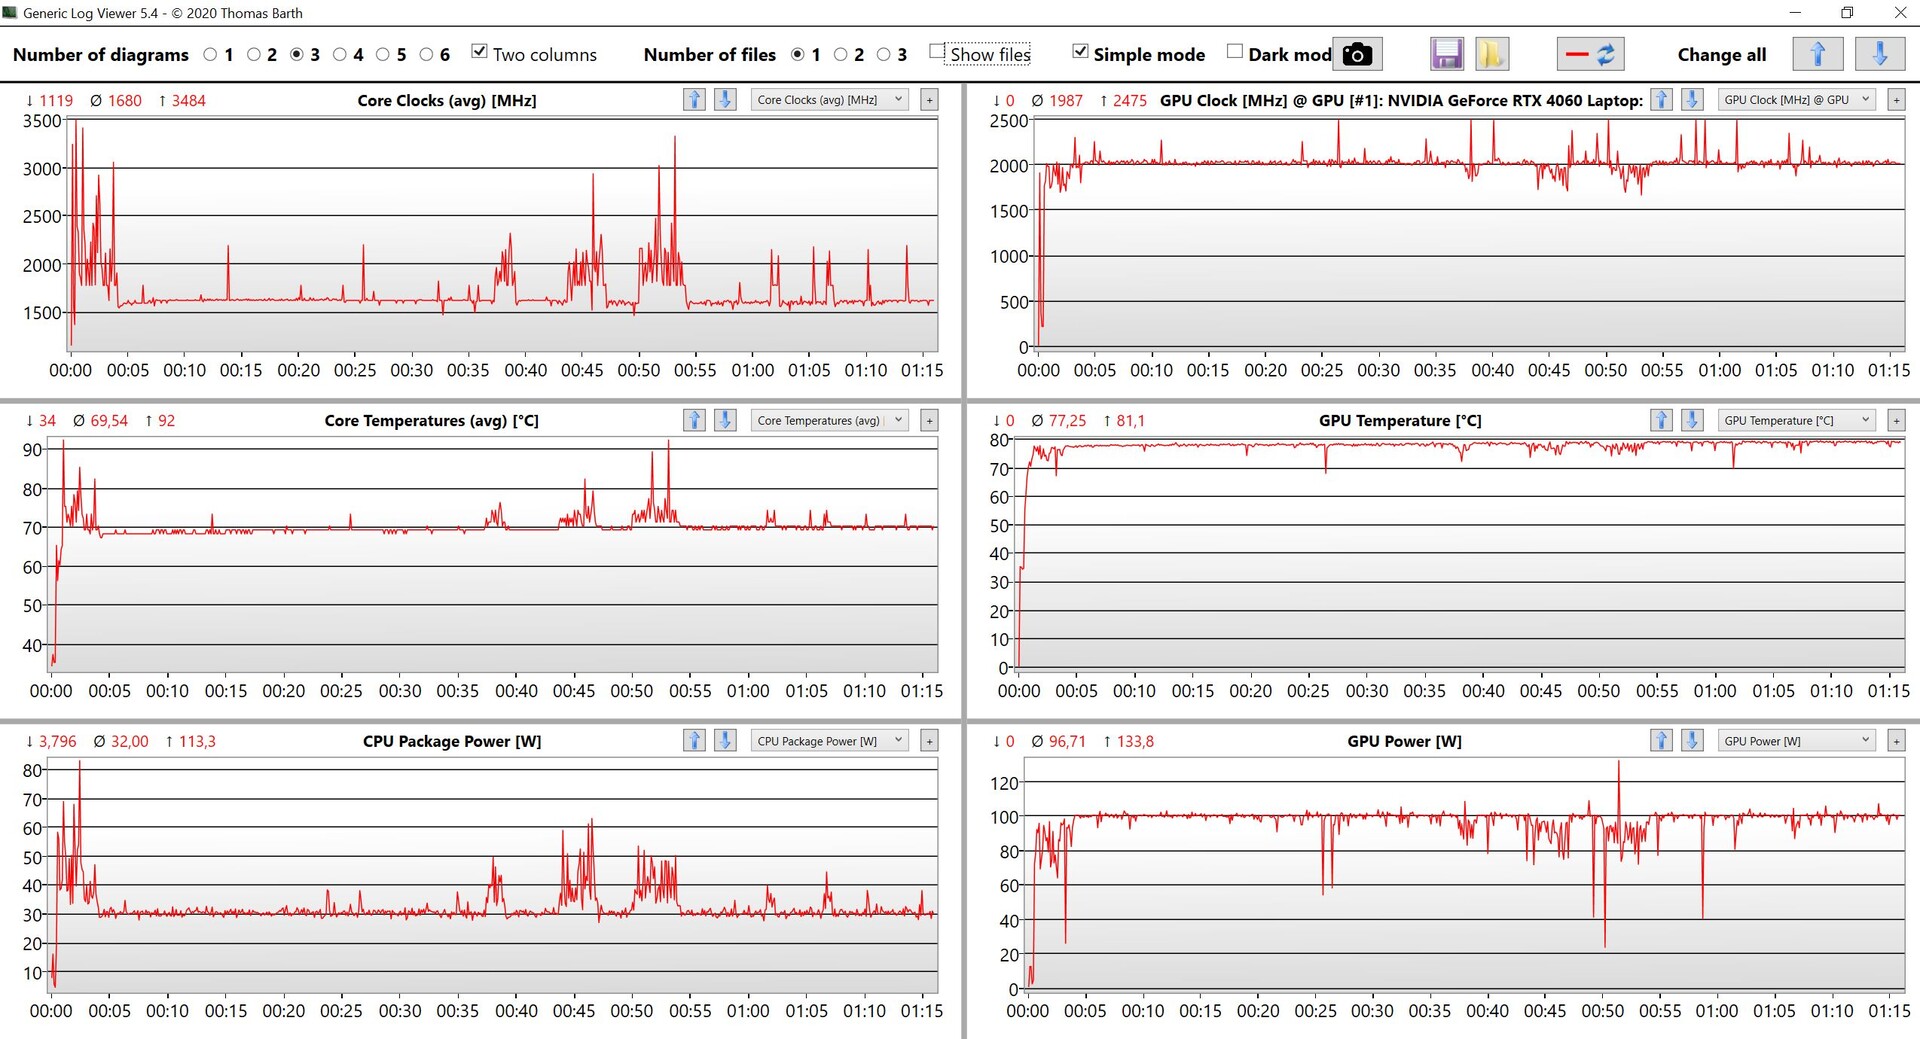
I stresstestet prioriteras GPU:n tydligt av systemet och körs konsekvent på hela 100 watt medan processorn snabbt planar ut på 30 watt.
(±) Den maximala temperaturen på ovansidan är 41.6 °C / 107 F, jämfört med genomsnittet av 36.8 °C / 98 F , allt från 21 till 71 °C för klassen Multimedia.
(-) Botten värms upp till maximalt 50 °C / 122 F, jämfört med genomsnittet av 39.1 °C / 102 F
(+) Vid tomgångsbruk är medeltemperaturen för ovansidan 26.4 °C / 80 F, jämfört med enhetsgenomsnittet på 31.3 °C / ### class_avg_f### F.
(±) När du spelar The Witcher 3 är medeltemperaturen för ovansidan 35.6 °C / 96 F, jämfört med enhetsgenomsnittet på 31.3 °C / ## #class_avg_f### F.
(+) Handledsstöden och pekplattan når maximal hudtemperatur (34.9 °C / 94.8 F) och är därför inte varma.
(-) Medeltemperaturen för handledsstödsområdet på liknande enheter var 28.7 °C / 83.7 F (-6.2 °C / -11.1 F).
| Lenovo Yoga Pro 9 16-IRP G8 Intel Core i7-13705H, NVIDIA GeForce RTX 4060 Laptop GPU | Schenker VISION 16 Pro (M23) Intel Core i7-13700H, NVIDIA GeForce RTX 4070 Laptop GPU | Asus Vivobook Pro 16X K6604JV-MX016W Intel Core i9-13980HX, NVIDIA GeForce RTX 4060 Laptop GPU | Asus ProArt Studiobook 16 OLED H7604 Intel Core i9-13980HX, NVIDIA GeForce RTX 4070 Laptop GPU | MSI Stealth 16 Studio A13VG Intel Core i7-13700H, NVIDIA GeForce RTX 4070 Laptop GPU | Apple MacBook Pro 16 2023 M2 Max Apple M2 Max, Apple M2 Max 38-Core GPU | |
|---|---|---|---|---|---|---|
| Heat | -4% | -14% | -12% | -36% | 11% | |
| Maximum Upper Side * (°C) | 41.6 | 46.7 -12% | 39.7 5% | 44.1 -6% | 60 -44% | 44.2 -6% |
| Maximum Bottom * (°C) | 50 | 54.1 -8% | 60 -20% | 48 4% | 61 -22% | 42.9 14% |
| Idle Upper Side * (°C) | 26.8 | 26.5 1% | 30.9 -15% | 32.7 -22% | 38.2 -43% | 22.4 16% |
| Idle Bottom * (°C) | 27.9 | 26.8 4% | 34.7 -24% | 34.9 -25% | 37.7 -35% | 22.3 20% |
* ... mindre är bättre
Högtalare
16-tumsvarianten av Yoga Pro 9i är utrustad med sex högtalare (4 woofers + 2 tweeters, 6 watt vardera) och kan förbättra 14-tumsmodellens redan solida prestanda, även om den maximala volymen är lite lägre. Ljudet är överlag mycket bra och gapet tillApple MacBook Pro 16(också 6 högtalare) är inte heller stor. Sammantaget gör högtalarna sitt jobb mycket bra.
Lenovo Yoga Pro 9 16-IRP G8 ljudanalys
(±) | högtalarljudstyrkan är genomsnittlig men bra (80.5 dB)
Bas 100 - 315 Hz
(+) | bra bas - bara 4.9% från medianen
(±) | linjäriteten för basen är genomsnittlig (9.1% delta till föregående frekvens)
Mellan 400 - 2000 Hz
(+) | balanserad mellan - endast 3.2% från medianen
(+) | mids är linjära (6.5% delta till föregående frekvens)
Högsta 2 - 16 kHz
(+) | balanserade toppar - endast 2.9% från medianen
(+) | toppar är linjära (3% delta till föregående frekvens)
Totalt 100 - 16 000 Hz
(+) | det totala ljudet är linjärt (8.4% skillnad mot median)
Jämfört med samma klass
» 9% av alla testade enheter i den här klassen var bättre, 2% liknande, 89% sämre
» Den bästa hade ett delta på 5%, genomsnittet var 17%, sämst var 45%
Jämfört med alla testade enheter
» 2% av alla testade enheter var bättre, 1% liknande, 97% sämre
» Den bästa hade ett delta på 4%, genomsnittet var 23%, sämst var 134%
Apple MacBook Pro 16 2023 M2 Max ljudanalys
(+) | högtalare kan spela relativt högt (86.1 dB)
Bas 100 - 315 Hz
(+) | bra bas - bara 3.9% från medianen
(+) | basen är linjär (5.7% delta till föregående frekvens)
Mellan 400 - 2000 Hz
(+) | balanserad mellan - endast 1.2% från medianen
(+) | mids är linjära (1.5% delta till föregående frekvens)
Högsta 2 - 16 kHz
(+) | balanserade toppar - endast 2.5% från medianen
(+) | toppar är linjära (1.7% delta till föregående frekvens)
Totalt 100 - 16 000 Hz
(+) | det totala ljudet är linjärt (4.9% skillnad mot median)
Jämfört med samma klass
» 0% av alla testade enheter i den här klassen var bättre, 0% liknande, 99% sämre
» Den bästa hade ett delta på 5%, genomsnittet var 17%, sämst var 45%
Jämfört med alla testade enheter
» 0% av alla testade enheter var bättre, 0% liknande, 100% sämre
» Den bästa hade ett delta på 4%, genomsnittet var 23%, sämst var 134%
Energihantering - Kort batteritid
Strömförbrukning
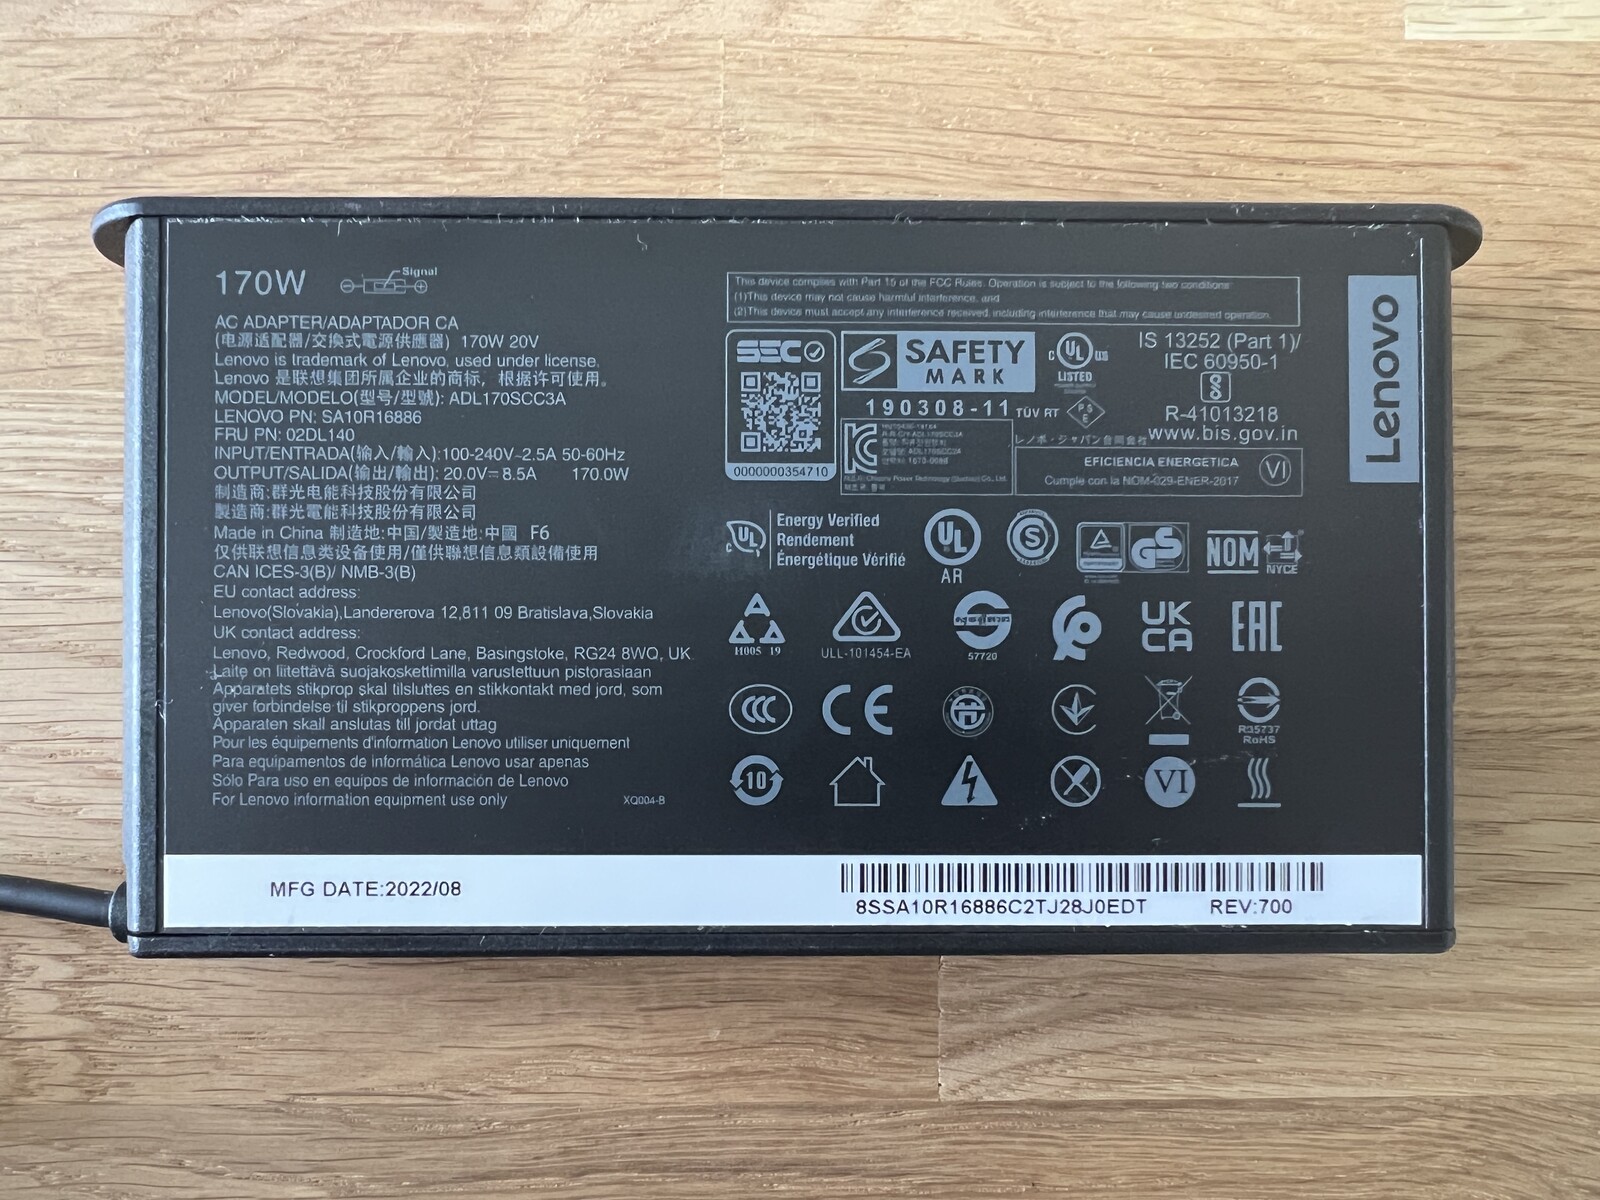
Den stora 16-tumsskärmen är till stor del ansvarig för strömförbrukningen vid daglig användning och vi uppmätte upp till 24 watt i viloläge vid maximal SDR-ljusstyrka. Som jämförelse förbrukar den mindre 14-tumsmodellen 20 watt trots högre ljusstyrka. I HDR-läge är upp till 40 watt möjligt. Under belastning ser vi kortvarigt cirka 177 watt, men detta sätter sig snabbt på cirka 170 watt (~ 160-170 watt under spel). Så 170 watt nätadapter är precis tillräckligt, men det finns inget utrymme för att ladda batteriet i sådana situationer. En modell med 200 eller 230 watt skulle ha varit ett bättre val här.
| Av/Standby | |
| Låg belastning | |
| Hög belastning |
|
Förklaring:
min: | |
| Lenovo Yoga Pro 9 16-IRP G8 i7-13705H, GeForce RTX 4060 Laptop GPU, Samsung PM9A1 MZVL21T0HCLR, Mini-LED, 3200x2000, 16" | Schenker VISION 16 Pro (M23) i7-13700H, GeForce RTX 4070 Laptop GPU, Samsung 990 Pro 1 TB, IPS, 2560x1600, 16" | Asus Vivobook Pro 16X K6604JV-MX016W i9-13980HX, GeForce RTX 4060 Laptop GPU, Solidigm P41 Plus SSDPFKNU010TZ, OLED, 3200x2000, 16" | Asus ProArt Studiobook 16 OLED H7604 i9-13980HX, GeForce RTX 4070 Laptop GPU, Phison EM2804TBMTCB47, OLED, 3200x2000, 16" | MSI Stealth 16 Studio A13VG i7-13700H, GeForce RTX 4070 Laptop GPU, Micron 3400 2TB MTFDKBA2T0TFH, IPS, 2560x1600, 16" | Apple MacBook Pro 16 2023 M2 Max M2 Max, M2 Max 38-Core GPU, Apple SSD AP2048Z, Mini-LED, 3456x2234, 16.2" | Genomsnitt NVIDIA GeForce RTX 4060 Laptop GPU | Genomsnitt av klass Multimedia | |
|---|---|---|---|---|---|---|---|---|
| Power Consumption | 22% | -14% | -18% | 3% | 22% | 2% | 42% | |
| Idle Minimum * (Watt) | 10.9 | 8.6 21% | 13.8 -27% | 12.8 -17% | 11 -1% | 5.2 52% | 11.5 ? -6% | 5.62 ? 48% |
| Idle Average * (Watt) | 22.6 | 12 47% | 16 29% | 19.9 12% | 18 20% | 16.5 27% | 16 ? 29% | 10.2 ? 55% |
| Idle Maximum * (Watt) | 23.5 | 12.4 47% | 19 19% | 20.3 14% | 19 19% | 16.8 29% | 20.3 ? 14% | 12.5 ? 47% |
| Load Average * (Watt) | 84.6 | 80 5% | 147 -74% | 131.4 -55% | 91 -8% | 113 -34% | 92.9 ? -10% | 65 ? 23% |
| Witcher 3 ultra * (Watt) | 159.5 | 147.7 7% | 147.8 7% | 196.5 -23% | 130 18% | 92 42% | ||
| Load Maximum * (Watt) | 177.3 | 173.1 2% | 244 -38% | 246.8 -39% | 228 -29% | 145 18% | 210 ? -18% | 111.9 ? 37% |
* ... mindre är bättre
Power consumption Witcher 3 / Stress test
Power consumption with an external monitor
Batteritid
Lenovo utrustar också Yoga Pro 9i 16 med ett 75 Wh batteri. Med tanke på de högre förbrukningshastigheterna kan man förlåtas för att man redan antar att batteritiden kommer att bli ännu sämre än i 14-tums modellen. Vid 150 cd/m² (motsvarande 50% av maximal SDR-ljusstyrka) och 60 Hz är resultaten fortfarande okej med 6,5 timmar i WLAN-testet (165 Hz: ~5,5 timmar) och 7,5 timmar i videotestet. Men så snart du använder hög ljusstyrka och/eller den högre frekvensen på 165 Hz, blir det problematiskt. Vid full SDR-ljusstyrka varar vårt Wi-Fi-test bara lite över 3,5 timmar vid 60 Hz och 15 minuter mindre vid 165 Hz. En HDR-video med full ljusstyrka tömmer batteriet helt på bara 133 minuter.
Med tanke på dessa resultat borde Lenovo ha installerat ett större batteri istället för den andra M.2-platsen eller åtminstone gett kunden valet. Laddningsprocessen är mycket linjär upp till 80% och tar 48 minuter att komma dit. Den fullständiga laddningsprocessen tar 87 minuter när enheten är påslagen.
| Lenovo Yoga Pro 9 16-IRP G8 i7-13705H, GeForce RTX 4060 Laptop GPU, 75 Wh | Schenker VISION 16 Pro (M23) i7-13700H, GeForce RTX 4070 Laptop GPU, 80 Wh | Asus Vivobook Pro 16X K6604JV-MX016W i9-13980HX, GeForce RTX 4060 Laptop GPU, 90 Wh | Asus ProArt Studiobook 16 OLED H7604 i9-13980HX, GeForce RTX 4070 Laptop GPU, 90 Wh | MSI Stealth 16 Studio A13VG i7-13700H, GeForce RTX 4070 Laptop GPU, 99.9 Wh | Apple MacBook Pro 16 2023 M2 Max M2 Max, M2 Max 38-Core GPU, 99.6 Wh | Genomsnitt av klass Multimedia | |
|---|---|---|---|---|---|---|---|
| Batteridrifttid | 37% | 29% | 8% | 89% | 112% | 117% | |
| H.264 (h) | 7.5 | 7.8 4% | 5.3 -29% | 6 -20% | 7.7 3% | 18.7 149% | 16.8 ? 124% |
| WiFi v1.3 (h) | 6.4 | 7.8 22% | 6.5 2% | 5.6 -13% | 7.8 22% | 14.8 131% | 12.3 ? 92% |
| Load (h) | 0.7 | 1.3 86% | 1.5 114% | 1.1 57% | 2.4 243% | 1.1 57% | 1.645 ? 135% |
För
Emot
Bedömning - Yoga Pro 9i kämpar främst med batteritiden

Yoga Pro 9i 16 är tänkt att vara Lenovos mest kraftfulla och bästa multimedia-notebook. Jämfört med den mindre Yoga Pro 9i 14har man dock intrycket att tillverkaren har gjort nedskärningar på flera områden på 16-tumsmodellen. Men först och främst är prestandan överlag mycket bra och båda huvudkomponenterna, nämligen CPU och GPU, är snabbare än i 14-tumsmodellen. Så vi undrar varför Yoga Pro 9i 16 inte erbjuder Advanced Optimus och varför HDMI-porten endast stöder 1.4b-standarden. Följaktligen kan 4K-skärmar bara köras vid 30 Hz, vilket inte överensstämmer med den nuvarande tekniknivån och inte matchar det höga priset. Beslutet att göra RAM lödd är också problematiskt. När det gäller fodralet är en annan sak som stör oss den knarrande basplattan.
Den glansiga mini-LED-panelen ser fantastisk ut, särskilt med HDR-innehåll, och erbjuder också korrekt färgåtergivning utöver fullständig AdobeRGB-täckning. Tyvärr är mätningarna sämre här än i 14-tumsmodellen; tillverkaren verkar ha lagt ner mindre arbete här, eftersom den stora 16-tumsmodellen flimrar vid alla ljusstyrkenivåer. Den stora skärmen har också höga energiförbrukningshastigheter, så vi kan inte förstå varför Lenovo inte har installerat ett större batteri.
Lenovo Yoga Pro 9i 16, på sina egna villkor, är en mycket bra multimedia-notebook med en fantastisk mini-LED-panel, hög prestanda, bra tangentbord och fantastiska högtalare. Lenovo har dock skurit ner på flera områden och det finns vissa nackdelar jämfört med den mindre 14-tums modellen, vilket är obegripligt.
Naturligtvis finns det massor av positiva aspekter. Vi har redan nämnt de solida prestandavärdena tillsammans med det bra tangentbordet, numpad och utmärkta högtalare. Om man bortser från den knarrande baspanelen är höljet mycket bra och byggkvaliteten mycket stabil. Slutligen erbjuder 16-tumsmodellen också en andra SSD-kortplats.
Batteritiden är överlag mycket dålig och definitivt en svaghet. Den här Apple MacBook Pro 16 har alltså en enorm fördel här trots sin utmärkta och ljusstarka mini-LED-panel. Windows-utrustade rivaler med OLED-skärmar som t.ex Asus Vivobook Pro 16X eller Asus Studiobook 16 OLED klarar sig inte bättre här och ligger klart efter när det gäller skärmens ljusstyrka. IPS-rivaler Schenker Vision 16 Pro och MSI Stealth 16 Studio har fördelar som matta skärmar och inget PWN-flimmer, men stöder inte HDR.
Pris och tillgänglighet
I Lenovos amerikanska butik är en variant med Core i9-13905H, RTX 4060 och 32 GB RAM för närvarande tillgänglig för 2 199,99 USD.
Priserna gäller från 02.08.2023 och kan komma att ändras.
Lenovo Yoga Pro 9 16-IRP G8
- 07/31/2023 v7 (old)
Andreas Osthoff
Genomskinlighet
Valet av enheter som ska granskas görs av vår redaktion. Testprovet gavs till författaren som ett lån av tillverkaren eller återförsäljaren för denna recension. Långivaren hade inget inflytande på denna recension och inte heller fick tillverkaren en kopia av denna recension innan publiceringen. Det fanns ingen skyldighet att publicera denna recension. Som ett oberoende medieföretag är Notebookcheck inte föremål för auktoritet från tillverkare, återförsäljare eller förlag.
This is how Notebookcheck is testingEvery year, Notebookcheck independently reviews hundreds of laptops and smartphones using standardized procedures to ensure that all results are comparable. We have continuously developed our test methods for around 20 years and set industry standards in the process. In our test labs, high-quality measuring equipment is utilized by experienced technicians and editors. These tests involve a multi-stage validation process. Our complex rating system is based on hundreds of well-founded measurements and benchmarks, which maintains objectivity.
Price comparison

