Test: Lenovo IdeaPad 5 Pro 16ACH - Ryzen 5000-laptop med stor 120 Hz LCD (Sammanfattning)
Testgrupp
Gradering | Datum | Modell | Vikt | Höjd | Storlek | Upplösning | Pris |
|---|---|---|---|---|---|---|---|
| 86.1 % v7 (old) | 09/2021 | Lenovo IdeaPad 5 Pro 16ACH R7 5800H, GeForce GTX 1650 Mobile | 2 kg | 17.5 mm | 16.00" | 2560x1600 | |
| 81.2 % v7 (old) | 07/2021 | HP Pavilion 15-eg i7-1165G7, GeForce MX450 | 1.7 kg | 17.9 mm | 15.60" | 1920x1080 | |
| 83.2 % v7 (old) | Xiaomi RedmiBook Pro 15 i7-11370H, GeForce MX450 | 1.7 kg | 16 mm | 15.60" | 3200x2000 | ||
| 84.5 % v7 (old) | 09/2020 | Honor MagicBook Pro (AMD) R5 4600H, Vega 6 | 1.7 kg | 16.9 mm | 16.10" | 1920x1080 | |
| 83.4 % v7 (old) | 01/2021 | Asus VivoBook S15 S533EQ-BQ002T i7-1165G7, GeForce MX350 | 1.8 kg | 16.1 mm | 15.60" | 1920x1080 |
| SD Card Reader | |
| average JPG Copy Test (av. of 3 runs) | |
| Genomsnitt av klass Multimedia (23 - 531, n=36, senaste 2 åren) | |
| Lenovo IdeaPad 5 Pro 16ACH (AV PRO V60) | |
| HP Pavilion 15-eg (AV PRO microSD 128 GB V60) | |
| Asus VivoBook S15 S533EQ-BQ002T (Toshiba Exceria Pro M501 microSDXC 64GB) | |
| maximum AS SSD Seq Read Test (1GB) | |
| Genomsnitt av klass Multimedia (37.3 - 1455, n=35, senaste 2 åren) | |
| Lenovo IdeaPad 5 Pro 16ACH (AV PRO V60) | |
| HP Pavilion 15-eg (AV PRO microSD 128 GB V60) | |
| Asus VivoBook S15 S533EQ-BQ002T (Toshiba Exceria Pro M501 microSDXC 64GB) | |
| Networking | |
| iperf3 transmit AX12 | |
| Xiaomi RedmiBook Pro 15 | |
| HP Pavilion 15-eg | |
| Lenovo IdeaPad 5 Pro 16ACH | |
| Genomsnitt RealTek Semiconductor RTL8852AE (424 - 928, n=20) | |
| Asus VivoBook S15 S533EQ-BQ002T | |
| Honor MagicBook Pro (AMD) | |
| iperf3 receive AX12 | |
| HP Pavilion 15-eg | |
| Xiaomi RedmiBook Pro 15 | |
| Asus VivoBook S15 S533EQ-BQ002T | |
| Genomsnitt RealTek Semiconductor RTL8852AE (621 - 877, n=20) | |
| Honor MagicBook Pro (AMD) | |
| Lenovo IdeaPad 5 Pro 16ACH | |


| |||||||||||||||||||||||||
Distribution av ljusstyrkan: 90 %
Mitt på batteriet: 394 cd/m²
Kontrast: 1234:1 (Svärta: 0.32 cd/m²)
ΔE ColorChecker Calman: 2.6 | ∀{0.5-29.43 Ø4.71}
calibrated: 1.1
ΔE Greyscale Calman: 3.4 | ∀{0.09-98 Ø4.96}
73.3% AdobeRGB 1998 (Argyll 3D)
99% sRGB (Argyll 3D)
71% Display P3 (Argyll 3D)
Gamma: 2.12
CCT: 6140 K
| Lenovo IdeaPad 5 Pro 16ACH IPS LED, 2560x1600, 16" | HP Pavilion 15-eg Chi Mei CMN1523, IPS, 1920x1080, 15.6" | Xiaomi RedmiBook Pro 15 IPS, 3200x2000, 15.6" | Honor MagicBook Pro (AMD) N161HCA-EA3, IPS, 1920x1080, 16.1" | Asus VivoBook S15 S533EQ-BQ002T Panda LM156LF-5L04, IPS, 1920x1080, 15.6" | |
|---|---|---|---|---|---|
| Display | -38% | -5% | -13% | -44% | |
| Display P3 Coverage (%) | 71 | 42.9 -40% | 66.7 -6% | 67.5 -5% | 39.01 -45% |
| sRGB Coverage (%) | 99 | 64 -35% | 96.3 -3% | 69.7 -30% | 58.5 -41% |
| AdobeRGB 1998 Coverage (%) | 73.3 | 44.4 -39% | 68.5 -7% | 69.7 -5% | 40.33 -45% |
| Response Times | -104% | -143% | -160% | -170% | |
| Response Time Grey 50% / Grey 80% * (ms) | 16.4 ? | 22.8 ? -39% | 34.8 ? -112% | 37.6 ? -129% | 38 ? -132% |
| Response Time Black / White * (ms) | 8.8 ? | 23.6 ? -168% | 24 ? -173% | 25.6 ? -191% | 27 ? -207% |
| PWM Frequency (Hz) | 24940 ? | 26320 ? | 25250 ? | ||
| Screen | -67% | -47% | 33% | -77% | |
| Brightness middle (cd/m²) | 395 | 294.3 -25% | 312 -21% | 337 -15% | 287 -27% |
| Brightness (cd/m²) | 375 | 251 -33% | 298 -21% | 312 -17% | 261 -30% |
| Brightness Distribution (%) | 90 | 76 -16% | 87 -3% | 89 -1% | 84 -7% |
| Black Level * (cd/m²) | 0.32 | 0.26 19% | 0.18 44% | 0.2 37% | 0.51 -59% |
| Contrast (:1) | 1234 | 1132 -8% | 1733 40% | 1685 37% | 563 -54% |
| Colorchecker dE 2000 * | 2.6 | 4.08 -57% | 5.39 -107% | 0.8 69% | 4.72 -82% |
| Colorchecker dE 2000 max. * | 5.4 | 19.49 -261% | 9.95 -84% | 1.1 80% | 17.94 -232% |
| Colorchecker dE 2000 calibrated * | 1.1 | 3.7 -236% | 3.15 -186% | 0.7 36% | 3.74 -240% |
| Greyscale dE 2000 * | 3.4 | 3 12% | 6.3 -85% | 1 71% | 2.2 35% |
| Gamma | 2.12 104% | 2.21 100% | 2.192 100% | 2.2 100% | 2.51 88% |
| CCT | 6140 106% | 6616 98% | 7473 87% | 6538 99% | 6758 96% |
| Color Space (Percent of AdobeRGB 1998) (%) | 69 | 63.8 | 37 | ||
| Color Space (Percent of sRGB) (%) | 96 | 99.5 | 58 | ||
| Totalt genomsnitt (program/inställningar) | -70% /
-66% | -65% /
-52% | -47% /
-5% | -97% /
-83% |
* ... mindre är bättre
Visa svarstider
| ↔ Svarstid svart till vitt | ||
|---|---|---|
| 8.8 ms ... stiga ↗ och falla ↘ kombinerat | ↗ 4.4 ms stiga | 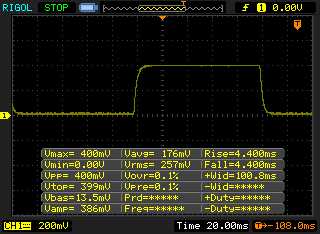 |
| ↘ 4.4 ms hösten | ||
| Skärmen visar snabba svarsfrekvenser i våra tester och bör passa för spel. I jämförelse sträcker sig alla testade enheter från 0.1 (minst) till 240 (maximalt) ms. » 25 % av alla enheter är bättre. Det betyder att den uppmätta svarstiden är bättre än genomsnittet av alla testade enheter (19.8 ms). | ||
| ↔ Svarstid 50 % grått till 80 % grått | ||
| 16.4 ms ... stiga ↗ och falla ↘ kombinerat | ↗ 6.4 ms stiga | 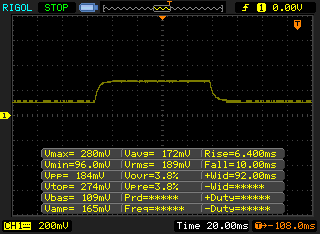 |
| ↘ 10 ms hösten | ||
| Skärmen visar bra svarsfrekvens i våra tester, men kan vara för långsam för konkurrenskraftiga spelare. I jämförelse sträcker sig alla testade enheter från 0.165 (minst) till 636 (maximalt) ms. » 31 % av alla enheter är bättre. Det betyder att den uppmätta svarstiden är bättre än genomsnittet av alla testade enheter (30.9 ms). | ||
Skärmflimmer / PWM (Puls-Width Modulation)
| Skärmflimmer / PWM upptäckt | 24940 Hz | ≤ 50 % ljusstyrka inställning | 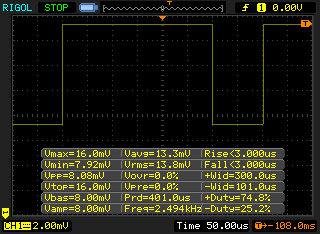 |
Displayens bakgrundsbelysning flimrar vid 24940 Hz (i värsta fall, t.ex. med PWM) Flimrande upptäckt vid en ljusstyrkeinställning på 50 % och lägre. Det ska inte finnas något flimmer eller PWM över denna ljusstyrkeinställning. Frekvensen för 24940 Hz är ganska hög, så de flesta användare som är känsliga för PWM bör inte märka något flimmer. Som jämförelse: 52 % av alla testade enheter använder inte PWM för att dämpa skärmen. Om PWM upptäcktes mättes ett medelvärde av 7741 (minst: 5 - maximum: 343500) Hz. | |||
Cinebench R15 Multi Uthållighetstest
Cinebench R20: CPU (Single Core) | CPU (Multi Core)
Cinebench R15: CPU Single 64Bit | CPU Multi 64Bit
Blender: v2.79 BMW27 CPU
7-Zip 18.03: 7z b 4 -mmt1 | 7z b 4
Geekbench 5.5: Single-Core | Multi-Core
HWBOT x265 Benchmark v2.2: 4k Preset
LibreOffice : 20 Documents To PDF
R Benchmark 2.5: Overall mean
| Cinebench R23 / Single Core | |
| Genomsnitt av klass Multimedia (1128 - 2459, n=64, senaste 2 åren) | |
| Xiaomi RedmiBook Pro 15 | |
| Asus VivoBook S15 S533EQ-BQ002T | |
| HP Pavilion 15-eg | |
| Lenovo IdeaPad 5 Pro 16IHU6 | |
| Genomsnitt AMD Ryzen 7 5800H (1294 - 1441, n=29) | |
| Lenovo IdeaPad 5 Pro 16ACH | |
| Cinebench R23 / Multi Core | |
| Genomsnitt av klass Multimedia (4861 - 33362, n=65, senaste 2 åren) | |
| Genomsnitt AMD Ryzen 7 5800H (8812 - 13214, n=29) | |
| Lenovo IdeaPad 5 Pro 16ACH | |
| Lenovo IdeaPad 5 Pro 16IHU6 | |
| Xiaomi RedmiBook Pro 15 | |
| Xiaomi RedmiBook Pro 15 | |
| Asus VivoBook S15 S533EQ-BQ002T | |
| HP Pavilion 15-eg | |
| Cinebench R20 / CPU (Single Core) | |
| Genomsnitt av klass Multimedia (425 - 853, n=56, senaste 2 åren) | |
| Xiaomi RedmiBook Pro 15 | |
| Asus VivoBook S15 S533EQ-BQ002T | |
| HP Pavilion 15-eg | |
| Genomsnitt AMD Ryzen 7 5800H (502 - 560, n=30) | |
| Lenovo IdeaPad 5 Pro 16IHU6 | |
| Lenovo IdeaPad 5 Pro 16ACH | |
| Honor MagicBook Pro (AMD) | |
| Cinebench R20 / CPU (Multi Core) | |
| Genomsnitt av klass Multimedia (1887 - 12912, n=56, senaste 2 åren) | |
| Lenovo IdeaPad 5 Pro 16ACH | |
| Genomsnitt AMD Ryzen 7 5800H (3430 - 5020, n=31) | |
| Honor MagicBook Pro (AMD) | |
| Lenovo IdeaPad 5 Pro 16IHU6 | |
| Xiaomi RedmiBook Pro 15 | |
| Asus VivoBook S15 S533EQ-BQ002T | |
| HP Pavilion 15-eg | |
| Cinebench R15 / CPU Single 64Bit | |
| Genomsnitt av klass Multimedia (184.8 - 326, n=58, senaste 2 åren) | |
| Xiaomi RedmiBook Pro 15 | |
| Xiaomi RedmiBook Pro 15 | |
| Genomsnitt AMD Ryzen 7 5800H (209 - 234, n=29) | |
| Lenovo IdeaPad 5 Pro 16ACH | |
| HP Pavilion 15-eg | |
| Asus VivoBook S15 S533EQ-BQ002T | |
| Honor MagicBook Pro (AMD) | |
| Lenovo IdeaPad 5 Pro 16IHU6 | |
| Cinebench R15 / CPU Multi 64Bit | |
| Genomsnitt av klass Multimedia (856 - 5224, n=60, senaste 2 åren) | |
| Lenovo IdeaPad 5 Pro 16ACH | |
| Genomsnitt AMD Ryzen 7 5800H (1487 - 2119, n=28) | |
| Honor MagicBook Pro (AMD) | |
| Xiaomi RedmiBook Pro 15 | |
| Xiaomi RedmiBook Pro 15 | |
| Xiaomi RedmiBook Pro 15 | |
| Lenovo IdeaPad 5 Pro 16IHU6 | |
| Asus VivoBook S15 S533EQ-BQ002T | |
| HP Pavilion 15-eg | |
| Blender / v2.79 BMW27 CPU | |
| HP Pavilion 15-eg | |
| Asus VivoBook S15 S533EQ-BQ002T | |
| Lenovo IdeaPad 5 Pro 16IHU6 | |
| Xiaomi RedmiBook Pro 15 | |
| Honor MagicBook Pro (AMD) | |
| Lenovo IdeaPad 5 Pro 16ACH | |
| Genomsnitt AMD Ryzen 7 5800H (237 - 340, n=29) | |
| Genomsnitt av klass Multimedia (100 - 557, n=57, senaste 2 åren) | |
| 7-Zip 18.03 / 7z b 4 -mmt1 | |
| Genomsnitt av klass Multimedia (3666 - 7545, n=55, senaste 2 åren) | |
| Genomsnitt AMD Ryzen 7 5800H (5038 - 5632, n=29) | |
| HP Pavilion 15-eg | |
| Xiaomi RedmiBook Pro 15 | |
| Asus VivoBook S15 S533EQ-BQ002T | |
| Lenovo IdeaPad 5 Pro 16ACH | |
| Lenovo IdeaPad 5 Pro 16IHU6 | |
| Honor MagicBook Pro (AMD) | |
| 7-Zip 18.03 / 7z b 4 | |
| Genomsnitt av klass Multimedia (26062 - 130368, n=54, senaste 2 åren) | |
| Genomsnitt AMD Ryzen 7 5800H (45773 - 59986, n=28) | |
| Lenovo IdeaPad 5 Pro 16ACH | |
| Honor MagicBook Pro (AMD) | |
| Xiaomi RedmiBook Pro 15 | |
| Lenovo IdeaPad 5 Pro 16IHU6 | |
| Asus VivoBook S15 S533EQ-BQ002T | |
| HP Pavilion 15-eg | |
| Geekbench 5.5 / Single-Core | |
| Genomsnitt av klass Multimedia (805 - 2974, n=55, senaste 2 åren) | |
| Xiaomi RedmiBook Pro 15 | |
| Asus VivoBook S15 S533EQ-BQ002T | |
| Genomsnitt AMD Ryzen 7 5800H (1336 - 1505, n=28) | |
| Lenovo IdeaPad 5 Pro 16IHU6 | |
| Lenovo IdeaPad 5 Pro 16ACH | |
| Honor MagicBook Pro (AMD) | |
| Geekbench 5.5 / Multi-Core | |
| Genomsnitt av klass Multimedia (4652 - 20422, n=55, senaste 2 åren) | |
| Genomsnitt AMD Ryzen 7 5800H (6551 - 9062, n=28) | |
| Lenovo IdeaPad 5 Pro 16ACH | |
| Honor MagicBook Pro (AMD) | |
| Xiaomi RedmiBook Pro 15 | |
| Asus VivoBook S15 S533EQ-BQ002T | |
| Lenovo IdeaPad 5 Pro 16IHU6 | |
| HWBOT x265 Benchmark v2.2 / 4k Preset | |
| Genomsnitt av klass Multimedia (5.26 - 36.1, n=55, senaste 2 åren) | |
| Genomsnitt AMD Ryzen 7 5800H (11.6 - 16.1, n=29) | |
| Lenovo IdeaPad 5 Pro 16ACH | |
| Honor MagicBook Pro (AMD) | |
| Lenovo IdeaPad 5 Pro 16IHU6 | |
| Xiaomi RedmiBook Pro 15 | |
| HP Pavilion 15-eg | |
| Asus VivoBook S15 S533EQ-BQ002T | |
| LibreOffice / 20 Documents To PDF | |
| Genomsnitt AMD Ryzen 7 5800H (47.4 - 113, n=29) | |
| Honor MagicBook Pro (AMD) | |
| Lenovo IdeaPad 5 Pro 16IHU6 | |
| Genomsnitt av klass Multimedia (23.9 - 146.7, n=56, senaste 2 åren) | |
| Lenovo IdeaPad 5 Pro 16ACH | |
| Xiaomi RedmiBook Pro 15 | |
| HP Pavilion 15-eg | |
| Asus VivoBook S15 S533EQ-BQ002T | |
| R Benchmark 2.5 / Overall mean | |
| Honor MagicBook Pro (AMD) | |
| Lenovo IdeaPad 5 Pro 16IHU6 | |
| Asus VivoBook S15 S533EQ-BQ002T | |
| HP Pavilion 15-eg | |
| Xiaomi RedmiBook Pro 15 | |
| Lenovo IdeaPad 5 Pro 16ACH | |
| Genomsnitt AMD Ryzen 7 5800H (0.511 - 0.559, n=28) | |
| Genomsnitt av klass Multimedia (0.3604 - 0.947, n=55, senaste 2 åren) | |
* ... mindre är bättre
| PCMark 10 / Score | |
| Genomsnitt av klass Multimedia (4325 - 10386, n=51, senaste 2 åren) | |
| Genomsnitt AMD Ryzen 7 5800H, NVIDIA GeForce GTX 1650 Mobile (5862 - 6217, n=2) | |
| Lenovo IdeaPad 5 Pro 16ACH | |
| HP Pavilion 15-eg | |
| Xiaomi RedmiBook Pro 15 | |
| Lenovo IdeaPad 5 Pro 16IHU6 | |
| Asus VivoBook S15 S533EQ-BQ002T | |
| Honor MagicBook Pro (AMD) | |
| PCMark 10 / Essentials | |
| Genomsnitt av klass Multimedia (8025 - 11664, n=50, senaste 2 åren) | |
| Genomsnitt AMD Ryzen 7 5800H, NVIDIA GeForce GTX 1650 Mobile (10001 - 10031, n=2) | |
| Lenovo IdeaPad 5 Pro 16ACH | |
| HP Pavilion 15-eg | |
| Lenovo IdeaPad 5 Pro 16IHU6 | |
| Asus VivoBook S15 S533EQ-BQ002T | |
| Honor MagicBook Pro (AMD) | |
| Xiaomi RedmiBook Pro 15 | |
| PCMark 10 / Productivity | |
| Genomsnitt av klass Multimedia (7323 - 18233, n=50, senaste 2 åren) | |
| Xiaomi RedmiBook Pro 15 | |
| HP Pavilion 15-eg | |
| Genomsnitt AMD Ryzen 7 5800H, NVIDIA GeForce GTX 1650 Mobile (8218 - 9225, n=2) | |
| Lenovo IdeaPad 5 Pro 16IHU6 | |
| Asus VivoBook S15 S533EQ-BQ002T | |
| Lenovo IdeaPad 5 Pro 16ACH | |
| Honor MagicBook Pro (AMD) | |
| PCMark 10 / Digital Content Creation | |
| Genomsnitt av klass Multimedia (3651 - 16240, n=50, senaste 2 åren) | |
| Genomsnitt AMD Ryzen 7 5800H, NVIDIA GeForce GTX 1650 Mobile (6650 - 7048, n=2) | |
| Lenovo IdeaPad 5 Pro 16ACH | |
| Xiaomi RedmiBook Pro 15 | |
| HP Pavilion 15-eg | |
| Lenovo IdeaPad 5 Pro 16IHU6 | |
| Asus VivoBook S15 S533EQ-BQ002T | |
| Honor MagicBook Pro (AMD) | |
| PCMark 10 Score | 5862 poäng | |
Hjälp | ||
| DPC Latencies / LatencyMon - interrupt to process latency (max), Web, Youtube, Prime95 | |
| Lenovo IdeaPad 5 Pro 16ACH | |
| Lenovo IdeaPad 5 Pro 16IHU6 | |
* ... mindre är bättre
| Lenovo IdeaPad 5 Pro 16ACH Micron 2300 512GB MTFDHBA512TDV | HP Pavilion 15-eg Samsung PM991 MZVLQ1T0HALB | Xiaomi RedmiBook Pro 15 Toshiba KBG40ZNV512G | Honor MagicBook Pro (AMD) WDC PC SN730 SDBPNTY-512G | Asus VivoBook S15 S533EQ-BQ002T Intel SSD 660p 1TB SSDPEKNW010T8 | Genomsnitt Micron 2300 512GB MTFDHBA512TDV | |
|---|---|---|---|---|---|---|
| AS SSD | 7% | -46% | 42% | -3% | -8% | |
| Seq Read (MB/s) | 2643 | 2030 -23% | 1972 -25% | 2749 4% | 1754 -34% | 2300 ? -13% |
| Seq Write (MB/s) | 1510 | 1003 -34% | 981 -35% | 2348 55% | 1567 4% | 1550 ? 3% |
| 4K Read (MB/s) | 42.86 | 46.74 9% | 55.8 30% | 44.22 3% | 53 24% | 45 ? 5% |
| 4K Write (MB/s) | 85.5 | 164.2 92% | 133.5 56% | 140.5 64% | 167.9 96% | 106.6 ? 25% |
| 4K-64 Read (MB/s) | 768 | 1098 43% | 1277 66% | 1450 89% | 586 -24% | 676 ? -12% |
| 4K-64 Write (MB/s) | 1983 | 891 -55% | 313.9 -84% | 2346 18% | 858 -57% | 1616 ? -19% |
| Access Time Read * (ms) | 0.103 | 0.053 49% | 0.15 -46% | 0.079 23% | 0.097 6% | 0.059 ? 43% |
| Access Time Write * (ms) | 0.101 | 0.062 39% | 0.513 -408% | 0.027 73% | 0.038 62% | 0.1807 ? -79% |
| Score Read (Points) | 1075 | 1348 25% | 1530 42% | 1769 65% | 815 -24% | 952 ? -11% |
| Score Write (Points) | 2220 | 1155 -48% | 546 -75% | 2721 23% | 1182 -47% | 1877 ? -15% |
| Score Total (Points) | 3797 | 3149 -17% | 2819 -26% | 5376 42% | 2421 -36% | 3290 ? -13% |
* ... mindre är bättre

DiskSpd Read Loop, Queue Depth 8
| 3DMark 11 - 1280x720 Performance GPU | |
| Genomsnitt av klass Multimedia (3749 - 60002, n=54, senaste 2 åren) | |
| Acer Nitro 5 AN517-53-54DQ | |
| Genomsnitt NVIDIA GeForce GTX 1650 Mobile (10885 - 13575, n=30) | |
| Lenovo IdeaPad 5 Pro 16ACH | |
| Lenovo IdeaPad 5 Pro 16IHU6 | |
| HP Pavilion 15-eg | |
| Xiaomi RedmiBook Pro 15 | |
| Asus VivoBook S15 S533EQ-BQ002T | |
| Honor MagicBook Pro (AMD) | |
| 3DMark | |
| 1920x1080 Fire Strike Graphics | |
| Genomsnitt av klass Multimedia (2328 - 48907, n=57, senaste 2 åren) | |
| Acer Nitro 5 AN517-53-54DQ | |
| Genomsnitt NVIDIA GeForce GTX 1650 Mobile (7741 - 9810, n=32) | |
| Lenovo IdeaPad 5 Pro 16ACH | |
| Lenovo IdeaPad 5 Pro 16IHU6 | |
| HP Pavilion 15-eg | |
| Xiaomi RedmiBook Pro 15 | |
| Asus VivoBook S15 S533EQ-BQ002T | |
| Honor MagicBook Pro (AMD) | |
| 2560x1440 Time Spy Graphics | |
| Genomsnitt av klass Multimedia (696 - 19403, n=57, senaste 2 åren) | |
| Acer Nitro 5 AN517-53-54DQ | |
| Genomsnitt NVIDIA GeForce GTX 1650 Mobile (2900 - 3700, n=31) | |
| Lenovo IdeaPad 5 Pro 16ACH | |
| Lenovo IdeaPad 5 Pro 16IHU6 | |
| HP Pavilion 15-eg | |
| Asus VivoBook S15 S533EQ-BQ002T | |
| Honor MagicBook Pro (AMD) | |
| 3DMark 11 Performance | 11801 poäng | |
| 3DMark Fire Strike Score | 7763 poäng | |
| 3DMark Time Spy Score | 3362 poäng | |
Hjälp | ||
| The Witcher 3 - 1920x1080 High Graphics & Postprocessing (Nvidia HairWorks Off) | |
| Acer Nitro 5 AN517-53-54DQ | |
| Genomsnitt av klass Multimedia (22 - 157, n=5, senaste 2 åren) | |
| Genomsnitt NVIDIA GeForce GTX 1650 Mobile (45 - 70.4, n=29) | |
| Lenovo IdeaPad 5 Pro 16ACH | |
| Lenovo IdeaPad 5 Pro 16IHU6 | |
| HP Pavilion 15-eg | |
| Xiaomi RedmiBook Pro 15 | |
| Asus VivoBook S15 S533EQ-BQ002T | |
| Honor MagicBook Pro (AMD) | |
The Witcher 3 FPS-tabell
| låg | med. | hög | ultra | |
|---|---|---|---|---|
| GTA V (2015) | 171 | 162 | 91.7 | 44.9 |
| The Witcher 3 (2015) | 175 | 58 | 32.7 | |
| Dota 2 Reborn (2015) | 128 | 122 | 112 | 108 |
| X-Plane 11.11 (2018) | 97 | 84.6 | 70 | |
| Strange Brigade (2018) | 191 | 73.8 | 59.4 | 49.9 |
| F1 2020 (2020) | 178 | 86.5 | 68.7 | 48.3 |
Ljudnivå
| Låg belastning |
| 24.04 / 24.04 / 24.04 dB(A) |
| Hög belastning |
| 41.3 / 52.93 dB(A) |
 | ||
30 dB tyst 40 dB(A) hörbar 50 dB(A) högt ljud |
||
min: | ||
(-) Den maximala temperaturen på ovansidan är 51.9 °C / 125 F, jämfört med genomsnittet av 36.8 °C / 98 F , allt från 21 till 71 °C för klassen Multimedia.
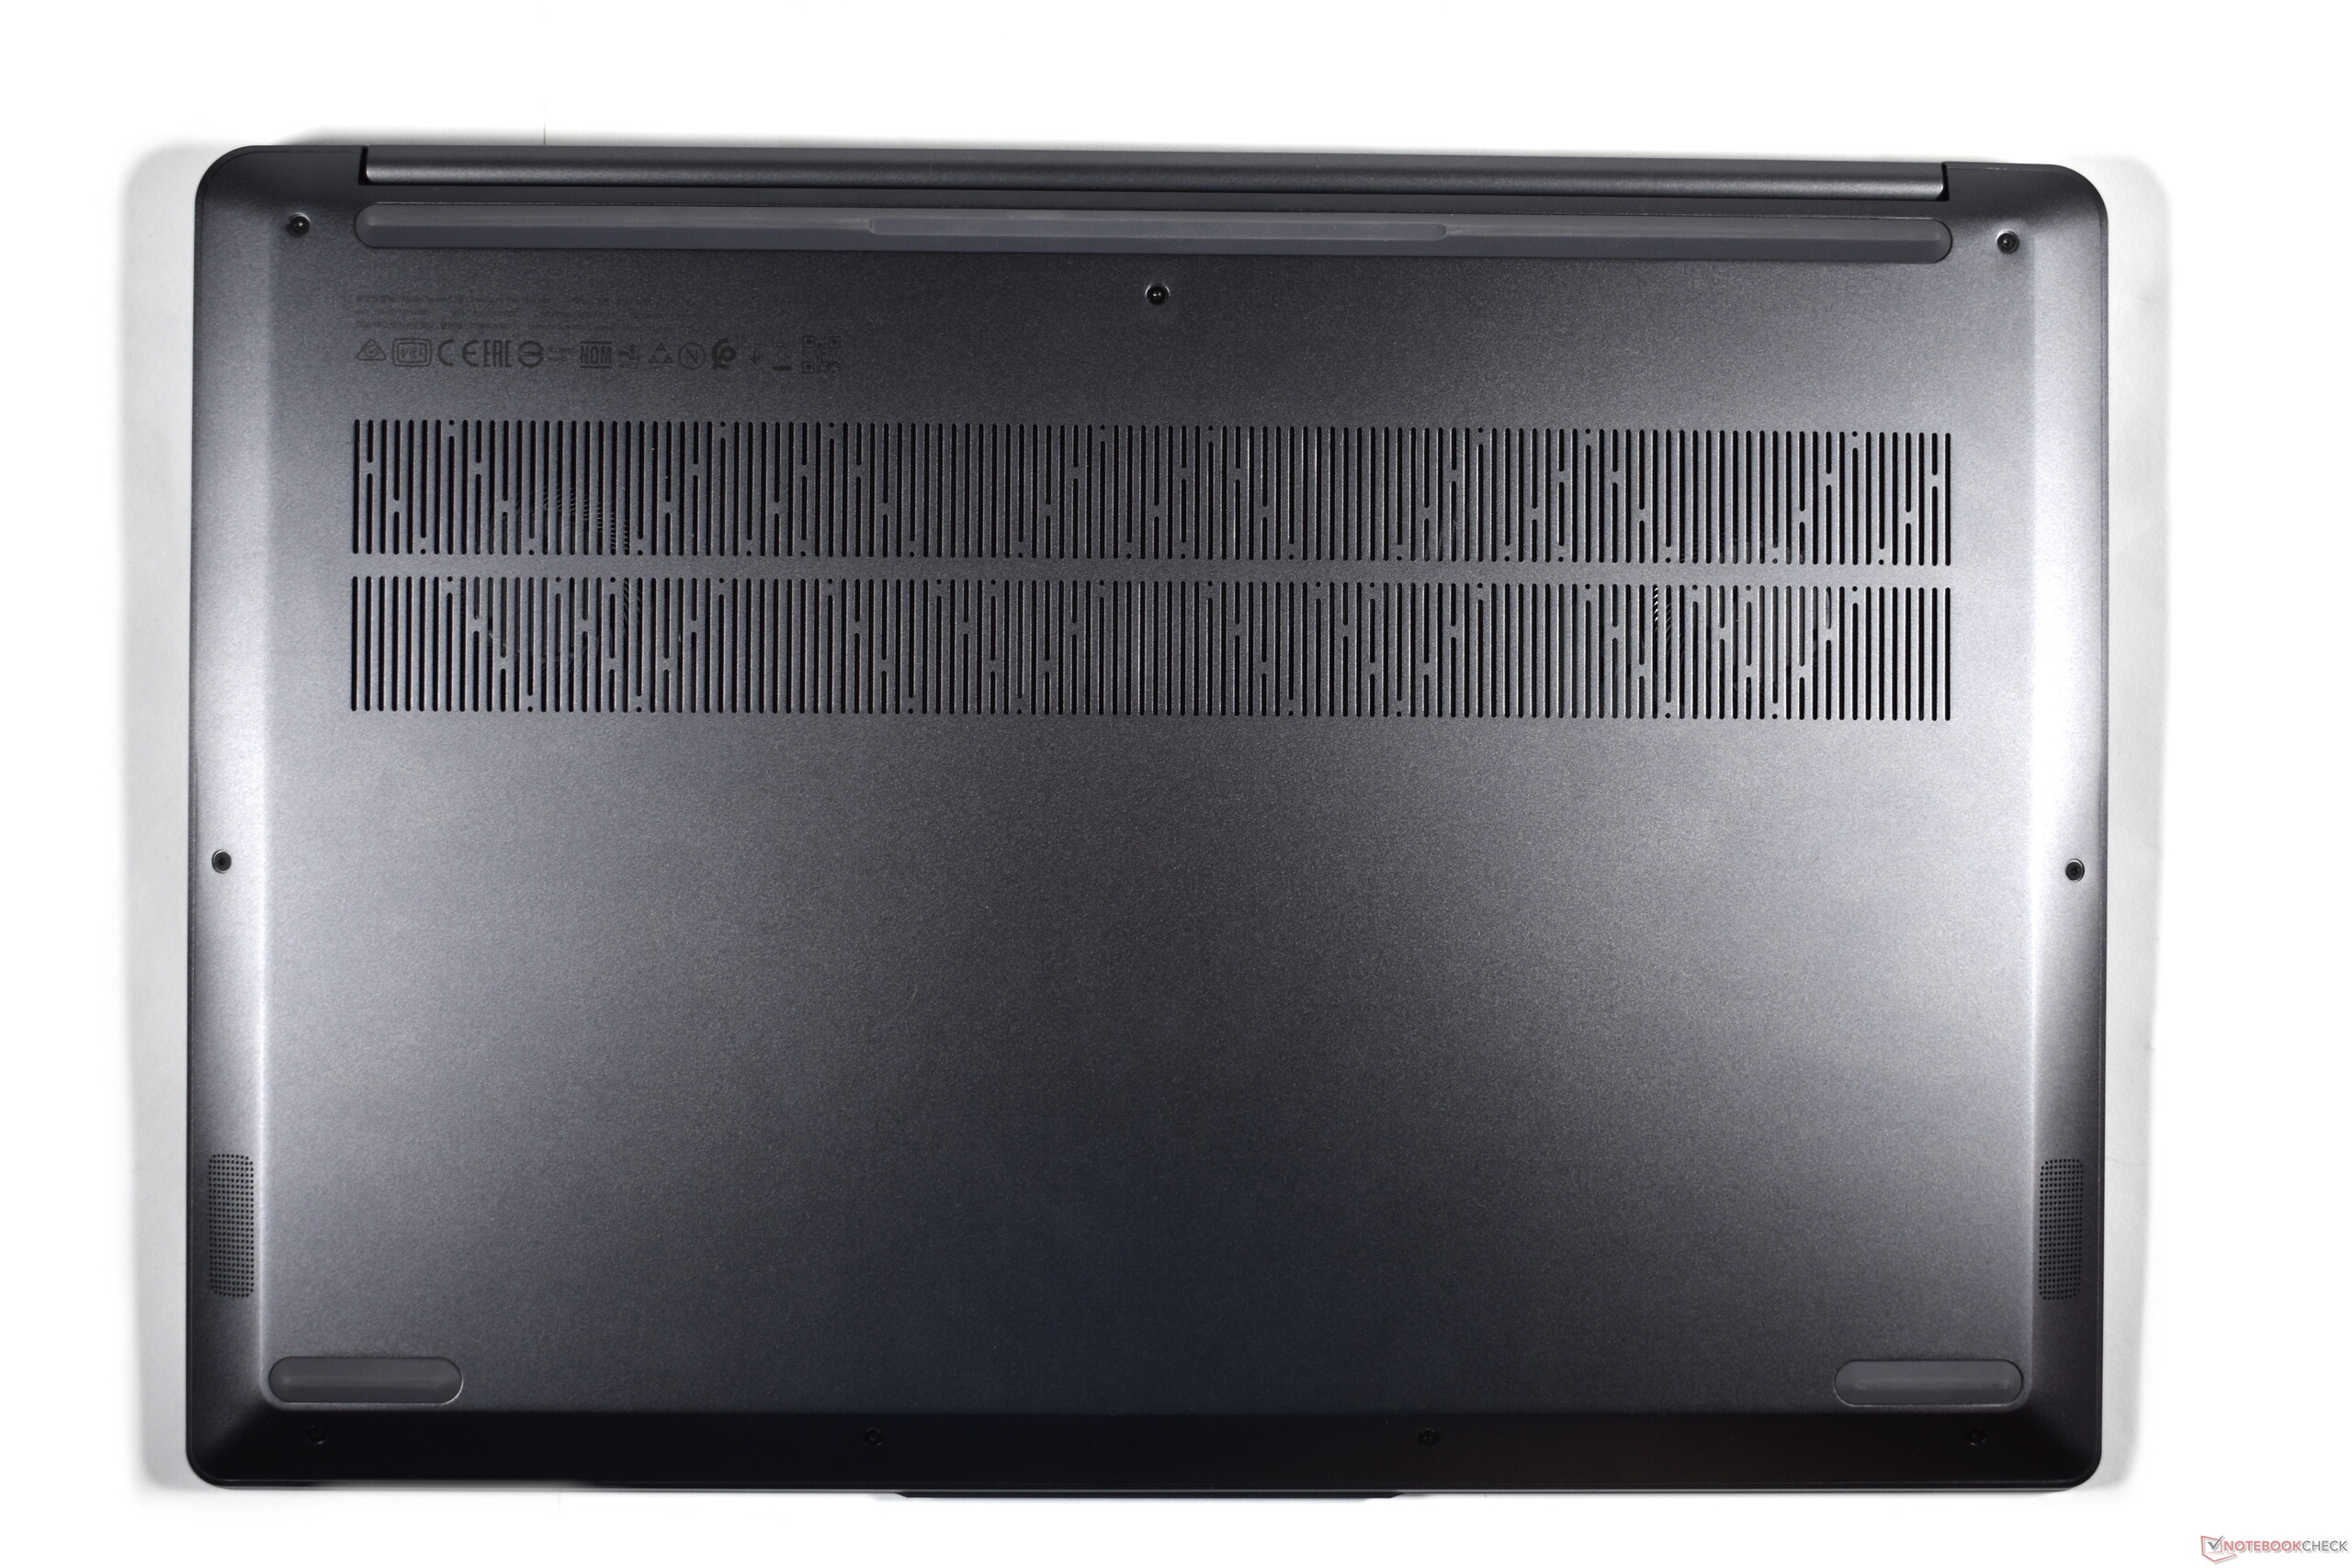
(-) Botten värms upp till maximalt 51.5 °C / 125 F, jämfört med genomsnittet av 39.1 °C / 102 F
(+) Vid tomgångsbruk är medeltemperaturen för ovansidan 24.7 °C / 76 F, jämfört med enhetsgenomsnittet på 31.3 °C / ### class_avg_f### F.
(±) När du spelar The Witcher 3 är medeltemperaturen för ovansidan 33.9 °C / 93 F, jämfört med enhetsgenomsnittet på 31.3 °C / ## #class_avg_f### F.
(+) Handledsstöden och pekplattan är kallare än hudtemperaturen med maximalt 30.2 °C / 86.4 F och är därför svala att ta på.
(±) Medeltemperaturen för handledsstödsområdet på liknande enheter var 28.7 °C / 83.7 F (-1.5 °C / -2.7 F).
Lenovo IdeaPad 5 Pro 16ACH ljudanalys
(-) | inte särskilt höga högtalare (68.8 dB)
Bas 100 - 315 Hz
(-) | nästan ingen bas - i genomsnitt 24.4% lägre än medianen
(±) | linjäriteten för basen är genomsnittlig (13.3% delta till föregående frekvens)
Mellan 400 - 2000 Hz
(+) | balanserad mellan - endast 3.2% från medianen
(+) | mids är linjära (4.1% delta till föregående frekvens)
Högsta 2 - 16 kHz
(+) | balanserade toppar - endast 2% från medianen
(+) | toppar är linjära (6.3% delta till föregående frekvens)
Totalt 100 - 16 000 Hz
(±) | linjäriteten för det totala ljudet är genomsnittlig (22.5% skillnad mot median)
Jämfört med samma klass
» 80% av alla testade enheter i den här klassen var bättre, 4% liknande, 16% sämre
» Den bästa hade ett delta på 5%, genomsnittet var 17%, sämst var 45%
Jämfört med alla testade enheter
» 66% av alla testade enheter var bättre, 6% liknande, 28% sämre
» Den bästa hade ett delta på 4%, genomsnittet var 23%, sämst var 134%
Honor MagicBook Pro (AMD) ljudanalys
(±) | högtalarljudstyrkan är genomsnittlig men bra (74 dB)
Bas 100 - 315 Hz
(±) | reducerad bas - i genomsnitt 14.3% lägre än medianen
(±) | linjäriteten för basen är genomsnittlig (13.6% delta till föregående frekvens)
Mellan 400 - 2000 Hz
(±) | högre mellan - i genomsnitt 5.6% högre än median
(+) | mids är linjära (6.4% delta till föregående frekvens)
Högsta 2 - 16 kHz
(+) | balanserade toppar - endast 3.8% från medianen
(±) | linjäriteten för toppar är genomsnittlig (8.3% delta till föregående frekvens)
Totalt 100 - 16 000 Hz
(±) | linjäriteten för det totala ljudet är genomsnittlig (21.2% skillnad mot median)
Jämfört med samma klass
» 73% av alla testade enheter i den här klassen var bättre, 7% liknande, 20% sämre
» Den bästa hade ett delta på 5%, genomsnittet var 17%, sämst var 45%
Jämfört med alla testade enheter
» 59% av alla testade enheter var bättre, 7% liknande, 34% sämre
» Den bästa hade ett delta på 4%, genomsnittet var 23%, sämst var 134%
| Av/Standby | |
| Låg belastning | |
| Hög belastning |
|
Förklaring:
min: | |
| Lenovo IdeaPad 5 Pro 16ACH R7 5800H, GeForce GTX 1650 Mobile, Micron 2300 512GB MTFDHBA512TDV, IPS LED, 2560x1600, 16" | Lenovo IdeaPad 5 Pro 16IHU6 i5-11300H, GeForce MX450, Samsung SSD PM981a MZVLB512HBJQ, IPS, 2560x1600, 16" | HP Pavilion 15-eg i7-1165G7, GeForce MX450, Samsung PM991 MZVLQ1T0HALB, IPS, 1920x1080, 15.6" | Xiaomi RedmiBook Pro 15 i7-11370H, GeForce MX450, Toshiba KBG40ZNV512G, IPS, 3200x2000, 15.6" | Honor MagicBook Pro (AMD) R5 4600H, Vega 6, WDC PC SN730 SDBPNTY-512G, IPS, 1920x1080, 16.1" | Asus VivoBook S15 S533EQ-BQ002T i7-1165G7, GeForce MX350, Intel SSD 660p 1TB SSDPEKNW010T8, IPS, 1920x1080, 15.6" | Genomsnitt NVIDIA GeForce GTX 1650 Mobile | Genomsnitt av klass Multimedia | |
|---|---|---|---|---|---|---|---|---|
| Power Consumption | 15% | 19% | 9% | 35% | 39% | -3% | 2% | |
| Idle Minimum * (Watt) | 5.7 | 5 12% | 4.9 14% | 6 -5% | 4.2 26% | 3 47% | 4.96 ? 13% | 5.62 ? 1% |
| Idle Average * (Watt) | 9.3 | 9 3% | 7.9 15% | 9 3% | 8.4 10% | 6.4 31% | 8.61 ? 7% | 10.2 ? -10% |
| Idle Maximum * (Watt) | 11 | 9.4 15% | 14.2 -29% | 12 -9% | 9.7 12% | 7.9 28% | 14.8 ? -35% | 12.5 ? -14% |
| Load Average * (Watt) | 83.4 | 71 15% | 64.3 23% | 74 11% | 39.5 53% | 59 29% | 81.7 ? 2% | 65 ? 22% |
| Witcher 3 ultra * (Watt) | 94.4 | 72.4 23% | 55.6 41% | 70.7 25% | 39.1 59% | 48 49% | ||
| Load Maximum * (Watt) | 128.7 | 99 23% | 65.4 49% | 91 29% | 67.1 48% | 68 47% | 131.9 ? -2% | 111.9 ? 13% |
* ... mindre är bättre
Energiförbrukning: The Witcher 3 - Stress-test
| Lenovo IdeaPad 5 Pro 16ACH R7 5800H, GeForce GTX 1650 Mobile, 75 Wh | Lenovo IdeaPad 5 Pro 16IHU6 i5-11300H, GeForce MX450, 75 Wh | HP Pavilion 15-eg i7-1165G7, GeForce MX450, 41 Wh | Xiaomi RedmiBook Pro 15 i7-11370H, GeForce MX450, 70 Wh | Honor MagicBook Pro (AMD) R5 4600H, Vega 6, 56 Wh | Asus VivoBook S15 S533EQ-BQ002T i7-1165G7, GeForce MX350, 50 Wh | Genomsnitt av klass Multimedia | |
|---|---|---|---|---|---|---|---|
| Batteridrifttid | -15% | -39% | -37% | -15% | -33% | 19% | |
| H.264 (h) | 10.4 | 10.4 0% | 5.4 -48% | 10.6 2% | 16.8 ? 62% | ||
| WiFi v1.3 (h) | 12.6 | 9.1 -28% | 6.6 -48% | 8.2 -35% | 10.3 -18% | 8.4 -33% | 12.3 ? -2% |
| Load (h) | 1.7 | 1.4 -18% | 1.2 -29% | 1.2 -29% | 1.2 -29% | 1.645 ? -3% |
För
Emot
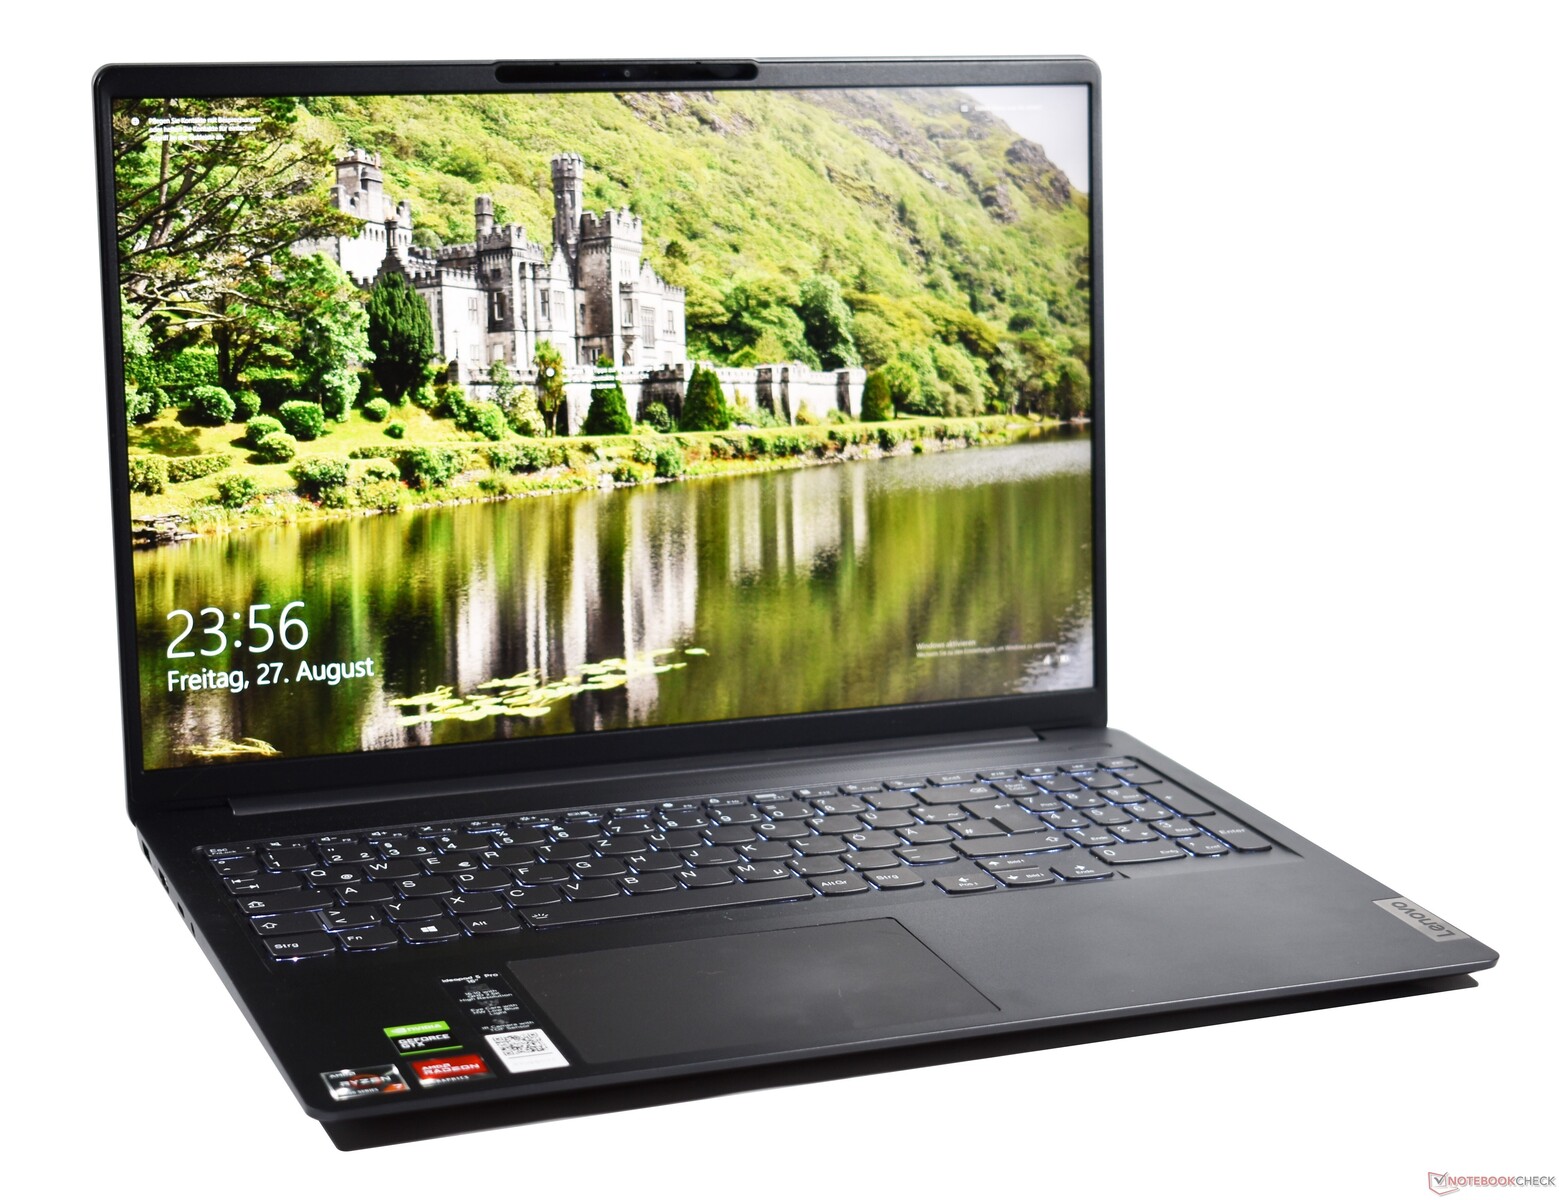
Omdöme: Lenovo IdeaPad ser bra ut men låter inte särskilt bra

Läs den fullständiga versionen av den här recensionen på engelska här.
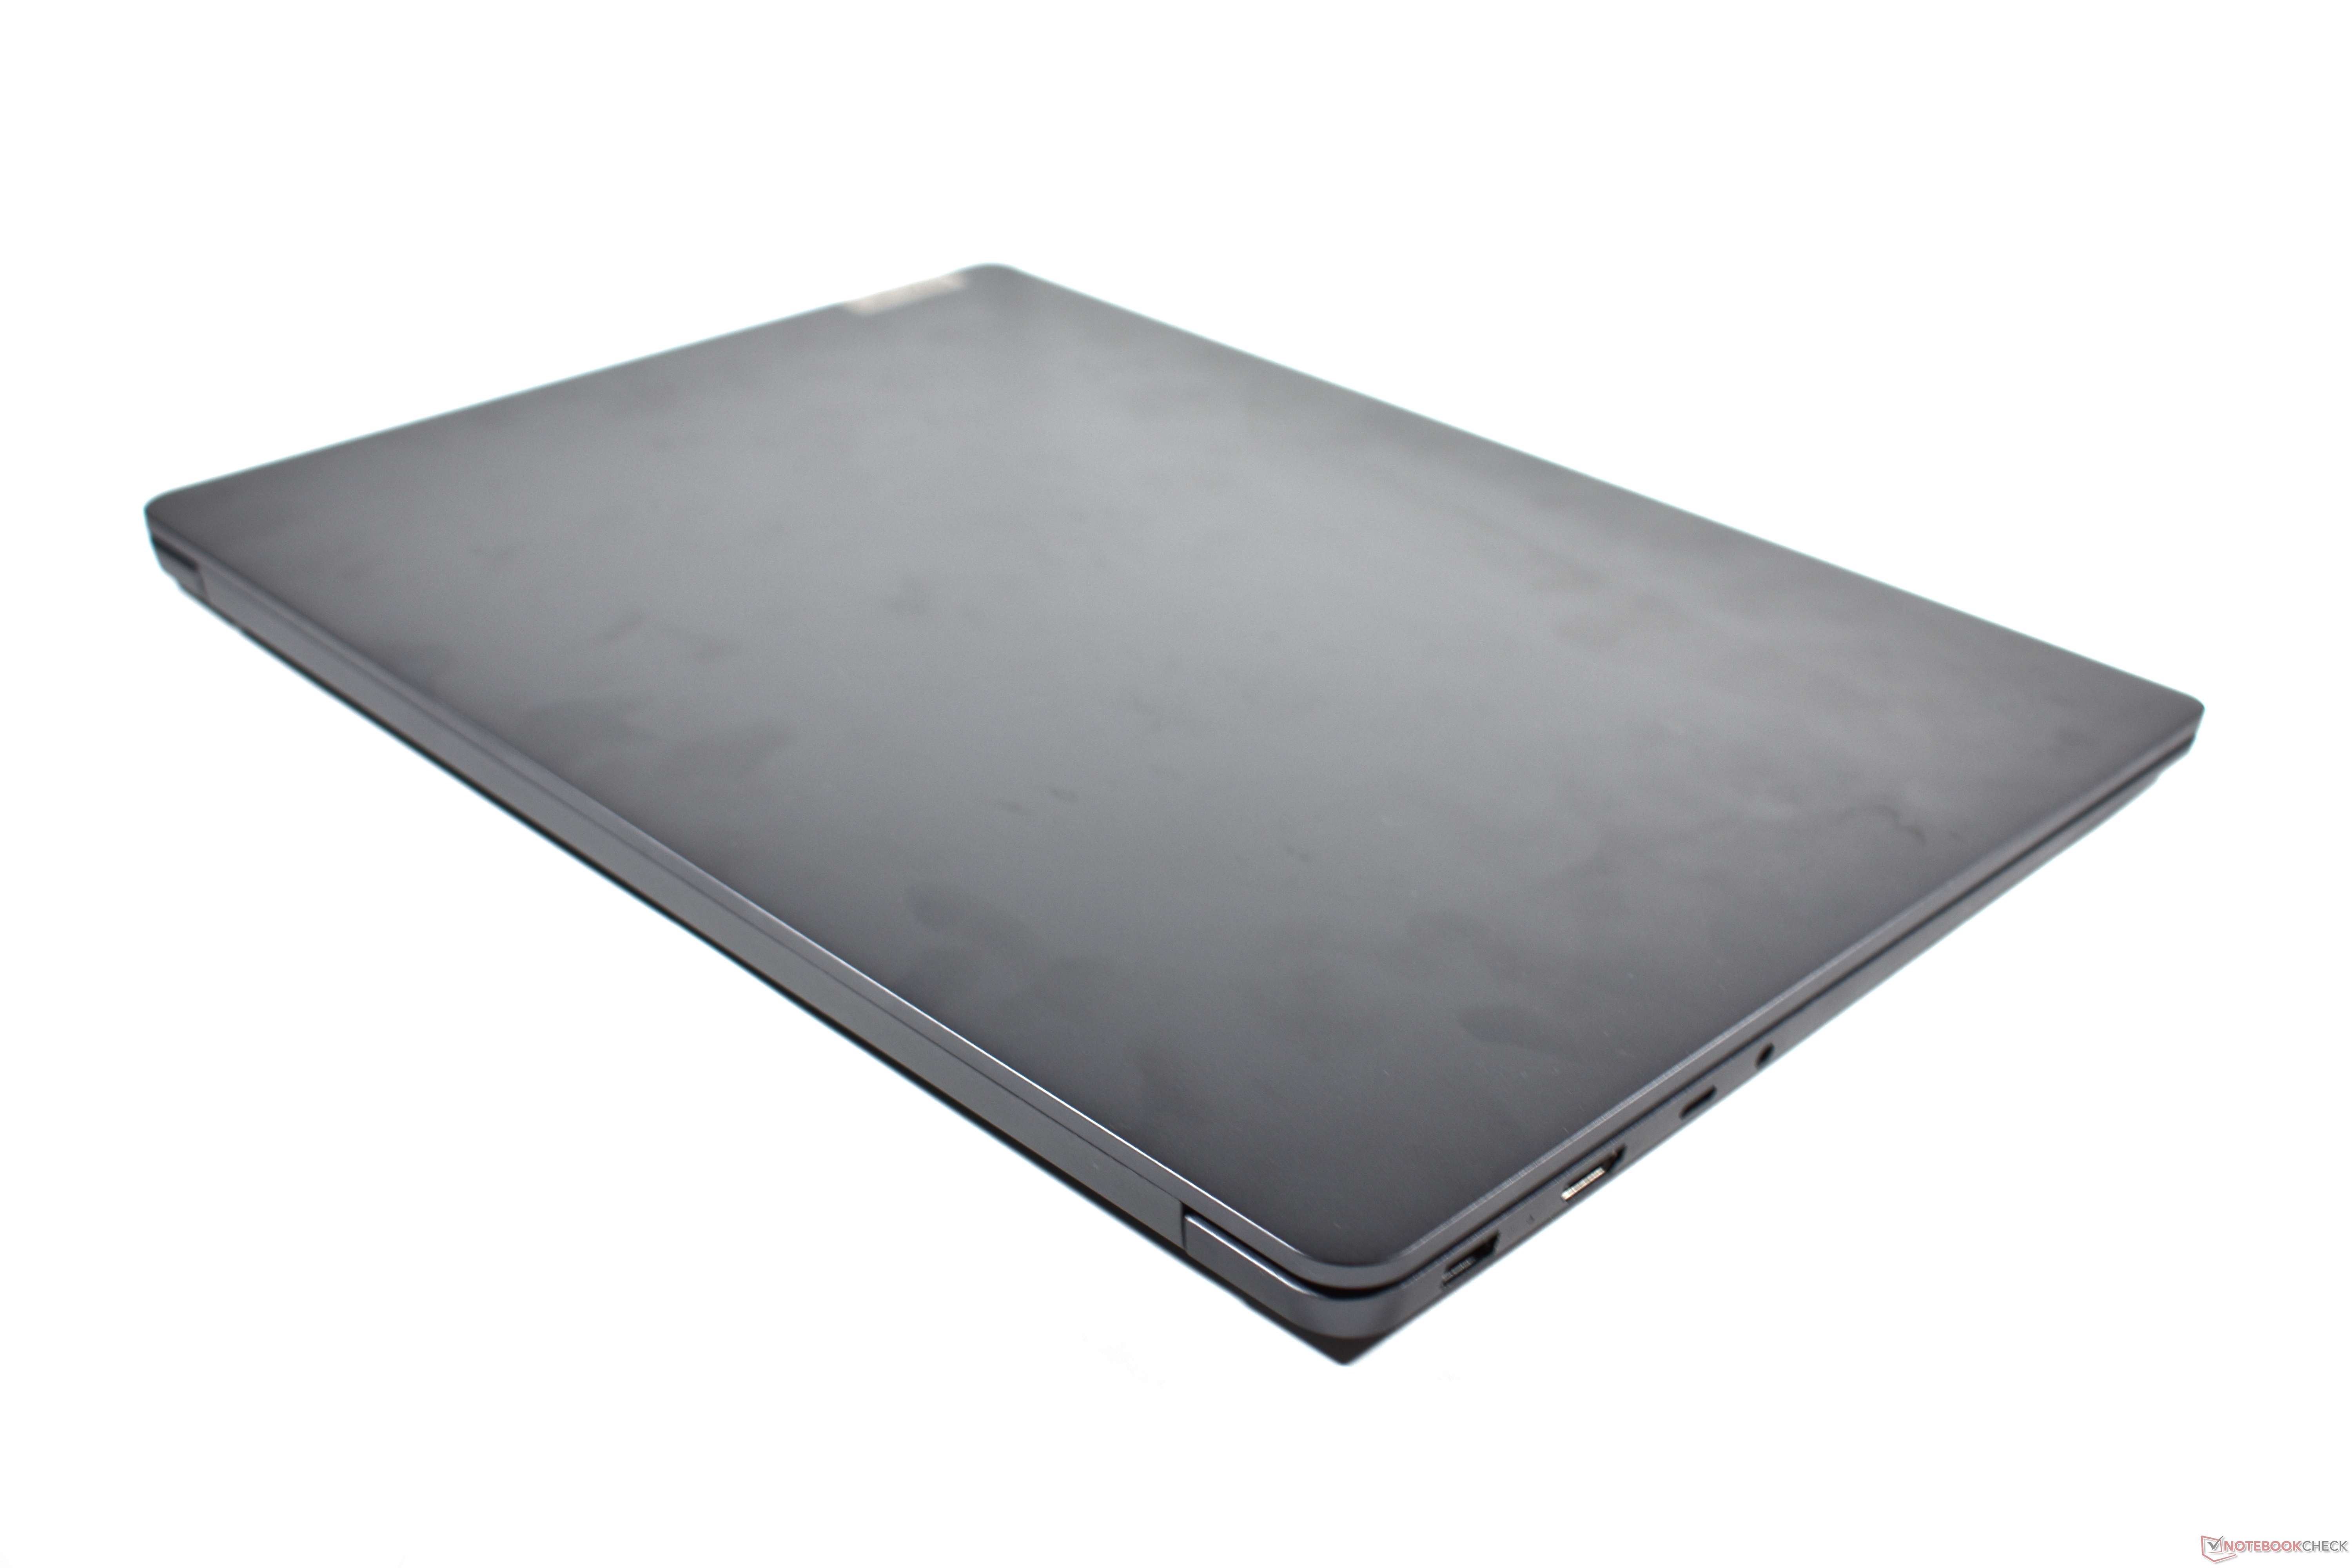
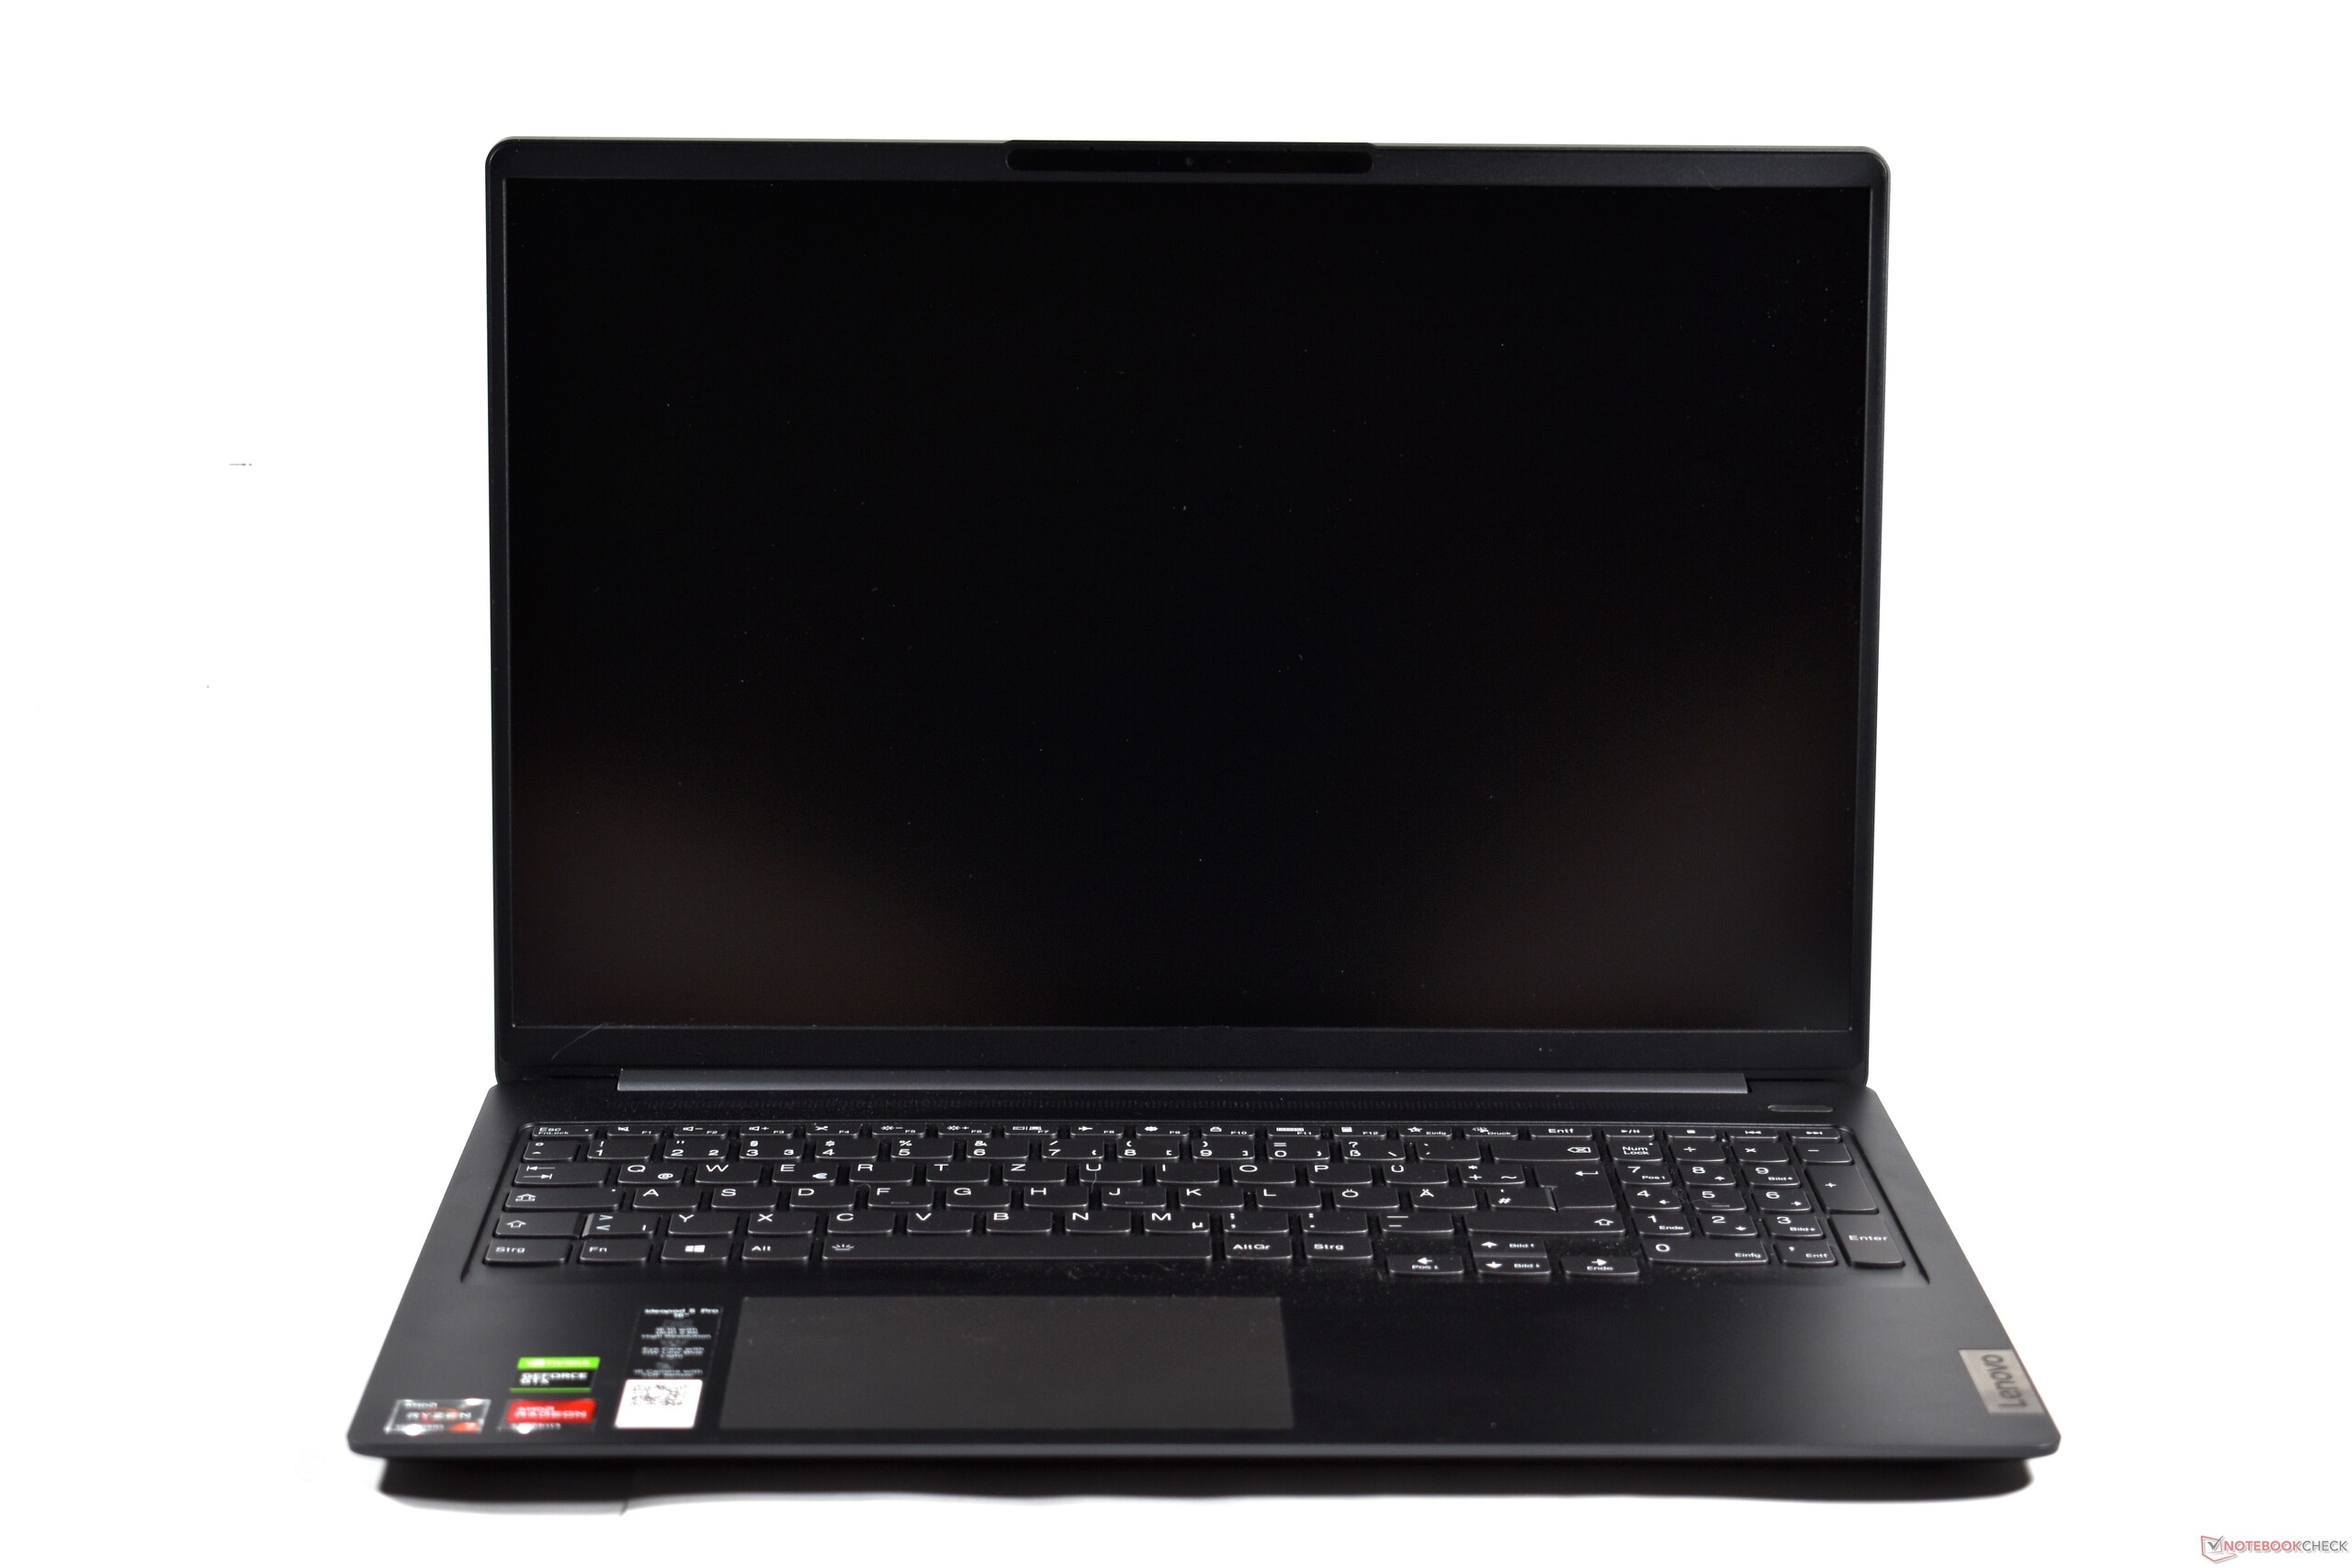
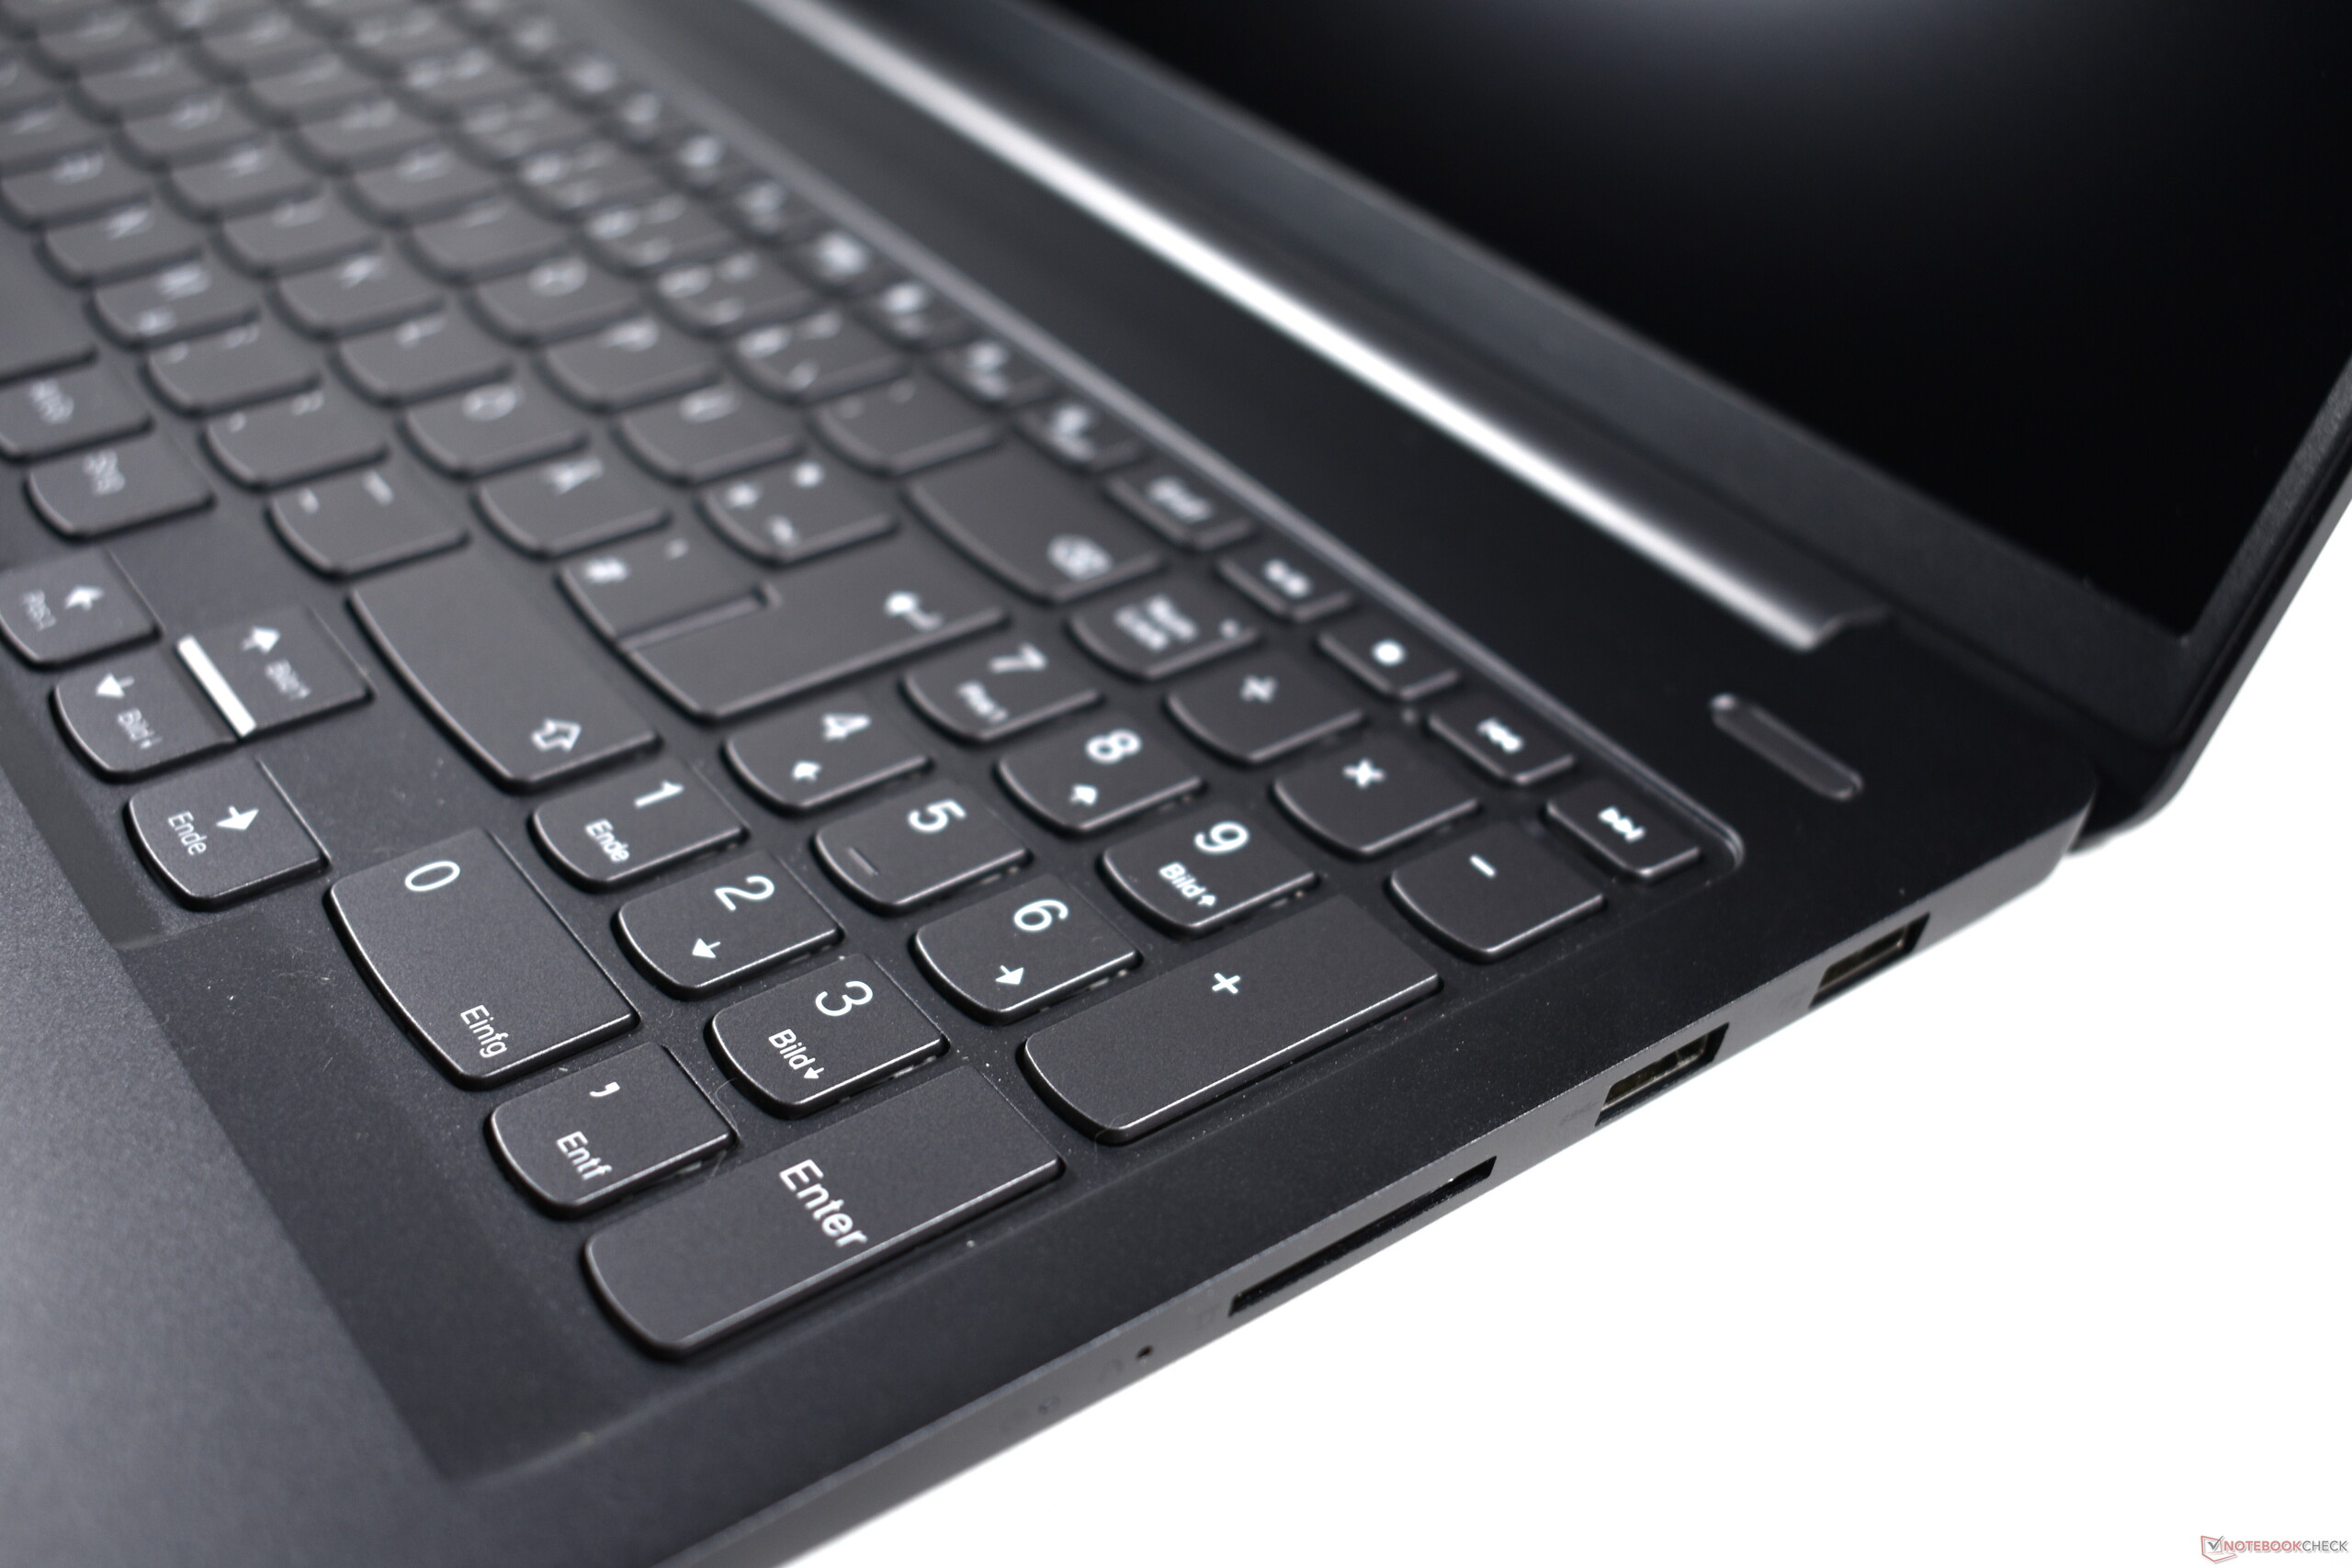
Lenovo IdeaPad 5 Pro 16ACH bevisar att 16:10-formatet inte längre är begränsat till toppskikts-modeller. 16-tumsskärmen - som har hög WQXGA-upplösning, bra kvalitet och snabba responstider - är troligen den här multimediadatorns höjdpunkt och den passar perfekt till både spel och filmer.
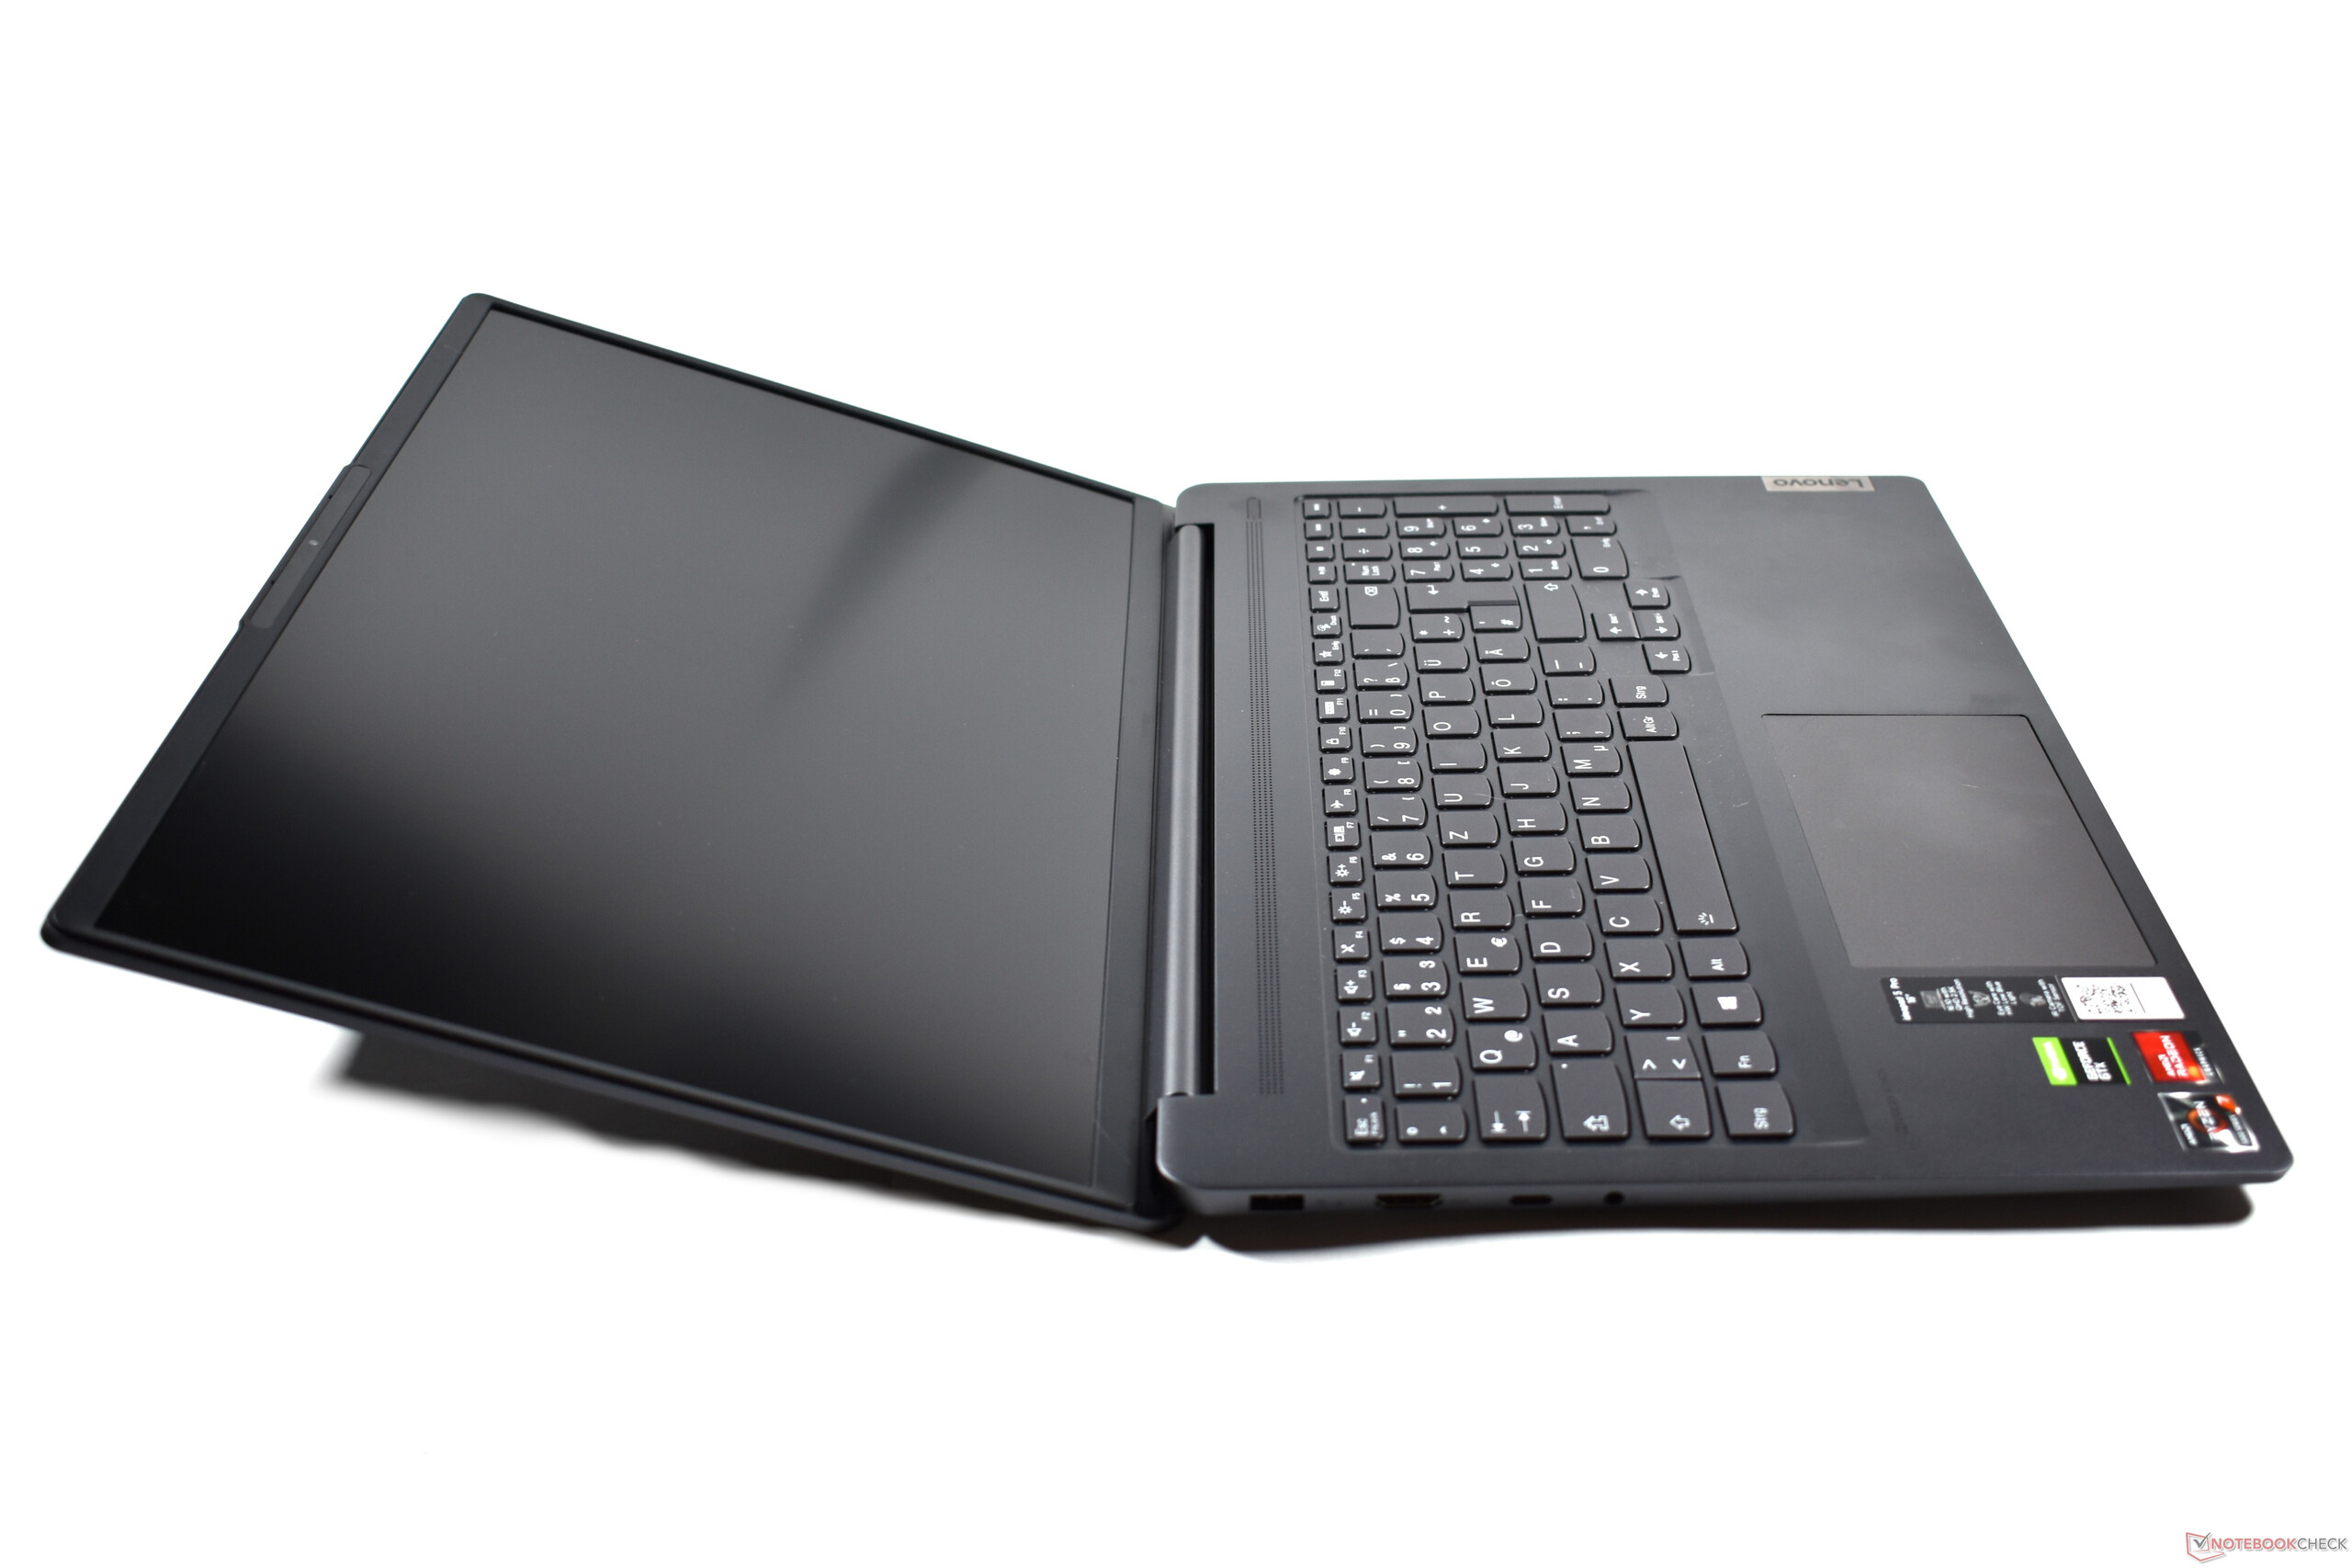
I synnerhet spel kräver förstås en del prestanda - något som IdeaPad också levererar tack vare AMD Ryzen- och Nvidia GeForce-komponenter. Viktigt att tänka på i förhållande till detta är att AMD-modellen vi testat här är betydligt snabbare än Intel-varianten, Lenovo IdeaPad 5 Pro 16IHU. Men den höga prestandan har också ett pris: fläktarna, som inte direkt var tysta på Intel-modellen, låter nu ännu mer vid belastning och kan nu kallas irriterande. Däremot blir AMD-versionen inte lika varm och den har också bättre batteritid.
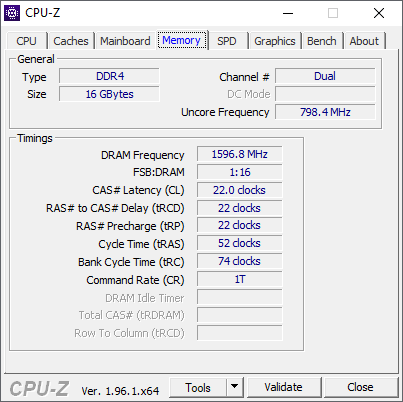
Helt fastlött RAM är ovanligt för en såpass stor laptop. Och de dåliga interna högtalarna är ovanligt för en multimedialaptop: det märks att Lenovo gjort vissa nedskärningar och en extern ljudlösning är ett måste.
Lenovo IdeaPad 5 Pro 16ACH formar en utmärkt symbios som innefattar en Ryzen 5000 CPU, ett 16:10-förhållande samt ett överkomligt pris.
Ljudet är den största bristen med Lenovo IdeaPad 5 Pro 16ACH, som i övrigt visar hur en bra multimedialaptop i budgetkategorin ska se ut. Vi rekommenderar den, särskilt med tanke på att skärmen är riktigt bra men också på grund av prestandan.
Ett alternativ är RedmiBook Pro 15 med sin utmärkta 3:2 LCD, men den går bara att köpa från en Kinesisk onlinebutik. Honor MagicBook Pro påminner också om Lenovos laptop, men den har en 16-tums LCD-skärm i 16:9-format. Detta kan vara en fördel när man tittar på film men är en nackdel för kontorsprogram eller när man surfar på nätet.
Lenovo IdeaPad 5 Pro 16ACH
- 08/30/2021 v7 (old)
Benjamin Herzig
Price comparison
