Test: 2020 HP Envy x360 15 Core i7 Omvandlingsbar 2-in-1: Lite för bekant (Sammanfattning)
Gradering | Datum | Modell | Vikt | Höjd | Storlek | Upplösning | Pris |
|---|---|---|---|---|---|---|---|
| 80.4 % v7 (old) | 06/2020 | HP Envy x360 15-dr1679cl i7-10510U, UHD Graphics 620 | 2.1 kg | 17.2 mm | 15.60" | 1920x1080 | |
| 84.8 % v7 (old) | 04/2020 | Lenovo Yoga C740-15IML i7-10510U, UHD Graphics 620 | 1.9 kg | 17.25 mm | 15.60" | 1920x1080 | |
| 81.2 % v6 (old) | 06/2018 | Dell Inspiron 15 5579-9672 i5-8250U, UHD Graphics 620 | 2.1 kg | 20.2 mm | 15.60" | 1920x1080 | |
| 86.5 % v7 (old) | 03/2020 | Asus ZenBook Flip 15 UX563FD-A1027T i7-10510U, GeForce GTX 1050 Max-Q | 1.9 kg | 19.9 mm | 15.60" | 3840x2160 | |
| 86.8 % v7 (old) | 06/2020 | Dell XPS 15 9500 Core i5 i5-10300H, UHD Graphics 630 | 1.8 kg | 18 mm | 15.60" | 1920x1200 |

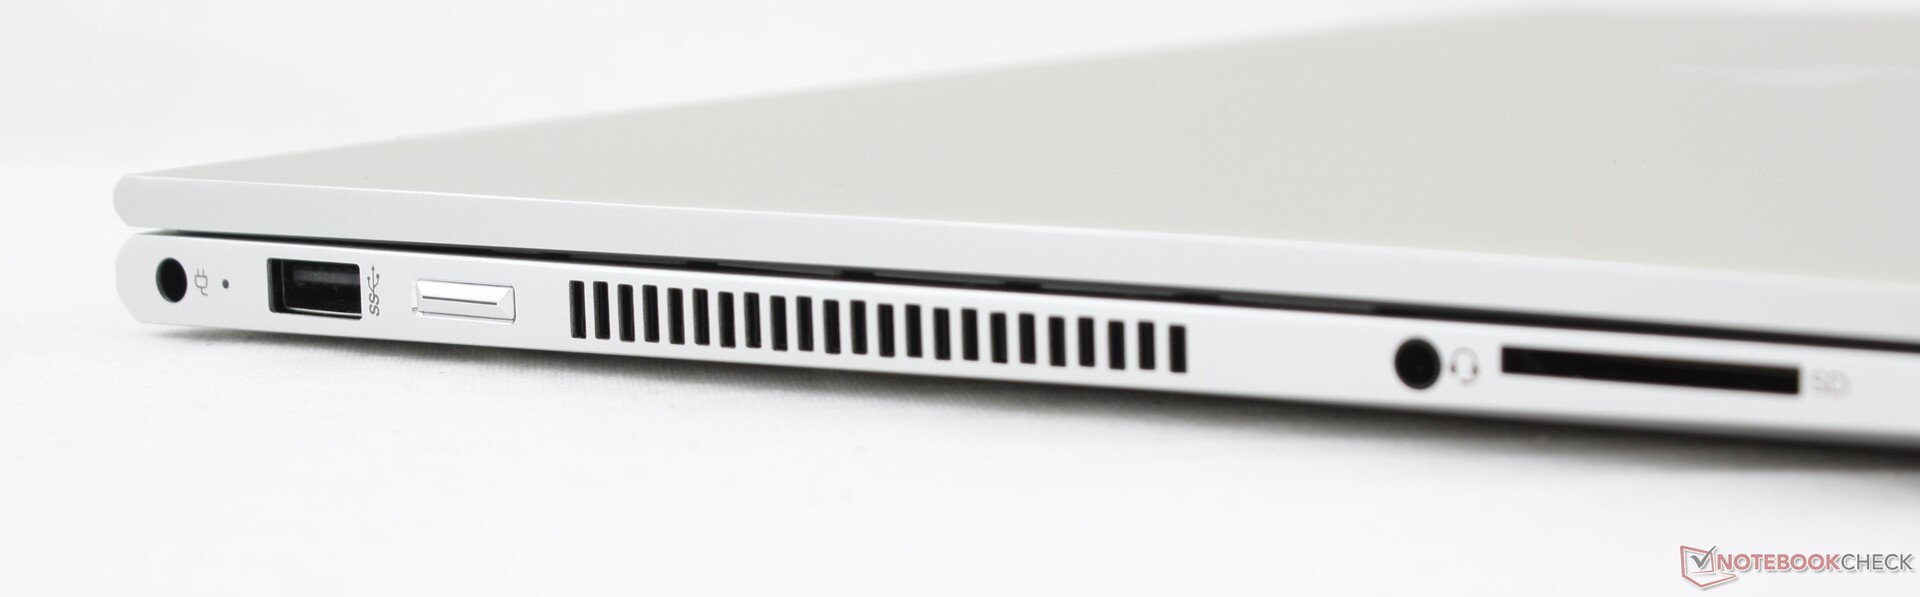
| SD Card Reader | |
| average JPG Copy Test (av. of 3 runs) | |
| Dell XPS 15 9500 Core i5 (Toshiba Exceria Pro SDXC 64 GB UHS-II) | |
| HP Envy x360 15-dr1679cl (Toshiba Exceria Pro SDXC 64 GB UHS-II) | |
| HP Envy x360 15-bq102ng (Toshiba Exceria Pro SDXC 64 GB UHS-II) | |
| Dell Inspiron 15 5579-9672 (Toshiba Exceria Pro SDXC 64 GB UHS-II) | |
| maximum AS SSD Seq Read Test (1GB) | |
| Dell XPS 15 9500 Core i5 (Toshiba Exceria Pro SDXC 64 GB UHS-II) | |
| HP Envy x360 15-dr1679cl (Toshiba Exceria Pro SDXC 64 GB UHS-II) | |
| HP Envy x360 15-bq102ng (Toshiba Exceria Pro SDXC 64 GB UHS-II) | |
| Dell Inspiron 15 5579-9672 (Toshiba Exceria Pro SDXC 64 GB UHS-II) | |

")
")
| |||||||||||||||||||||||||
Distribution av ljusstyrkan: 92 %
Mitt på batteriet: 261.2 cd/m²
Kontrast: 687:1 (Svärta: 0.38 cd/m²)
ΔE ColorChecker Calman: 5.4 | ∀{0.5-29.43 Ø4.71}
calibrated: 3.81
ΔE Greyscale Calman: 4.1 | ∀{0.09-98 Ø4.96}
58.7% sRGB (Argyll 1.6.3 3D)
37.4% AdobeRGB 1998 (Argyll 1.6.3 3D)
40.58% AdobeRGB 1998 (Argyll 3D)
58.8% sRGB (Argyll 3D)
39.28% Display P3 (Argyll 3D)
Gamma: 2.53
CCT: 6611 K
| HP Envy x360 15-dr1679cl AU Optronics B156HW02, IPS, 15.6", 1920x1080 | Lenovo Yoga C740-15IML B156HAN02.5, IPS LED, 15.6", 1920x1080 | Dell Inspiron 15 5579-9672 AUO, B156HW01, IPS, 15.6", 1920x1080 | Asus ZenBook Flip 15 UX563FD-A1027T BOE HF NE156QUM-N64, IPS, 15.6", 3840x2160 | Dell XPS 15 9500 Core i5 Sharp LQ156N1, IPS, 15.6", 1920x1200 | HP Envy x360 15-bq102ng Chi Mei CM15E9, IPS, 15.6", 1920x1080 | |
|---|---|---|---|---|---|---|
| Display | -1% | -6% | 67% | 91% | 5% | |
| Display P3 Coverage (%) | 39.28 | 39.04 -1% | 37 -6% | 66.2 69% | 81.5 107% | 41.36 5% |
| sRGB Coverage (%) | 58.8 | 57.9 -2% | 55.6 -5% | 97.2 65% | 100 70% | 62.2 6% |
| AdobeRGB 1998 Coverage (%) | 40.58 | 40.33 -1% | 38.23 -6% | 68.3 68% | 79.6 96% | 42.74 5% |
| Response Times | -33% | -14% | -50% | -14% | -6% | |
| Response Time Grey 50% / Grey 80% * (ms) | 39.6 ? | 50.8 ? -28% | 41 ? -4% | 60 ? -52% | 42 ? -6% | 40 ? -1% |
| Response Time Black / White * (ms) | 23.6 ? | 32.4 ? -37% | 29 ? -23% | 35 ? -48% | 28.8 ? -22% | 26 ? -10% |
| PWM Frequency (Hz) | 25000 ? | |||||
| Screen | -1% | 16% | 48% | 58% | 32% | |
| Brightness middle (cd/m²) | 261.2 | 286 9% | 251 -4% | 351 34% | 592 127% | 221 -15% |
| Brightness (cd/m²) | 248 | 268 8% | 240 -3% | 335 35% | 565 128% | 207 -17% |
| Brightness Distribution (%) | 92 | 83 -10% | 84 -9% | 87 -5% | 85 -8% | 87 -5% |
| Black Level * (cd/m²) | 0.38 | 0.2 47% | 0.2 47% | 0.31 18% | 0.46 -21% | 0.15 61% |
| Contrast (:1) | 687 | 1430 108% | 1255 83% | 1132 65% | 1287 87% | 1473 114% |
| Colorchecker dE 2000 * | 5.4 | 7.3 -35% | 5.25 3% | 1.74 68% | 3.19 41% | 4.35 19% |
| Colorchecker dE 2000 max. * | 16.31 | 21.7 -33% | 10.04 38% | 2.76 83% | 5.45 67% | 8.98 45% |
| Colorchecker dE 2000 calibrated * | 3.81 | 5.1 -34% | 2.03 47% | |||
| Greyscale dE 2000 * | 4.1 | 7 -71% | 3.28 20% | 2.22 46% | 3.9 5% | 3.09 25% |
| Gamma | 2.53 87% | 2.35 94% | 2.15 102% | 2.35 94% | 2.25 98% | 2.23 99% |
| CCT | 6611 98% | 5847 111% | 6502 100% | 6667 97% | 6522 100% | 6068 107% |
| Color Space (Percent of AdobeRGB 1998) (%) | 37.4 | 36.9 -1% | 35 -6% | 62 66% | 71.6 91% | 56 50% |
| Color Space (Percent of sRGB) (%) | 58.7 | 57.5 -2% | 55 -6% | 97 65% | 100 70% | 86 47% |
| Totalt genomsnitt (program/inställningar) | -12% /
-5% | -1% /
8% | 22% /
38% | 45% /
55% | 10% /
22% |
* ... mindre är bättre
Visa svarstider
| ↔ Svarstid svart till vitt | ||
|---|---|---|
| 23.6 ms ... stiga ↗ och falla ↘ kombinerat | ↗ 12 ms stiga | 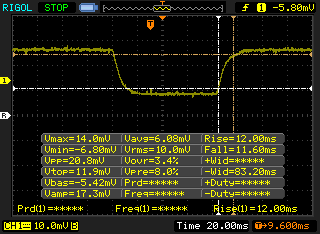 |
| ↘ 11.6 ms hösten | ||
| Skärmen visar bra svarsfrekvens i våra tester, men kan vara för långsam för konkurrenskraftiga spelare. I jämförelse sträcker sig alla testade enheter från 0.1 (minst) till 240 (maximalt) ms. » 54 % av alla enheter är bättre. Detta innebär att den uppmätta svarstiden är sämre än genomsnittet av alla testade enheter (19.8 ms). | ||
| ↔ Svarstid 50 % grått till 80 % grått | ||
| 39.6 ms ... stiga ↗ och falla ↘ kombinerat | ↗ 19.6 ms stiga | 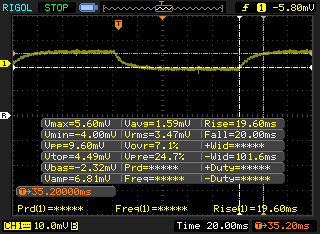 |
| ↘ 20 ms hösten | ||
| Skärmen visar långsamma svarsfrekvenser i våra tester och kommer att vara otillfredsställande för spelare. I jämförelse sträcker sig alla testade enheter från 0.165 (minst) till 636 (maximalt) ms. » 61 % av alla enheter är bättre. Detta innebär att den uppmätta svarstiden är sämre än genomsnittet av alla testade enheter (30.9 ms). | ||
Skärmflimmer / PWM (Puls-Width Modulation)
| Skärmflimmer / PWM upptäcktes inte | 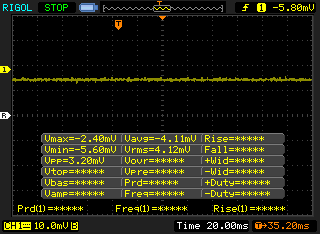 | ||
Som jämförelse: 52 % av alla testade enheter använder inte PWM för att dämpa skärmen. Om PWM upptäcktes mättes ett medelvärde av 7741 (minst: 5 - maximum: 343500) Hz. | |||
Cinebench R20: CPU (Multi Core) | CPU (Single Core)
Blender: v2.79 BMW27 CPU
7-Zip 18.03: 7z b 4 -mmt1 | 7z b 4
Geekbench 5.5: Single-Core | Multi-Core
HWBOT x265 Benchmark v2.2: 4k Preset
LibreOffice : 20 Documents To PDF
R Benchmark 2.5: Overall mean
| Cinebench R15 / CPU Multi 64Bit | |
| MSI Prestige 15 A10SC | |
| Lenovo Ideapad C340-15IWL-81N5004QGE | |
| Asus VivoBook S15 S530UN-BQ097T | |
| Asus ZenBook 15 UX534FT-DB77 | |
| Schenker VIA 15 | |
| Dell Inspiron 15 5000 5585 | |
| Genomsnitt Intel Core i7-10510U (482 - 856, n=45) | |
| Acer Nitro 5 AN515-42-R6V0 | |
| HP Envy x360 15-dr1679cl | |
| Microsoft Surface Book 3 15 | |
| Acer Aspire 5 A515-54G | |
| Cinebench R15 / CPU Single 64Bit | |
| MSI Prestige 15 A10SC | |
| Asus ZenBook 15 UX534FT-DB77 | |
| Microsoft Surface Book 3 15 | |
| Genomsnitt Intel Core i7-10510U (113 - 202, n=42) | |
| Asus VivoBook S15 S530UN-BQ097T | |
| HP Envy x360 15-dr1679cl | |
| Acer Aspire 5 A515-54G | |
| Lenovo Ideapad C340-15IWL-81N5004QGE | |
| Acer Nitro 5 AN515-42-R6V0 | |
| Schenker VIA 15 | |
| Dell Inspiron 15 5000 5585 | |
| Cinebench R20 / CPU (Multi Core) | |
| MSI Prestige 15 A10SC | |
| Asus ZenBook 15 UX534FT-DB77 | |
| Lenovo Ideapad C340-15IWL-81N5004QGE | |
| Schenker VIA 15 | |
| Microsoft Surface Book 3 15 | |
| Dell Inspiron 15 5000 5585 | |
| HP Envy x360 15-dr1679cl | |
| Genomsnitt Intel Core i7-10510U (1015 - 1897, n=38) | |
| Acer Aspire 5 A515-54G | |
| Cinebench R20 / CPU (Single Core) | |
| MSI Prestige 15 A10SC | |
| Microsoft Surface Book 3 15 | |
| Asus ZenBook 15 UX534FT-DB77 | |
| Genomsnitt Intel Core i7-10510U (362 - 497, n=37) | |
| HP Envy x360 15-dr1679cl | |
| Acer Aspire 5 A515-54G | |
| Lenovo Ideapad C340-15IWL-81N5004QGE | |
| Dell Inspiron 15 5000 5585 | |
| Schenker VIA 15 | |
| Blender / v2.79 BMW27 CPU | |
| Microsoft Surface Book 3 15 | |
| Acer Aspire 5 A515-54G | |
| Genomsnitt Intel Core i7-10510U (628 - 1051, n=31) | |
| HP Envy x360 15-dr1679cl | |
| Schenker VIA 15 | |
| 7-Zip 18.03 / 7z b 4 -mmt1 | |
| HP Envy x360 15-dr1679cl | |
| Genomsnitt Intel Core i7-10510U (3747 - 4981, n=31) | |
| Microsoft Surface Book 3 15 | |
| Acer Aspire 5 A515-54G | |
| Schenker VIA 15 | |
| 7-Zip 18.03 / 7z b 4 | |
| HP Envy x360 15-dr1679cl | |
| Microsoft Surface Book 3 15 | |
| Genomsnitt Intel Core i7-10510U (12196 - 21298, n=31) | |
| Acer Aspire 5 A515-54G | |
| Schenker VIA 15 | |
| Geekbench 5.5 / Single-Core | |
| Microsoft Surface Book 3 15 | |
| Genomsnitt Intel Core i7-10510U (977 - 1287, n=31) | |
| HP Envy x360 15-dr1679cl | |
| Acer Aspire 5 A515-54G | |
| Schenker VIA 15 | |
| Geekbench 5.5 / Multi-Core | |
| Microsoft Surface Book 3 15 | |
| Acer Aspire 5 A515-54G | |
| Genomsnitt Intel Core i7-10510U (2474 - 4484, n=31) | |
| HP Envy x360 15-dr1679cl | |
| Schenker VIA 15 | |
| HWBOT x265 Benchmark v2.2 / 4k Preset | |
| HP Envy x360 15-dr1679cl | |
| Genomsnitt Intel Core i7-10510U (3.41 - 6.04, n=31) | |
| Microsoft Surface Book 3 15 | |
| Acer Aspire 5 A515-54G | |
| Schenker VIA 15 | |
| LibreOffice / 20 Documents To PDF | |
| Microsoft Surface Book 3 15 | |
| Acer Aspire 5 A515-54G | |
| HP Envy x360 15-dr1679cl | |
| Genomsnitt Intel Core i7-10510U (50.7 - 77.8, n=27) | |
| R Benchmark 2.5 / Overall mean | |
| Schenker VIA 15 | |
| Acer Aspire 5 A515-54G | |
| HP Envy x360 15-dr1679cl | |
| Microsoft Surface Book 3 15 | |
| Genomsnitt Intel Core i7-10510U (0.637 - 0.81, n=28) | |
* ... mindre är bättre
| PCMark 8 Home Score Accelerated v2 | 3458 poäng | |
| PCMark 8 Work Score Accelerated v2 | 5273 poäng | |
| PCMark 10 Score | 4356 poäng | |
Hjälp | ||
| DPC Latencies / LatencyMon - interrupt to process latency (max), Web, Youtube, Prime95 | |
| HP Envy x360 15-dr1679cl | |
| HP 470 G7 8VU24EA | |
| Dell XPS 15 9500 Core i5 | |
| Huawei MateBook 13 2020 i5 | |
* ... mindre är bättre
| HP Envy x360 15-dr1679cl Intel Optane Memory H10 with Solid State Storage 32GB + 512GB HBRPEKNX0202A(L/H) | Lenovo Yoga C740-15IML Samsung SSD PM981 MZVLB512HAJQ | Dell Inspiron 15 5579-9672 SK hynix SC311 SATA | Dell XPS 15 9500 Core i5 Toshiba KBG40ZNS256G NVMe | HP Envy x360 15-bq102ng Samsung PM961 MZVLW256HEHP | |
|---|---|---|---|---|---|
| AS SSD | 128% | -43% | 2% | 47% | |
| Seq Read (MB/s) | 931 | 2732 193% | 497.5 -47% | 1423 53% | 2465 165% |
| Seq Write (MB/s) | 331.5 | 1477 346% | 356.2 7% | 766 131% | 1318 298% |
| 4K Read (MB/s) | 72.8 | 57.7 -21% | 23.71 -67% | 42.21 -42% | 42.97 -41% |
| 4K Write (MB/s) | 119 | 136.3 15% | 47.64 -60% | 74.8 -37% | 81.9 -31% |
| 4K-64 Read (MB/s) | 389.7 | 1021 162% | 309.7 -21% | 973 150% | 1025 163% |
| 4K-64 Write (MB/s) | 573 | 1651 188% | 247 -57% | 218.8 -62% | 338.6 -41% |
| Access Time Read * (ms) | 0.07 | 0.062 11% | 0.142 -103% | 0.125 -79% | 0.077 -10% |
| Access Time Write * (ms) | 0.138 | 0.028 80% | 0.075 46% | 0.552 -300% | 0.046 67% |
| Score Read (Points) | 556 | 1352 143% | 383 -31% | 1157 108% | 1314 136% |
| Score Write (Points) | 725 | 1935 167% | 330 -54% | 370 -49% | 552 -24% |
| Score Total (Points) | 1565 | 3929 151% | 910 -42% | 2094 34% | 2488 59% |
| Copy ISO MB/s (MB/s) | 593 | 1972 233% | 301.3 -49% | 1151 94% | 700 18% |
| Copy Program MB/s (MB/s) | 495.5 | 642 30% | 166.4 -66% | 499.4 1% | 167.2 -66% |
| Copy Game MB/s (MB/s) | 566 | 1090 93% | 231.6 -59% | 733 30% | 370.4 -35% |
| CrystalDiskMark 5.2 / 6 | 71% | -56% | 3% | 10% | |
| Write 4K (MB/s) | 125.6 | 142.3 13% | 48.25 -62% | 93.3 -26% | 116 -8% |
| Read 4K (MB/s) | 145.8 | 47.56 -67% | 23.77 -84% | 45.9 -69% | 42.73 -71% |
| Write Seq (MB/s) | 509 | 2185 329% | 444.9 -13% | 1211 138% | 1222 140% |
| Read Seq (MB/s) | 1536 | 2235 46% | 497.5 -68% | 1633 6% | 1608 5% |
| Write 4K Q32T1 (MB/s) | 362.4 | 515 42% | 223.5 -38% | 273.1 -25% | 280.1 -23% |
| Read 4K Q32T1 (MB/s) | 307.3 | 413.4 35% | 171.8 -44% | 356 16% | 333.6 9% |
| Write Seq Q32T1 (MB/s) | 1320 | 2981 126% | 511 -61% | 1198 -9% | 1291 -2% |
| Read Seq Q32T1 (MB/s) | 2489 | 3565 43% | 553 -78% | 2269 -9% | 3183 28% |
| Write 4K Q8T8 (MB/s) | 310.2 | ||||
| Read 4K Q8T8 (MB/s) | 349.5 | ||||
| Totalt genomsnitt (program/inställningar) | 100% /
107% | -50% /
-48% | 3% /
2% | 29% /
33% |
* ... mindre är bättre

Diskstrypning: DiskSpd Read Loop, Queue Depth 8
| 3DMark 11 | |
| 1280x720 Performance GPU | |
| HP Envy 17t-cg000 | |
| Asus VivoBook S15 S530UN-BQ097T | |
| Dell Inspiron 15 5000 5585 | |
| HP 15s-fq1440ng | |
| HP 14s-dq1431ng | |
| HP Envy x360 15-dr1679cl | |
| HP Pavilion x360 15-dq0065cl | |
| Genomsnitt Intel UHD Graphics 620 (1144 - 3432, n=244) | |
| Dell XPS 15 9500 Core i5 | |
| Chuwi AeroBook Pro | |
| 1280x720 Performance Combined | |
| HP Envy 17t-cg000 | |
| Asus VivoBook S15 S530UN-BQ097T | |
| Dell Inspiron 15 5000 5585 | |
| HP 15s-fq1440ng | |
| HP 14s-dq1431ng | |
| Dell XPS 15 9500 Core i5 | |
| Genomsnitt Intel UHD Graphics 620 (927 - 2505, n=244) | |
| HP Pavilion x360 15-dq0065cl | |
| HP Envy x360 15-dr1679cl | |
| Chuwi AeroBook Pro | |
| 3DMark 11 Performance | 2052 poäng | |
| 3DMark Cloud Gate Standard Score | 8532 poäng | |
| 3DMark Fire Strike Score | 1074 poäng | |
| 3DMark Time Spy Score | 447 poäng | |
Hjälp | ||
| låg | med. | hög | ultra | |
|---|---|---|---|---|
| The Witcher 3 (2015) | 18.9 | 12.4 | 6.5 | |
| Dota 2 Reborn (2015) | 71.9 | 41.8 | 18.8 | 16.7 |
| X-Plane 11.11 (2018) | 22.6 | 15.2 | 13.6 |
| HP Envy x360 15-dr1679cl UHD Graphics 620, i7-10510U, Intel Optane Memory H10 with Solid State Storage 32GB + 512GB HBRPEKNX0202A(L/H) | Lenovo Yoga C740-15IML UHD Graphics 620, i7-10510U, Samsung SSD PM981 MZVLB512HAJQ | Dell Inspiron 15 5579-9672 UHD Graphics 620, i5-8250U, SK hynix SC311 SATA | Asus ZenBook Flip 15 UX563FD-A1027T GeForce GTX 1050 Max-Q, i7-10510U, Samsung SSD PM981 MZVLB1T0HALR | Dell XPS 15 9500 Core i5 UHD Graphics 630, i5-10300H, Toshiba KBG40ZNS256G NVMe | HP Envy x360 15-bq102ng Vega 8, R5 2500U, Samsung PM961 MZVLW256HEHP | |
|---|---|---|---|---|---|---|
| Noise | 5% | 4% | 1% | 7% | -2% | |
| av / miljö * (dB) | 28 | 29.3 -5% | 30.4 -9% | 30.3 -8% | 28 -0% | 30.13 -8% |
| Idle Minimum * (dB) | 28 | 29.3 -5% | 30.4 -9% | 30.3 -8% | 28 -0% | 30.13 -8% |
| Idle Average * (dB) | 30.2 | 29.3 3% | 30.4 -1% | 30.3 -0% | 28 7% | 30.13 -0% |
| Idle Maximum * (dB) | 31.5 | 29.6 6% | 31.2 1% | 30.3 4% | 28 11% | 30.13 4% |
| Load Average * (dB) | 35.7 | 32.4 9% | 31.5 12% | 33.7 6% | 28 22% | 38.8 -9% |
| Load Maximum * (dB) | 43.1 | 33.3 23% | 31.5 27% | 38.9 10% | 41.9 3% | 38.8 10% |
| Witcher 3 ultra * (dB) | 37.4 |
* ... mindre är bättre
Ljudnivå
| Låg belastning |
| 28 / 30.2 / 31.5 dB(A) |
| Hög belastning |
| 35.7 / 43.1 dB(A) |
 | ||
30 dB tyst 40 dB(A) hörbar 50 dB(A) högt ljud |
||
min: | ||
(-) Den maximala temperaturen på ovansidan är 47 °C / 117 F, jämfört med genomsnittet av 35.4 °C / 96 F , allt från 19.6 till 60 °C för klassen Convertible.
(±) Botten värms upp till maximalt 44 °C / 111 F, jämfört med genomsnittet av 36.9 °C / 98 F
(+) Vid tomgångsbruk är medeltemperaturen för ovansidan 30.8 °C / 87 F, jämfört med enhetsgenomsnittet på 30.3 °C / ### class_avg_f### F.
(+) Handledsstöden och pekplattan når maximal hudtemperatur (35.2 °C / 95.4 F) och är därför inte varma.
(-) Medeltemperaturen för handledsstödsområdet på liknande enheter var 28 °C / 82.4 F (-7.2 °C / -13 F).
| Av/Standby | |
| Låg belastning | |
| Hög belastning |
|
Förklaring:
min: | |
| HP Envy x360 15-dr1679cl i7-10510U, UHD Graphics 620, Intel Optane Memory H10 with Solid State Storage 32GB + 512GB HBRPEKNX0202A(L/H), IPS, 1920x1080, 15.6" | Lenovo Yoga C740-15IML i7-10510U, UHD Graphics 620, Samsung SSD PM981 MZVLB512HAJQ, IPS LED, 1920x1080, 15.6" | Dell Inspiron 15 5579-9672 i5-8250U, UHD Graphics 620, SK hynix SC311 SATA, IPS, 1920x1080, 15.6" | Asus ZenBook Flip 15 UX563FD-A1027T i7-10510U, GeForce GTX 1050 Max-Q, Samsung SSD PM981 MZVLB1T0HALR, IPS, 3840x2160, 15.6" | Dell XPS 15 9500 Core i5 i5-10300H, UHD Graphics 630, Toshiba KBG40ZNS256G NVMe, IPS, 1920x1200, 15.6" | HP Envy x360 15-bq102ng R5 2500U, Vega 8, Samsung PM961 MZVLW256HEHP, IPS, 1920x1080, 15.6" | |
|---|---|---|---|---|---|---|
| Power Consumption | 0% | 13% | -43% | -5% | -1% | |
| Idle Minimum * (Watt) | 4.3 | 2.97 31% | 3.9 9% | 2.3 47% | 2.9 33% | 4.8 -12% |
| Idle Average * (Watt) | 7.2 | 7.2 -0% | 6.6 8% | 10.3 -43% | 7.6 -6% | 7 3% |
| Idle Maximum * (Watt) | 7.5 | 9.9 -32% | 9.3 -24% | 11 -47% | 8 -7% | 9.5 -27% |
| Load Average * (Watt) | 40.4 | 40.8 -1% | 30.2 25% | 77 -91% | 41.7 -3% | 40.8 -1% |
| Load Maximum * (Watt) | 65.7 | 64.7 2% | 33.2 49% | 118 -80% | 94.8 -44% | 44.3 33% |
| Witcher 3 ultra * (Watt) | 68 |
* ... mindre är bättre
| HP Envy x360 15-dr1679cl i7-10510U, UHD Graphics 620, 55.67 Wh | Lenovo Yoga C740-15IML i7-10510U, UHD Graphics 620, 60.3 Wh | Dell Inspiron 15 5579-9672 i5-8250U, UHD Graphics 620, 42 Wh | Asus ZenBook Flip 15 UX563FD-A1027T i7-10510U, GeForce GTX 1050 Max-Q, 71 Wh | Dell XPS 15 9500 Core i5 i5-10300H, UHD Graphics 630, 56 Wh | HP Envy x360 15-bq102ng R5 2500U, Vega 8, 55.8 Wh | |
|---|---|---|---|---|---|---|
| Batteridrifttid | 0% | -33% | -4% | -8% | -23% | |
| Reader / Idle (h) | 25.4 | 11.2 -56% | 19.5 -23% | 26.4 4% | ||
| WiFi v1.3 (h) | 9.2 | 10.4 13% | 7.3 -21% | 9.4 2% | 9.3 1% | 7.1 -23% |
| Load (h) | 2.3 | 2 -13% | 1.8 -22% | 2.5 9% | 1.6 -30% |
För
Emot
Läs den fullständiga versionen av den här recensionen på engelska här.
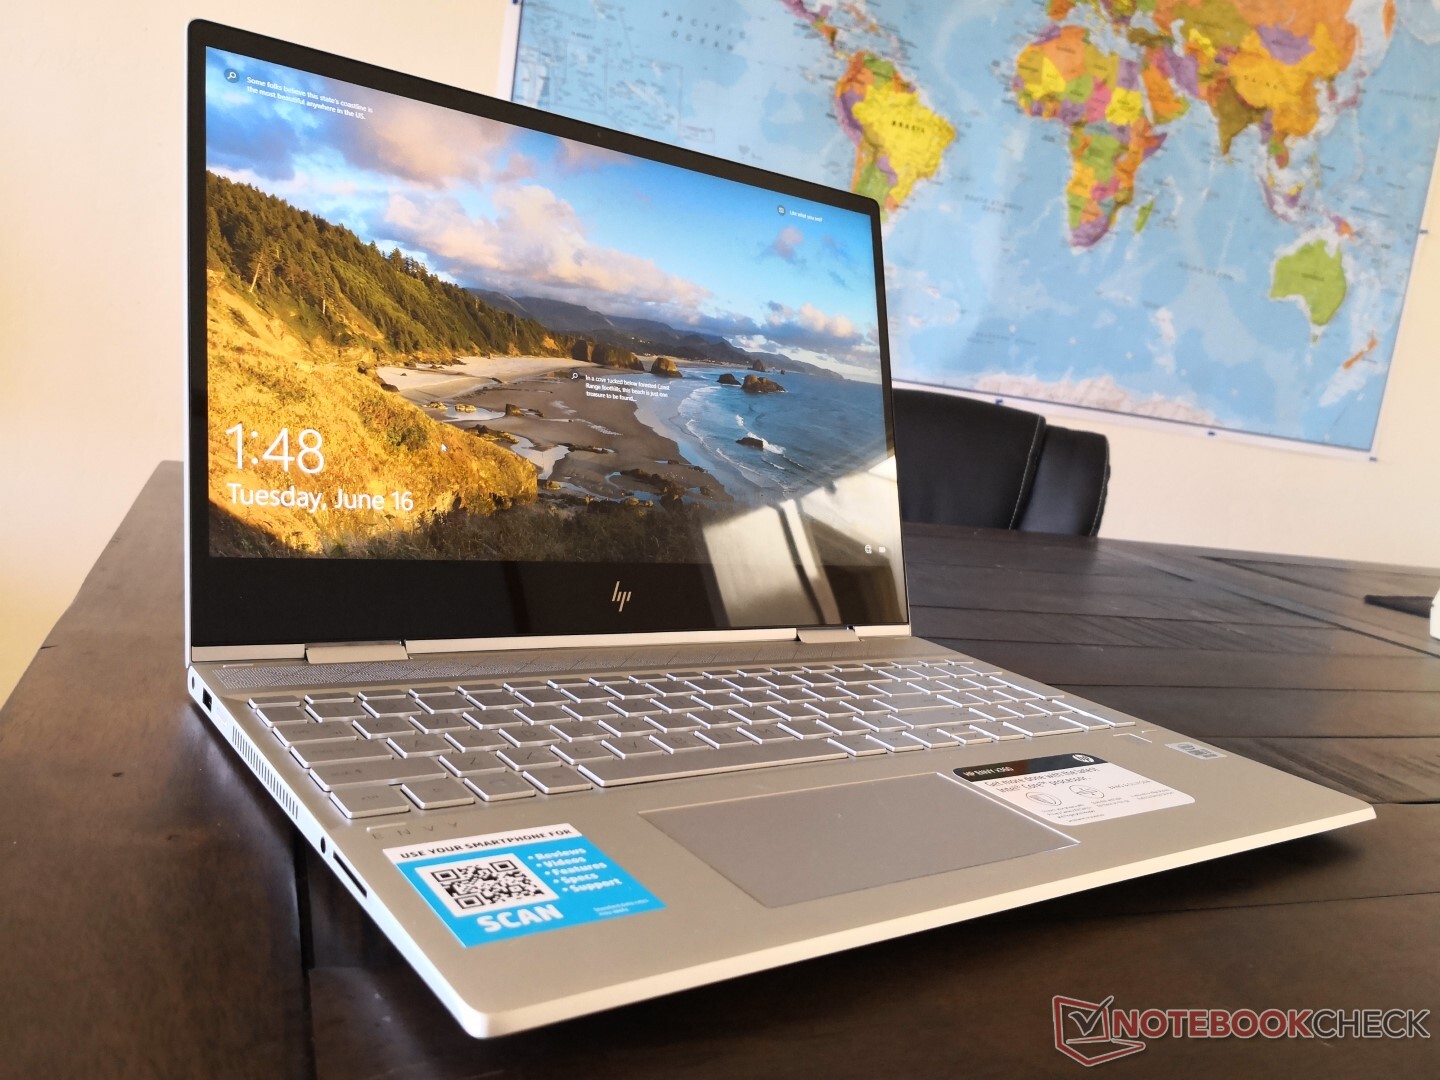
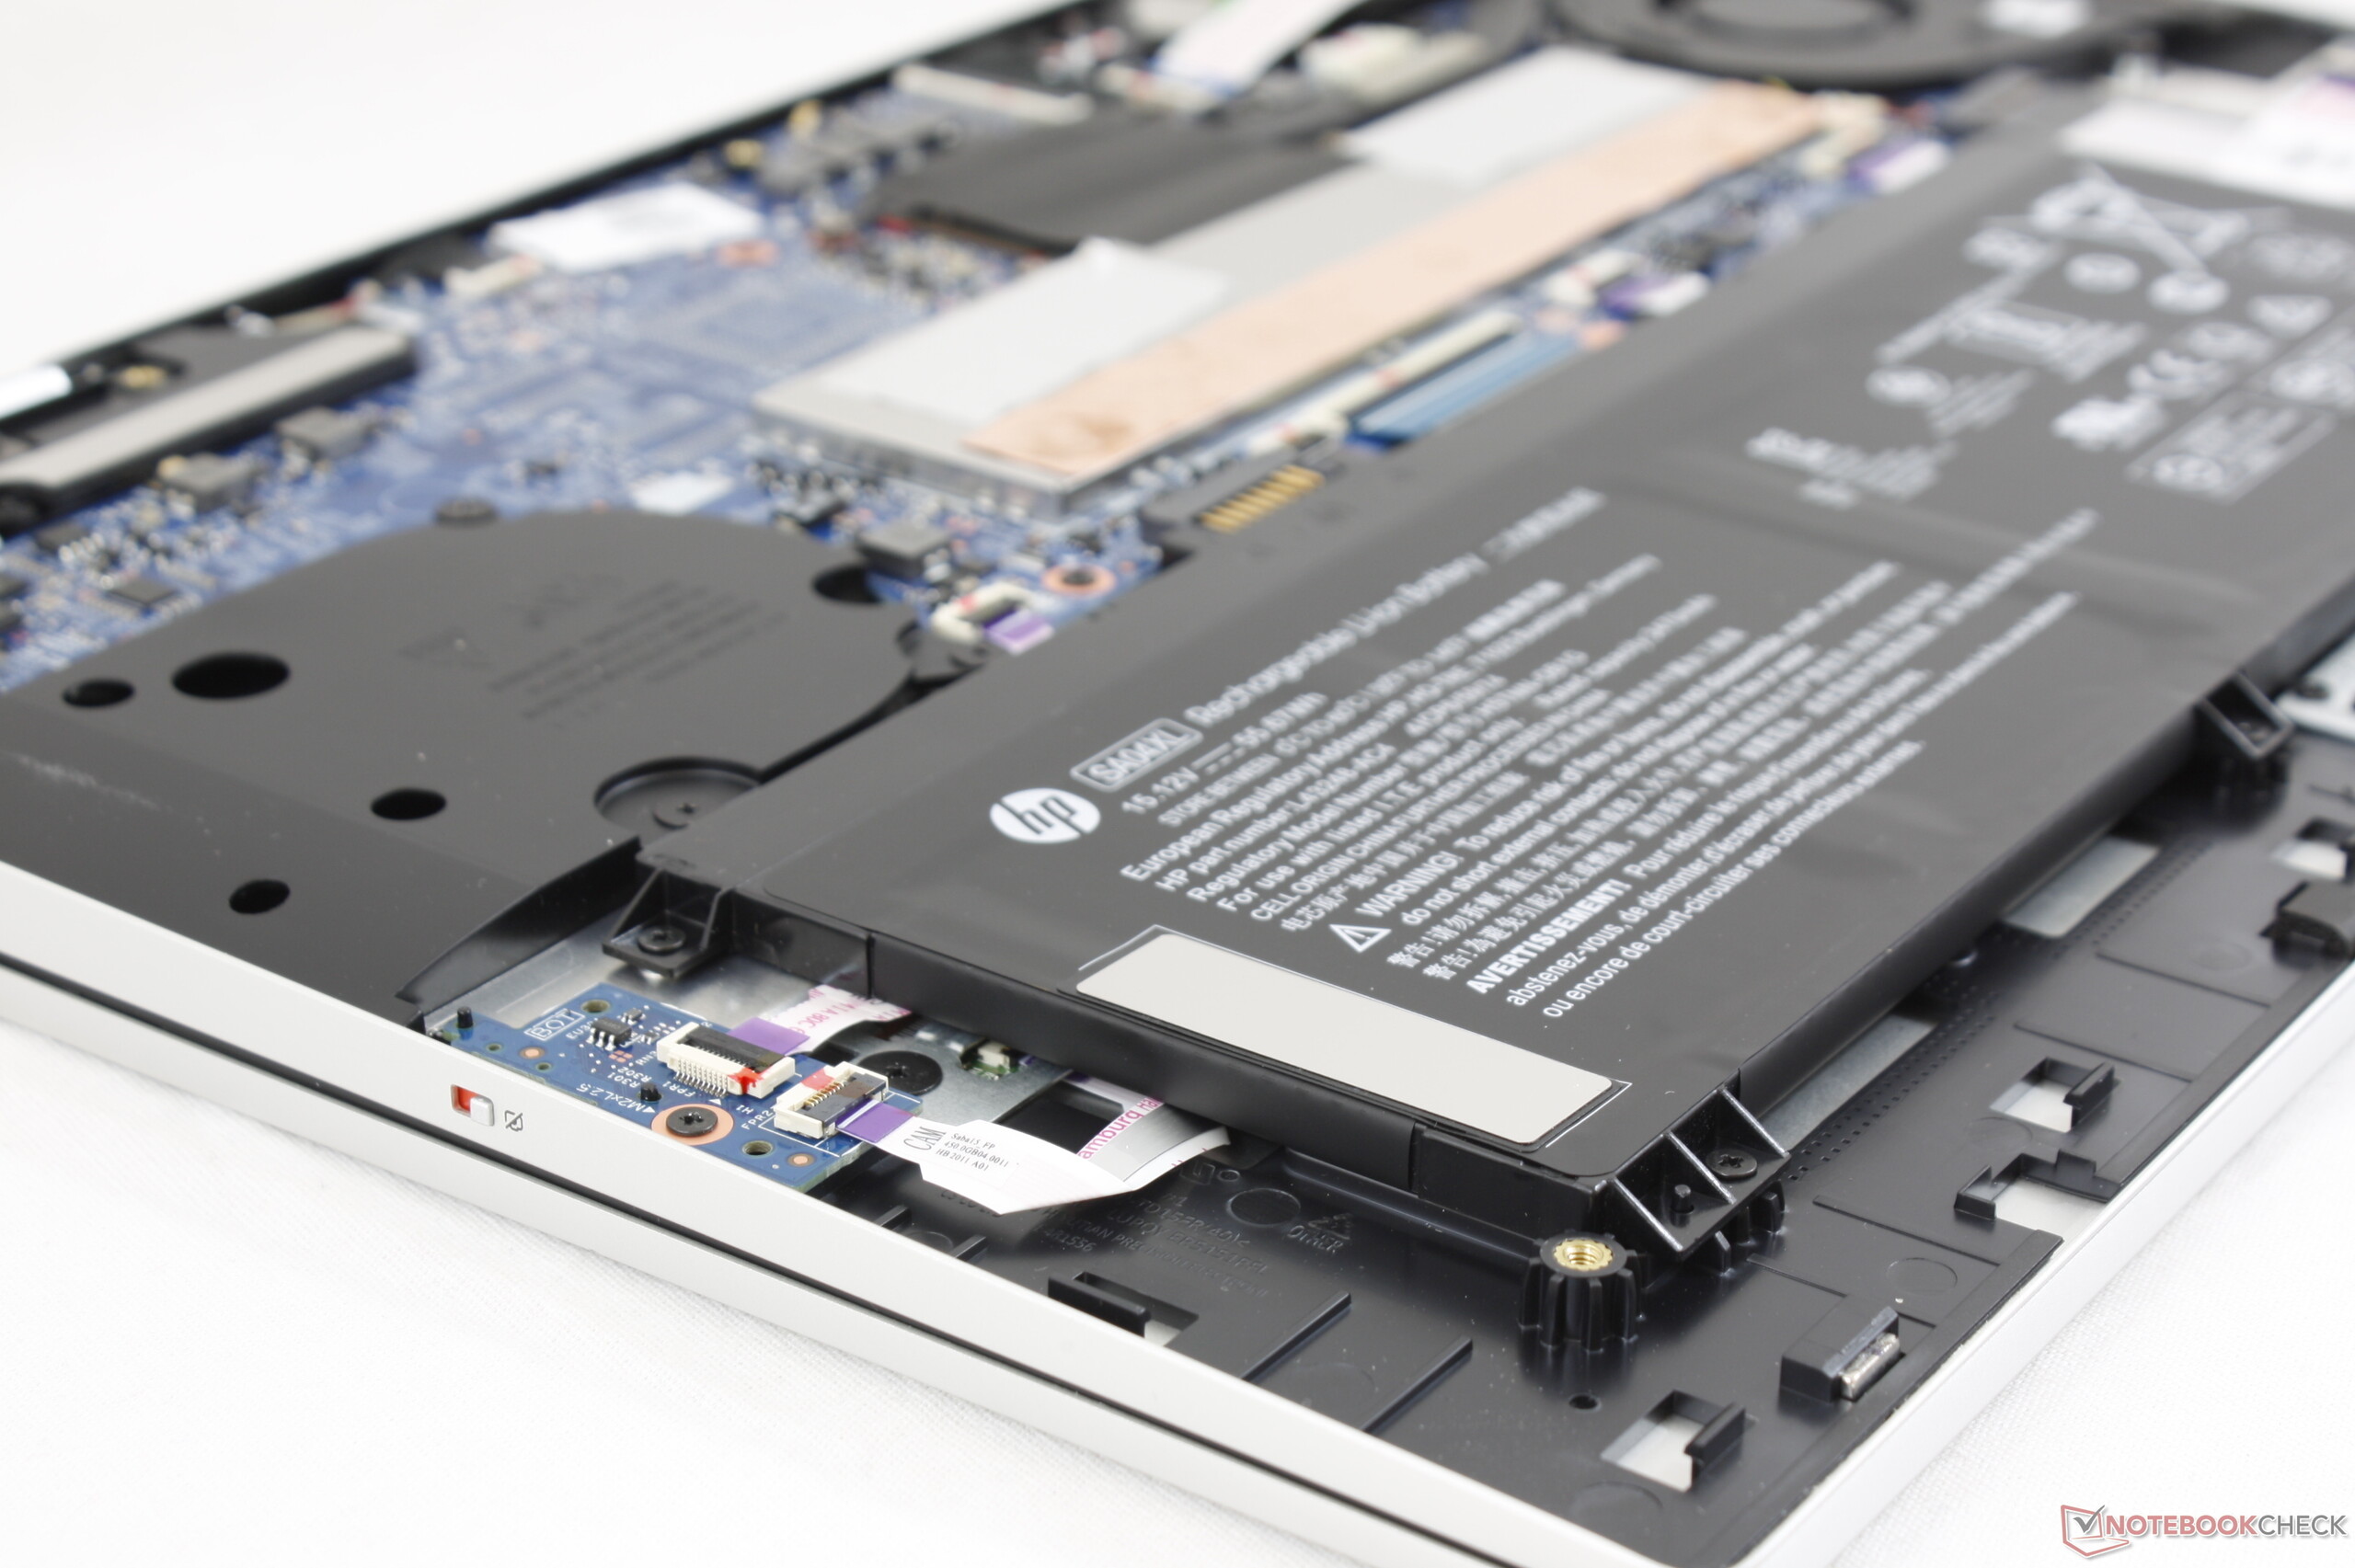
Envy x360 15-serien har stagnerat de senaste åren. Trots att chassit och processorerna ändrats har uppdateringarna i huvudsak varit kosmetiska och ökningen i prestanda har varit minimal. Du får konfigurera den med ett GeForce MX330 om du vill få ut mesta möjliga ur systemet då det grundläggande Core i7-alternativet med integrerad grafik inte är särskilt mycket bättre än de äldre modellerna med Core i7-8565U eller Ryzen.
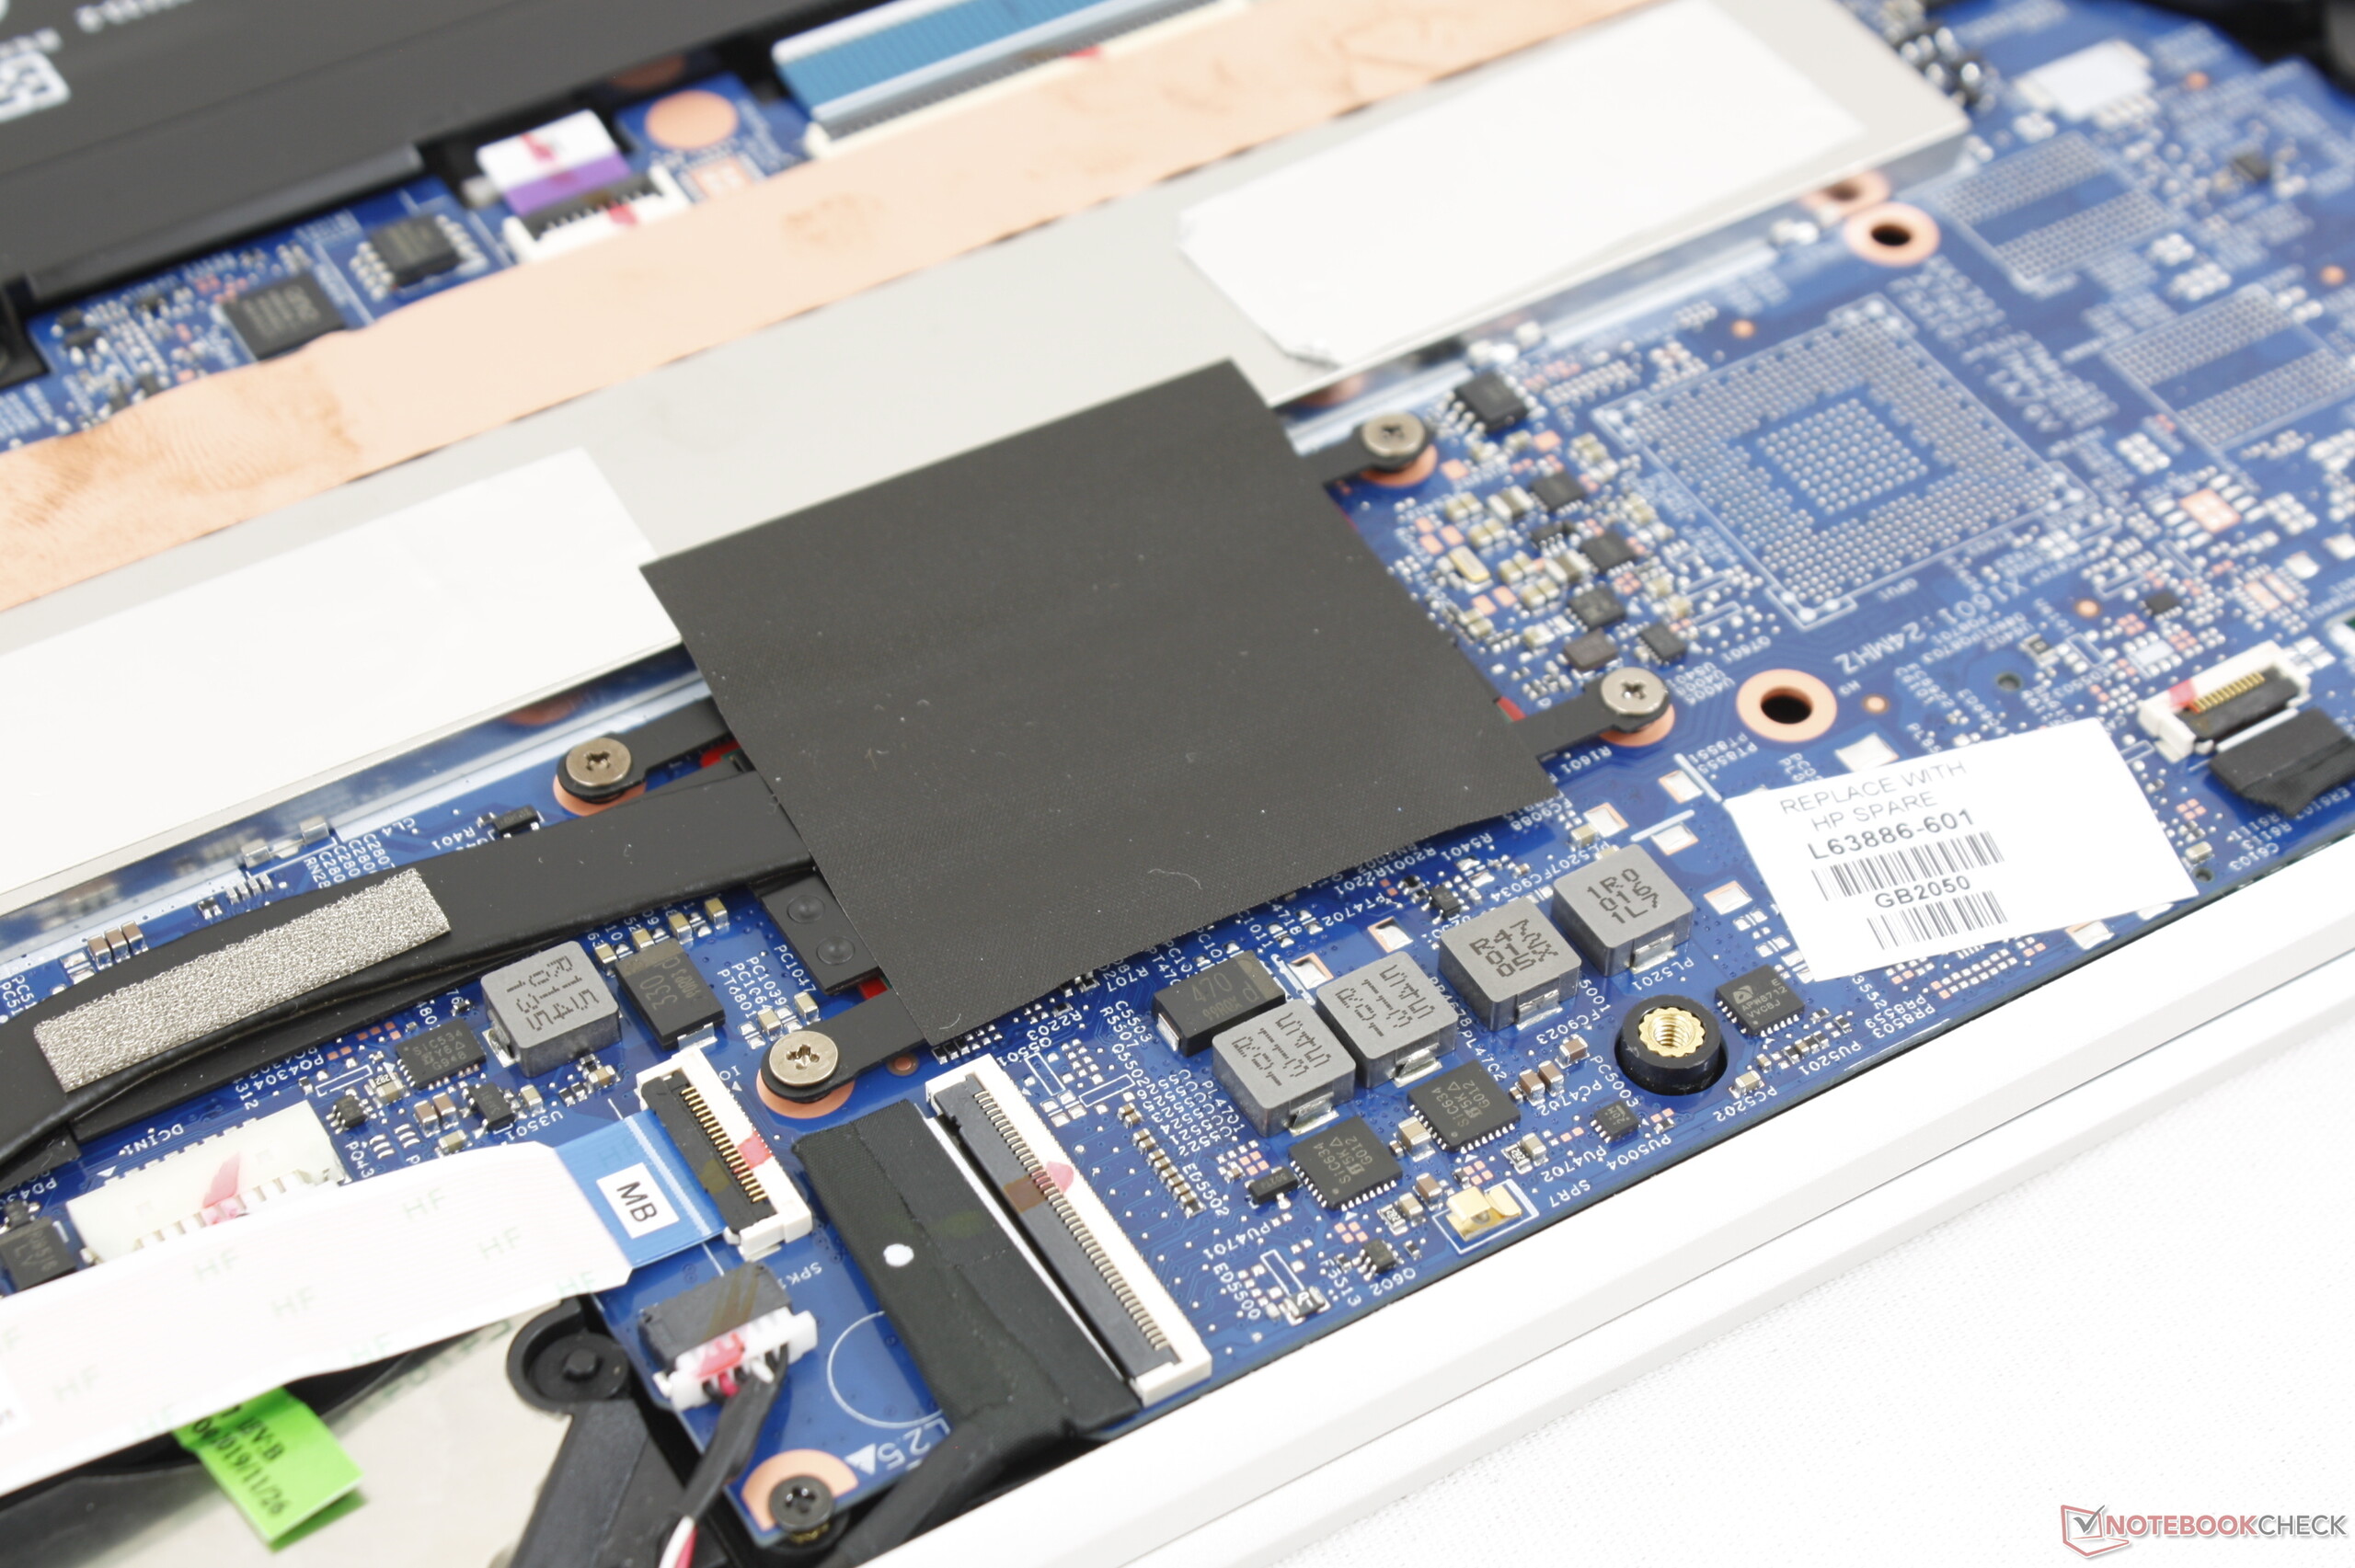
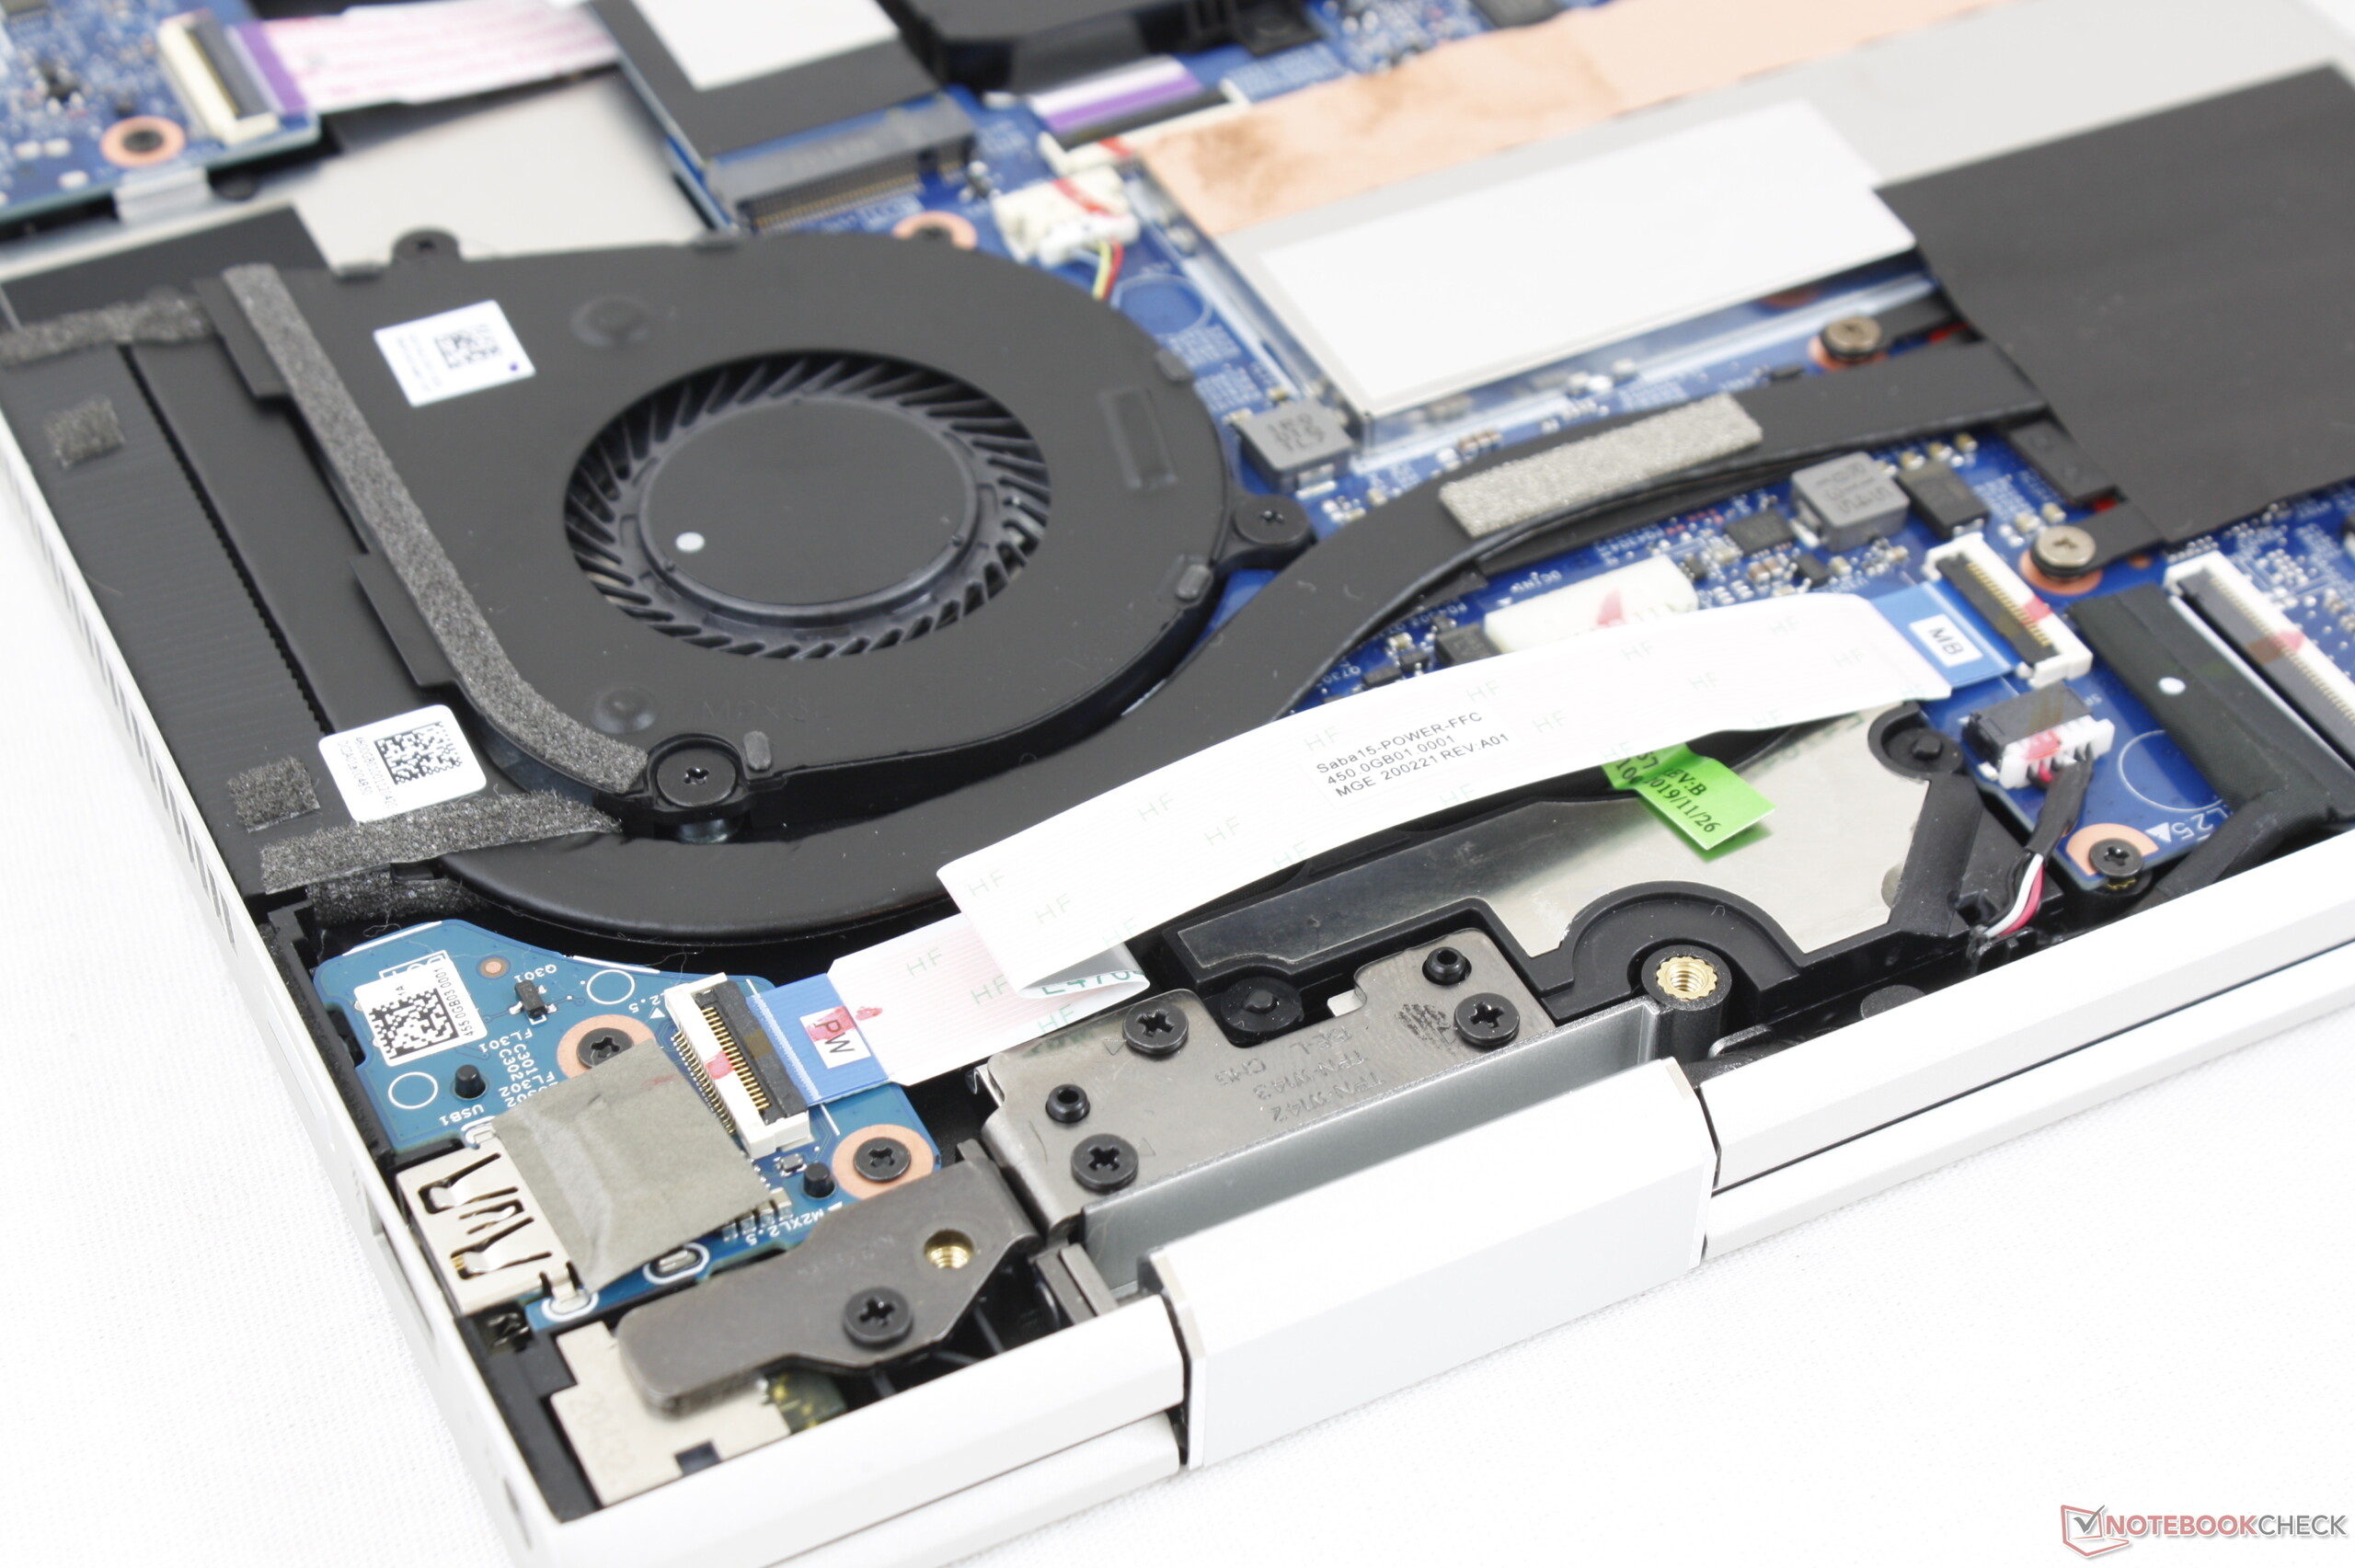
Vidare kvarstår många av problemen 2018 års Envy x360 15 led av, då HP inte åtgärdat dem. Den är fortfarande svår att serva och enkla procedurer som att uppgradera RAM eller lagring är mer frustrerande än de borde vara. Det finns fortfarande ingen knapp för att öppna HP Command Center, vilket är konstigt då systemprestandan är så tydligt kopplad till det programmet. Det är därför möjligt att äga datorn utan att ha någon aning om att programmet ens existerar.
På tal om HP Command Center är processorns prestanda medelmåttig när "Prestanda"-läget används och ligger under genomsnittet när det "Rekommenderade" läget används. CPU-prestandan är därför bara på den nivå vi förväntar oss som standard på andra modeller när energiprofilen och fläkten är på sina högsta inställningar.
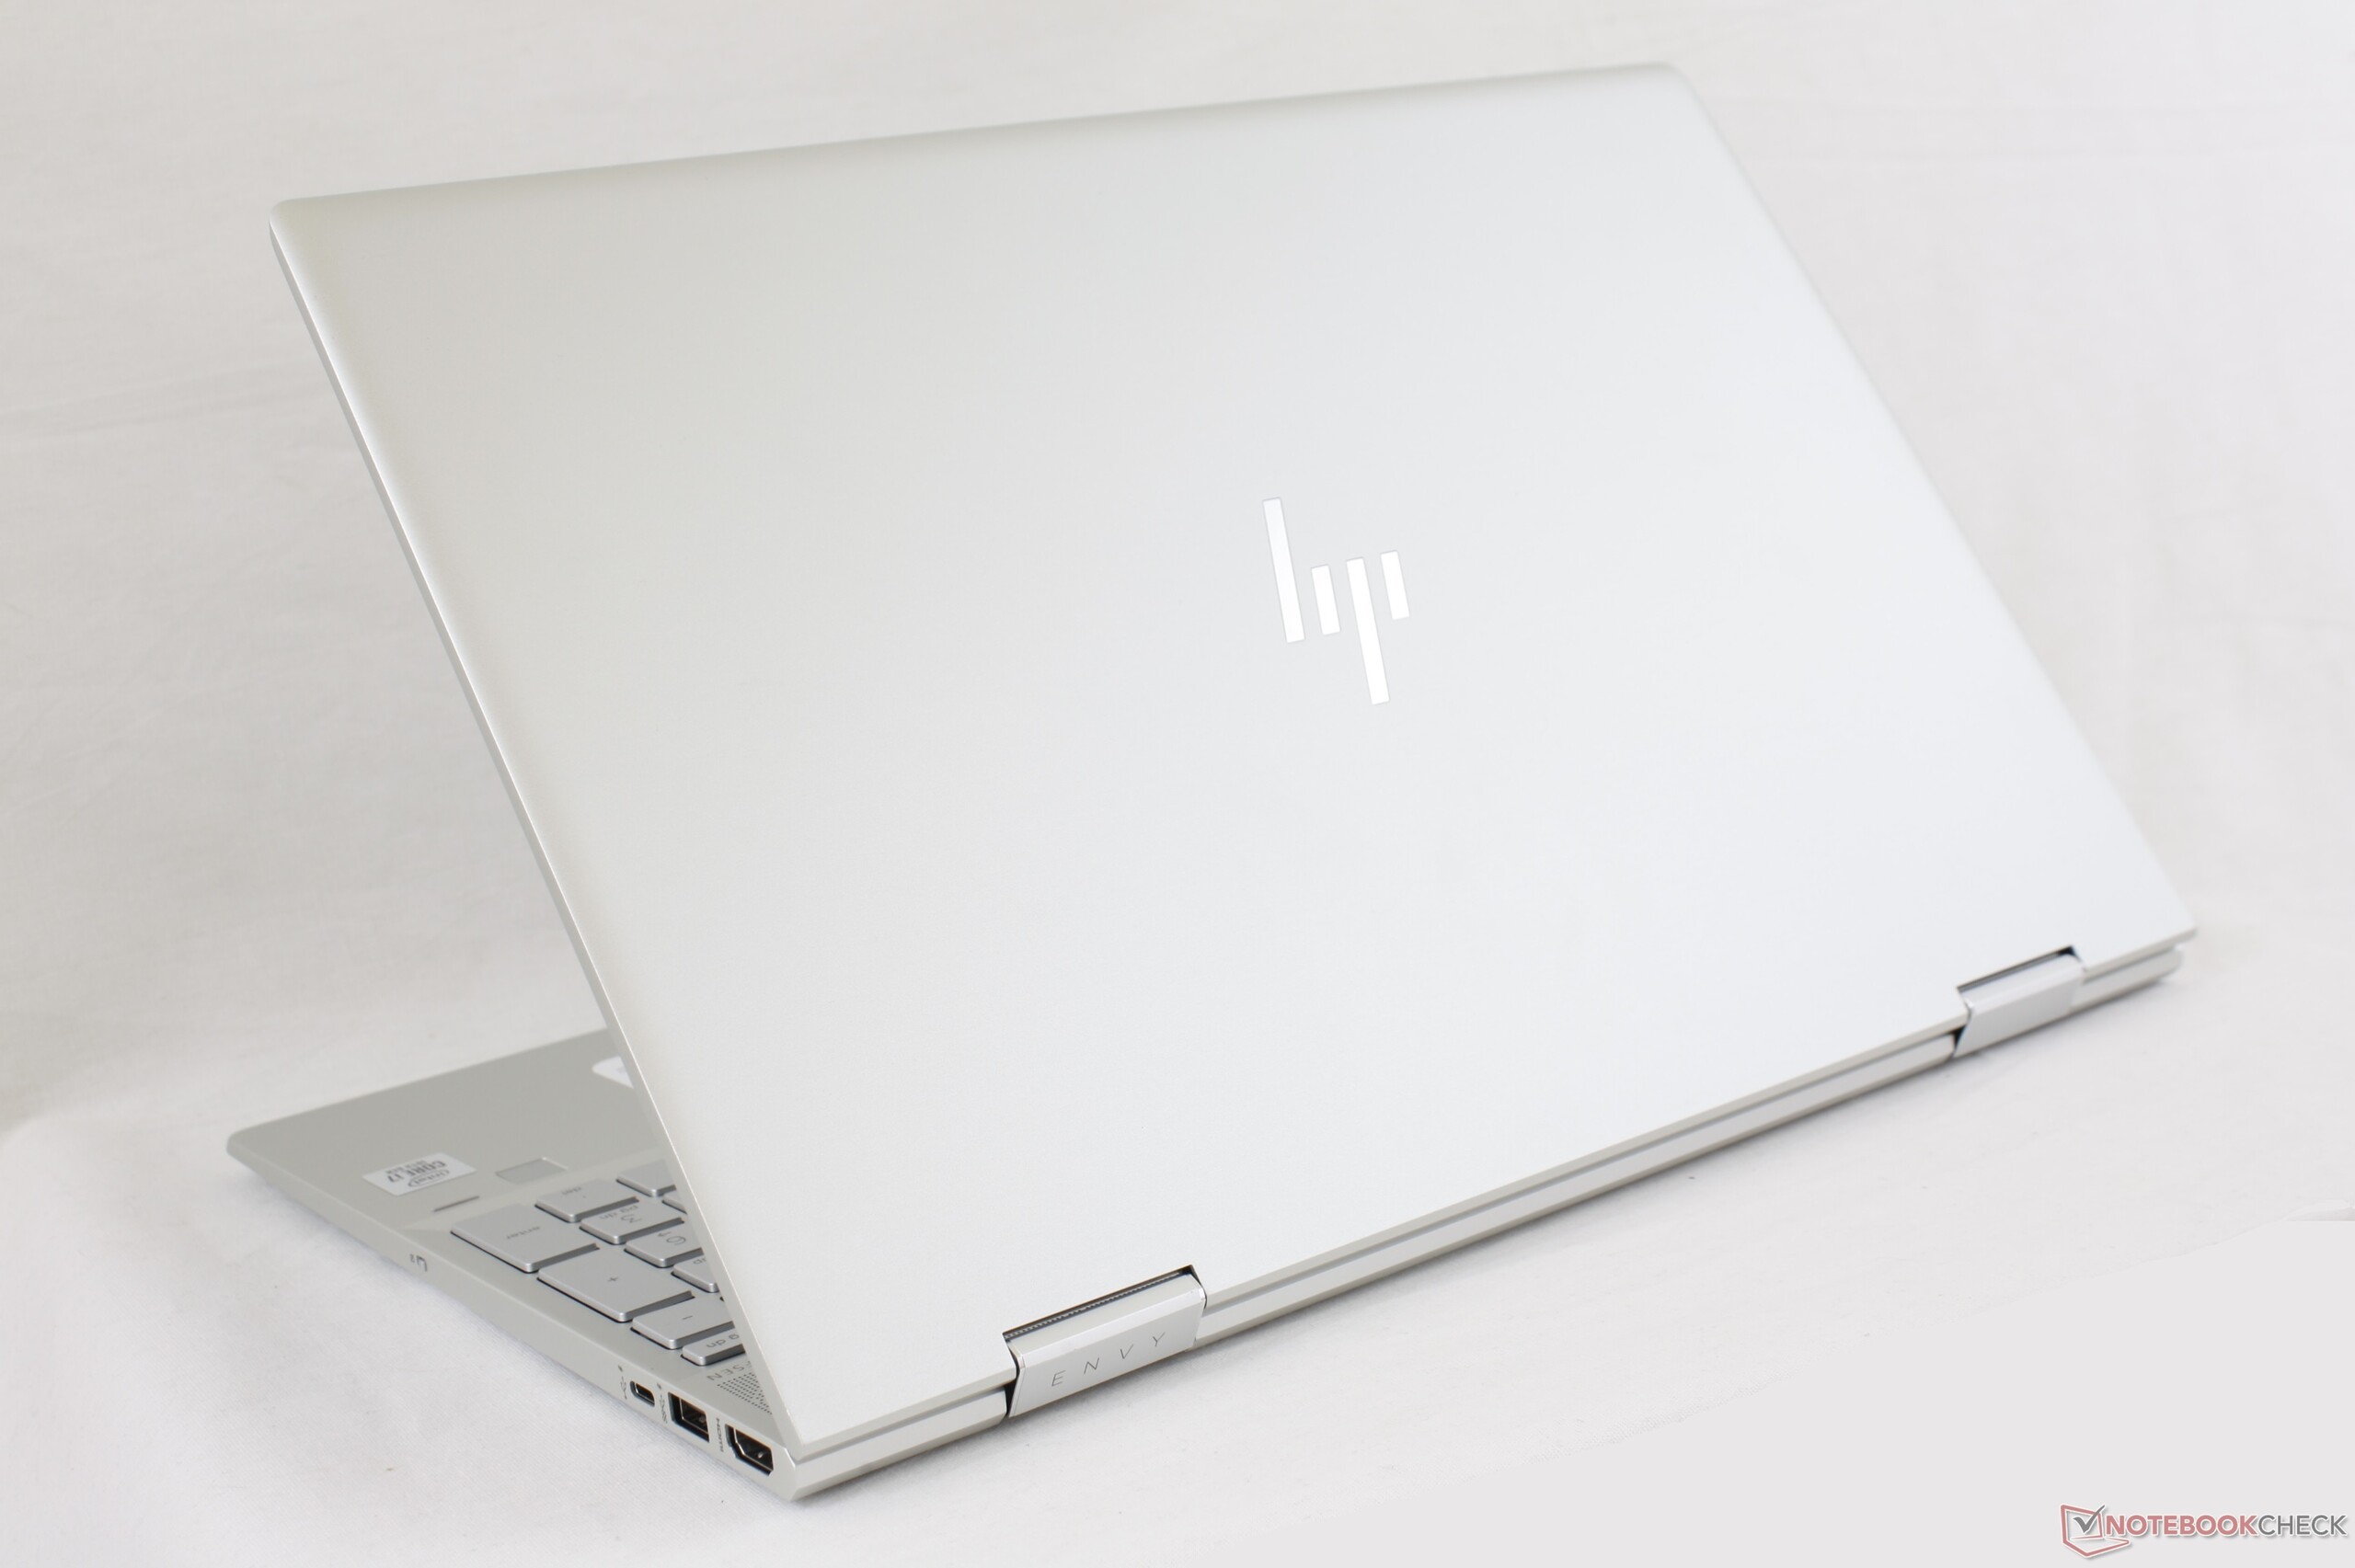
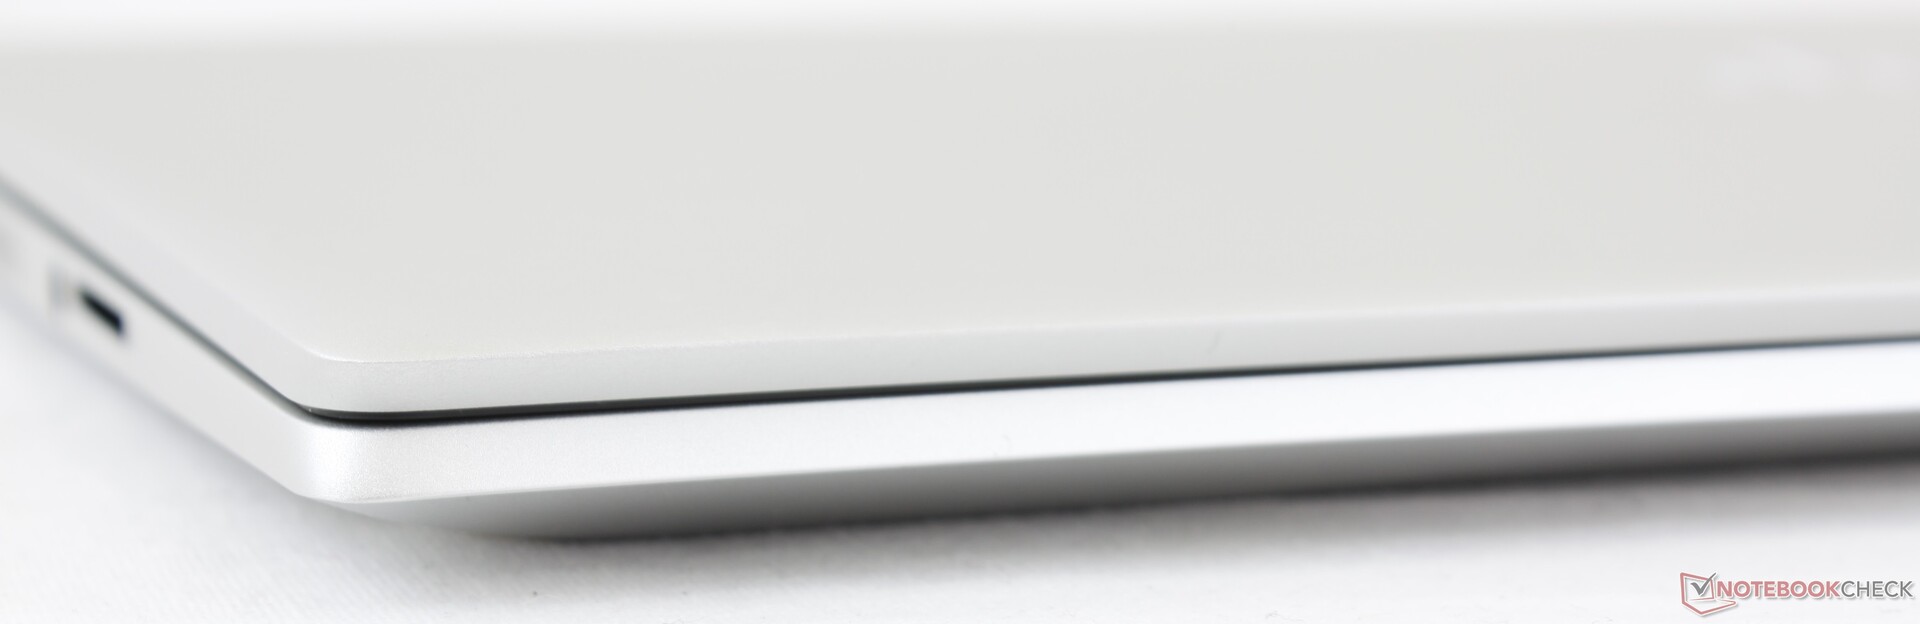
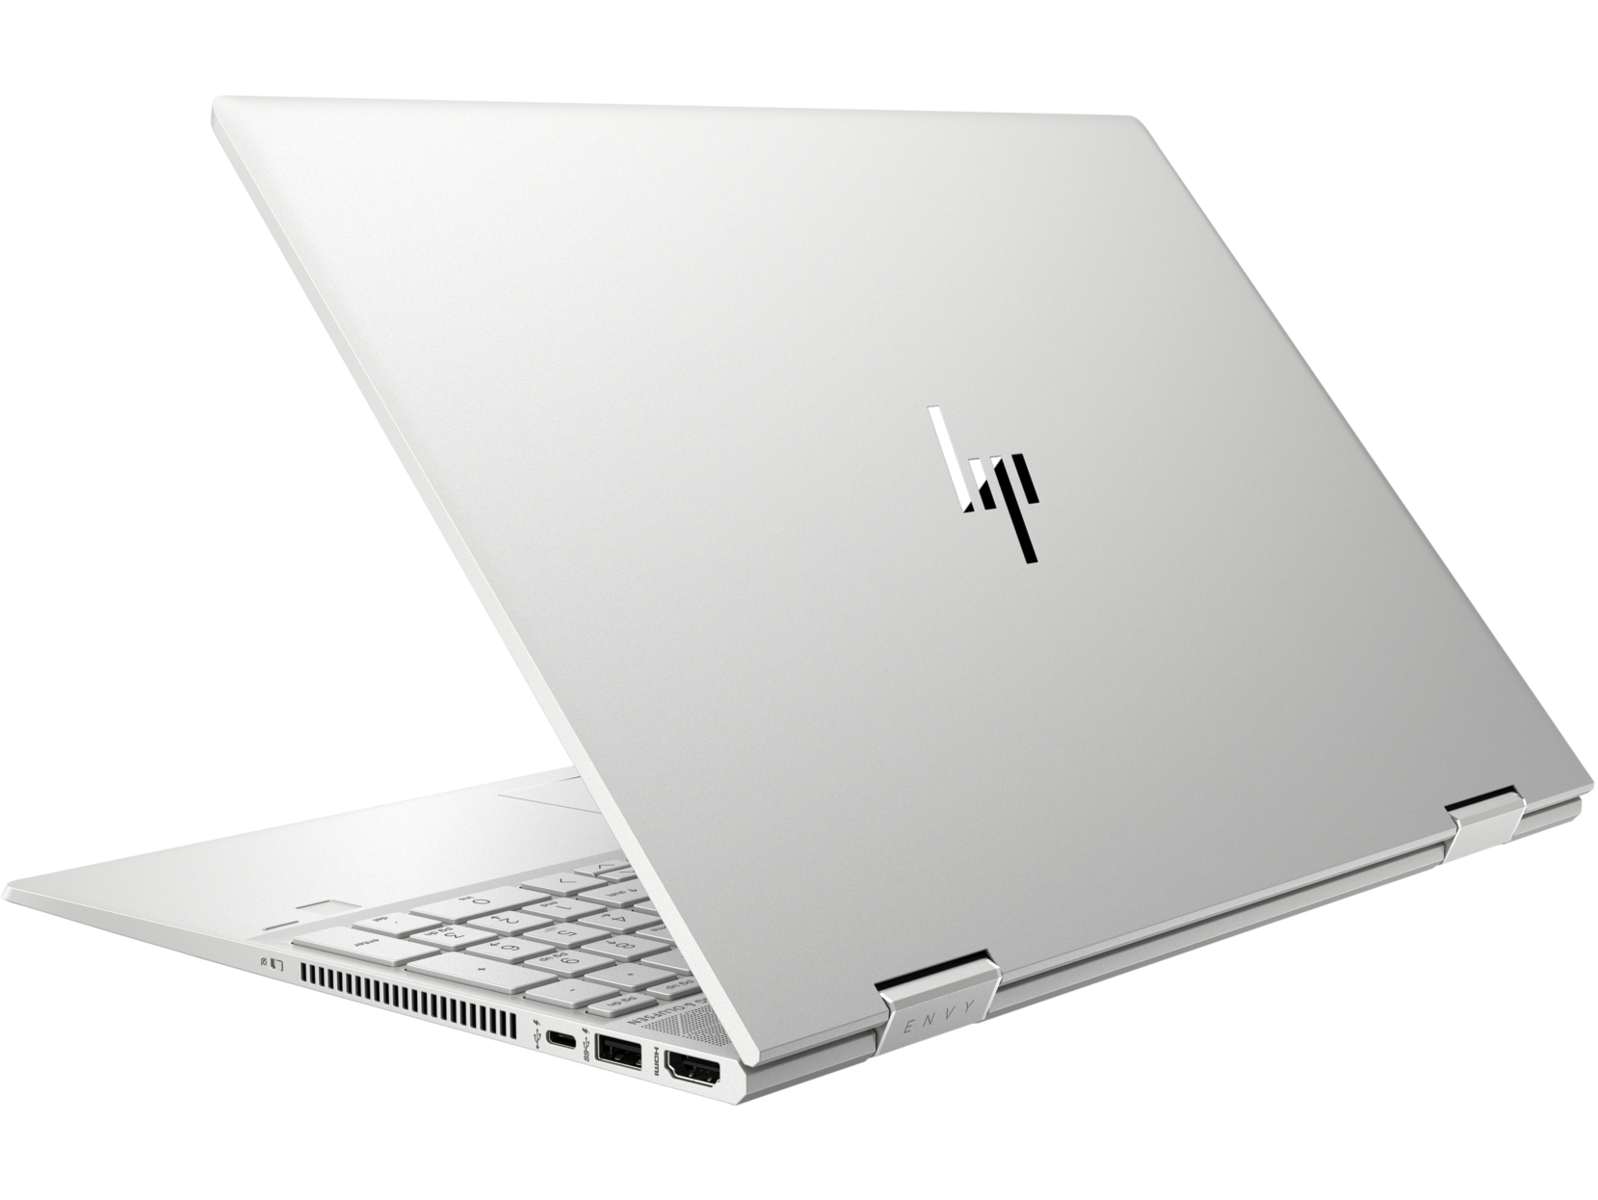
HP:s omvandlingsbara dator är känd för sin utmärkta konstruktionskvalitet och fasta chassi. Den är definitivt inte lätt, men det hjälper den att kännas starkare och robustare än motsvarigheterna från Lenovo, Acer och Asus.
Den har ett lågt utgångspris för att tilltala användare som bara vill ha en hyfsad laptop för epost och video. Om du inte tilltalas av GeForce MX330- eller AMOLED-alternativen kan du köpa den äldre versionen av Envy x360 15 istället för 2020 års version utan att missa särskilt mycket.
HP Envy x360 15-dr1679cl
- 06/18/2020 v7 (old)
Allen Ngo
Price comparison
