Test: Microsoft Surface Laptop 2 (Core i5, 256 GB) Laptop (Sammanfattning)
| |||||||||||||||||||||||||
Distribution av ljusstyrkan: 89 %
Mitt på batteriet: 392 cd/m²
Kontrast: 1633:1 (Svärta: 0.24 cd/m²)
ΔE ColorChecker Calman: 3.2 | ∀{0.5-29.43 Ø4.72}
calibrated: 1.4
ΔE Greyscale Calman: 4.5 | ∀{0.09-98 Ø4.97}
95% sRGB (Argyll 1.6.3 3D)
63.9% AdobeRGB 1998 (Argyll 1.6.3 3D)
69.2% AdobeRGB 1998 (Argyll 3D)
94.7% sRGB (Argyll 3D)
68% Display P3 (Argyll 3D)
Gamma: 2.2
CCT: 7556 K
| Microsoft Surface Laptop 2-LQN-00004 VVX14T092N00, , 2256x1504, 13.5" | Microsoft Surface Laptop i5 ID: MEI96A2, Name: Panasonic VVX14T092N00, , 2256x1504, 13.5" | Microsoft Surface Pro 6, Core i7, 512 GB LGPhilips LP123WQ112604, , 2736x1824, 12.3" | Dell XPS 13 9370 i5 UHD ID: Sharp SHP148B, Name: LQ133D1, Dell P/N: 8XDHY, , 3840x2160, 13.3" | Apple MacBook Air 2018 APPA039, , 2560x1600, 13.3" | Asus ZenBook S UX391U AUO B133HAN04.9, , 1920x1080, 13.3" | |
|---|---|---|---|---|---|---|
| Display | 0% | -1% | 2% | 1% | -5% | |
| Display P3 Coverage (%) | 68 | 67.8 0% | 67.1 -1% | 68.9 1% | 67.8 0% | 64.4 -5% |
| sRGB Coverage (%) | 94.7 | 94.3 0% | 95.5 1% | 98.4 4% | 96.1 1% | 90.5 -4% |
| AdobeRGB 1998 Coverage (%) | 69.2 | 69.5 0% | 67.9 -2% | 69.5 0% | 69.8 1% | 65.2 -6% |
| Response Times | 24% | 42% | 7% | 42% | 36% | |
| Response Time Grey 50% / Grey 80% * (ms) | 69.2 ? | 50.8 ? 27% | 43 ? 38% | 67.2 ? 3% | 39.6 ? 43% | 44.8 ? 35% |
| Response Time Black / White * (ms) | 46.4 ? | 37.2 ? 20% | 25 ? 46% | 41.6 ? 10% | 28 ? 40% | 29.2 ? 37% |
| PWM Frequency (Hz) | 22000 ? | 2500 ? | 113600 ? | |||
| Screen | 6% | -3% | -6% | 16% | -29% | |
| Brightness middle (cd/m²) | 392 | 384.2 -2% | 484 23% | 496.4 27% | 320 -18% | 299 -24% |
| Brightness (cd/m²) | 390 | 378 -3% | 473 21% | 469 20% | 315 -19% | 300 -23% |
| Brightness Distribution (%) | 89 | 90 1% | 91 2% | 84 -6% | 95 7% | 92 3% |
| Black Level * (cd/m²) | 0.24 | 0.36 -50% | 0.33 -38% | 0.5 -108% | 0.29 -21% | 0.26 -8% |
| Contrast (:1) | 1633 | 1067 -35% | 1467 -10% | 993 -39% | 1103 -32% | 1150 -30% |
| Colorchecker dE 2000 * | 3.2 | 1.8 44% | 4.29 -34% | 2.9 9% | 1.2 63% | 5.6 -75% |
| Colorchecker dE 2000 max. * | 6.3 | 4.2 33% | 6.46 -3% | 5.26 17% | 3.2 49% | 9.1 -44% |
| Colorchecker dE 2000 calibrated * | 1.4 | 1.34 4% | 0.5 64% | 2.6 -86% | ||
| Greyscale dE 2000 * | 4.5 | 1.2 73% | 4.3 4% | 3.9 13% | 0.8 82% | 5.5 -22% |
| Gamma | 2.2 100% | 2.21 100% | 2.51 88% | 2.066 106% | 2.2 100% | 2.47 89% |
| CCT | 7556 86% | 6708 97% | 7315 89% | 7169 91% | 6548 99% | 7533 86% |
| Color Space (Percent of AdobeRGB 1998) (%) | 63.9 | 63.7 0% | 62 -3% | 63.9 0% | 62.1 -3% | 58.9 -8% |
| Color Space (Percent of sRGB) (%) | 95 | 94.2 -1% | 95 0% | 98.2 3% | 96 1% | 90.3 -5% |
| Totalt genomsnitt (program/inställningar) | 10% /
7% | 13% /
3% | 1% /
-3% | 20% /
16% | 1% /
-17% |
* ... mindre är bättre
Visa svarstider
| ↔ Svarstid svart till vitt | ||
|---|---|---|
| 46.4 ms ... stiga ↗ och falla ↘ kombinerat | ↗ 26 ms stiga | 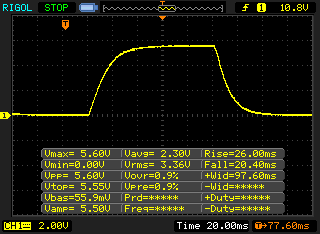 |
| ↘ 20.4 ms hösten | ||
| Skärmen visar långsamma svarsfrekvenser i våra tester och kommer att vara otillfredsställande för spelare. I jämförelse sträcker sig alla testade enheter från 0.1 (minst) till 240 (maximalt) ms. » 99 % av alla enheter är bättre. Detta innebär att den uppmätta svarstiden är sämre än genomsnittet av alla testade enheter (19.8 ms). | ||
| ↔ Svarstid 50 % grått till 80 % grått | ||
| 69.2 ms ... stiga ↗ och falla ↘ kombinerat | ↗ 34.8 ms stiga | 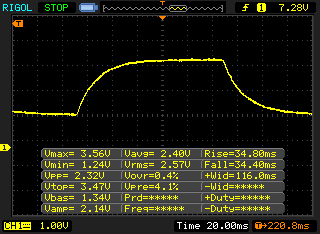 |
| ↘ 34.4 ms hösten | ||
| Skärmen visar långsamma svarsfrekvenser i våra tester och kommer att vara otillfredsställande för spelare. I jämförelse sträcker sig alla testade enheter från 0.165 (minst) till 636 (maximalt) ms. » 99 % av alla enheter är bättre. Detta innebär att den uppmätta svarstiden är sämre än genomsnittet av alla testade enheter (31 ms). | ||
Skärmflimmer / PWM (Puls-Width Modulation)
| Skärmflimmer / PWM upptäcktes inte | 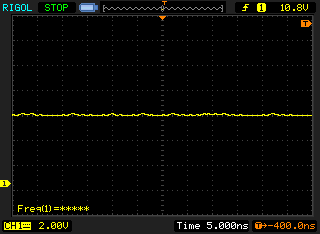 | ||
Som jämförelse: 52 % av alla testade enheter använder inte PWM för att dämpa skärmen. Om PWM upptäcktes mättes ett medelvärde av 7772 (minst: 5 - maximum: 343500) Hz. | |||

| PCMark 8 Home Score Accelerated v2 | 3153 poäng | |
| PCMark 8 Creative Score Accelerated v2 | 3927 poäng | |
| PCMark 8 Work Score Accelerated v2 | 4923 poäng | |
| PCMark 10 Score | 0 poäng | |
Hjälp | ||
| Microsoft Surface Laptop 2-LQN-00004 SK Hynix BC501 NVMe 256 GB | Microsoft Surface Pro 6, Core i7, 512 GB Toshiba KBG30ZPZ512G | Dell XPS 13 9370 i5 UHD Toshiba XG5 KXG50ZNV256G | Apple MacBook Air 2018 Apple SSD AP0256 | Asus ZenBook S UX391U Samsung PM961 NVMe MZVLW512HMJP | Genomsnitt SK Hynix BC501 NVMe 256 GB | |
|---|---|---|---|---|---|---|
| CrystalDiskMark 5.2 / 6 | -5% | 29% | 17% | 41% | 10% | |
| Write 4K (MB/s) | 87.3 | 83.2 -5% | 121.4 39% | 118 35% | 98.9 13% | 110 ? 26% |
| Read 4K (MB/s) | 36.52 | 43.84 20% | 33.42 -8% | 29.97 -18% | 38.33 5% | 36.6 ? 0% |
| Write Seq (MB/s) | 716 | 636 -11% | 385.3 -46% | 1000 40% | 1414 97% | 699 ? -2% |
| Read Seq (MB/s) | 1009 | 900 -11% | 1958 94% | 1218 21% | 1051 4% | 1057 ? 5% |
| Write 4K Q32T1 (MB/s) | 324.1 | 192.9 -40% | 375.7 16% | 232.1 -28% | 370.7 14% | 359 ? 11% |
| Read 4K Q32T1 (MB/s) | 249 | 247.4 -1% | 364.1 46% | 254 2% | 251.4 1% | 339 ? 36% |
| Write Seq Q32T1 (MB/s) | 811 | 861 6% | 1069 32% | 1001 23% | 1606 98% | 813 ? 0% |
| Read Seq Q32T1 (MB/s) | 1631 | 1615 -1% | 2564 57% | 2555 57% | 3218 97% | 1670 ? 2% |

| 3DMark 11 Performance | 2065 poäng | |
| 3DMark Cloud Gate Standard Score | 8910 poäng | |
| 3DMark Fire Strike Score | 1162 poäng | |
| 3DMark Time Spy Score | 446 poäng | |
Hjälp | ||
| låg | med. | hög | ultra | |
|---|---|---|---|---|
| BioShock Infinite (2013) | 55.6 | 34.1 | 29.5 | 9.2 |
| The Witcher 3 (2015) | 16.6 | |||
| Rocket League (2017) | 93.9 | 34.8 | 21.6 |
Ljudnivå
| Låg belastning |
| 28.7 / 28.7 / 28.7 dB(A) |
| Hög belastning |
| 30 / 32.9 dB(A) |
 | ||
30 dB tyst 40 dB(A) hörbar 50 dB(A) högt ljud |
||
min: | ||
| Microsoft Surface Laptop 2-LQN-00004 UHD Graphics 620, i5-8250U, SK Hynix BC501 NVMe 256 GB | Microsoft Surface Laptop i5 HD Graphics 620, i5-7200U, Toshiba THNSN0128GTYA | Microsoft Surface Pro 6, Core i7, 512 GB UHD Graphics 620, i7-8650U, Toshiba KBG30ZPZ512G | Dell XPS 13 9370 i5 UHD UHD Graphics 620, i5-8250U, Toshiba XG5 KXG50ZNV256G | Apple MacBook Air 2018 UHD Graphics 617, i5-8210Y, Apple SSD AP0256 | Asus ZenBook S UX391U UHD Graphics 620, i5-8550U, Samsung PM961 NVMe MZVLW512HMJP | |
|---|---|---|---|---|---|---|
| Noise | -3% | -6% | -6% | -4% | -8% | |
| av / miljö * (dB) | 28.7 | 28.2 2% | 30.3 -6% | 29 -1% | 28.5 1% | 29.7 -3% |
| Idle Minimum * (dB) | 28.7 | 28.2 2% | 30.3 -6% | 29 -1% | 28.5 1% | 29.7 -3% |
| Idle Average * (dB) | 28.7 | 28.2 2% | 30.3 -6% | 29 -1% | 28.5 1% | 29.7 -3% |
| Idle Maximum * (dB) | 28.7 | 29 -1% | 30.3 -6% | 29 -1% | 28.5 1% | 30.1 -5% |
| Load Average * (dB) | 30 | 30.3 -1% | 33.5 -12% | 32 -7% | 30 -0% | 36.8 -23% |
| Load Maximum * (dB) | 32.9 | 39.3 -19% | 33.5 -2% | 40.1 -22% | 41.8 -27% | 36.8 -12% |
* ... mindre är bättre
(+) Den maximala temperaturen på ovansidan är 39.3 °C / 103 F, jämfört med genomsnittet av 35.9 °C / 97 F , allt från 21.4 till 59 °C för klassen Subnotebook.
(±) Botten värms upp till maximalt 42 °C / 108 F, jämfört med genomsnittet av 39.2 °C / 103 F
(+) Vid tomgångsbruk är medeltemperaturen för ovansidan 23 °C / 73 F, jämfört med enhetsgenomsnittet på 30.8 °C / ### class_avg_f### F.
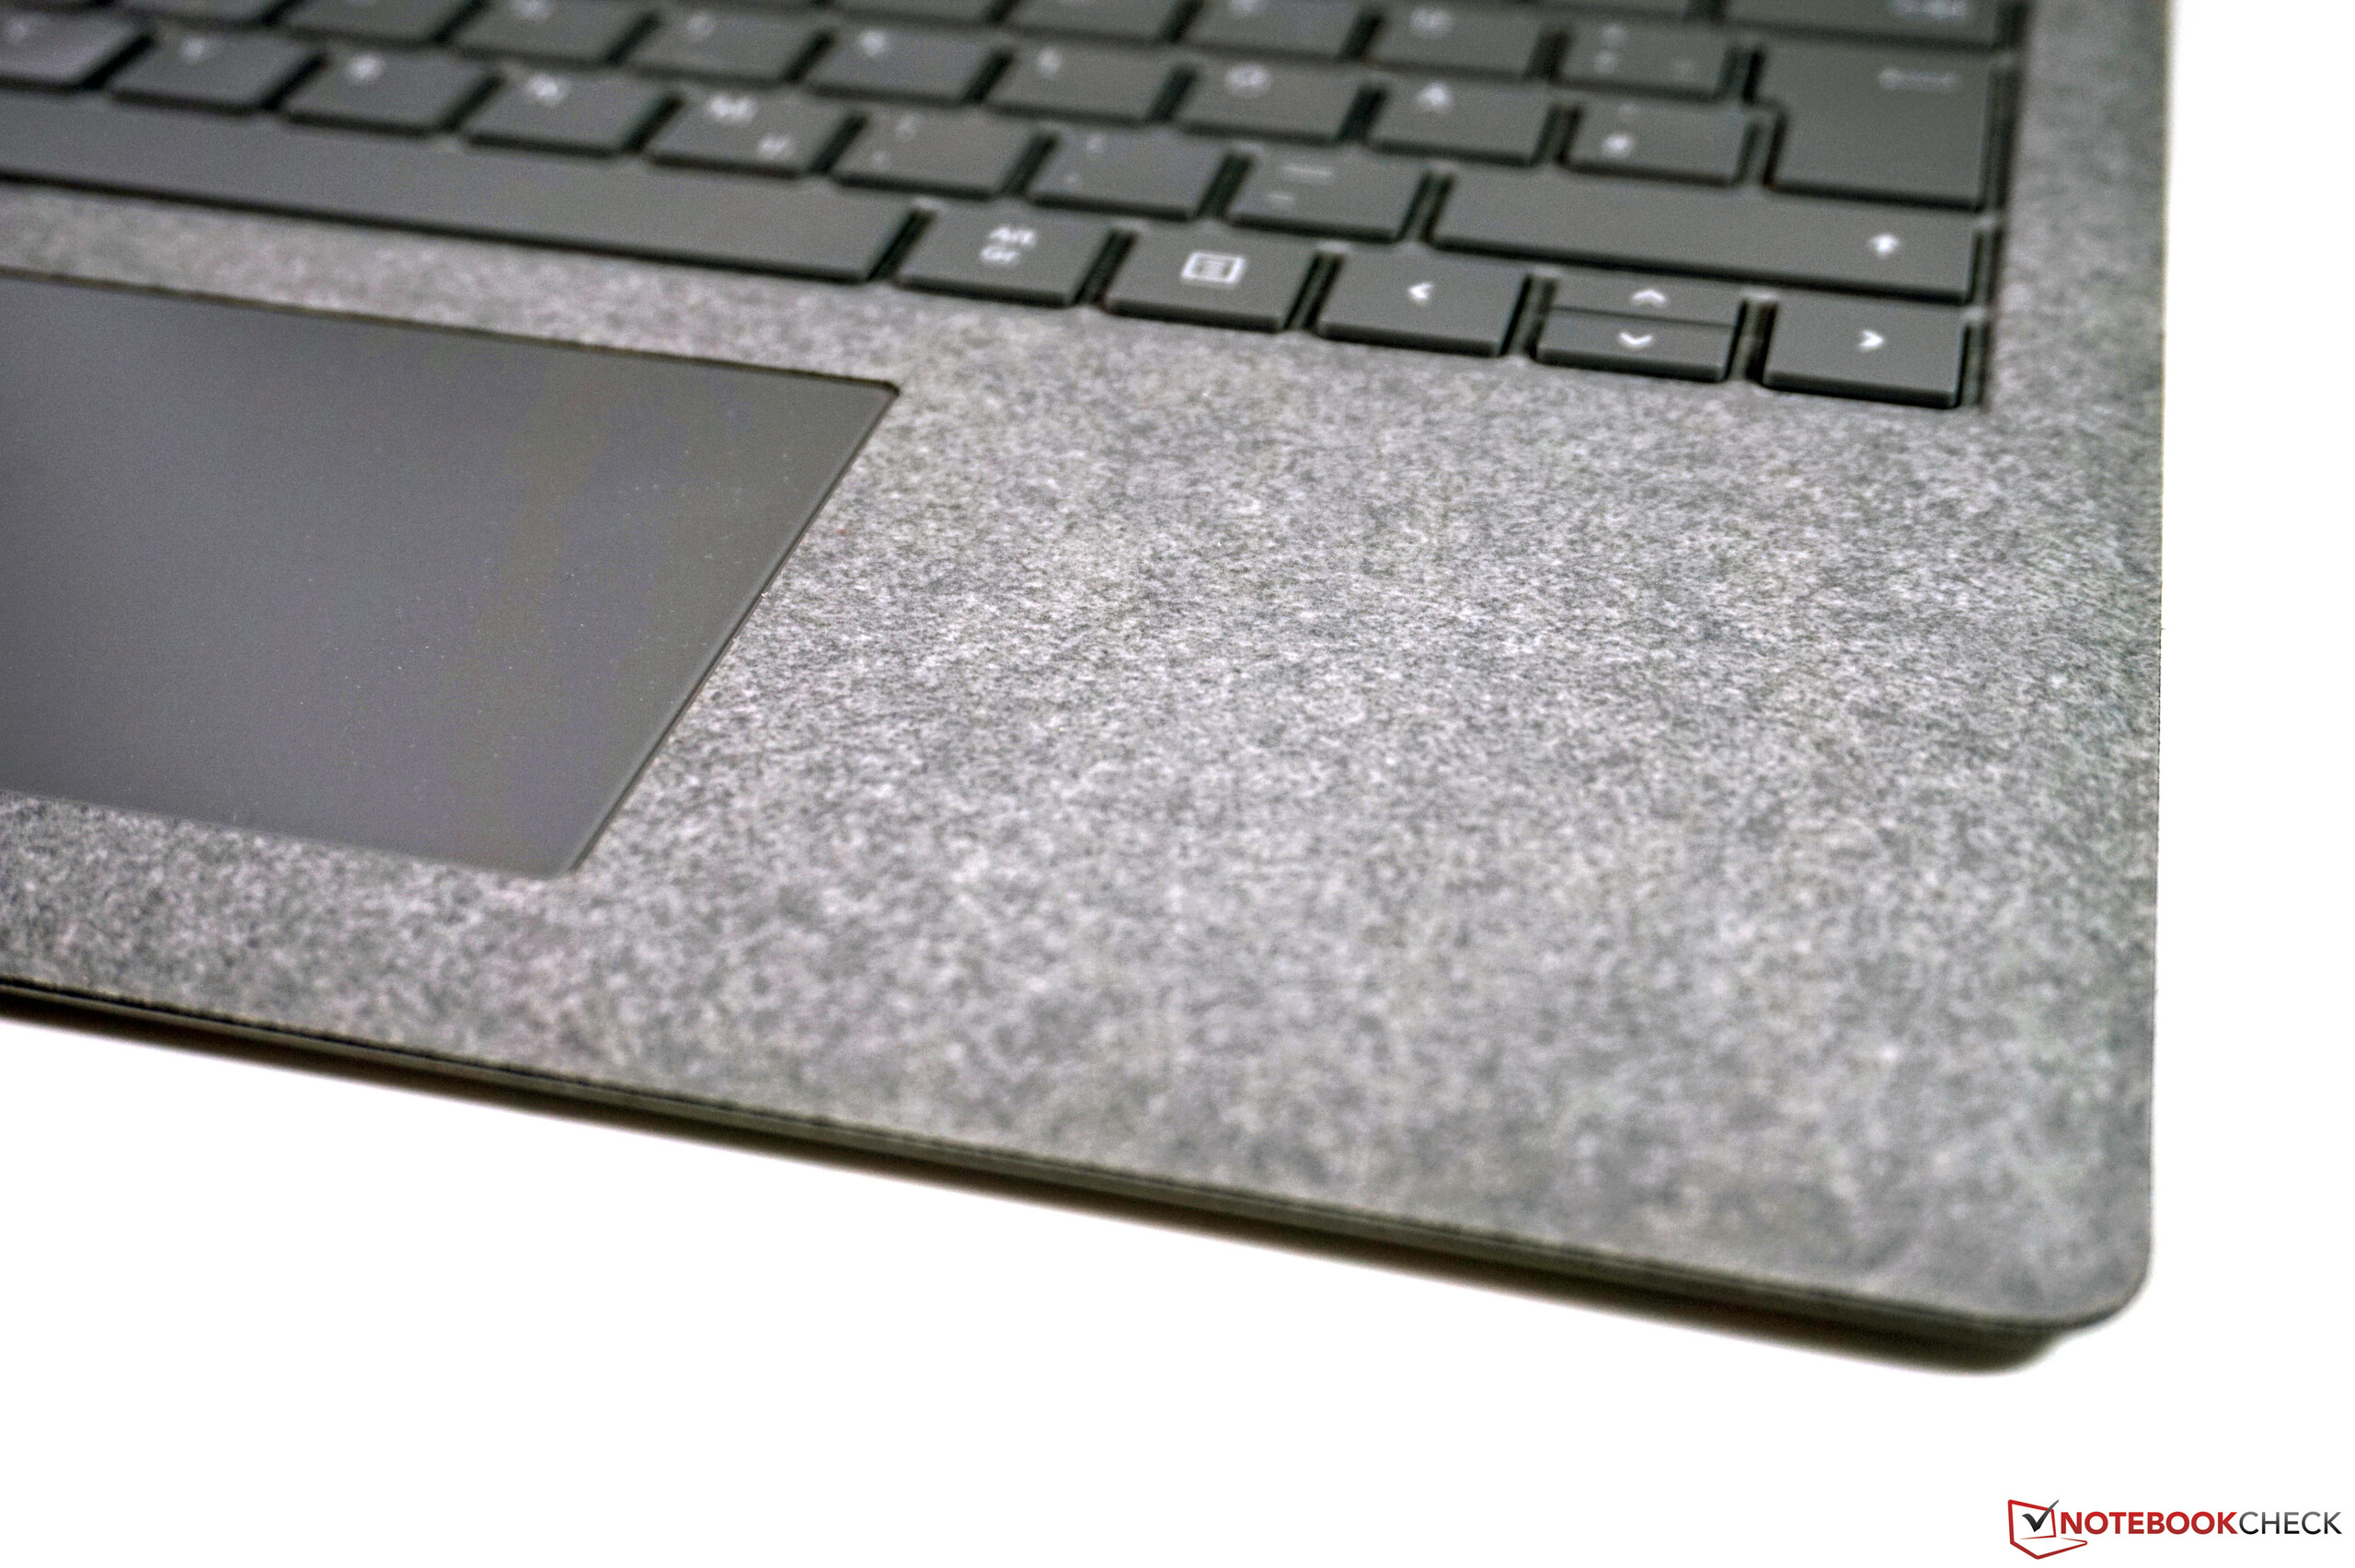
(+) Handledsstöden och pekplattan är kallare än hudtemperaturen med maximalt 29.2 °C / 84.6 F och är därför svala att ta på.
(±) Medeltemperaturen för handledsstödsområdet på liknande enheter var 28.2 °C / 82.8 F (-1 °C / -1.8 F).
Microsoft Surface Laptop 2-LQN-00004 ljudanalys
(±) | högtalarljudstyrkan är genomsnittlig men bra (72 dB)
Bas 100 - 315 Hz
(±) | reducerad bas - i genomsnitt 10.5% lägre än medianen
(±) | linjäriteten för basen är genomsnittlig (12.2% delta till föregående frekvens)
Mellan 400 - 2000 Hz
(+) | balanserad mellan - endast 2.7% från medianen
(+) | mids är linjära (4.2% delta till föregående frekvens)
Högsta 2 - 16 kHz
(+) | balanserade toppar - endast 1.4% från medianen
(+) | toppar är linjära (4.7% delta till föregående frekvens)
Totalt 100 - 16 000 Hz
(+) | det totala ljudet är linjärt (14.5% skillnad mot median)
Jämfört med samma klass
» 29% av alla testade enheter i den här klassen var bättre, 6% liknande, 65% sämre
» Den bästa hade ett delta på 5%, genomsnittet var 18%, sämst var 53%
Jämfört med alla testade enheter
» 18% av alla testade enheter var bättre, 4% liknande, 78% sämre
» Den bästa hade ett delta på 4%, genomsnittet var 24%, sämst var 134%
Apple MacBook Air 2018 ljudanalys
(±) | högtalarljudstyrkan är genomsnittlig men bra (75 dB)
Bas 100 - 315 Hz
(±) | reducerad bas - i genomsnitt 8.1% lägre än medianen
(±) | linjäriteten för basen är genomsnittlig (10% delta till föregående frekvens)
Mellan 400 - 2000 Hz
(+) | balanserad mellan - endast 2.9% från medianen
(+) | mids är linjära (5.6% delta till föregående frekvens)
Högsta 2 - 16 kHz
(+) | balanserade toppar - endast 2.2% från medianen
(+) | toppar är linjära (4.5% delta till föregående frekvens)
Totalt 100 - 16 000 Hz
(+) | det totala ljudet är linjärt (12.3% skillnad mot median)
Jämfört med samma klass
» 16% av alla testade enheter i den här klassen var bättre, 5% liknande, 80% sämre
» Den bästa hade ett delta på 5%, genomsnittet var 18%, sämst var 53%
Jämfört med alla testade enheter
» 10% av alla testade enheter var bättre, 3% liknande, 87% sämre
» Den bästa hade ett delta på 4%, genomsnittet var 24%, sämst var 134%
| Av/Standby | |
| Låg belastning | |
| Hög belastning |
|
Förklaring:
min: | |
| Microsoft Surface Laptop 2-LQN-00004 i5-8250U, UHD Graphics 620, SK Hynix BC501 NVMe 256 GB, IPS, 2256x1504, 13.5" | Microsoft Surface Laptop i5 i5-7200U, HD Graphics 620, Toshiba THNSN0128GTYA, IPS, 2256x1504, 13.5" | Microsoft Surface Pro 6, Core i7, 512 GB i7-8650U, UHD Graphics 620, Toshiba KBG30ZPZ512G, IPS, 2736x1824, 12.3" | Dell XPS 13 9370 i5 UHD i5-8250U, UHD Graphics 620, Toshiba XG5 KXG50ZNV256G, IPS, 3840x2160, 13.3" | Apple MacBook Air 2018 i5-8210Y, UHD Graphics 617, Apple SSD AP0256, IPS, 2560x1600, 13.3" | Asus ZenBook S UX391U i5-8550U, UHD Graphics 620, Samsung PM961 NVMe MZVLW512HMJP, IPS, 1920x1080, 13.3" | Genomsnitt Intel UHD Graphics 620 | Genomsnitt av klass Subnotebook | |
|---|---|---|---|---|---|---|---|---|
| Power Consumption | 11% | -7% | -21% | 16% | -7% | -8% | -18% | |
| Idle Minimum * (Watt) | 3 | 3.2 -7% | 3.2 -7% | 4.3 -43% | 2.2 27% | 3.24 -8% | 3.81 ? -27% | 3.86 ? -29% |
| Idle Average * (Watt) | 6.8 | 6.5 4% | 8.7 -28% | 8 -18% | 5.7 16% | 6.1 10% | 6.94 ? -2% | 6.61 ? 3% |
| Idle Maximum * (Watt) | 8.76 | 6.8 22% | 10.4 -19% | 8.1 8% | 10.3 -18% | 9.2 -5% | 8.75 ? -0% | 8 ? 9% |
| Load Average * (Watt) | 35.1 | 28.2 20% | 29.2 17% | 46.6 -33% | 25.6 27% | 38.8 -11% | 35 ? -0% | 42.2 ? -20% |
| Load Maximum * (Watt) | 42.6 | 36 15% | 40.8 4% | 49.8 -17% | 30.6 28% | 52.6 -23% | 47.5 ? -12% | 64.5 ? -51% |
* ... mindre är bättre
| Microsoft Surface Laptop 2-LQN-00004 i5-8250U, UHD Graphics 620, 45 Wh | Microsoft Surface Laptop i5 i5-7200U, HD Graphics 620, 45 Wh | Microsoft Surface Pro 6, Core i7, 512 GB i7-8650U, UHD Graphics 620, 45 Wh | Dell XPS 13 9370 i5 UHD i5-8250U, UHD Graphics 620, 52 Wh | Apple MacBook Air 2018 i5-8210Y, UHD Graphics 617, 50.3 Wh | Asus ZenBook S UX391U i5-8550U, UHD Graphics 620, 50 Wh | Genomsnitt av klass Subnotebook | |
|---|---|---|---|---|---|---|---|
| Batteridrifttid | 16% | 6% | -14% | 17% | -2% | 32% | |
| Reader / Idle (h) | 20.8 | 22.5 8% | 18.1 -13% | 14.5 -30% | 22.3 7% | 28.6 ? 38% | |
| H.264 (h) | 13.6 | 12.3 -10% | 10.4 -24% | 15.4 ? 13% | |||
| WiFi v1.3 (h) | 9.1 | 10 10% | 8.5 -7% | 6.8 -25% | 11.1 22% | 8.2 -10% | 14 ? 54% |
| Load (h) | 1.6 | 2.1 31% | 2.2 38% | 1.8 13% | 2.2 38% | 1.9 19% | 1.969 ? 23% |
För
Emot
Läs den fullständiga versionen av den här recensionen på engelska här.
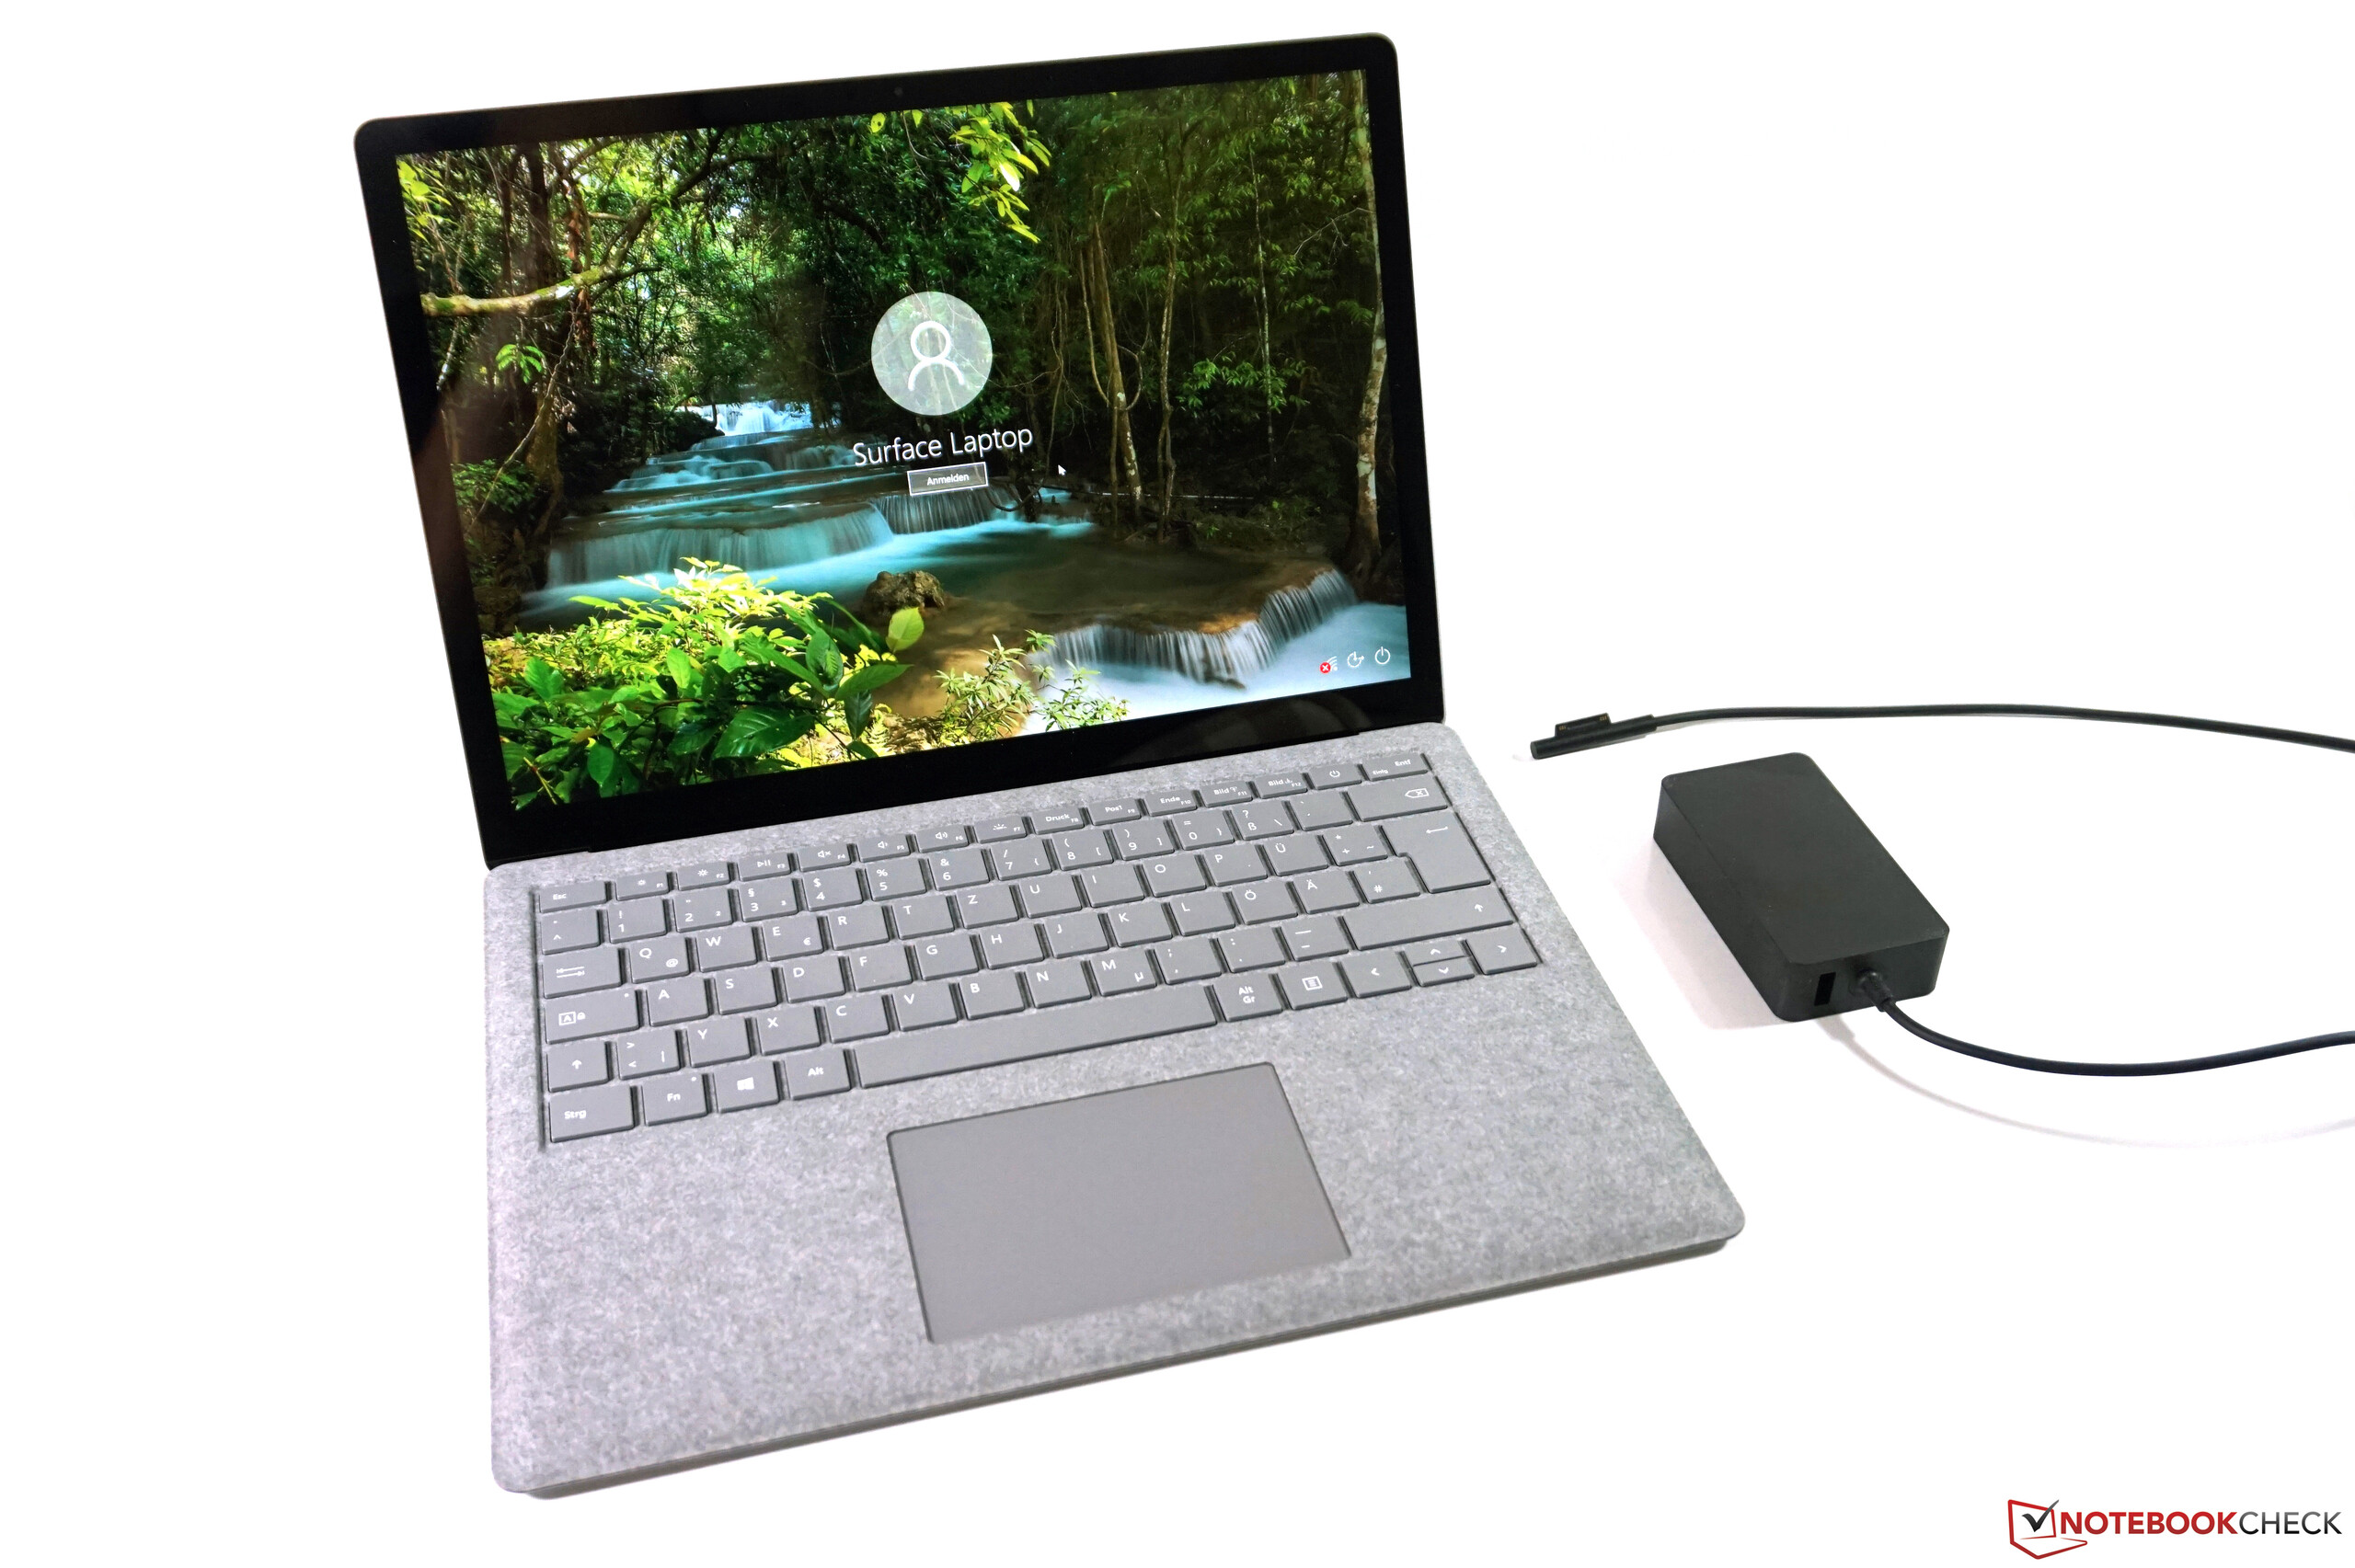
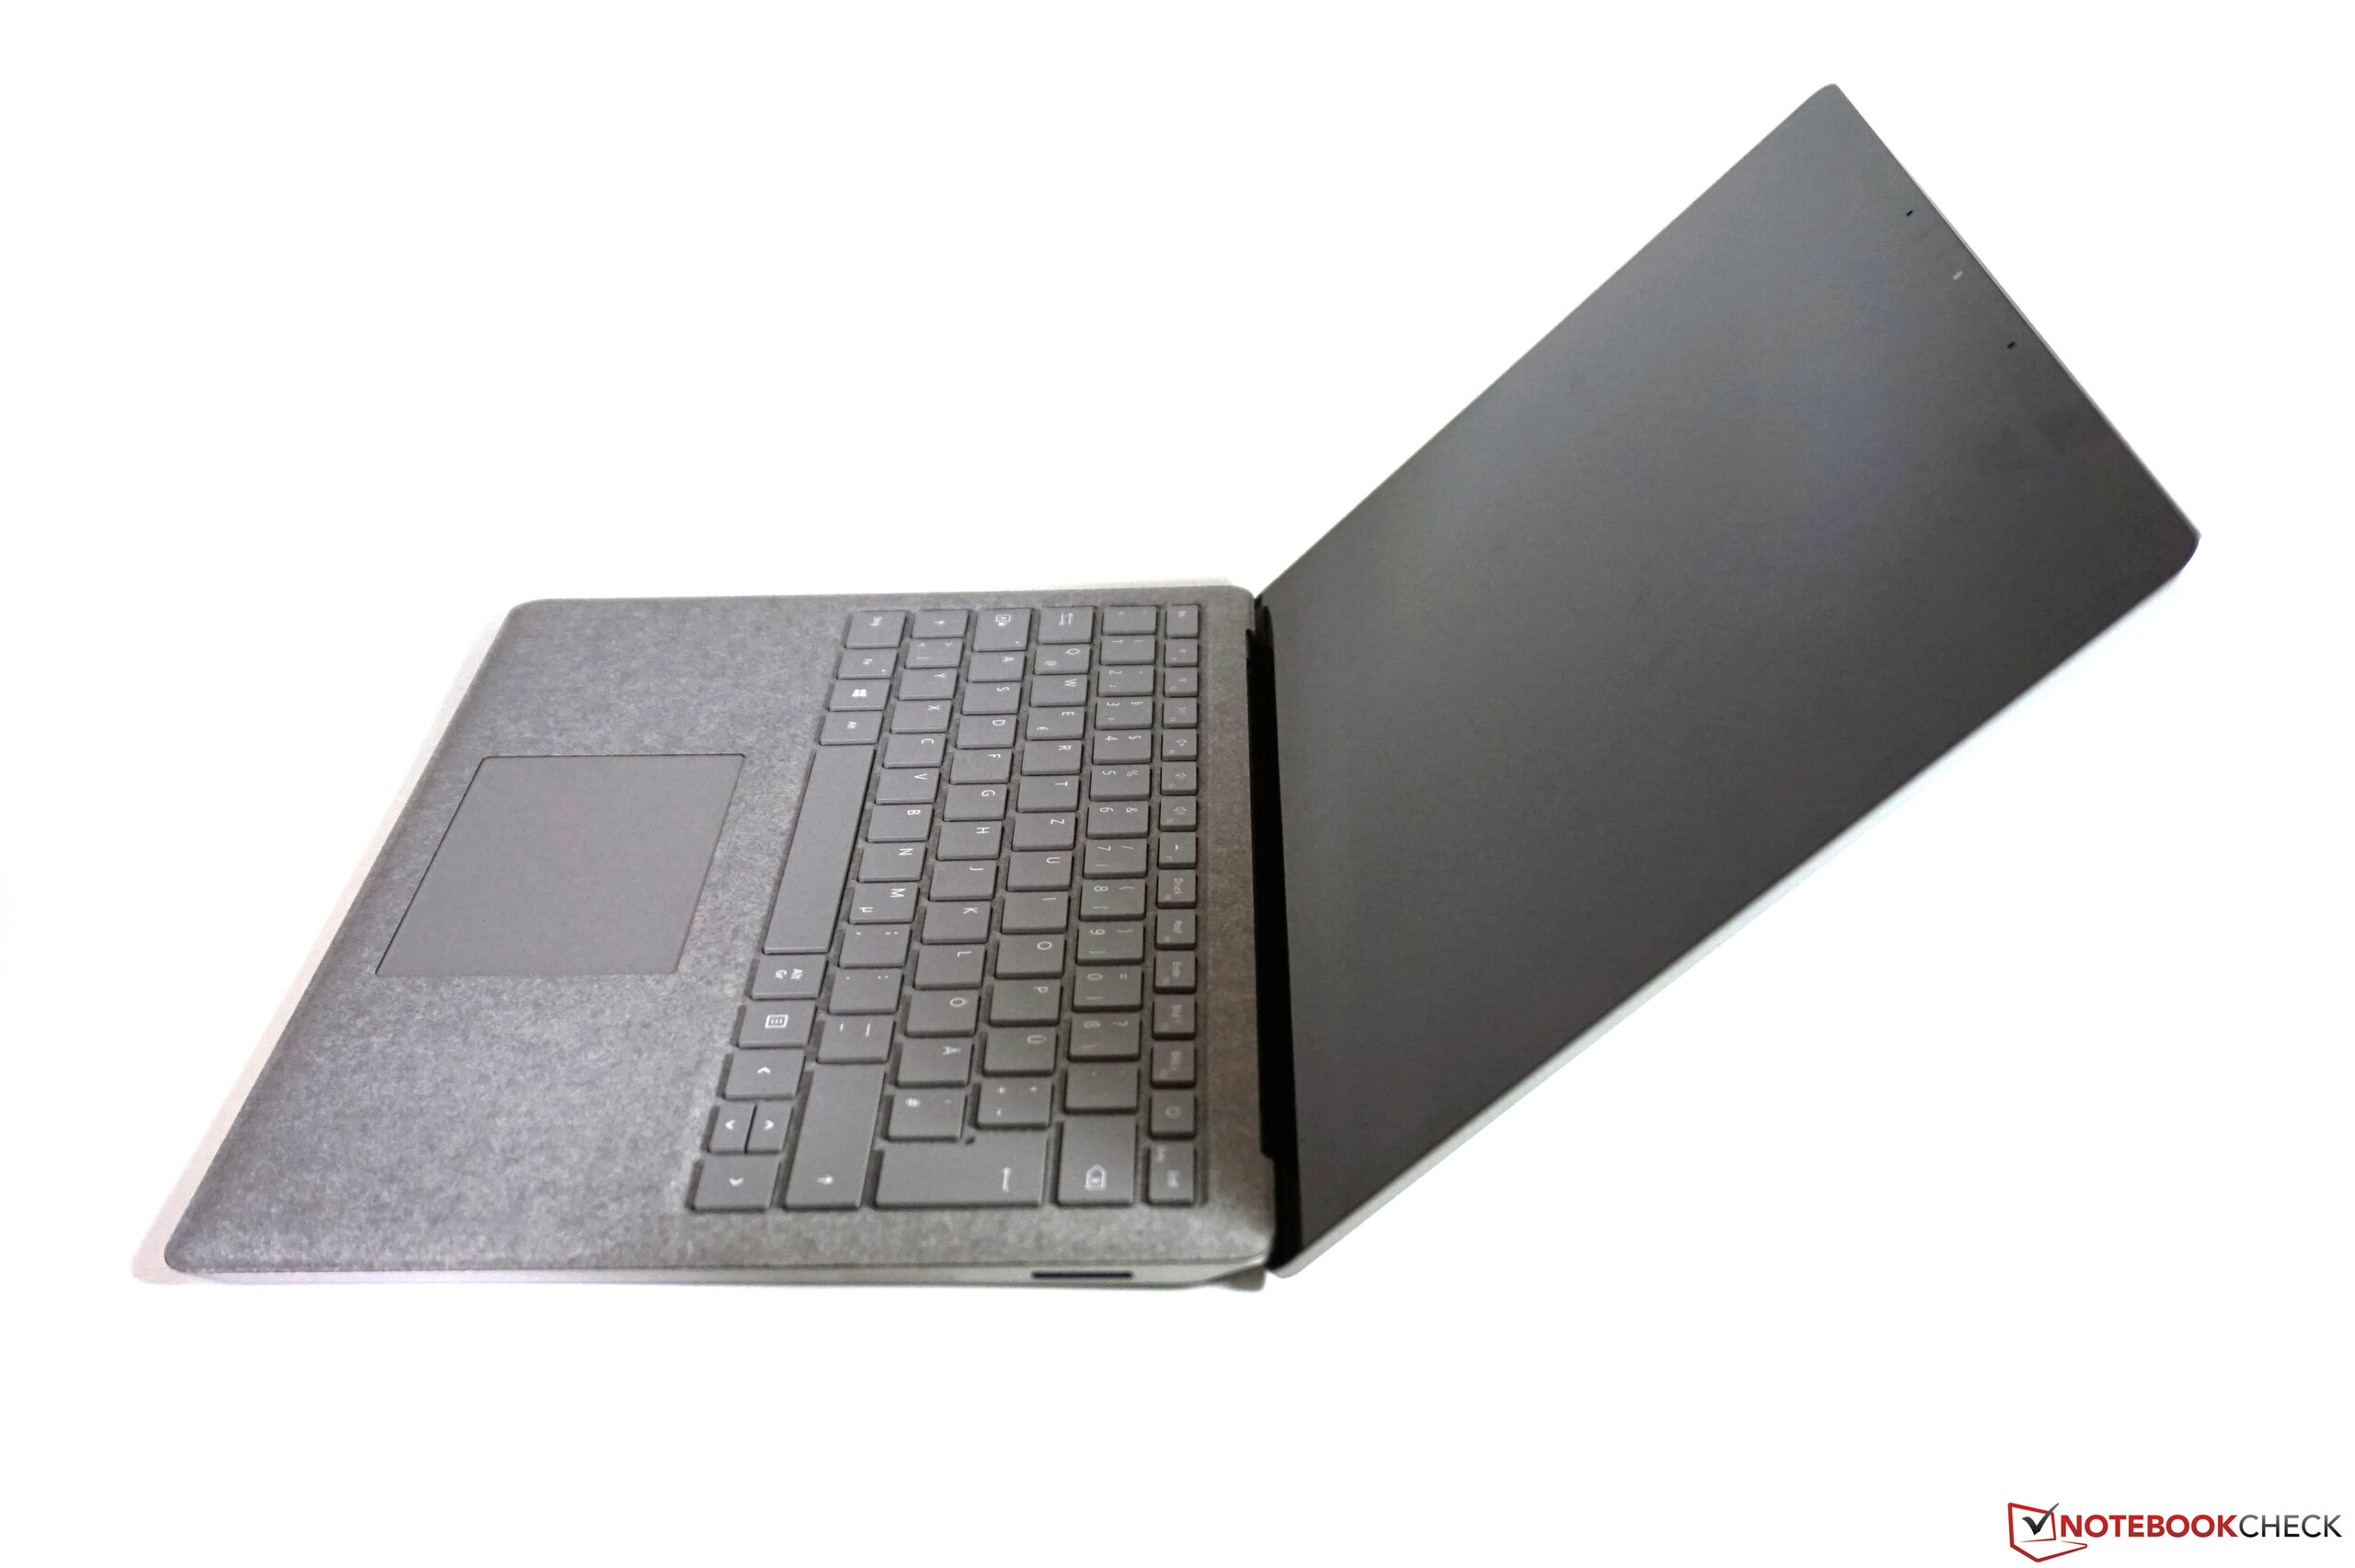
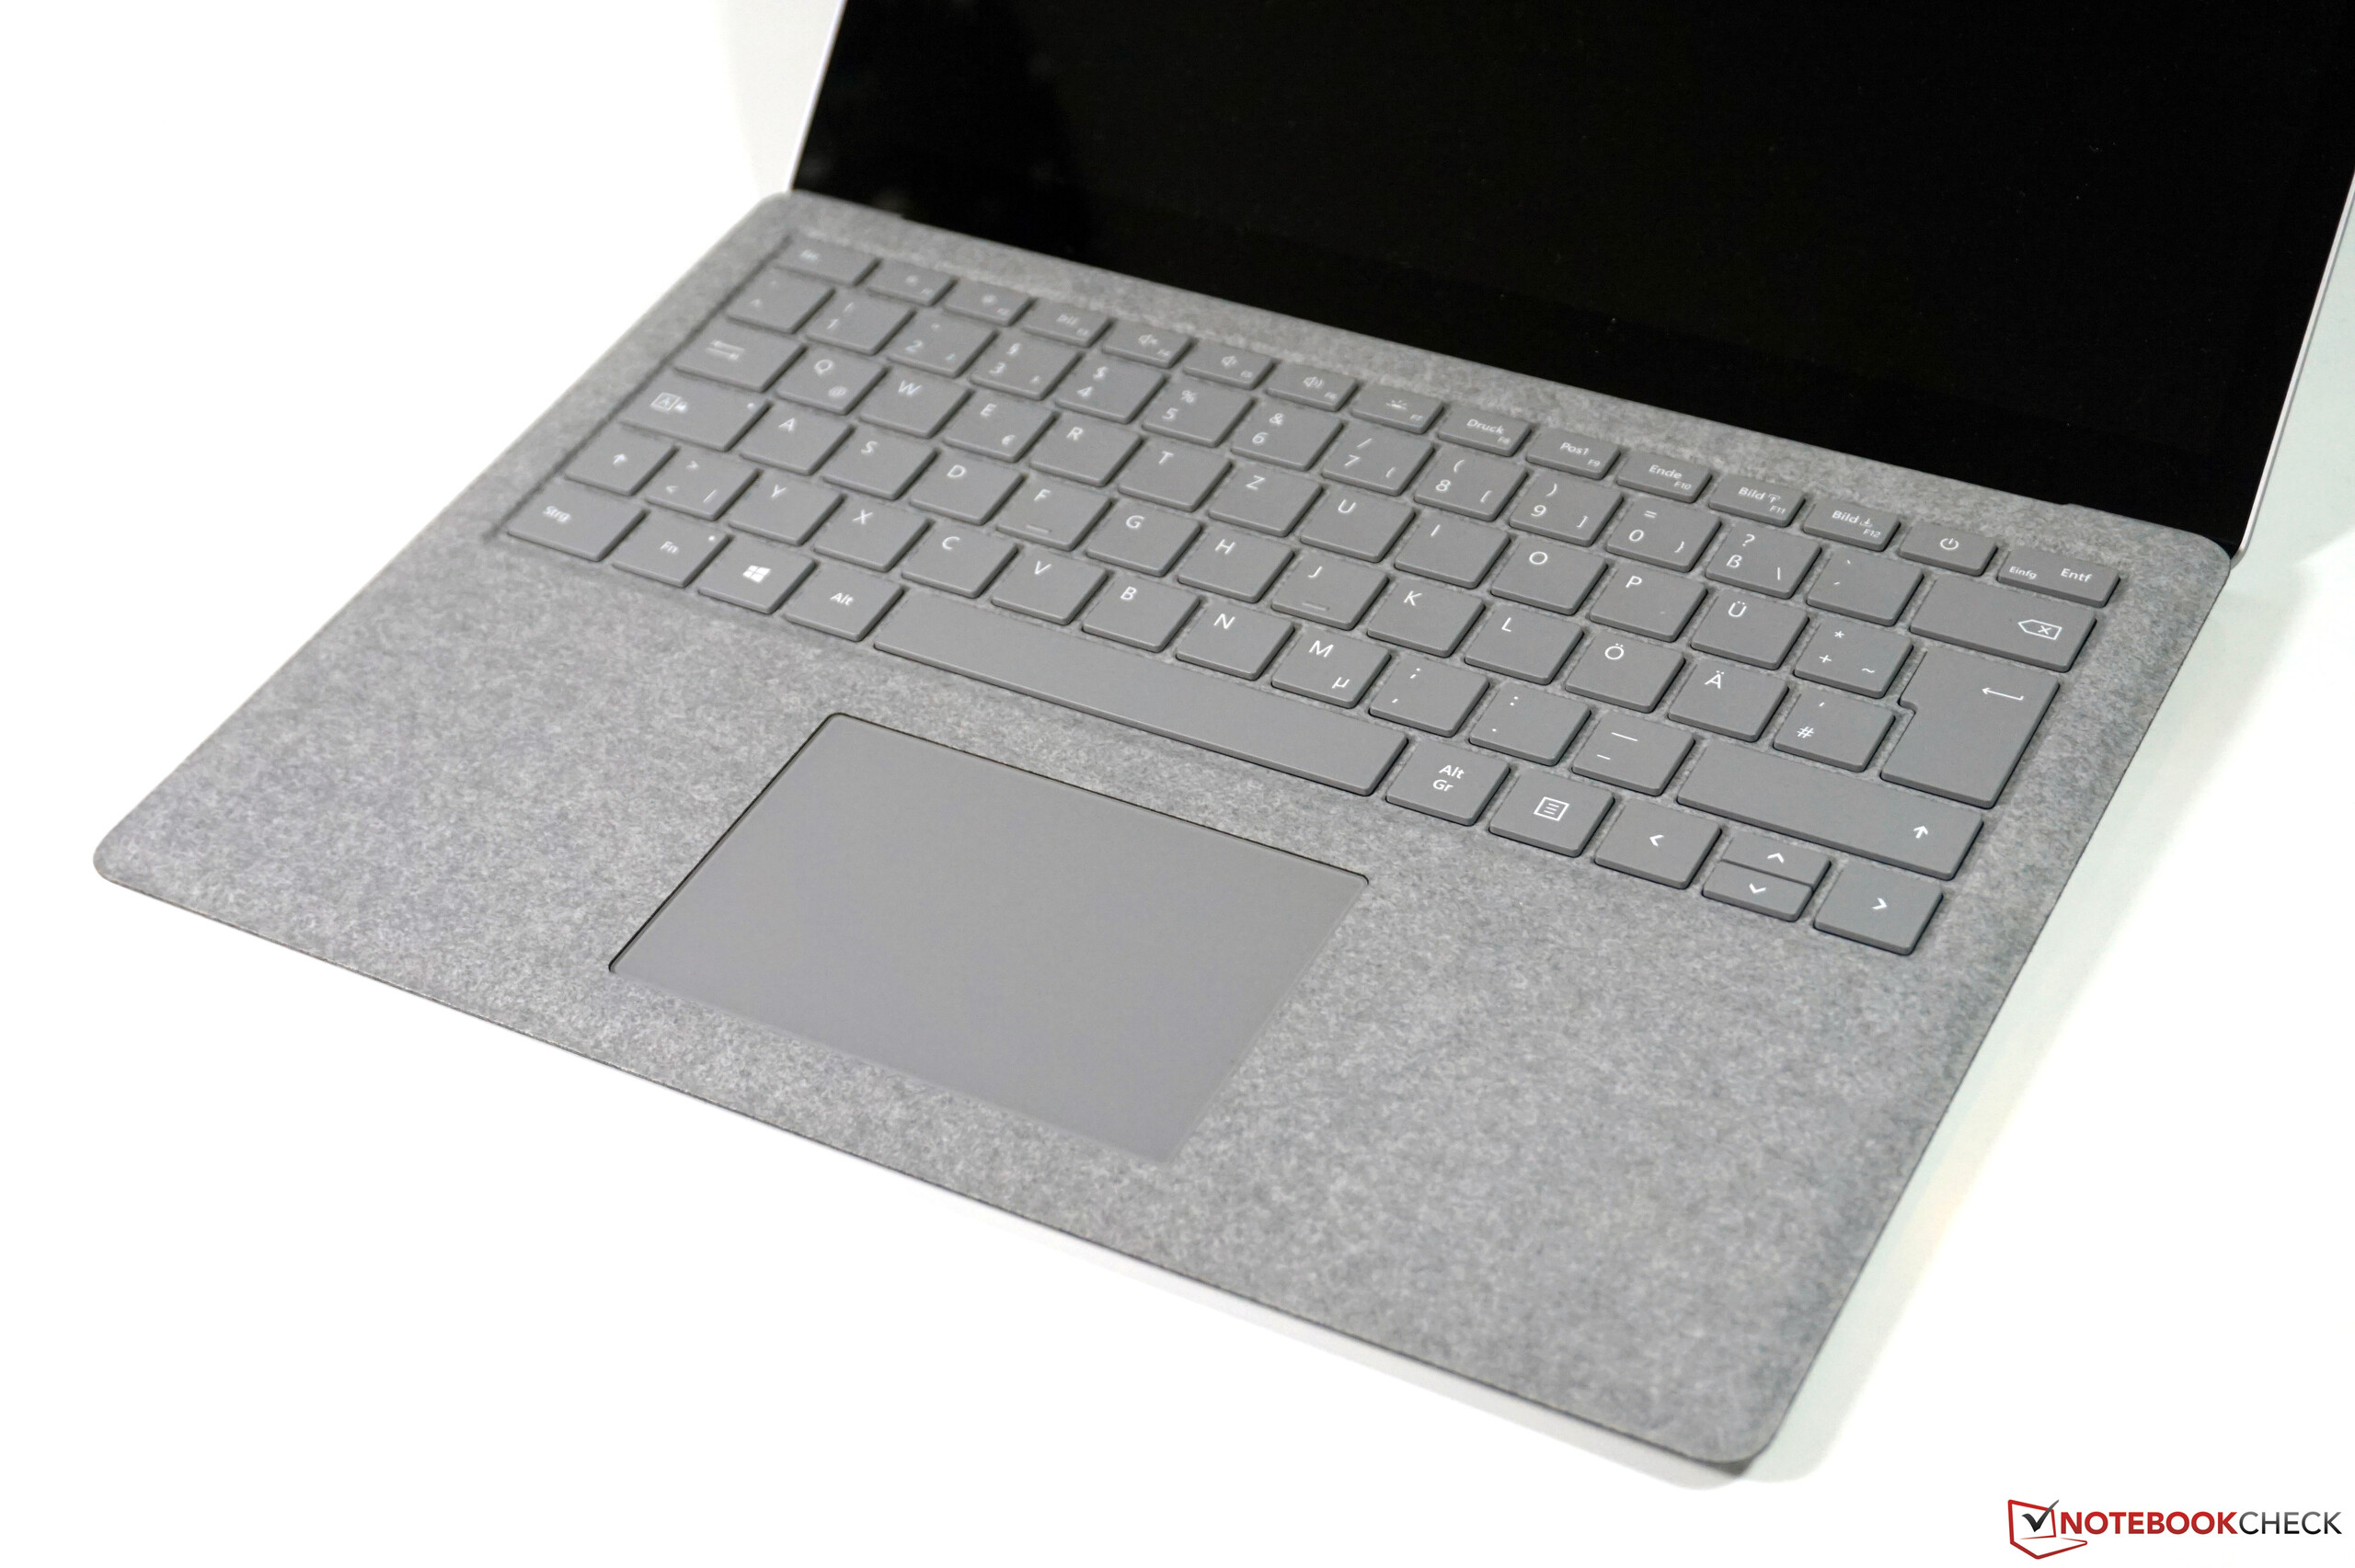
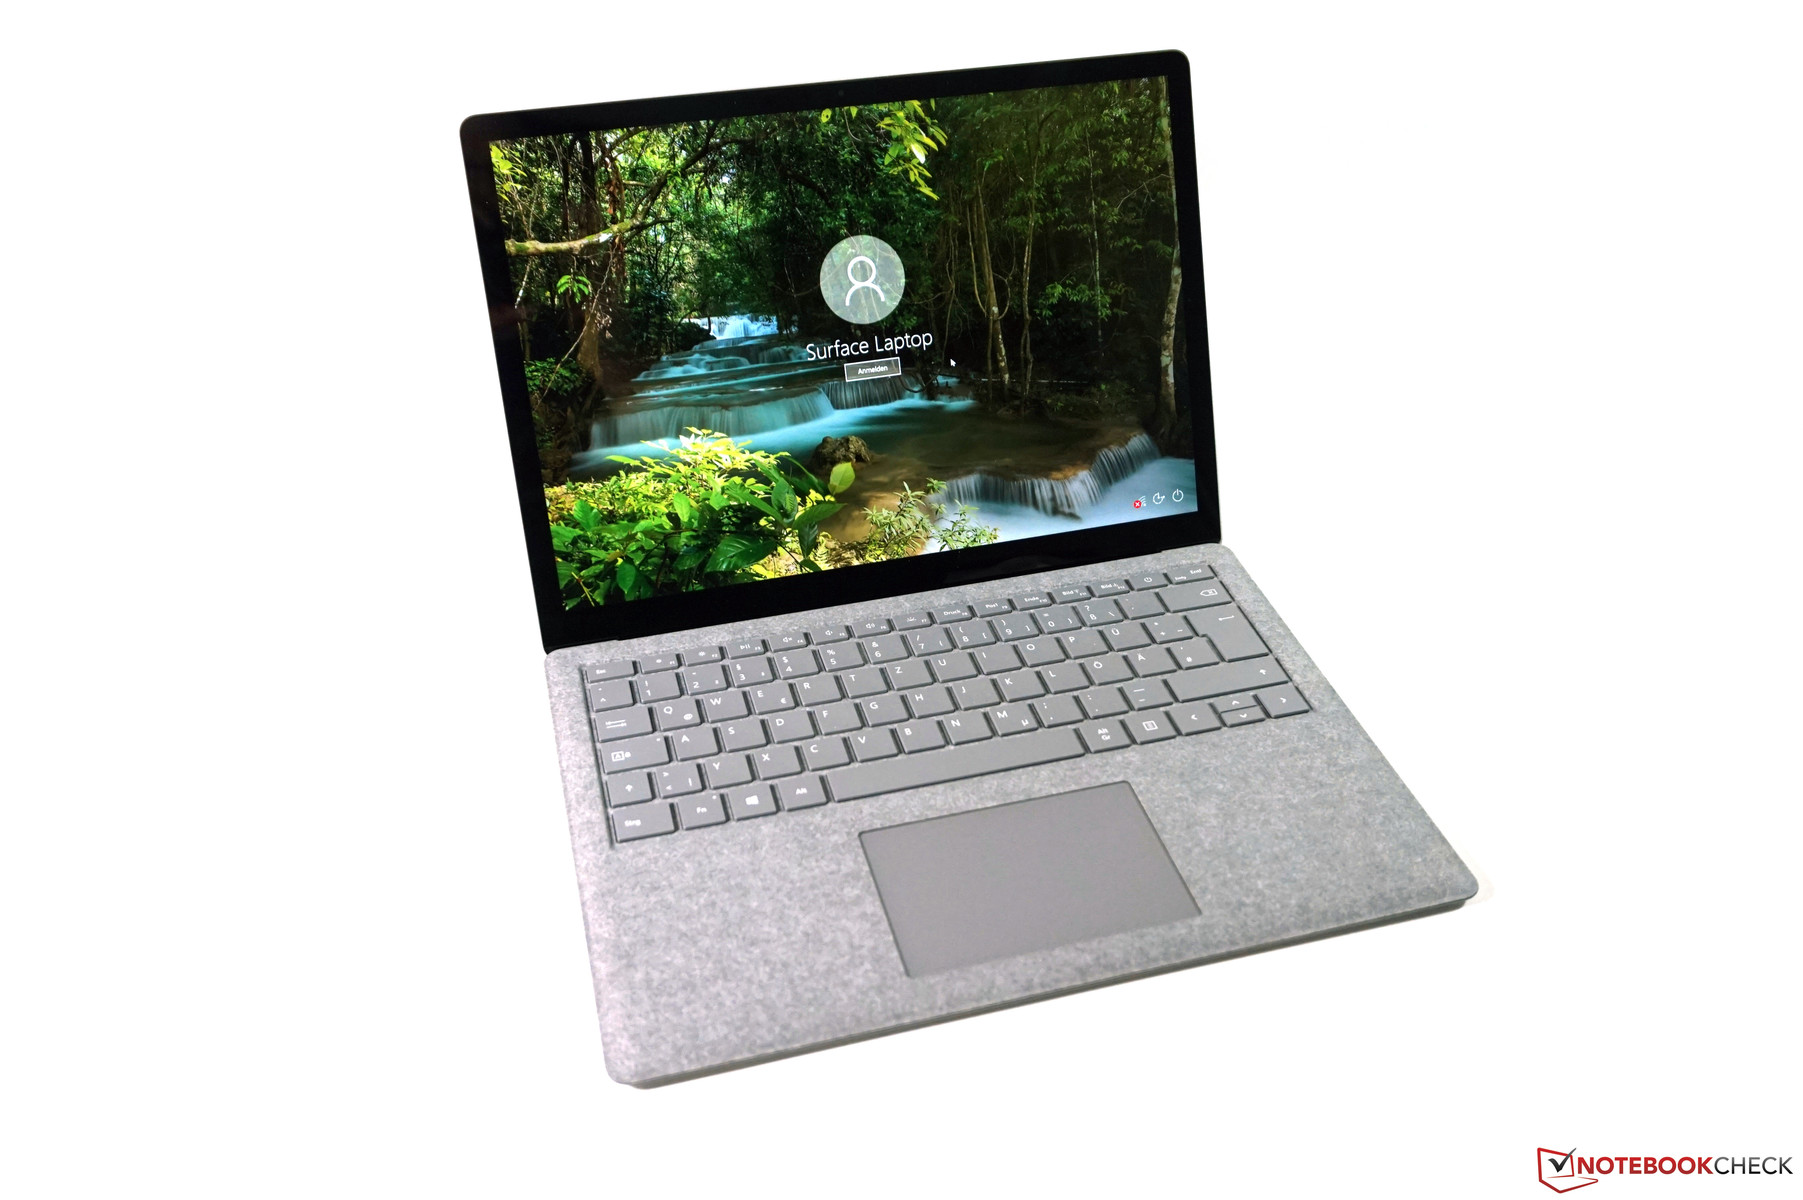
Som vi nämnde i början så har Microsoft i huvudsak bara uppdaterat den äldre Surface-modellen. Surface Laptop 2 kommer med moderna processorer med fyra kärnor, ett tystare kylsystem, en aning förbättrade högtalare och nya färgvarianter. Skärmen får fortfarande representera enhetens höjdpunkt och imponerar med sin goda färgprecision i kombination med bra ljusstyrka och hög kontrast. Även om 4K-skärmar ger högre upplösning så är bilden på Surface Laptop 2 väldigt naturtrogen och personligen gillade vi den verkligen. 3:2-skärmen har en fördel vid användning av produktivitetsapplikationer. Om man i huvudsak är intresserad av att titta på video kan det vara bättre med en 16:9-skärm. Inmatningsenheterna övertygar också och tangentbordet har jämförelsevis lång restid med tanke på hur tunn enheten är. Som ett resultat är den riktigt bekväm att skriva på.
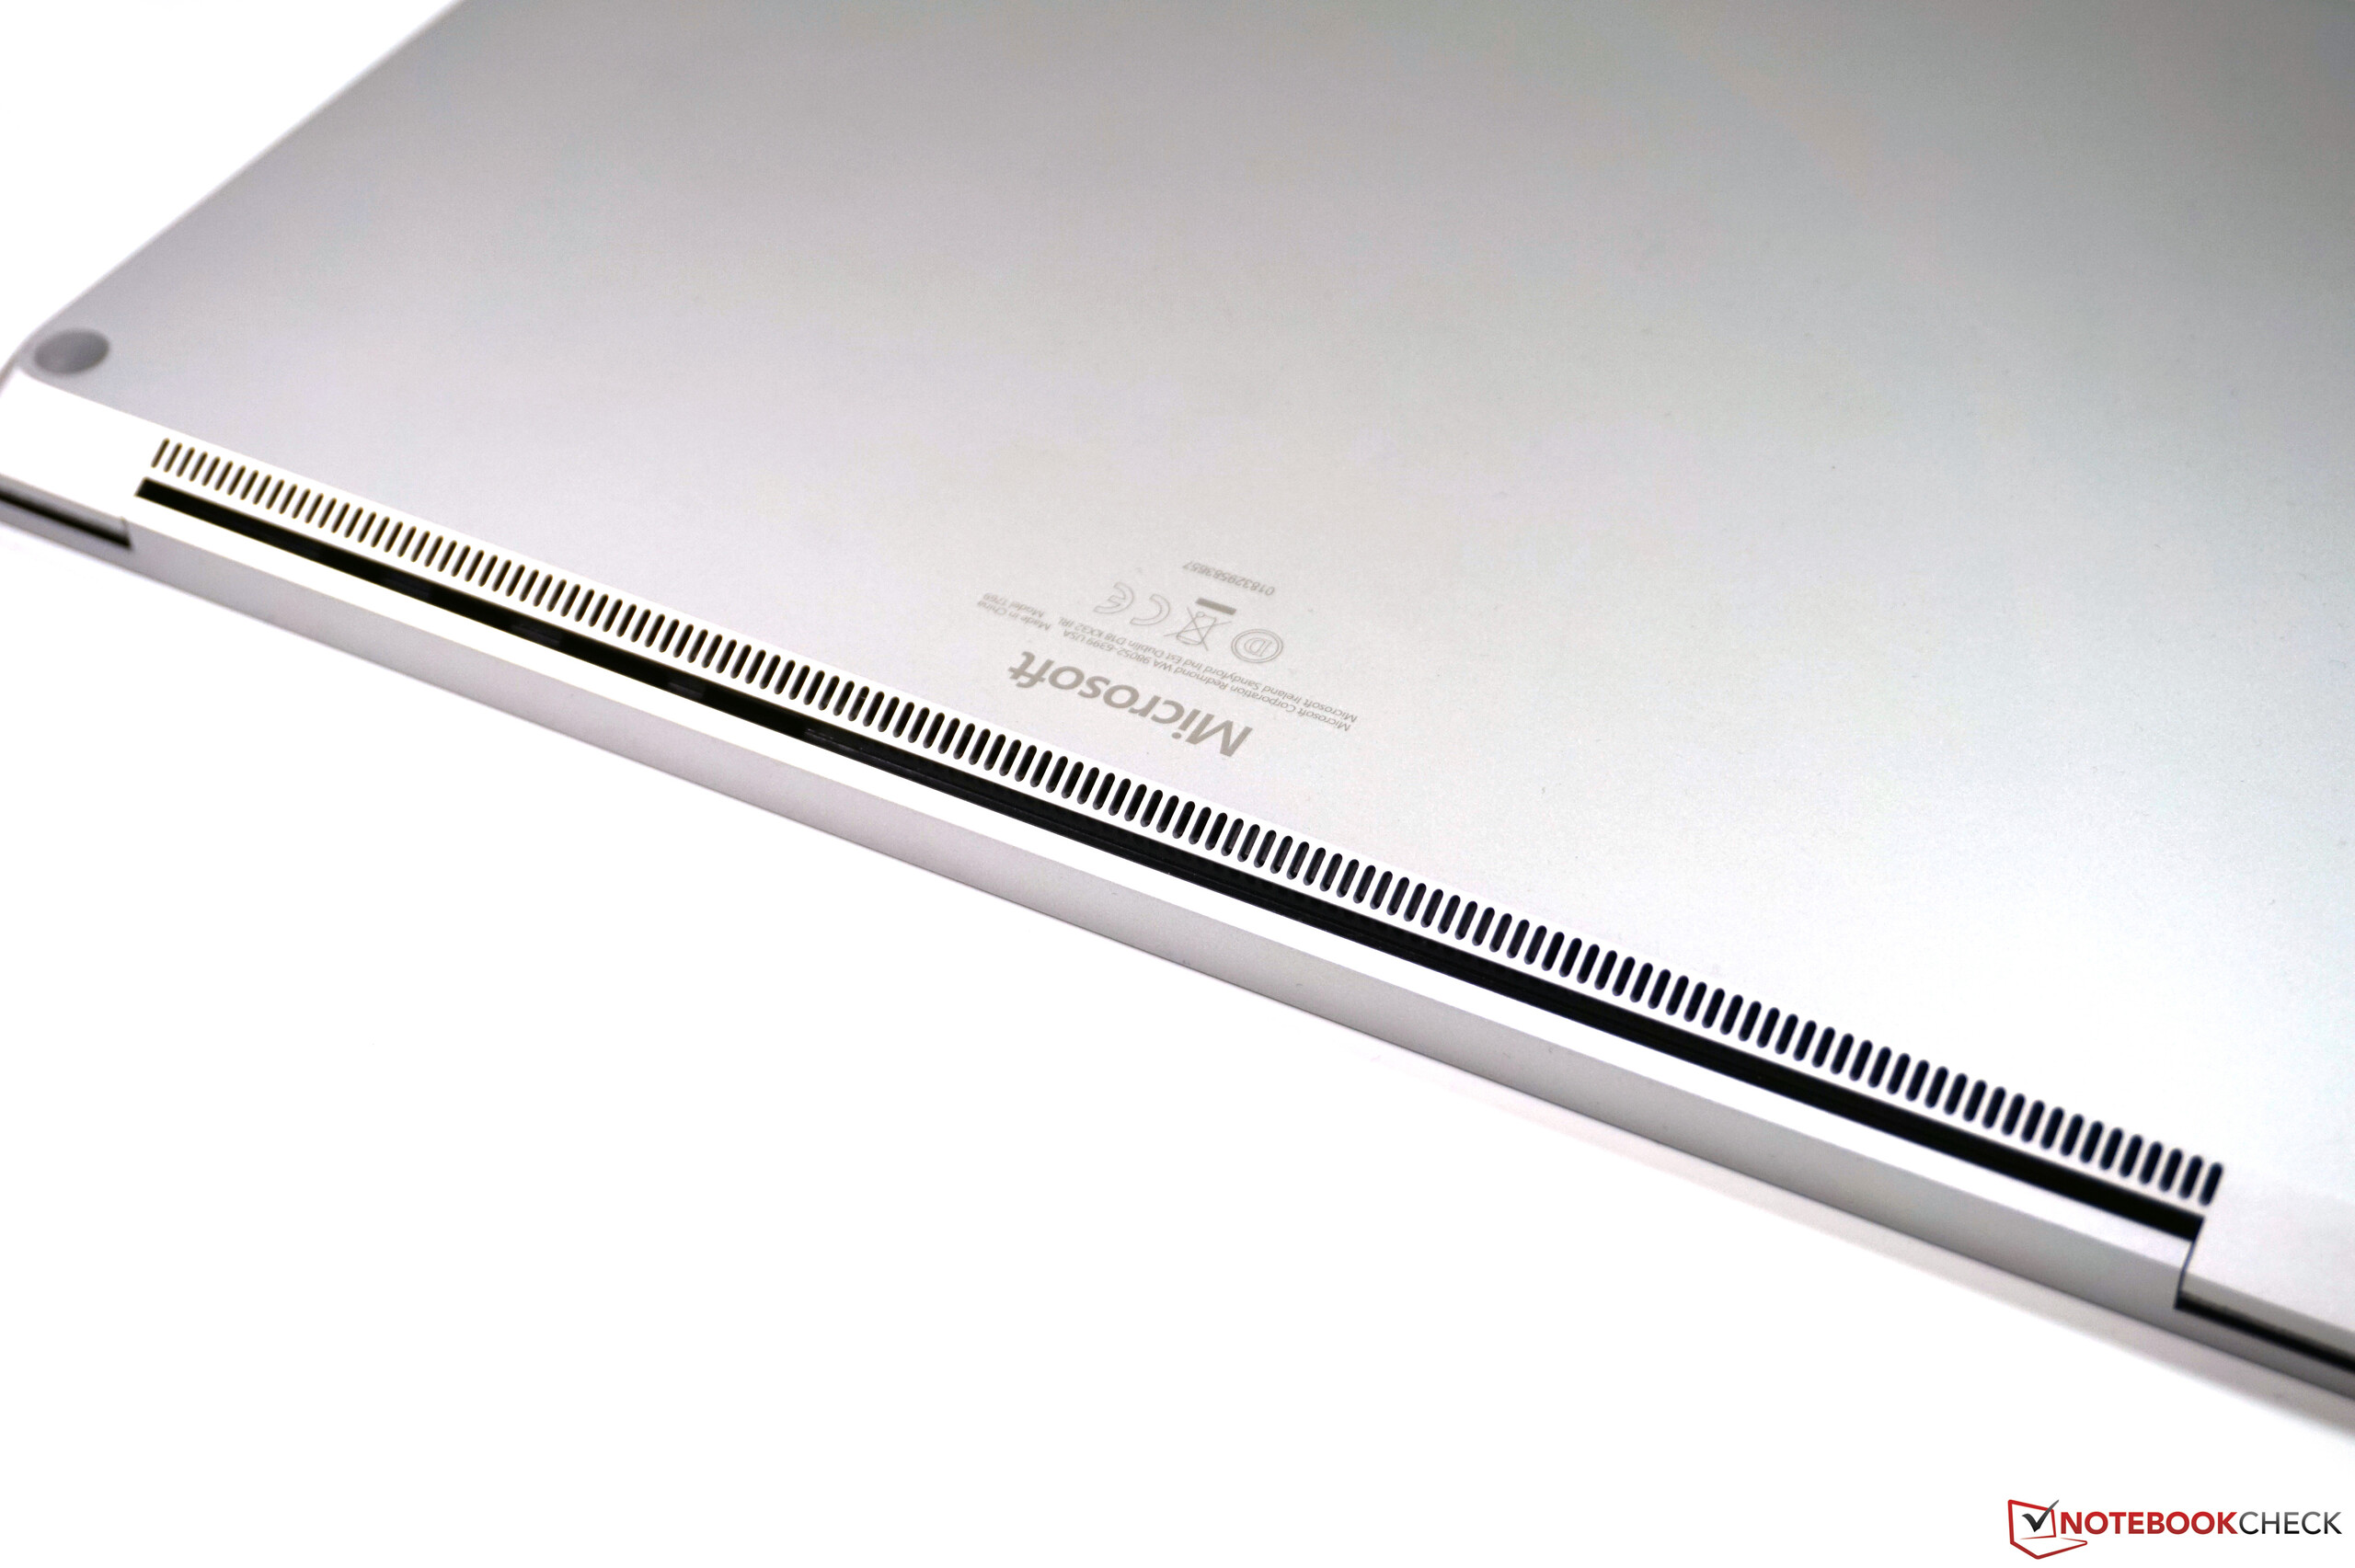
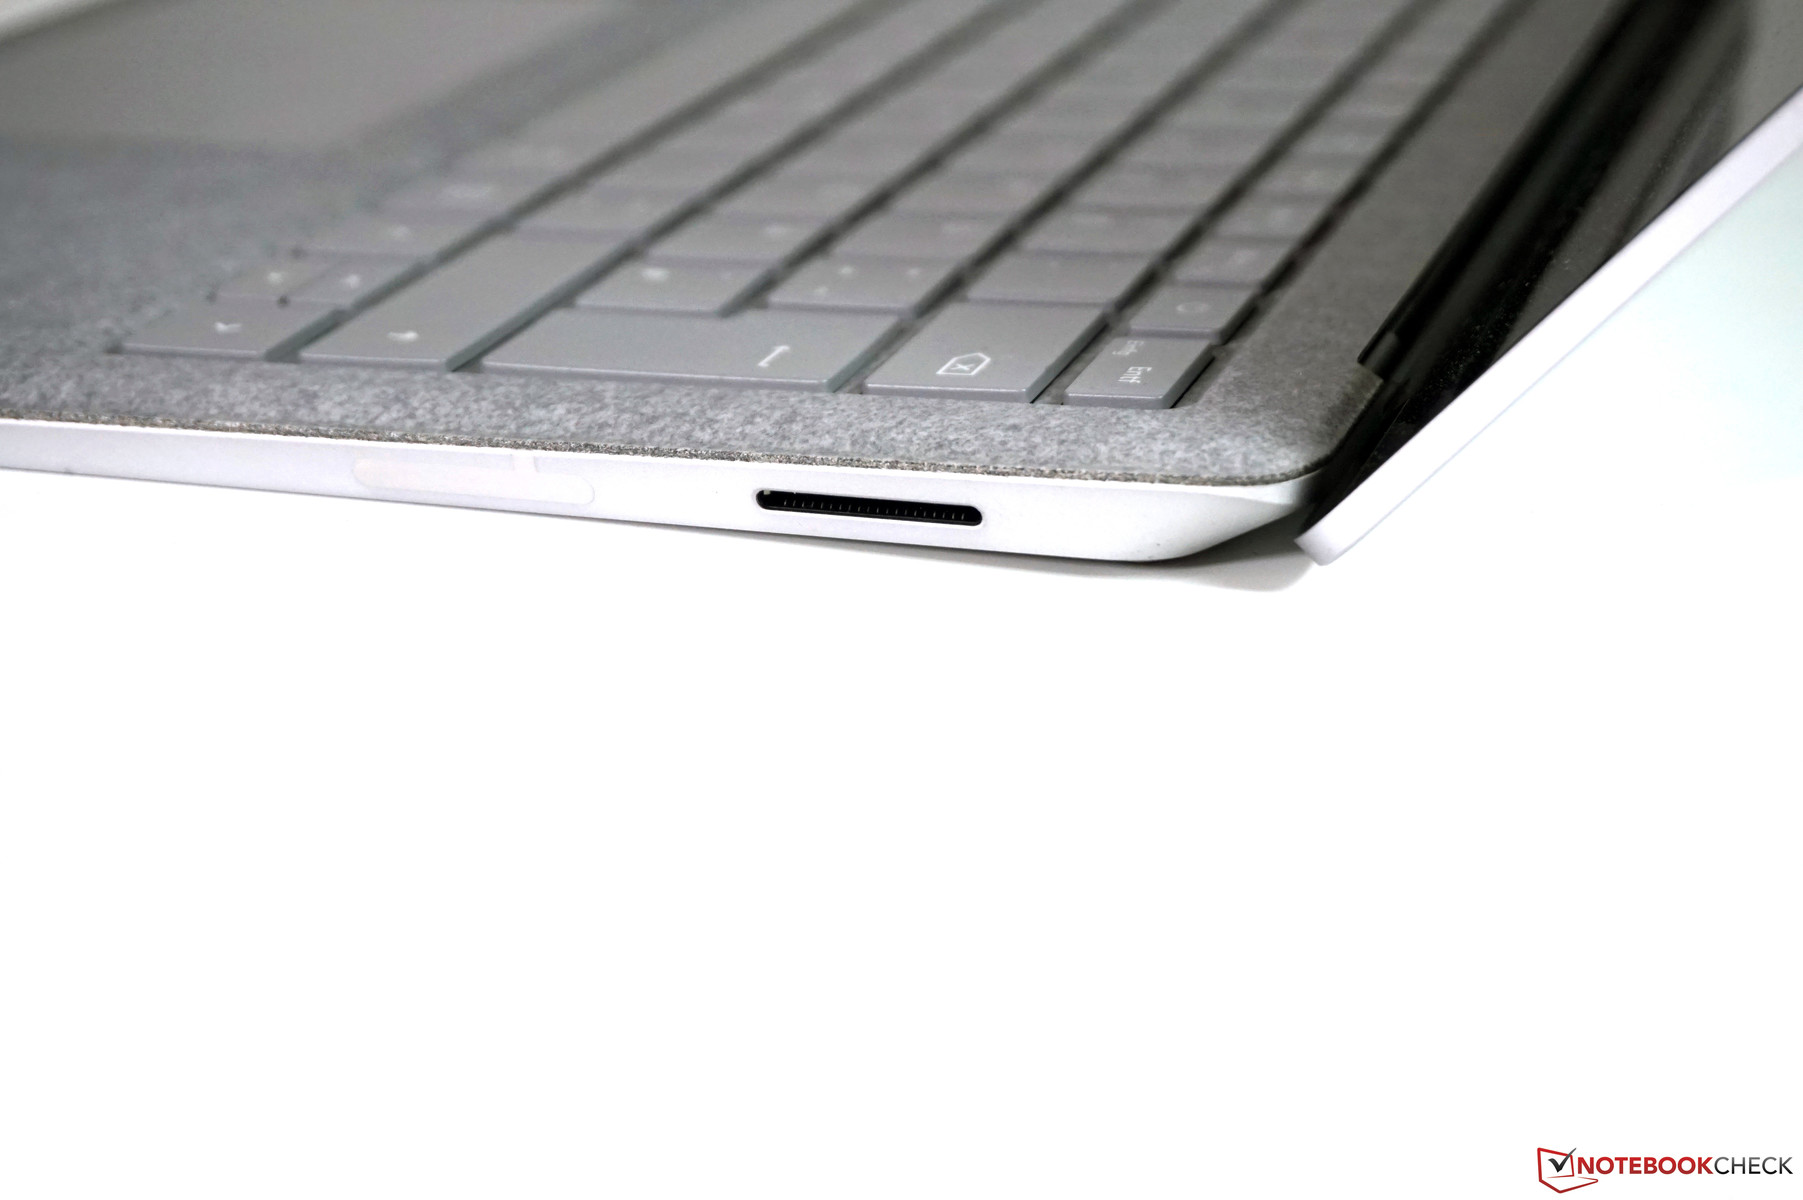
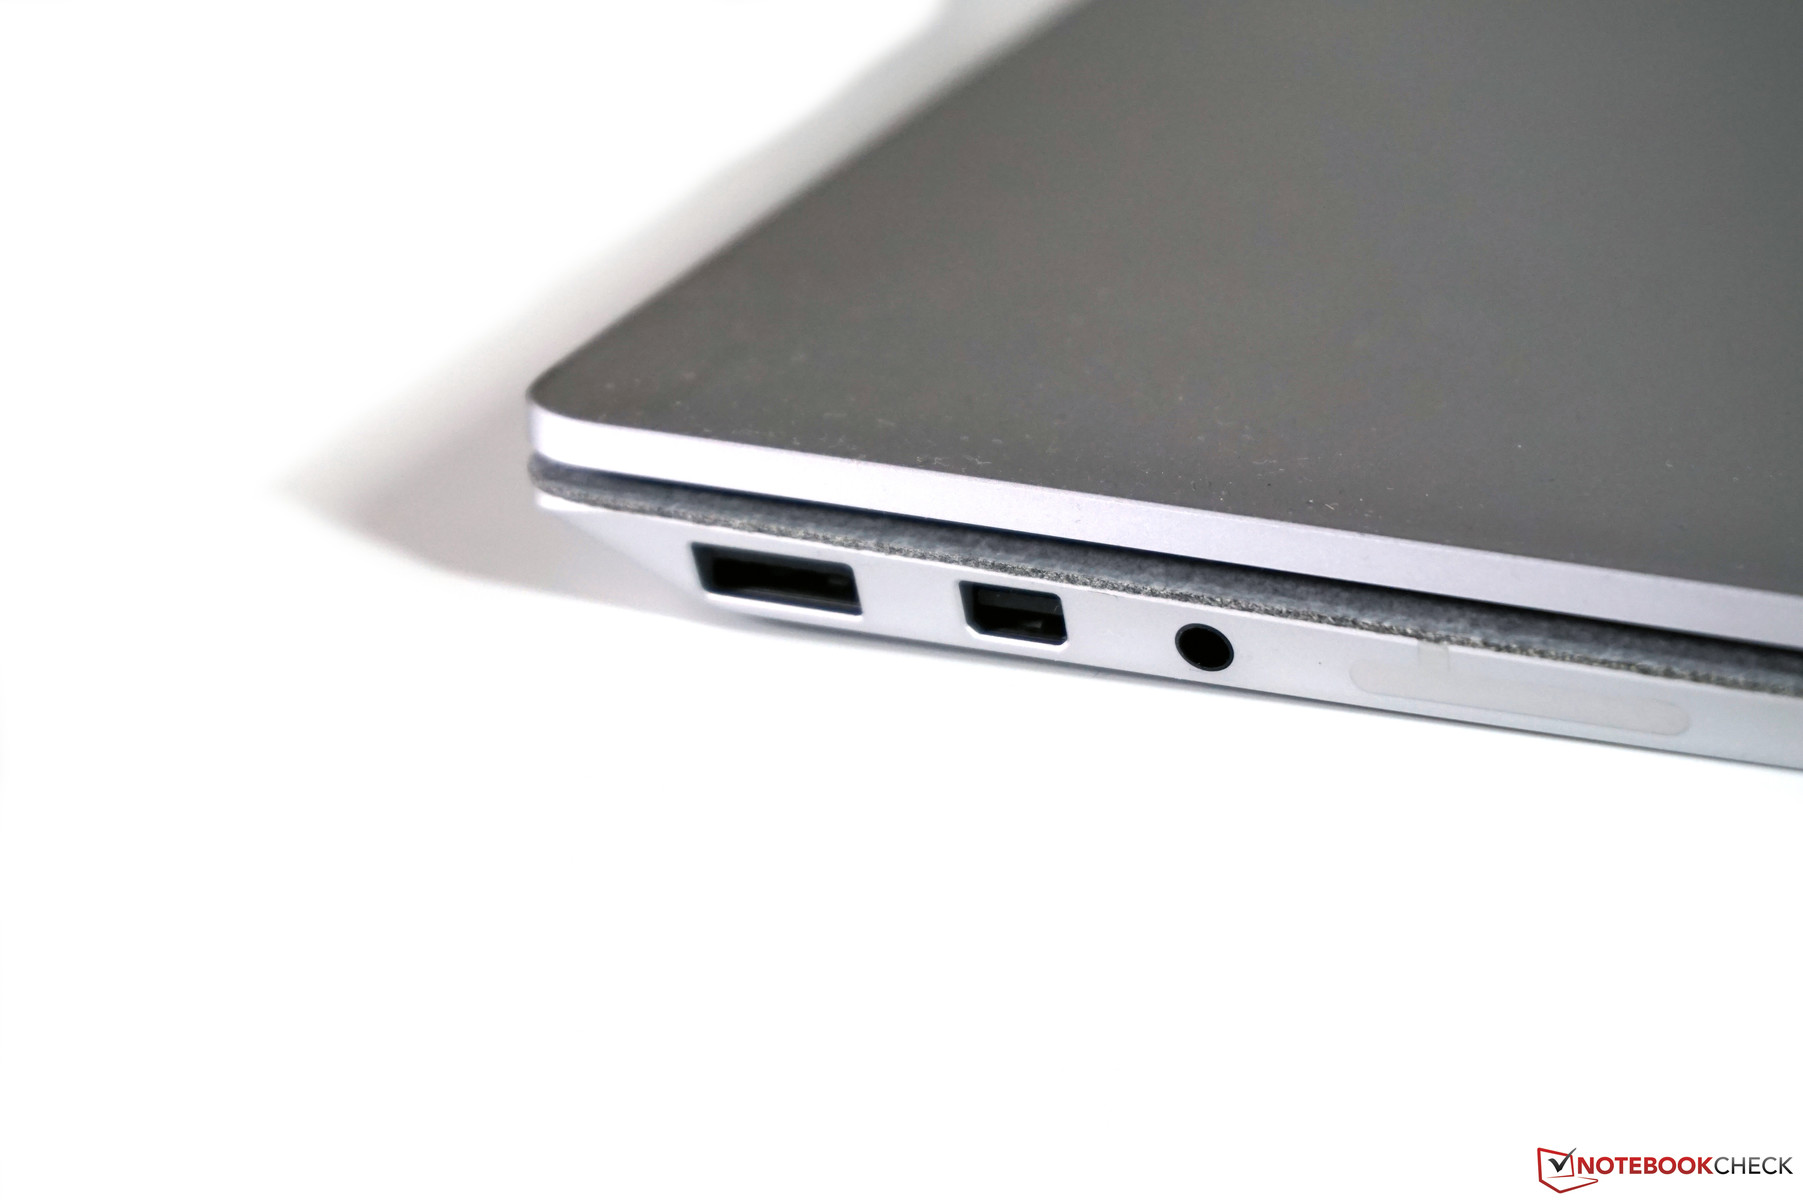
Vi upptäckte två huvudpunkter att kritisera på den här enheten. Den första är själva höljet, som, även om det är stabilt och av hög kvalitet, i princip är omöjligt att öppna. Detta innebär att användaren inte ens kan göra rent fläkten. Det andra problemet är att den saknar en Thunderbolt 3-port. Istället har enheten Surface Connect-anslutningen som Microsoft erbjuder ett antal enheter till. Det är förstås logiskt att Microsoft vill behålla den anslutningen; men de kunde ha inkluderat Thunderbolt 3 istället för en mini-DisplayPort. Det hade framtidssäkrat enheten och gjort det möjligt för användare som föredrar att ha en enda enhet för både stationär och mobil användning att ansluta en eGPU. Ytterligare en nackdel är bristen på SD-kortläsare - i synnerhet eftersom skärmen hade passat väldigt bra till bildbehandling.
Om du letar efter en högkvalitativ laptop med en bra skärm, tyst drift och bra inmatningsenheter bör Surface Laptop 2 från Microsoft passa bra. Även om vi är besvikna över och inte kan förstå faktum att det inte finns en Thunderbolt 3-port så påverkar detta för tillfället inte vardagligt arbete.
Oavsett så erbjuder Surface Laptop 2 en riktigt bra helhet, särskilt med tanke på målgruppen som i huvudsak består av genomsnittliga användare och personer som behöver en bra skärm med tryckkänslighet. Förhållandet mellan pris och prestanda är bra, även om det är synd att Microsoft tar ganska mycket extra betalt för mer RAM och SSD-lagring och dessutom komplicerar konfigurationsbegränsningar (beroende på färg, RAM, etc.) saker i onödan. Surface Laptop 2 slår MacBook Air i vår jämförelse och är troligen det bättre (och billigare) alternativet för de flesta användare, utan att ta operativsystemet i beaktande. Den som letar efter en ännu mer kompakt enhet bör ta en titt på XPS 13, som dessutom erbjuder fler alternativ för hårdvara och service.
Microsoft Surface Laptop 2-LQN-00004
- 10/22/2019 v7 (old)
Andreas Osthoff
Price comparison
