Test: Microsoft Surface Go (Pentium, 64GB eMMC) Surfplatta (Sammanfattning)

| SD Card Reader | |
| average JPG Copy Test (av. of 3 runs) | |
| Genomsnitt av klass Convertible (29.4 - 186, n=21, senaste 2 åren) | |
| Microsoft Surface Go MHN-00003 (Toshiba Exceria Pro M501) | |
| Asus Transformer Book T102HA-GR022T (Toshiba Exceria Pro M501 microSDXC 64GB) | |
| Asus VivoBook Flip 14 TP401NA (Toshiba Exceria Pro M501 microSDXC 64GB) | |
| maximum AS SSD Seq Read Test (1GB) | |
| Genomsnitt av klass Convertible (67.5 - 254, n=20, senaste 2 åren) | |
| Microsoft Surface Go MHN-00003 (Toshiba Exceria Pro M501) | |
| Asus VivoBook Flip 14 TP401NA (Toshiba Exceria Pro M501 microSDXC 64GB) | |
| Trekstor Primetab T13B | |
| Networking | |
| iperf3 transmit AX12 | |
| Acer Switch 3 SW312-31-P5VG | |
| Microsoft Surface Go MHN-00003 | |
| Trekstor Primetab T13B | |
| Lenovo IdeaPad Miix 320-10ICR Pro LTE | |
| Asus VivoBook Flip 14 TP401NA | |
| Asus Transformer Book T102HA-GR022T | |
| iperf3 receive AX12 | |
| Microsoft Surface Go MHN-00003 | |
| Acer Switch 3 SW312-31-P5VG | |
| Asus VivoBook Flip 14 TP401NA | |
| Trekstor Primetab T13B | |
| Asus Transformer Book T102HA-GR022T | |
| Lenovo IdeaPad Miix 320-10ICR Pro LTE | |
| |||||||||||||||||||||||||
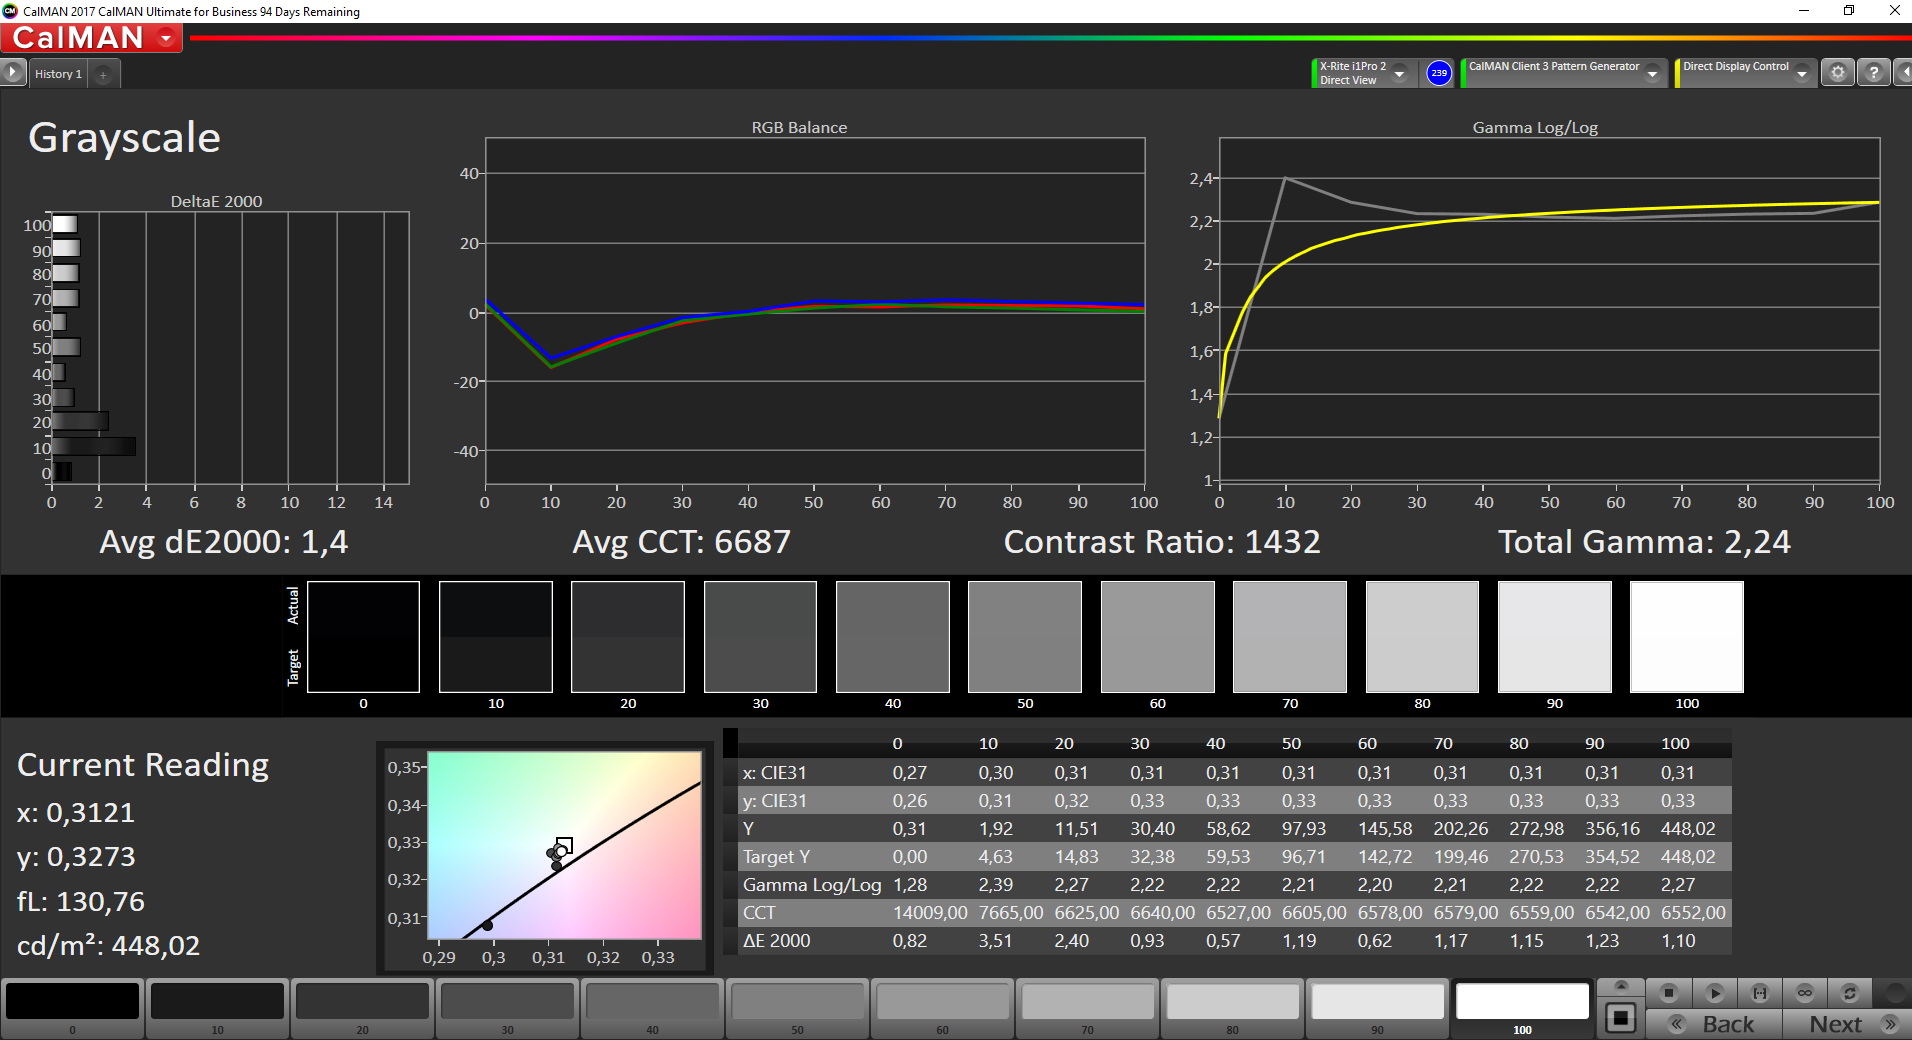
Distribution av ljusstyrkan: 88 %
Mitt på batteriet: 446 cd/m²
Kontrast: 1471:1 (Svärta: 0.31 cd/m²)
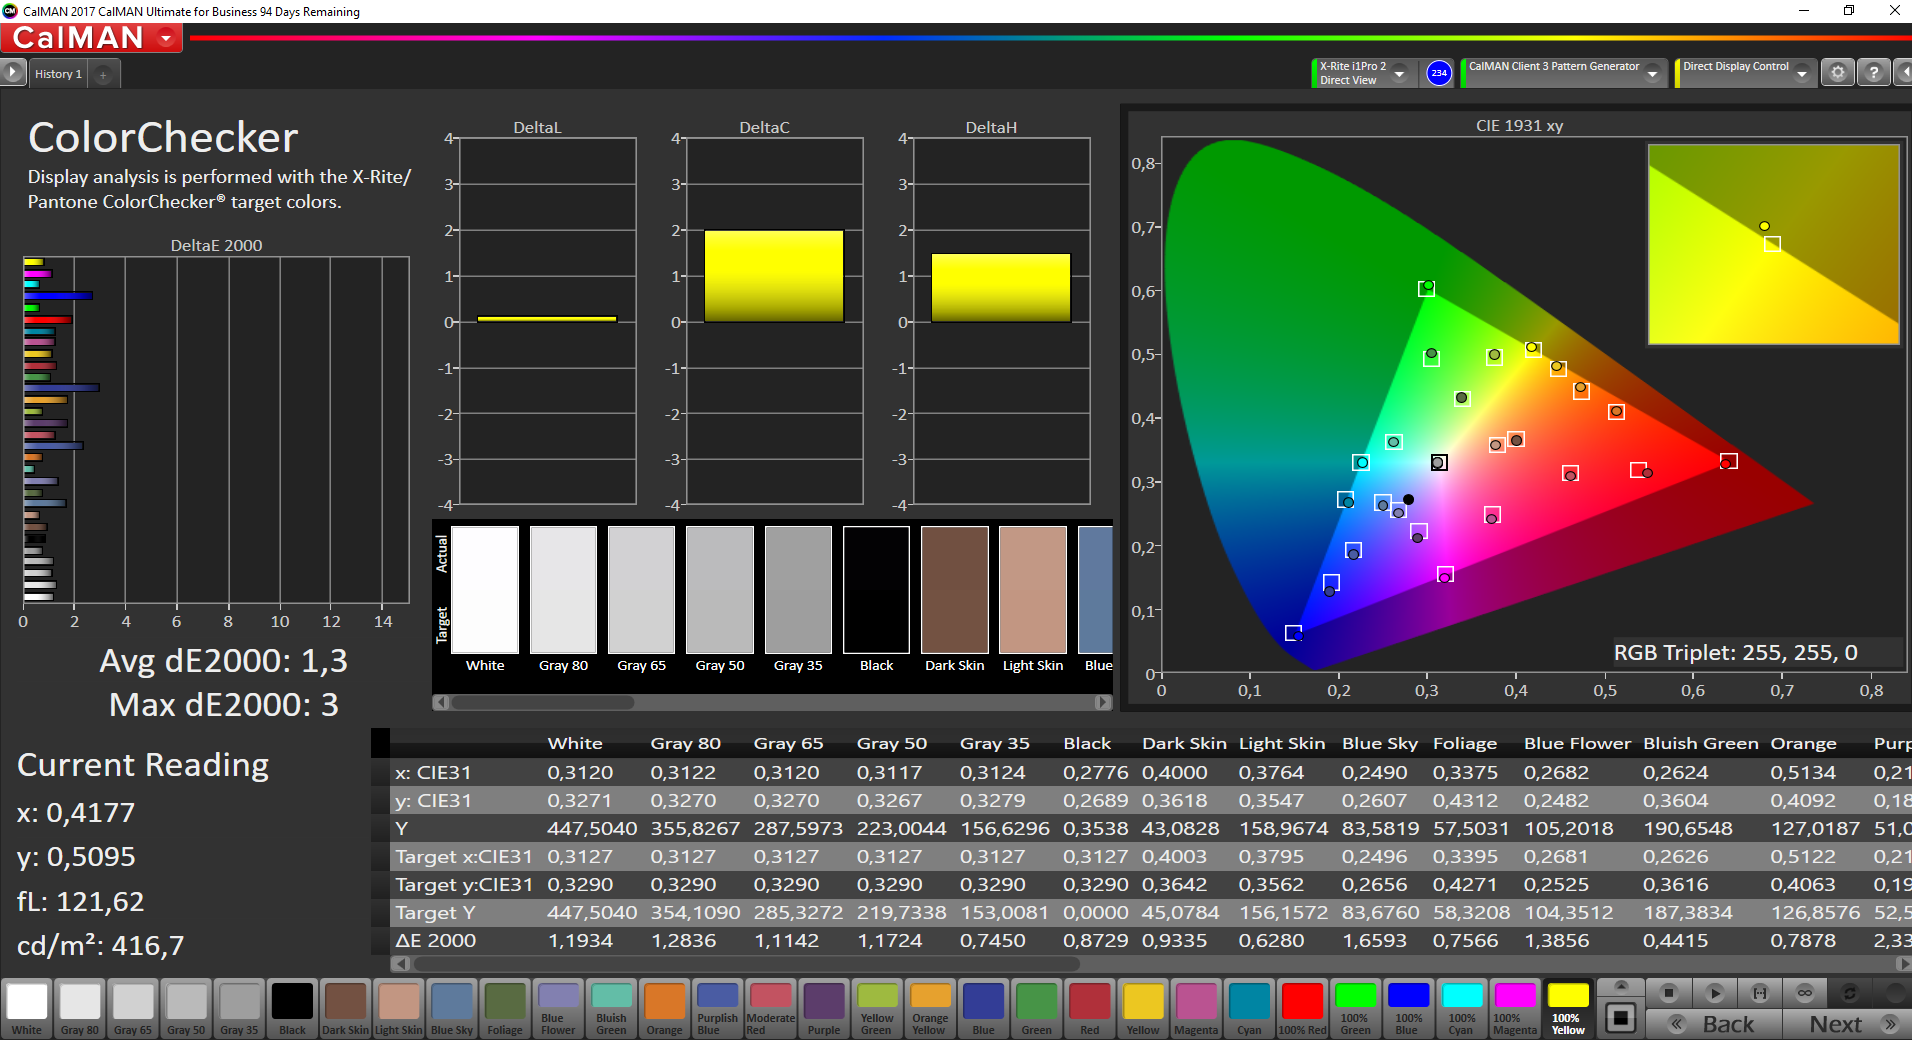
ΔE ColorChecker Calman: 1.3 | ∀{0.5-29.43 Ø4.71}
calibrated: 1.1
ΔE Greyscale Calman: 1.4 | ∀{0.09-98 Ø4.96}
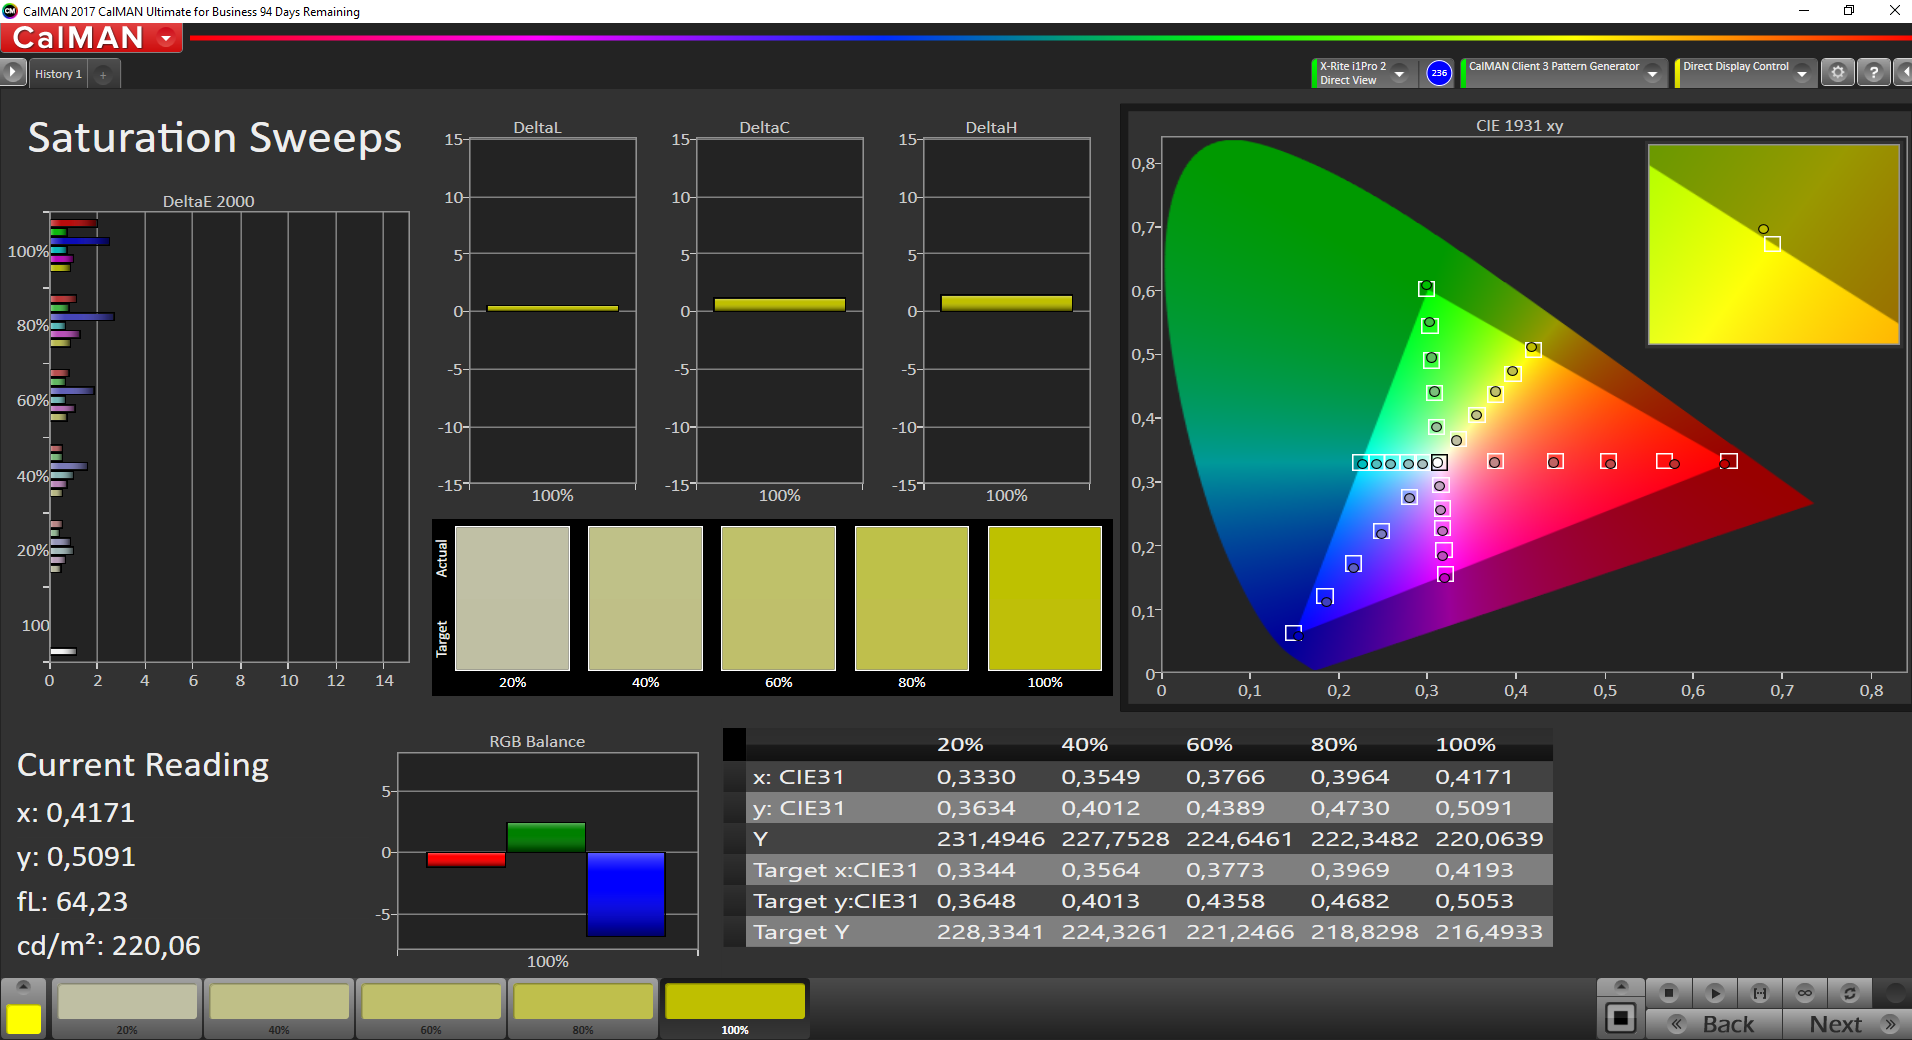
96.8% sRGB (Argyll 1.6.3 3D)
62.3% AdobeRGB 1998 (Argyll 1.6.3 3D)
67.5% AdobeRGB 1998 (Argyll 3D)
97.5% sRGB (Argyll 3D)
66.5% Display P3 (Argyll 3D)
Gamma: 2.24
CCT: 6687 K
| Microsoft Surface Go MHN-00003 Sharp SHP14A6, IPS, 1800x1200, 10" | Asus Transformer Book T102HA-GR022T AU Optronics AUO20D4, IPS, 1280x800, 10.1" | Trekstor Primetab T13B LC133LF4L01, IPS, 1920x1080, 13.3" | Lenovo IdeaPad Miix 320-10ICR Pro LTE YF102, MS_9003, IPS, 1920x1200, 10.1" | Acer Switch 3 SW312-31-P5VG XR122EA2T, IPS, 1920x1200, 12.2" | Asus VivoBook Flip 14 TP401NA BOE CQ NV140FHM-N49, IPS, 1920x1080, 14" | |
|---|---|---|---|---|---|---|
| Display | -20% | -1% | -17% | -6% | -39% | |
| Display P3 Coverage (%) | 66.5 | 53.4 -20% | 66.5 0% | 54.2 -18% | 68 2% 58.8 -12% | 40.21 -40% |
| sRGB Coverage (%) | 97.5 | 76.9 -21% | 95.1 -2% | 81.4 -17% | 91.2 -6% 87.5 -10% | 59.6 -39% |
| AdobeRGB 1998 Coverage (%) | 67.5 | 55.3 -18% | 67.8 0% | 56 -17% | 66.9 -1% 60.6 -10% | 41.54 -38% |
| Response Times | 13% | 1% | 17% | 9% | -14% | |
| Response Time Grey 50% / Grey 80% * (ms) | 44 ? | 29 ? 34% | 38 ? 14% | 32 ? 27% | 37 ? 16% | 42 ? 5% |
| Response Time Black / White * (ms) | 25.6 ? | 28 ? -9% | 29 ? -13% | 24 ? 6% | 25 ? 2% | 34 ? -33% |
| PWM Frequency (Hz) | 1020 ? | 294 ? | 19000 ? | 20000 ? | 960 ? | |
| Screen | -61% | -155% | -106% | -49% | -94% | |
| Brightness middle (cd/m²) | 456 | 530 16% | 324 -29% | 251 -45% | 364 -20% | 253 -45% |
| Brightness (cd/m²) | 426 | 491 15% | 333 -22% | 244 -43% | 341 -20% | 239 -44% |
| Brightness Distribution (%) | 88 | 88 0% | 87 -1% | 79 -10% | 85 -3% | 76 -14% |
| Black Level * (cd/m²) | 0.31 | 0.46 -48% | 0.39 -26% | 0.33 -6% | 0.47 -52% | 0.21 32% |
| Contrast (:1) | 1471 | 1152 -22% | 831 -44% | 761 -48% | 774 -47% | 1205 -18% |
| Colorchecker dE 2000 * | 1.3 | 4.33 -233% | 8.42 -548% | 5.34 -311% | 3.4 -162% | 4.29 -230% |
| Colorchecker dE 2000 max. * | 3 | 7.32 -144% | 15.11 -404% | 9.91 -230% | 7.61 -154% | 8.74 -191% |
| Colorchecker dE 2000 calibrated * | 1.1 | 1.85 -68% | 5.93 -439% | |||
| Greyscale dE 2000 * | 1.4 | 3.51 -151% | 9.18 -556% | 6.04 -331% | 1.7 -21% | 1.49 -6% |
| Gamma | 2.24 98% | 2.36 93% | 2.34 94% | 3.23 68% | 2.36 93% | 2.29 96% |
| CCT | 6687 97% | 7007 93% | 8841 74% | 7491 87% | 6750 96% | 6611 98% |
| Color Space (Percent of AdobeRGB 1998) (%) | 62.3 | 50 -20% | 62 0% | 51 -18% | 59 -5% | 38 -39% |
| Color Space (Percent of sRGB) (%) | 96.8 | 77 -20% | 95 -2% | 81 -16% | 91 -6% | 59 -39% |
| Totalt genomsnitt (program/inställningar) | -23% /
-43% | -52% /
-106% | -35% /
-72% | -15% /
-28% | -49% /
-74% |
* ... mindre är bättre


Visa svarstider
| ↔ Svarstid svart till vitt | ||
|---|---|---|
| 25.6 ms ... stiga ↗ och falla ↘ kombinerat | ↗ 11.6 ms stiga | 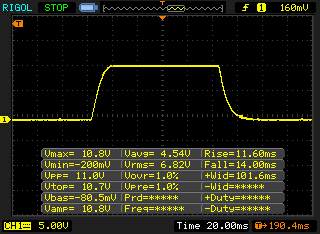 |
| ↘ 14 ms hösten | ||
| Skärmen visar relativt långsamma svarsfrekvenser i våra tester och kan vara för långsam för spelare. I jämförelse sträcker sig alla testade enheter från 0.1 (minst) till 240 (maximalt) ms. » 61 % av alla enheter är bättre. Detta innebär att den uppmätta svarstiden är sämre än genomsnittet av alla testade enheter (19.8 ms). | ||
| ↔ Svarstid 50 % grått till 80 % grått | ||
| 44 ms ... stiga ↗ och falla ↘ kombinerat | ↗ 22 ms stiga | 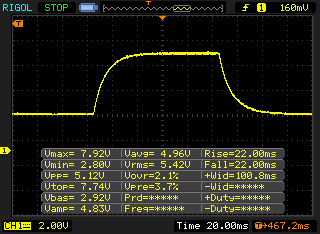 |
| ↘ 22 ms hösten | ||
| Skärmen visar långsamma svarsfrekvenser i våra tester och kommer att vara otillfredsställande för spelare. I jämförelse sträcker sig alla testade enheter från 0.165 (minst) till 636 (maximalt) ms. » 73 % av alla enheter är bättre. Detta innebär att den uppmätta svarstiden är sämre än genomsnittet av alla testade enheter (31 ms). | ||
Skärmflimmer / PWM (Puls-Width Modulation)
| Skärmflimmer / PWM upptäckt | 1020 Hz | ≤ 99 % ljusstyrka inställning | 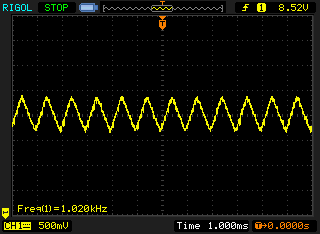 |
Displayens bakgrundsbelysning flimrar vid 1020 Hz (i värsta fall, t.ex. med PWM) Flimrande upptäckt vid en ljusstyrkeinställning på 99 % och lägre. Det ska inte finnas något flimmer eller PWM över denna ljusstyrkeinställning. Frekvensen för 1020 Hz är ganska hög, så de flesta användare som är känsliga för PWM bör inte märka något flimmer. Som jämförelse: 52 % av alla testade enheter använder inte PWM för att dämpa skärmen. Om PWM upptäcktes mättes ett medelvärde av 7751 (minst: 5 - maximum: 343500) Hz. | |||
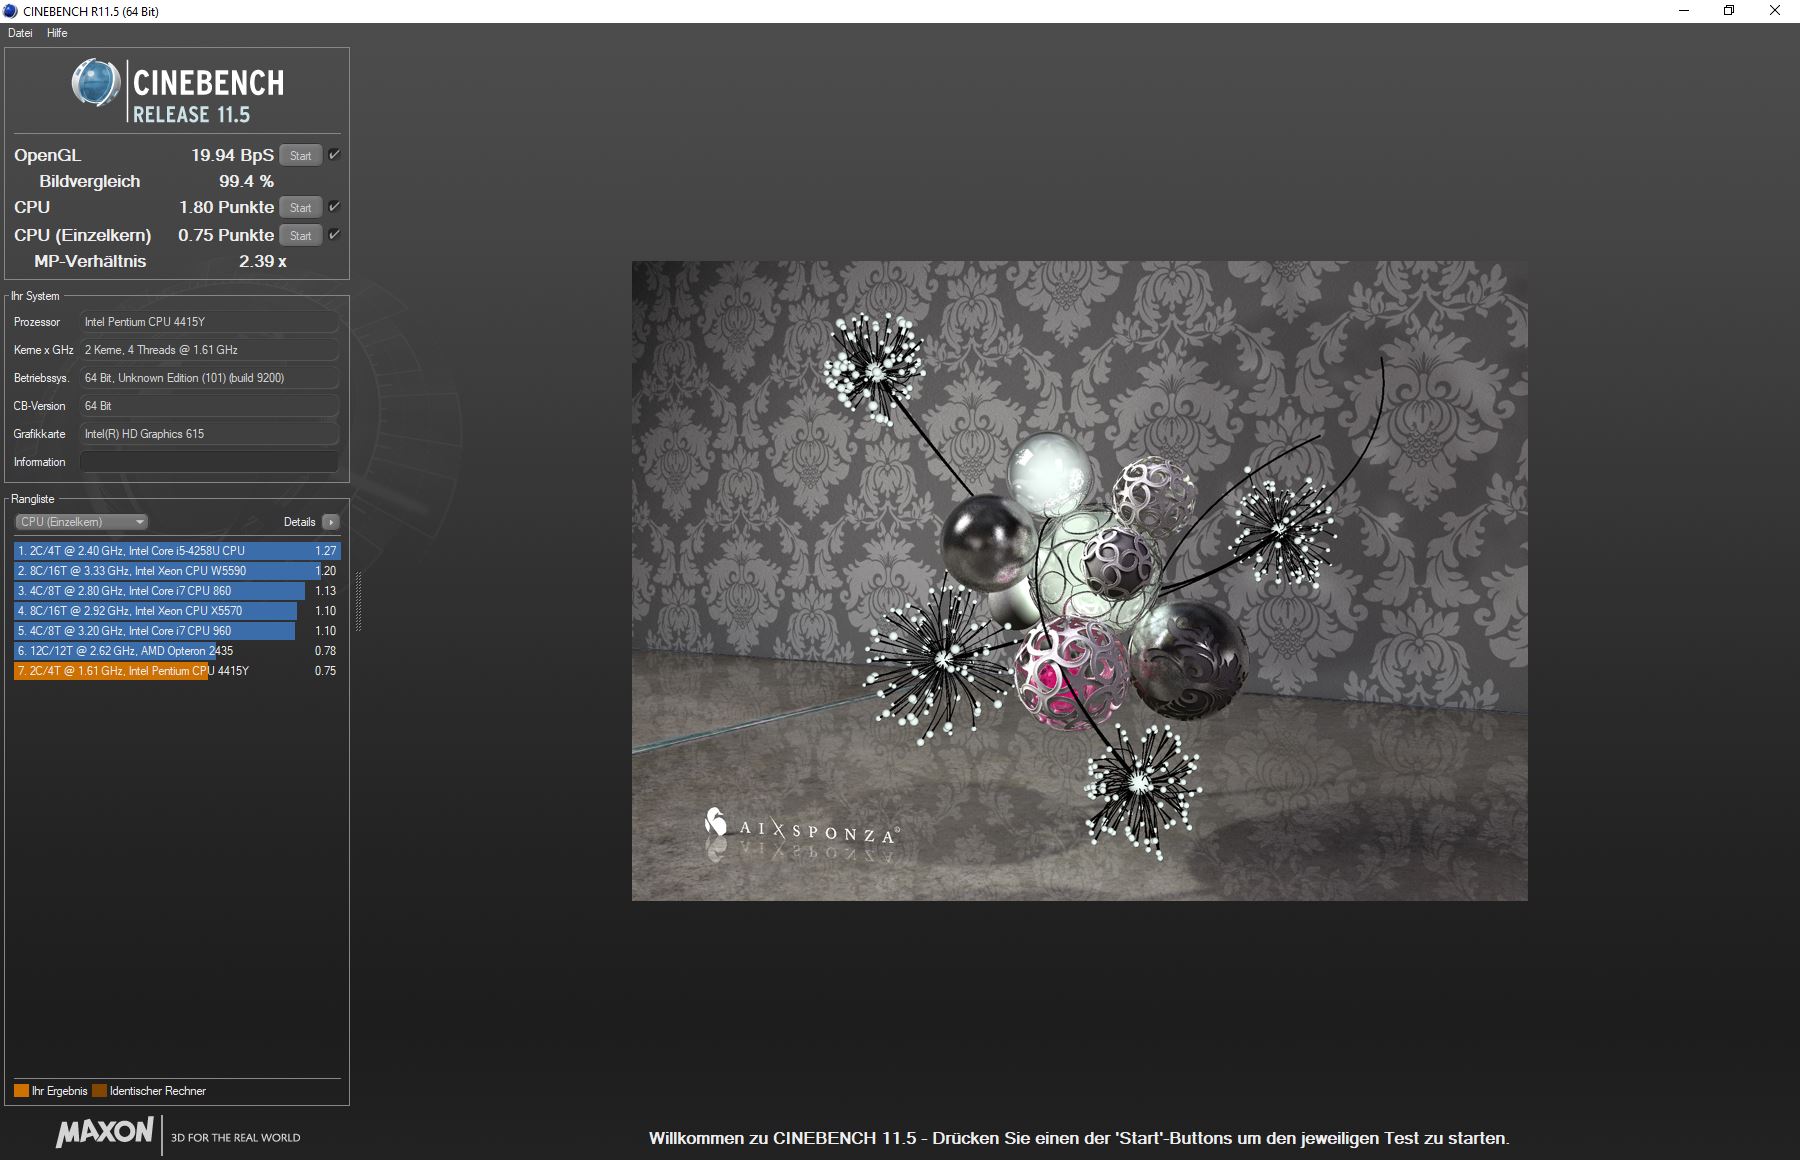
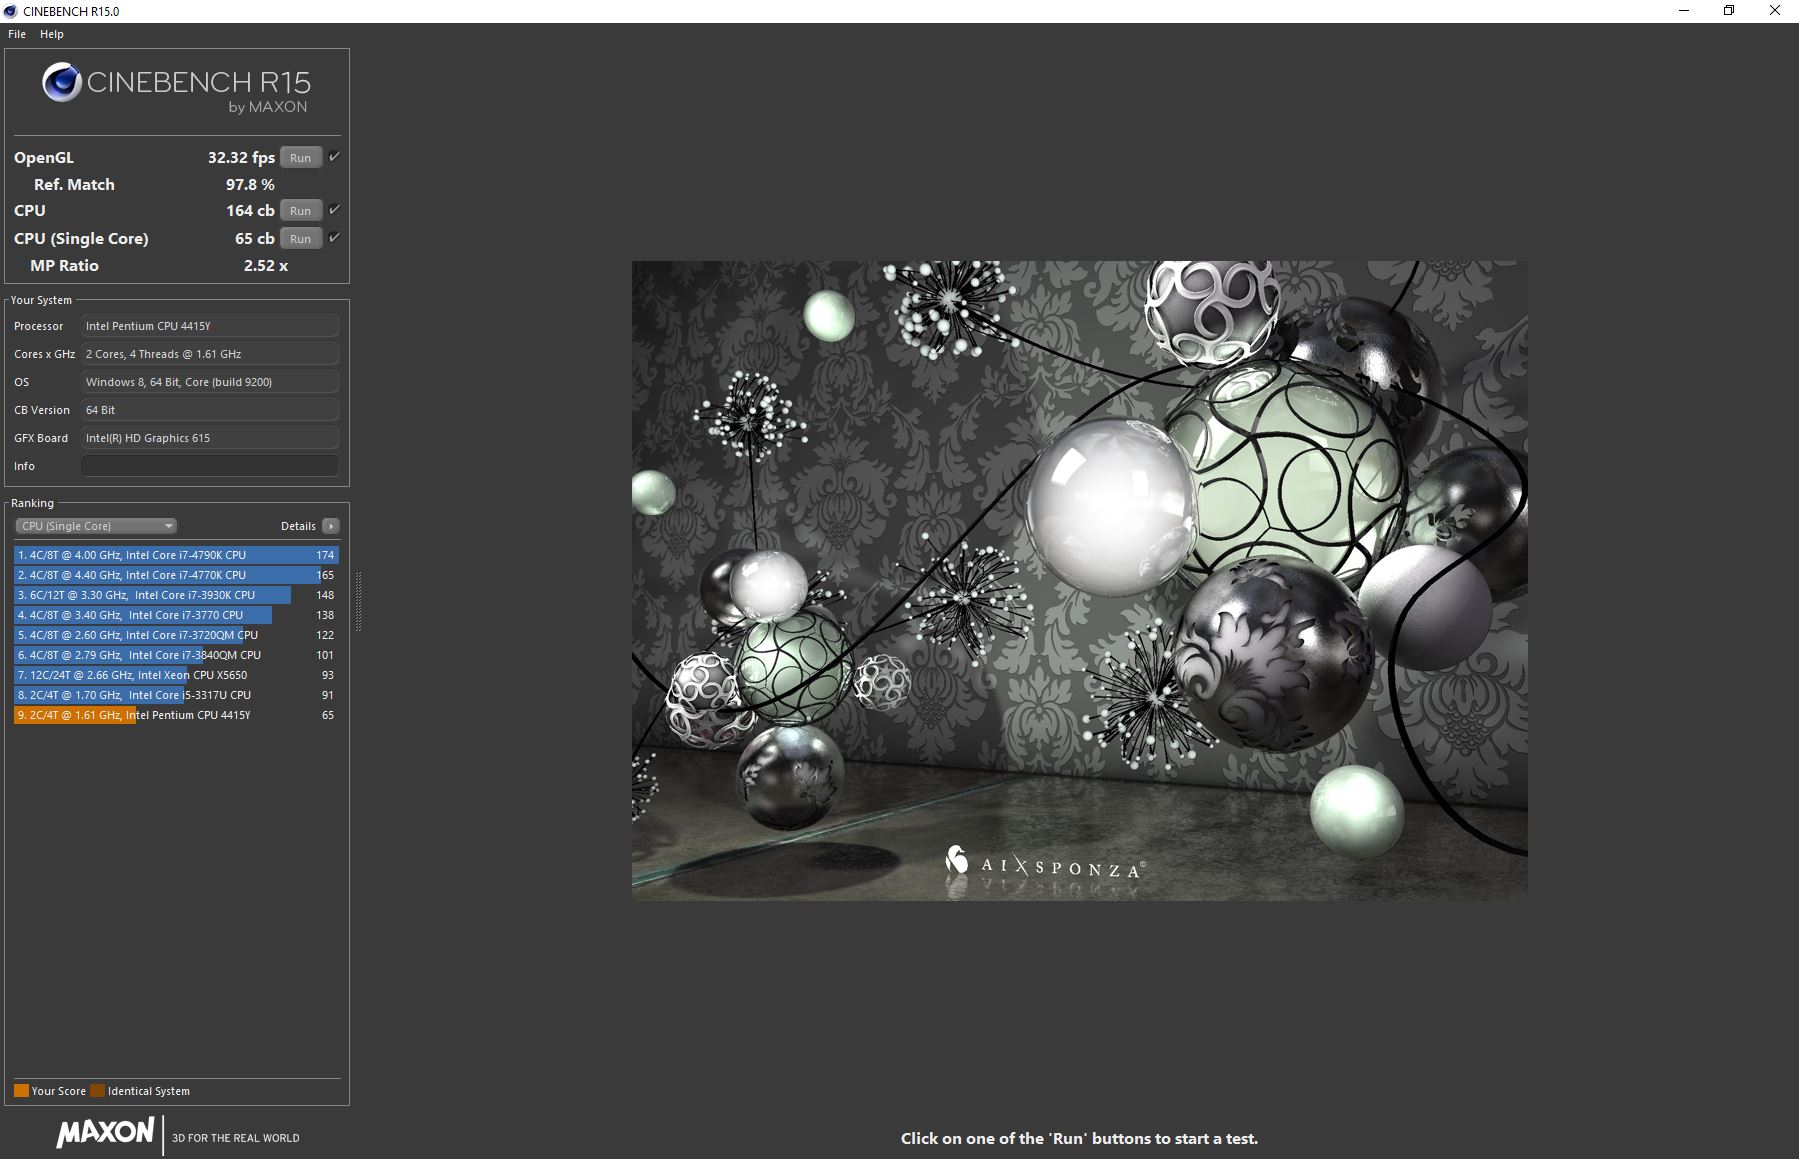
| Cinebench R15 | |
| CPU Single 64Bit | |
| Genomsnitt av klass Convertible (149.8 - 317, n=48, senaste 2 åren) | |
| Microsoft Surface Go MHN-00003 | |
| Genomsnitt Intel Pentium Gold 4415Y (n=1) | |
| Asus VivoBook Flip 14 TP401NA | |
| Acer Switch 3 SW312-31-P5VG | |
| Trekstor Primetab T13B | |
| Asus Transformer Book T102HA-GR022T | |
| Lenovo IdeaPad Miix 320-10ICR Pro LTE | |
| CPU Multi 64Bit | |
| Genomsnitt av klass Convertible (478 - 4940, n=48, senaste 2 åren) | |
| Microsoft Surface Go MHN-00003 | |
| Genomsnitt Intel Pentium Gold 4415Y (n=1) | |
| Asus VivoBook Flip 14 TP401NA | |
| Acer Switch 3 SW312-31-P5VG | |
| Trekstor Primetab T13B | |
| Asus Transformer Book T102HA-GR022T | |
| Lenovo IdeaPad Miix 320-10ICR Pro LTE | |
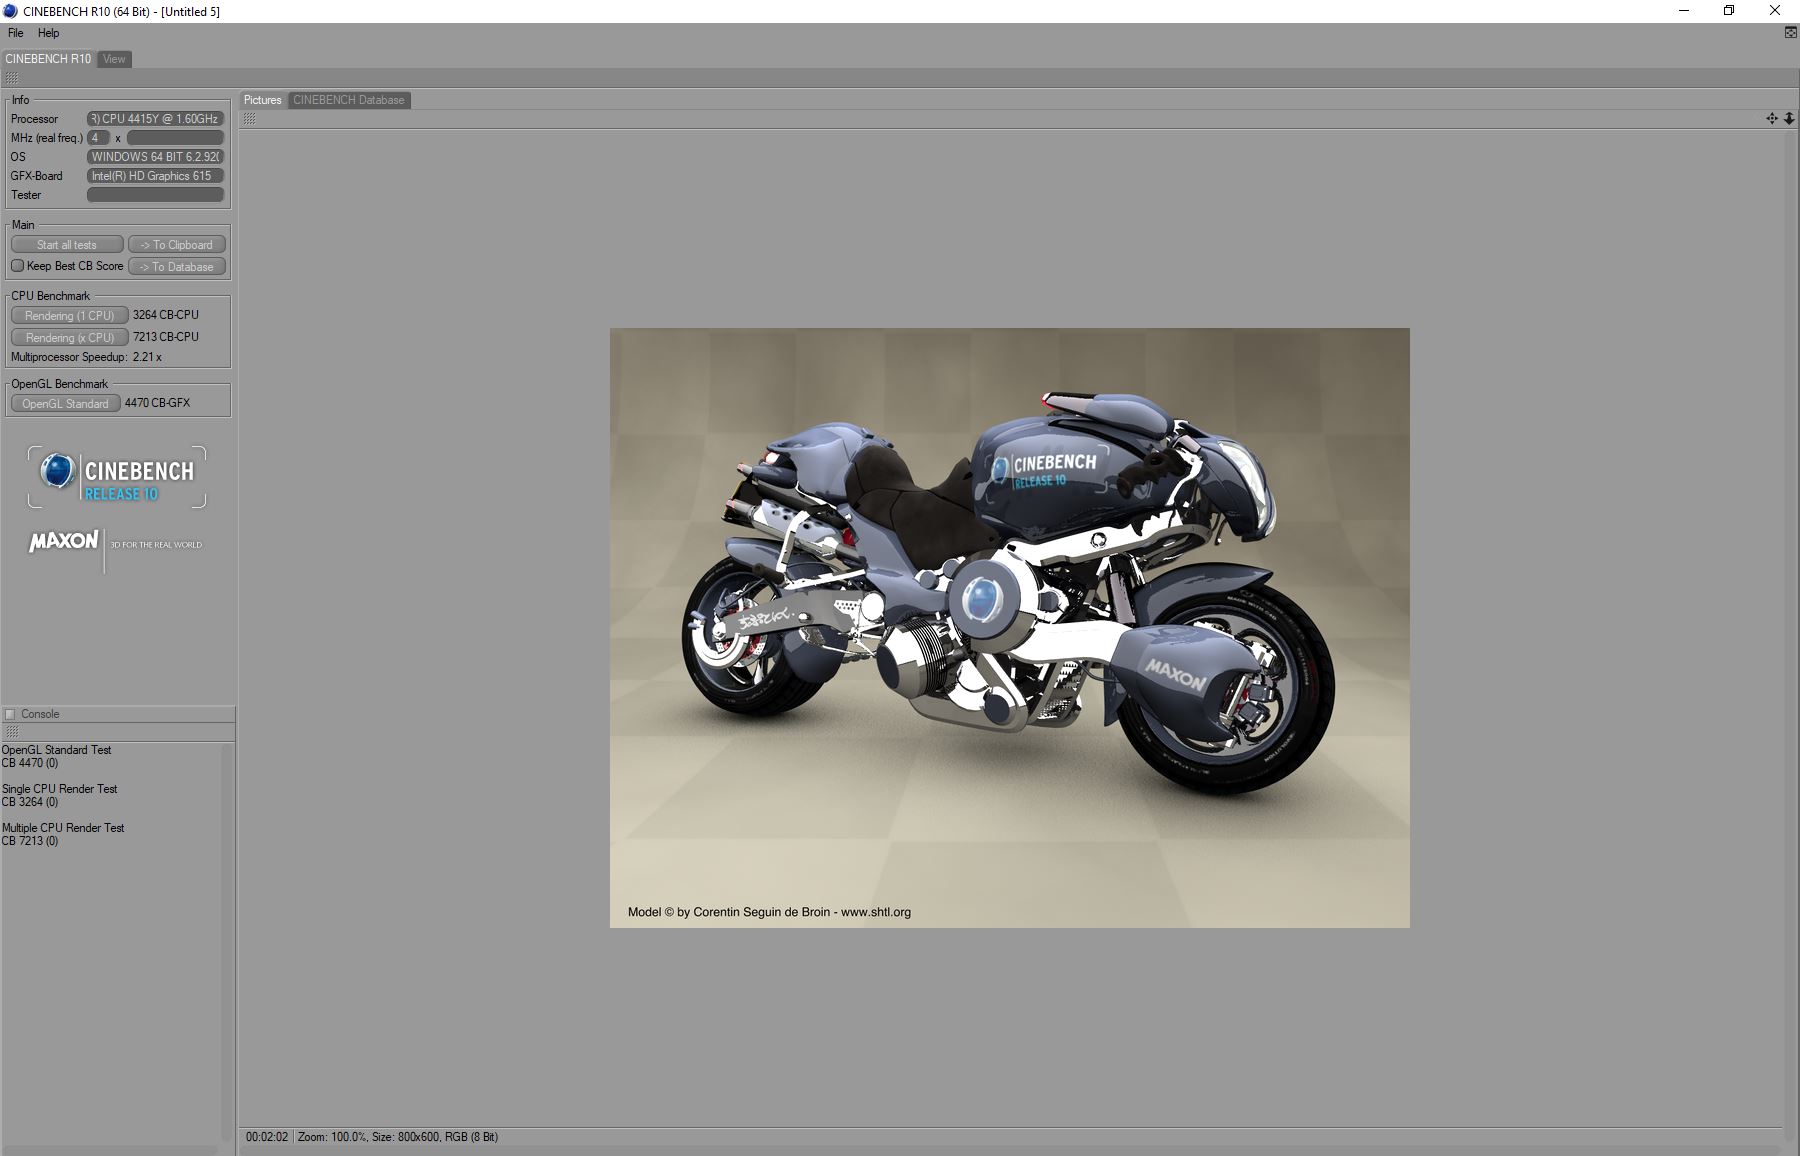
| Cinebench R10 | |
| Rendering Single CPUs 64Bit | |
| Genomsnitt av klass Convertible (12127 - 12555, n=2, senaste 2 åren) | |
| Microsoft Surface Go MHN-00003 | |
| Genomsnitt Intel Pentium Gold 4415Y (n=1) | |
| Rendering Multiple CPUs 64Bit | |
| Genomsnitt av klass Convertible (36094 - 50439, n=2, senaste 2 åren) | |
| Microsoft Surface Go MHN-00003 | |
| Genomsnitt Intel Pentium Gold 4415Y (n=1) | |
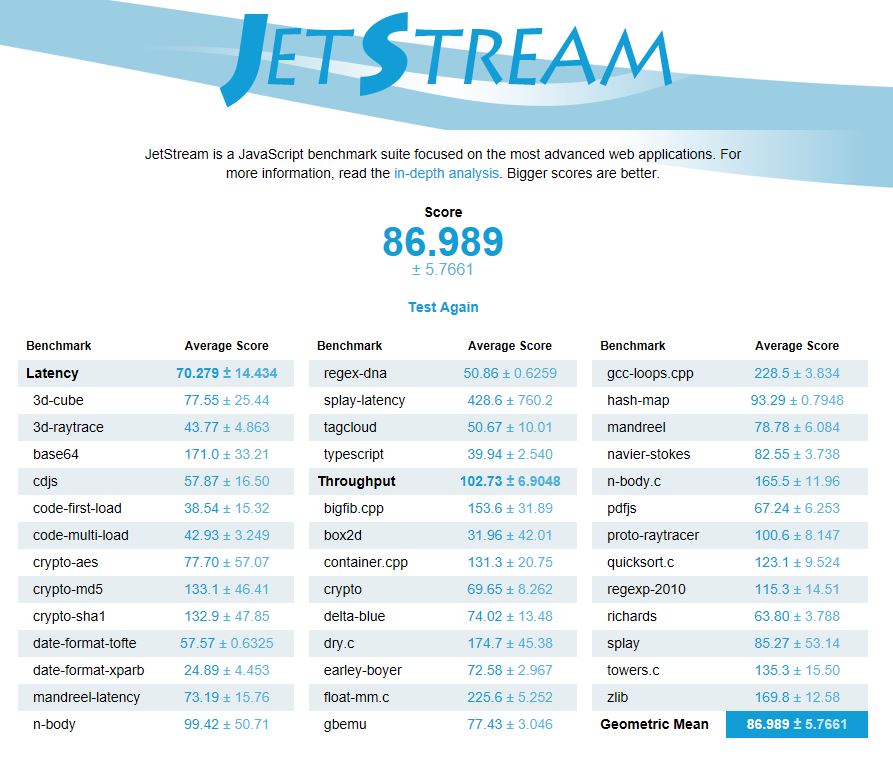
| JetStream 1.1 - 1.1 Total | |
| Microsoft Surface Go MHN-00003 | |
| Genomsnitt Intel Pentium Gold 4415Y (n=1) | |
| Acer Switch 3 SW312-31-P5VG | |
| Asus VivoBook Flip 14 TP401NA | |
| Trekstor Primetab T13B | |
| Lenovo IdeaPad Miix 320-10ICR Pro LTE | |
| Asus Transformer Book T102HA-GR022T | |
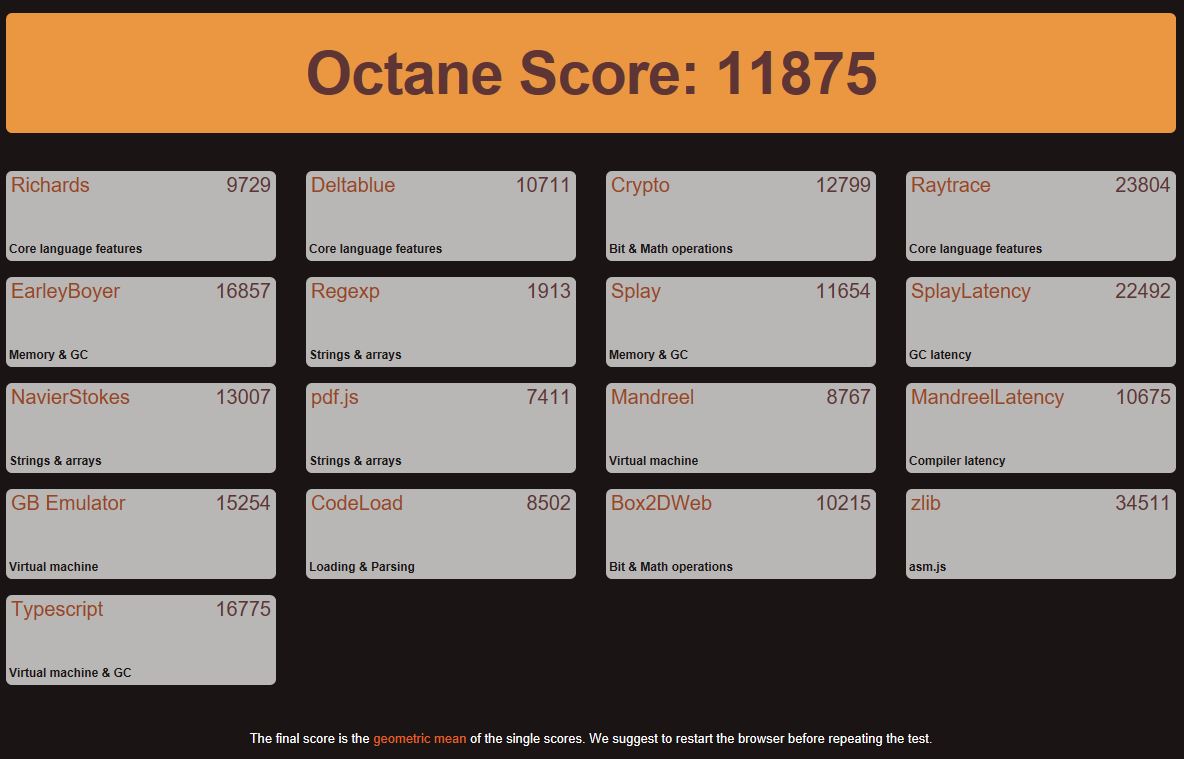
| Octane V2 - Total Score | |
| Genomsnitt av klass Convertible (50984 - 123023, n=13, senaste 2 åren) | |
| Microsoft Surface Go MHN-00003 | |
| Genomsnitt Intel Pentium Gold 4415Y (n=1) | |
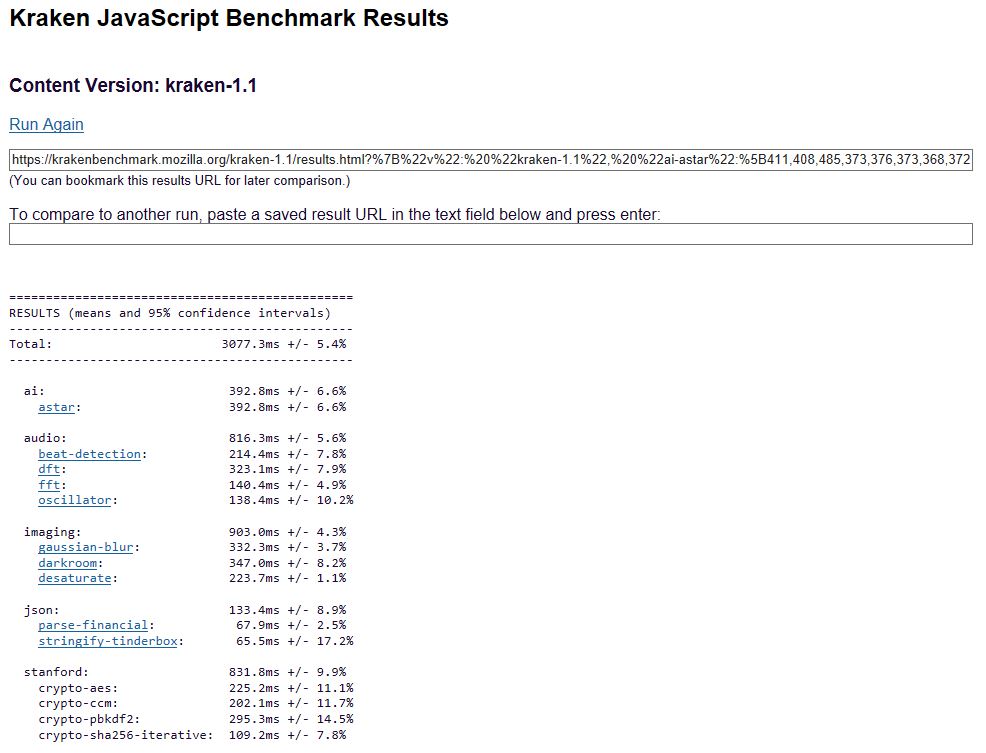
| Mozilla Kraken 1.1 - Total | |
| Microsoft Surface Go MHN-00003 | |
| Genomsnitt Intel Pentium Gold 4415Y (n=1) | |
| Genomsnitt av klass Convertible (386 - 1089, n=52, senaste 2 åren) | |
* ... mindre är bättre
| PCMark 8 - Home Score Accelerated v2 | |
| Genomsnitt av klass Convertible (n=1senaste 2 åren) | |
| Acer Switch 3 SW312-31-P5VG | |
| Asus VivoBook Flip 14 TP401NA | |
| Asus Transformer Book T102HA-GR022T | |
| Trekstor Primetab T13B | |
| Lenovo IdeaPad Miix 320-10ICR Pro LTE | |
| Microsoft Surface Go MHN-00003 | |
| Genomsnitt Intel Pentium Gold 4415Y, Intel UHD Graphics 615 (n=1) | |
| PCMark 8 Home Score Accelerated v2 | 741 poäng | |
Hjälp | ||
| Microsoft Surface Go MHN-00003 64 GB eMMC Flash | Asus Transformer Book T102HA-GR022T 128 GB eMMC Flash | Trekstor Primetab T13B SanDisk SEM64G | Lenovo IdeaPad Miix 320-10ICR Pro LTE SanDisk DF4128 | Acer Switch 3 SW312-31-P5VG Hynix HCG4a2 64 GB | Asus VivoBook Flip 14 TP401NA 128 GB eMMC Flash | Genomsnitt 64 GB eMMC Flash | |
|---|---|---|---|---|---|---|---|
| CrystalDiskMark 3.0 | -48% | -71% | -56% | 5% | 12% | -46% | |
| Read Seq (MB/s) | 259.6 | 139 -46% | 123.6 -52% | 92.7 -64% | 272.2 5% | 263.1 1% | 145.5 ? -44% |
| Write Seq (MB/s) | 122.4 | 54.1 -56% | 41.03 -66% | 54.5 -55% | 149.3 22% | 191.5 56% | 60.7 ? -50% |
| Read 512 (MB/s) | 190.6 | 121 -37% | 99.2 -48% | 68.6 -64% | 231.6 22% | 218.4 15% | 127.2 ? -33% |
| Write 512 (MB/s) | 107.1 | 44.39 -59% | 23.89 -78% | 39.86 -63% | 140 31% | 178.5 67% | 49.3 ? -54% |
| Read 4k (MB/s) | 19.06 | 9.935 -48% | 4.327 -77% | 6.705 -65% | 11.43 -40% | 24.11 26% | 12.2 ? -36% |
| Write 4k (MB/s) | 24.27 | 9.877 -59% | 2.929 -88% | 8.555 -65% | 26.31 8% | 19.36 -20% | 9.29 ? -62% |
| Read 4k QD32 (MB/s) | 34.45 | 30.03 -13% | 11 -68% | 32.71 -5% | 30.39 -12% | 28.6 -17% | 24.8 ? -28% |
| Write 4k QD32 (MB/s) | 33.64 | 10.67 -68% | 3.808 -89% | 11.5 -66% | 33.54 0% | 22.65 -33% | 12.1 ? -64% |

| 3DMark 11 - 1280x720 Performance GPU | |
| Genomsnitt av klass Convertible (1505 - 40732, n=48, senaste 2 åren) | |
| Microsoft Surface Go MHN-00003 | |
| Genomsnitt Intel UHD Graphics 615 (821 - 1378, n=10) | |
| Acer Switch 3 SW312-31-P5VG | |
| Asus VivoBook Flip 14 TP401NA | |
| Trekstor Primetab T13B | |
| Asus Transformer Book T102HA-GR022T | |
| Lenovo IdeaPad Miix 320-10ICR Pro LTE | |
| 3DMark | |
| 1280x720 Cloud Gate Standard Graphics | |
| Genomsnitt av klass Convertible (7885 - 57566, n=32, senaste 2 åren) | |
| Microsoft Surface Go MHN-00003 | |
| Genomsnitt Intel UHD Graphics 615 (4521 - 7568, n=10) | |
| Asus VivoBook Flip 14 TP401NA | |
| Asus Transformer Book T102HA-GR022T | |
| 1920x1080 Fire Strike Graphics | |
| Genomsnitt av klass Convertible (1185 - 27447, n=48, senaste 2 åren) | |
| Microsoft Surface Go MHN-00003 | |
| Genomsnitt Intel UHD Graphics 615 (563 - 976, n=11) | |
| Asus VivoBook Flip 14 TP401NA | |
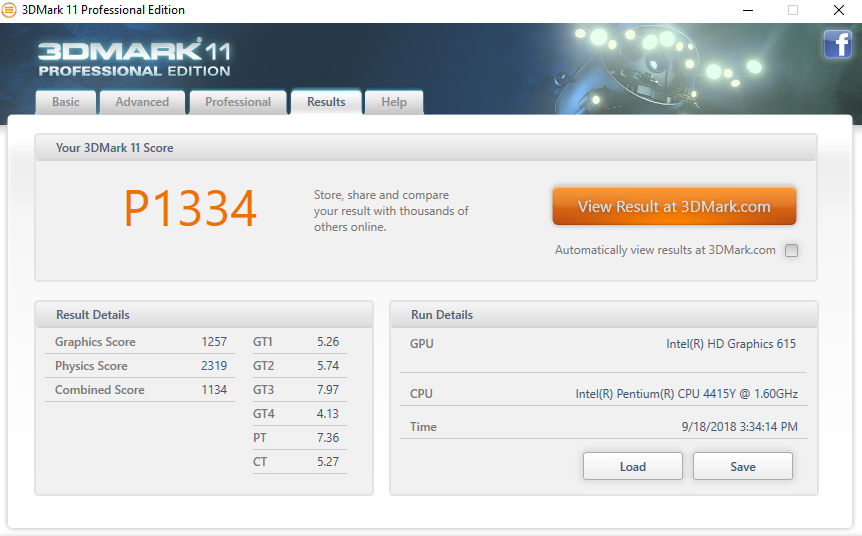
| 3DMark 11 Performance | 1334 poäng | |
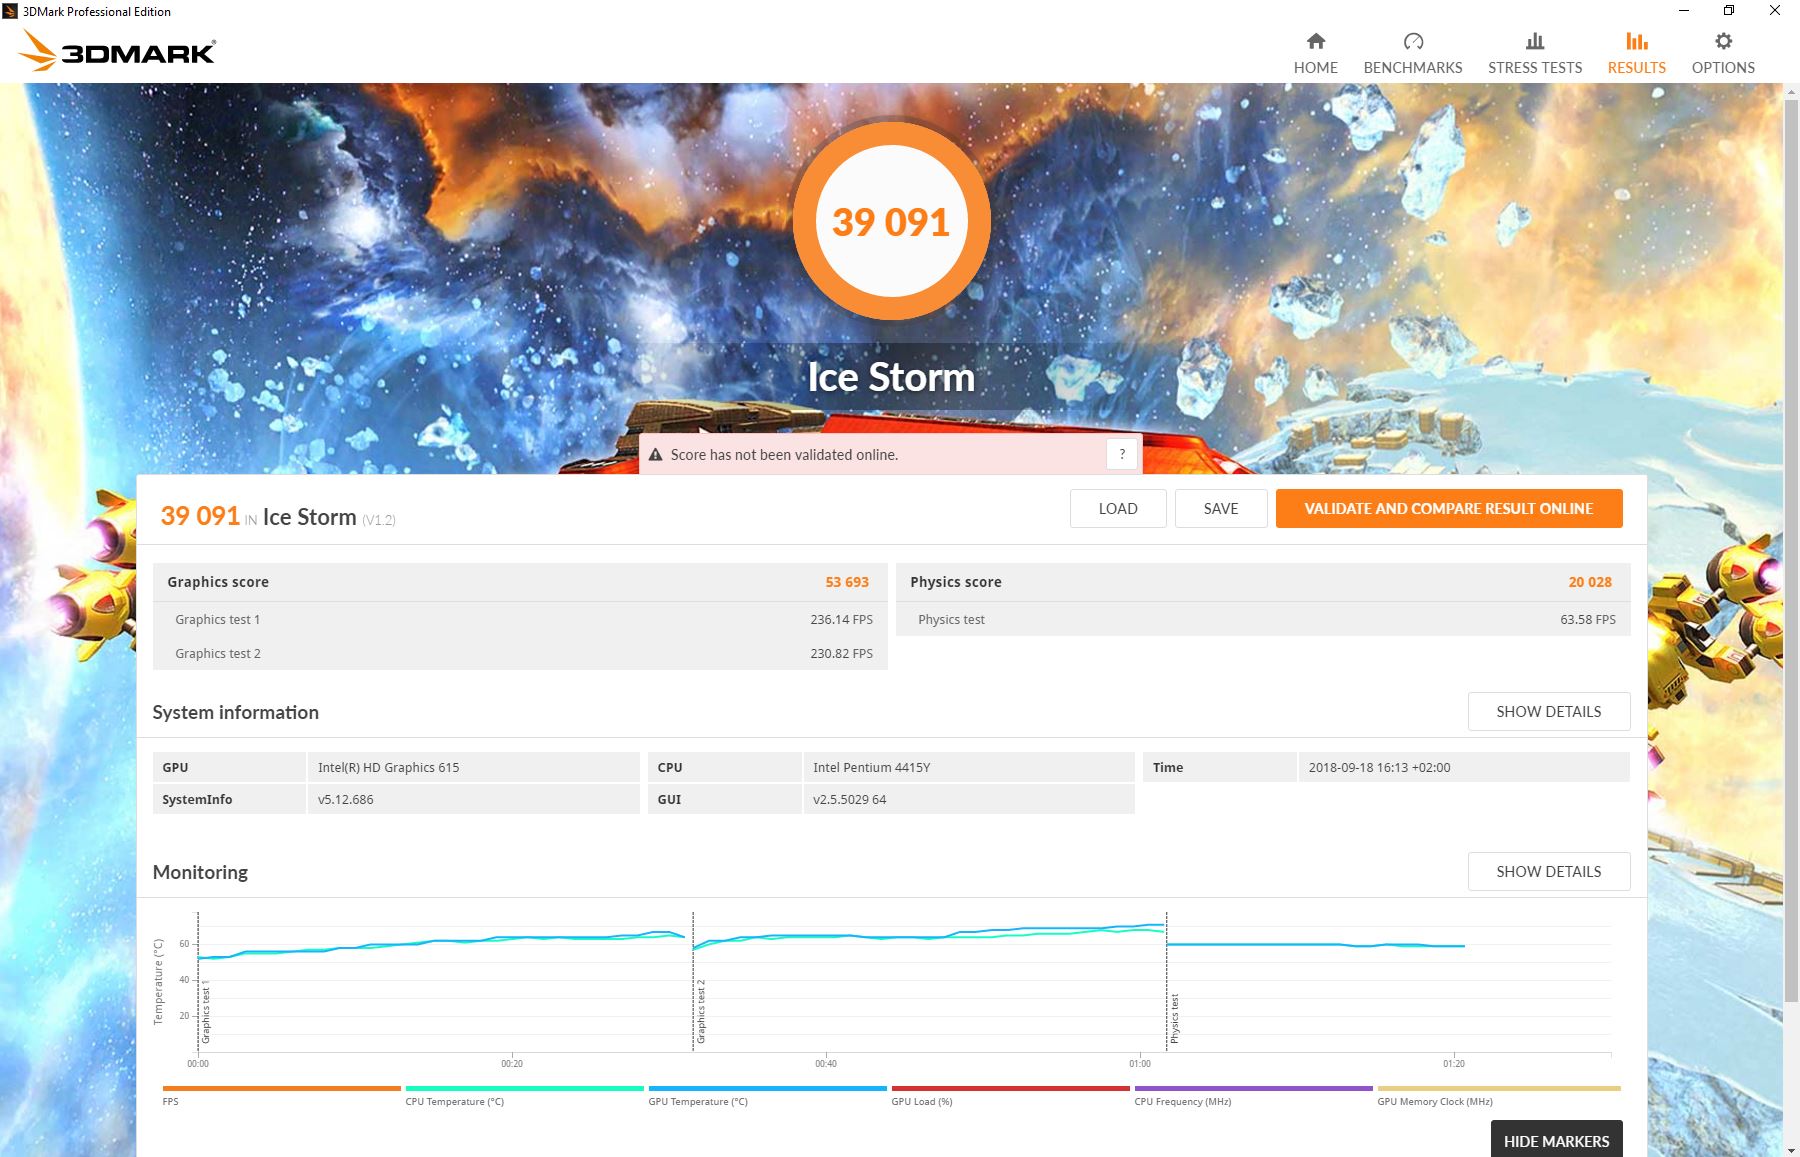
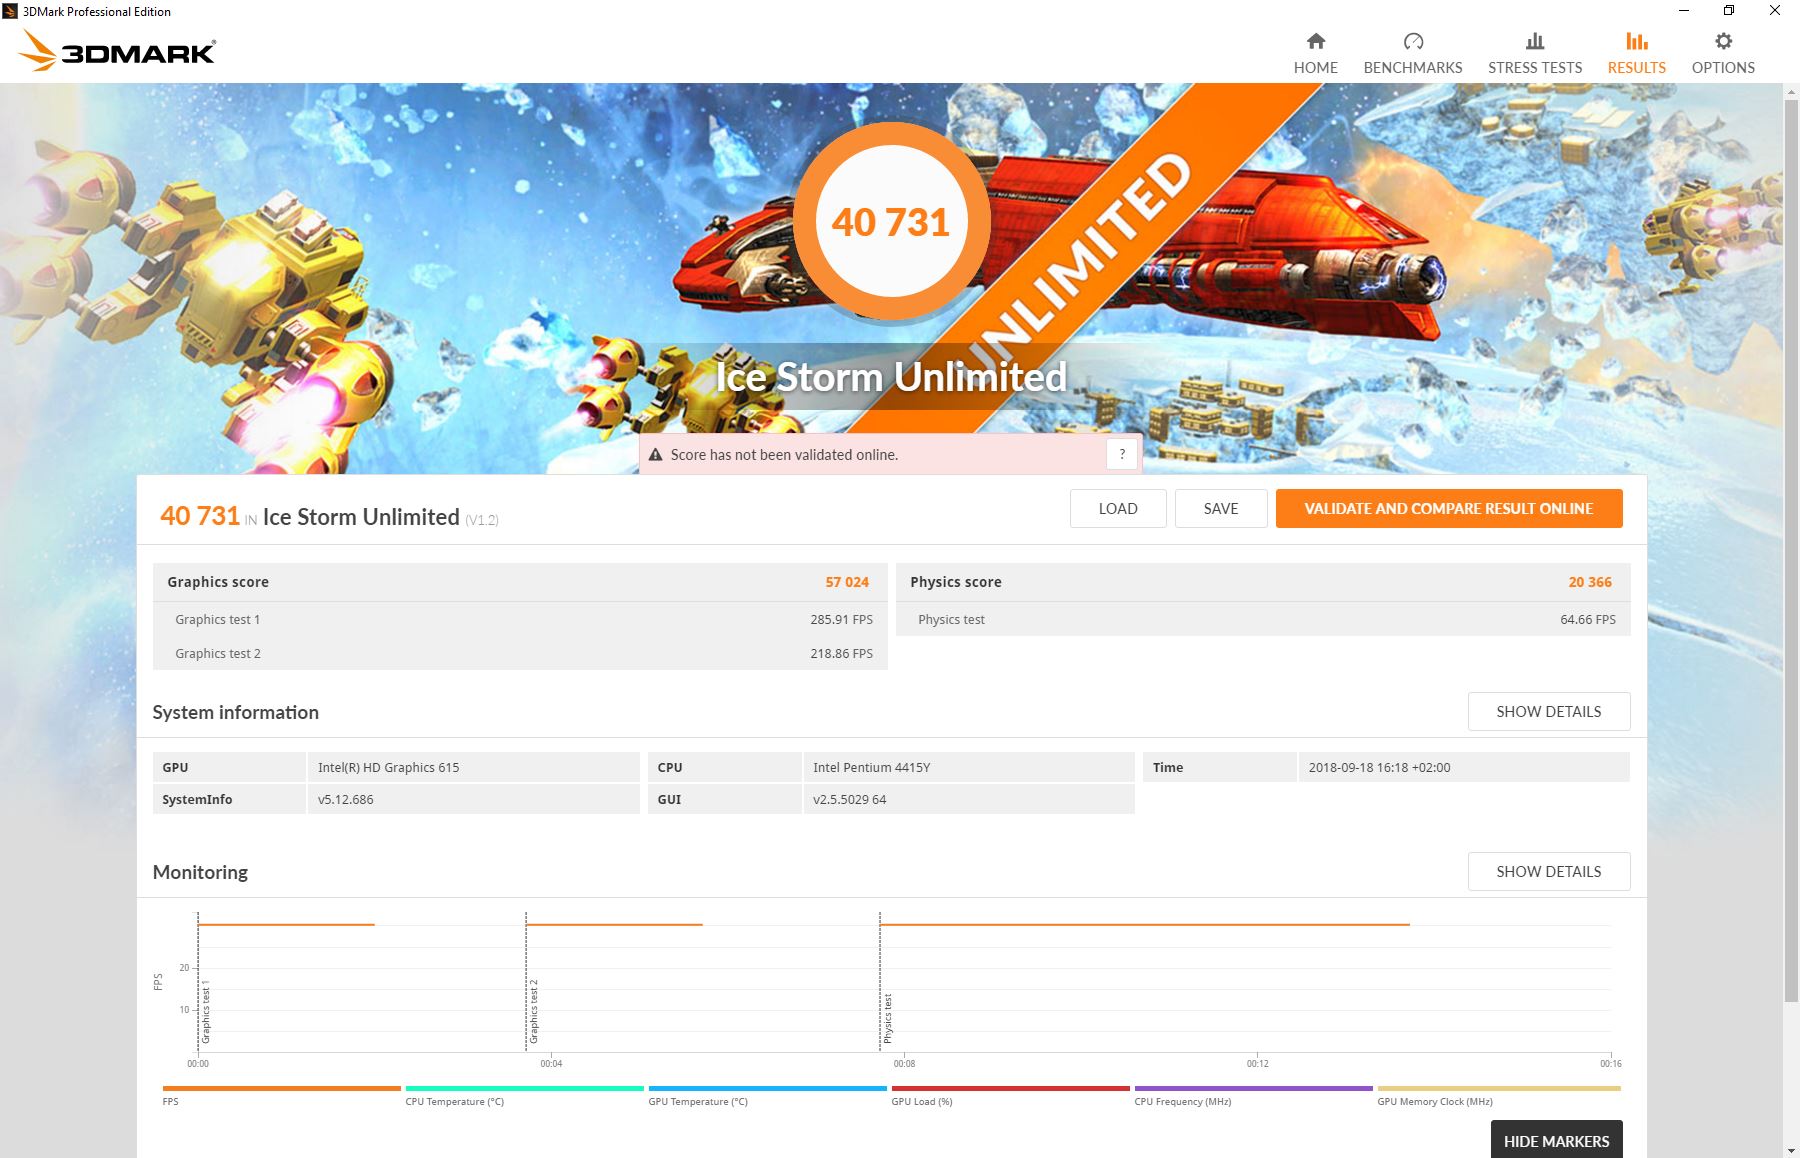
| 3DMark Ice Storm Standard Score | 39091 poäng | |
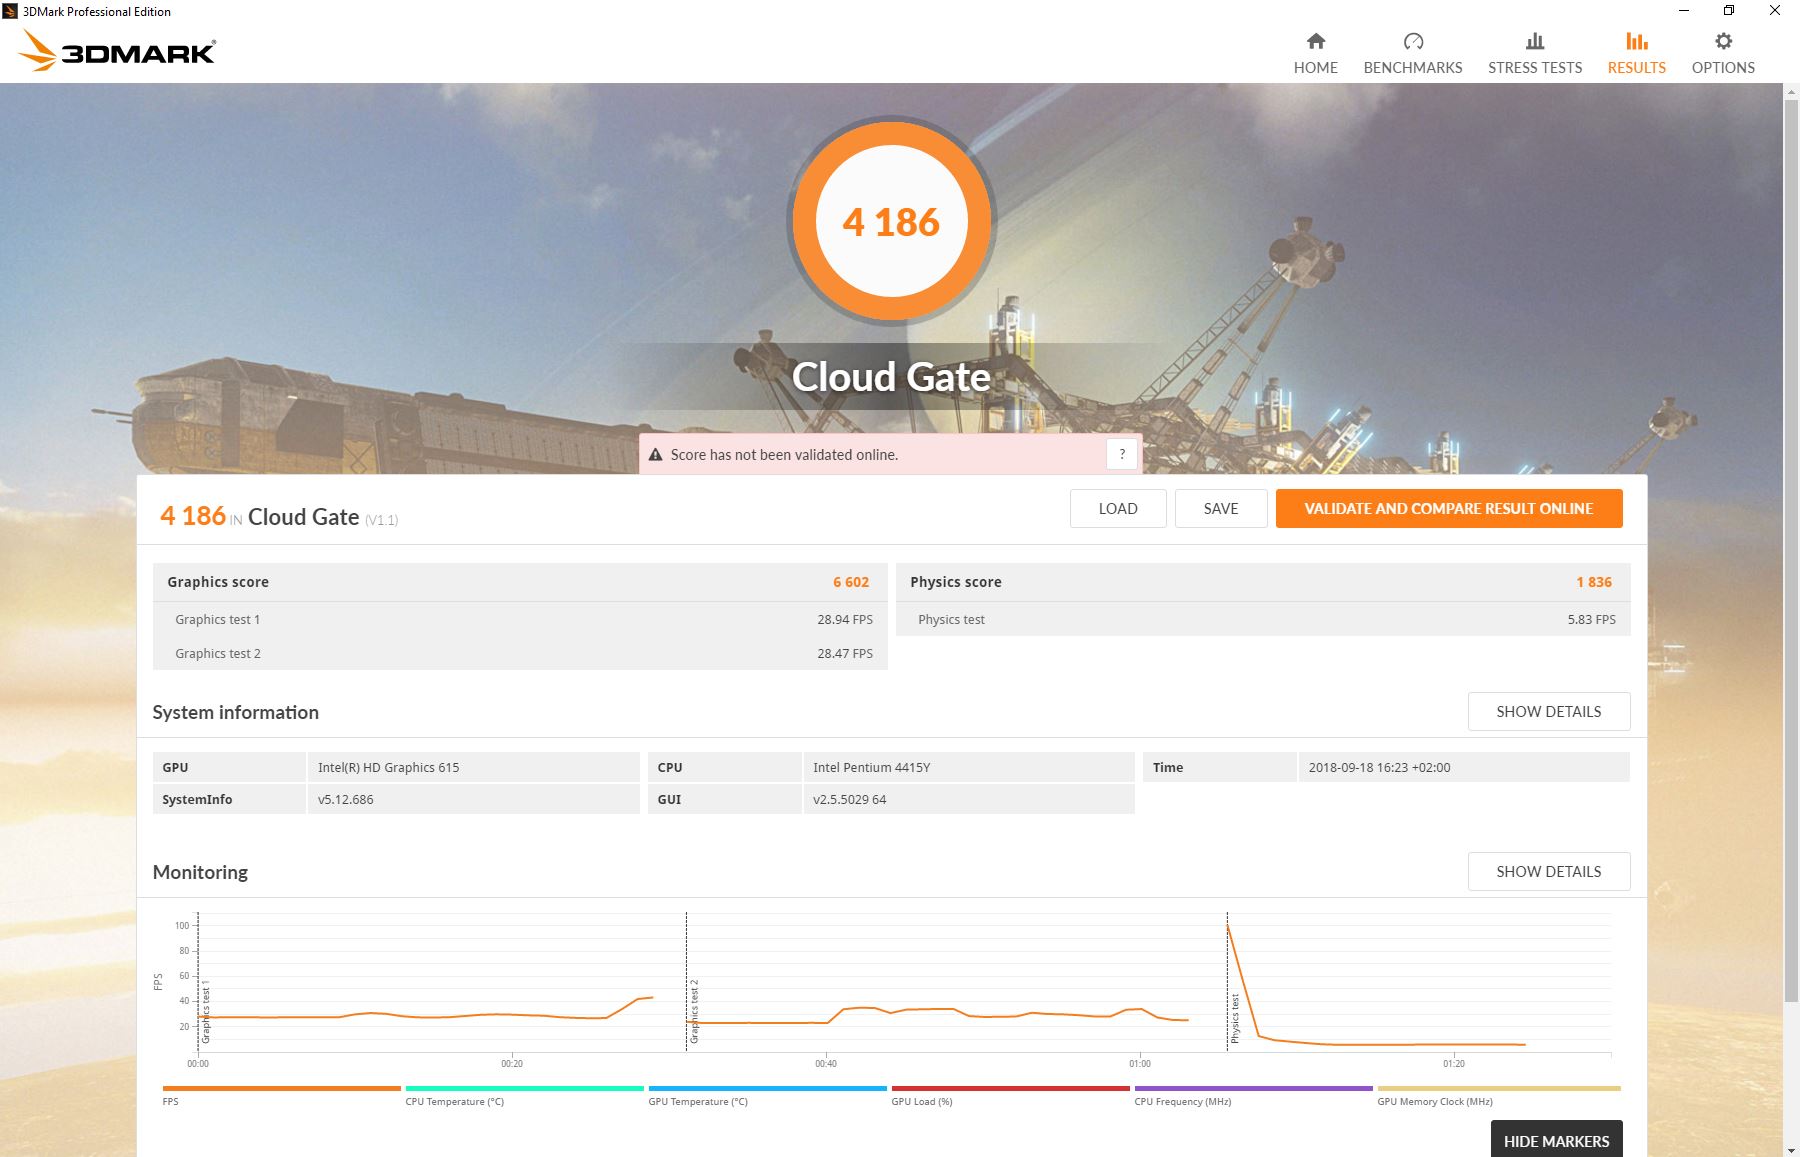
| 3DMark Cloud Gate Standard Score | 4186 poäng | |
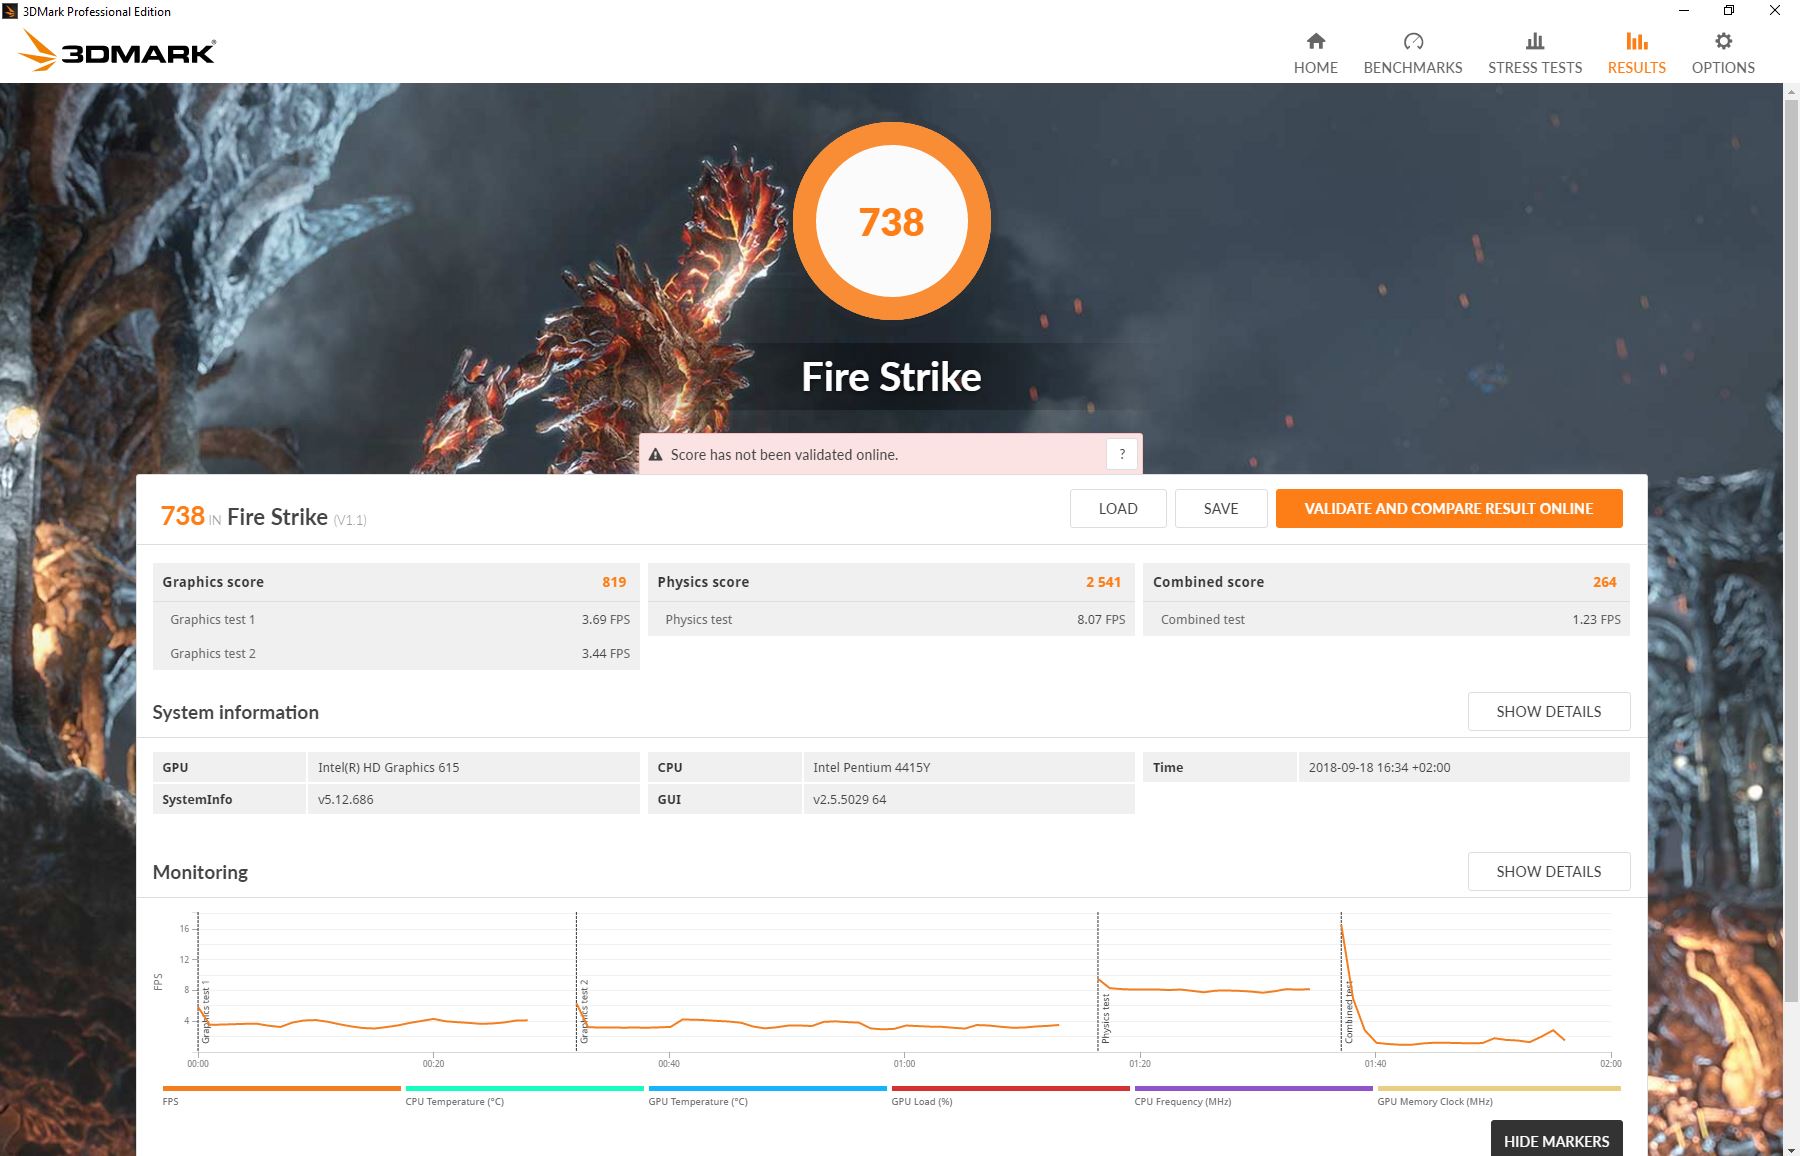
| 3DMark Fire Strike Score | 738 poäng | |
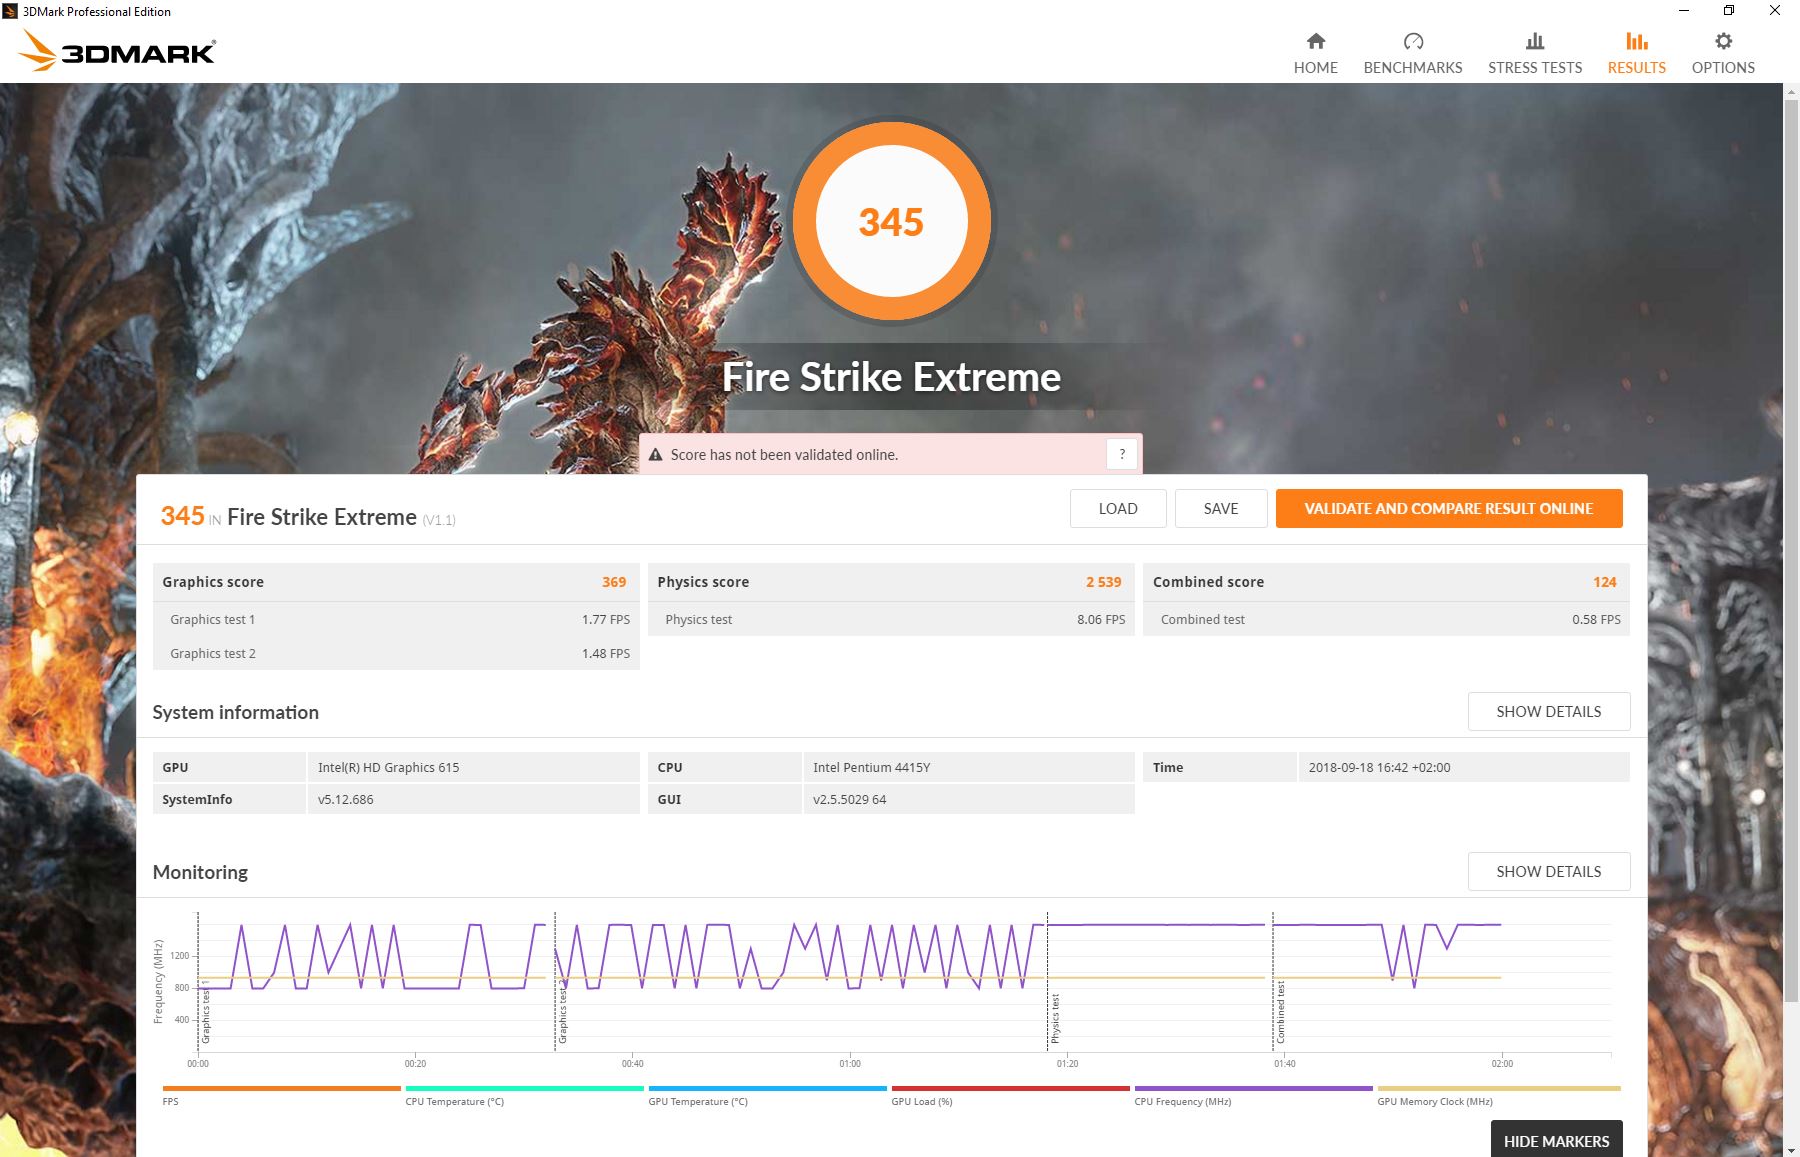
| 3DMark Fire Strike Extreme Score | 345 poäng | |
Hjälp | ||
| låg | med. | hög | ultra | |
|---|---|---|---|---|
| BioShock Infinite (2013) | 38.3 | 22.4 | 17.5 | 0 () |
| Battlefield 4 (2013) | 25.3 | 18.4 | 12.1 | |
| Rise of the Tomb Raider (2016) | 10.5 | 6.3 |
(±) Den maximala temperaturen på ovansidan är 44 °C / 111 F, jämfört med genomsnittet av 35.4 °C / 96 F , allt från 19.6 till 60 °C för klassen Convertible.
(±) Botten värms upp till maximalt 43 °C / 109 F, jämfört med genomsnittet av 36.9 °C / 98 F
(+) Vid tomgångsbruk är medeltemperaturen för ovansidan 24.5 °C / 76 F, jämfört med enhetsgenomsnittet på 30.3 °C / ### class_avg_f### F.
(±) Handledsstöden och pekplattan kan bli väldigt varma vid beröring med maximalt 37.7 °C / 99.9 F.
(-) Medeltemperaturen för handledsstödsområdet på liknande enheter var 28 °C / 82.4 F (-9.7 °C / -17.5 F).
| Microsoft Surface Go MHN-00003 UHD Graphics 615, Pentium 4415Y, 64 GB eMMC Flash | Asus Transformer Book T102HA-GR022T HD Graphics 400 (Braswell), Z8350, 128 GB eMMC Flash | Trekstor Primetab T13B HD Graphics 505, Pentium N4200, SanDisk SEM64G | Lenovo IdeaPad Miix 320-10ICR Pro LTE HD Graphics 400 (Braswell), Z8350, SanDisk DF4128 | Acer Switch 3 SW312-31-P5VG HD Graphics 505, Pentium N4200, Hynix HCG4a2 64 GB | Asus VivoBook Flip 14 TP401NA HD Graphics 505, Pentium N4200, 128 GB eMMC Flash | |
|---|---|---|---|---|---|---|
| Heat | -0% | -13% | -2% | -11% | -12% | |
| Maximum Upper Side * (°C) | 44 | 38.7 12% | 42 5% | 36.6 17% | 39.4 10% | 40 9% |
| Maximum Bottom * (°C) | 43 | 36.3 16% | 41.8 3% | 38.9 10% | 38.6 10% | 39.5 8% |
| Idle Upper Side * (°C) | 26 | 30.6 -18% | 35.8 -38% | 30 -15% | 36.5 -40% | 34.1 -31% |
| Idle Bottom * (°C) | 24.4 | 27.1 -11% | 30.1 -23% | 29.6 -21% | 30.2 -24% | 33 -35% |
* ... mindre är bättre
Microsoft Surface Go MHN-00003 ljudanalys
(-) | inte särskilt höga högtalare (69.8 dB)
Bas 100 - 315 Hz
(±) | reducerad bas - i genomsnitt 12.6% lägre än medianen
(±) | linjäriteten för basen är genomsnittlig (12.2% delta till föregående frekvens)
Mellan 400 - 2000 Hz
(±) | högre mellan - i genomsnitt 7% högre än median
(±) | linjäriteten för mids är genomsnittlig (11.4% delta till föregående frekvens)
Högsta 2 - 16 kHz
(+) | balanserade toppar - endast 4.7% från medianen
(±) | linjäriteten för toppar är genomsnittlig (12.4% delta till föregående frekvens)
Totalt 100 - 16 000 Hz
(±) | linjäriteten för det totala ljudet är genomsnittlig (27.9% skillnad mot median)
Jämfört med samma klass
» 85% av alla testade enheter i den här klassen var bättre, 2% liknande, 13% sämre
» Den bästa hade ett delta på 6%, genomsnittet var 20%, sämst var 57%
Jämfört med alla testade enheter
» 85% av alla testade enheter var bättre, 3% liknande, 12% sämre
» Den bästa hade ett delta på 4%, genomsnittet var 23%, sämst var 134%
Asus Transformer Book T102HA-GR022T ljudanalys
(-) | inte särskilt höga högtalare (71.1 dB)
Bas 100 - 315 Hz
(-) | nästan ingen bas - i genomsnitt 19.8% lägre än medianen
(±) | linjäriteten för basen är genomsnittlig (11.4% delta till föregående frekvens)
Mellan 400 - 2000 Hz
(+) | balanserad mellan - endast 2.4% från medianen
(±) | linjäriteten för mids är genomsnittlig (9.7% delta till föregående frekvens)
Högsta 2 - 16 kHz
(±) | högre toppar - i genomsnitt 6.8% högre än medianen
(±) | linjäriteten för toppar är genomsnittlig (11.6% delta till föregående frekvens)
Totalt 100 - 16 000 Hz
(±) | linjäriteten för det totala ljudet är genomsnittlig (24.6% skillnad mot median)
Jämfört med samma klass
» 75% av alla testade enheter i den här klassen var bättre, 6% liknande, 19% sämre
» Den bästa hade ett delta på 6%, genomsnittet var 20%, sämst var 57%
Jämfört med alla testade enheter
» 75% av alla testade enheter var bättre, 5% liknande, 20% sämre
» Den bästa hade ett delta på 4%, genomsnittet var 23%, sämst var 134%
| Av/Standby | |
| Låg belastning | |
| Hög belastning |
|
Förklaring:
min: | |
| Microsoft Surface Go MHN-00003 Pentium 4415Y, UHD Graphics 615, 64 GB eMMC Flash, IPS, 1800x1200, 10" | Asus Transformer Book T102HA-GR022T Z8350, HD Graphics 400 (Braswell), 128 GB eMMC Flash, IPS, 1280x800, 10.1" | Trekstor Primetab T13B Pentium N4200, HD Graphics 505, SanDisk SEM64G, IPS, 1920x1080, 13.3" | Lenovo IdeaPad Miix 320-10ICR Pro LTE Z8350, HD Graphics 400 (Braswell), SanDisk DF4128, IPS, 1920x1200, 10.1" | Acer Switch 3 SW312-31-P5VG Pentium N4200, HD Graphics 505, Hynix HCG4a2 64 GB, IPS, 1920x1200, 12.2" | Asus VivoBook Flip 14 TP401NA Pentium N4200, HD Graphics 505, 128 GB eMMC Flash, IPS, 1920x1080, 14" | Genomsnitt Intel UHD Graphics 615 | Genomsnitt av klass Convertible | |
|---|---|---|---|---|---|---|---|---|
| Power Consumption | 17% | -23% | 18% | -32% | 6% | -14% | -92% | |
| Idle Minimum * (Watt) | 2.88 | 2.5 13% | 3.9 -35% | 3 -4% | 4.1 -42% | 4.26 -48% | 3.55 ? -23% | 4.28 ? -49% |
| Idle Average * (Watt) | 4.8 | 5.7 -19% | 9.3 -94% | 5.3 -10% | 9.3 -94% | 7.1 -48% | 6.17 ? -29% | 6.96 ? -45% |
| Idle Maximum * (Watt) | 7.5 | 5.9 21% | 10.9 -45% | 6.4 15% | 9.8 -31% | 7.44 1% | 7.61 ? -1% | 8.67 ? -16% |
| Load Average * (Watt) | 16.9 | 12 29% | 12.6 25% | 10.9 36% | 18.9 -12% | 1.4 92% | 18.2 ? -8% | 45.1 ? -167% |
| Load Maximum * (Watt) | 23.8 | 13.9 42% | 15.6 34% | 11 54% | 19 20% | 15.6 34% | 25.4 ? -7% | 67.7 ? -184% |
* ... mindre är bättre
| Microsoft Surface Go MHN-00003 Pentium 4415Y, UHD Graphics 615, 28 Wh | Asus Transformer Book T102HA-GR022T Z8350, HD Graphics 400 (Braswell), 32 Wh | Trekstor Primetab T13B Pentium N4200, HD Graphics 505, 37 Wh | Lenovo IdeaPad Miix 320-10ICR Pro LTE Z8350, HD Graphics 400 (Braswell), 33.3 Wh | Acer Switch 3 SW312-31-P5VG Pentium N4200, HD Graphics 505, 36 Wh | Asus VivoBook Flip 14 TP401NA Pentium N4200, HD Graphics 505, 39 Wh | Genomsnitt av klass Convertible | |
|---|---|---|---|---|---|---|---|
| Batteridrifttid | 47% | -45% | 3% | -31% | -13% | 65% | |
| Reader / Idle (h) | 12.9 | 26.7 ? 107% | |||||
| H.264 (h) | 6.4 | 15 ? 134% | |||||
| WiFi v1.3 (h) | 7.5 | 11 47% | 4.1 -45% | 7.7 3% | 5.2 -31% | 6.5 -13% | 12 ? 60% |
| Load (h) | 3 | 1.713 ? -43% |
För
Emot

Läs den fullständiga versionen av den här recensionen på engelska här.
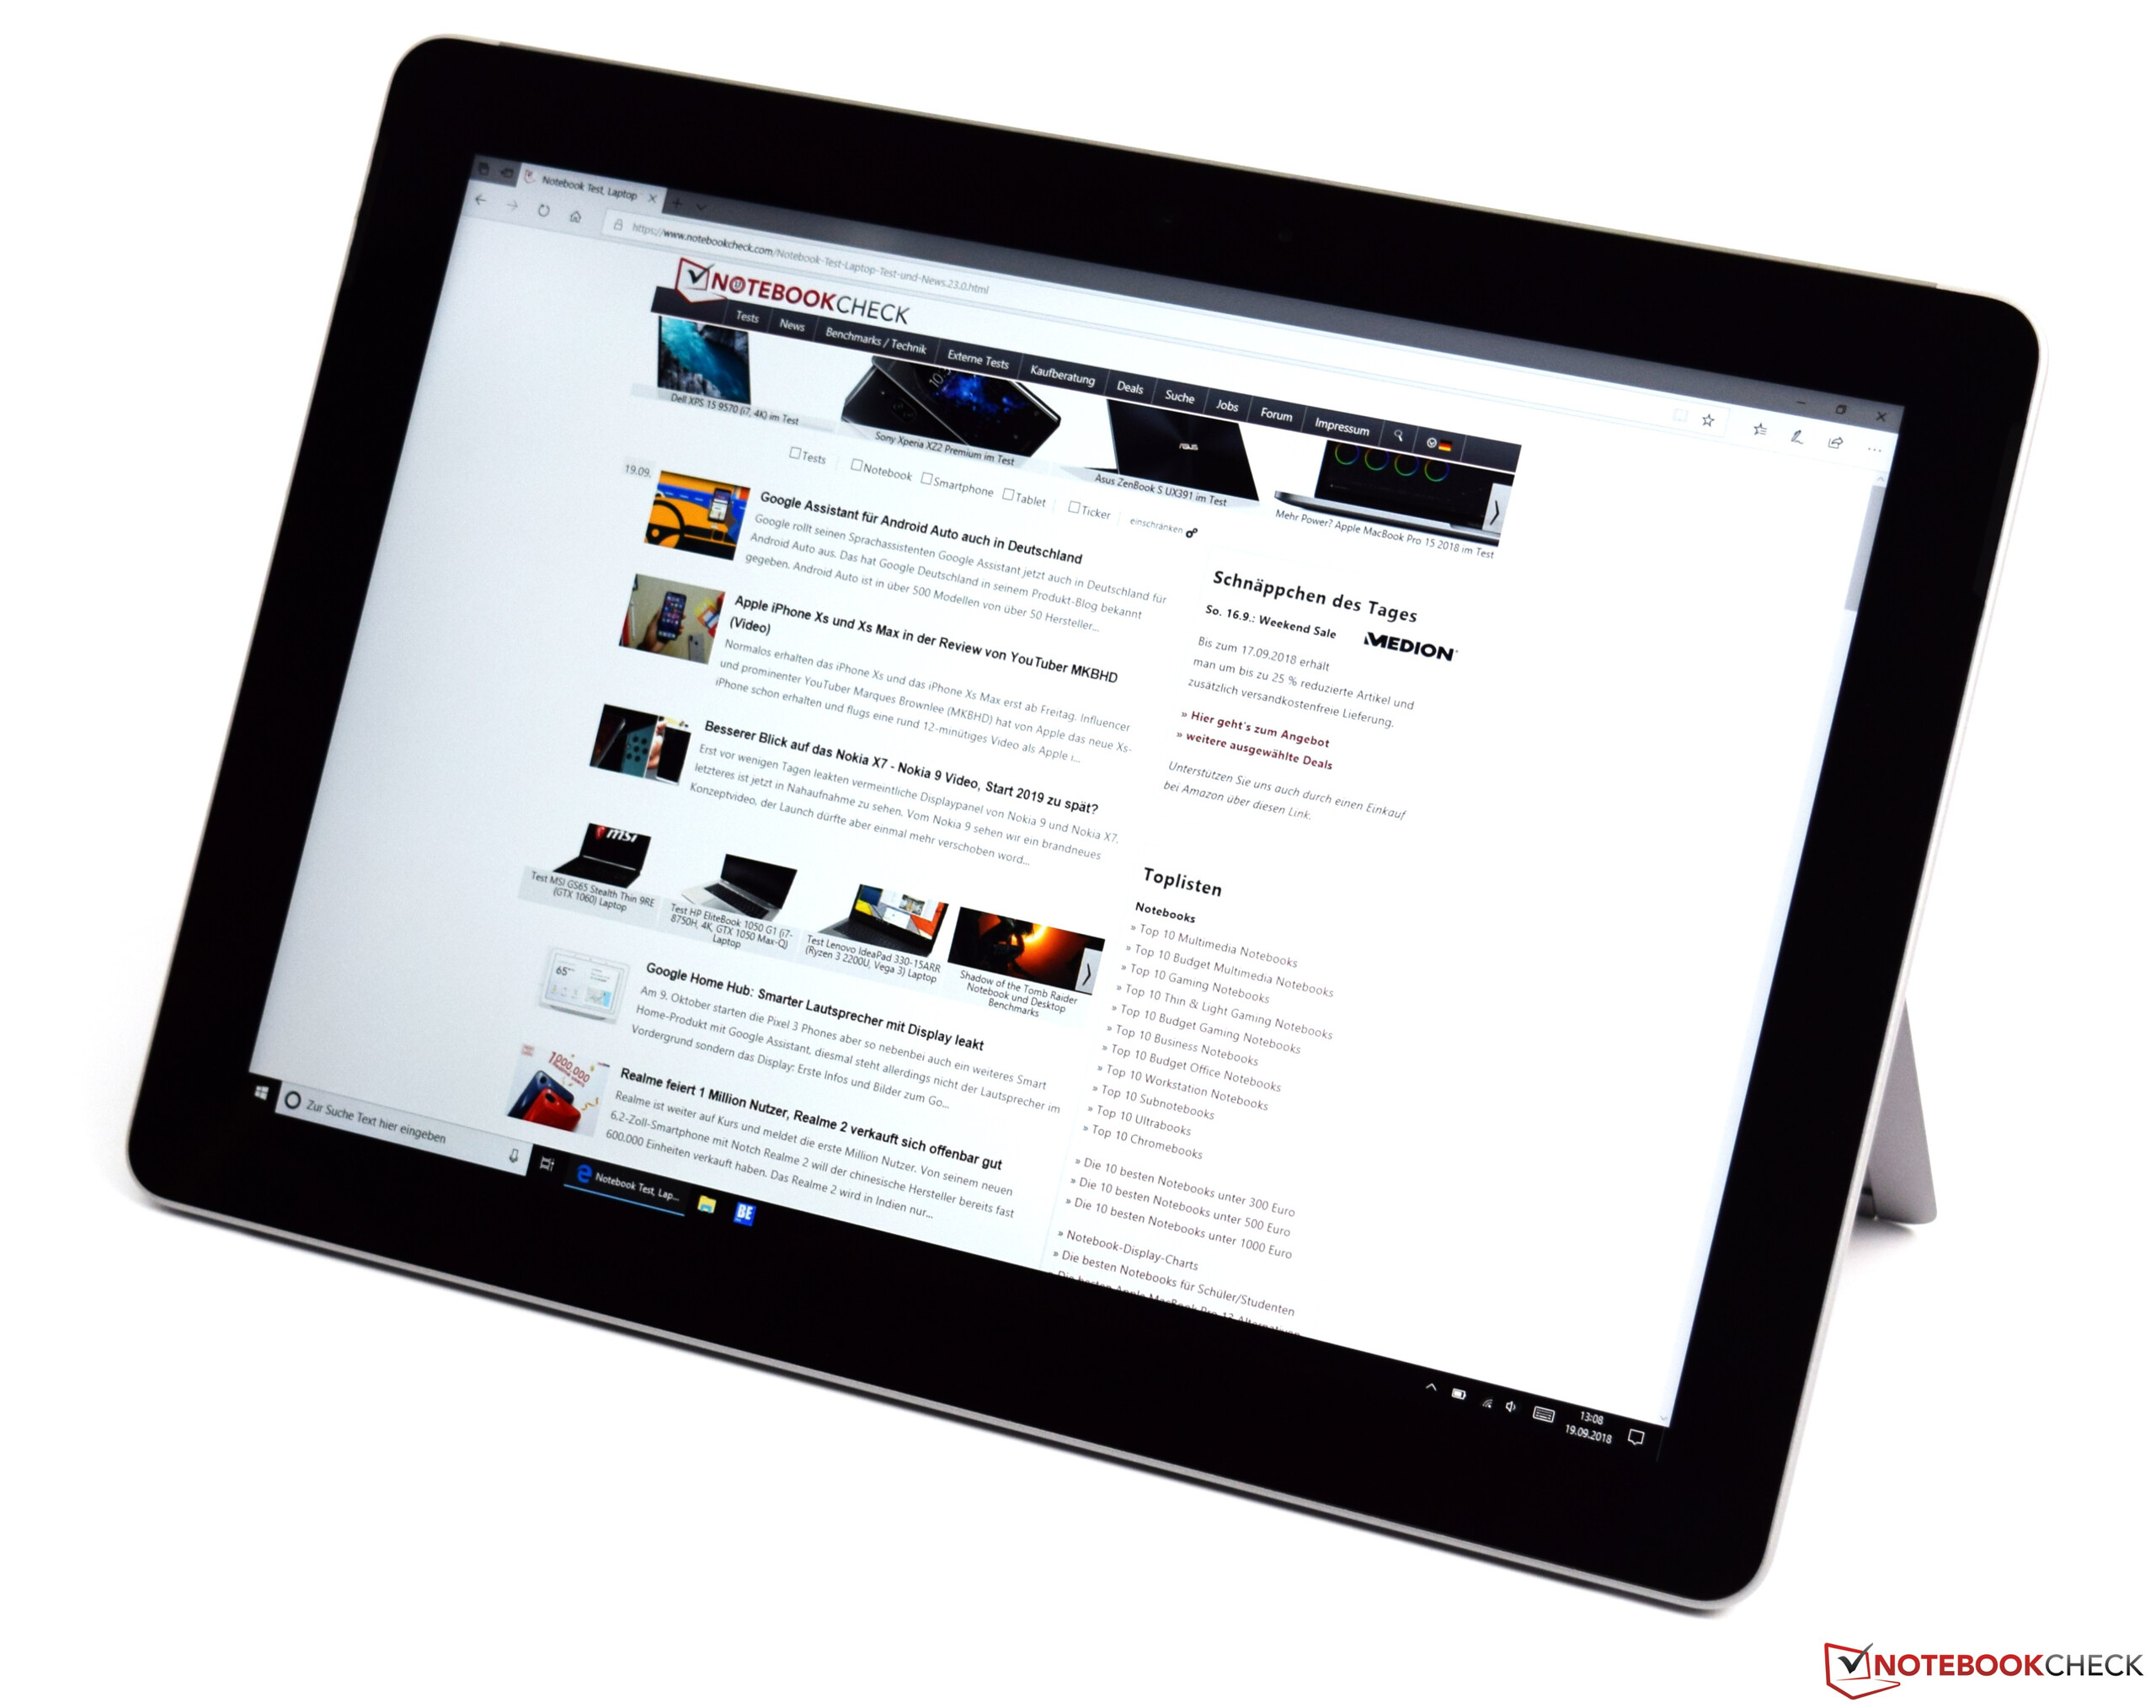
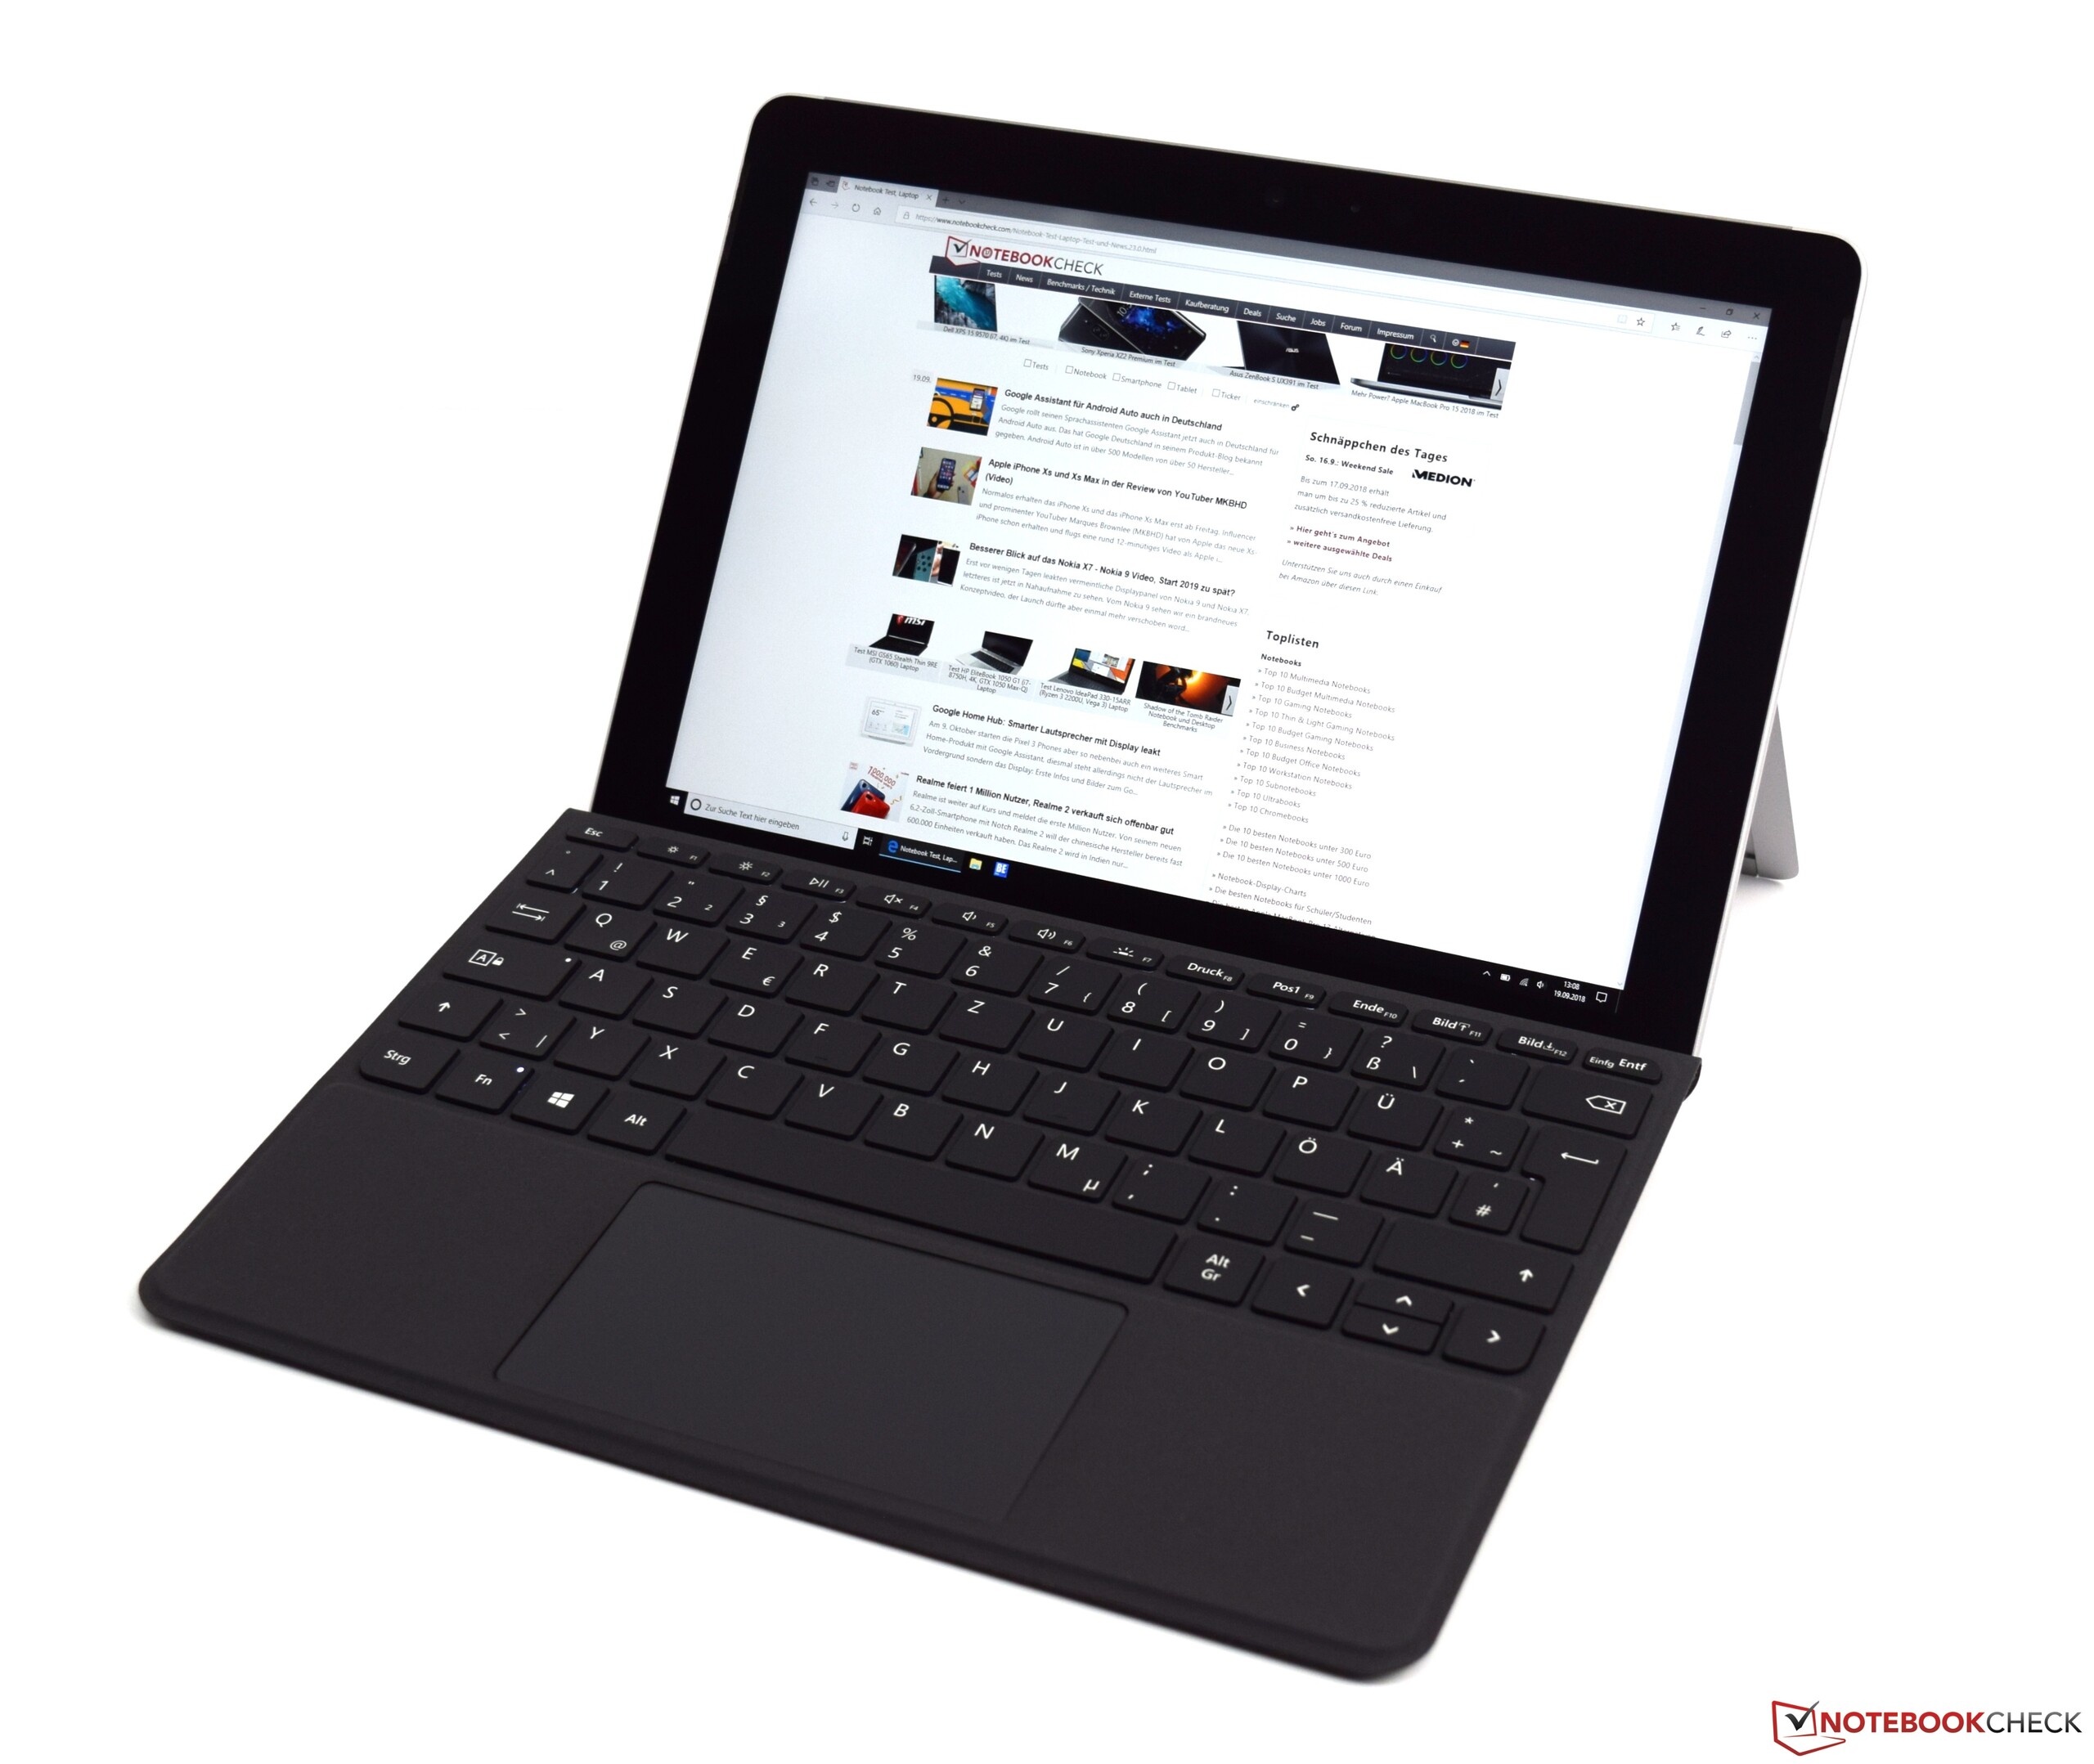
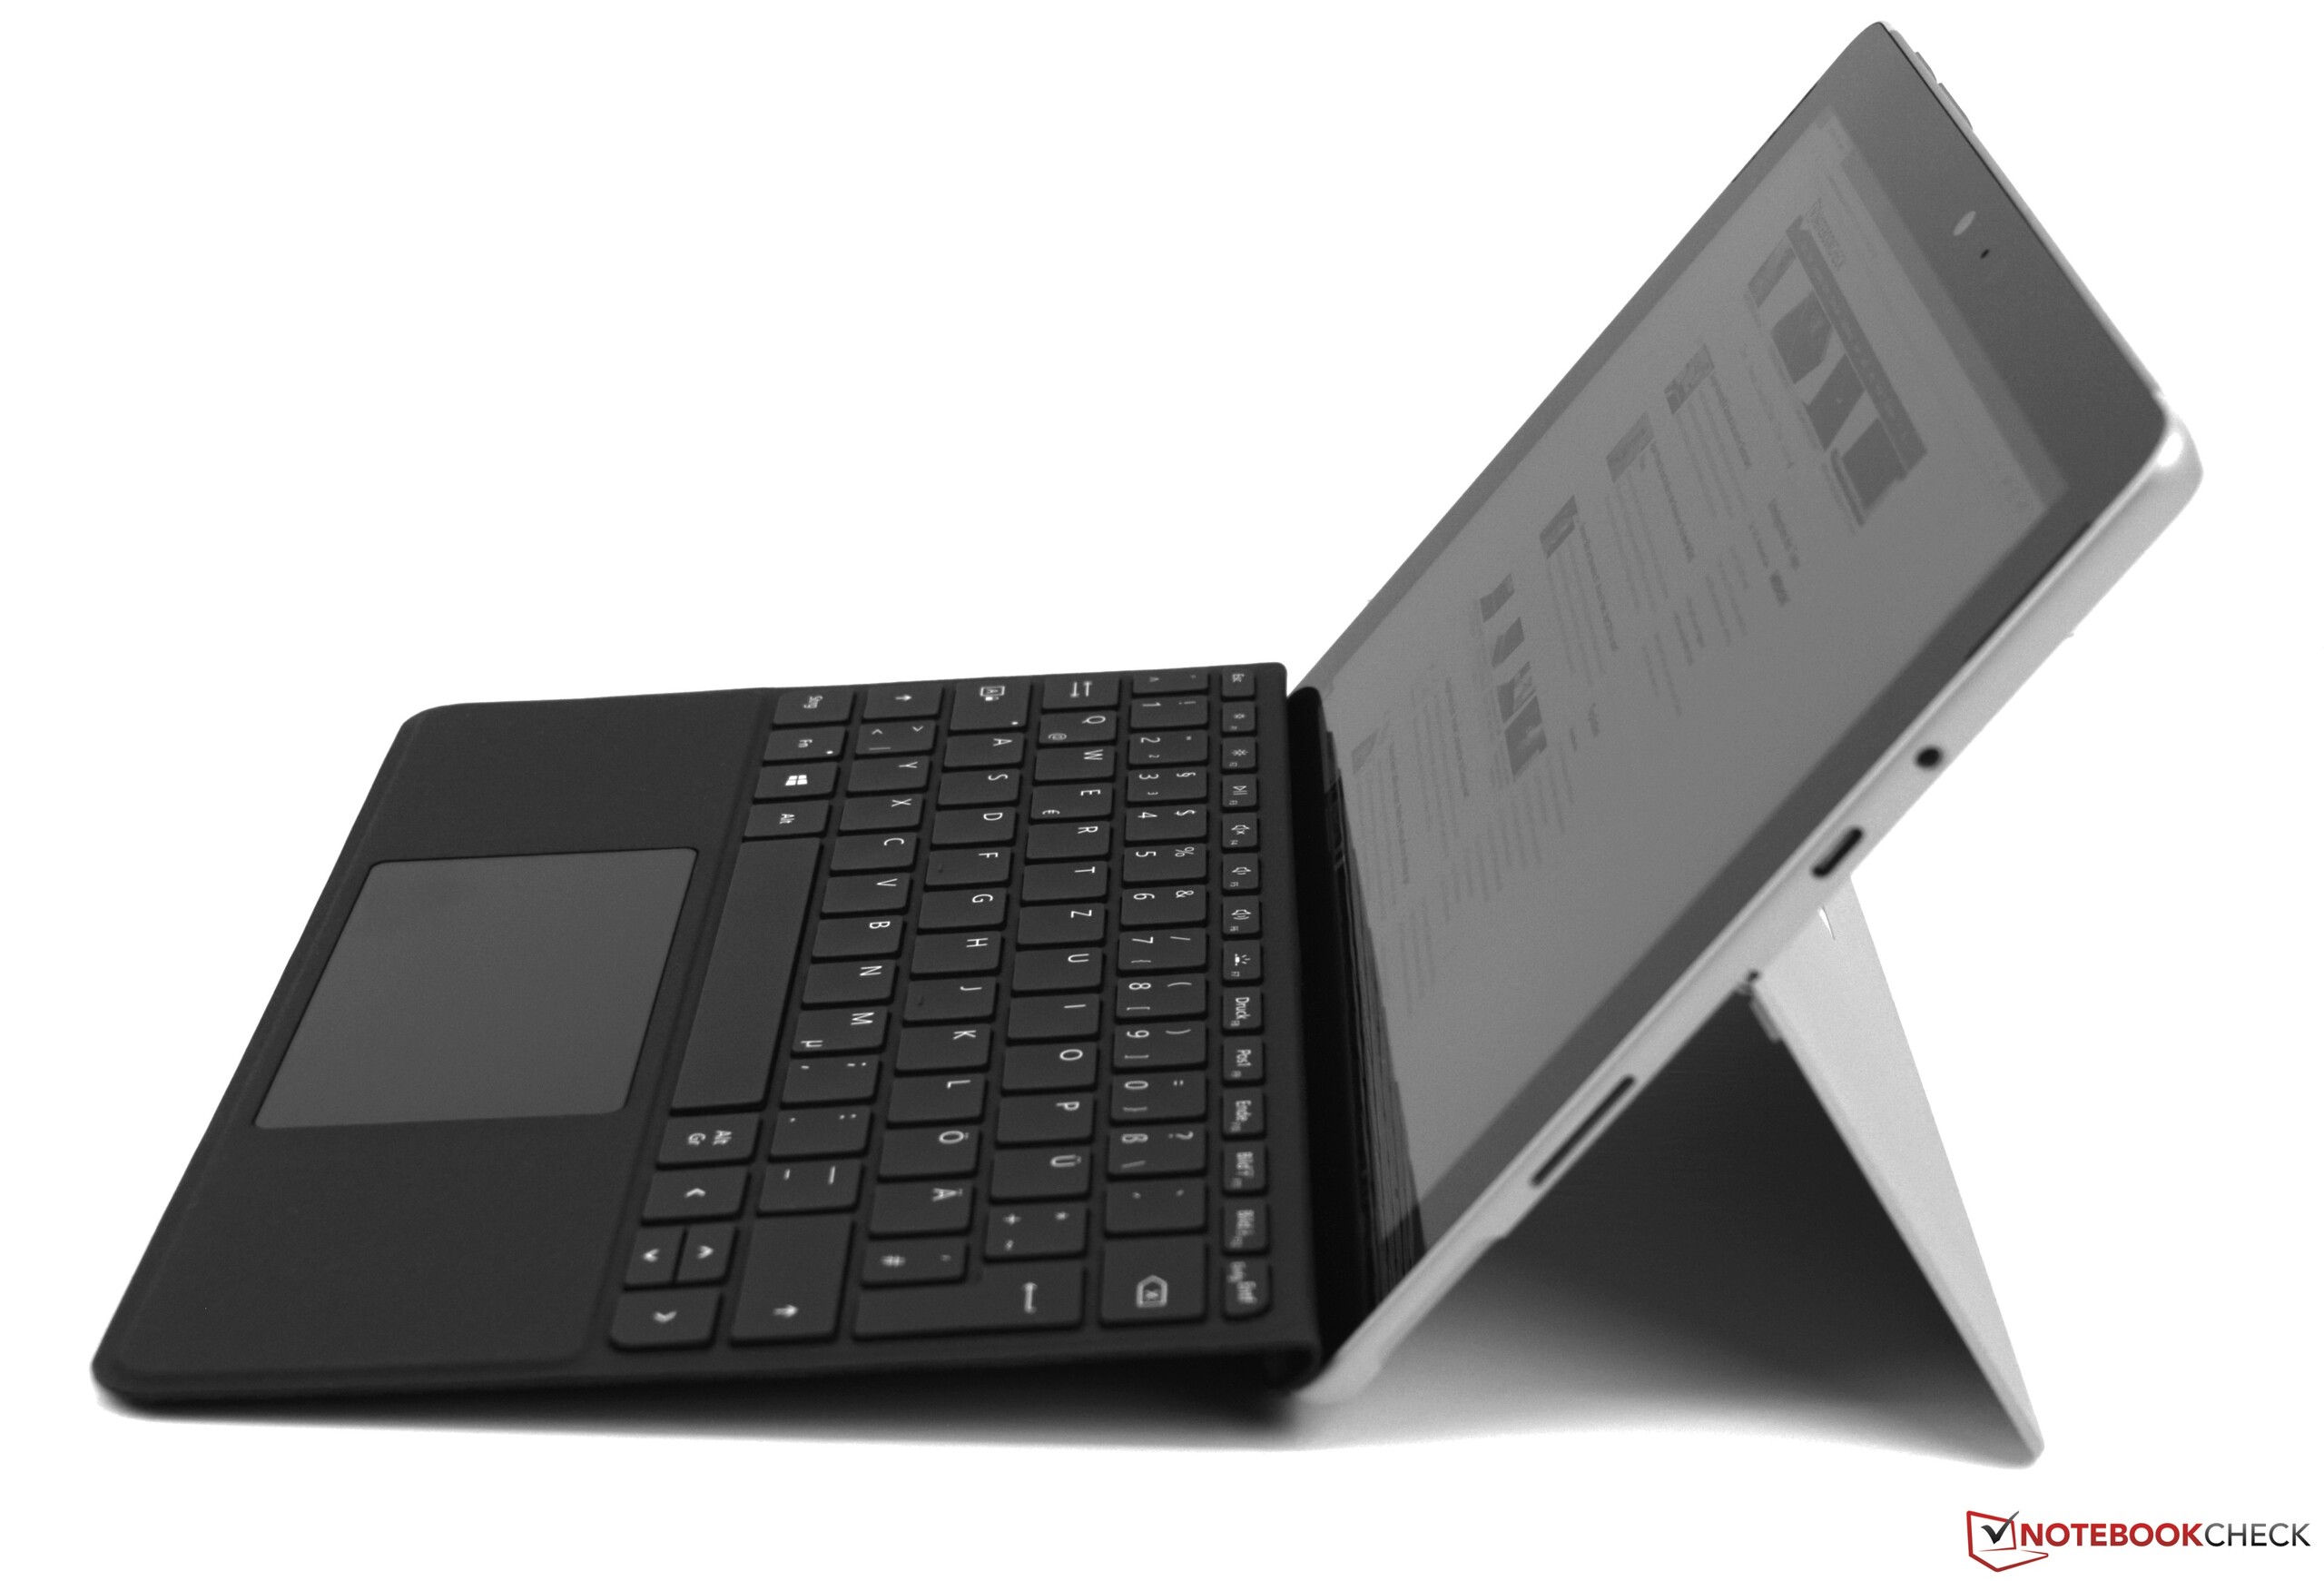
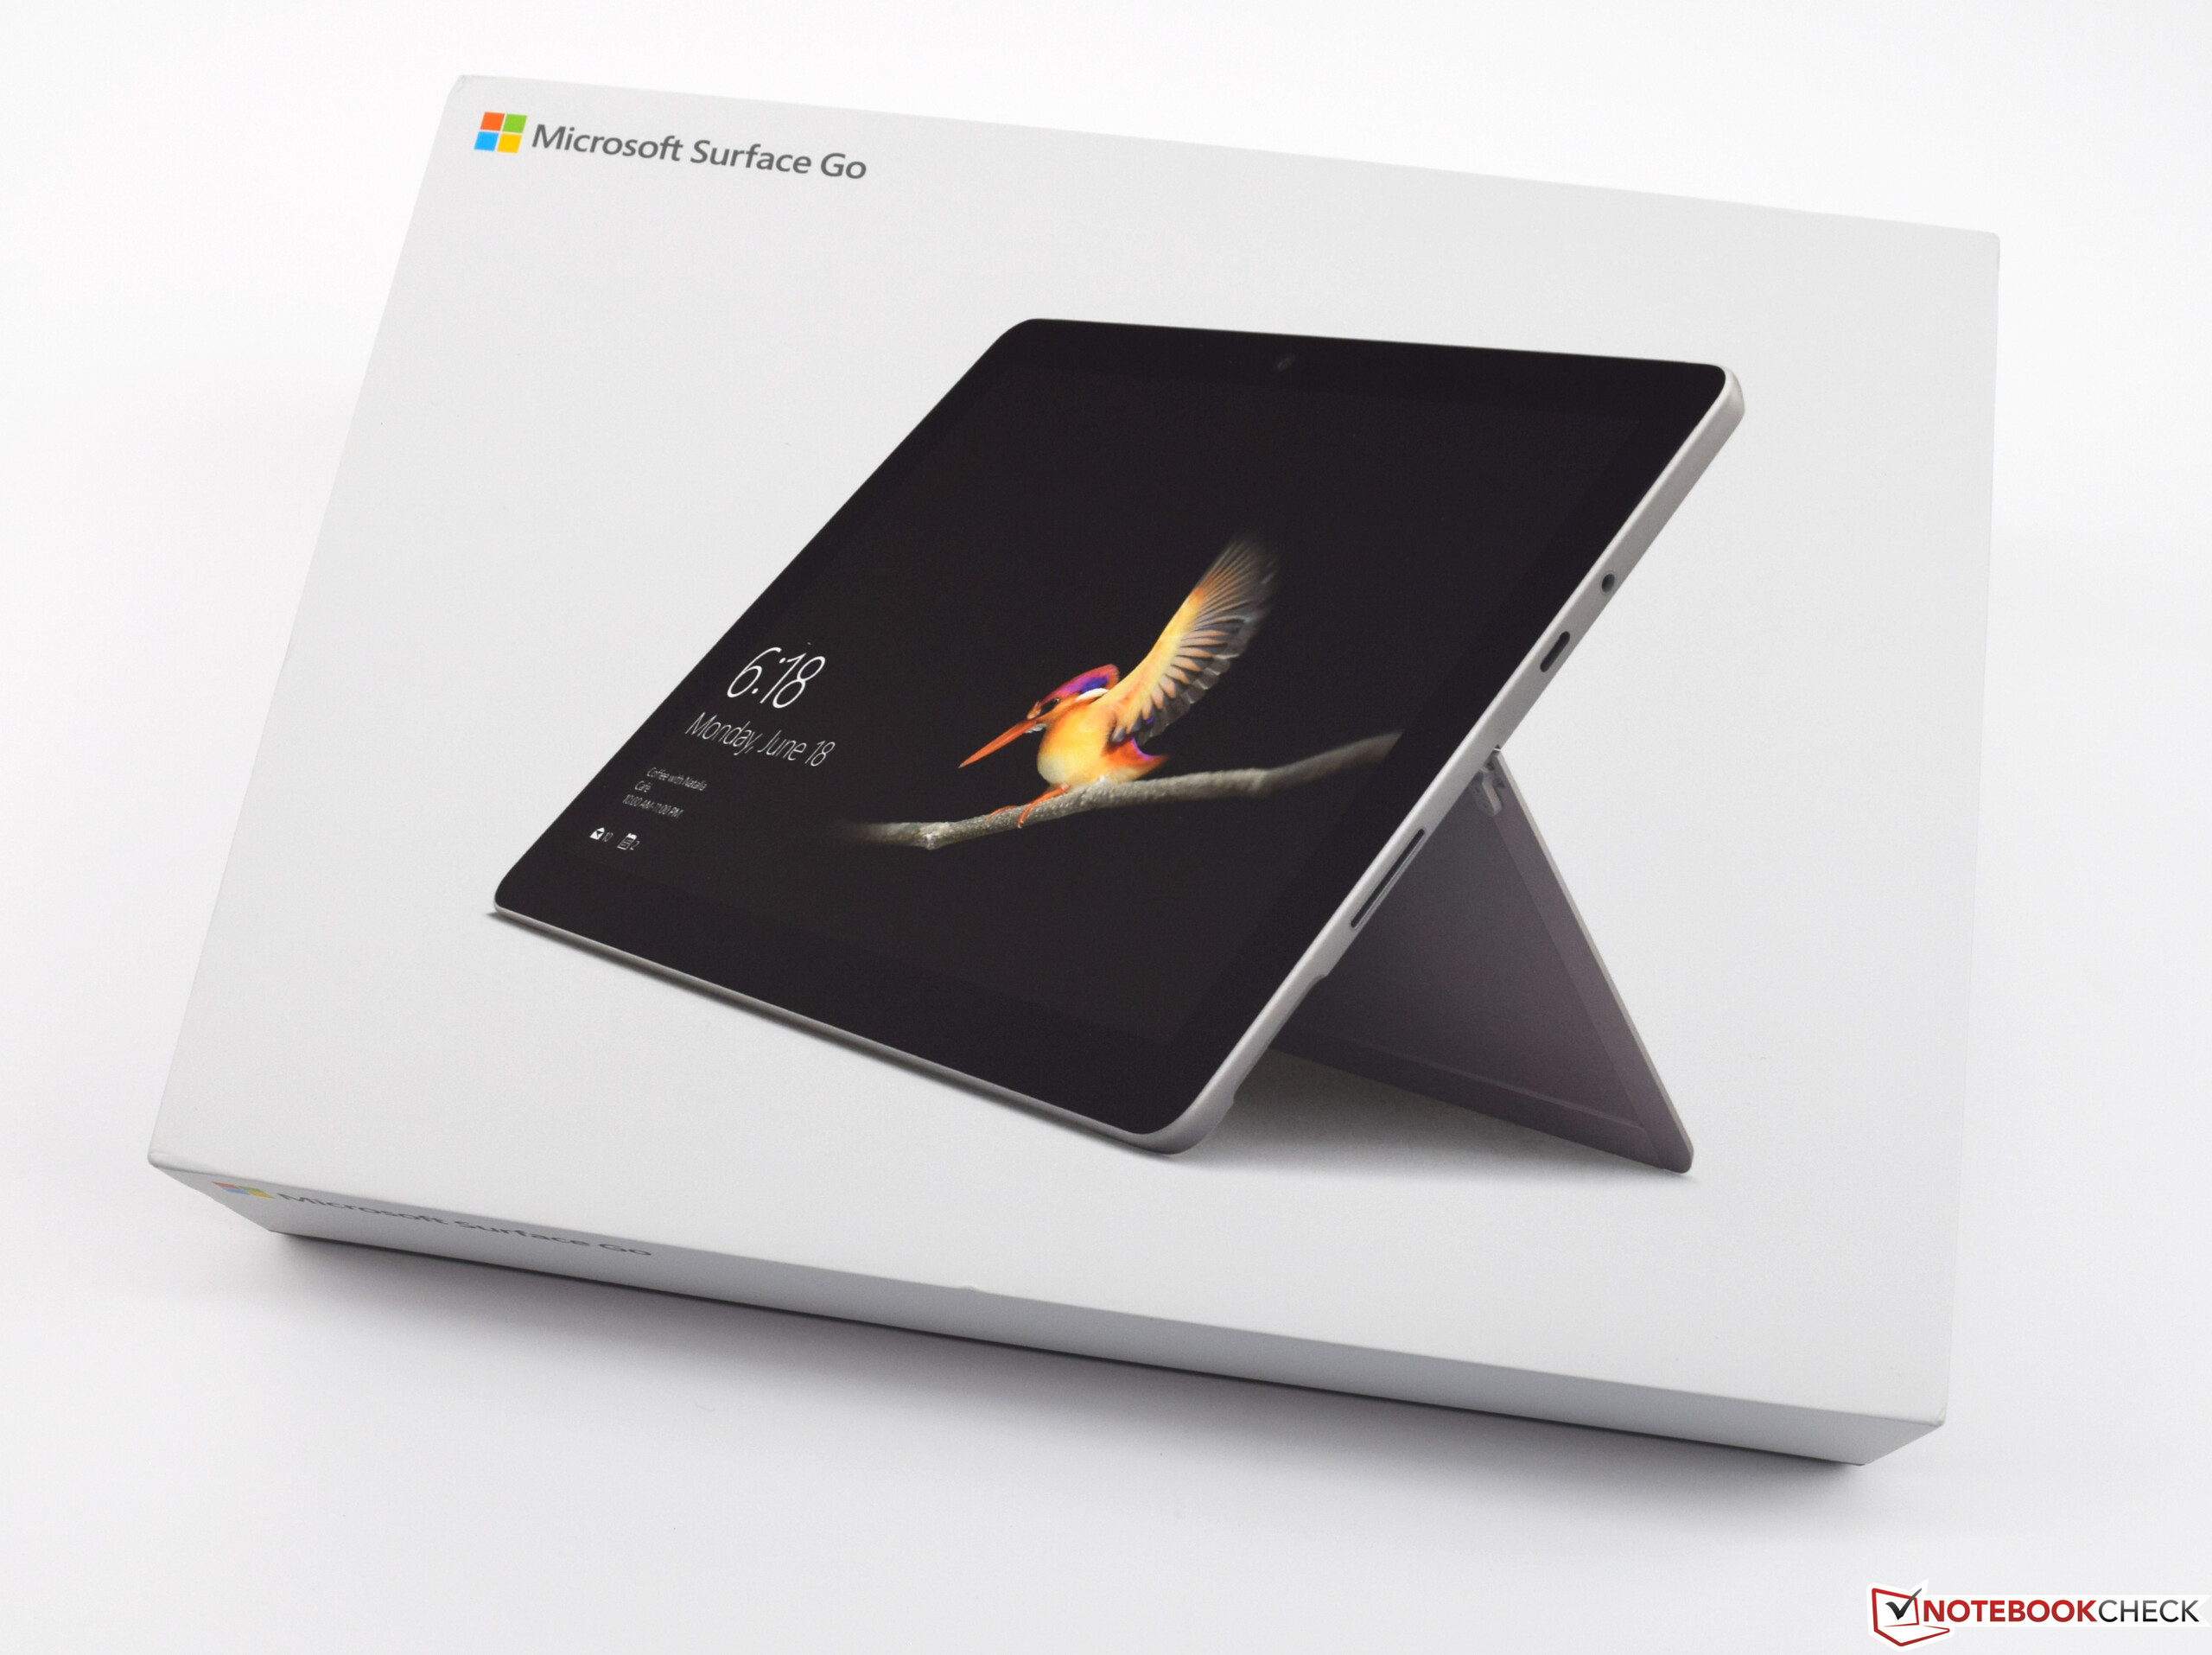
Microsofts Surface Go är en kompakt omvandlingsbar av hög kvalitet till ett lågt pris. Men bli inte lurad av priset om du vill använda den som en fullfjädrad laptop. I det fallet gör de extra tillbehören att det snabbt blir dyrt.
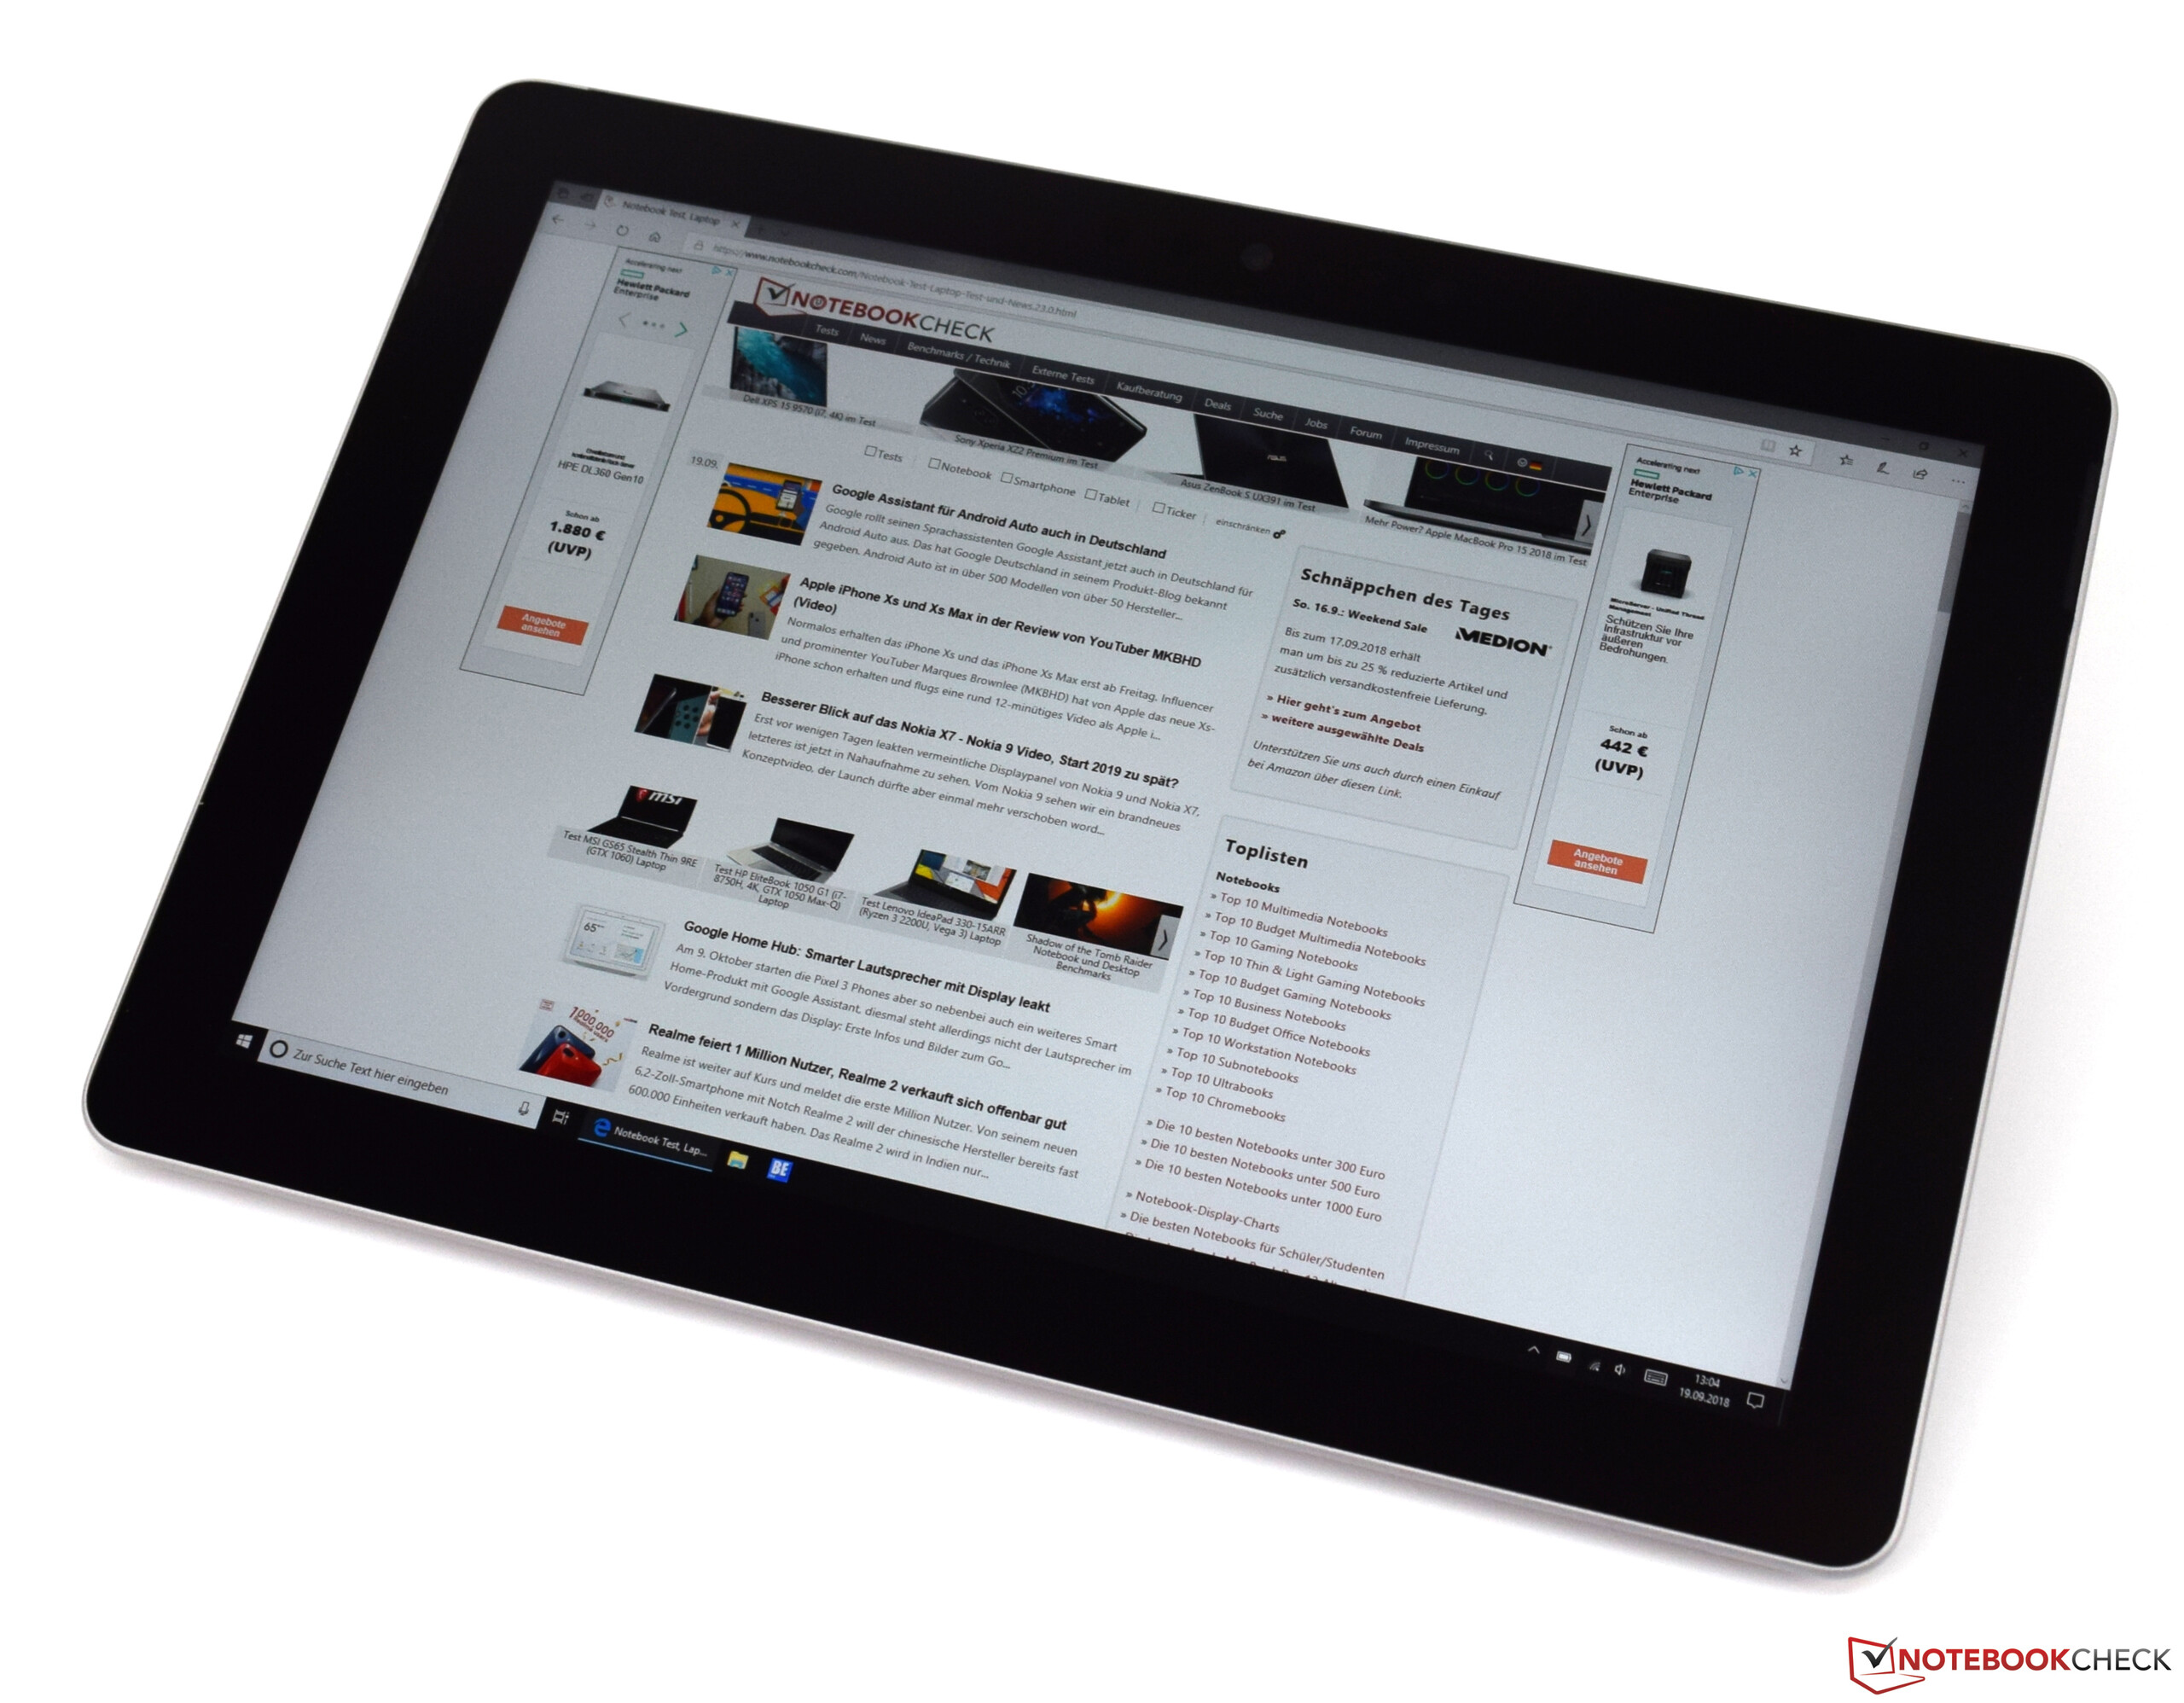
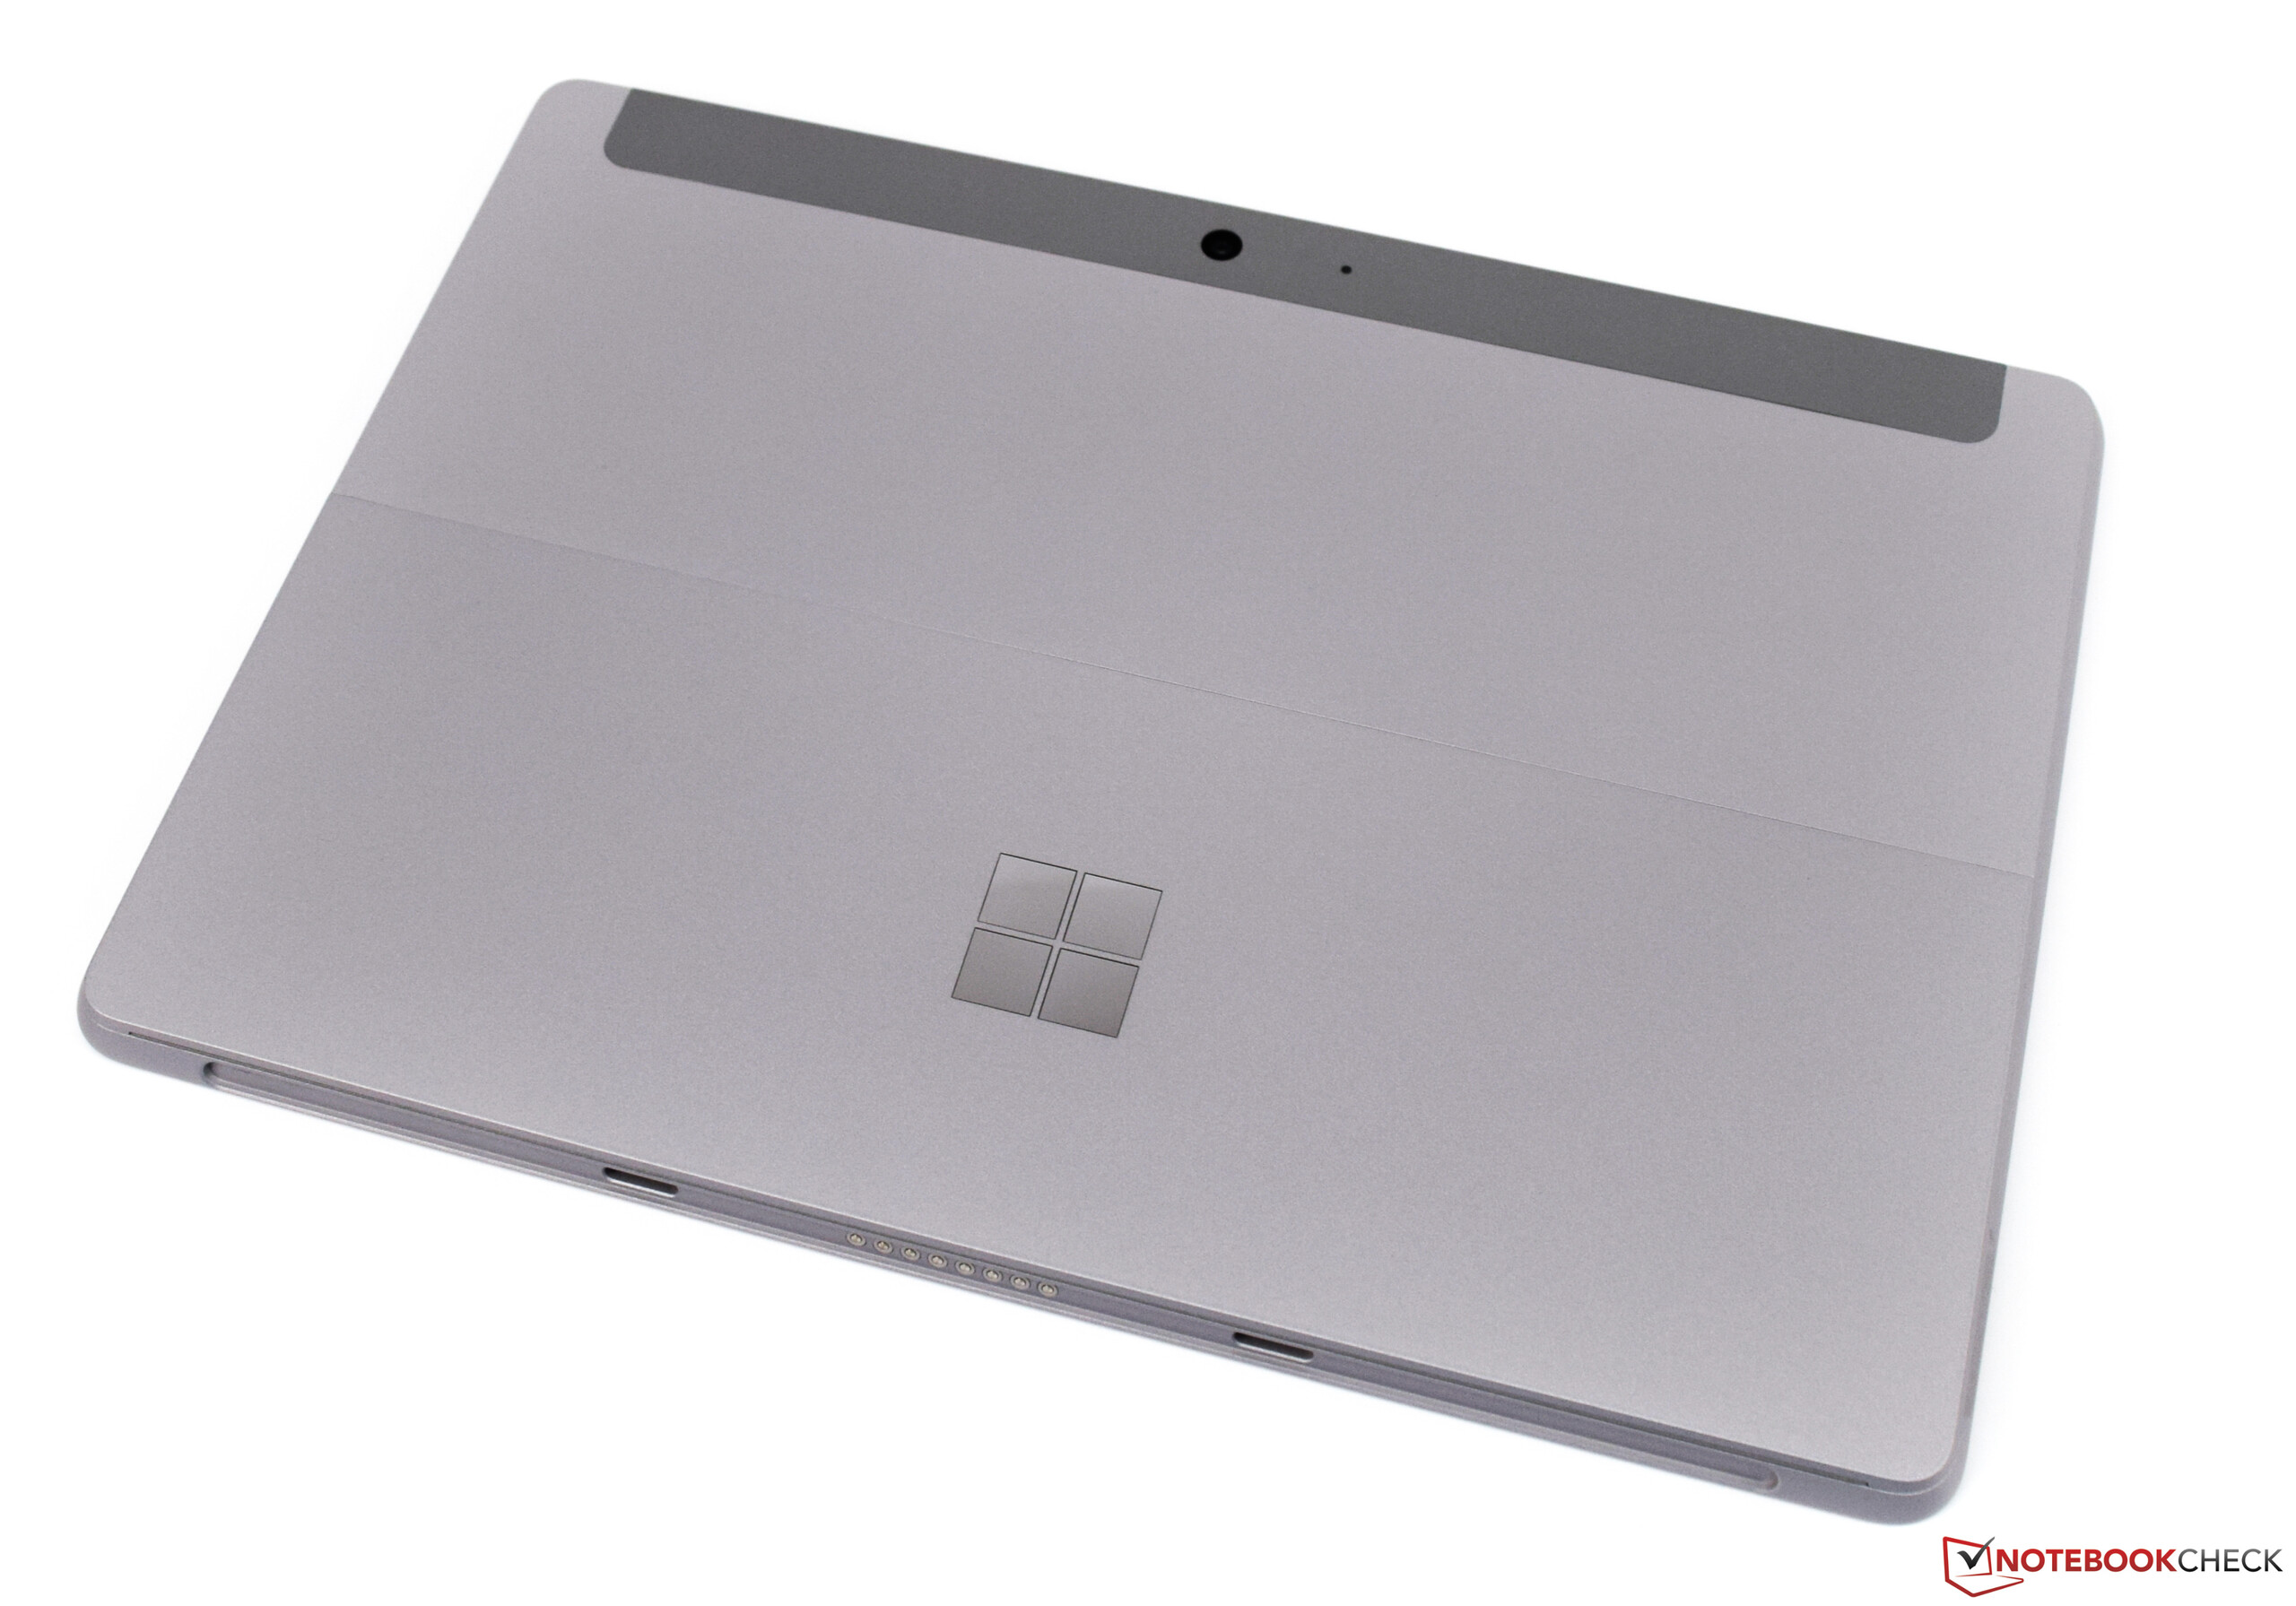
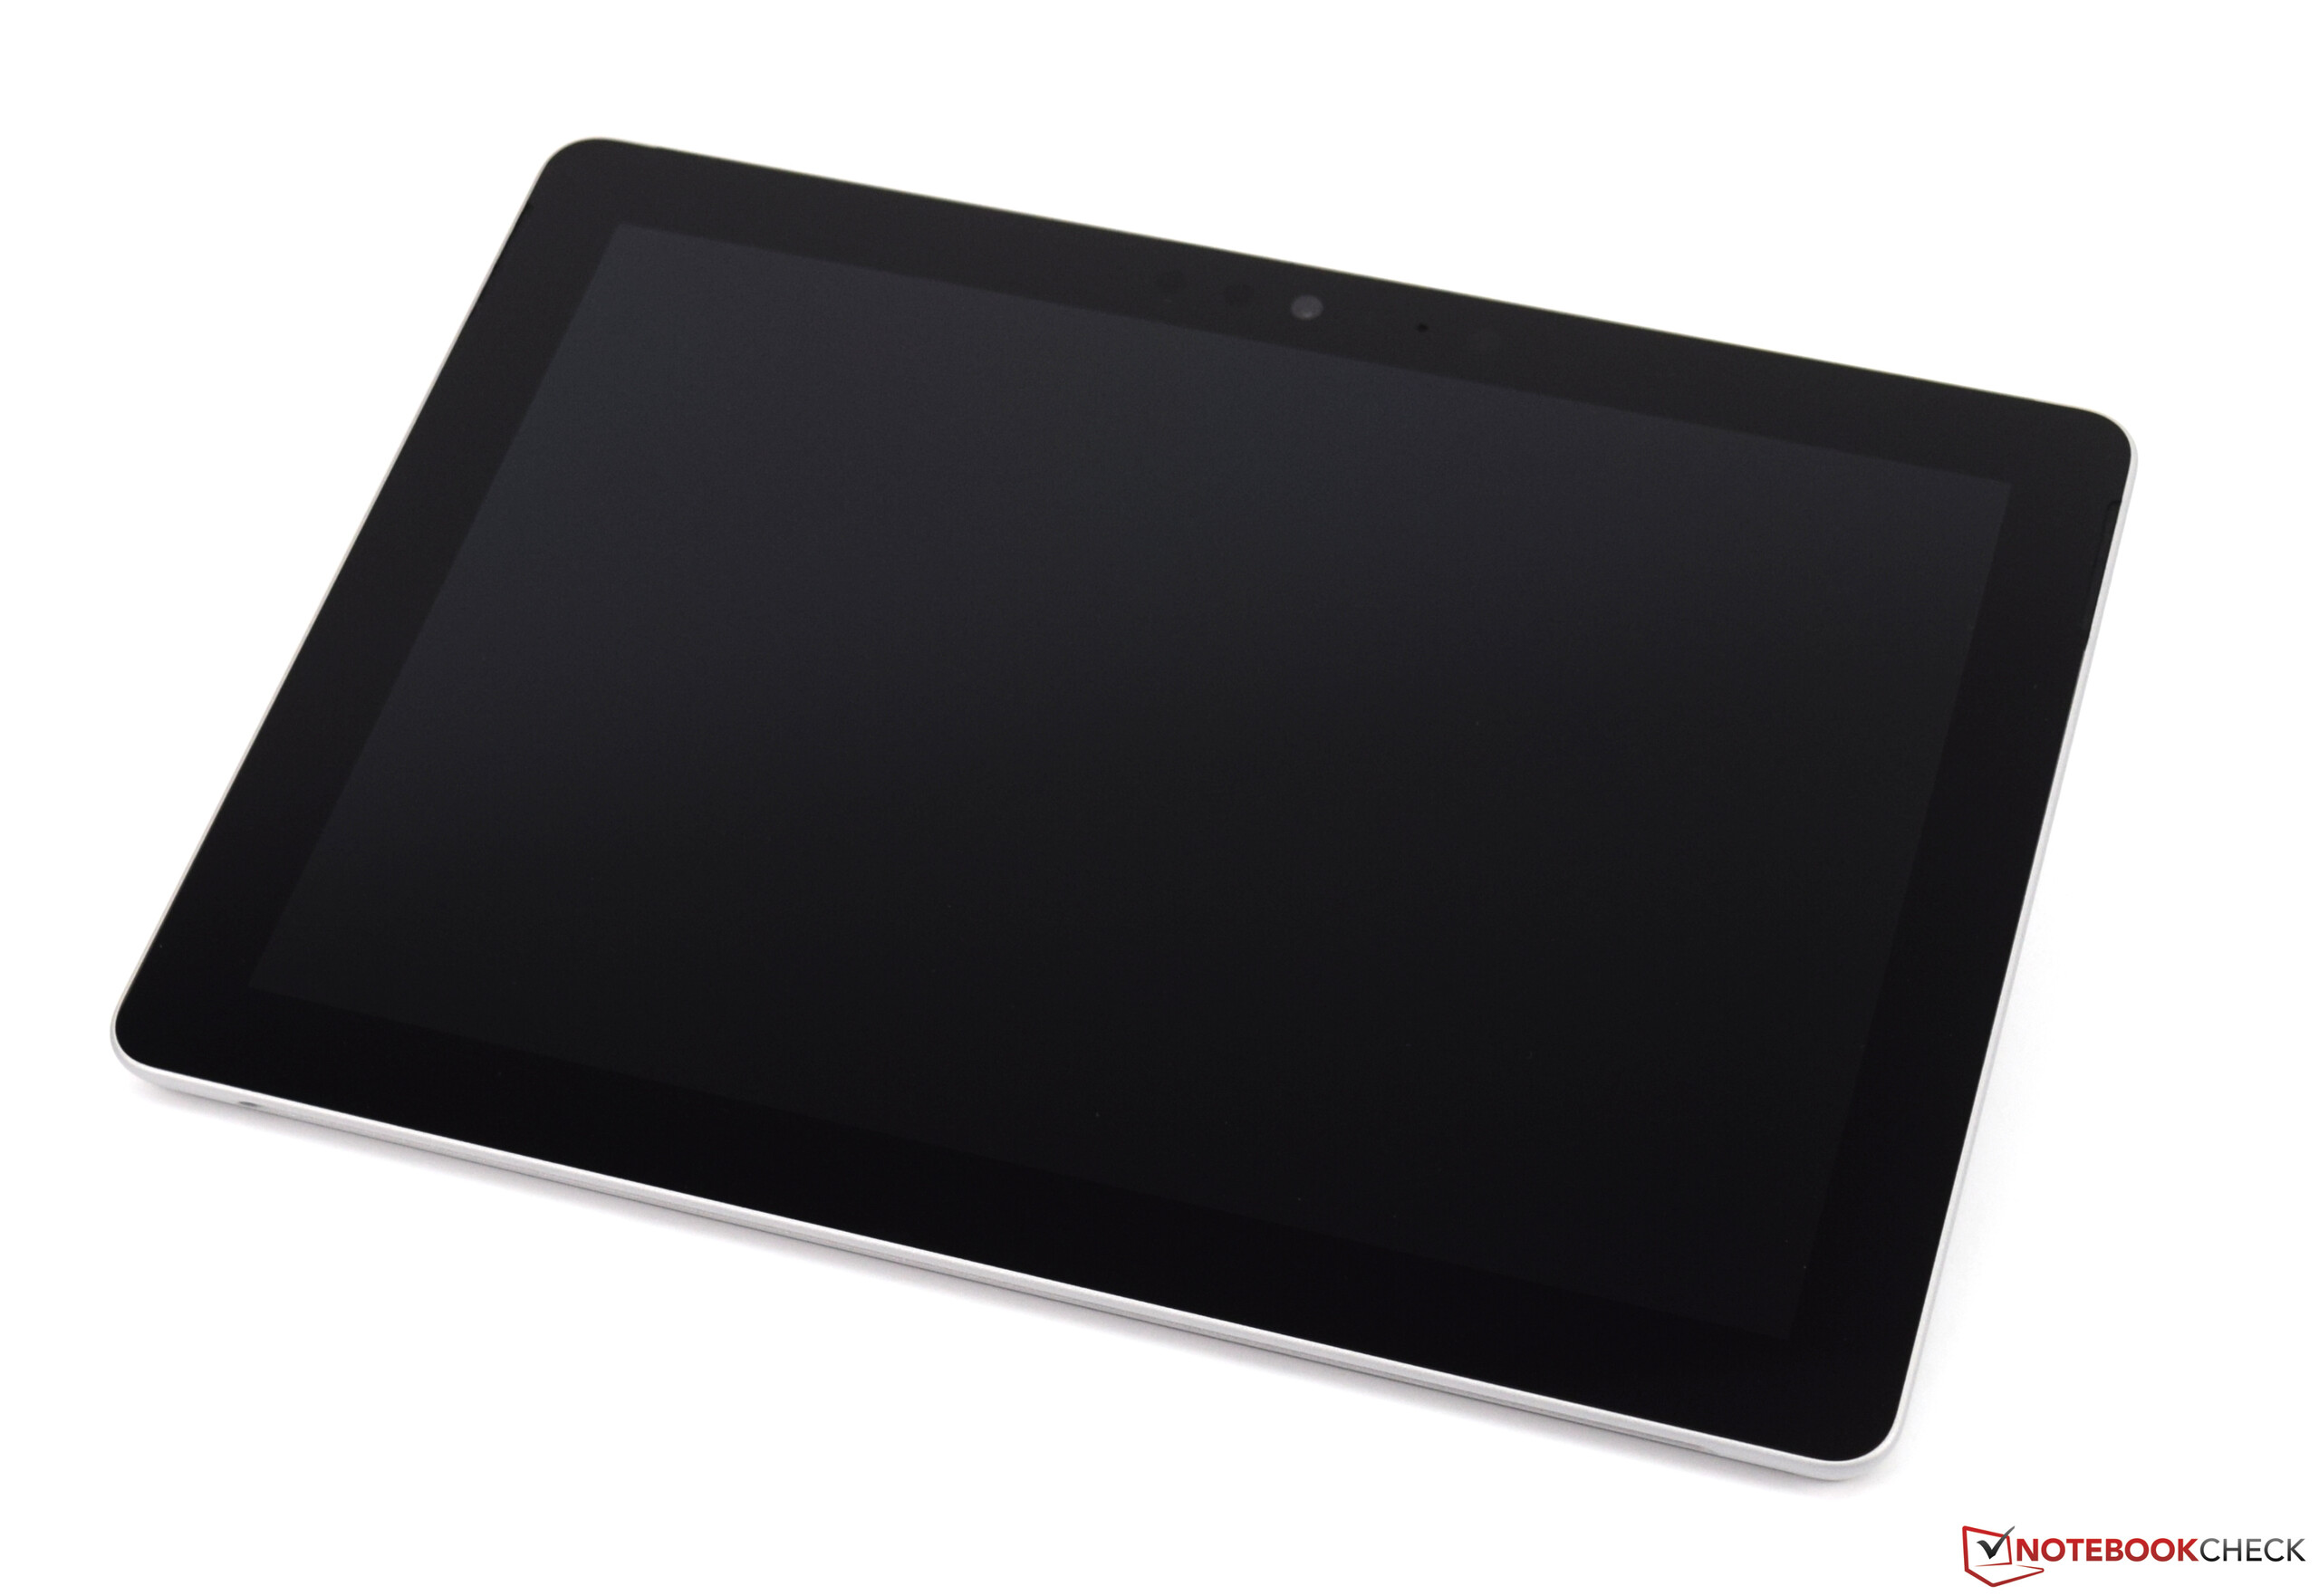
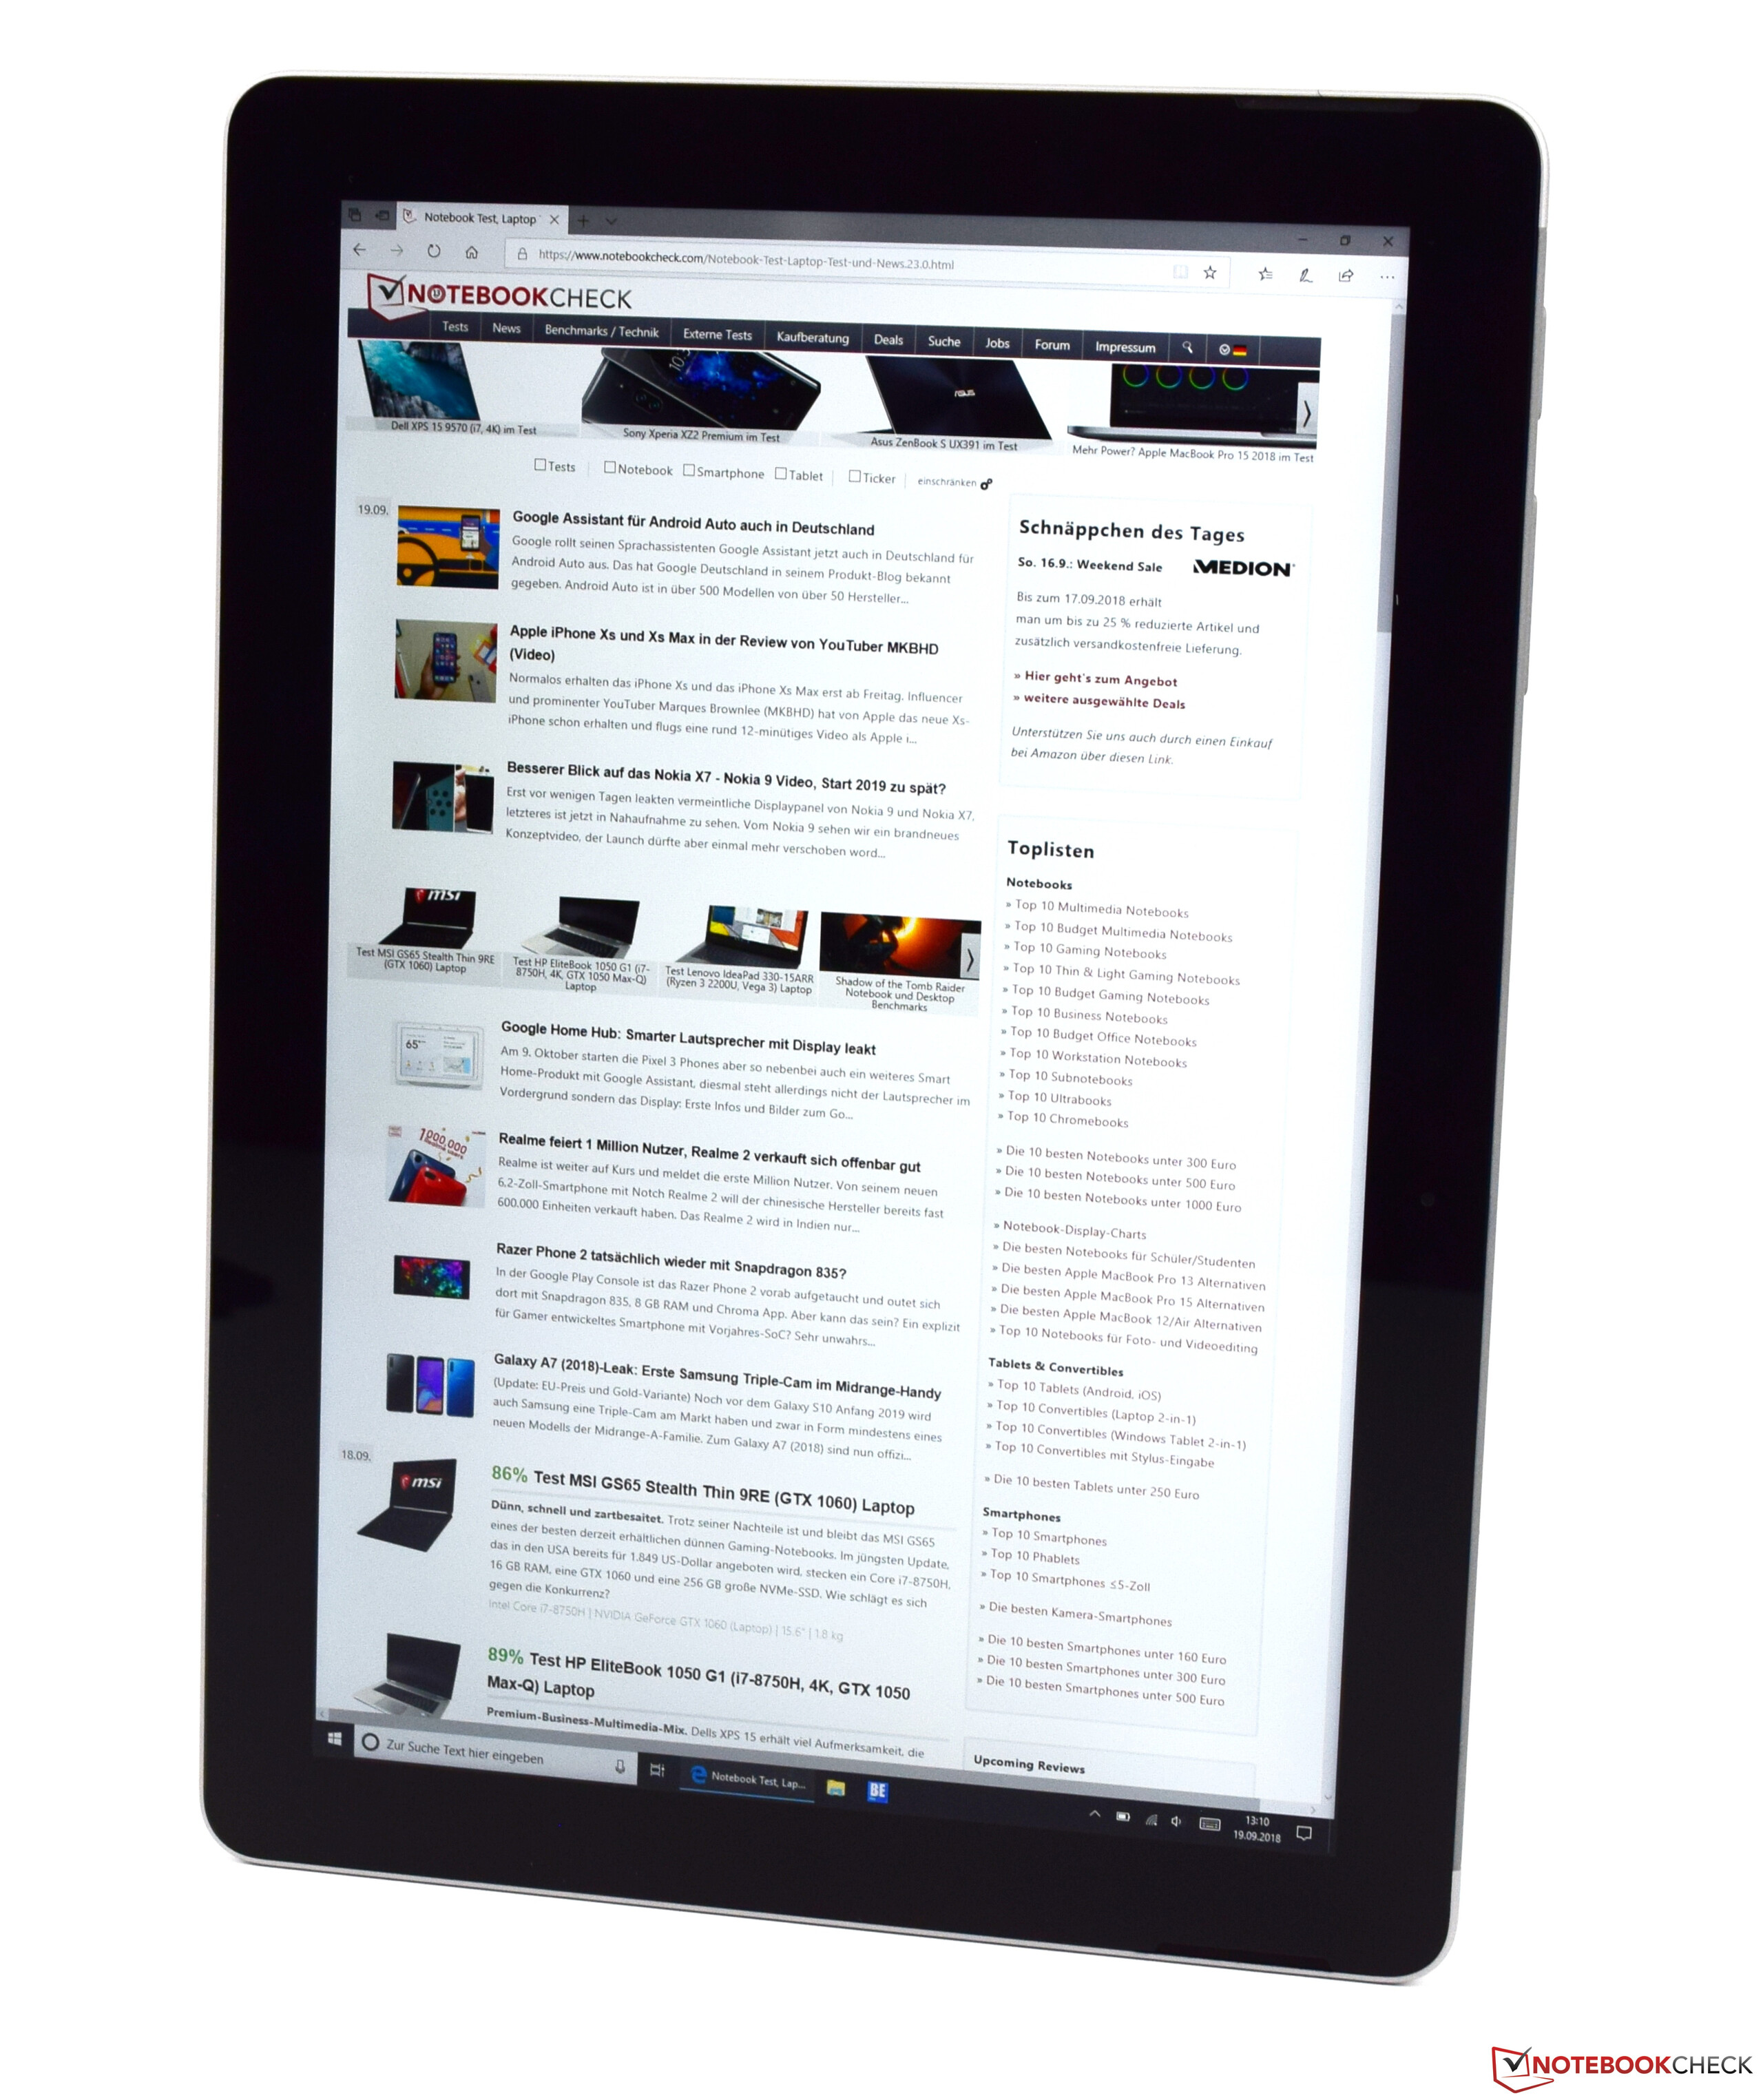
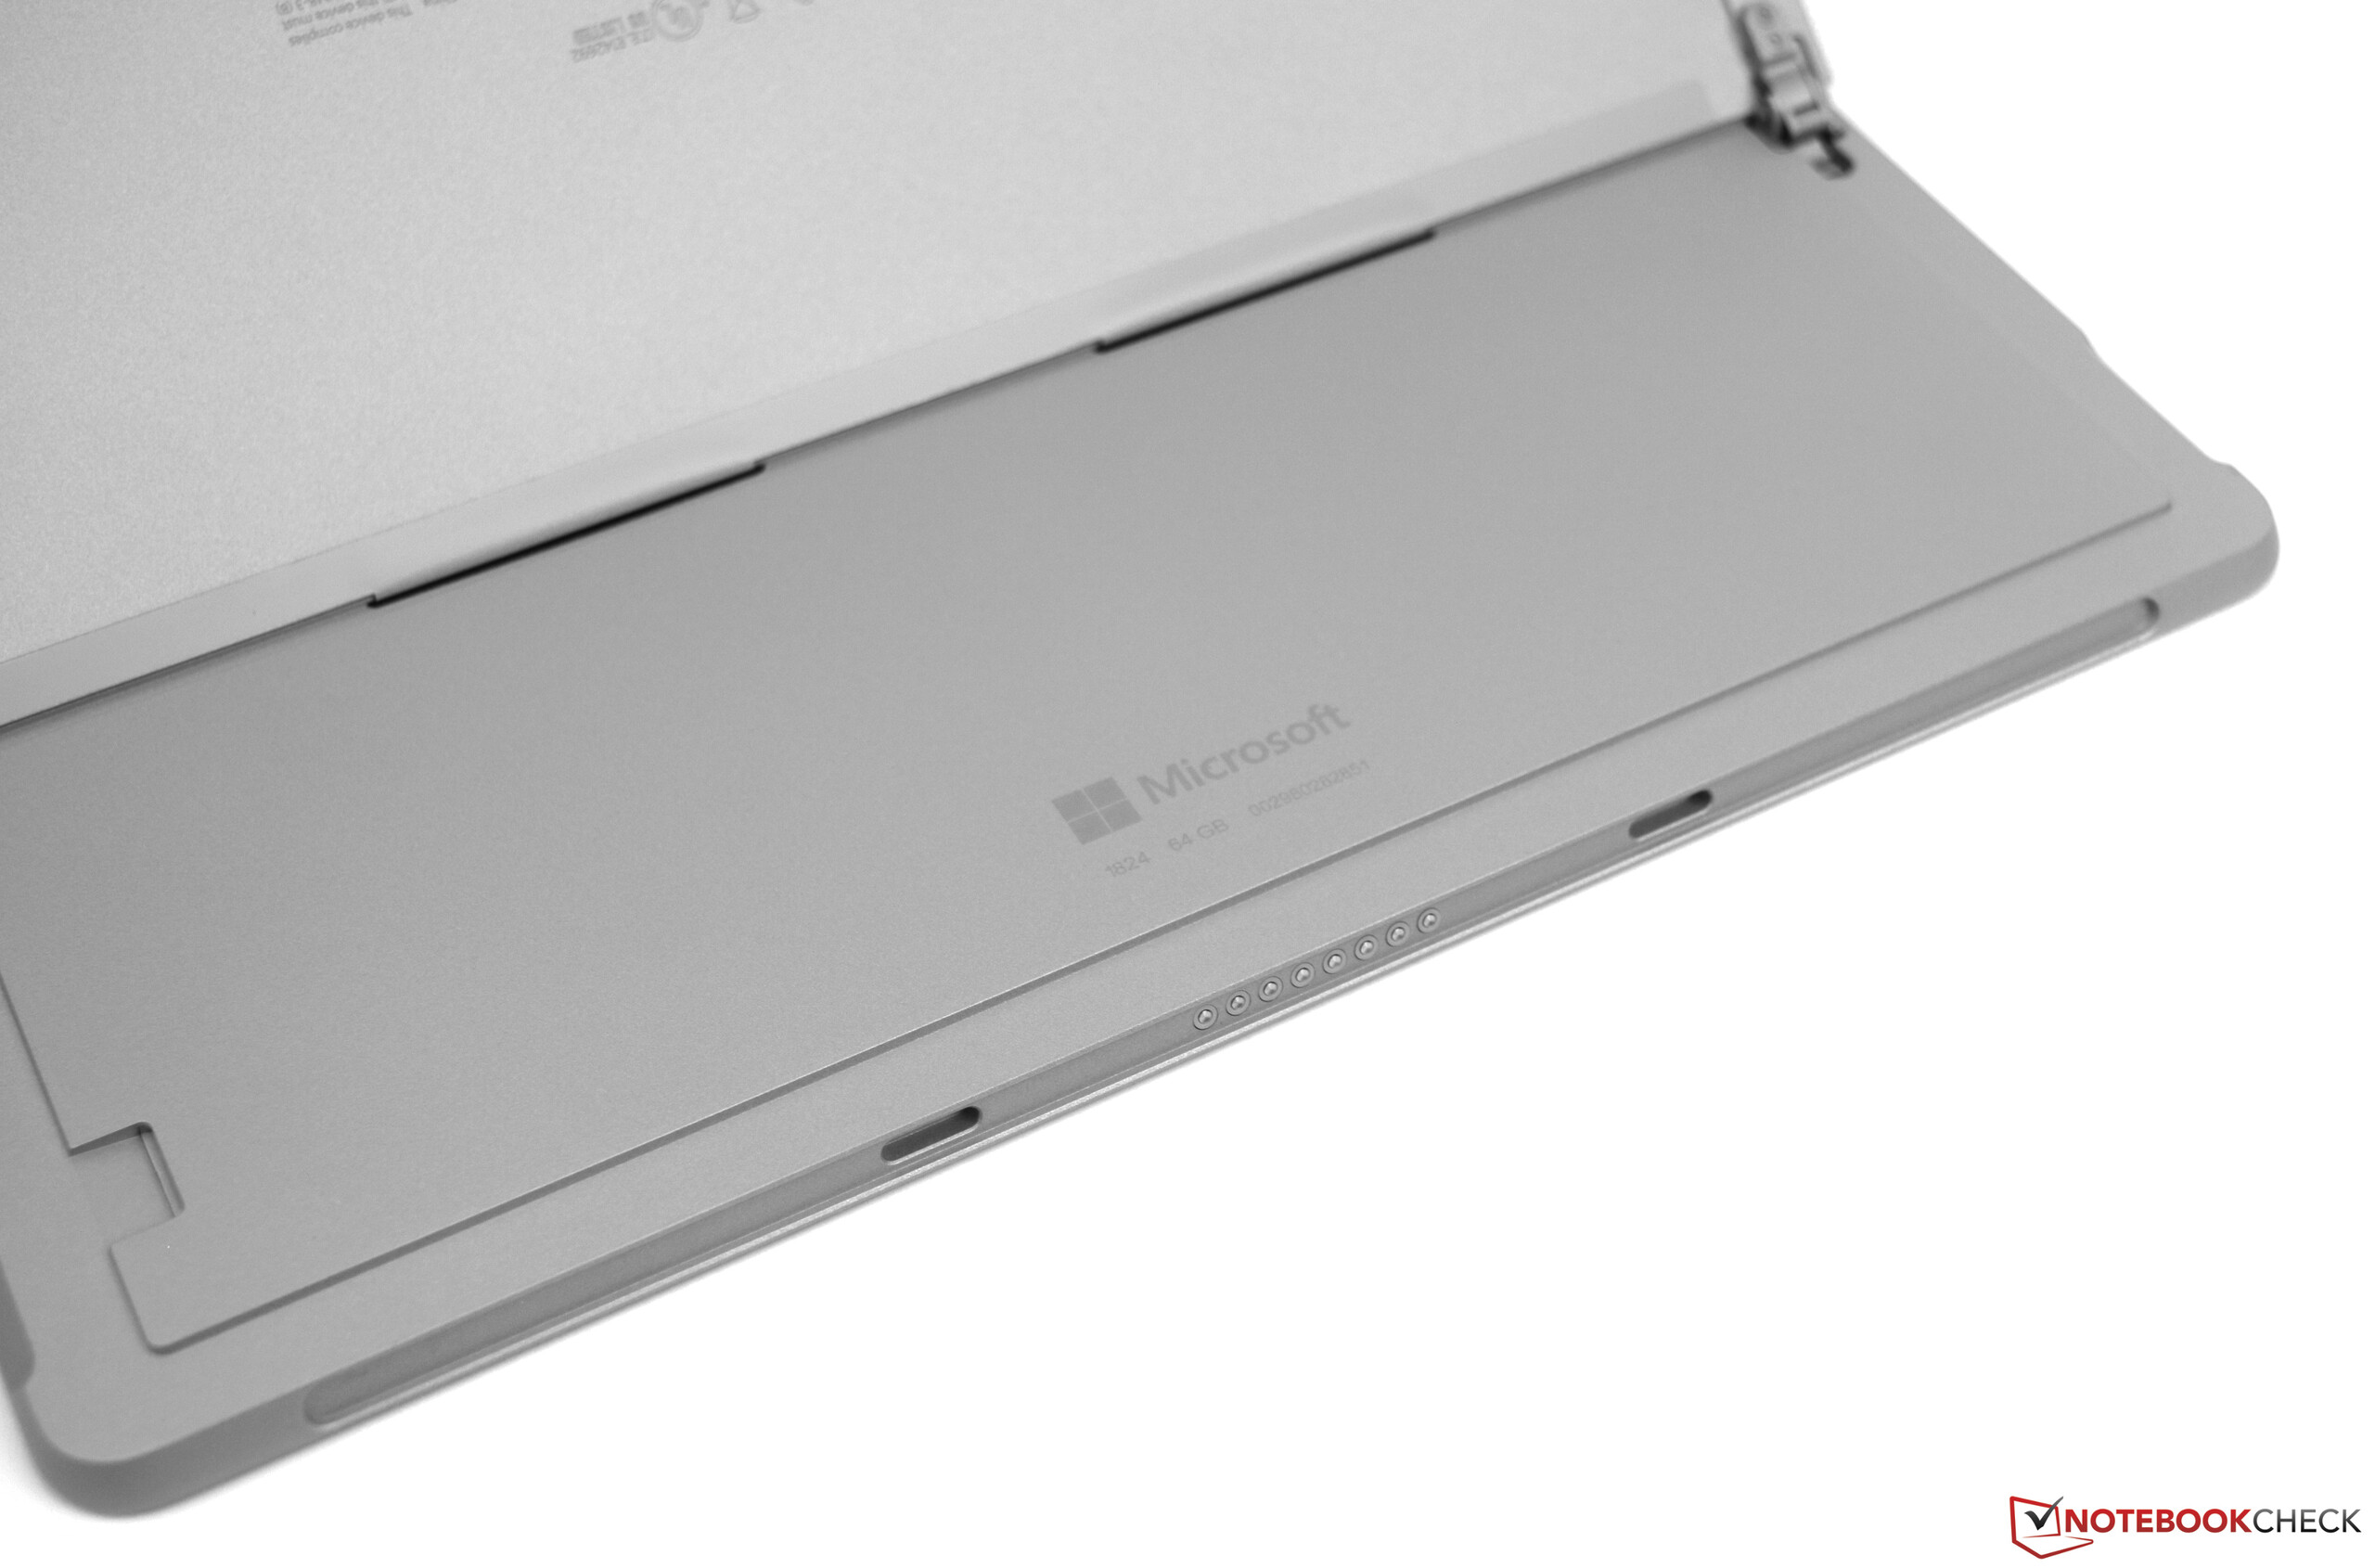
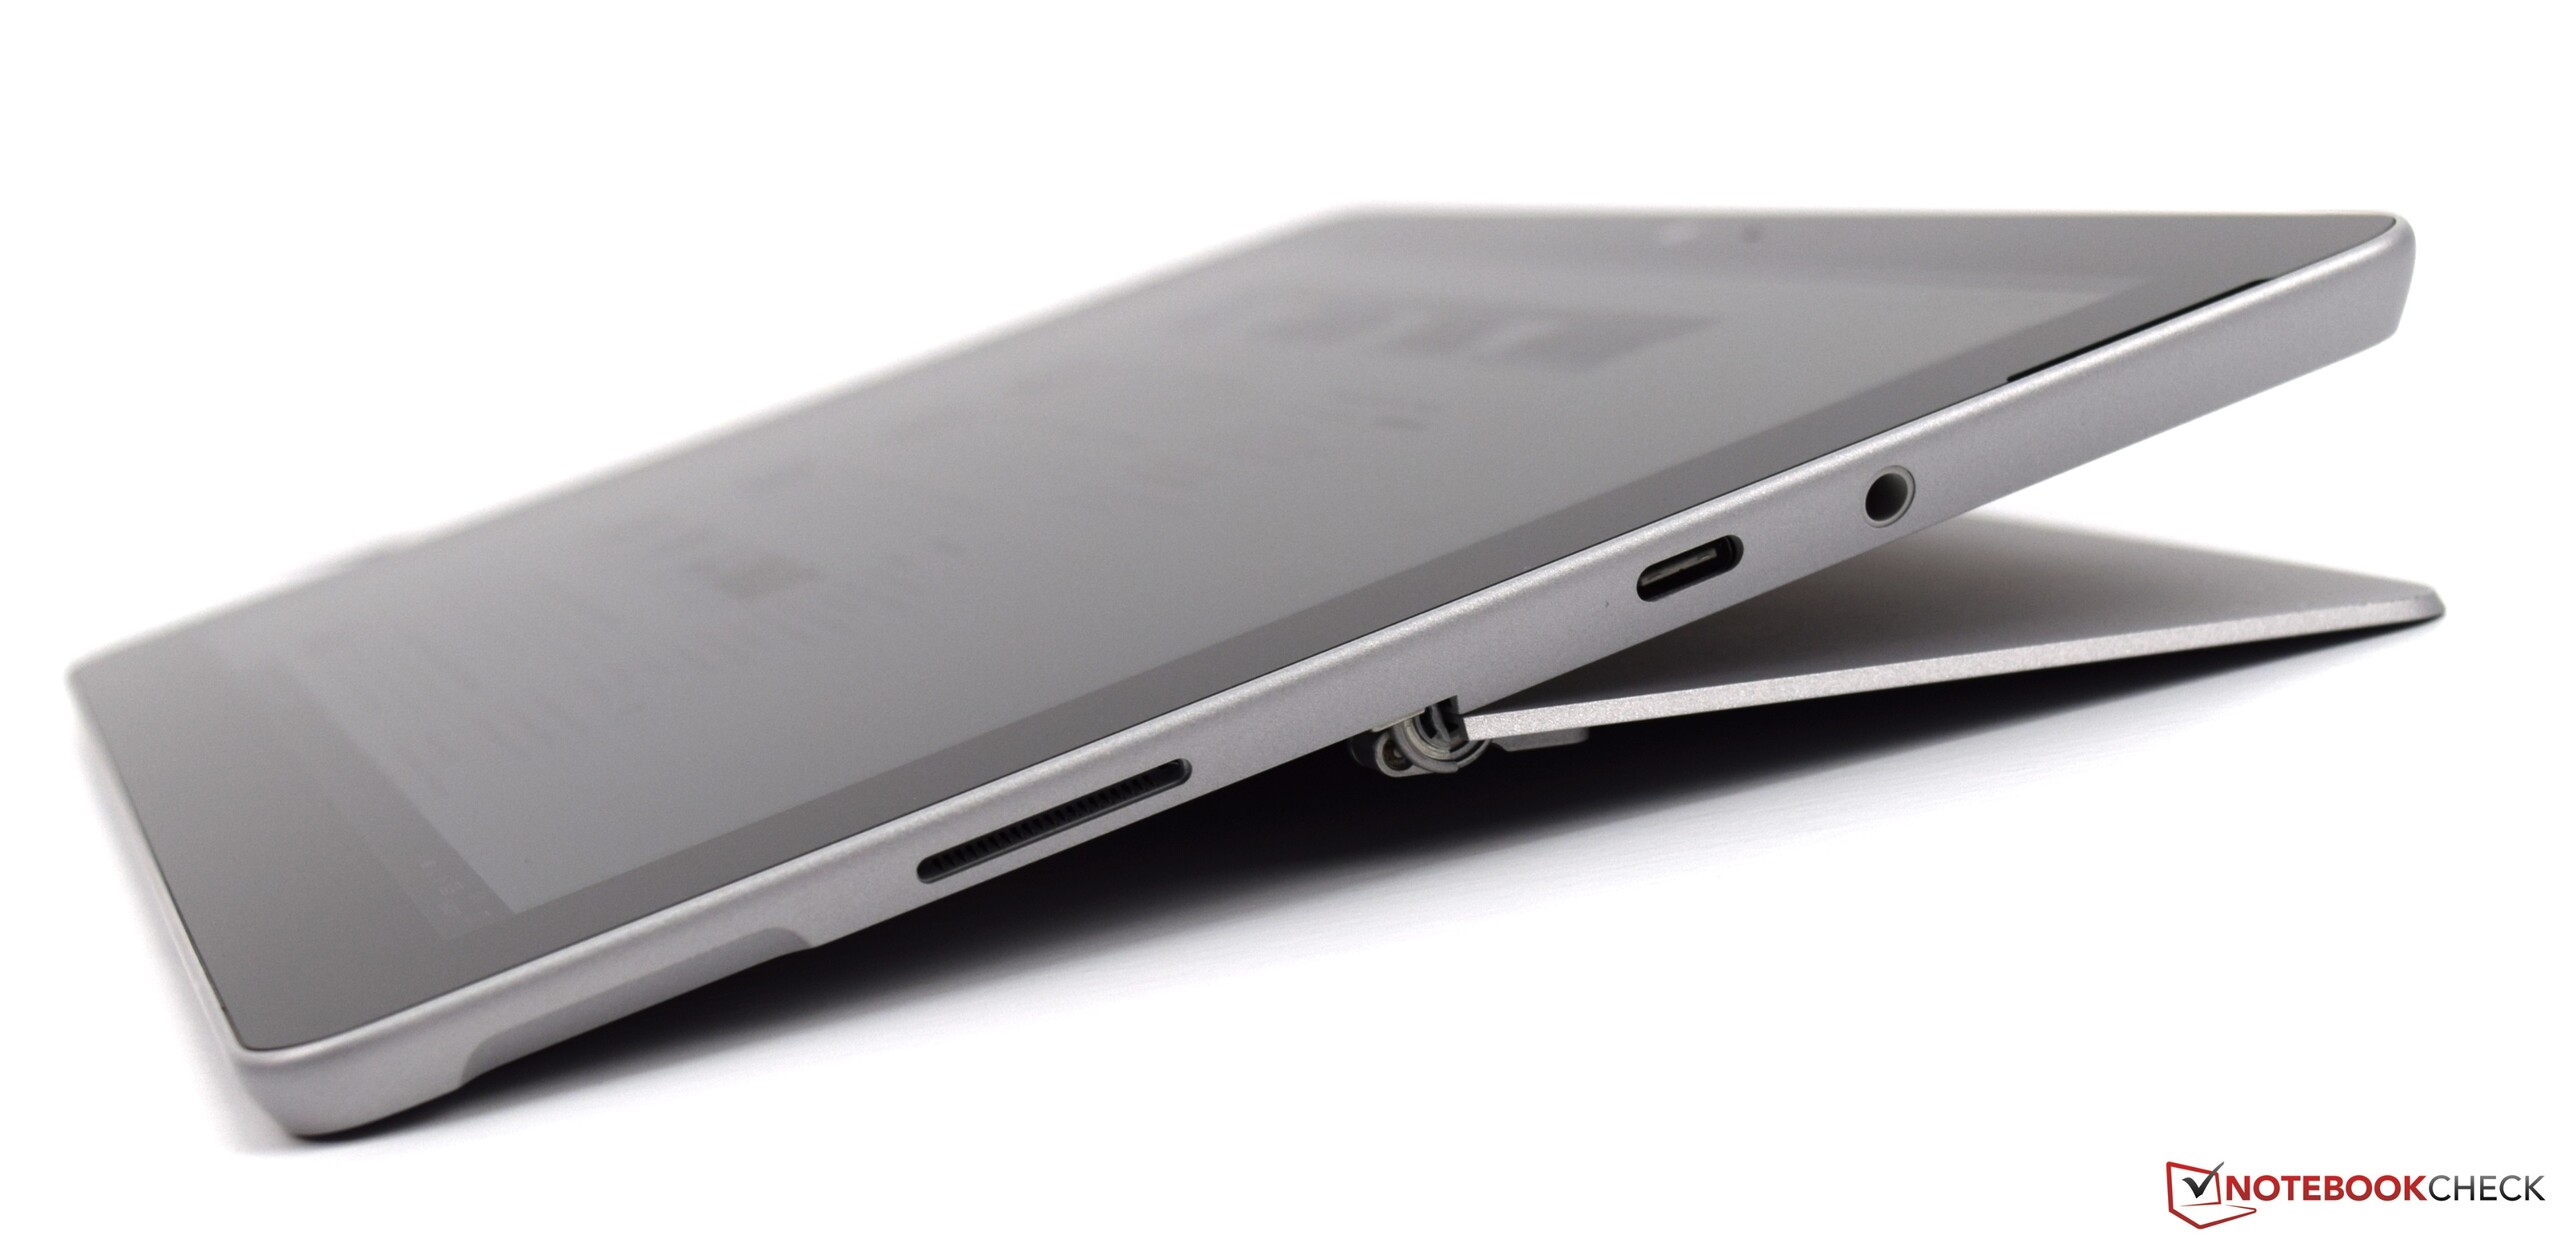
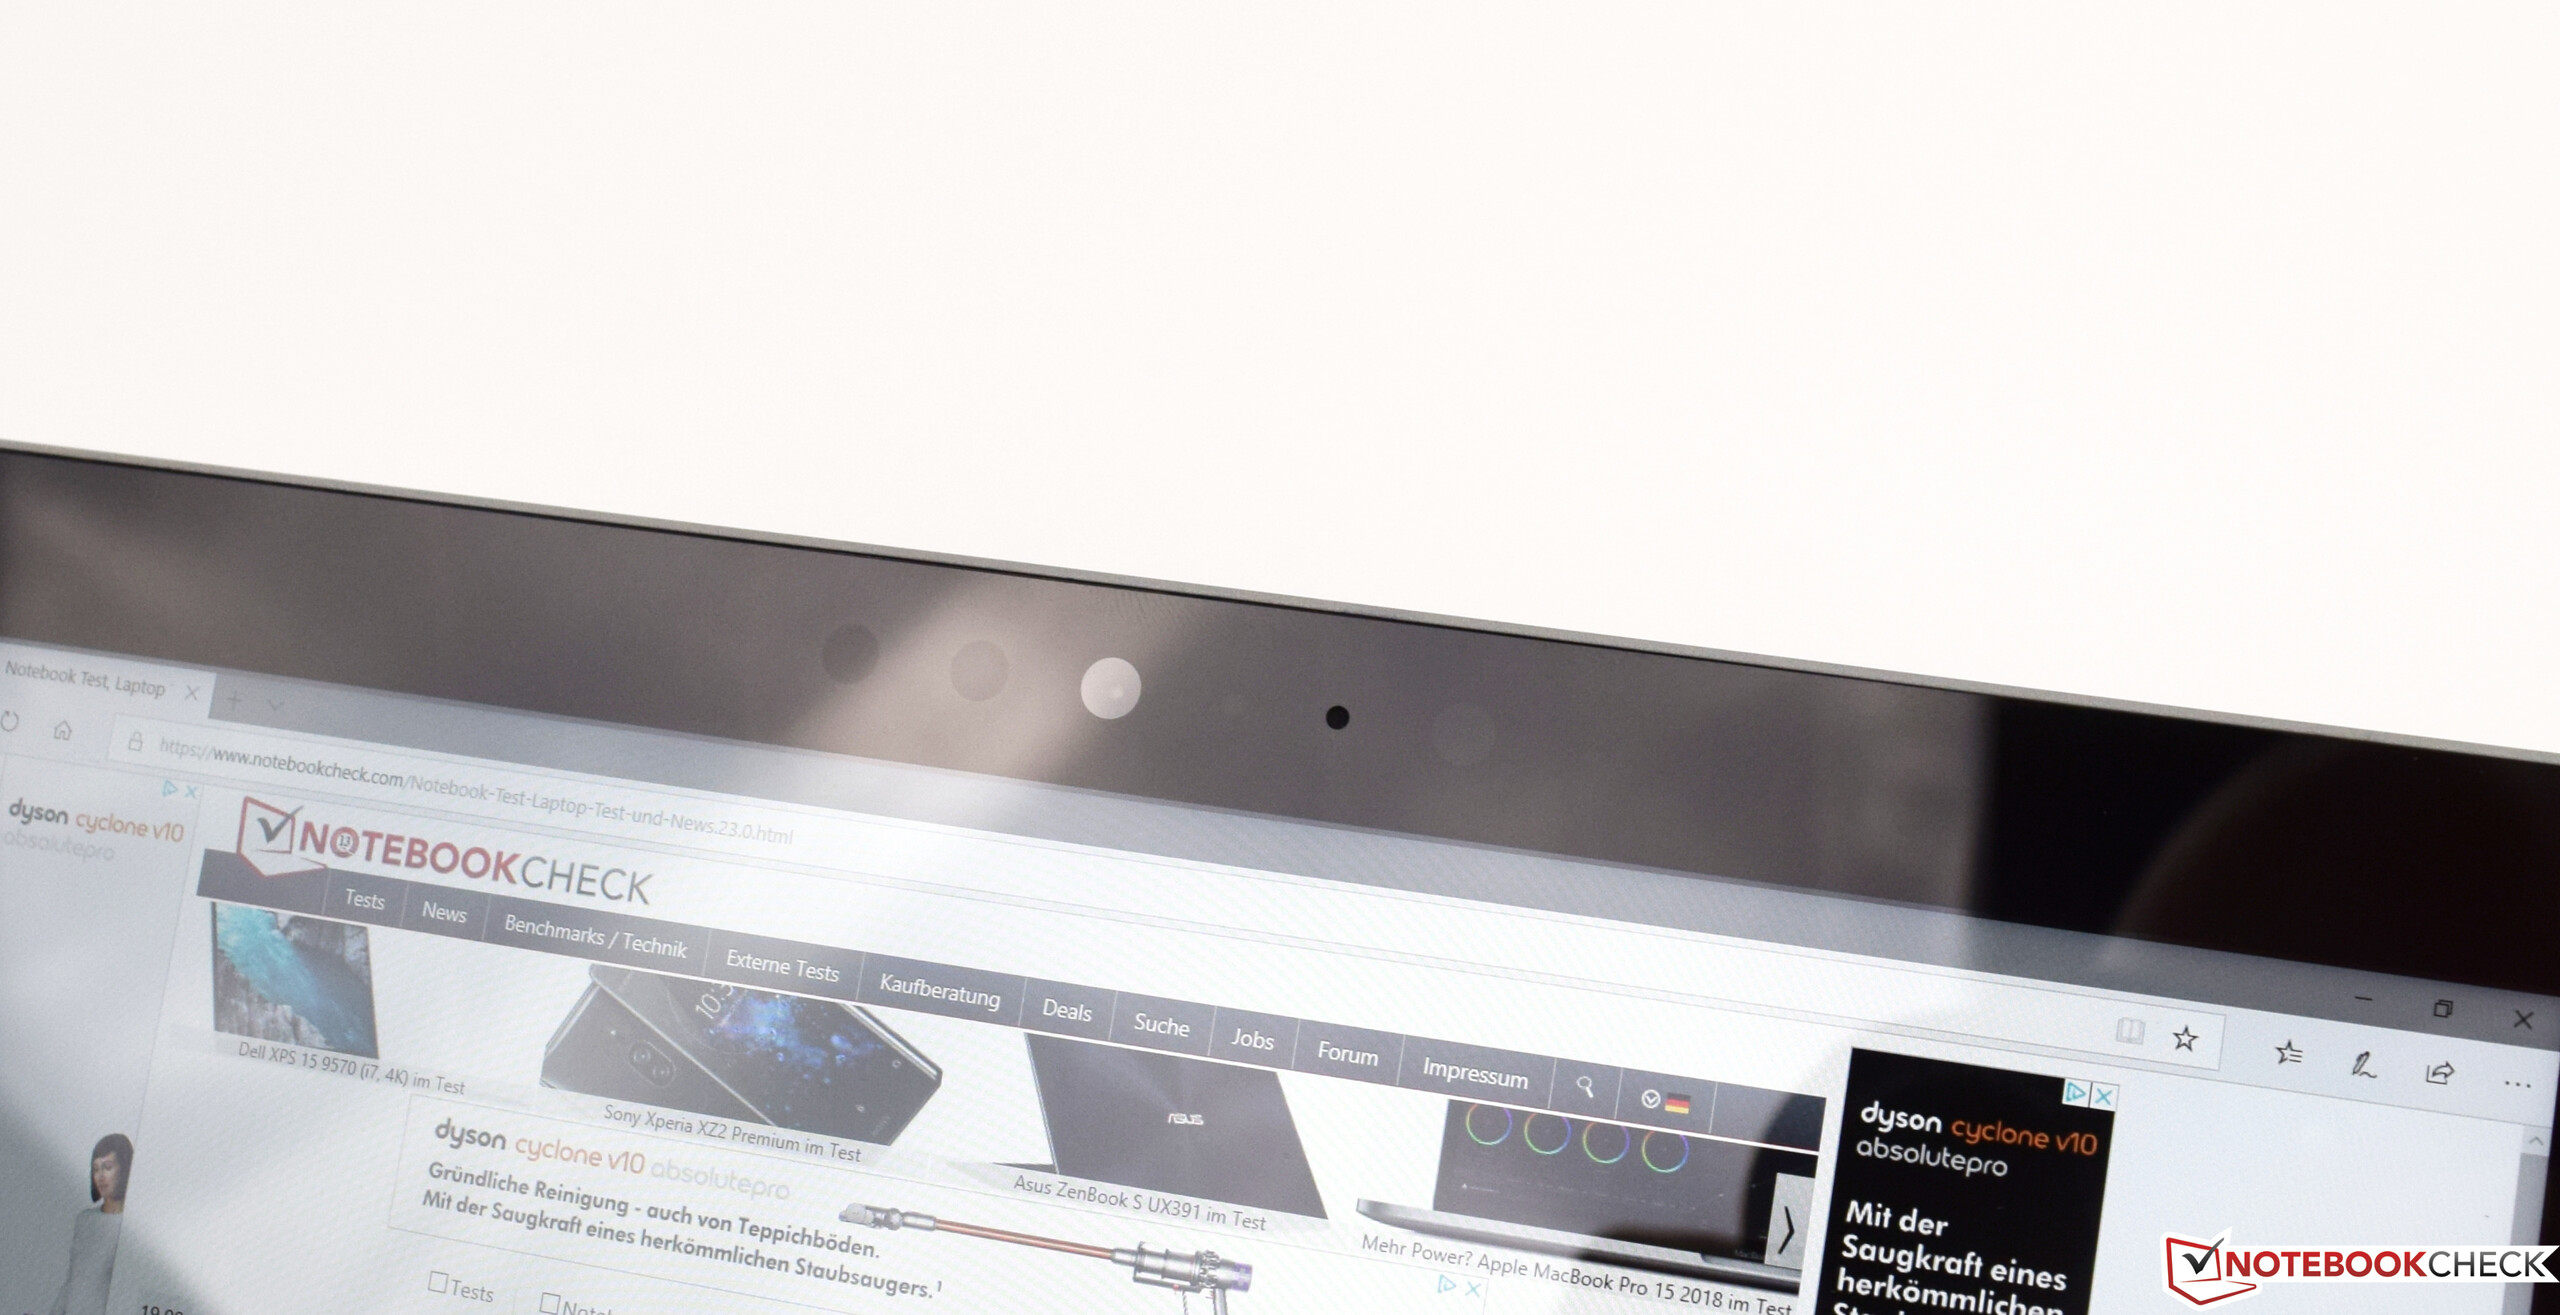
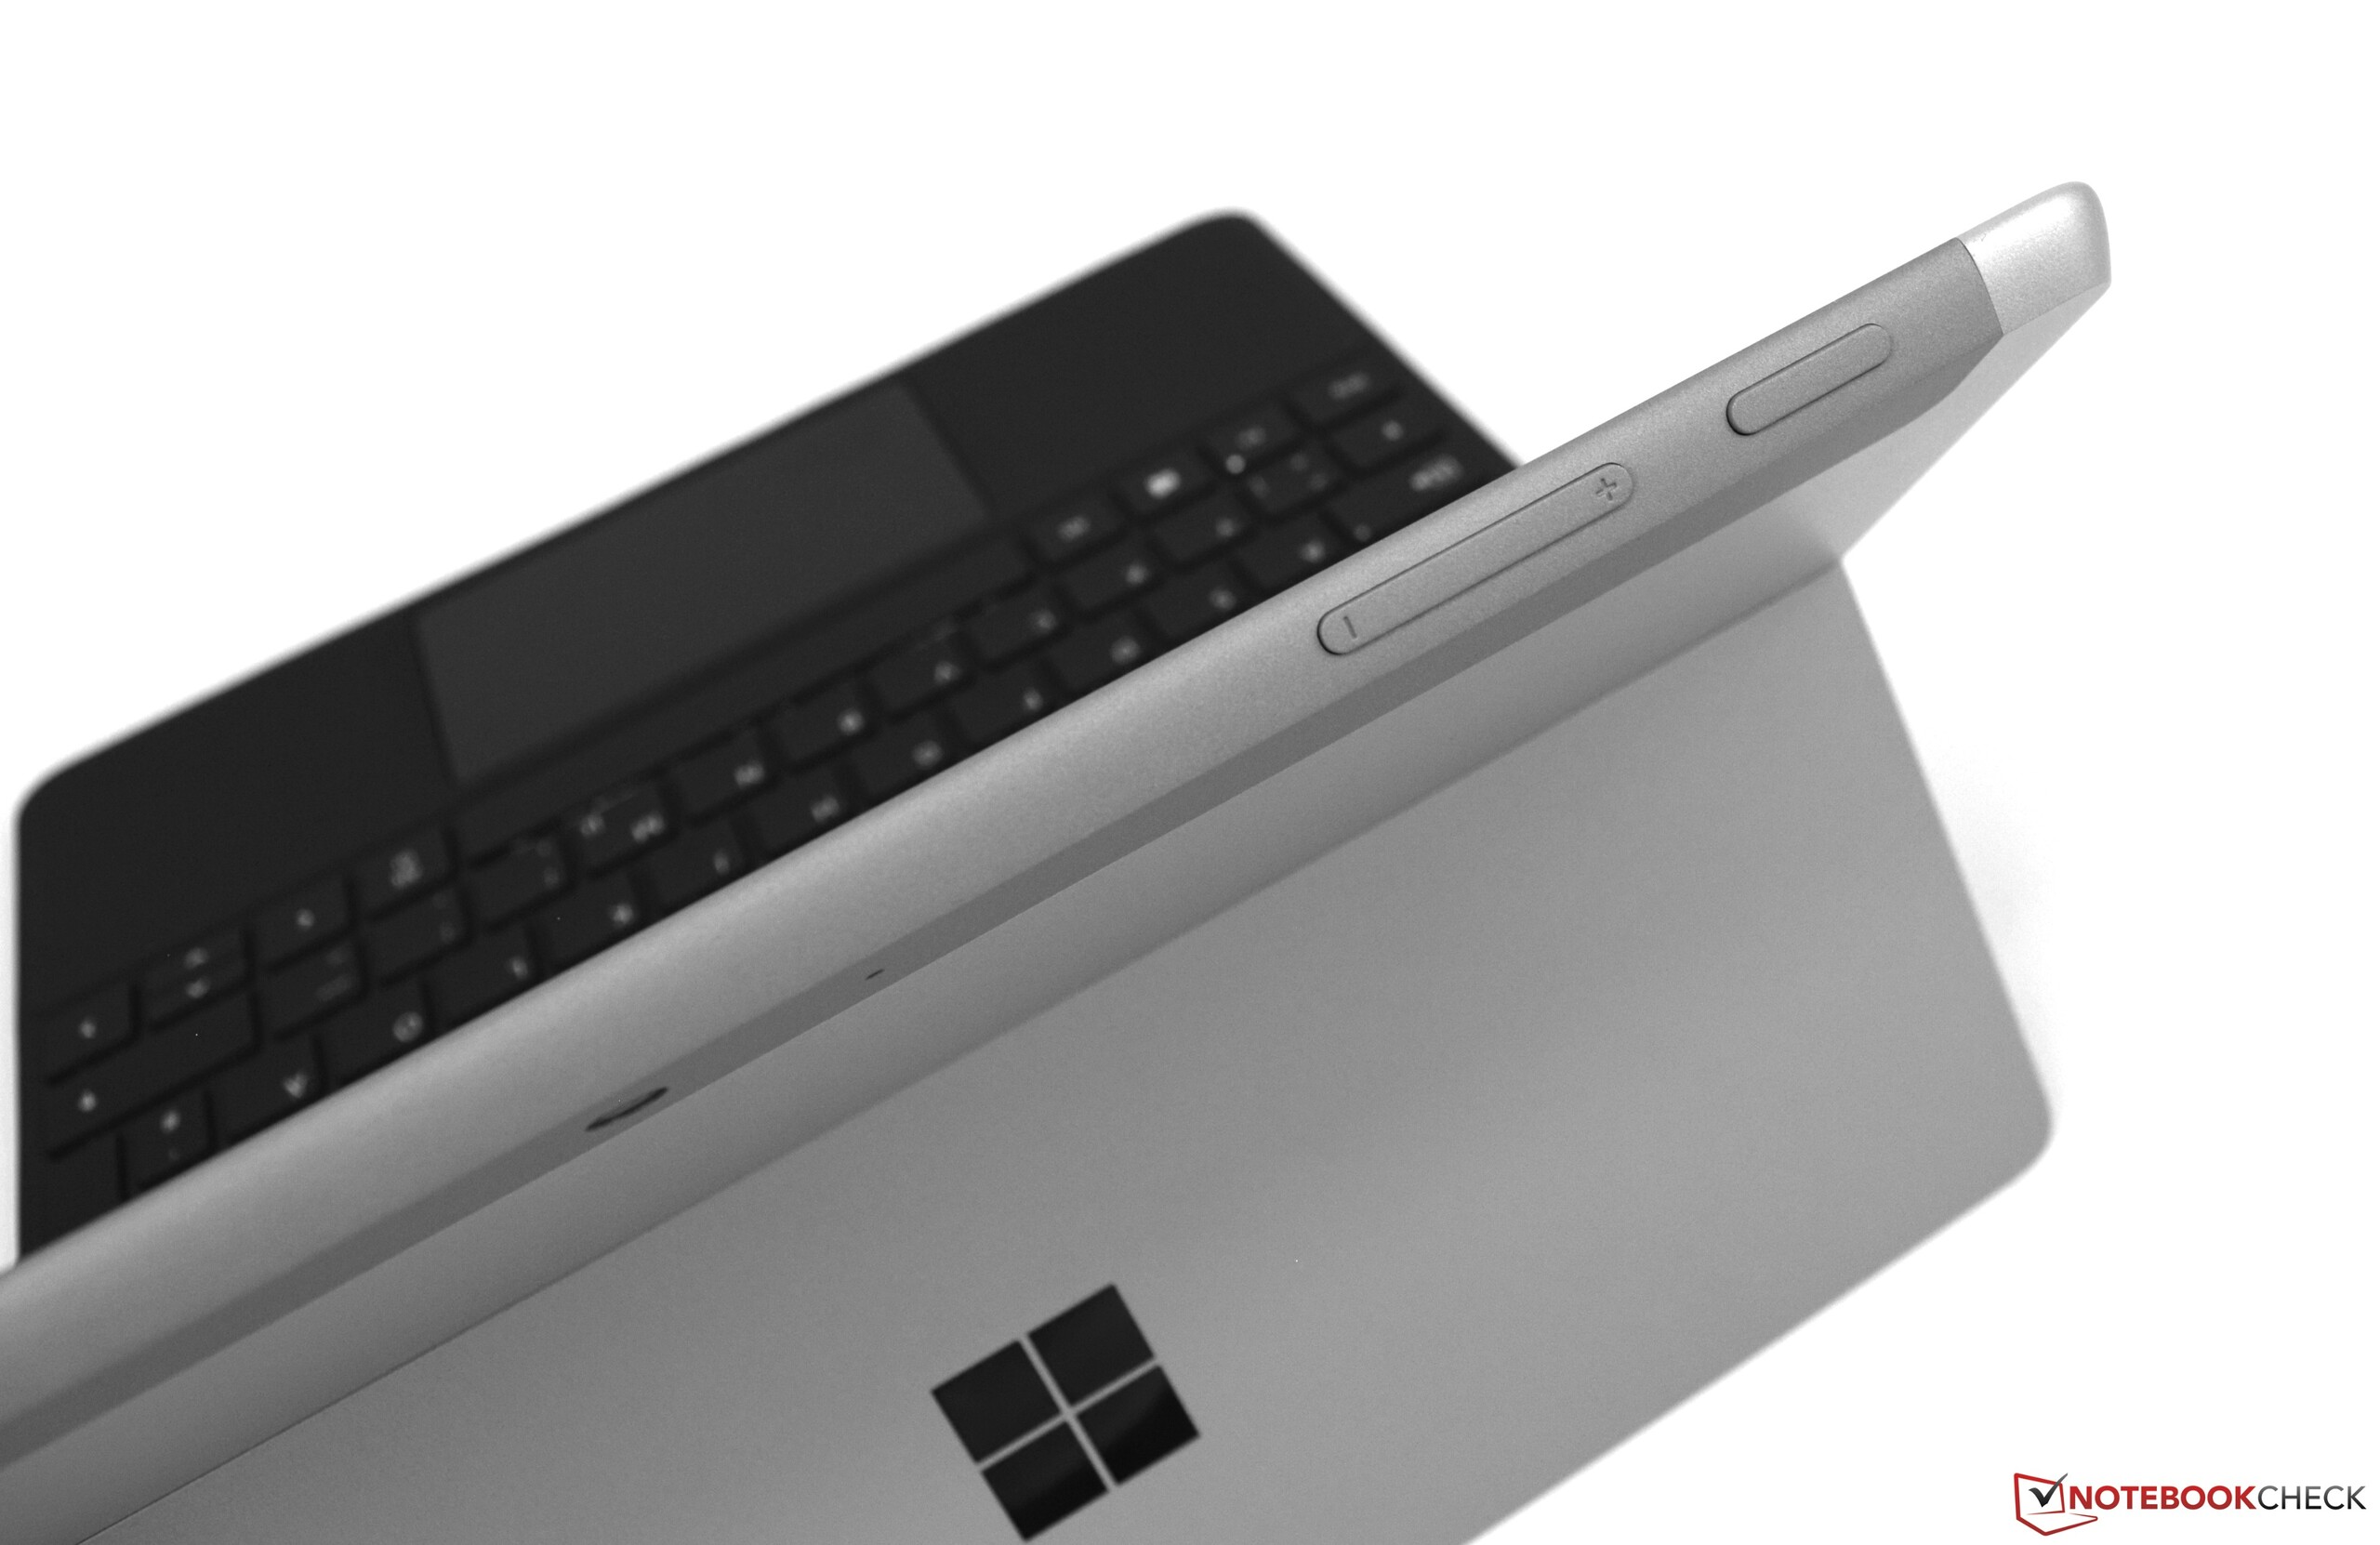
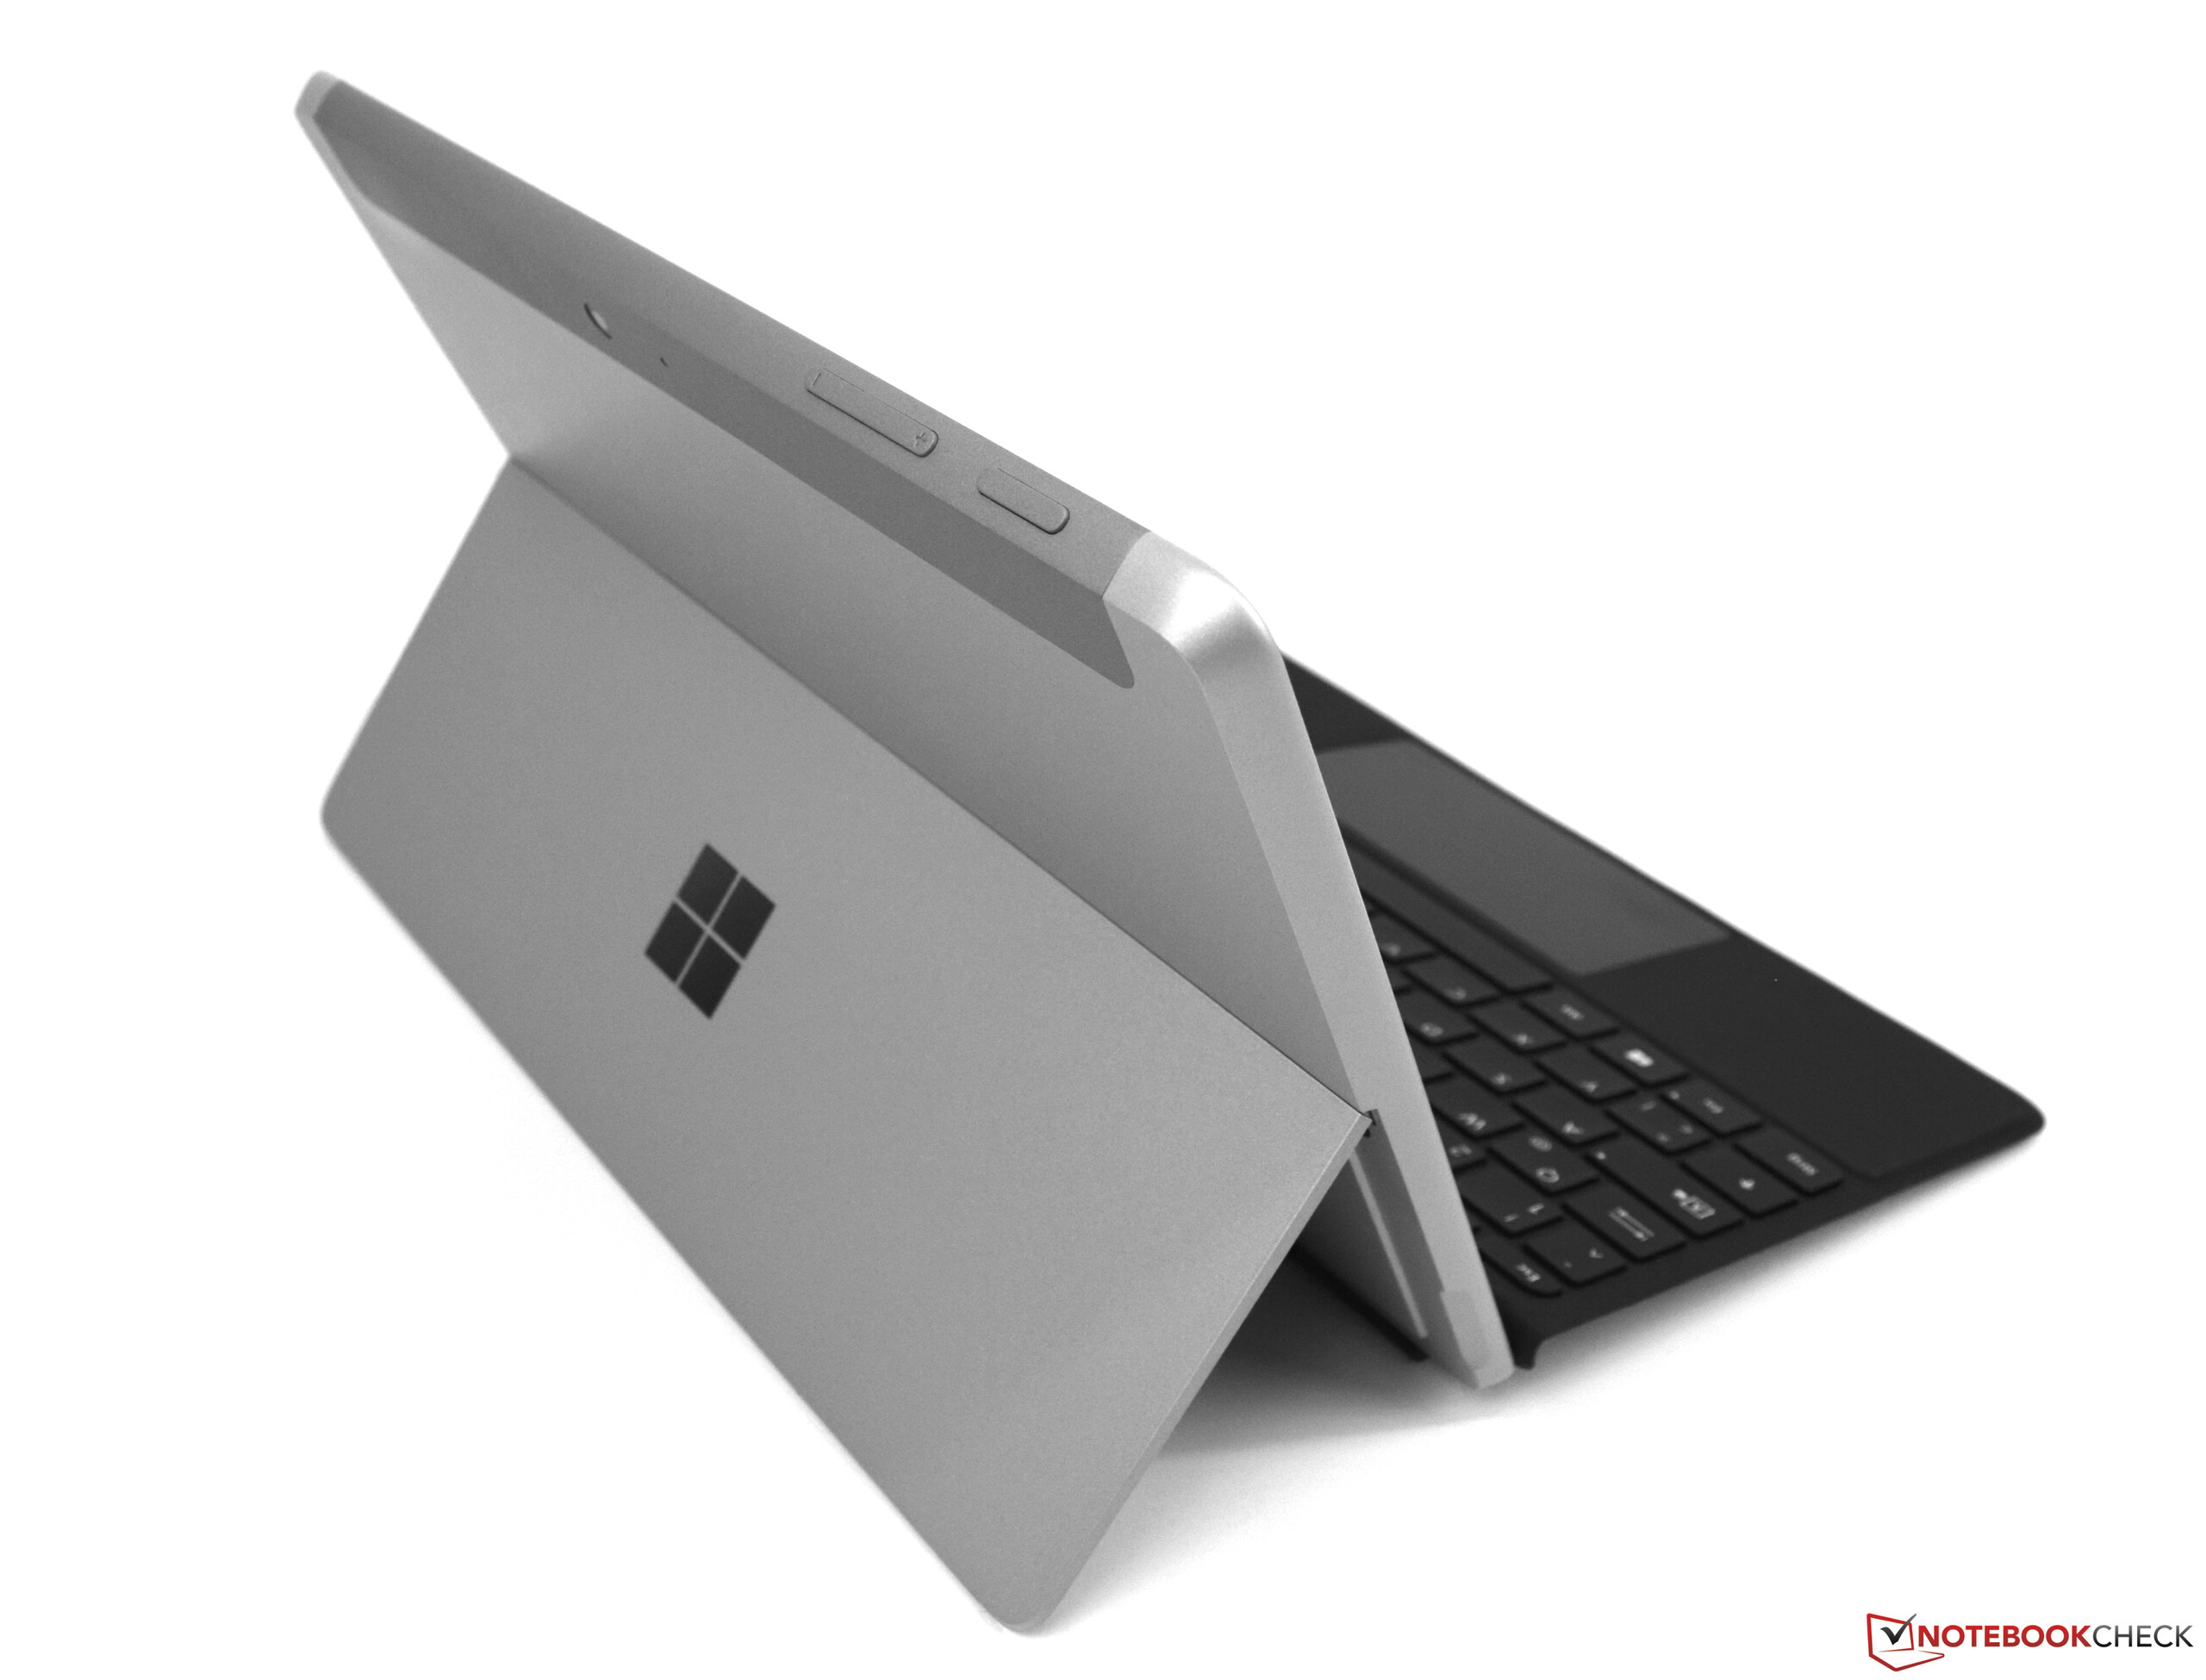
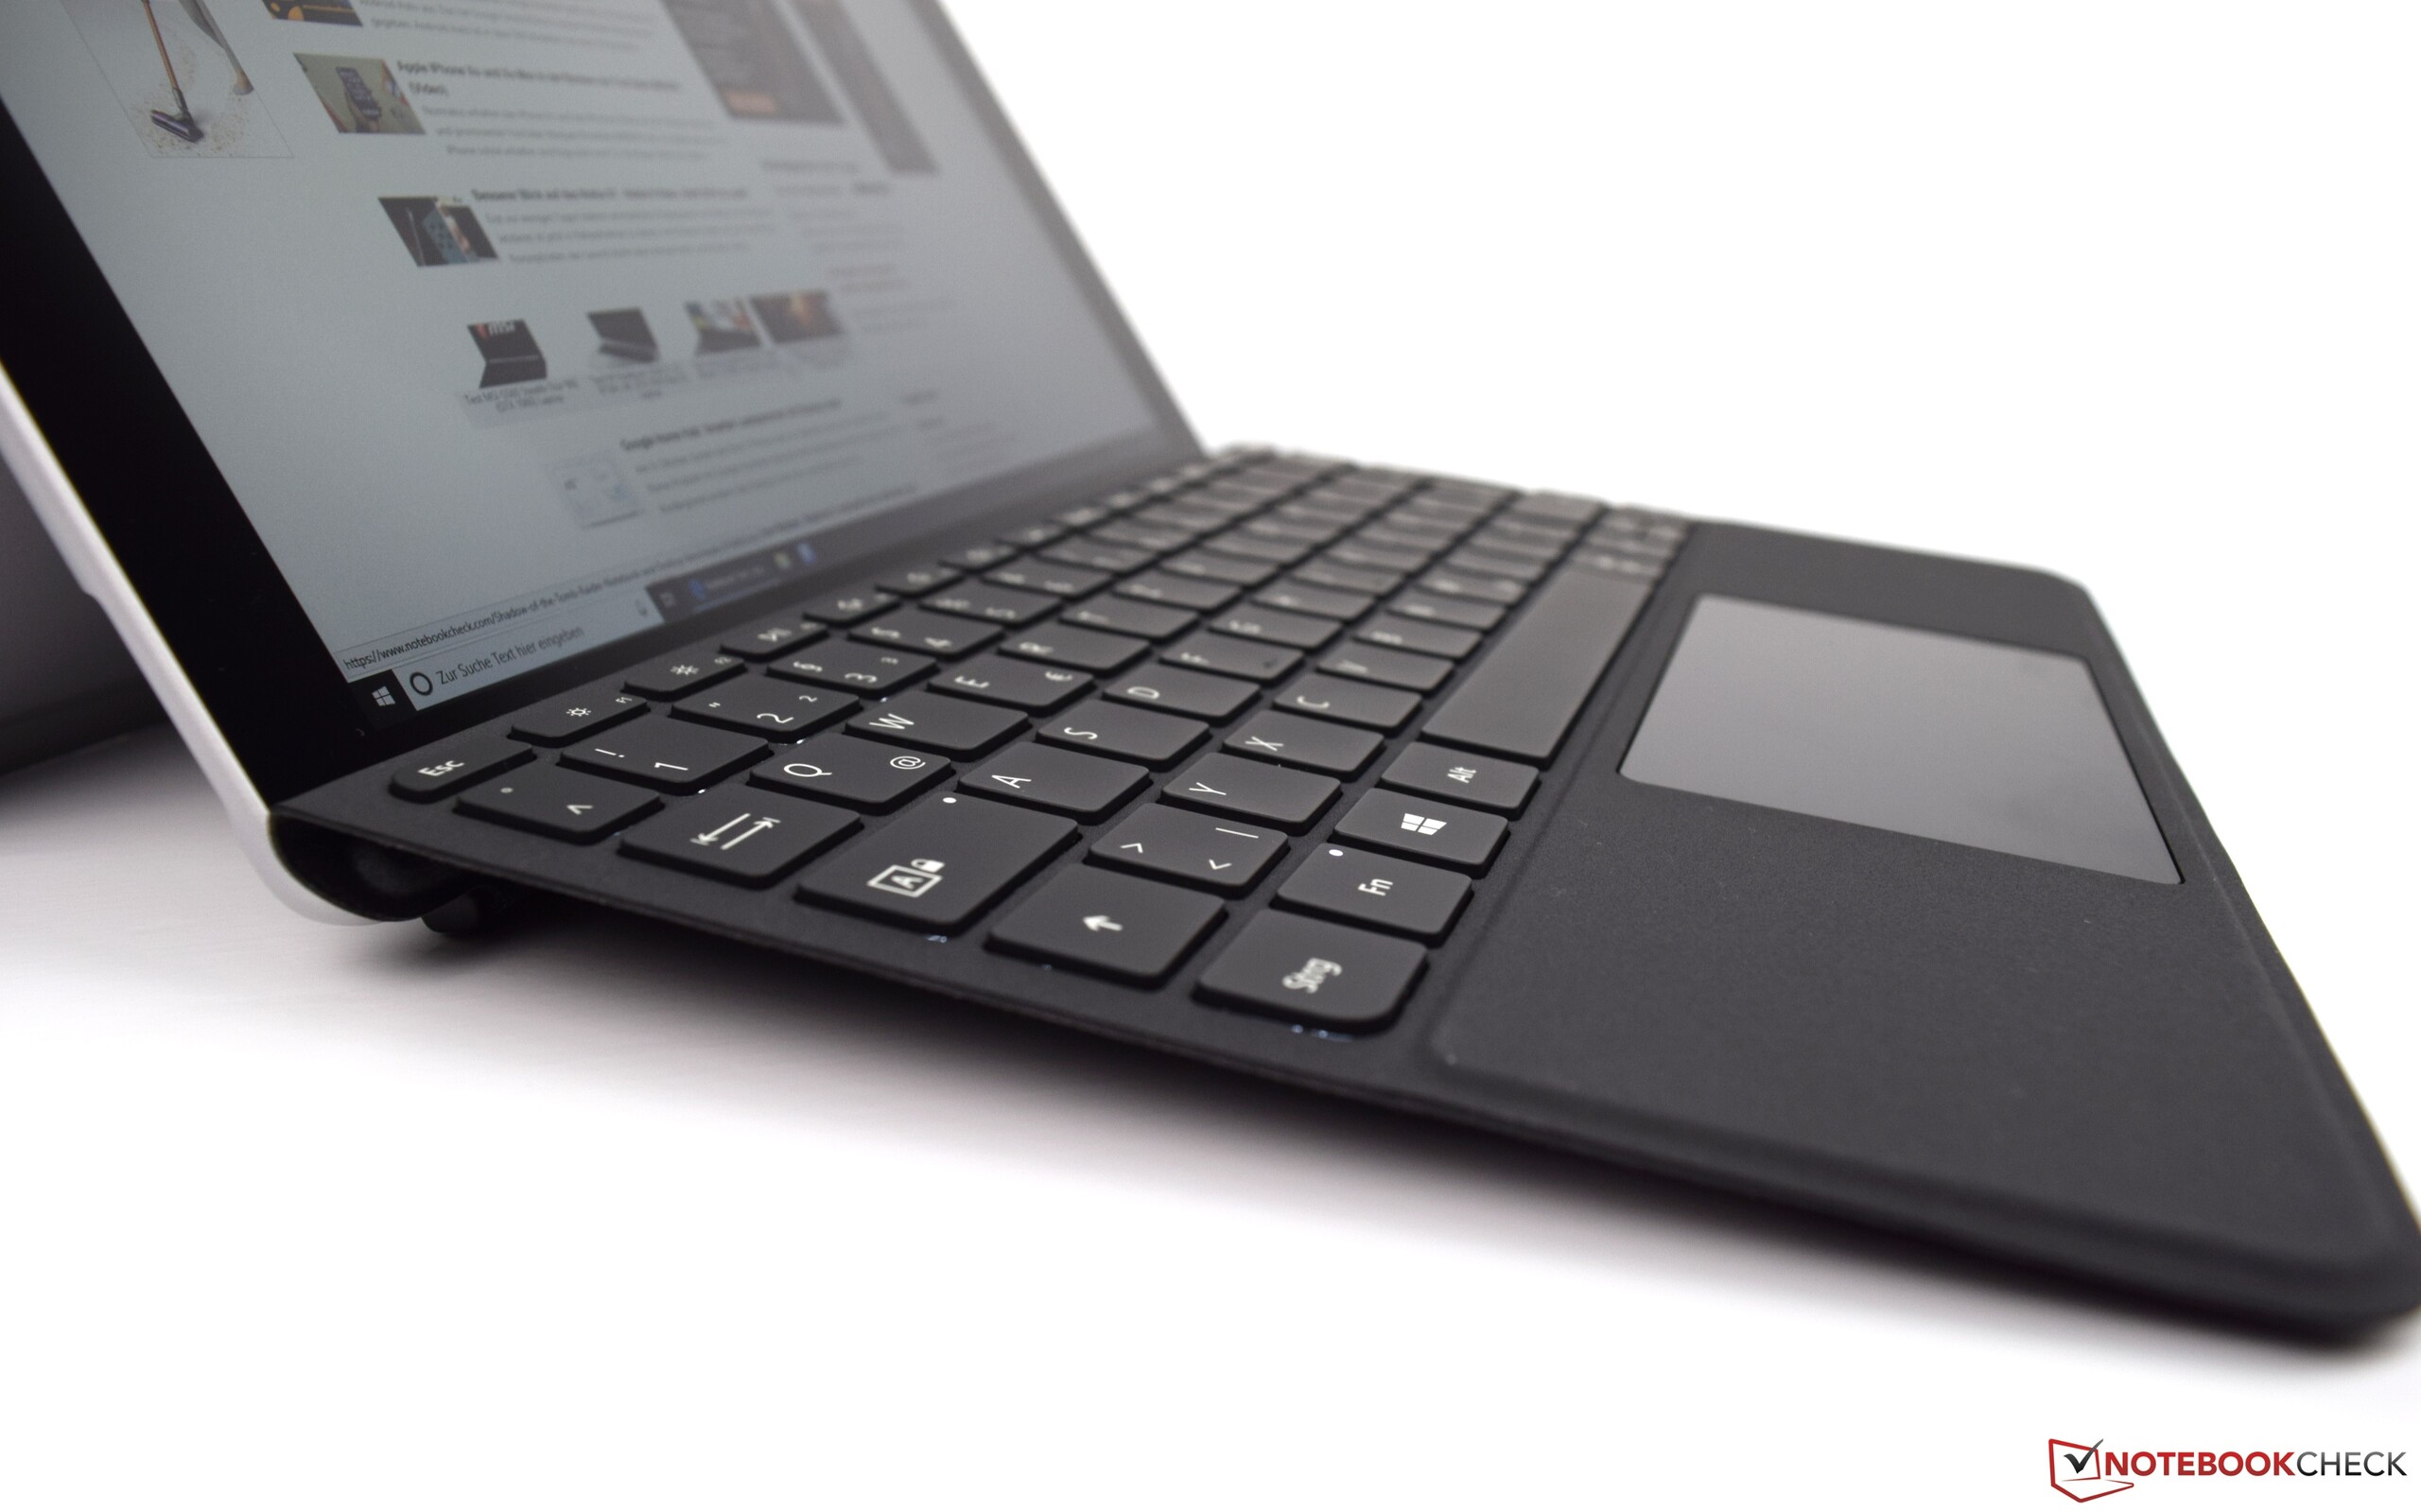
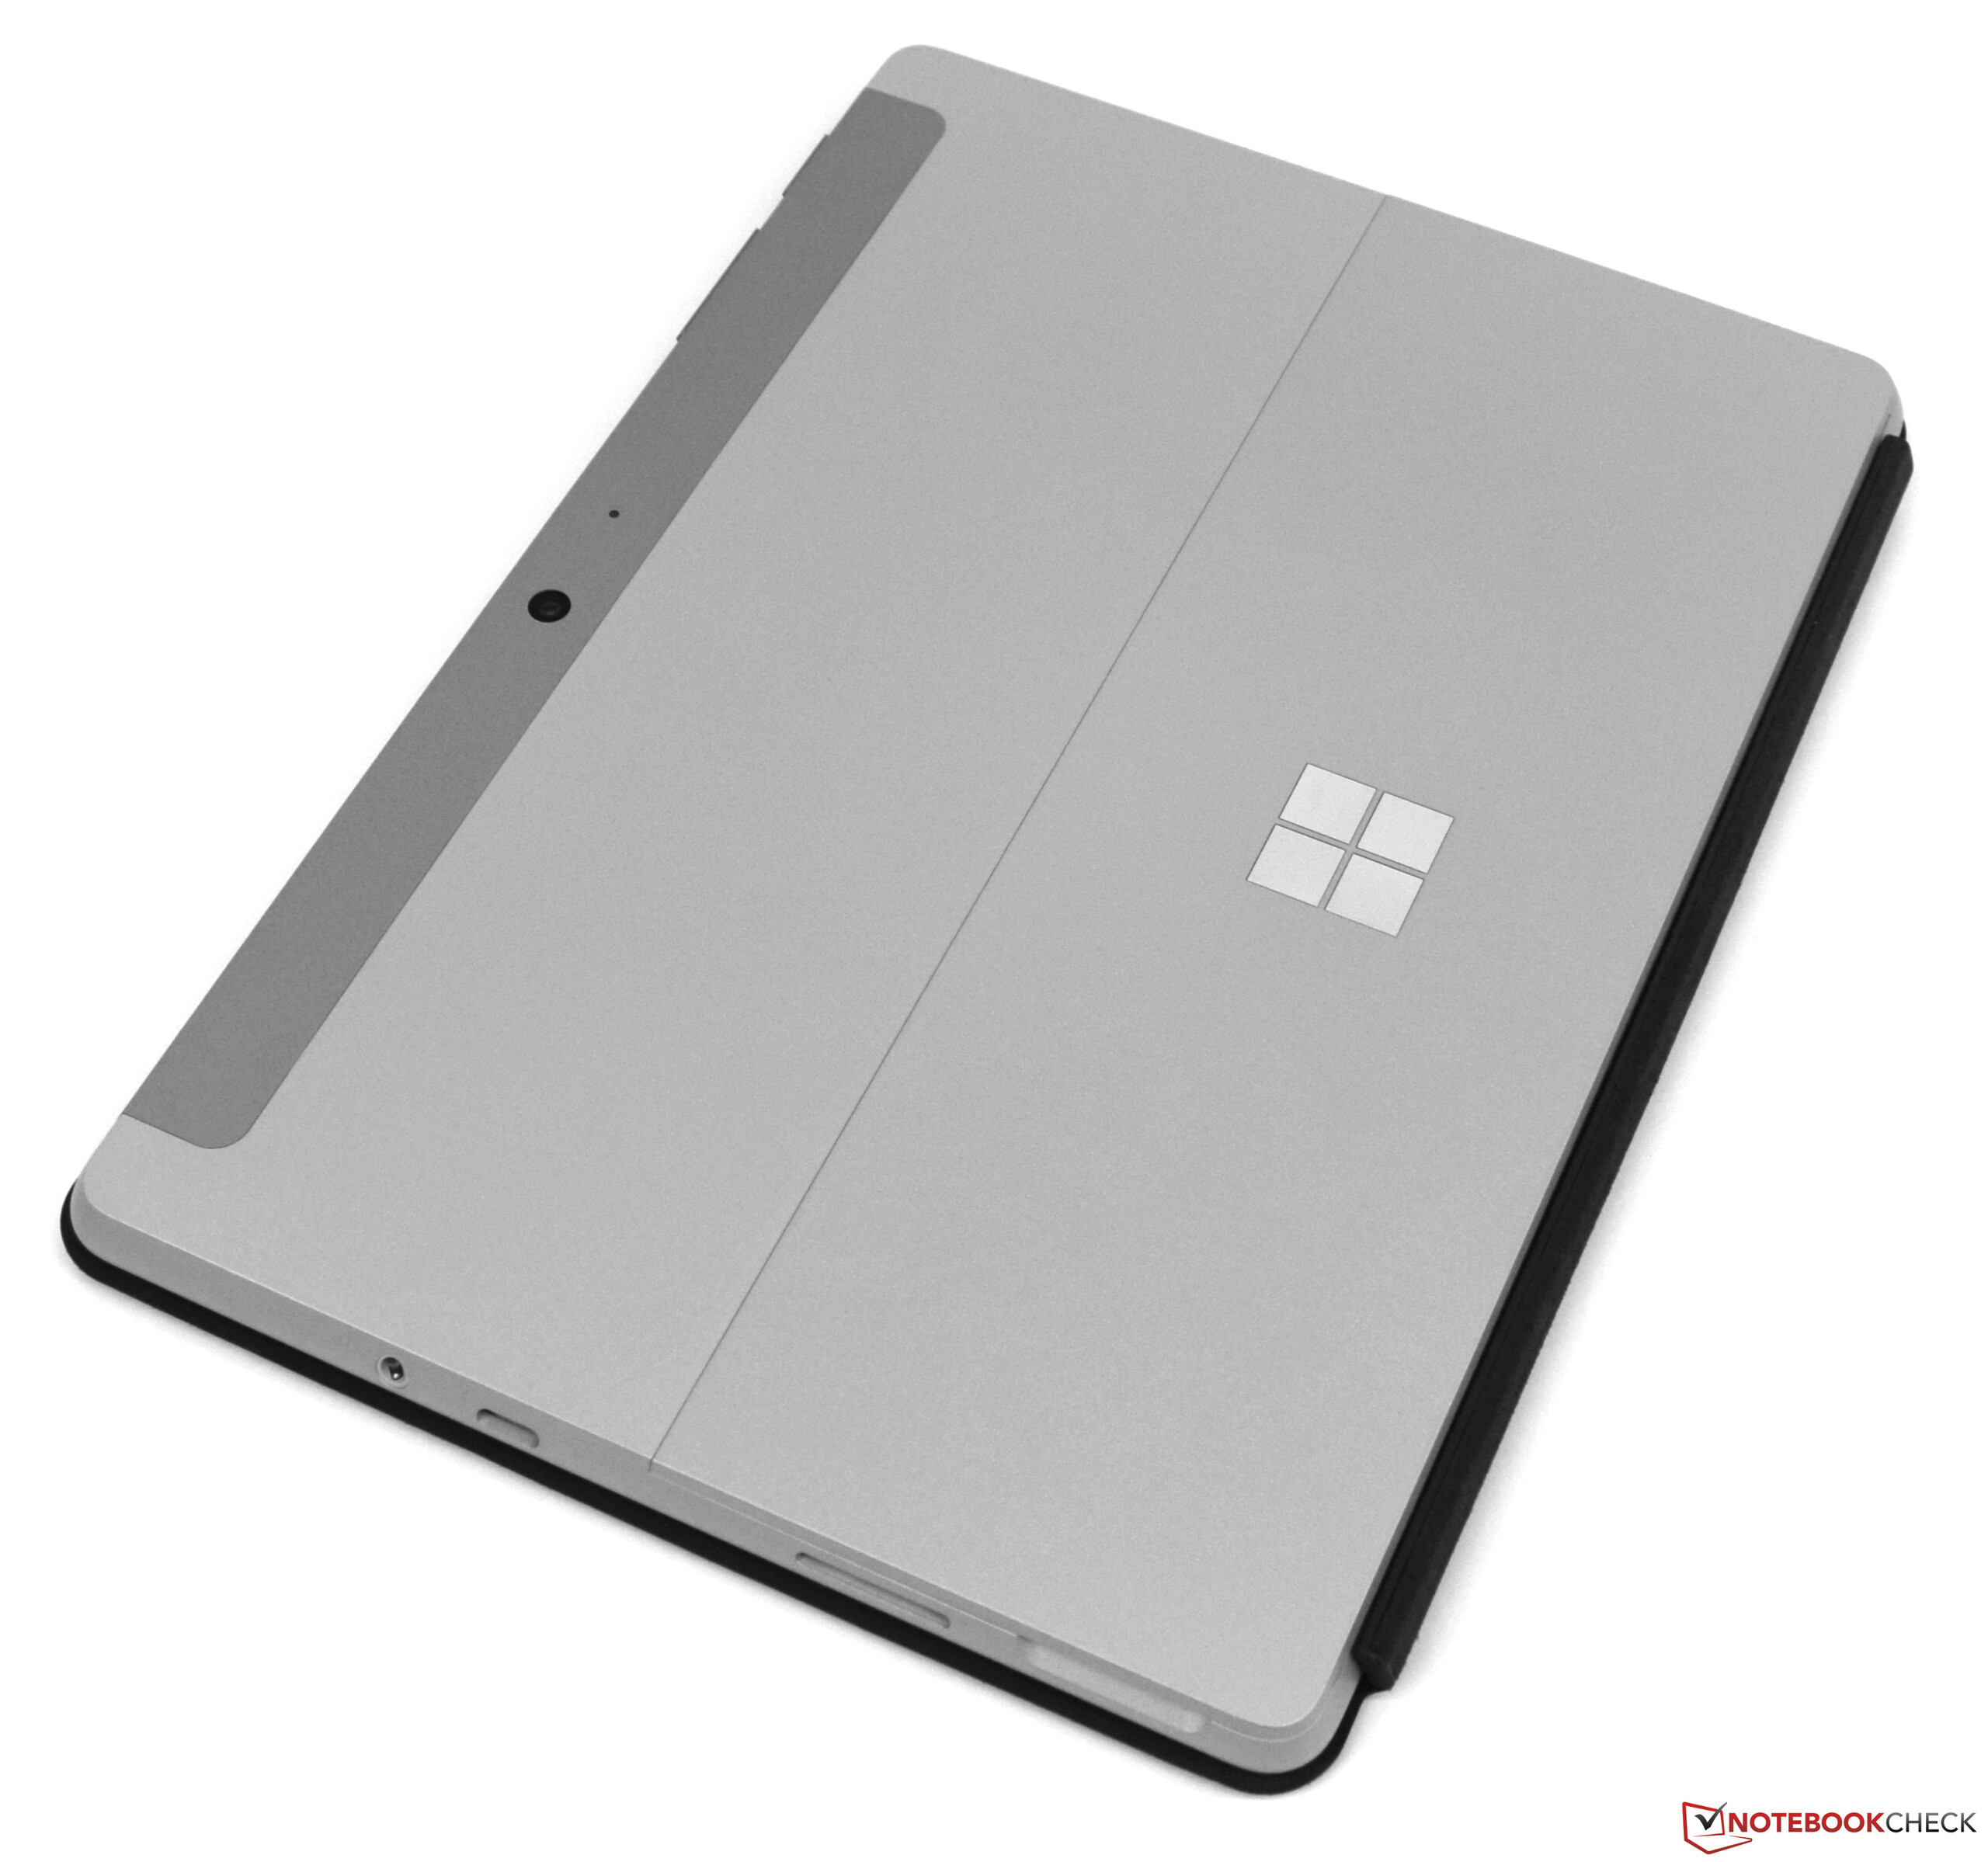
Vårt generella intryck är att detta definitivt är en riktigt välgjord surfplatta av hög kvalitet. Magnesiumhöljet var inte bara förvånansvärt lätt utan också väldigt robust och ytans textur gjorde den bekväm att hålla i. Vi imponerades särskilt av skärmen, som var ett värdefullt tillägg till denna billiga budgetenhet.
Intels Pentium 4415Y var tillräckligt snabb för en surfplatta och den interna GPU:n klarade utan problem av att visa video i 2160p smidigt. Oavsett priset är detta en bedrift och kommer definitivt vara viktigt för många intresserade köpare.
Microsofts Surface Go är en extremt välbyggd Windows-surfplatta med ett jämförelsevis lågt pris (för att vara en Surface-modell). Men de dyra tillbehören kan visa sig vara avskräckande för många användare.
Varför Microsoft har valt att endast erbjuda 64 GB eMMC-minne till instegs-SKU:n förblir för oss ett mysterium. På grund av detta tvingas i princip intresserade köpare att spendera ytterligare 1.500 kronor på varianten med 128 GB.
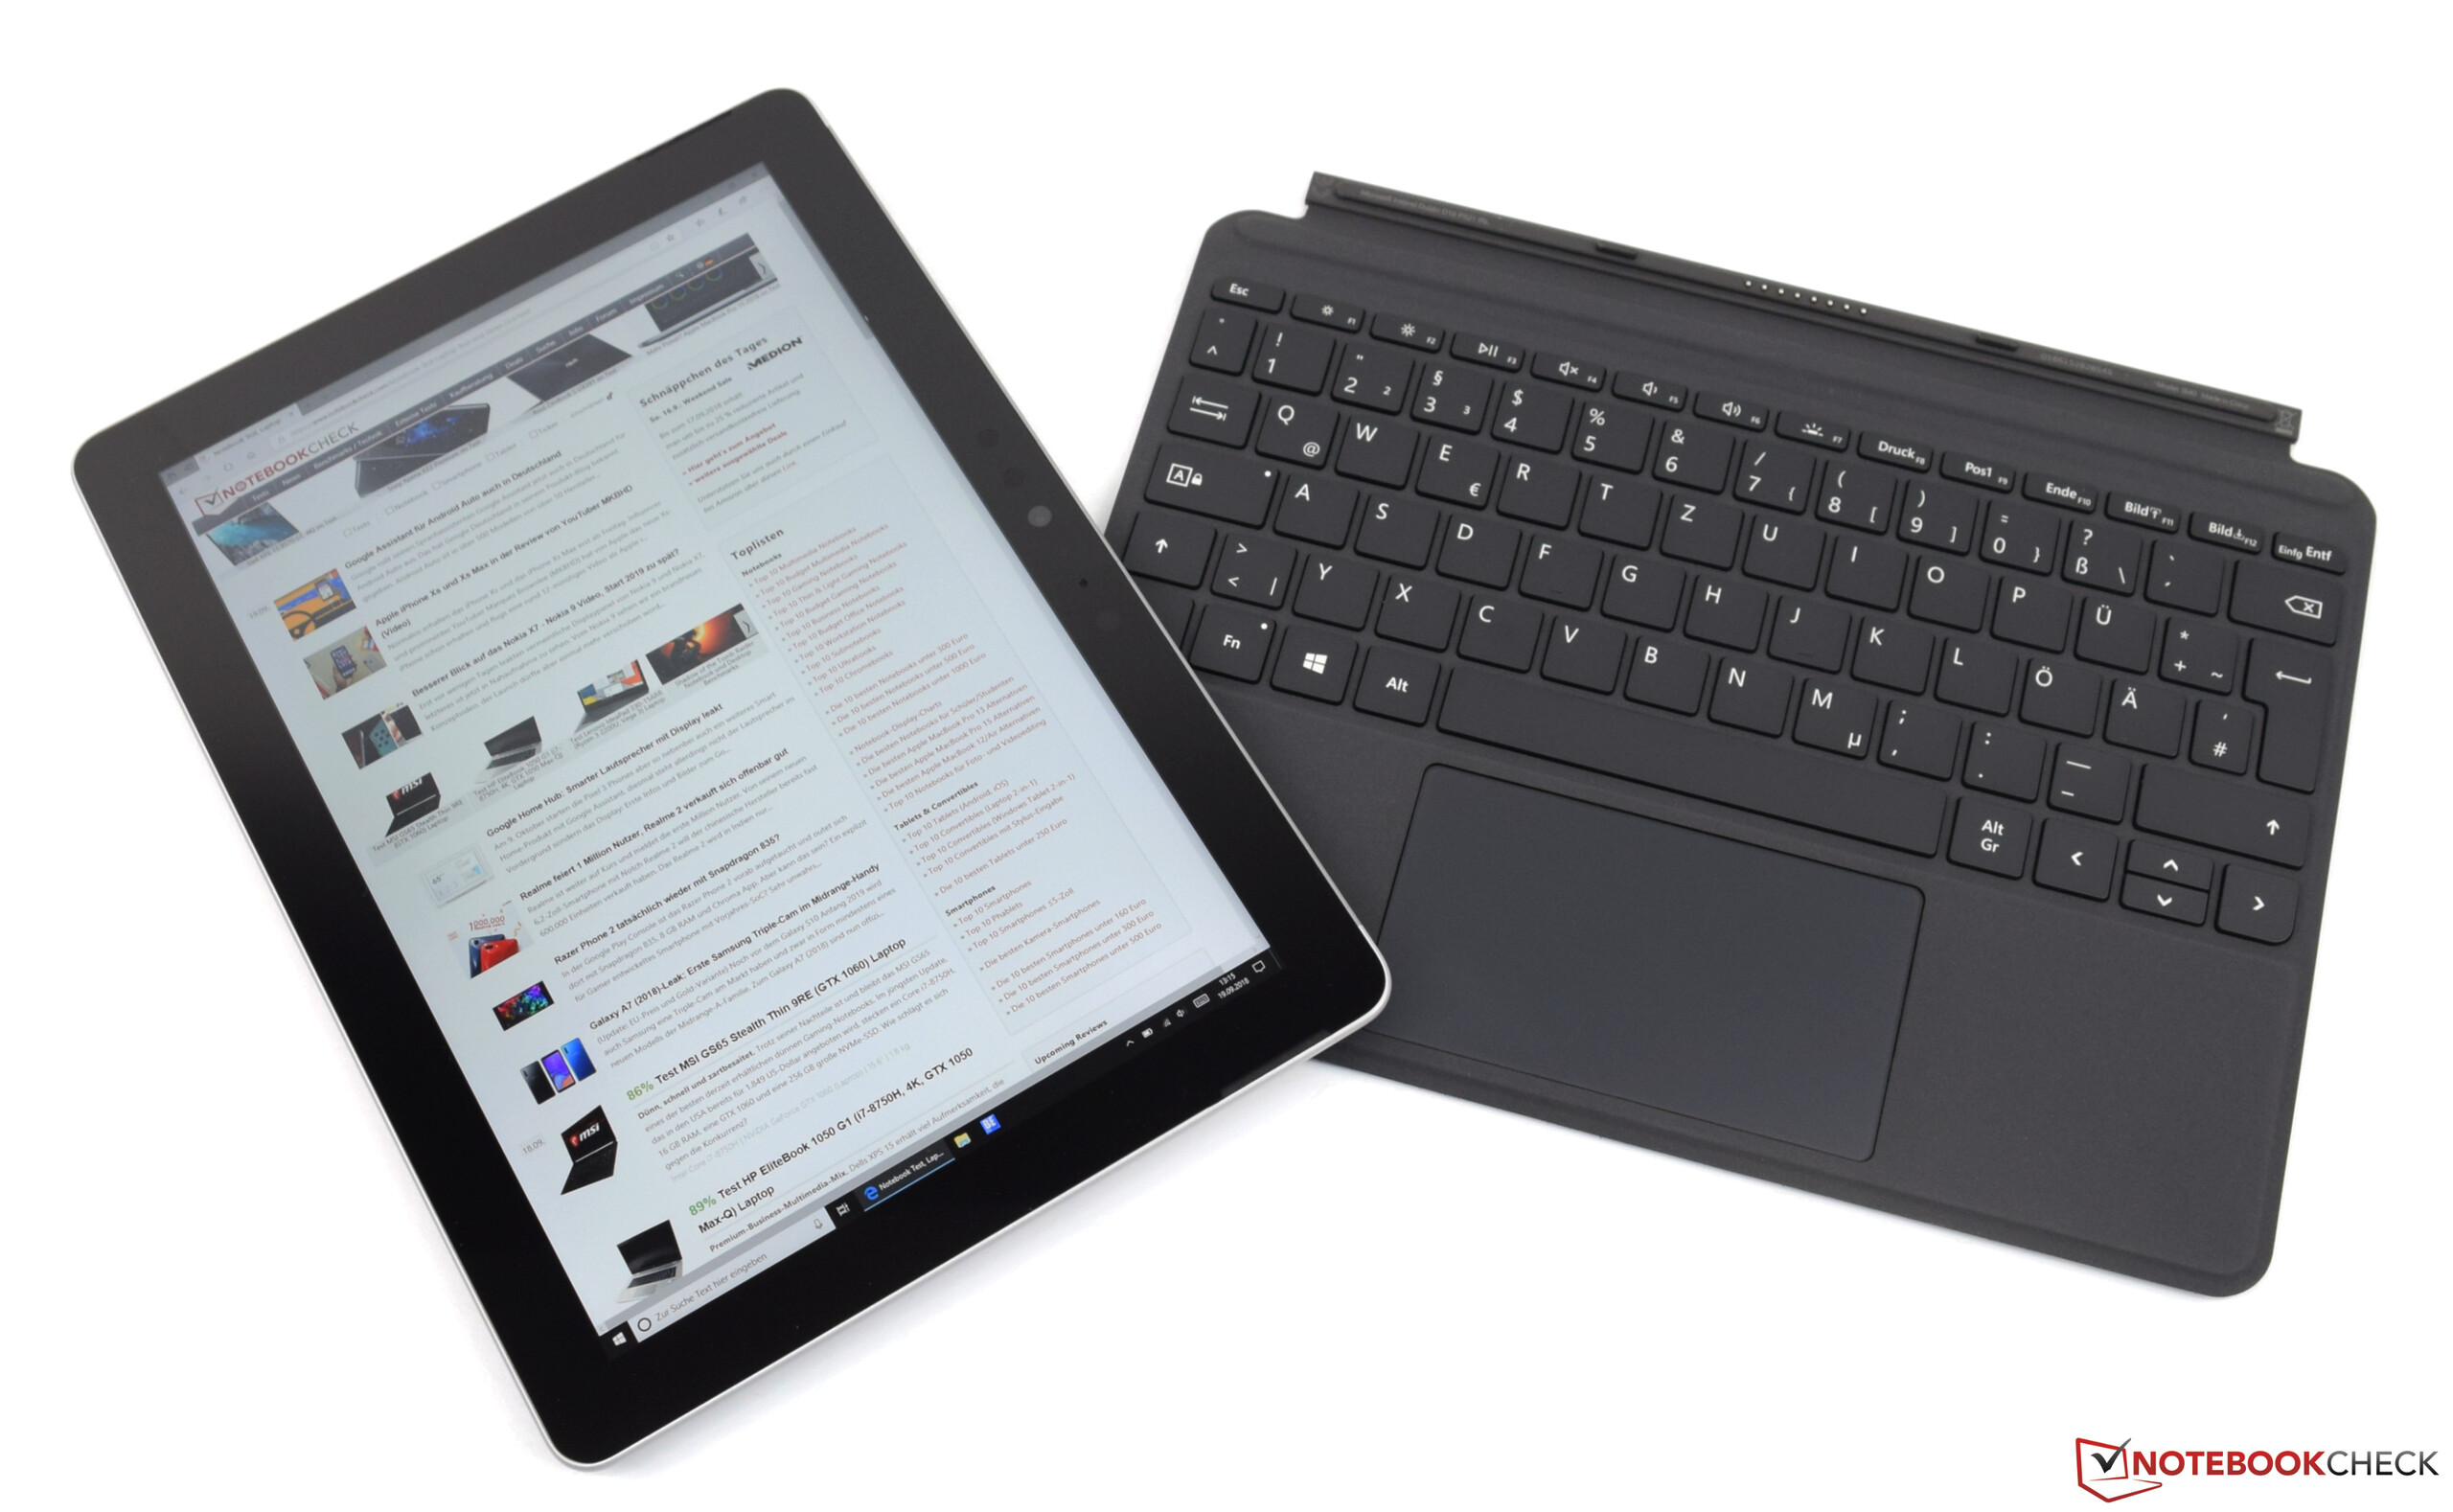
I slutändan får var och en avgöra huruvida 64 GB är tillräckligt. Go har åtminstone en microSD-kortläsare för den som väljer det billigare alternativet.
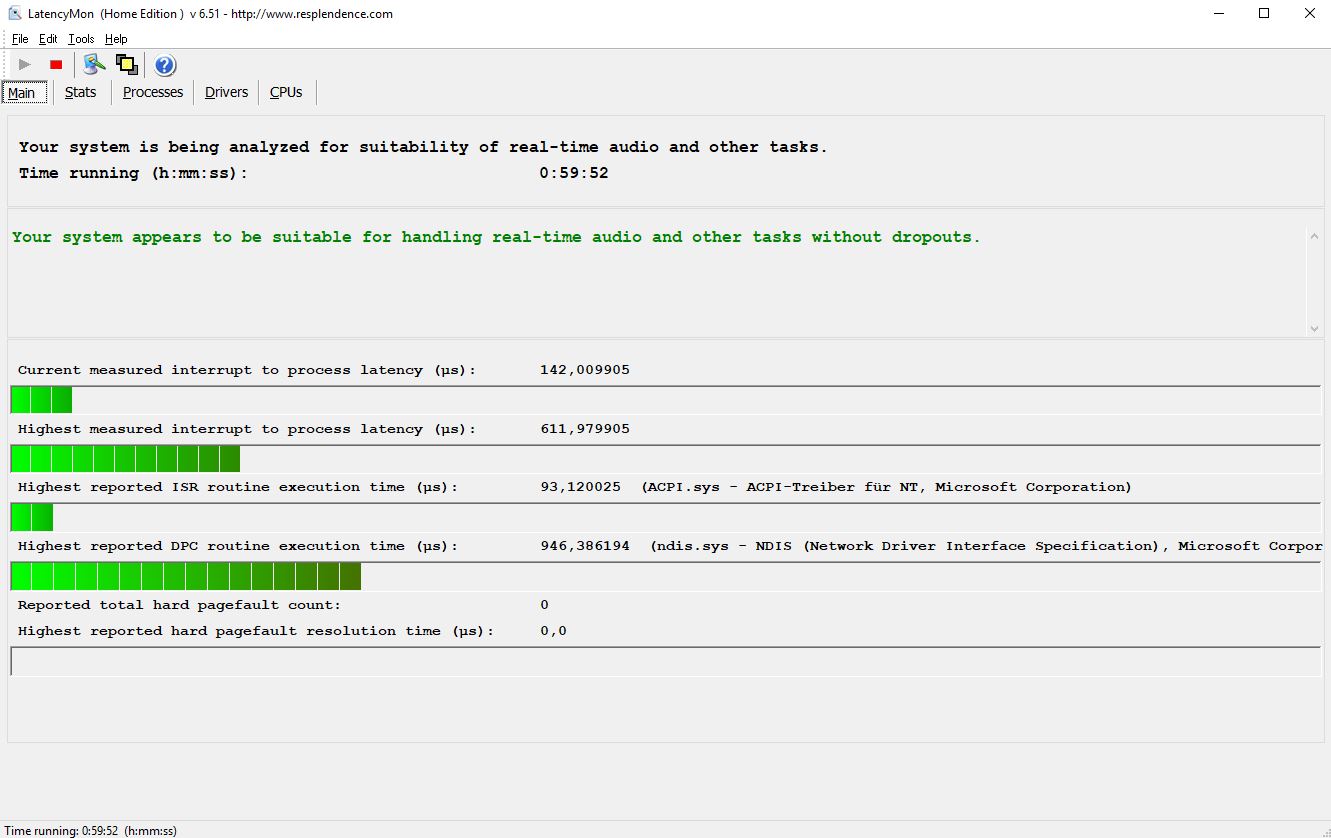
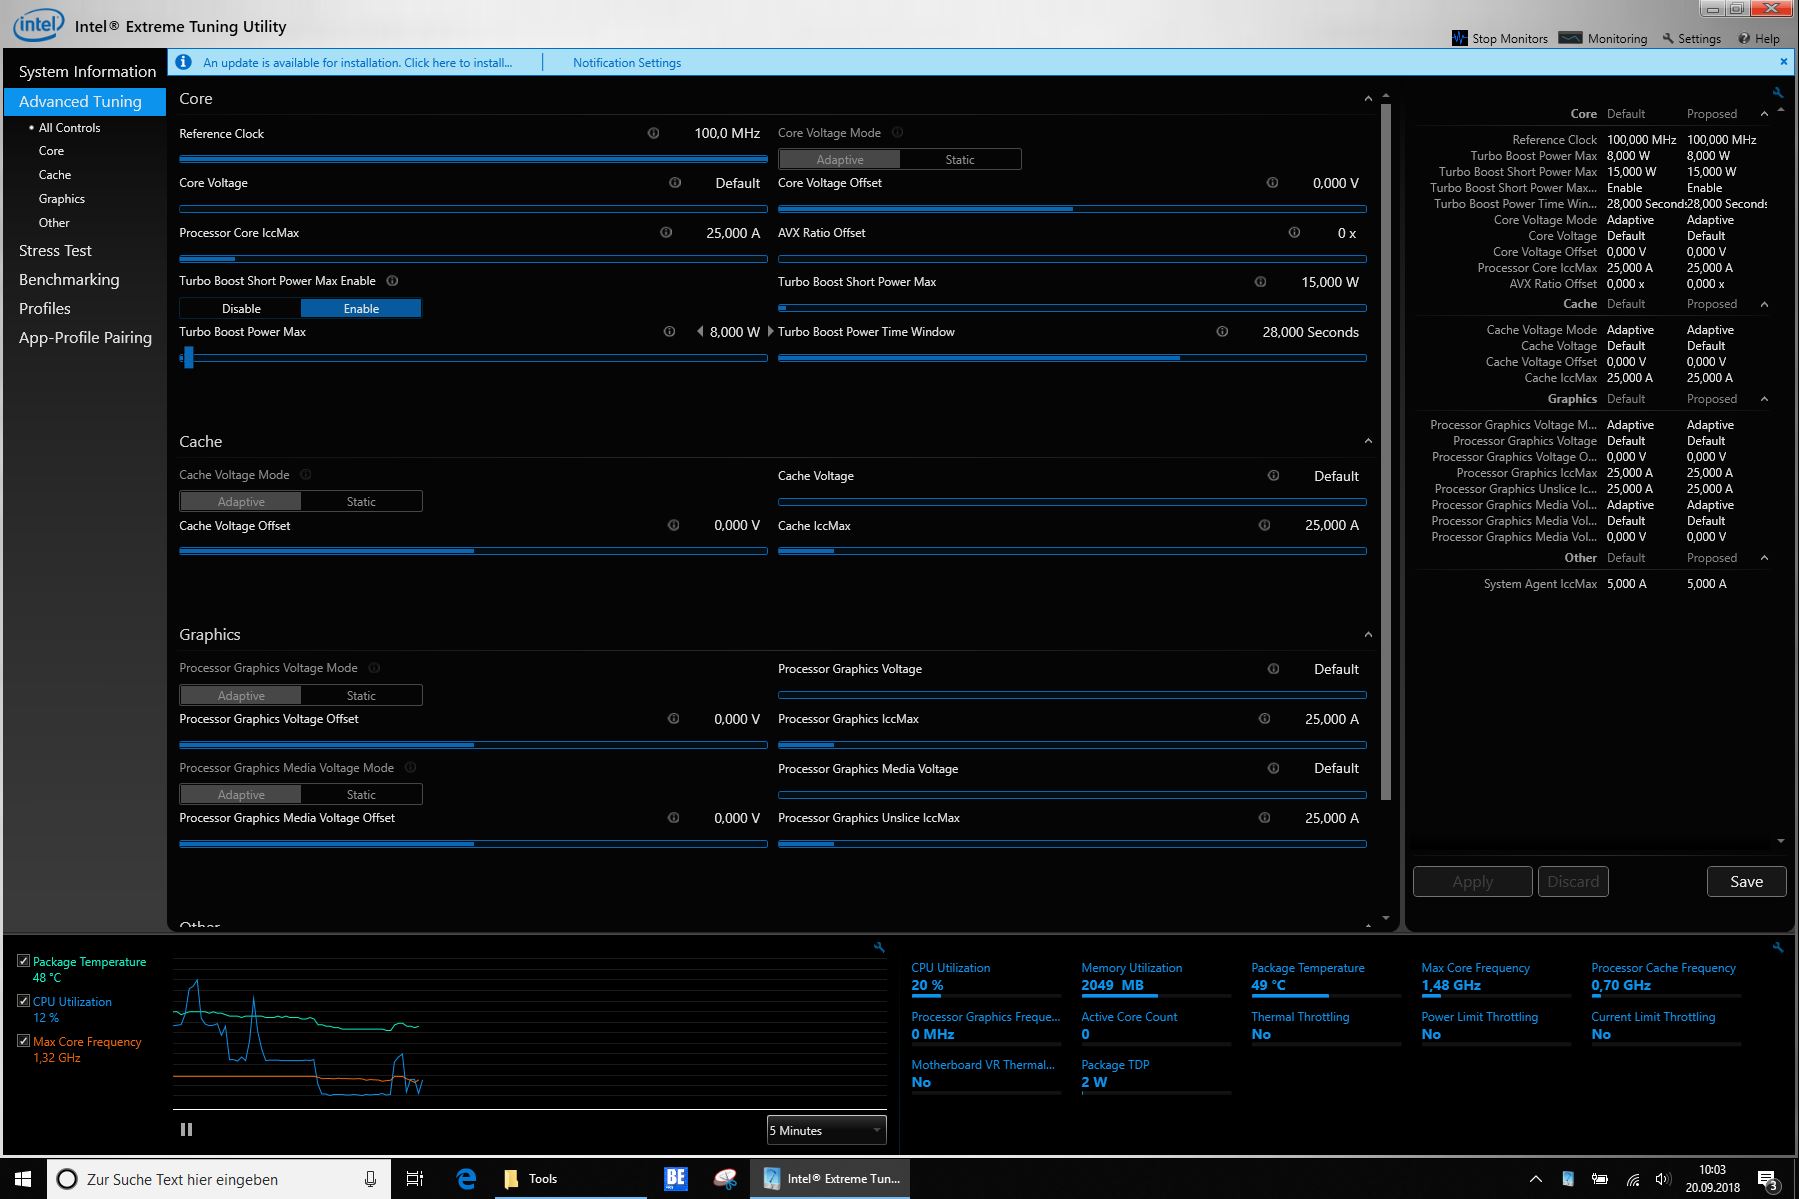
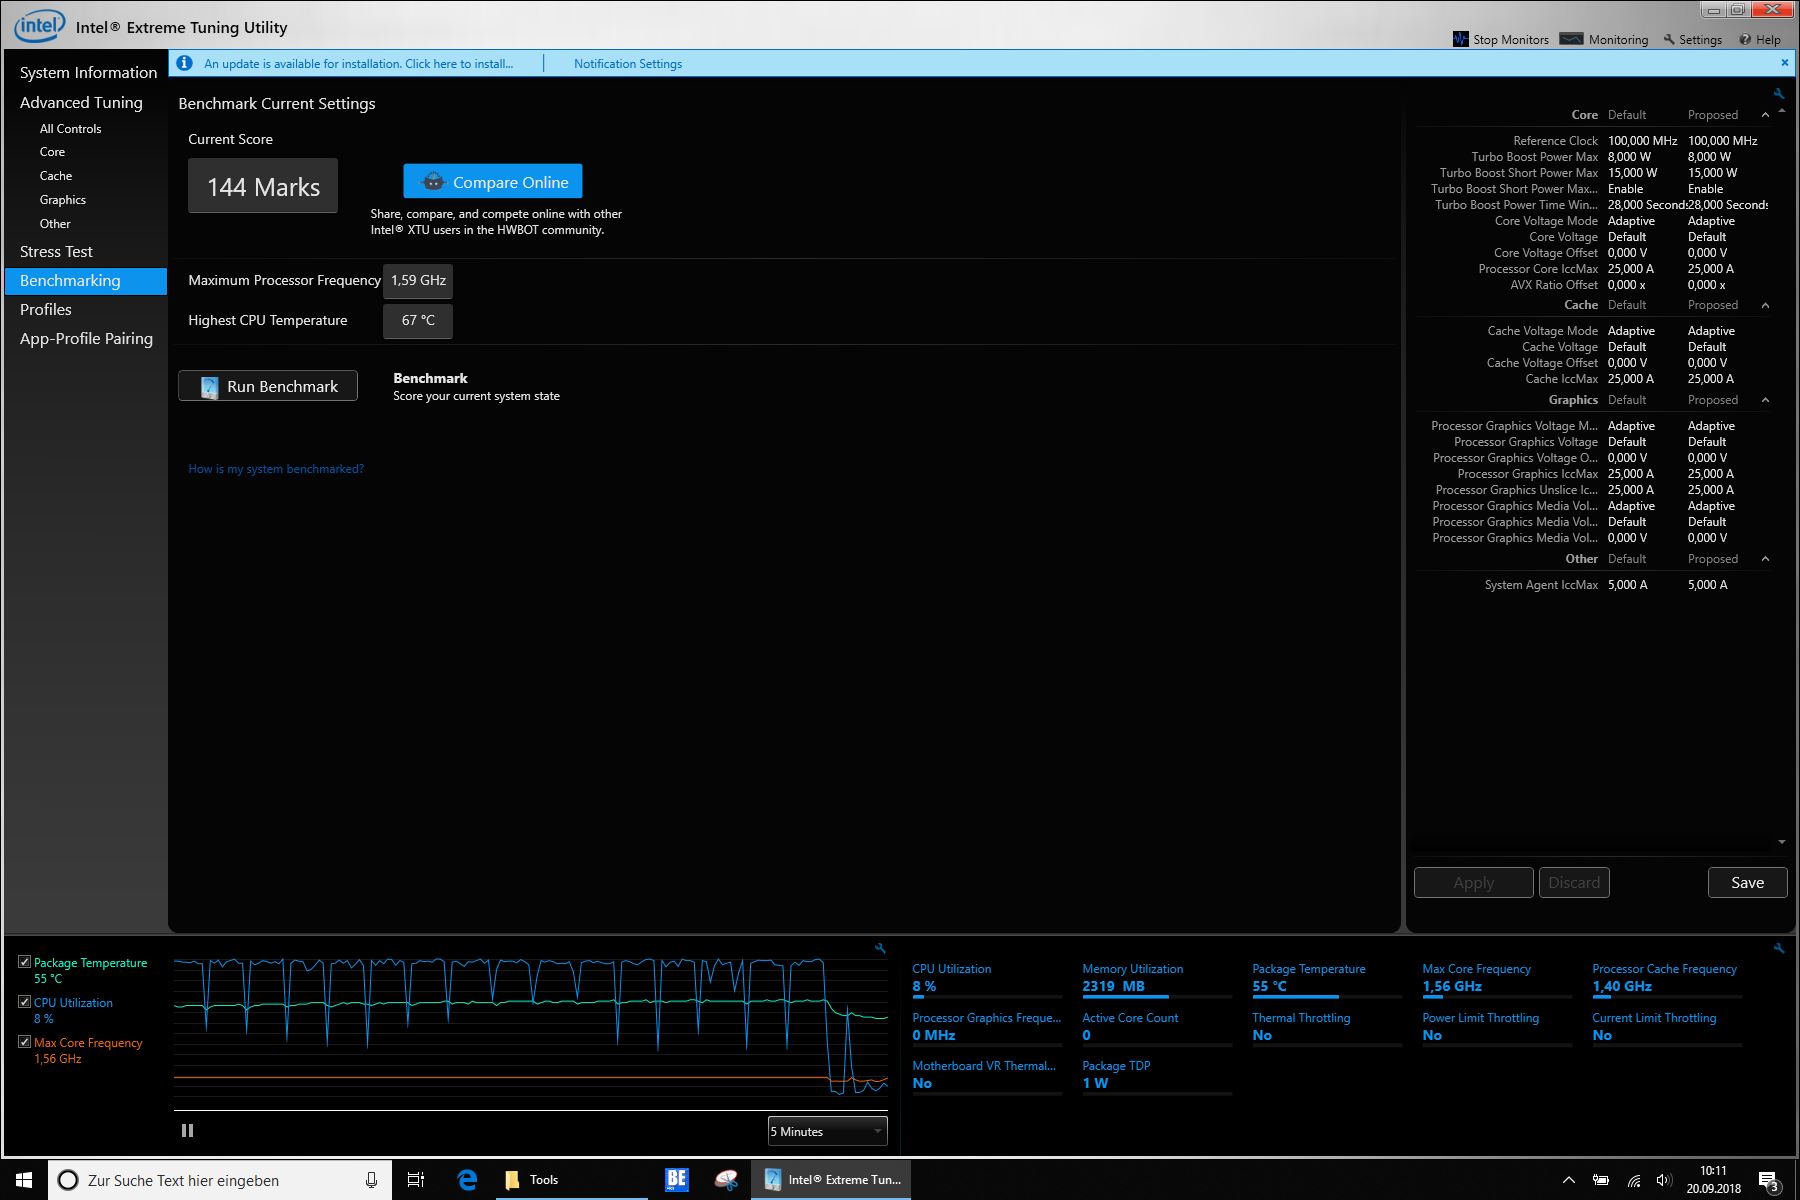
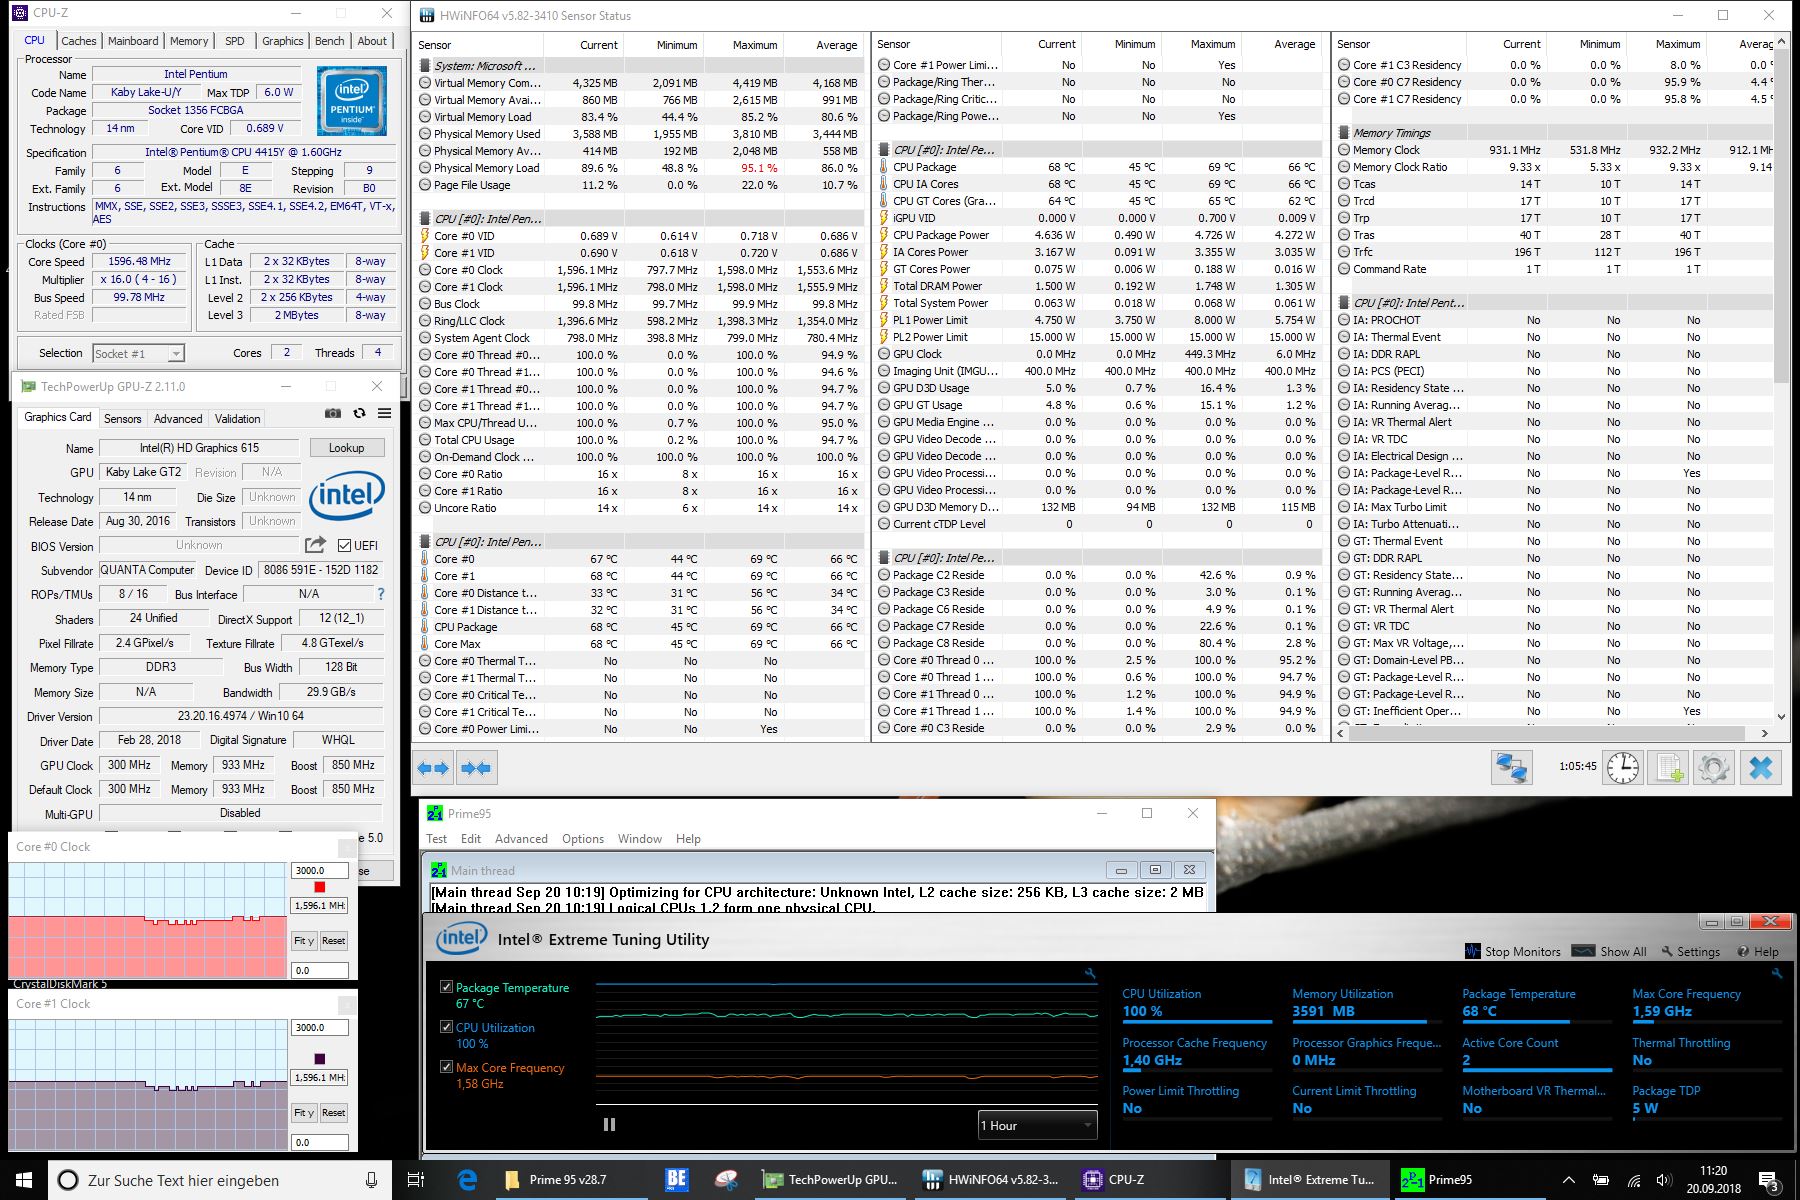
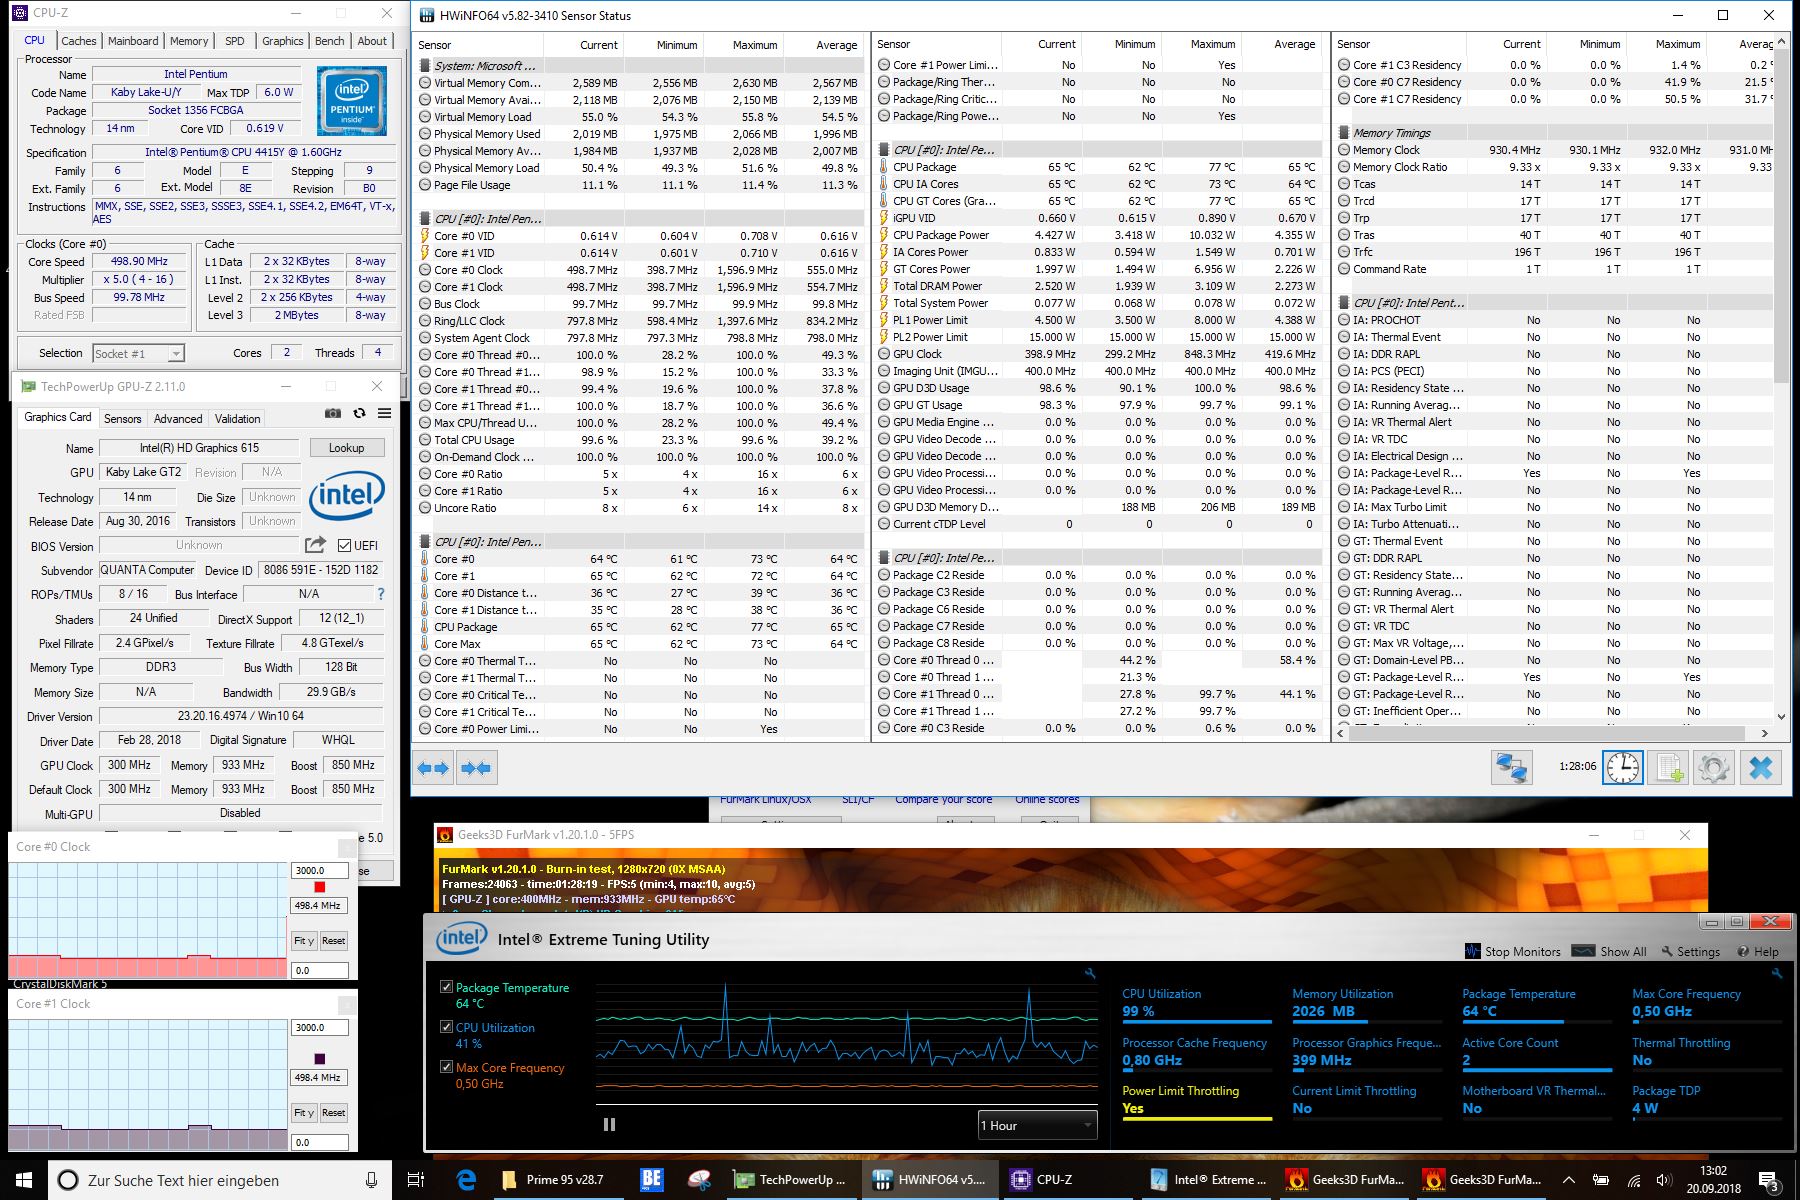
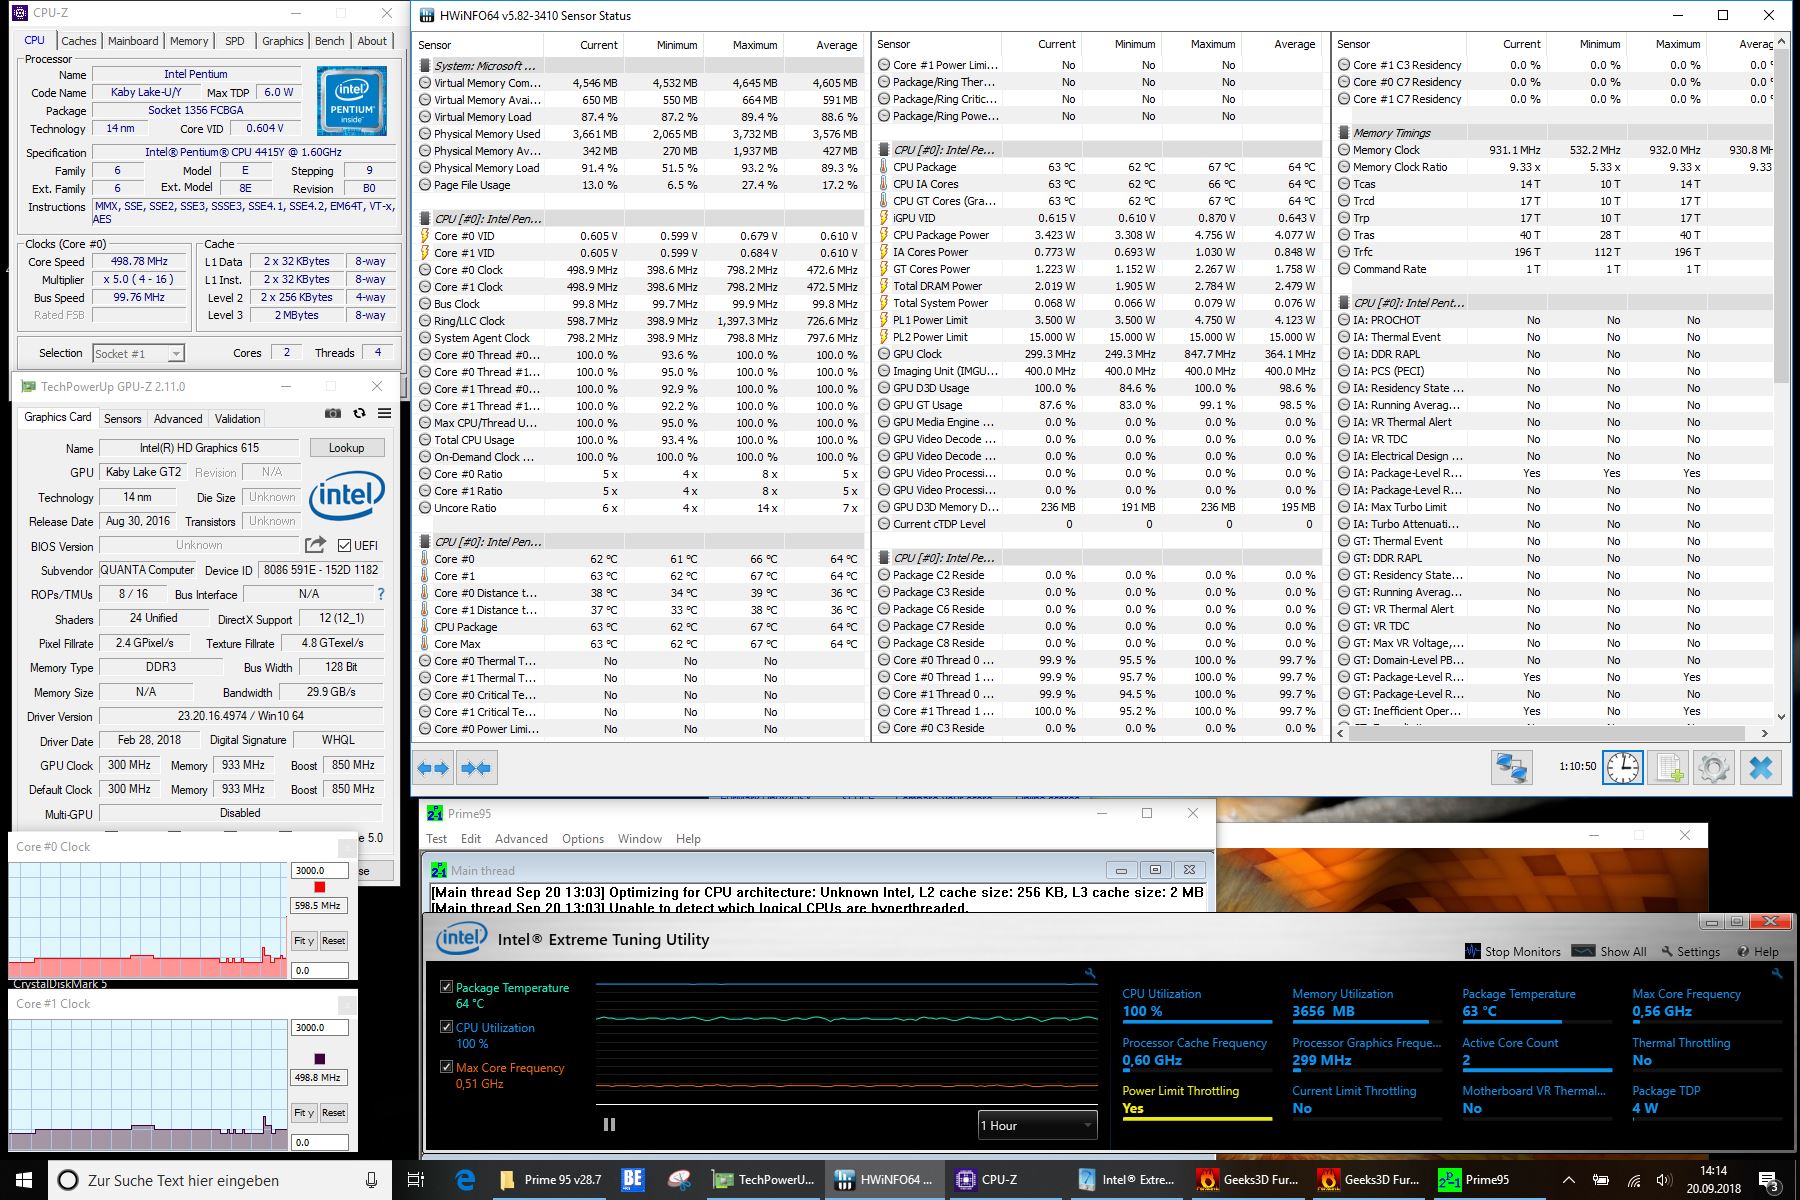
Med tanke på den passiva kyllösningen Go använder upplevde vi enhetens prestanda i vårt stress-test som särskilt lockande. Inte ens vid extrem belastning kunde vi upptäcka några spår av värmestrypning. Trots ett ganska litet batteri var batteritiden dessutom förvånansvärt bra.
Vårt största klagomål rör de dyra och nästan nödvändiga tillbehören, såsom Surface Go Signature Type Cover, som kommer vara väldigt svår att motstå och som i de flesta fall troligen kommer att köpas tillsammans med surfplattan.
Microsoft Surface Go MHN-00003
- 09/26/2019 v7 (old)
Sebastian Bade
Price comparison
