Test: Microsoft Surface Pro 7 - En i7-uppgradering med extra GPU-prestanda (Sammanfattning)
Gradering | Datum | Modell | Vikt | Höjd | Storlek | Upplösning | Pris |
|---|---|---|---|---|---|---|---|
| 88.1 % v7 (old) | 02/2020 | Microsoft Surface Pro 7 i7-1065G7, Iris Plus Graphics G7 (Ice Lake 64 EU) | 790 g | 8.5 mm | 12.30" | 2736x1824 | |
| 88.4 % v7 (old) | 11/2019 | Microsoft Surface Pro 7 Core i5-1035G4 i5-1035G4, Iris Plus Graphics G4 (Ice Lake 48 EU) | 1.1 kg | 8.5 mm | 12.30" | 2736x1824 | |
| 89.6 % v6 (old) | 07/2017 | Microsoft Surface Pro (2017) i7 i7-7660U, Iris Plus Graphics 640 | 1.1 kg | 8.5 mm | 12.30" | 2736x1824 | |
| 86.3 % v7 (old) | 10/2019 | Dell XPS 13 7390 2-in-1 Core i7 i7-1065G7, Iris Plus Graphics G7 (Ice Lake 64 EU) | 1.3 kg | 13 mm | 13.40" | 1920x1200 | |
| 88.4 % v7 (old) | 01/2020 | HP Spectre x360 13-aw0013dx i7-1065G7, Iris Plus Graphics G7 (Ice Lake 64 EU) | 1.2 kg | 16.9 mm | 13.30" | 1920x1080 |
| SD Card Reader | |
| average JPG Copy Test (av. of 3 runs) | |
| Microsoft Surface Book 2 15 (Toshiba Exceria Pro SDXC 64 GB UHS-II) | |
| Dell XPS 13 7390 2-in-1 Core i7 (Toshiba Exceria Pro M501 64 GB UHS-II) | |
| Microsoft Surface Pro 6, Core i7, 512 GB (Toshiba Exceria Pro M501 microSDXC 64GB) | |
| Microsoft Surface Pro 7 (Toshiba Exceria Pro M501 microSDXC 64GB) | |
| Chuwi UBook Pro (Toshiba Exceria Pro M501 64 GB UHS-II) | |
| Microsoft Surface Go MHN-00003 (Toshiba Exceria Pro M501) | |
| Genomsnitt av klass Convertible (28.1 - 197, n=23, senaste 2 åren) | |
| Microsoft Surface Pro (2017) i7 (Toshiba Exceria Pro M401 64 GB) | |
| maximum AS SSD Seq Read Test (1GB) | |
| Microsoft Surface Book 2 15 (Toshiba Exceria Pro SDXC 64 GB UHS-II) | |
| Dell XPS 13 7390 2-in-1 Core i7 (Toshiba Exceria Pro M501 64 GB UHS-II) | |
| Genomsnitt av klass Convertible (28.9 - 254, n=22, senaste 2 åren) | |
| Microsoft Surface Pro 7 (Toshiba Exceria Pro M501 microSDXC 64GB) | |
| Microsoft Surface Pro (2017) i7 (Toshiba Exceria Pro M401 64 GB) | |
| Microsoft Surface Pro 6, Core i7, 512 GB (Toshiba Exceria Pro M501 microSDXC 64GB) | |
| Microsoft Surface Go MHN-00003 (Toshiba Exceria Pro M501) | |
| Chuwi UBook Pro (Toshiba Exceria Pro M501 64 GB UHS-II) | |
| |||||||||||||||||||||||||
Distribution av ljusstyrkan: 90 %
Mitt på batteriet: 435 cd/m²
Kontrast: 1359:1 (Svärta: 0.32 cd/m²)
ΔE ColorChecker Calman: 1.18 | ∀{0.5-29.43 Ø4.73}
calibrated: 3.49
ΔE Greyscale Calman: 1.12 | ∀{0.09-98 Ø4.97}
96% sRGB (Argyll 1.6.3 3D)
60% AdobeRGB 1998 (Argyll 1.6.3 3D)
65.7% AdobeRGB 1998 (Argyll 3D)
95.8% sRGB (Argyll 3D)
63.7% Display P3 (Argyll 3D)
Gamma: 2.3
CCT: 6502 K
| Microsoft Surface Pro 7 LG Philips LP123WQ112604, IPS, 2736x1824, 12.3" | Microsoft Surface Pro 7 Core i5-1035G4 LG Philips LP123WQ112604, IPS, 2736x1824, 12.3" | Dell XPS 13 7390 2-in-1 Core i7 Sharp LQ134N1, IPS, 1920x1200, 13.4" | Chuwi UBook Pro BOE TV123WAM-ND0, IPS, 1920x1280, 12.3" | Microsoft Surface Pro 6, Core i7, 512 GB LGPhilips LP123WQ112604, IPS, 2736x1824, 12.3" | |
|---|---|---|---|---|---|
| Display | 1% | 8% | -1% | 3% | |
| Display P3 Coverage (%) | 63.7 | 66 4% | 69.9 10% | 63.3 -1% | 67.1 5% |
| sRGB Coverage (%) | 95.8 | 93.8 -2% | 99.2 4% | 94 -2% | 95.5 0% |
| AdobeRGB 1998 Coverage (%) | 65.7 | 66.9 2% | 71.5 9% | 65.1 -1% | 67.9 3% |
| Response Times | 10% | -12% | 14% | 2% | |
| Response Time Grey 50% / Grey 80% * (ms) | 40 ? | 34.8 ? 13% | 47.6 ? -19% | 30.8 ? 23% | 43 ? -8% |
| Response Time Black / White * (ms) | 28 ? | 26.4 ? 6% | 29.2 ? -4% | 26.8 ? 4% | 25 ? 11% |
| PWM Frequency (Hz) | 250 ? | 21550 ? | 2500 ? | 22000 ? | |
| Screen | -92% | -16% | -90% | -58% | |
| Brightness middle (cd/m²) | 435 | 480.4 10% | 549.8 26% | 867.6 99% | 484 11% |
| Brightness (cd/m²) | 422 | 485 15% | 520 23% | 818 94% | 473 12% |
| Brightness Distribution (%) | 90 | 91 1% | 86 -4% | 83 -8% | 91 1% |
| Black Level * (cd/m²) | 0.32 | 0.48 -50% | 0.39 -22% | 0.78 -144% | 0.33 -3% |
| Contrast (:1) | 1359 | 1001 -26% | 1410 4% | 1112 -18% | 1467 8% |
| Colorchecker dE 2000 * | 1.18 | 5 -324% | 2.12 -80% | 4.64 -293% | 4.29 -264% |
| Colorchecker dE 2000 max. * | 2.27 | 7.72 -240% | 3.66 -61% | 9.22 -306% | 6.46 -185% |
| Colorchecker dE 2000 calibrated * | 3.49 | 2.44 30% | 1.37 61% | 2.31 34% | 1.34 62% |
| Greyscale dE 2000 * | 1.12 | 5.9 -427% | 2.6 -132% | 6.1 -445% | 4.3 -284% |
| Gamma | 2.3 96% | 2.38 92% | 2.3 96% | 2.22 99% | 2.51 88% |
| CCT | 6502 100% | 7805 83% | 6884 94% | 7346 88% | 7315 89% |
| Color Space (Percent of AdobeRGB 1998) (%) | 60 | 60.3 0% | 65.4 9% | 59 -2% | 62 3% |
| Color Space (Percent of sRGB) (%) | 96 | 93.2 -3% | 99.7 4% | 93.7 -2% | 95 -1% |
| Totalt genomsnitt (program/inställningar) | -27% /
-62% | -7% /
-11% | -26% /
-61% | -18% /
-39% |
* ... mindre är bättre
Visa svarstider
| ↔ Svarstid svart till vitt | ||
|---|---|---|
| 28 ms ... stiga ↗ och falla ↘ kombinerat | ↗ 16 ms stiga | 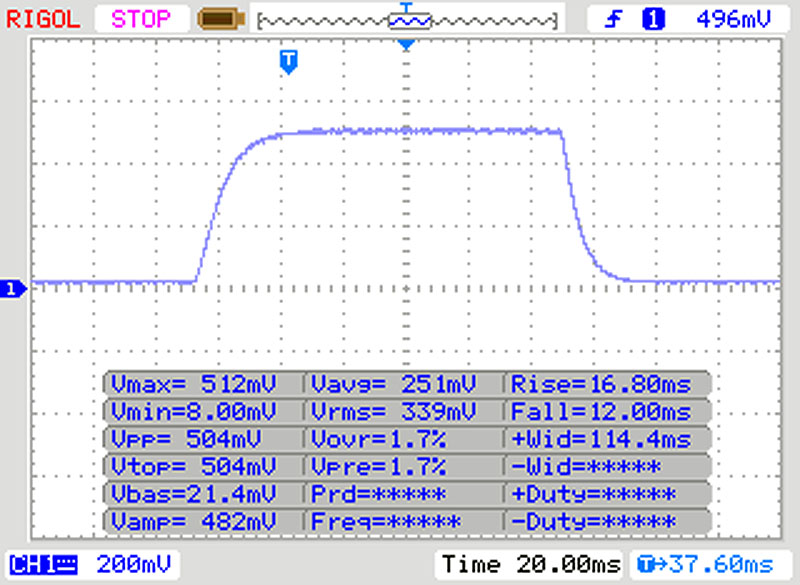 |
| ↘ 12 ms hösten | ||
| Skärmen visar relativt långsamma svarsfrekvenser i våra tester och kan vara för långsam för spelare. I jämförelse sträcker sig alla testade enheter från 0.1 (minst) till 240 (maximalt) ms. » 71 % av alla enheter är bättre. Detta innebär att den uppmätta svarstiden är sämre än genomsnittet av alla testade enheter (19.9 ms). | ||
| ↔ Svarstid 50 % grått till 80 % grått | ||
| 40 ms ... stiga ↗ och falla ↘ kombinerat | ↗ 19 ms stiga | 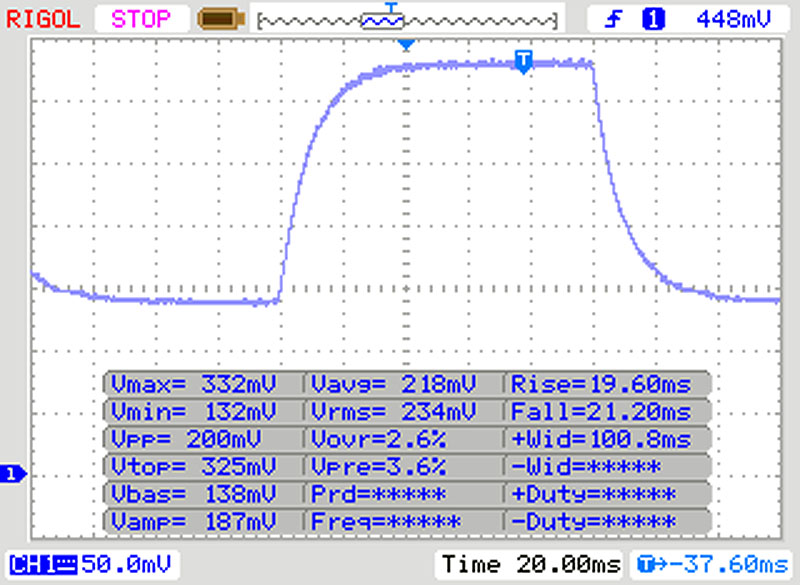 |
| ↘ 21 ms hösten | ||
| Skärmen visar långsamma svarsfrekvenser i våra tester och kommer att vara otillfredsställande för spelare. I jämförelse sträcker sig alla testade enheter från 0.165 (minst) till 636 (maximalt) ms. » 61 % av alla enheter är bättre. Detta innebär att den uppmätta svarstiden är sämre än genomsnittet av alla testade enheter (31.1 ms). | ||
Skärmflimmer / PWM (Puls-Width Modulation)
| Skärmflimmer / PWM upptäckt | 250 Hz | ≤ 50 % ljusstyrka inställning | 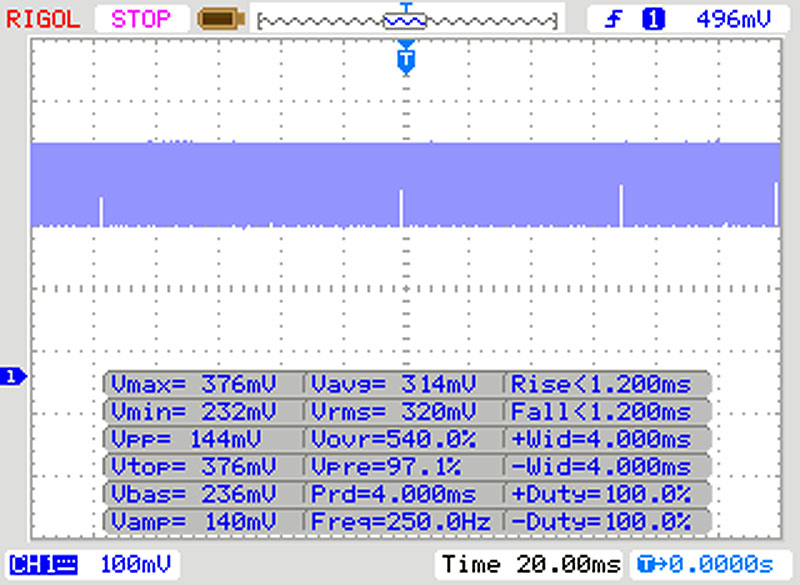 |
Displayens bakgrundsbelysning flimrar vid 250 Hz (i värsta fall, t.ex. med PWM) Flimrande upptäckt vid en ljusstyrkeinställning på 50 % och lägre. Det ska inte finnas något flimmer eller PWM över denna ljusstyrkeinställning. Frekvensen för 250 Hz är relativt låg, så känsliga användare kommer sannolikt att märka flimmer och uppleva ansträngda ögon vid den angivna ljusstyrkeinställningen och nedan. Som jämförelse: 52 % av alla testade enheter använder inte PWM för att dämpa skärmen. Om PWM upptäcktes mättes ett medelvärde av 7798 (minst: 5 - maximum: 343500) Hz. | |||
| PCMark 8 Home Score Accelerated v2 | 3660 poäng | |
| PCMark 8 Work Score Accelerated v2 | 3440 poäng | |
| PCMark 10 Score | 4367 poäng | |
Hjälp | ||
| Microsoft Surface Pro 7 Toshiba KBG40ZNS256G NVMe | Microsoft Surface Pro 7 Core i5-1035G4 Toshiba BG4 KBG40ZPZ256G | Microsoft Surface Pro (2017) i7 Samsung PM971 KUS040202M | Microsoft Surface Pro 6, Core i7, 512 GB Toshiba KBG30ZPZ512G | Genomsnitt Toshiba KBG40ZNS256G NVMe | |
|---|---|---|---|---|---|
| CrystalDiskMark 5.2 / 6 | -5% | -16% | -39% | -13% | |
| Write 4K (MB/s) | 131.3 | 118.5 -10% | 131.6 0% | 83.2 -37% | 112.1 ? -15% |
| Read 4K (MB/s) | 52.4 | 54.1 3% | 43.34 -17% | 43.84 -16% | 50.6 ? -3% |
| Write Seq (MB/s) | 1613 | 1166 -28% | 905 -44% | 636 -61% | 961 ? -40% |
| Read Seq (MB/s) | 1613 | 1676 4% | 985 -39% | 900 -44% | 1562 ? -3% |
| Write 4K Q32T1 (MB/s) | 411.6 | 330.5 -20% | 421.6 2% | 192.9 -53% | 299 ? -27% |
| Read 4K Q32T1 (MB/s) | 415.6 | 393.1 -5% | 498.9 20% | 247.4 -40% | 359 ? -14% |
| Write Seq Q32T1 (MB/s) | 2340 | 1569 -33% | 970 -59% | 861 -63% | 1366 ? -42% |
| Read Seq Q32T1 (MB/s) | 1568 | 2390 52% | 1670 7% | 1615 3% | 2170 ? 38% |
| Write 4K Q8T8 (MB/s) | 410.9 | 380 ? -8% | |||
| Read 4K Q8T8 (MB/s) | 1033 | 852 ? -18% | |||
| AS SSD | -31% | -275% | -60% | -23% | |
| Seq Read (MB/s) | 1881 | 1590 -15% | 1070 -43% | 1154 -39% | 1752 ? -7% |
| Seq Write (MB/s) | 703 | 714 2% | 171 -76% | 393.6 -44% | 720 ? 2% |
| 4K Read (MB/s) | 52.3 | 50.7 -3% | 41 -22% | 34.42 -34% | 47.3 ? -10% |
| 4K Write (MB/s) | 154.1 | 109.4 -29% | 0.2 -100% | 68.9 -55% | 118.6 ? -23% |
| 4K-64 Read (MB/s) | 1048 | 924 -12% | 1015 -3% | 494.1 -53% | 866 ? -17% |
| 4K-64 Write (MB/s) | 703 | 294.6 -58% | 34 -95% | 171.3 -76% | 402 ? -43% |
| Access Time Read * (ms) | 0.069 | 0.066 4% | 0.04 42% | 0.213 -209% | 0.1034 ? -50% |
| Access Time Write * (ms) | 0.221 | 0.697 -215% | 7.6 -3339% | 0.3 -36% | 0.3076 ? -39% |
| Score Read (Points) | 1288 | 1133 -12% | 1164 -10% | 644 -50% | 1088 ? -16% |
| Score Write (Points) | 927 | 475 -49% | 52 -94% | 280 -70% | 592 ? -36% |
| Score Total (Points) | 2826 | 2157 -24% | 1774 -37% | 1225 -57% | 2197 ? -22% |
| Copy ISO MB/s (MB/s) | 1160 | 1177 1% | 1036 -11% | 985 -15% | 926 ? -20% |
| Copy Program MB/s (MB/s) | 454.7 | 406 -11% | 386 -15% | 143.1 -69% | 372 ? -18% |
| Copy Game MB/s (MB/s) | 991 | 923 -7% | 582 -41% | 676 -32% | 714 ? -28% |
| Totalt genomsnitt (program/inställningar) | -18% /
-21% | -146% /
-181% | -50% /
-52% | -18% /
-19% |
* ... mindre är bättre

| 3DMark 11 Performance | 4504 poäng | |
| 3DMark Cloud Gate Standard Score | 14315 poäng | |
| 3DMark Fire Strike Score | 2833 poäng | |
| 3DMark Time Spy Score | 793 poäng | |
Hjälp | ||
| Rocket League | |
| 1920x1080 Quality AA:Medium FX | |
| Microsoft Surface Pro 7 | |
| Dell XPS 13 7390 2-in-1 Core i7 | |
| HP Spectre x360 13-aw0013dx | |
| Microsoft Surface Pro (2017) i7 | |
| Microsoft Surface Pro 7 Core i5-1035G4 | |
| 1920x1080 High Quality AA:High FX | |
| Microsoft Surface Pro 7 | |
| Dell XPS 13 7390 2-in-1 Core i7 | |
| HP Spectre x360 13-aw0013dx | |
| Microsoft Surface Pro (2017) i7 | |
| Microsoft Surface Pro 7 Core i5-1035G4 | |
| Shadow of the Tomb Raider - 1280x720 Lowest Preset | |
| Microsoft Surface Pro 7 | |
| Dell XPS 13 7390 2-in-1 Core i7 | |
| HP Spectre x360 13-aw0013dx | |
| Microsoft Surface Pro 7 Core i5-1035G4 | |
| Microsoft Surface Pro 6, Core i7, 512 GB | |
| låg | med. | hög | ultra | |
|---|---|---|---|---|
| BioShock Infinite (2013) | 112.5 | 72.8 | 60.2 | 21.96 |
| Rise of the Tomb Raider (2016) | 49.16 | 30 | 15.97 | 12.56 |
| Rocket League (2017) | 95.7 | 67.5 | 44.7 | |
| Shadow of the Tomb Raider (2018) | 33 | 14 | 13 |
Ljudnivå
| Låg belastning |
| 30.3 / 30.3 / 30.3 dB(A) |
| Hög belastning |
| 31.4 / 33.7 dB(A) |
 | ||
30 dB tyst 40 dB(A) hörbar 50 dB(A) högt ljud |
||
min: | ||
(±) Den maximala temperaturen på ovansidan är 40.1 °C / 104 F, jämfört med genomsnittet av 35.4 °C / 96 F , allt från 19.6 till 60 °C för klassen Convertible.
(±) Botten värms upp till maximalt 41 °C / 106 F, jämfört med genomsnittet av 36.9 °C / 98 F
(+) Vid tomgångsbruk är medeltemperaturen för ovansidan 28.7 °C / 84 F, jämfört med enhetsgenomsnittet på 30.3 °C / ### class_avg_f### F.
(±) Handledsstöden och pekplattan kan bli väldigt varma vid beröring med maximalt 39.4 °C / 102.9 F.
(-) Medeltemperaturen för handledsstödsområdet på liknande enheter var 28 °C / 82.4 F (-11.4 °C / -20.5 F).
Microsoft Surface Pro 7 ljudanalys
(-) | inte särskilt höga högtalare (65.2 dB)
Bas 100 - 315 Hz
(±) | reducerad bas - i genomsnitt 10.2% lägre än medianen
(±) | linjäriteten för basen är genomsnittlig (12.1% delta till föregående frekvens)
Mellan 400 - 2000 Hz
(+) | balanserad mellan - endast 4.6% från medianen
(±) | linjäriteten för mids är genomsnittlig (10.2% delta till föregående frekvens)
Högsta 2 - 16 kHz
(+) | balanserade toppar - endast 3.1% från medianen
(+) | toppar är linjära (6.8% delta till föregående frekvens)
Totalt 100 - 16 000 Hz
(±) | linjäriteten för det totala ljudet är genomsnittlig (21.5% skillnad mot median)
Jämfört med samma klass
» 58% av alla testade enheter i den här klassen var bättre, 11% liknande, 32% sämre
» Den bästa hade ett delta på 6%, genomsnittet var 20%, sämst var 57%
Jämfört med alla testade enheter
» 61% av alla testade enheter var bättre, 7% liknande, 33% sämre
» Den bästa hade ett delta på 4%, genomsnittet var 24%, sämst var 134%
Apple MacBook 12 (Early 2016) 1.1 GHz ljudanalys
(+) | högtalare kan spela relativt högt (83.6 dB)
Bas 100 - 315 Hz
(±) | reducerad bas - i genomsnitt 11.3% lägre än medianen
(±) | linjäriteten för basen är genomsnittlig (14.2% delta till föregående frekvens)
Mellan 400 - 2000 Hz
(+) | balanserad mellan - endast 2.4% från medianen
(+) | mids är linjära (5.5% delta till föregående frekvens)
Högsta 2 - 16 kHz
(+) | balanserade toppar - endast 2% från medianen
(+) | toppar är linjära (4.5% delta till föregående frekvens)
Totalt 100 - 16 000 Hz
(+) | det totala ljudet är linjärt (10.2% skillnad mot median)
Jämfört med samma klass
» 7% av alla testade enheter i den här klassen var bättre, 2% liknande, 91% sämre
» Den bästa hade ett delta på 5%, genomsnittet var 18%, sämst var 53%
Jämfört med alla testade enheter
» 5% av alla testade enheter var bättre, 1% liknande, 94% sämre
» Den bästa hade ett delta på 4%, genomsnittet var 24%, sämst var 134%
| Av/Standby | |
| Låg belastning | |
| Hög belastning |
|
Förklaring:
min: | |
| Microsoft Surface Pro 7 i7-1065G7, Iris Plus Graphics G7 (Ice Lake 64 EU), Toshiba KBG40ZNS256G NVMe, IPS, 2736x1824, 12.3" | Microsoft Surface Pro 6, Core i7, 512 GB i7-8650U, UHD Graphics 620, Toshiba KBG30ZPZ512G, IPS, 2736x1824, 12.3" | Microsoft Surface Pro (2017) i7 i7-7660U, Iris Plus Graphics 640, Samsung PM971 KUS040202M, IPS, 2736x1824, 12.3" | Microsoft Surface Pro 7 Core i5-1035G4 i5-1035G4, Iris Plus Graphics G4 (Ice Lake 48 EU), Toshiba BG4 KBG40ZPZ256G, IPS, 2736x1824, 12.3" | Dell XPS 13 7390 2-in-1 Core i7 i7-1065G7, Iris Plus Graphics G7 (Ice Lake 64 EU), Toshiba BG4 KBG40ZPZ512G, IPS, 1920x1200, 13.4" | Genomsnitt Intel Iris Plus Graphics G7 (Ice Lake 64 EU) | Genomsnitt av klass Convertible | |
|---|---|---|---|---|---|---|---|
| Power Consumption | 17% | 0% | -1% | 26% | 12% | 4% | |
| Idle Minimum * (Watt) | 4.4 | 3.2 27% | 4.2 5% | 4.5 -2% | 2.6 41% | 3.91 ? 11% | 4.29 ? 2% |
| Idle Average * (Watt) | 8.7 | 8.7 -0% | 10.1 -16% | 9.2 -6% | 5.3 39% | 7.33 ? 16% | 7.08 ? 19% |
| Idle Maximum * (Watt) | 9.6 | 10.4 -8% | 14 -46% | 9.6 -0% | 7 27% | 9.16 ? 5% | 8.68 ? 10% |
| Load Average * (Watt) | 44 | 29.2 34% | 37.4 15% | 42 5% | 43.1 2% | 39.2 ? 11% | 44 ? -0% |
| Load Maximum * (Watt) | 61 | 40.8 33% | 34 44% | 63.5 -4% | 49 20% | 49.8 ? 18% | 67.3 ? -10% |
| Witcher 3 ultra * (Watt) | 38.1 | 43.1 |
* ... mindre är bättre
| Microsoft Surface Pro 7 i7-1065G7, Iris Plus Graphics G7 (Ice Lake 64 EU), 45 Wh | Microsoft Surface Pro 7 Core i5-1035G4 i5-1035G4, Iris Plus Graphics G4 (Ice Lake 48 EU), 45 Wh | Microsoft Surface Pro (2017) i7 i7-7660U, Iris Plus Graphics 640, 45 Wh | Dell XPS 13 7390 2-in-1 Core i7 i7-1065G7, Iris Plus Graphics G7 (Ice Lake 64 EU), 51 Wh | Genomsnitt av klass Convertible | |
|---|---|---|---|---|---|
| Batteridrifttid | 32% | 12% | -8% | 71% | |
| Reader / Idle (h) | 11.5 | 22.3 94% | 27.7 ? 141% | ||
| H.264 (h) | 6.7 | 10.2 52% | 15.3 ? 128% | ||
| WiFi v1.3 (h) | 9.8 | 10 2% | 8.2 -16% | 9 -8% | 11.9 ? 21% |
| Load (h) | 1.9 | 1.9 0% | 1.9 0% | 1.779 ? -6% | |
| Witcher 3 ultra (h) | 1.9 |
För
Emot
Läs den fullständiga versionen av den här recensionen på engelska här.
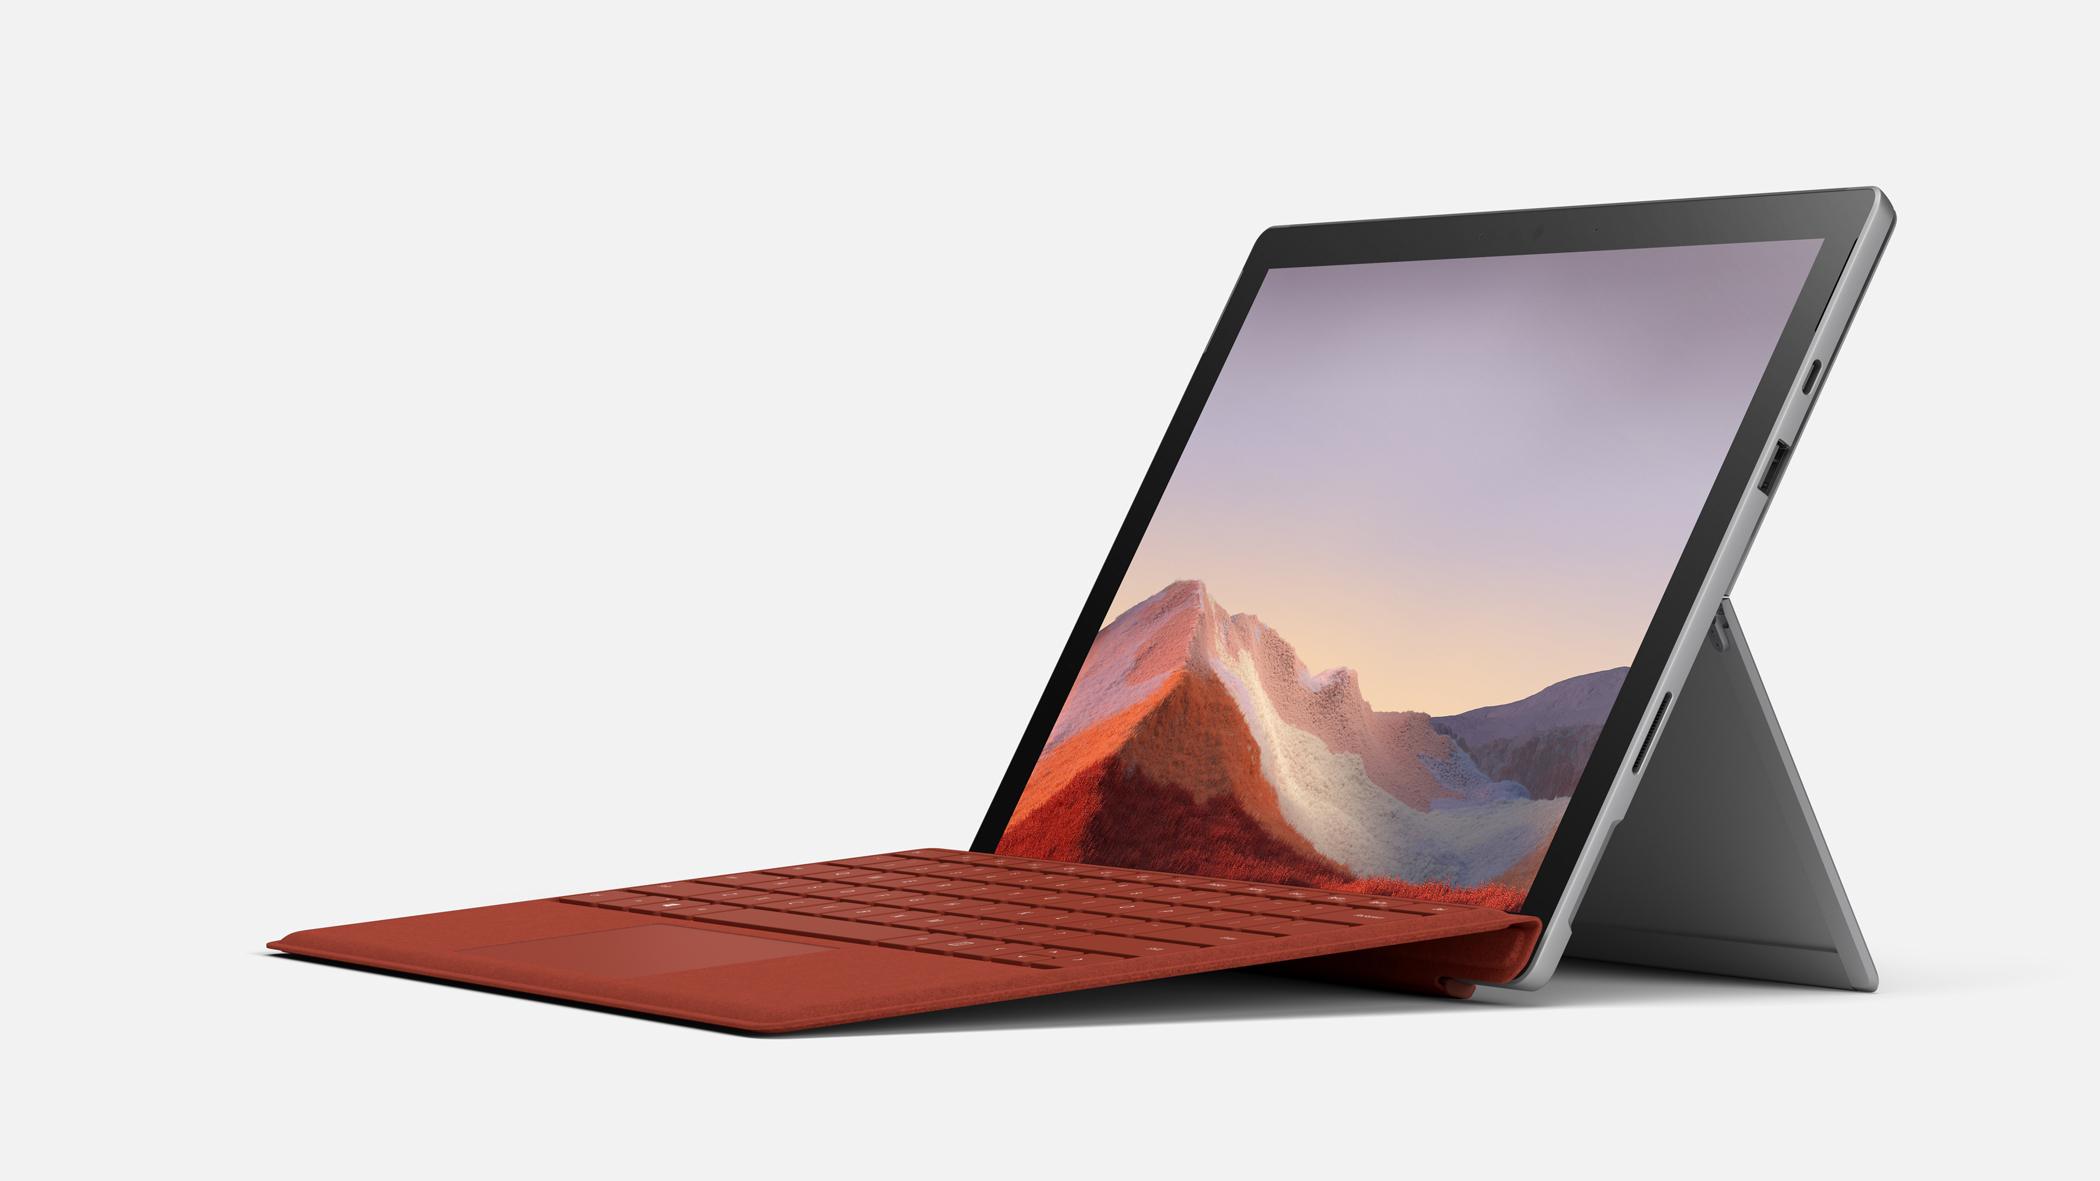
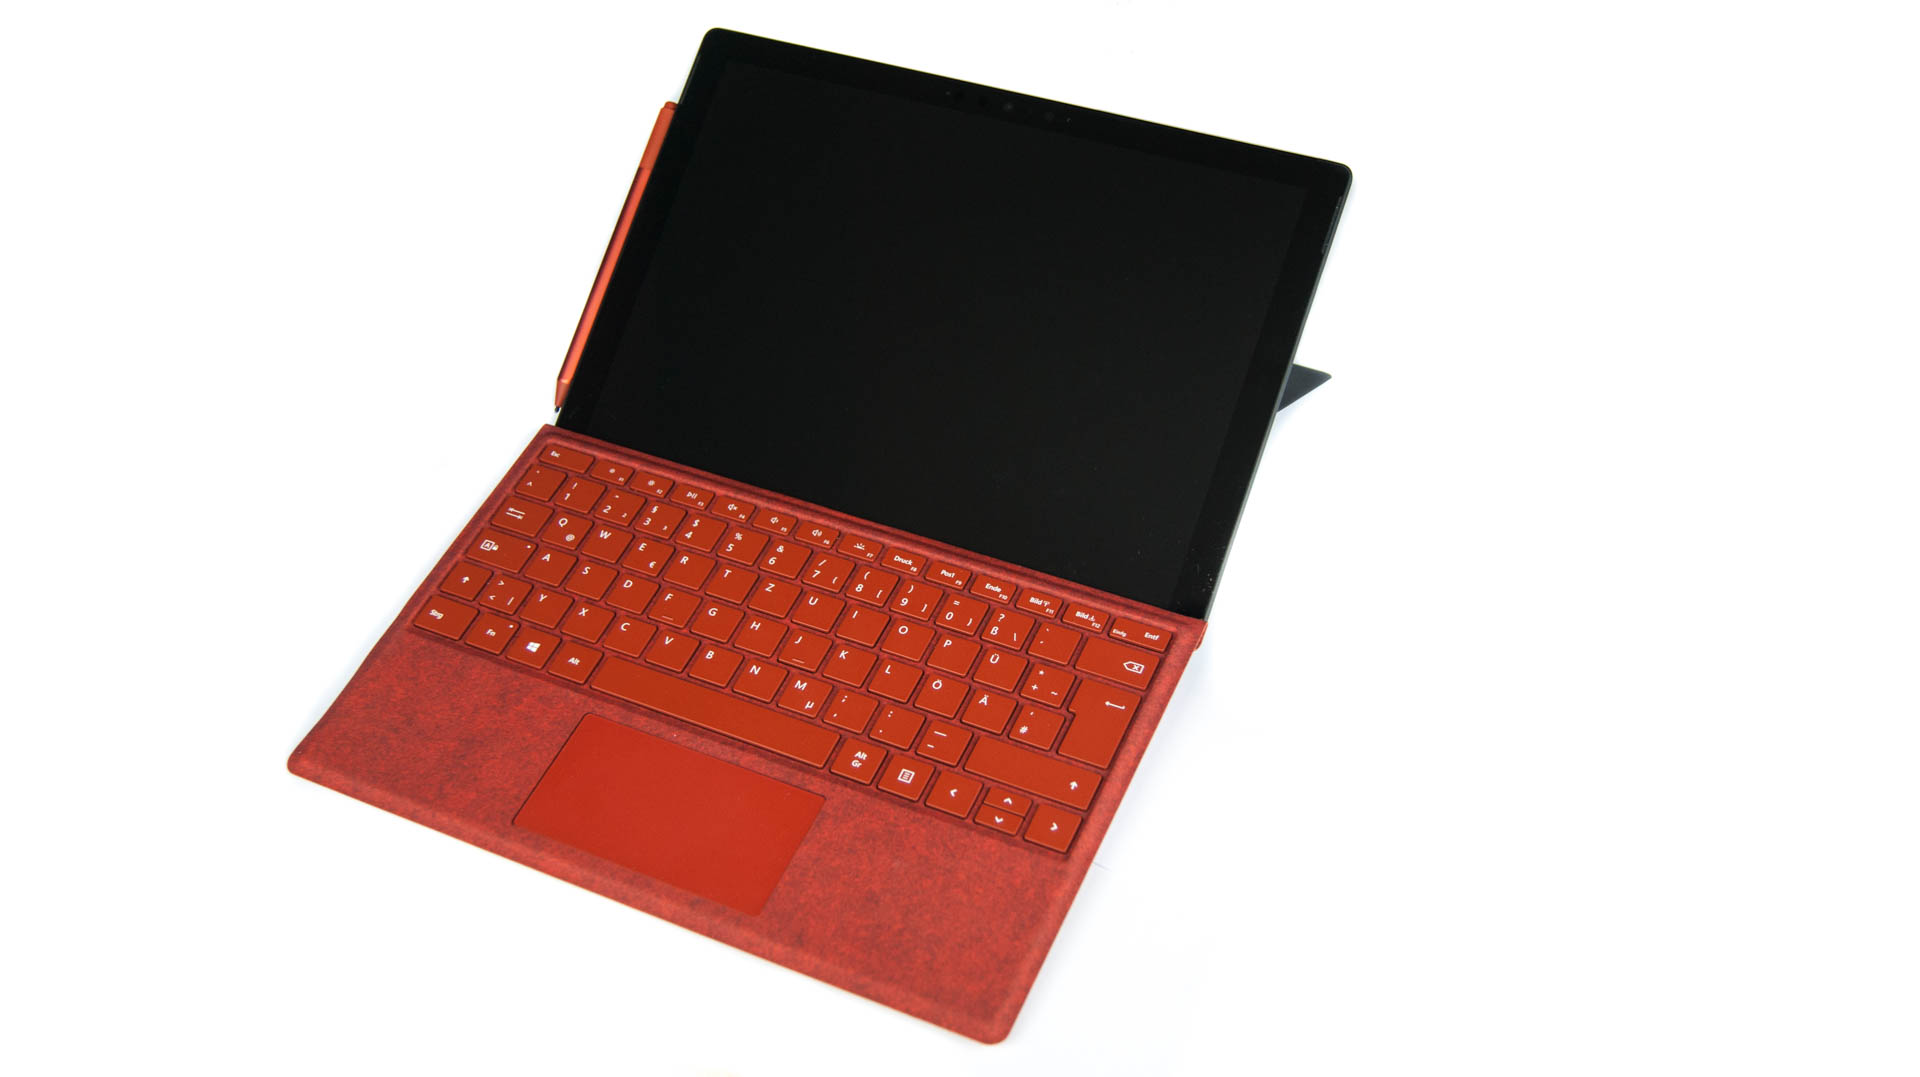
Efter vår första utförliga recension av i5-varianten av Microsoft Surface Pro 7 (Core i5, 8 GB) har vi nu också testat den allra kraftigaste modellen och vi noterade snabbt att den snabbare modellen inte skiljer sig särskilt mycket från sitt billigare syskon. Detta gäller särskilt när det kommer till ihållande CPU-belastning. GPU-prestandan var däremot en fullträff och har ökat markant. Dessutom behövde varken låga temperaturer eller batteritid offras för den extra kraften.
Frågan är: är det värt det?
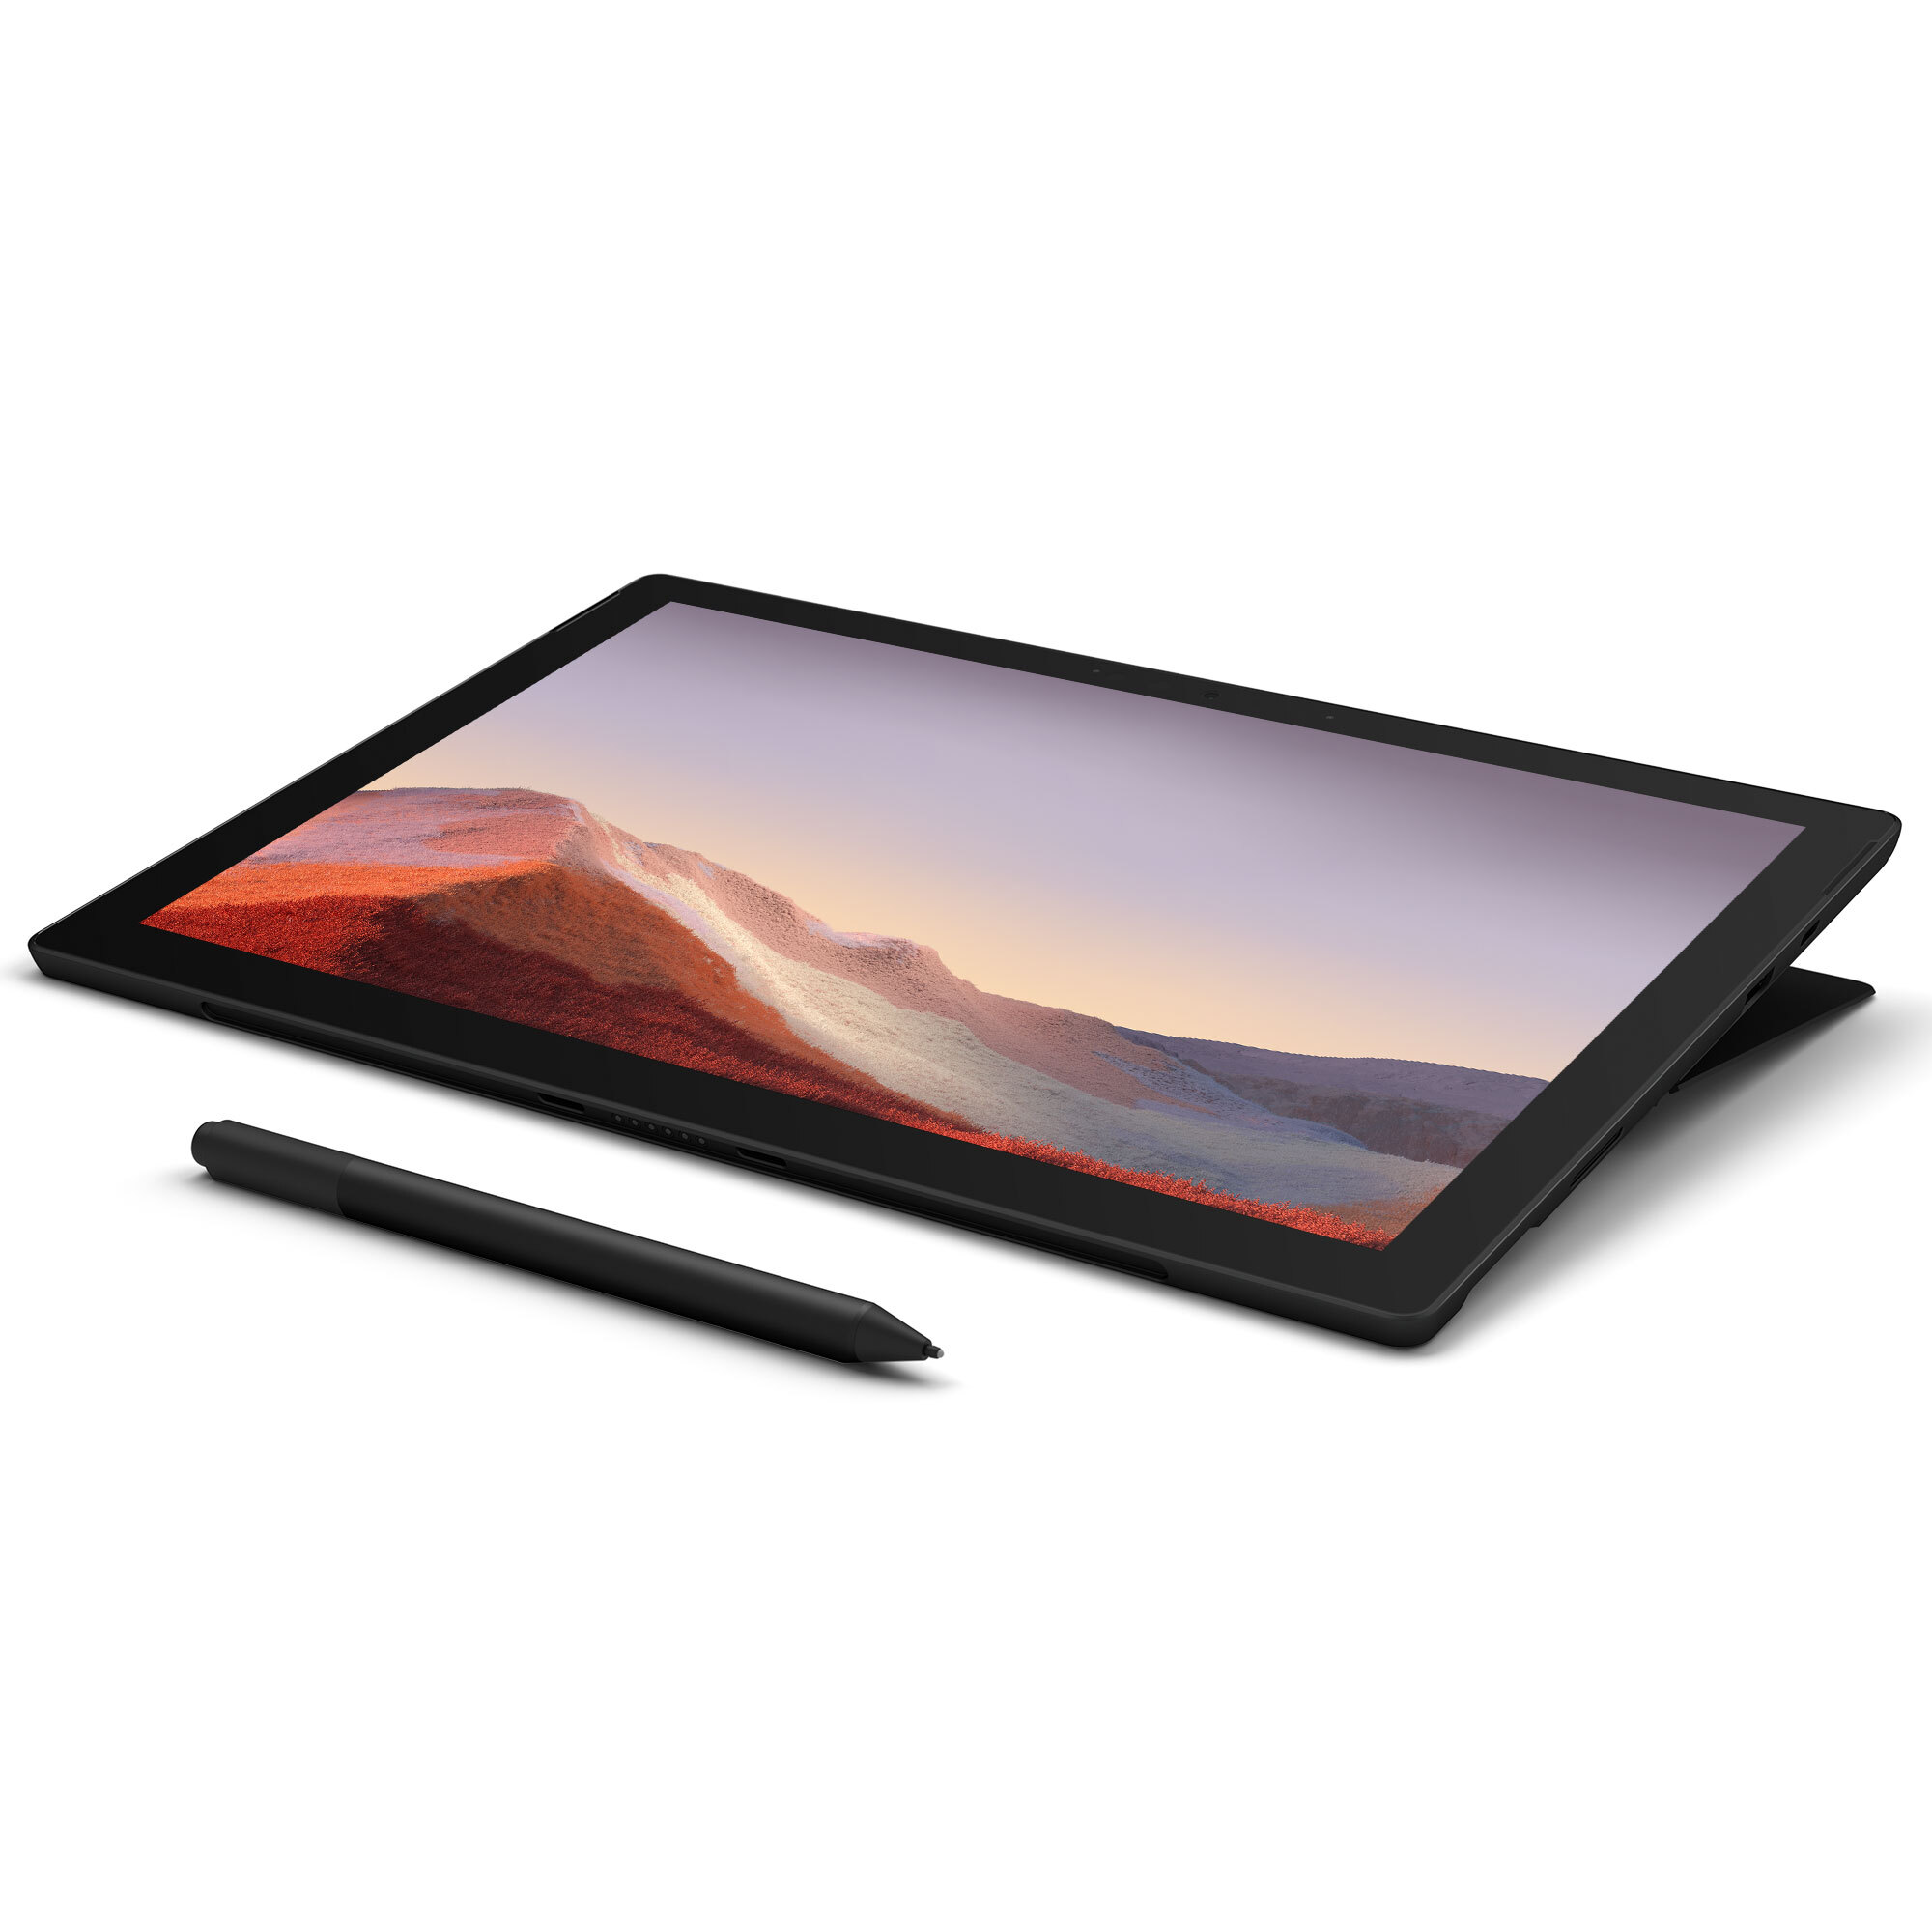
Den Intel Core i7-utrustade varianten av Surface Pro 7 är gjord för proffs som behöver lite extra presta, särskilt när det kommer till grafikstyrka.
Som vi lyckats visa i våra prestandatester är det inte CPU-prestandan som får i7-modellen att stå ut. Det är när det kommer till grafikprestandan den verkligen lyckas bra och det är där det ökade priset ger utdelning. För mer detaljer om Surface-serien, se vår tidigare recension.
Microsoft Surface Pro 7
- 02/20/2020 v7 (old)
Nino Ricchizzi
Price comparison
