Test: Lenovo Legion Y730-17ICH (i7-8750H, GTX 1050 Ti) Laptop (Sammanfattning)
| |||||||||||||||||||||||||
Distribution av ljusstyrkan: 91 %
Mitt på batteriet: 328.7 cd/m²
Kontrast: 645:1 (Svärta: 0.51 cd/m²)
ΔE ColorChecker Calman: 4.91 | ∀{0.5-29.43 Ø4.71}
calibrated: 4.27
ΔE Greyscale Calman: 3.9 | ∀{0.09-98 Ø4.96}
84.7% sRGB (Argyll 1.6.3 3D)
55.6% AdobeRGB 1998 (Argyll 1.6.3 3D)
62.1% AdobeRGB 1998 (Argyll 3D)
84.9% sRGB (Argyll 3D)
66.4% Display P3 (Argyll 3D)
Gamma: 2.13
CCT: 6911 K
| Lenovo Legion Y730-17ICH, i7-8750H LP173WF4-SPF6, IPS, 17.3", 1920x1080 | Alienware 17 R5 JYWWF_B173QTN (AUO1496), TN, 17.3", 2560x1440 | HP Omen 17t-3AW55AV_1 AU Optronics AUO309D, IPS, 17.3", 1920x1080 | Dell G3 17 3779 AUO, B173HAN01.3, IPS, 17.3", 1920x1080 | Asus Strix GL703GM-DS74 Chi Mei CMN1747 M173JJE-G32, TN LED, 17.3", 1920x1080 | MSI GE73 8RF-008 Raider RGB Chi Mei N173HHE-G32 (CMN1747), TN WLED, 17.3", 1920x1080 | |
|---|---|---|---|---|---|---|
| Display | -1% | 3% | 2% | 30% | 31% | |
| Display P3 Coverage (%) | 66.4 | 63.4 -5% | 65.4 -2% | 63.9 -4% | 90 36% | 90.8 37% |
| sRGB Coverage (%) | 84.9 | 86.1 1% | 90 6% | 89.8 6% | 100 18% | 99.9 18% |
| AdobeRGB 1998 Coverage (%) | 62.1 | 62.9 1% | 65.8 6% | 64.9 5% | 84.8 37% | 85.8 38% |
| Response Times | 59% | 55% | -6% | 73% | 34% | |
| Response Time Grey 50% / Grey 80% * (ms) | 36.8 ? | 20.8 ? 43% | 17.6 ? 52% | 38 ? -3% | 8.8 ? 76% | 28 ? 24% |
| Response Time Black / White * (ms) | 24 ? | 6 ? 75% | 10 ? 58% | 26 ? -8% | 7.4 ? 69% | 13.6 ? 43% |
| PWM Frequency (Hz) | 25510 ? | 25000 ? | ||||
| Screen | 4% | 18% | 8% | 16% | 25% | |
| Brightness middle (cd/m²) | 328.7 | 398 21% | 343.6 5% | 323 -2% | 297.8 -9% | 273 -17% |
| Brightness (cd/m²) | 318 | 367 15% | 320 1% | 306 -4% | 285 -10% | 273 -14% |
| Brightness Distribution (%) | 91 | 86 -5% | 87 -4% | 89 -2% | 84 -8% | 90 -1% |
| Black Level * (cd/m²) | 0.51 | 0.51 -0% | 0.34 33% | 0.31 39% | 0.33 35% | 0.26 49% |
| Contrast (:1) | 645 | 780 21% | 1011 57% | 1042 62% | 902 40% | 1050 63% |
| Colorchecker dE 2000 * | 4.91 | 5.45 -11% | 3.74 24% | 4.96 -1% | 3.68 25% | 3.52 28% |
| Colorchecker dE 2000 max. * | 10.15 | 10.36 -2% | 5.33 47% | 8.25 19% | 7.71 24% | 6.34 38% |
| Colorchecker dE 2000 calibrated * | 4.27 | 2.56 40% | 3.49 18% | 2.71 37% | 2.09 51% | |
| Greyscale dE 2000 * | 3.9 | 5.4 -38% | 3.7 5% | 5.65 -45% | 5 -28% | 3.11 20% |
| Gamma | 2.13 103% | 2.4 92% | 2.36 93% | 2.24 98% | 2.06 107% | 2.43 91% |
| CCT | 6911 94% | 7453 87% | 6388 102% | 7441 87% | 6728 97% | 6999 93% |
| Color Space (Percent of AdobeRGB 1998) (%) | 55.6 | 56 1% | 58 4% | 58 4% | 84.77 52% | 76 37% |
| Color Space (Percent of sRGB) (%) | 84.7 | 86 2% | 90 6% | 90 6% | 99.97 18% | 100 18% |
| Totalt genomsnitt (program/inställningar) | 21% /
10% | 25% /
20% | 1% /
5% | 40% /
26% | 30% /
27% |
* ... mindre är bättre
Visa svarstider
| ↔ Svarstid svart till vitt | ||
|---|---|---|
| 24 ms ... stiga ↗ och falla ↘ kombinerat | ↗ 14 ms stiga | 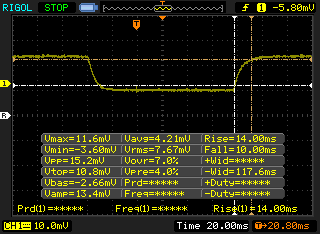 |
| ↘ 10 ms hösten | ||
| Skärmen visar bra svarsfrekvens i våra tester, men kan vara för långsam för konkurrenskraftiga spelare. I jämförelse sträcker sig alla testade enheter från 0.1 (minst) till 240 (maximalt) ms. » 54 % av alla enheter är bättre. Detta innebär att den uppmätta svarstiden är sämre än genomsnittet av alla testade enheter (19.8 ms). | ||
| ↔ Svarstid 50 % grått till 80 % grått | ||
| 36.8 ms ... stiga ↗ och falla ↘ kombinerat | ↗ 18.8 ms stiga | 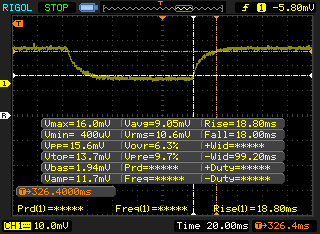 |
| ↘ 18 ms hösten | ||
| Skärmen visar långsamma svarsfrekvenser i våra tester och kommer att vara otillfredsställande för spelare. I jämförelse sträcker sig alla testade enheter från 0.165 (minst) till 636 (maximalt) ms. » 53 % av alla enheter är bättre. Detta innebär att den uppmätta svarstiden är sämre än genomsnittet av alla testade enheter (30.9 ms). | ||
Skärmflimmer / PWM (Puls-Width Modulation)
| Skärmflimmer / PWM upptäcktes inte | 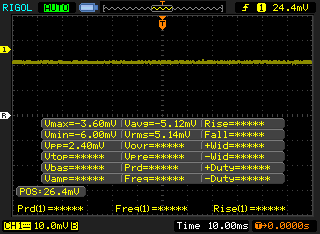 | ||
Som jämförelse: 52 % av alla testade enheter använder inte PWM för att dämpa skärmen. Om PWM upptäcktes mättes ett medelvärde av 7744 (minst: 5 - maximum: 343500) Hz. | |||
| PCMark 8 Home Score Accelerated v2 | 4148 poäng | |
| PCMark 8 Work Score Accelerated v2 | 5340 poäng | |
| PCMark 10 Score | 4982 poäng | |
Hjälp | ||
| Lenovo Legion Y730-17ICH, i7-8750H Toshiba KBG30ZMT128G | Alienware 17 R5 SK hynix PC401 HFS256GD9TNG | HP Omen 17t-3AW55AV_1 Samsung SSD PM981 MZVLB512HAJQ | Dell G3 17 3779 SK hynix SC311 SATA | Asus Strix GL703GM-DS74 Samsung PM961 MZVLW256HEHP | Genomsnitt Toshiba KBG30ZMT128G | |
|---|---|---|---|---|---|---|
| AS SSD | 233% | 915% | 41% | 463% | 28% | |
| Copy Game MB/s (MB/s) | 134.6 | 875 550% | 124.2 -8% | 481 257% | 122.3 ? -9% | |
| Copy Program MB/s (MB/s) | 182.9 | 481.1 163% | 99.8 -45% | 780 326% | 122.6 ? -33% | |
| Copy ISO MB/s (MB/s) | 272.7 | 1080 296% | 154.9 -43% | 1043 282% | 174.8 ? -36% | |
| Score Total (Points) | 479 | 1424 197% | 4142 765% | 552 15% | 3075 542% | 656 ? 37% |
| Score Write (Points) | 86 | 428 398% | 2147 2397% | 199 131% | 825 859% | 149 ? 73% |
| Score Read (Points) | 286 | 706 147% | 1304 356% | 236 -17% | 1520 431% | 360 ? 26% |
| Access Time Write * (ms) | 0.324 | 0.065 80% | 0.047 85% | 0.069 79% | 0.042 87% | 0.27 ? 17% |
| Access Time Read * (ms) | 0.519 | 0.091 82% | 0.071 86% | 0.136 74% | 0.066 87% | 0.3803 ? 27% |
| 4K-64 Write (MB/s) | 31.38 | 279.1 789% | 1866 5846% | 114.8 266% | 633 1917% | 75.1 ? 139% |
| 4K-64 Read (MB/s) | 168.6 | 447.2 165% | 1125 567% | 160.7 -5% | 1285 662% | 222 ? 32% |
| 4K Write (MB/s) | 38.73 | 92.7 139% | 84.4 118% | 58.5 51% | 88.4 128% | 60.8 ? 57% |
| 4K Read (MB/s) | 19.73 | 38.74 96% | 31.66 60% | 24.22 23% | 35.76 81% | 30.3 ? 54% |
| Seq Write (MB/s) | 125.4 | 559 346% | 1962 1465% | 254.4 103% | 1031 722% | 122.4 ? -2% |
| Seq Read (MB/s) | 979 | 2203 125% | 1473 50% | 511 -48% | 1993 104% | 1074 ? 10% |
* ... mindre är bättre

| 3DMark - 1920x1080 Fire Strike Graphics | |
| Aorus X7 DT v8 | |
| Alienware 17 R5 | |
| MSI GS65 Stealth Thin 8RE-051US | |
| Dell G7 15-7588 | |
| Asus Strix GL502VY-DS71 | |
| Lenovo Legion Y730-17ICH, i7-8750H | |
| Genomsnitt NVIDIA GeForce GTX 1050 Ti Mobile (6792 - 8376, n=38) | |
| MSI GeForce GTX 1050 Ti | |
| Dell G3 15 3579 | |
| MSI PE60 6QE-056XUS | |
| 3DMark 11 | |
| 1280x720 Performance GPU | |
| Aorus X7 DT v8 | |
| Alienware 17 R5 | |
| MSI GS65 Stealth Thin 8RE-051US | |
| Dell G7 15-7588 | |
| Asus Strix GL502VY-DS71 | |
| MSI GeForce GTX 1050 Ti | |
| Genomsnitt NVIDIA GeForce GTX 1050 Ti Mobile (8304 - 10402, n=36) | |
| Dell G3 15 3579 | |
| MSI PE60 6QE-056XUS | |
| 1280x720 Performance Combined | |
| Aorus X7 DT v8 | |
| Alienware 17 R5 | |
| Dell G7 15-7588 | |
| MSI GS65 Stealth Thin 8RE-051US | |
| MSI GeForce GTX 1050 Ti | |
| Asus Strix GL502VY-DS71 | |
| Genomsnitt NVIDIA GeForce GTX 1050 Ti Mobile (6104 - 9172, n=35) | |
| Dell G3 15 3579 | |
| MSI PE60 6QE-056XUS | |
| 3DMark Cloud Gate Standard Score | 27317 poäng | |
| 3DMark Fire Strike Score | 7049 poäng | |
Hjälp | ||
| låg | med. | hög | ultra | |
|---|---|---|---|---|
| BioShock Infinite (2013) | 255.3 | 203.4 | 185.5 | 74.5 |
| The Witcher 3 (2015) | 144.5 | 87.3 | 51 | 26 |
| Rise of the Tomb Raider (2016) | 134.9 | 92.4 | 47.6 | 40.1 |
Ljudnivå
| Låg belastning |
| 28 / 28 / 31.3 dB(A) |
| Hårddisk |
| 31.2 dB(A) |
| Hög belastning |
| 33.4 / 46.2 dB(A) |
 | ||
30 dB tyst 40 dB(A) hörbar 50 dB(A) högt ljud |
||
min: | ||
| Lenovo Legion Y730-17ICH, i7-8750H GeForce GTX 1050 Ti Mobile, i7-8750H, Toshiba KBG30ZMT128G | Dell G3 17 3779 GeForce GTX 1050 Mobile, i5-8300H, SK hynix SC311 SATA | Asus Strix GL703GM-DS74 GeForce GTX 1060 Mobile, i7-8750H, Samsung PM961 MZVLW256HEHP | HP Omen 17t-3AW55AV_1 GeForce GTX 1070 Mobile, i7-8750H, Samsung SSD PM981 MZVLB512HAJQ | Dell XPS 15 9575 i7-8705G Vega M GL / 870, i7-8705G, SK hynix PC401 NVMe 500 GB | |
|---|---|---|---|---|---|
| Noise | -8% | -8% | -9% | 2% | |
| av / miljö * (dB) | 28 | 30.5 -9% | 28.6 -2% | 27.8 1% | 28.2 -1% |
| Idle Minimum * (dB) | 28 | 30.5 -9% | 29.4 -5% | 31.1 -11% | 28.2 -1% |
| Idle Average * (dB) | 28 | 31.1 -11% | 29.4 -5% | 31.1 -11% | 28.2 -1% |
| Idle Maximum * (dB) | 31.3 | 32.1 -3% | 33.7 -8% | 35 -12% | 28.2 10% |
| Load Average * (dB) | 33.4 | 43.4 -30% | 41.2 -23% | 42 -26% | 29 13% |
| Witcher 3 ultra * (dB) | 42.8 | 47.3 -11% | 44.5 -4% | 44.7 -4% | |
| Load Maximum * (dB) | 46.2 | 39.2 15% | 48.3 -5% | 46.5 -1% | 47.4 -3% |
* ... mindre är bättre
(±) Den maximala temperaturen på ovansidan är 42 °C / 108 F, jämfört med genomsnittet av 40.4 °C / 105 F , allt från 21.2 till 68.8 °C för klassen Gaming.
(-) Botten värms upp till maximalt 51.2 °C / 124 F, jämfört med genomsnittet av 43.2 °C / 110 F
(+) Vid tomgångsbruk är medeltemperaturen för ovansidan 29.2 °C / 85 F, jämfört med enhetsgenomsnittet på 33.9 °C / ### class_avg_f### F.
(+) När du spelar The Witcher 3 är medeltemperaturen för ovansidan 28.4 °C / 83 F, jämfört med enhetsgenomsnittet på 33.9 °C / ## #class_avg_f### F.
(+) Handledsstöden och pekplattan är kallare än hudtemperaturen med maximalt 28.4 °C / 83.1 F och är därför svala att ta på.
(±) Medeltemperaturen för handledsstödsområdet på liknande enheter var 28.8 °C / 83.8 F (+0.4 °C / 0.7 F).
Lenovo Legion Y730-17ICH, i7-8750H ljudanalys
(-) | inte särskilt höga högtalare (69.1 dB)
Bas 100 - 315 Hz
(±) | reducerad bas - i genomsnitt 5.7% lägre än medianen
(±) | linjäriteten för basen är genomsnittlig (12.8% delta till föregående frekvens)
Mellan 400 - 2000 Hz
(+) | balanserad mellan - endast 3.3% från medianen
(+) | mids är linjära (5.3% delta till föregående frekvens)
Högsta 2 - 16 kHz
(+) | balanserade toppar - endast 1.2% från medianen
(+) | toppar är linjära (4.5% delta till föregående frekvens)
Totalt 100 - 16 000 Hz
(+) | det totala ljudet är linjärt (13.8% skillnad mot median)
Jämfört med samma klass
» 21% av alla testade enheter i den här klassen var bättre, 7% liknande, 71% sämre
» Den bästa hade ett delta på 6%, genomsnittet var 18%, sämst var 132%
Jämfört med alla testade enheter
» 15% av alla testade enheter var bättre, 4% liknande, 81% sämre
» Den bästa hade ett delta på 4%, genomsnittet var 23%, sämst var 134%
Apple MacBook 12 (Early 2016) 1.1 GHz ljudanalys
(+) | högtalare kan spela relativt högt (83.6 dB)
Bas 100 - 315 Hz
(±) | reducerad bas - i genomsnitt 11.3% lägre än medianen
(±) | linjäriteten för basen är genomsnittlig (14.2% delta till föregående frekvens)
Mellan 400 - 2000 Hz
(+) | balanserad mellan - endast 2.4% från medianen
(+) | mids är linjära (5.5% delta till föregående frekvens)
Högsta 2 - 16 kHz
(+) | balanserade toppar - endast 2% från medianen
(+) | toppar är linjära (4.5% delta till föregående frekvens)
Totalt 100 - 16 000 Hz
(+) | det totala ljudet är linjärt (10.2% skillnad mot median)
Jämfört med samma klass
» 7% av alla testade enheter i den här klassen var bättre, 2% liknande, 90% sämre
» Den bästa hade ett delta på 5%, genomsnittet var 18%, sämst var 53%
Jämfört med alla testade enheter
» 5% av alla testade enheter var bättre, 1% liknande, 94% sämre
» Den bästa hade ett delta på 4%, genomsnittet var 23%, sämst var 134%
| Av/Standby | |
| Låg belastning | |
| Hög belastning |
|
Förklaring:
min: | |
| Lenovo Legion Y730-17ICH, i7-8750H i7-8750H, GeForce GTX 1050 Ti Mobile, Toshiba KBG30ZMT128G, IPS, 1920x1080, 17.3" | HP Omen 17t-3AW55AV_1 i7-8750H, GeForce GTX 1070 Mobile, Samsung SSD PM981 MZVLB512HAJQ, IPS, 1920x1080, 17.3" | Dell G3 17 3779 i5-8300H, GeForce GTX 1050 Mobile, SK hynix SC311 SATA, IPS, 1920x1080, 17.3" | Asus Strix GL703GM-DS74 i7-8750H, GeForce GTX 1060 Mobile, Samsung PM961 MZVLW256HEHP, TN LED, 1920x1080, 17.3" | Dell XPS 15 9575 i7-8705G i7-8705G, Vega M GL / 870, SK hynix PC401 NVMe 500 GB, IPS, 3840x2160, 15.6" | Asus Strix GL502VT-DS74 6700HQ, GeForce GTX 970M, Lite-On CV1-8B128, IPS, 1920x1080, 15.6" | |
|---|---|---|---|---|---|---|
| Power Consumption | -98% | -14% | -97% | 4% | -39% | |
| Idle Minimum * (Watt) | 6.3 | 17.8 -183% | 7.7 -22% | 18.88 -200% | 6.2 2% | 11.1 -76% |
| Idle Average * (Watt) | 11 | 24.7 -125% | 14 -27% | 24.36 -121% | 12.9 -17% | 14.1 -28% |
| Idle Maximum * (Watt) | 11.5 | 29.6 -157% | 15.5 -35% | 32.27 -181% | 13.6 -18% | 18.4 -60% |
| Load Average * (Watt) | 89.8 | 110 -22% | 95 -6% | 107.74 -20% | 76.1 15% | 96.5 -7% |
| Witcher 3 ultra * (Watt) | 102 | 167.8 -65% | 142 -39% | 84.3 17% | ||
| Load Maximum * (Watt) | 130.7 | 178.6 -37% | 106 19% | 160.28 -23% | 99.4 24% | 159.5 -22% |
* ... mindre är bättre
| Lenovo Legion Y730-17ICH, i7-8750H i7-8750H, GeForce GTX 1050 Ti Mobile, 76 Wh | Alienware 17 R5 i7-8750H, GeForce GTX 1070 Mobile, 99 Wh | Dell G3 17 3779 i5-8300H, GeForce GTX 1050 Mobile, 56 Wh | Asus Strix GL703GM-DS74 i7-8750H, GeForce GTX 1060 Mobile, 74 Wh | Aorus X7 DT v8 i7-8850H, GeForce GTX 1080 Mobile, 94.24 Wh | Lenovo Ideapad Y700 17ISK 80Q0 6700HQ, GeForce GTX 960M, 60 Wh | |
|---|---|---|---|---|---|---|
| Batteridrifttid | -30% | 37% | -24% | -21% | 13% | |
| Reader / Idle (h) | 13.2 | 4.5 -66% | 12.2 -8% | 5.3 -60% | 4.9 -63% | 11.5 -13% |
| WiFi v1.3 (h) | 6.7 | 3.6 -46% | 5.8 -13% | 3.6 -46% | 3.8 -43% | 5.6 -16% |
| Load (h) | 0.9 | 1.1 22% | 2.1 133% | 1.2 33% | 1.3 44% | 1.5 67% |
För
Emot
Läs den fullständiga versionen av den här recensionen på engelska här.
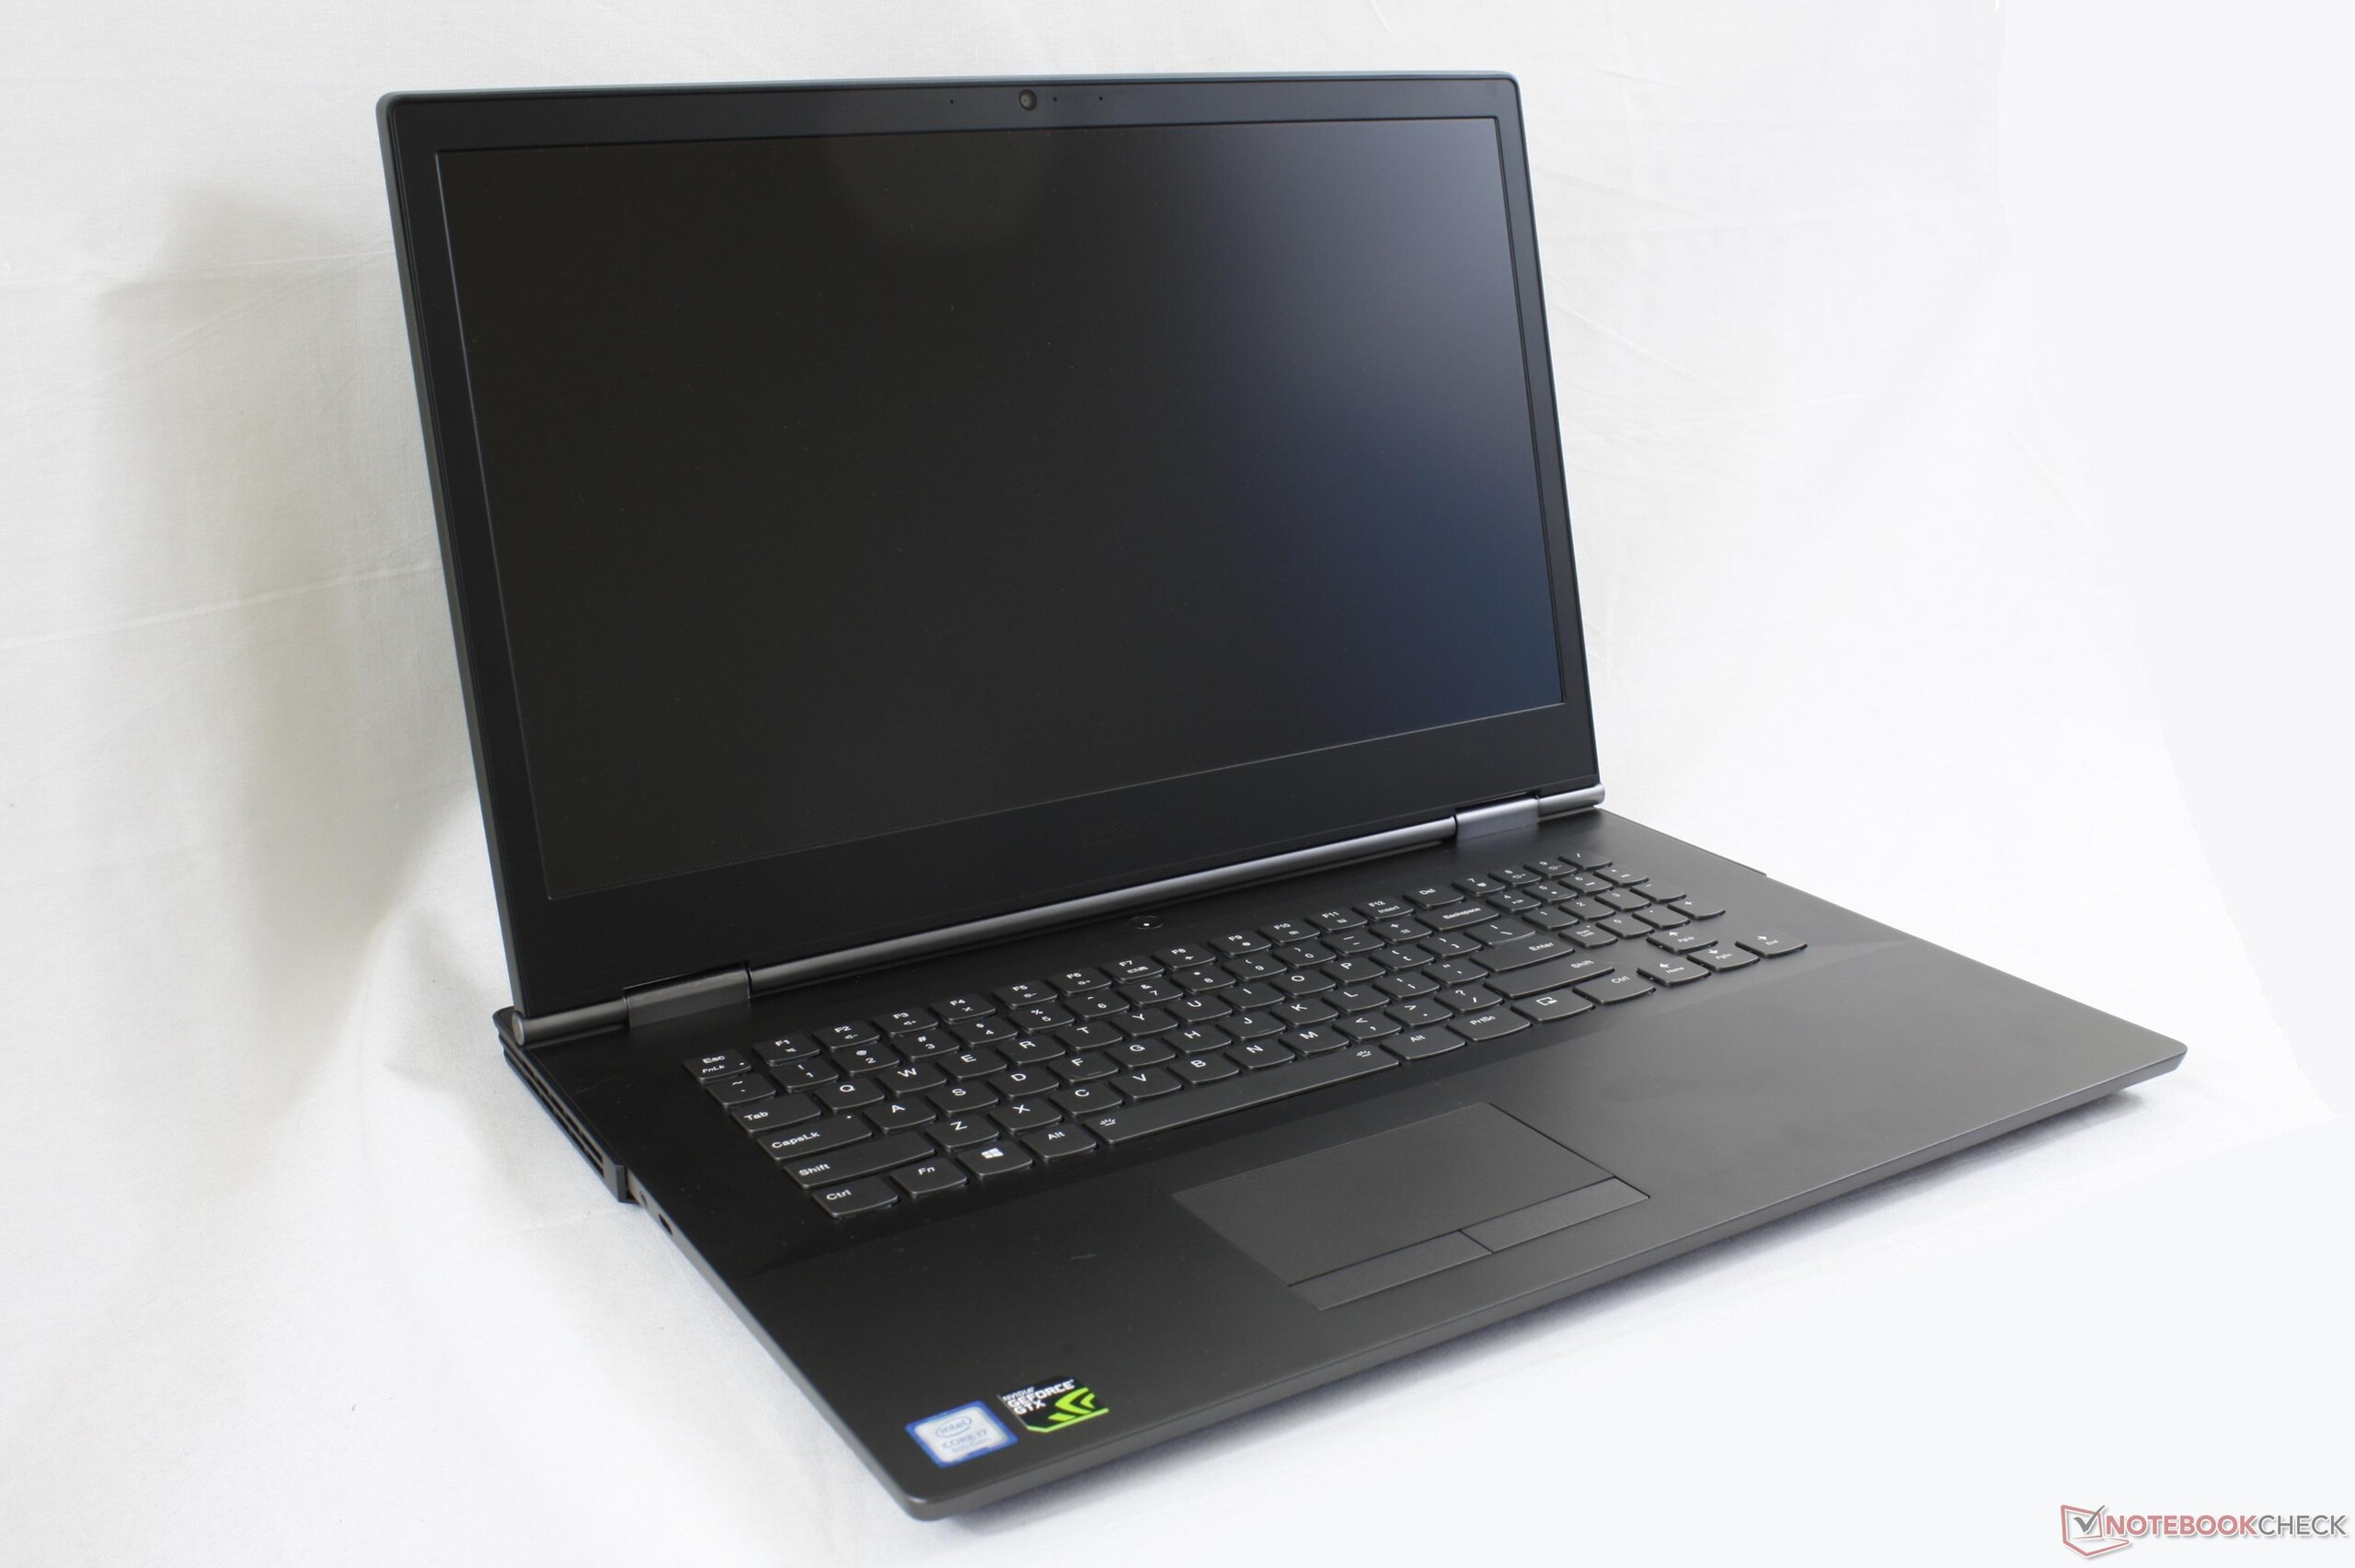
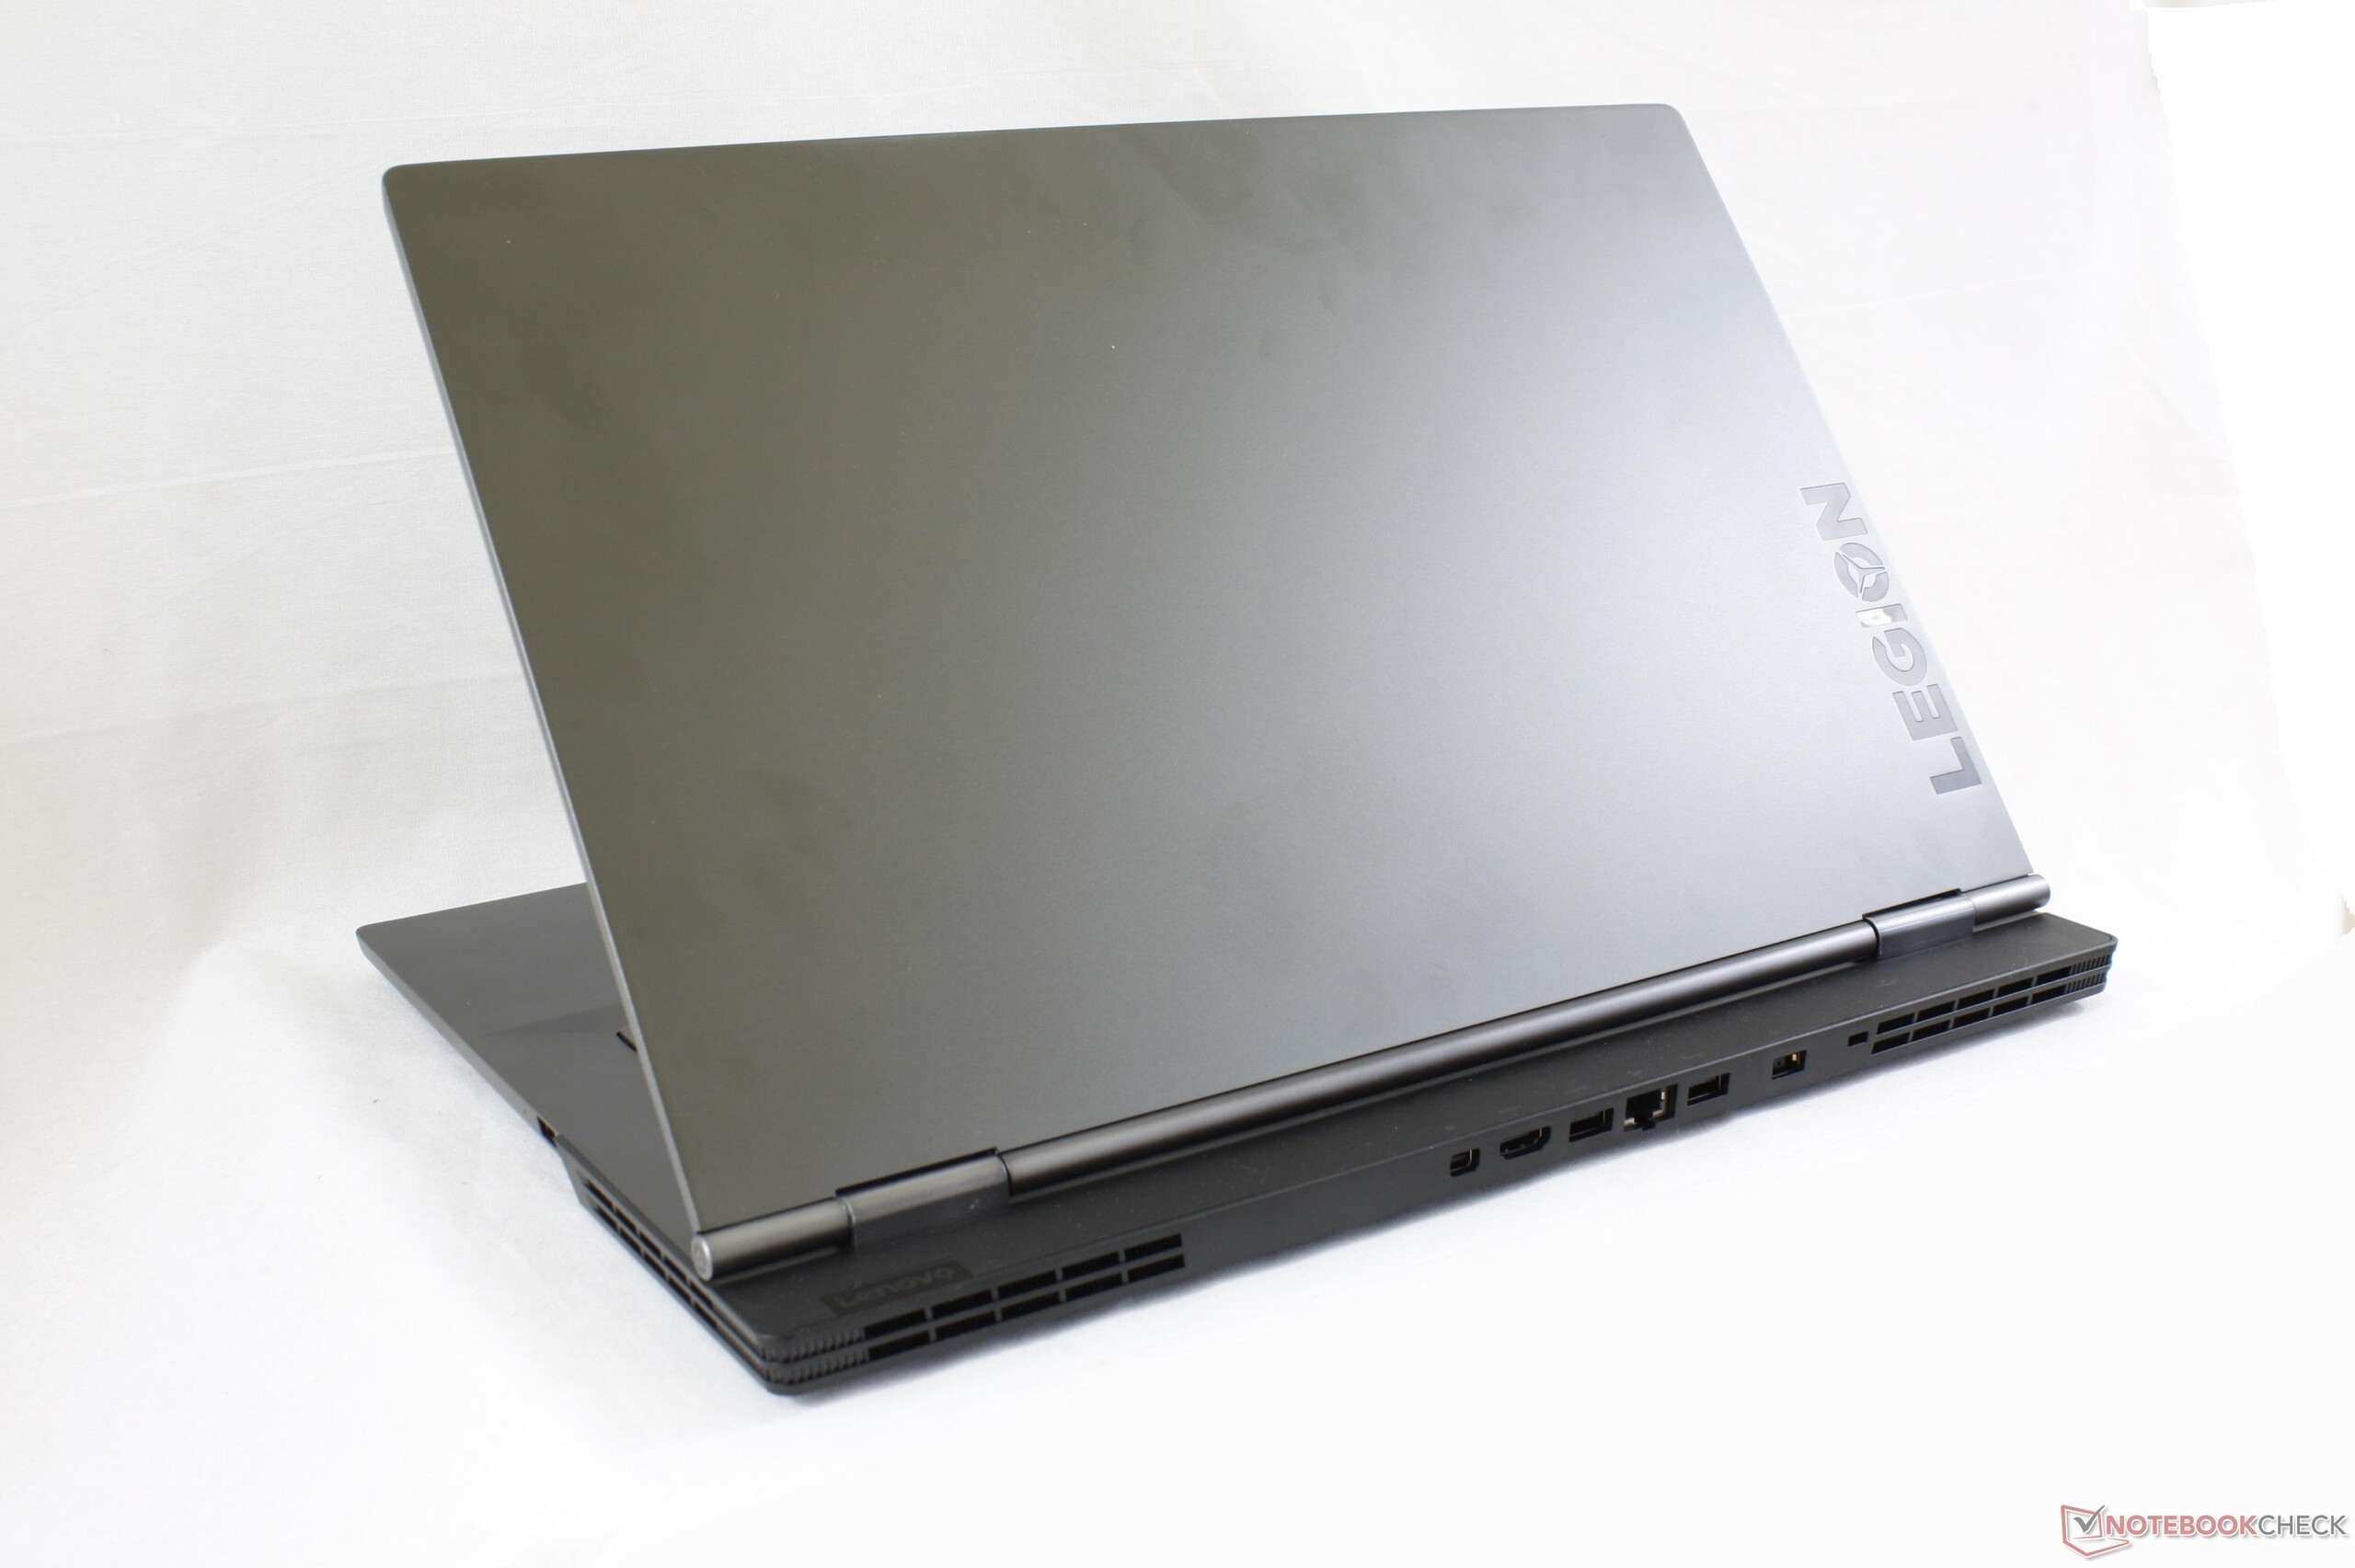
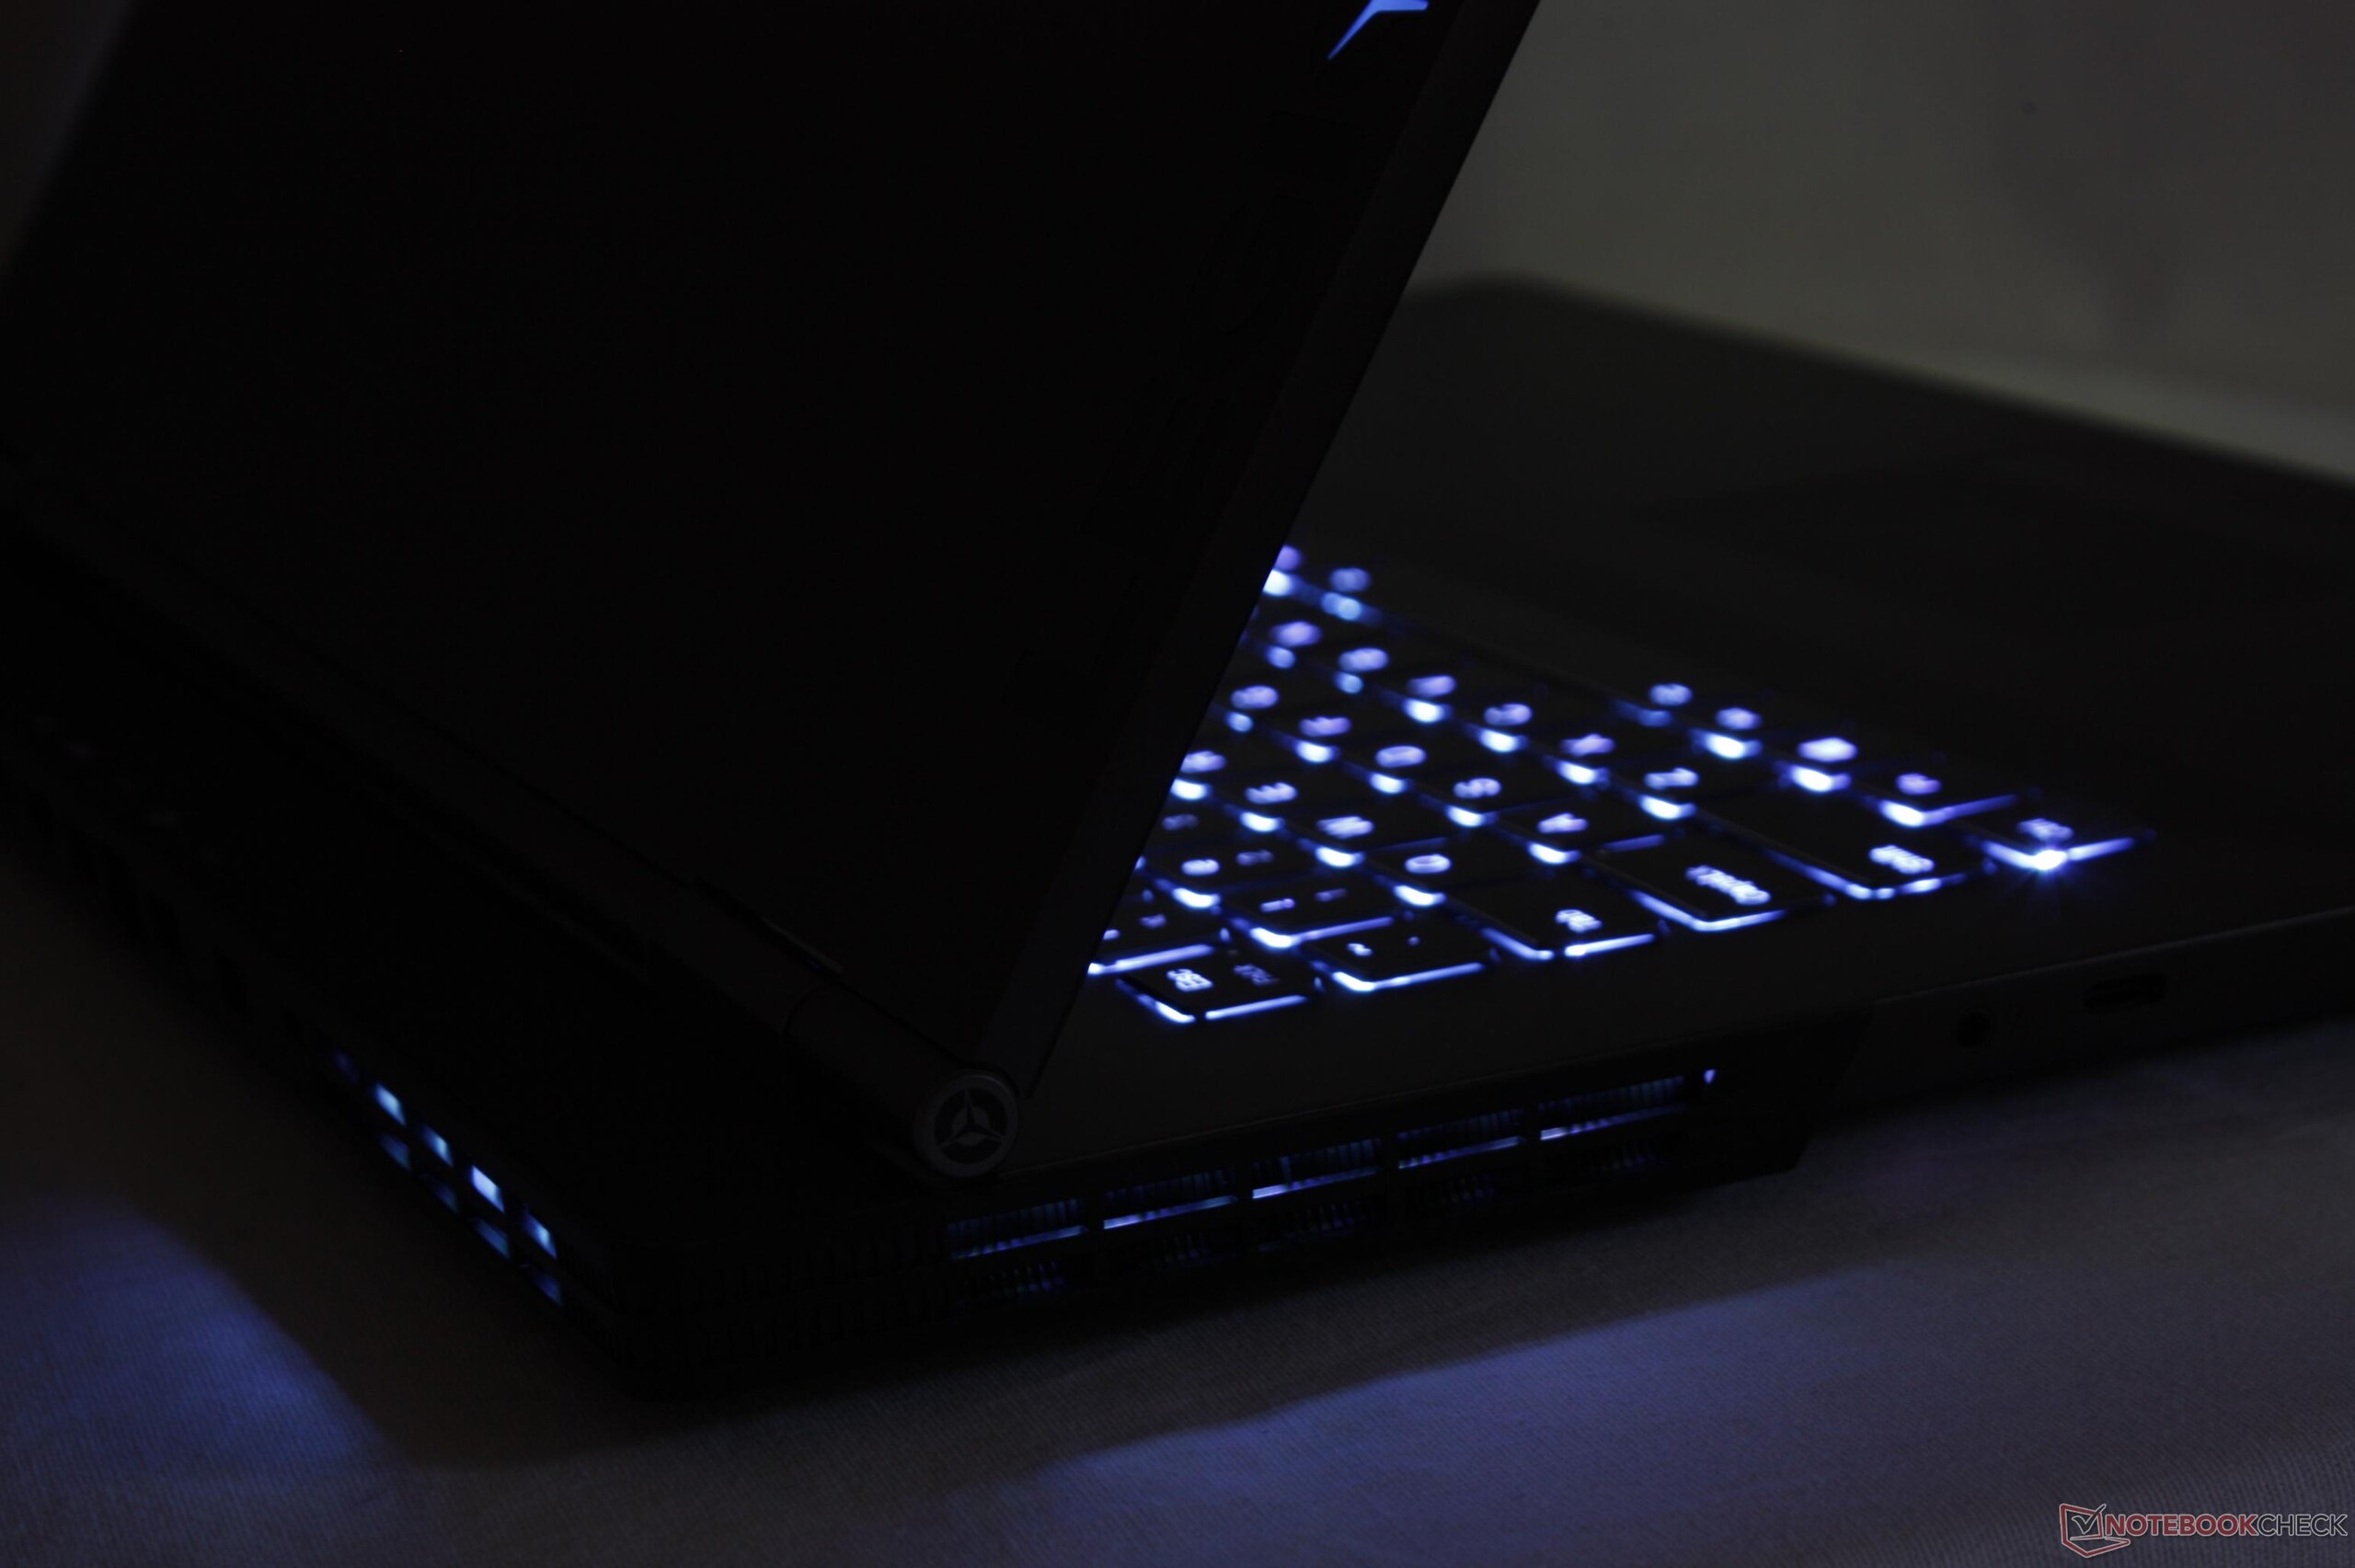
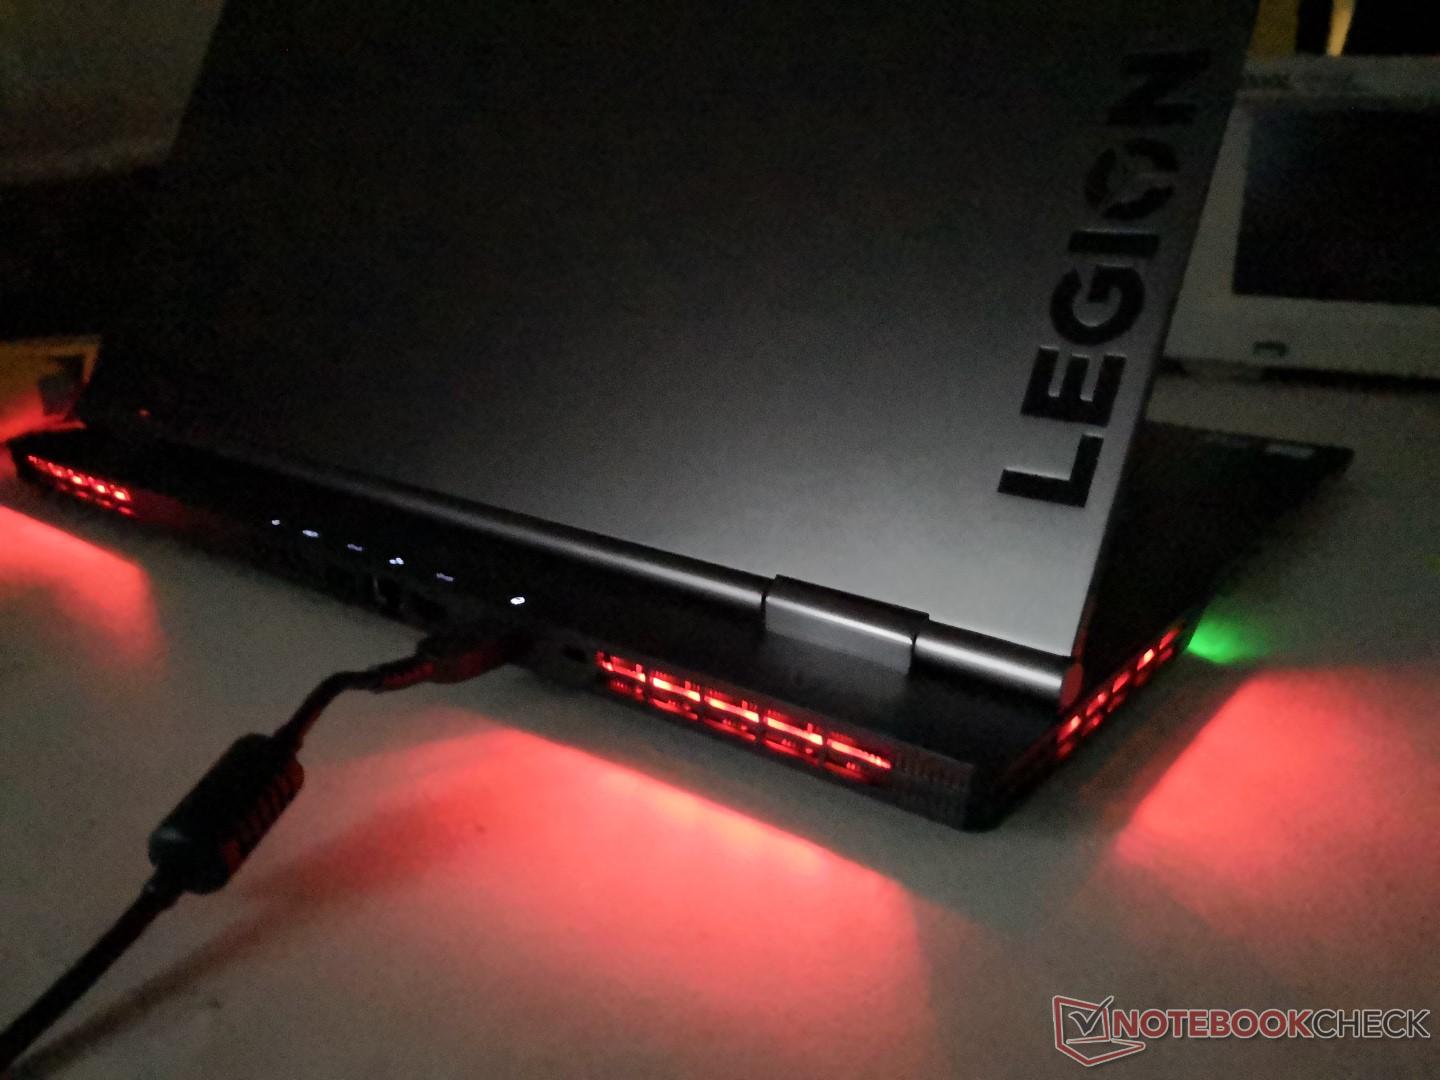
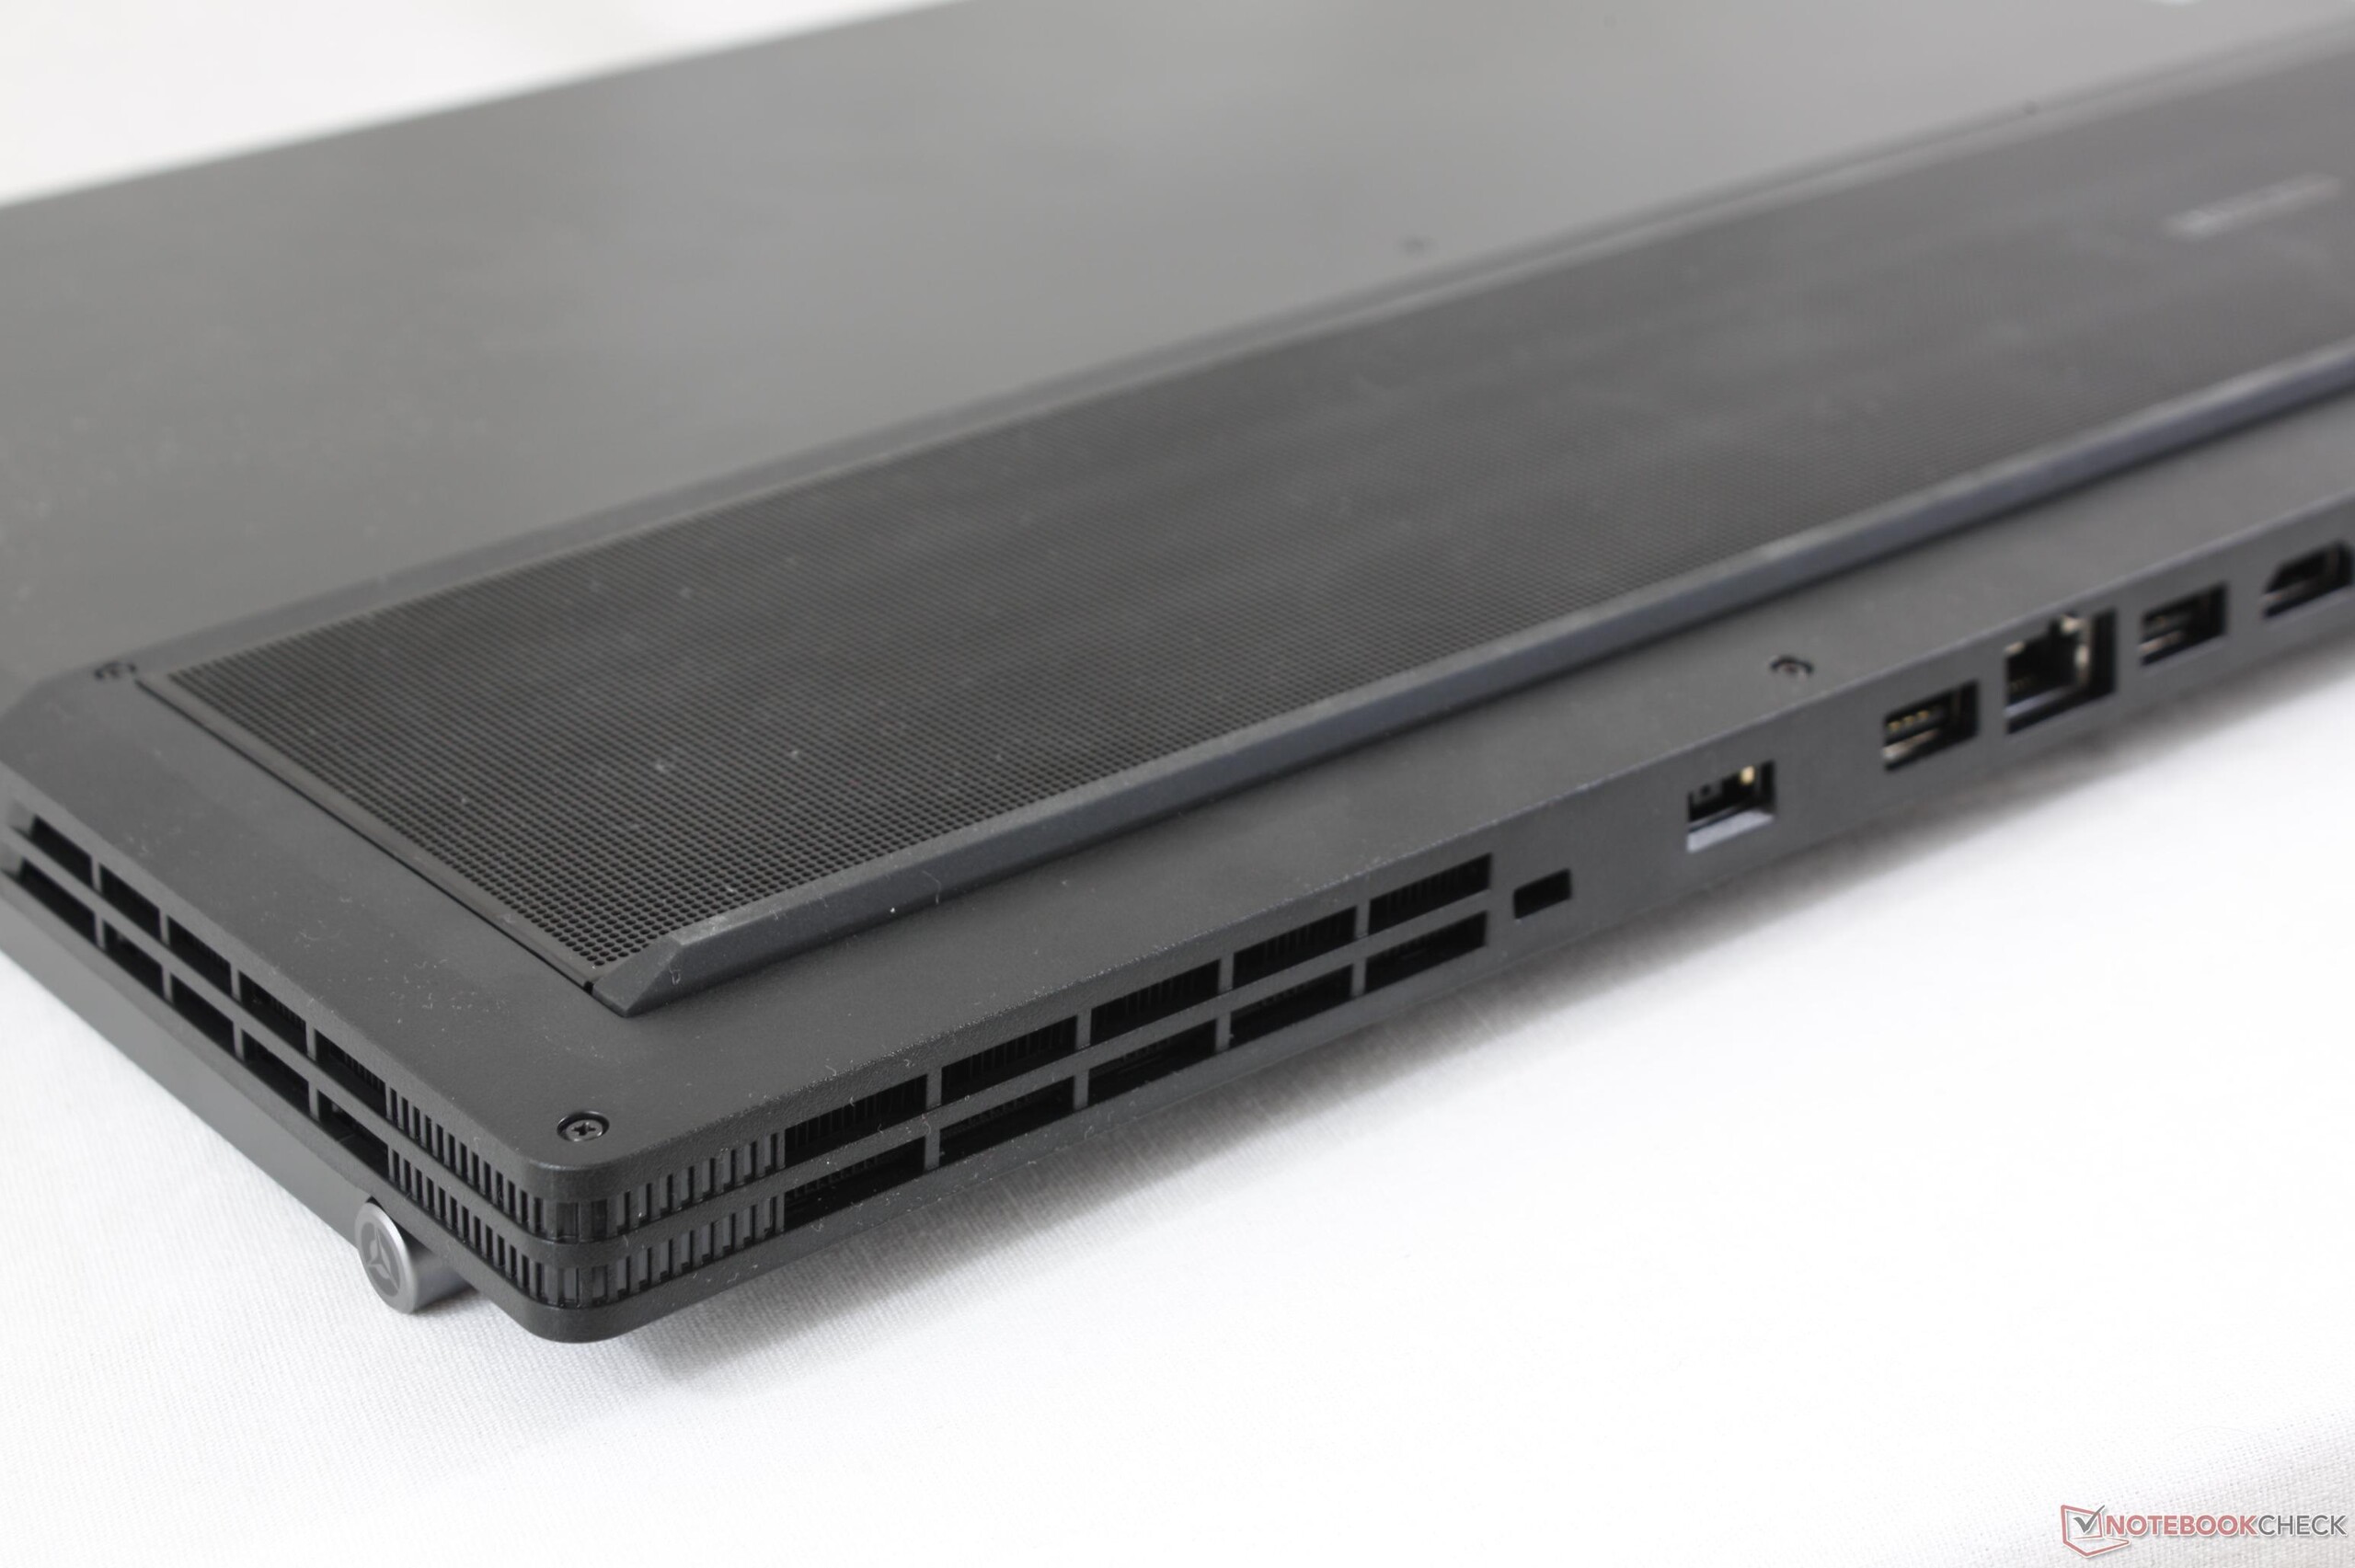
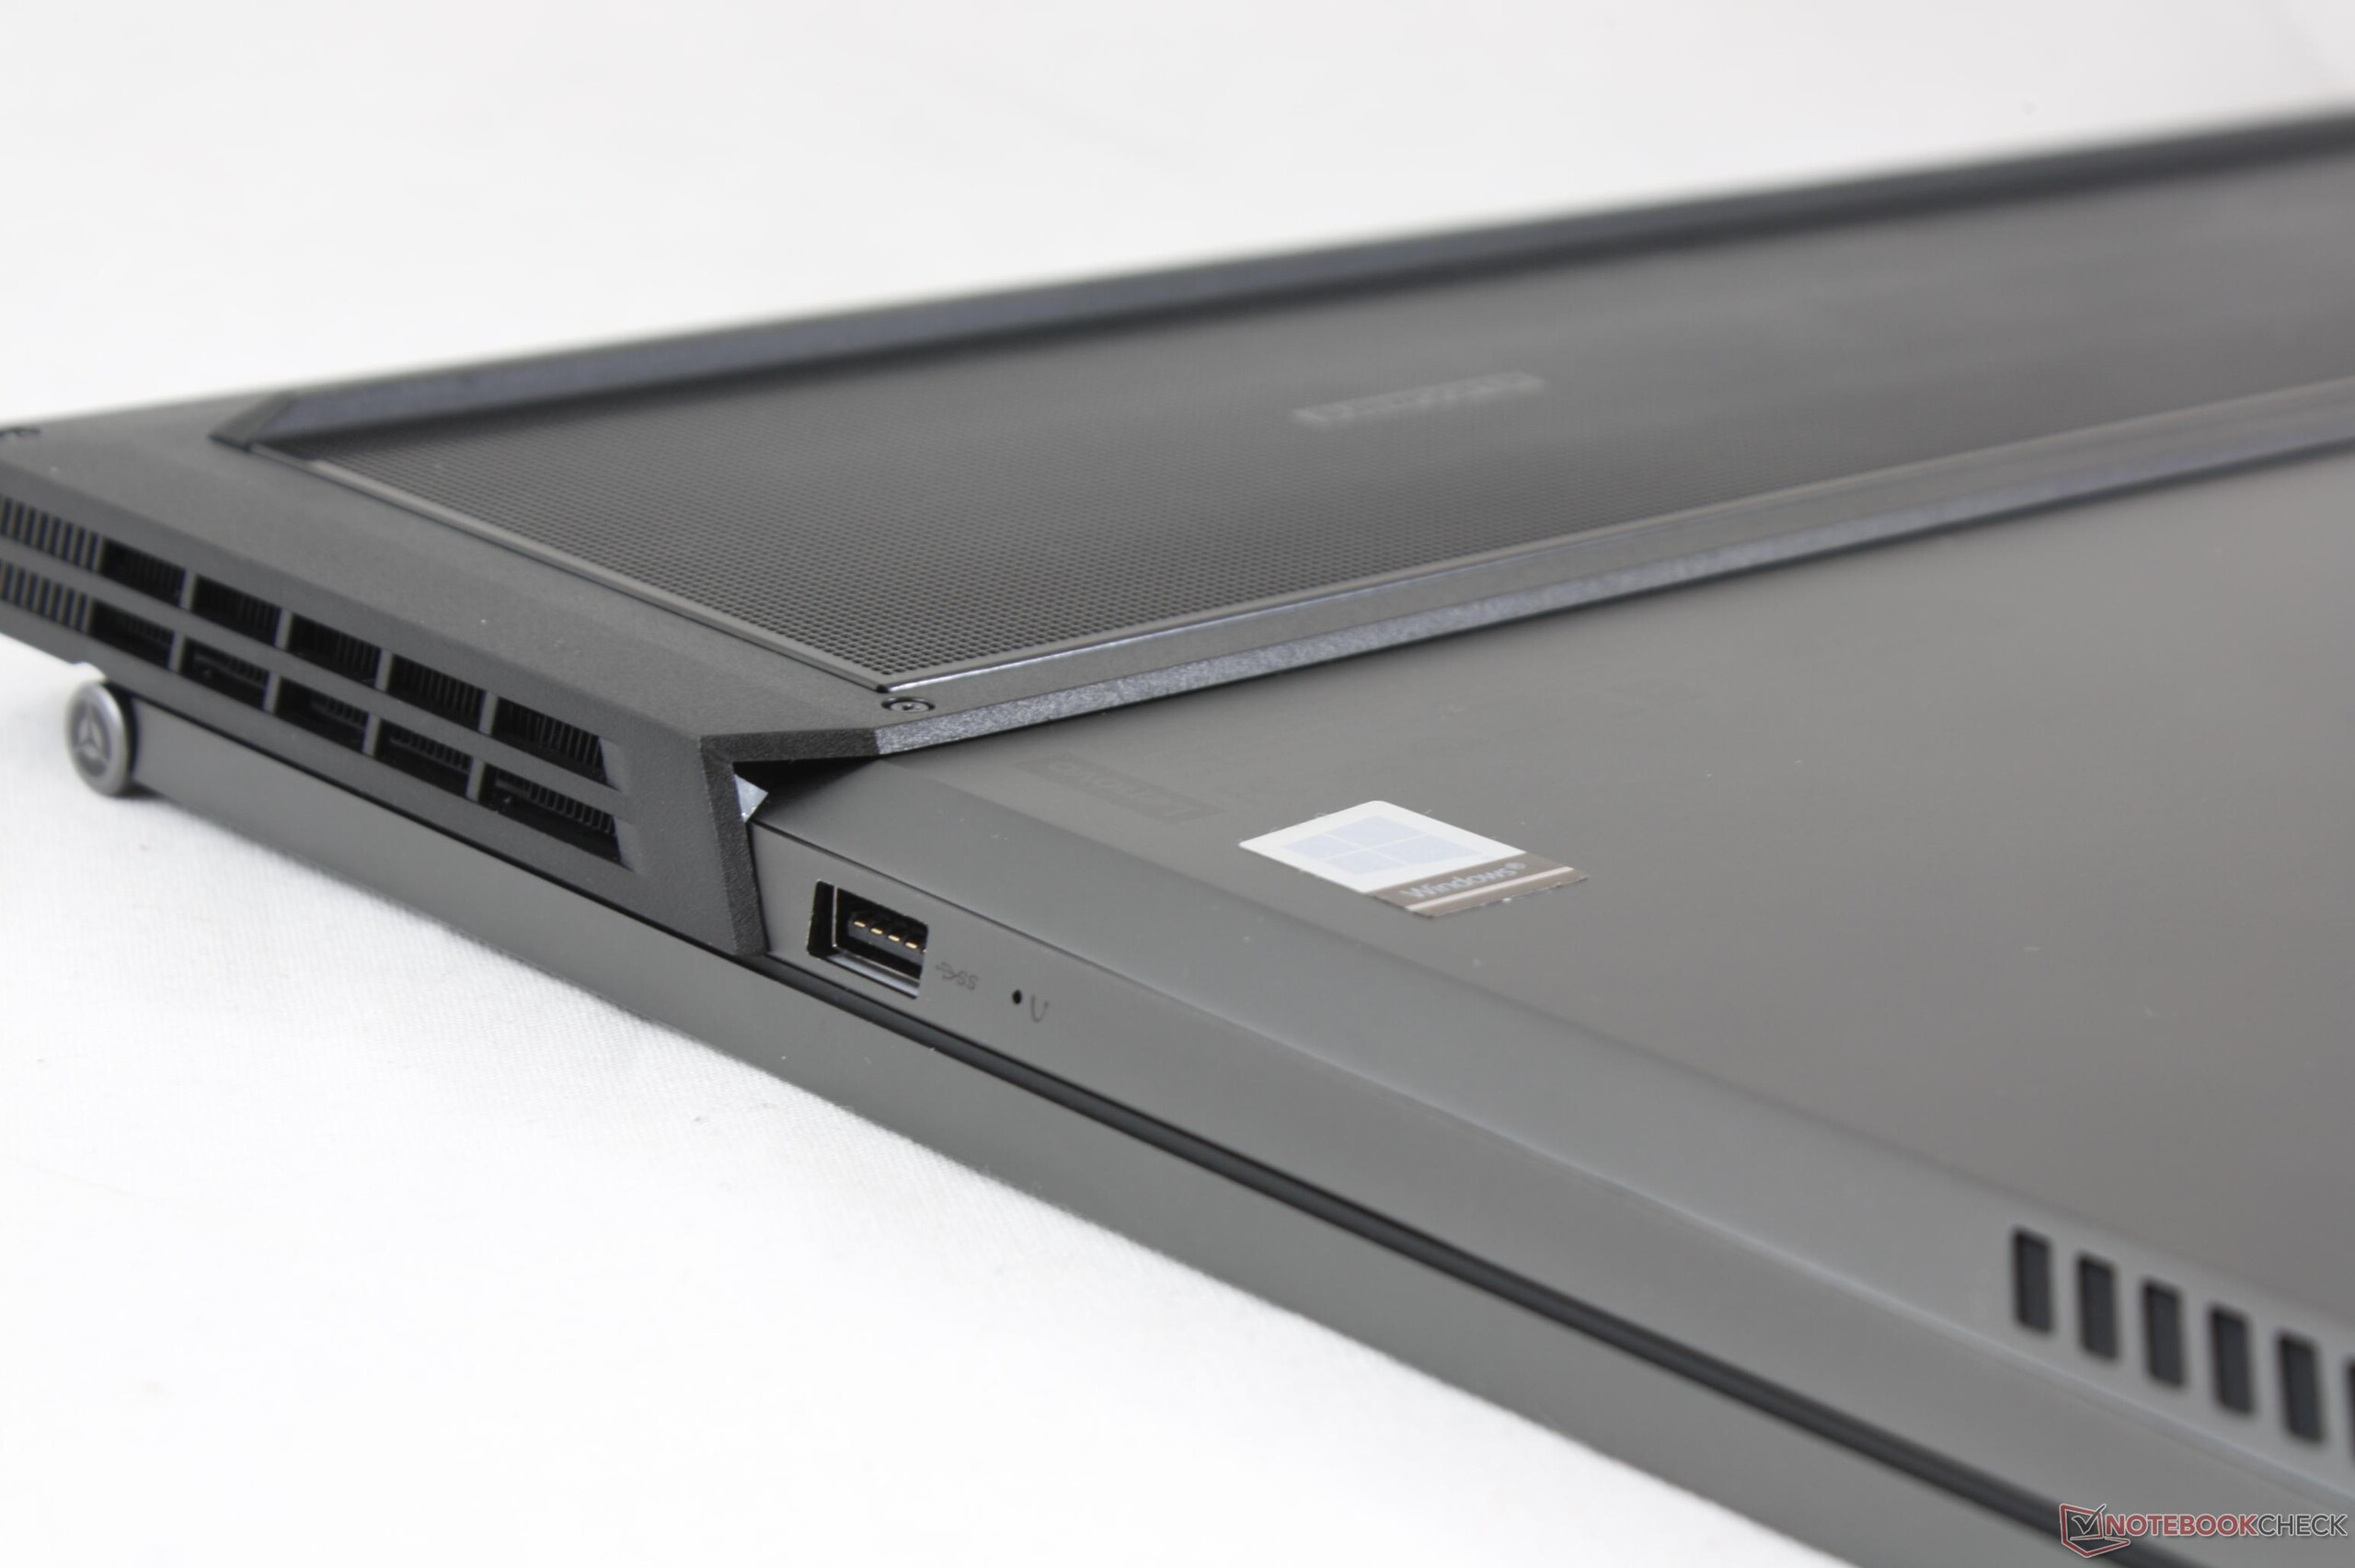
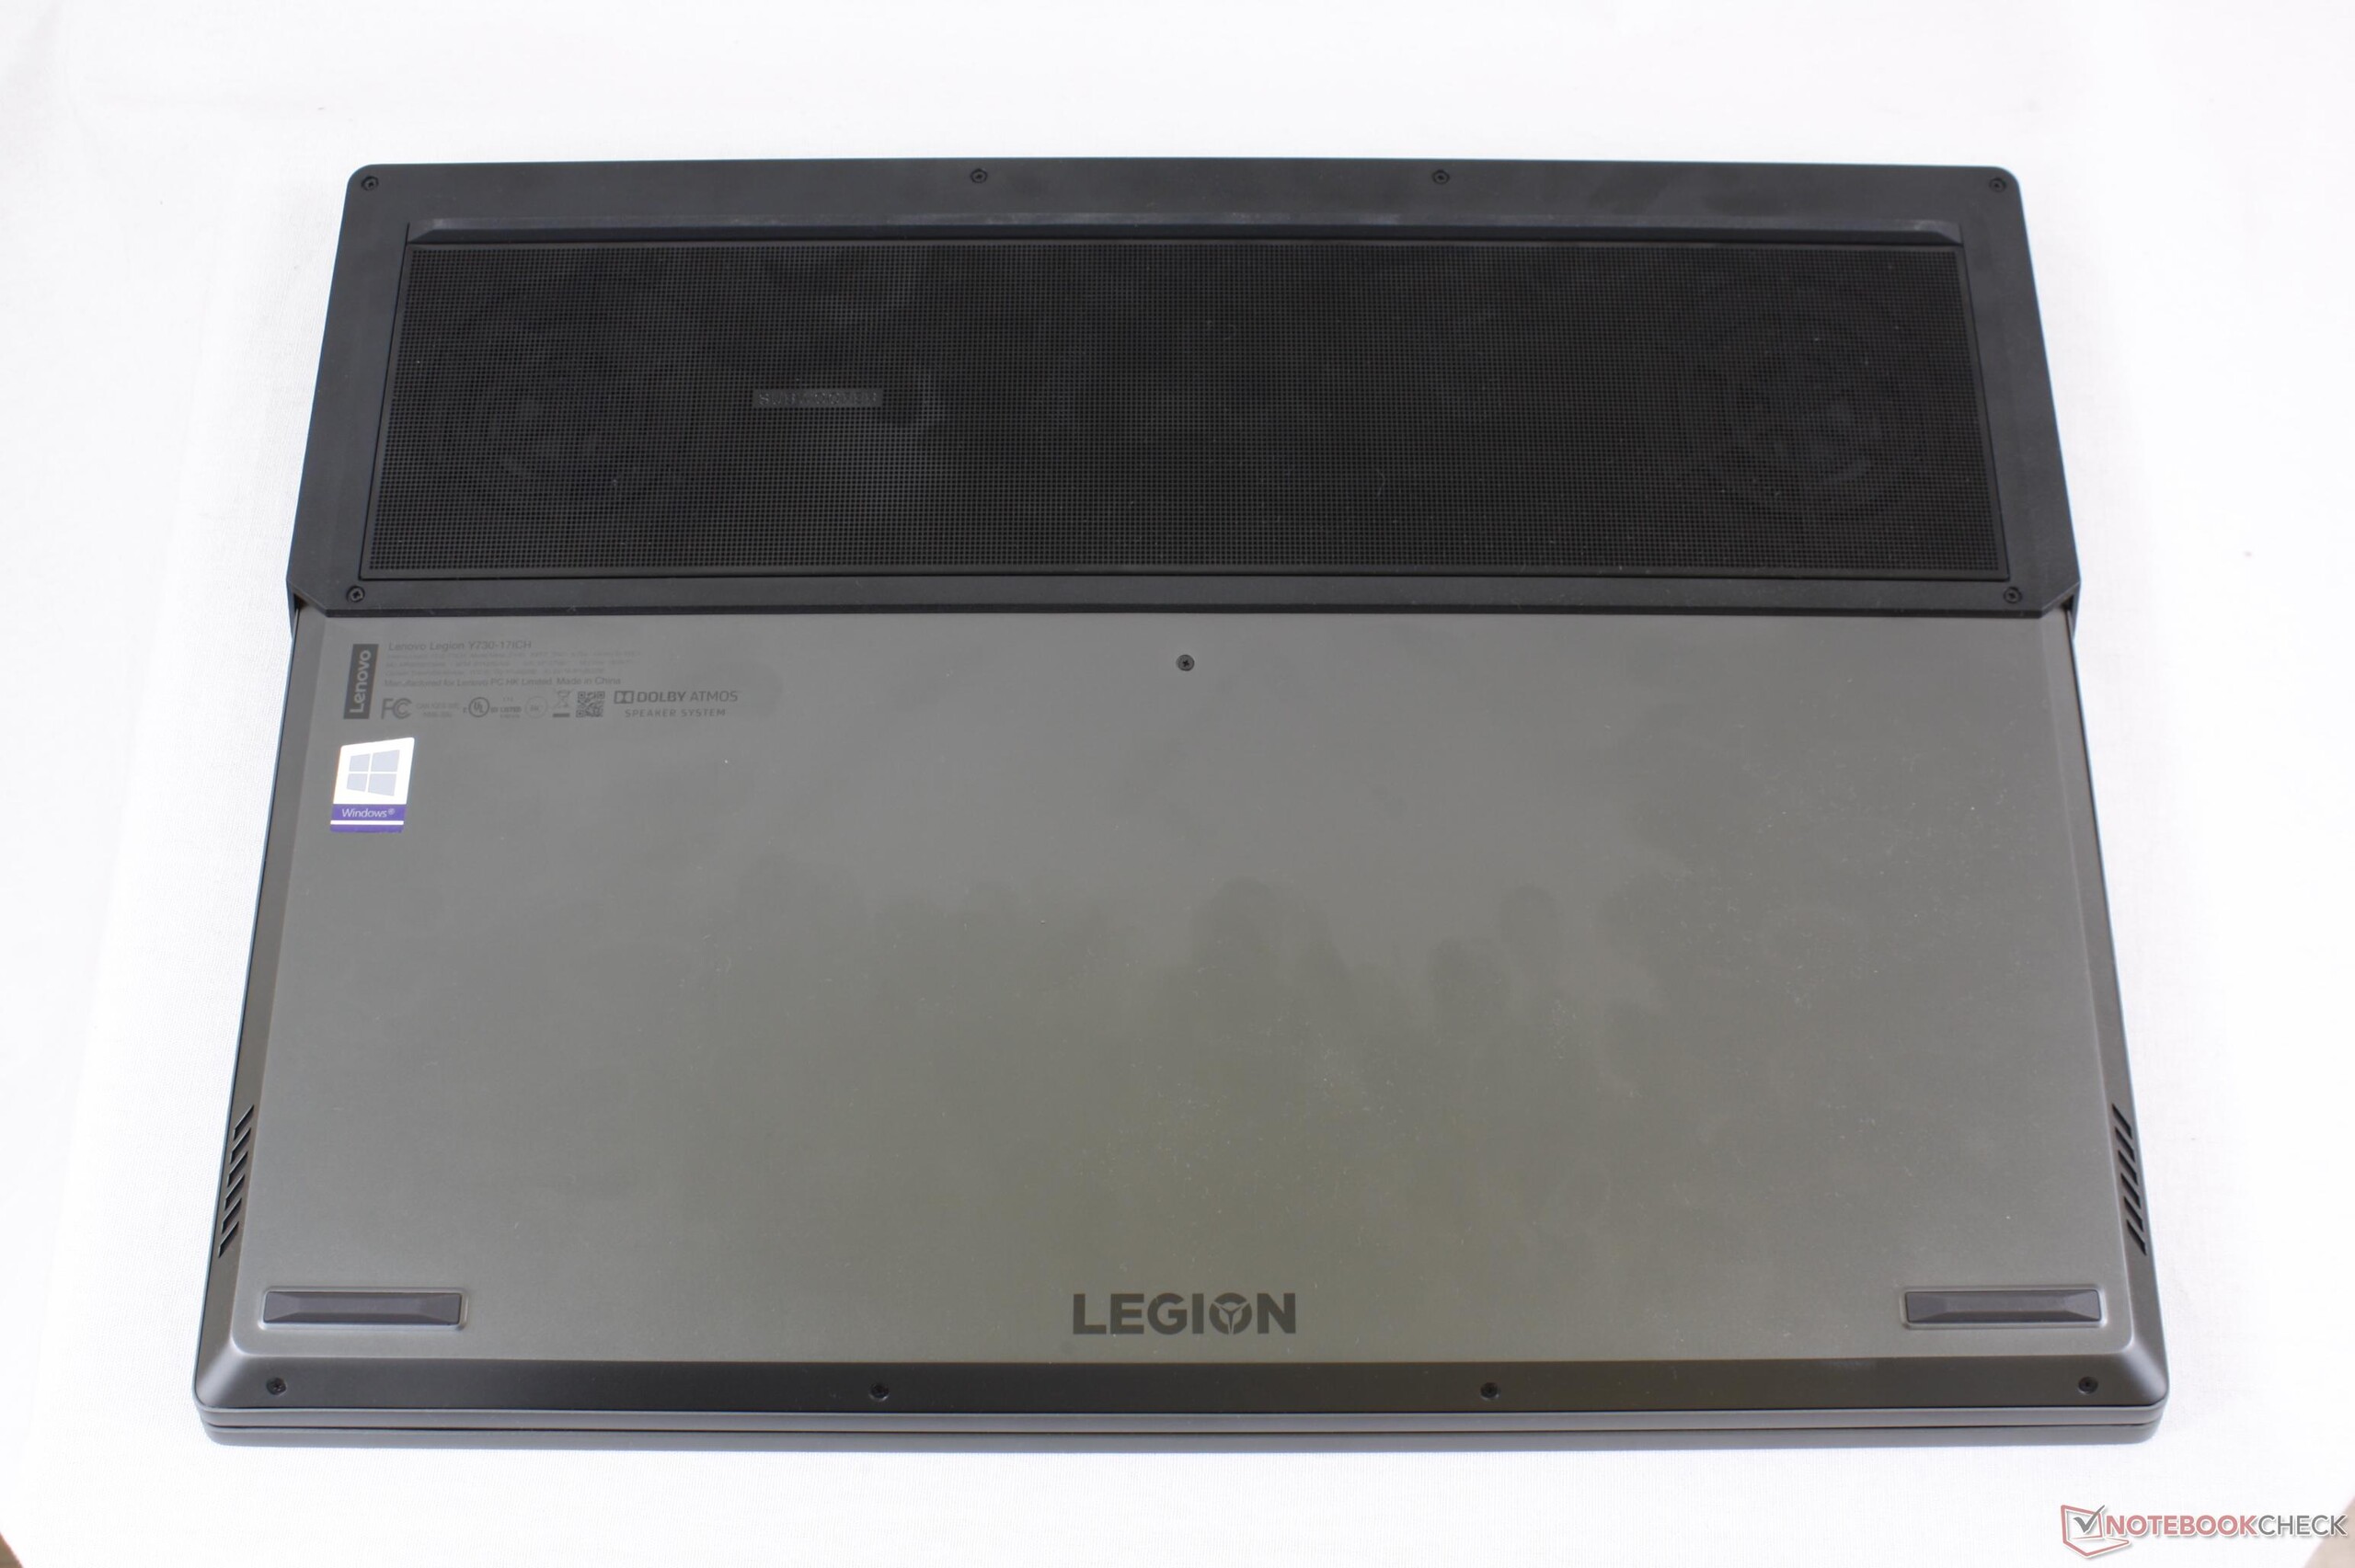
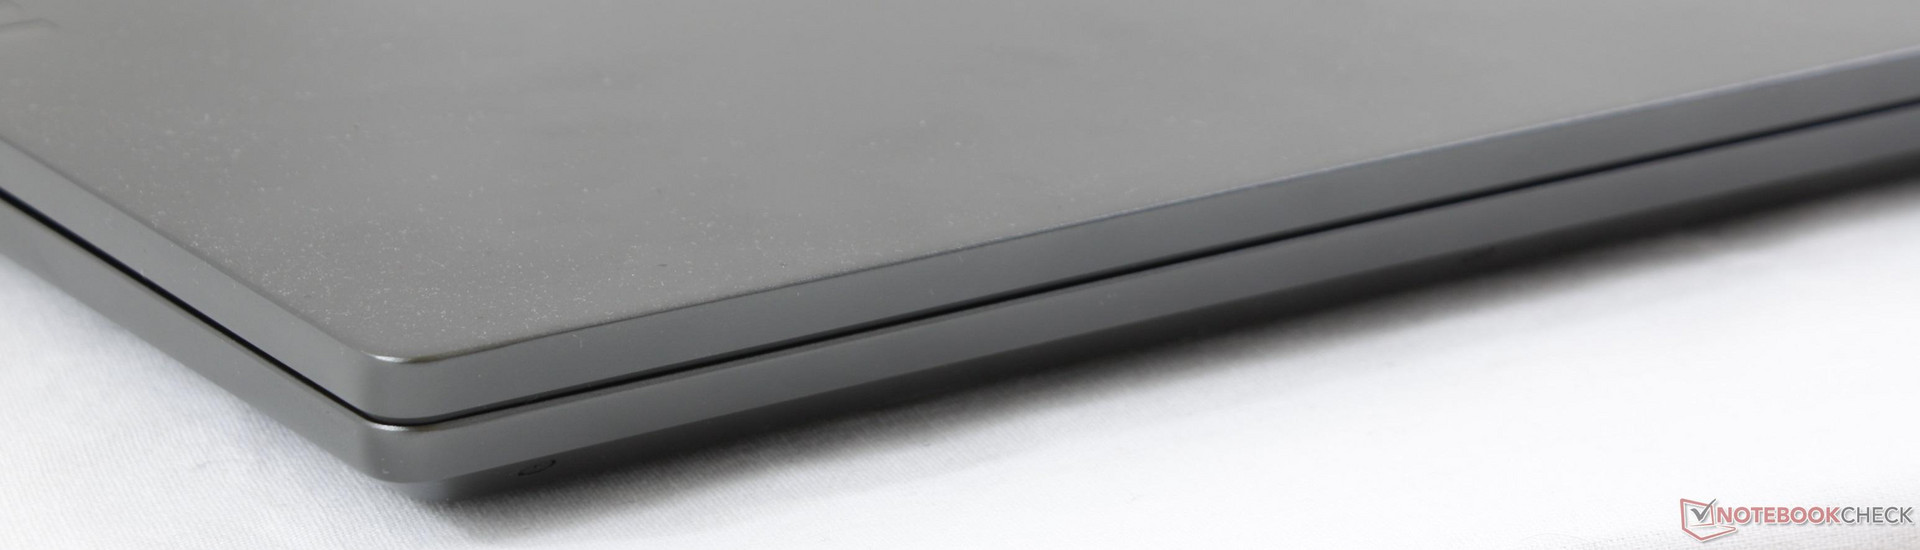
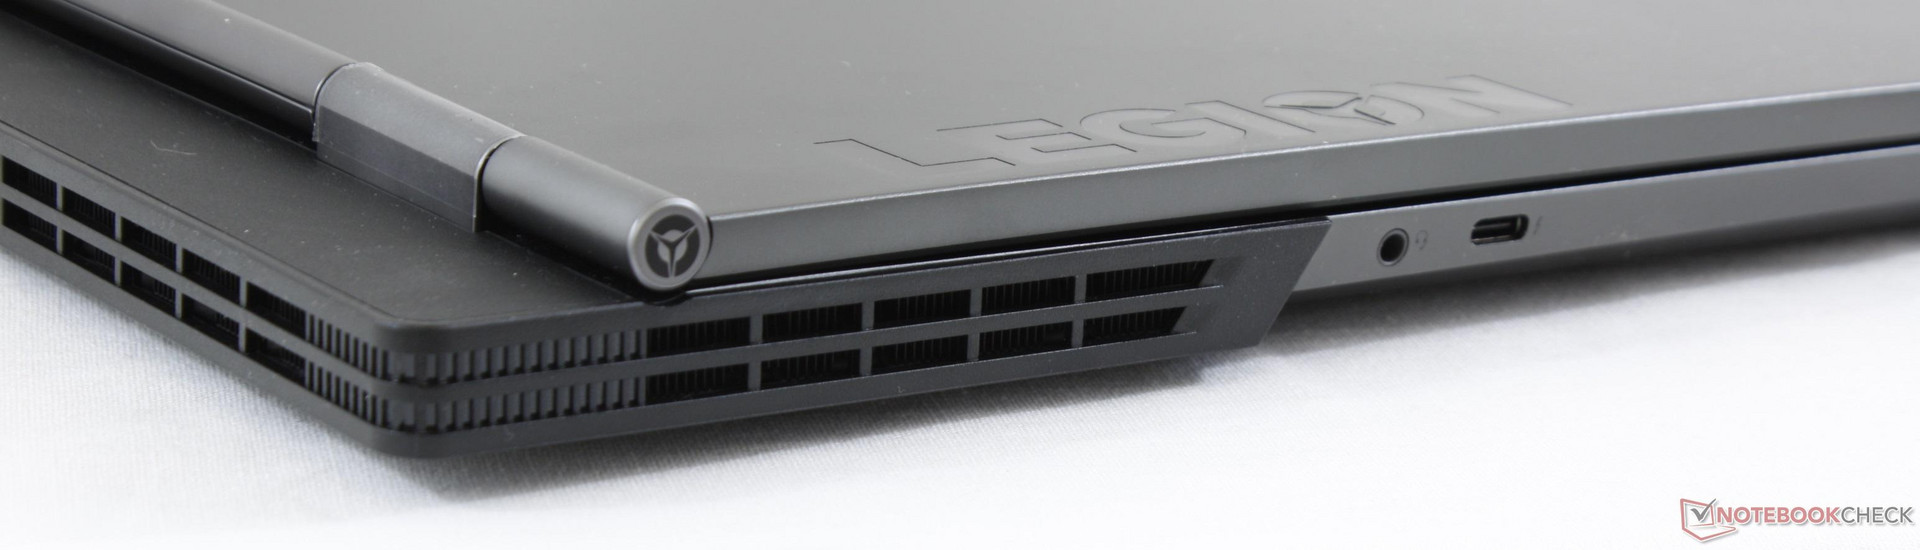
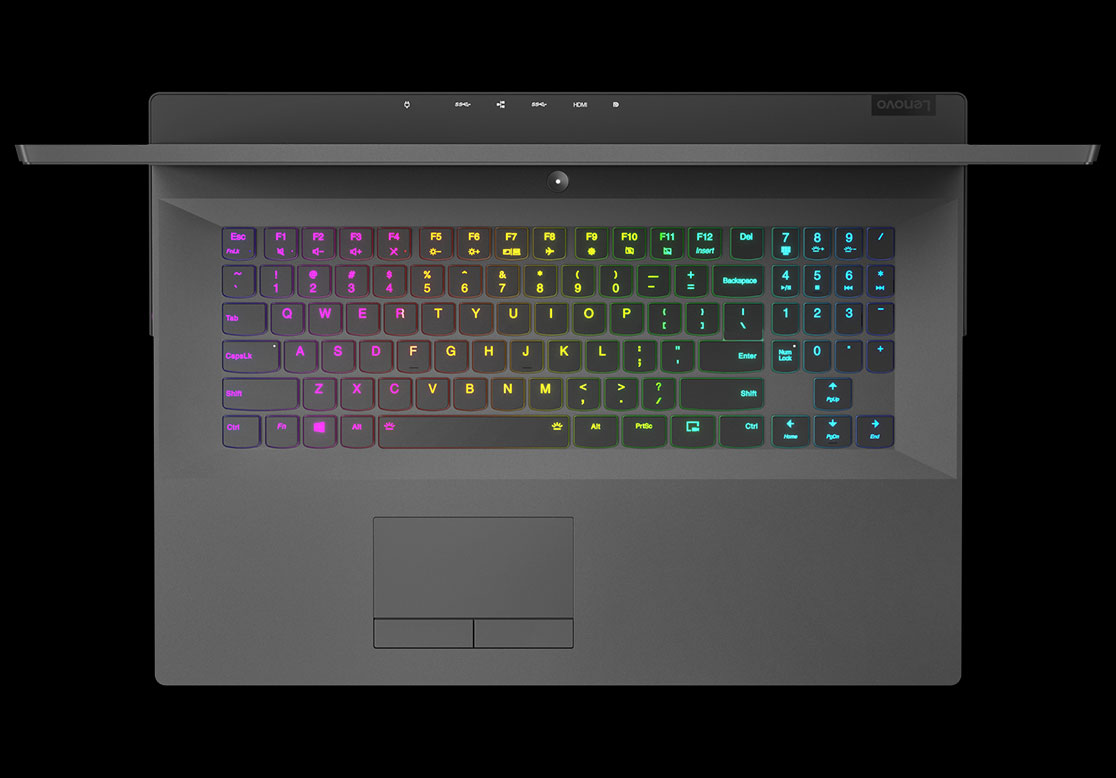
Legion Y730 och Y530 utgör de största förändringarna i Legion-familjen hittills. Den ledigare företags-fasaden står i kontrast med spelhårdvaran och LED-belysningen på undersidan, vilket ger en väldigt annorlunda framtoning än vad Asus ROG, Acer Predator och MSI G-serien har att erbjuda. På samma gång lyckas Y730 ändå kasta in en del lyx såsom Thunderbolt 3, förbättrad kylning och tangentspecifik RGB-belysning, vilket normalt sett är förbehållet "hardcore"-modeller. Det är en otypisk kombination som fungerar förvånansvärt bra för Y730.
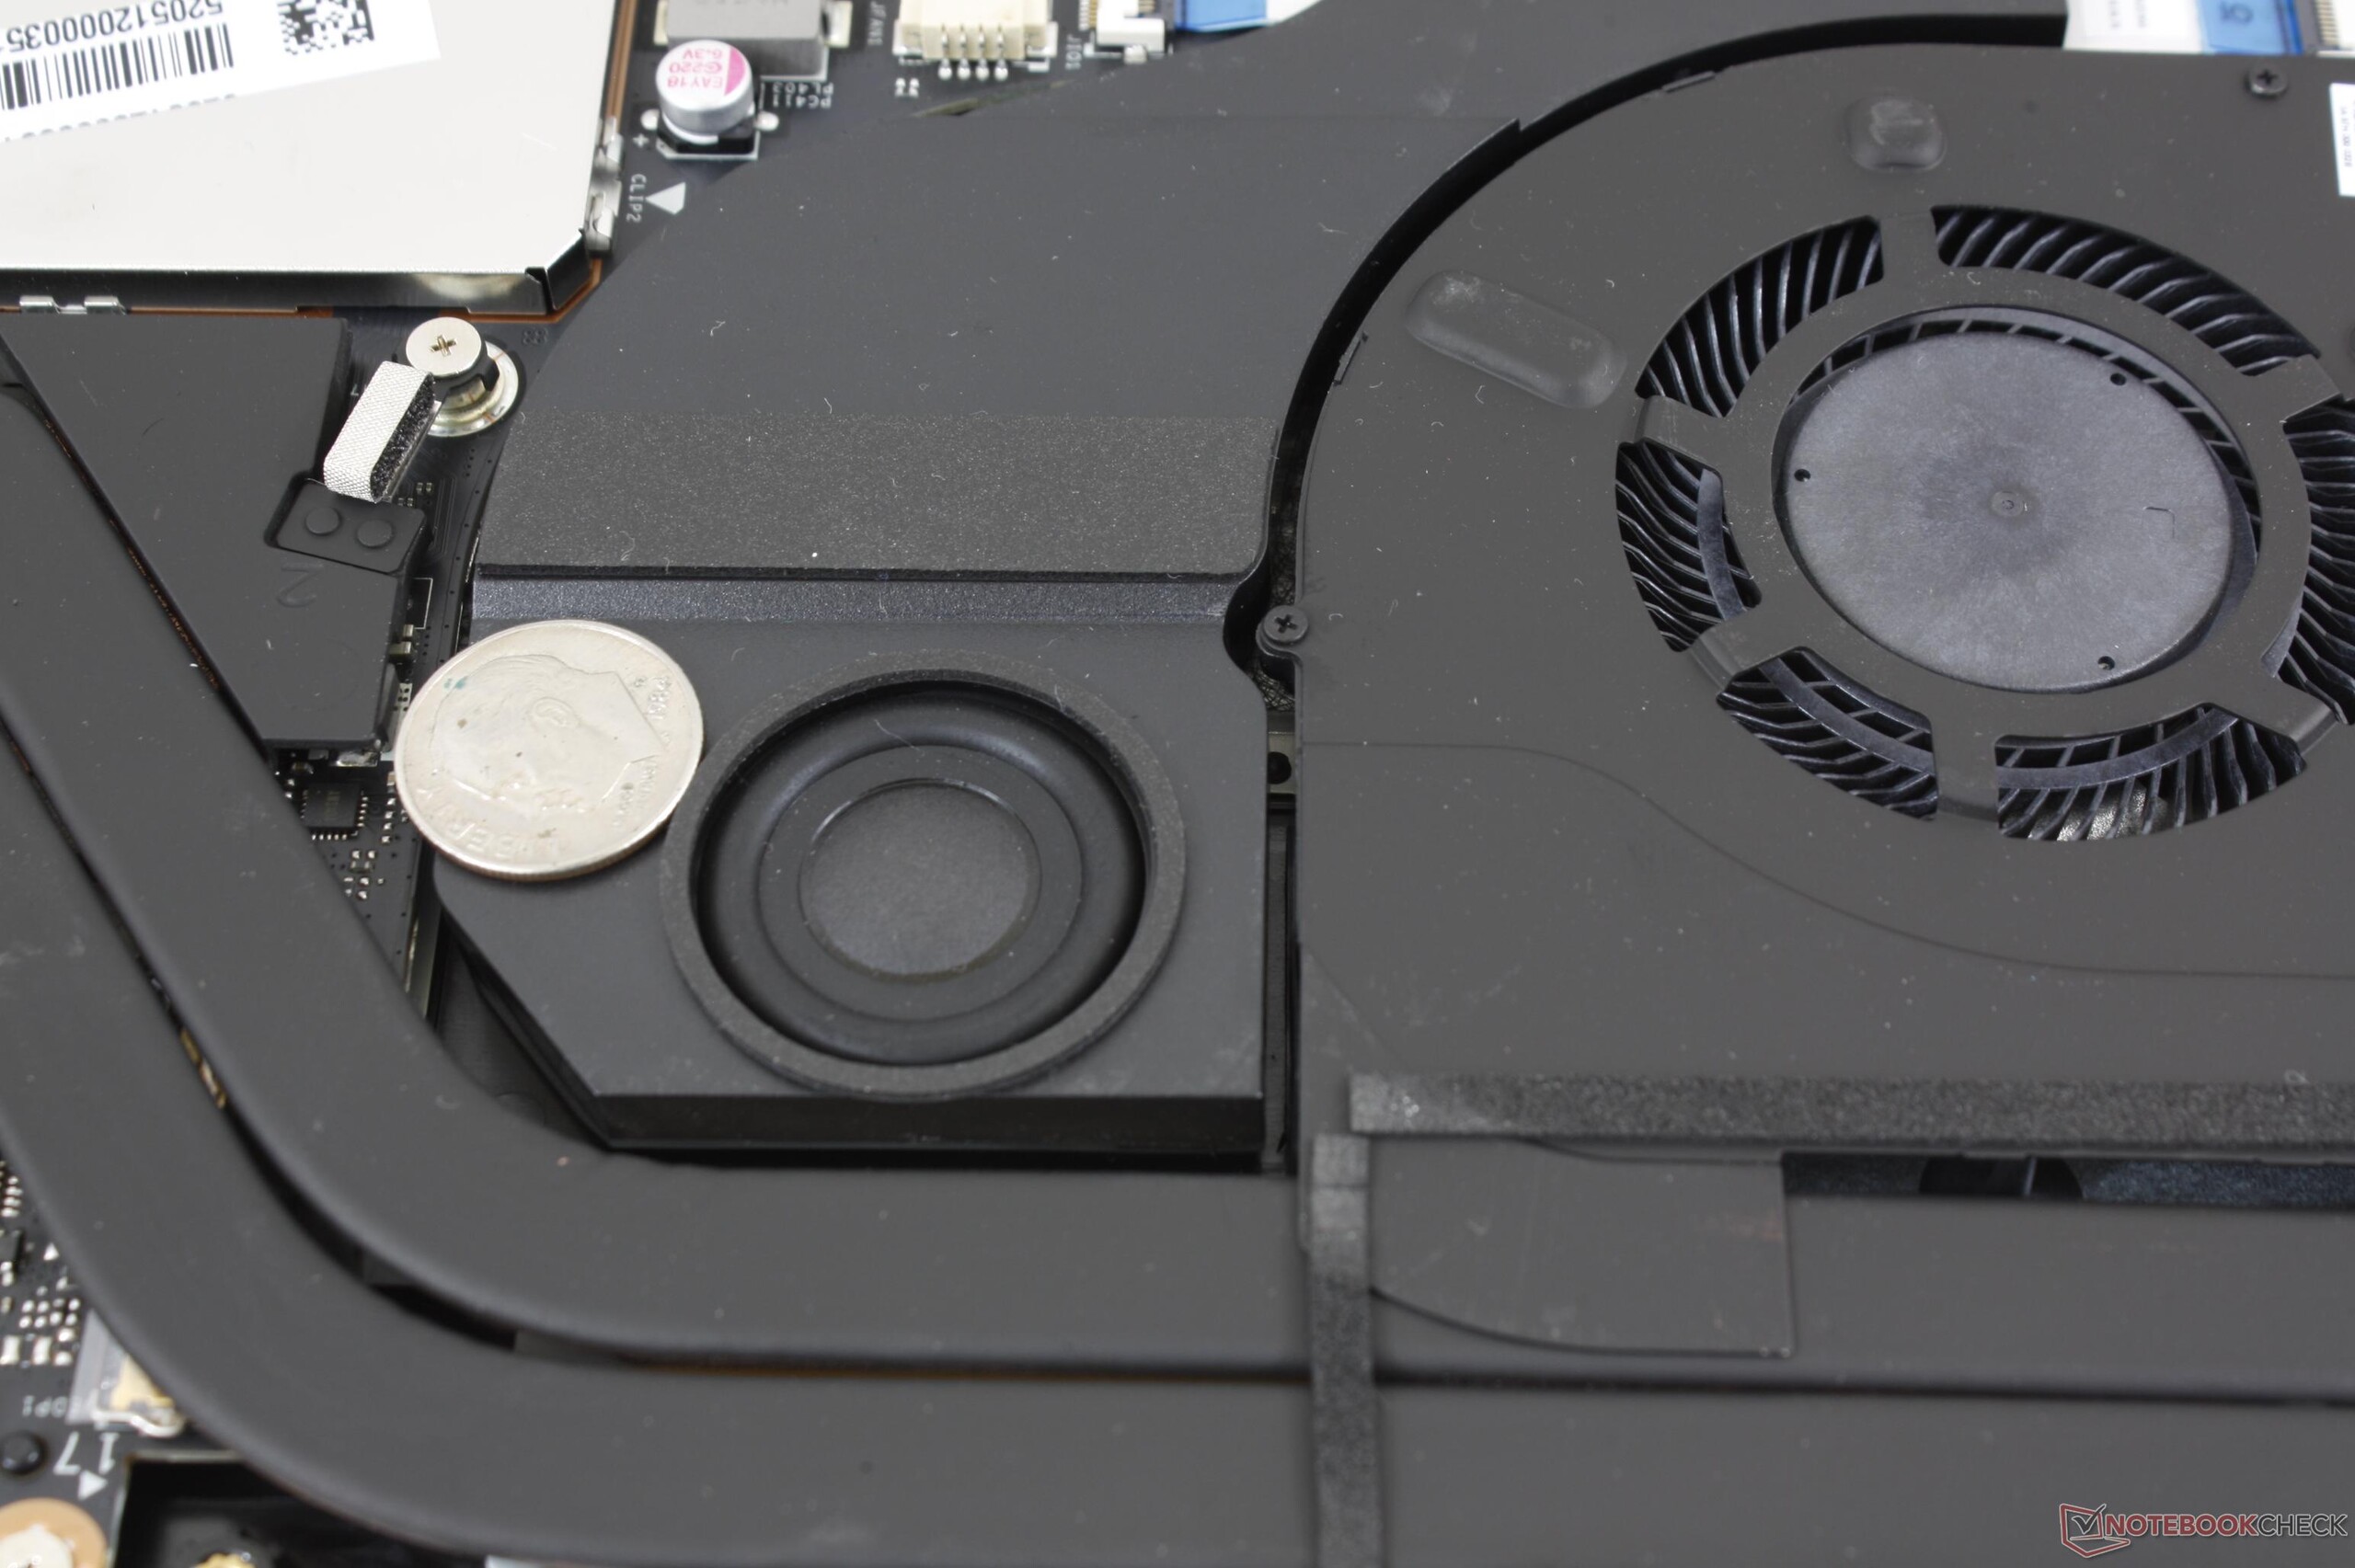
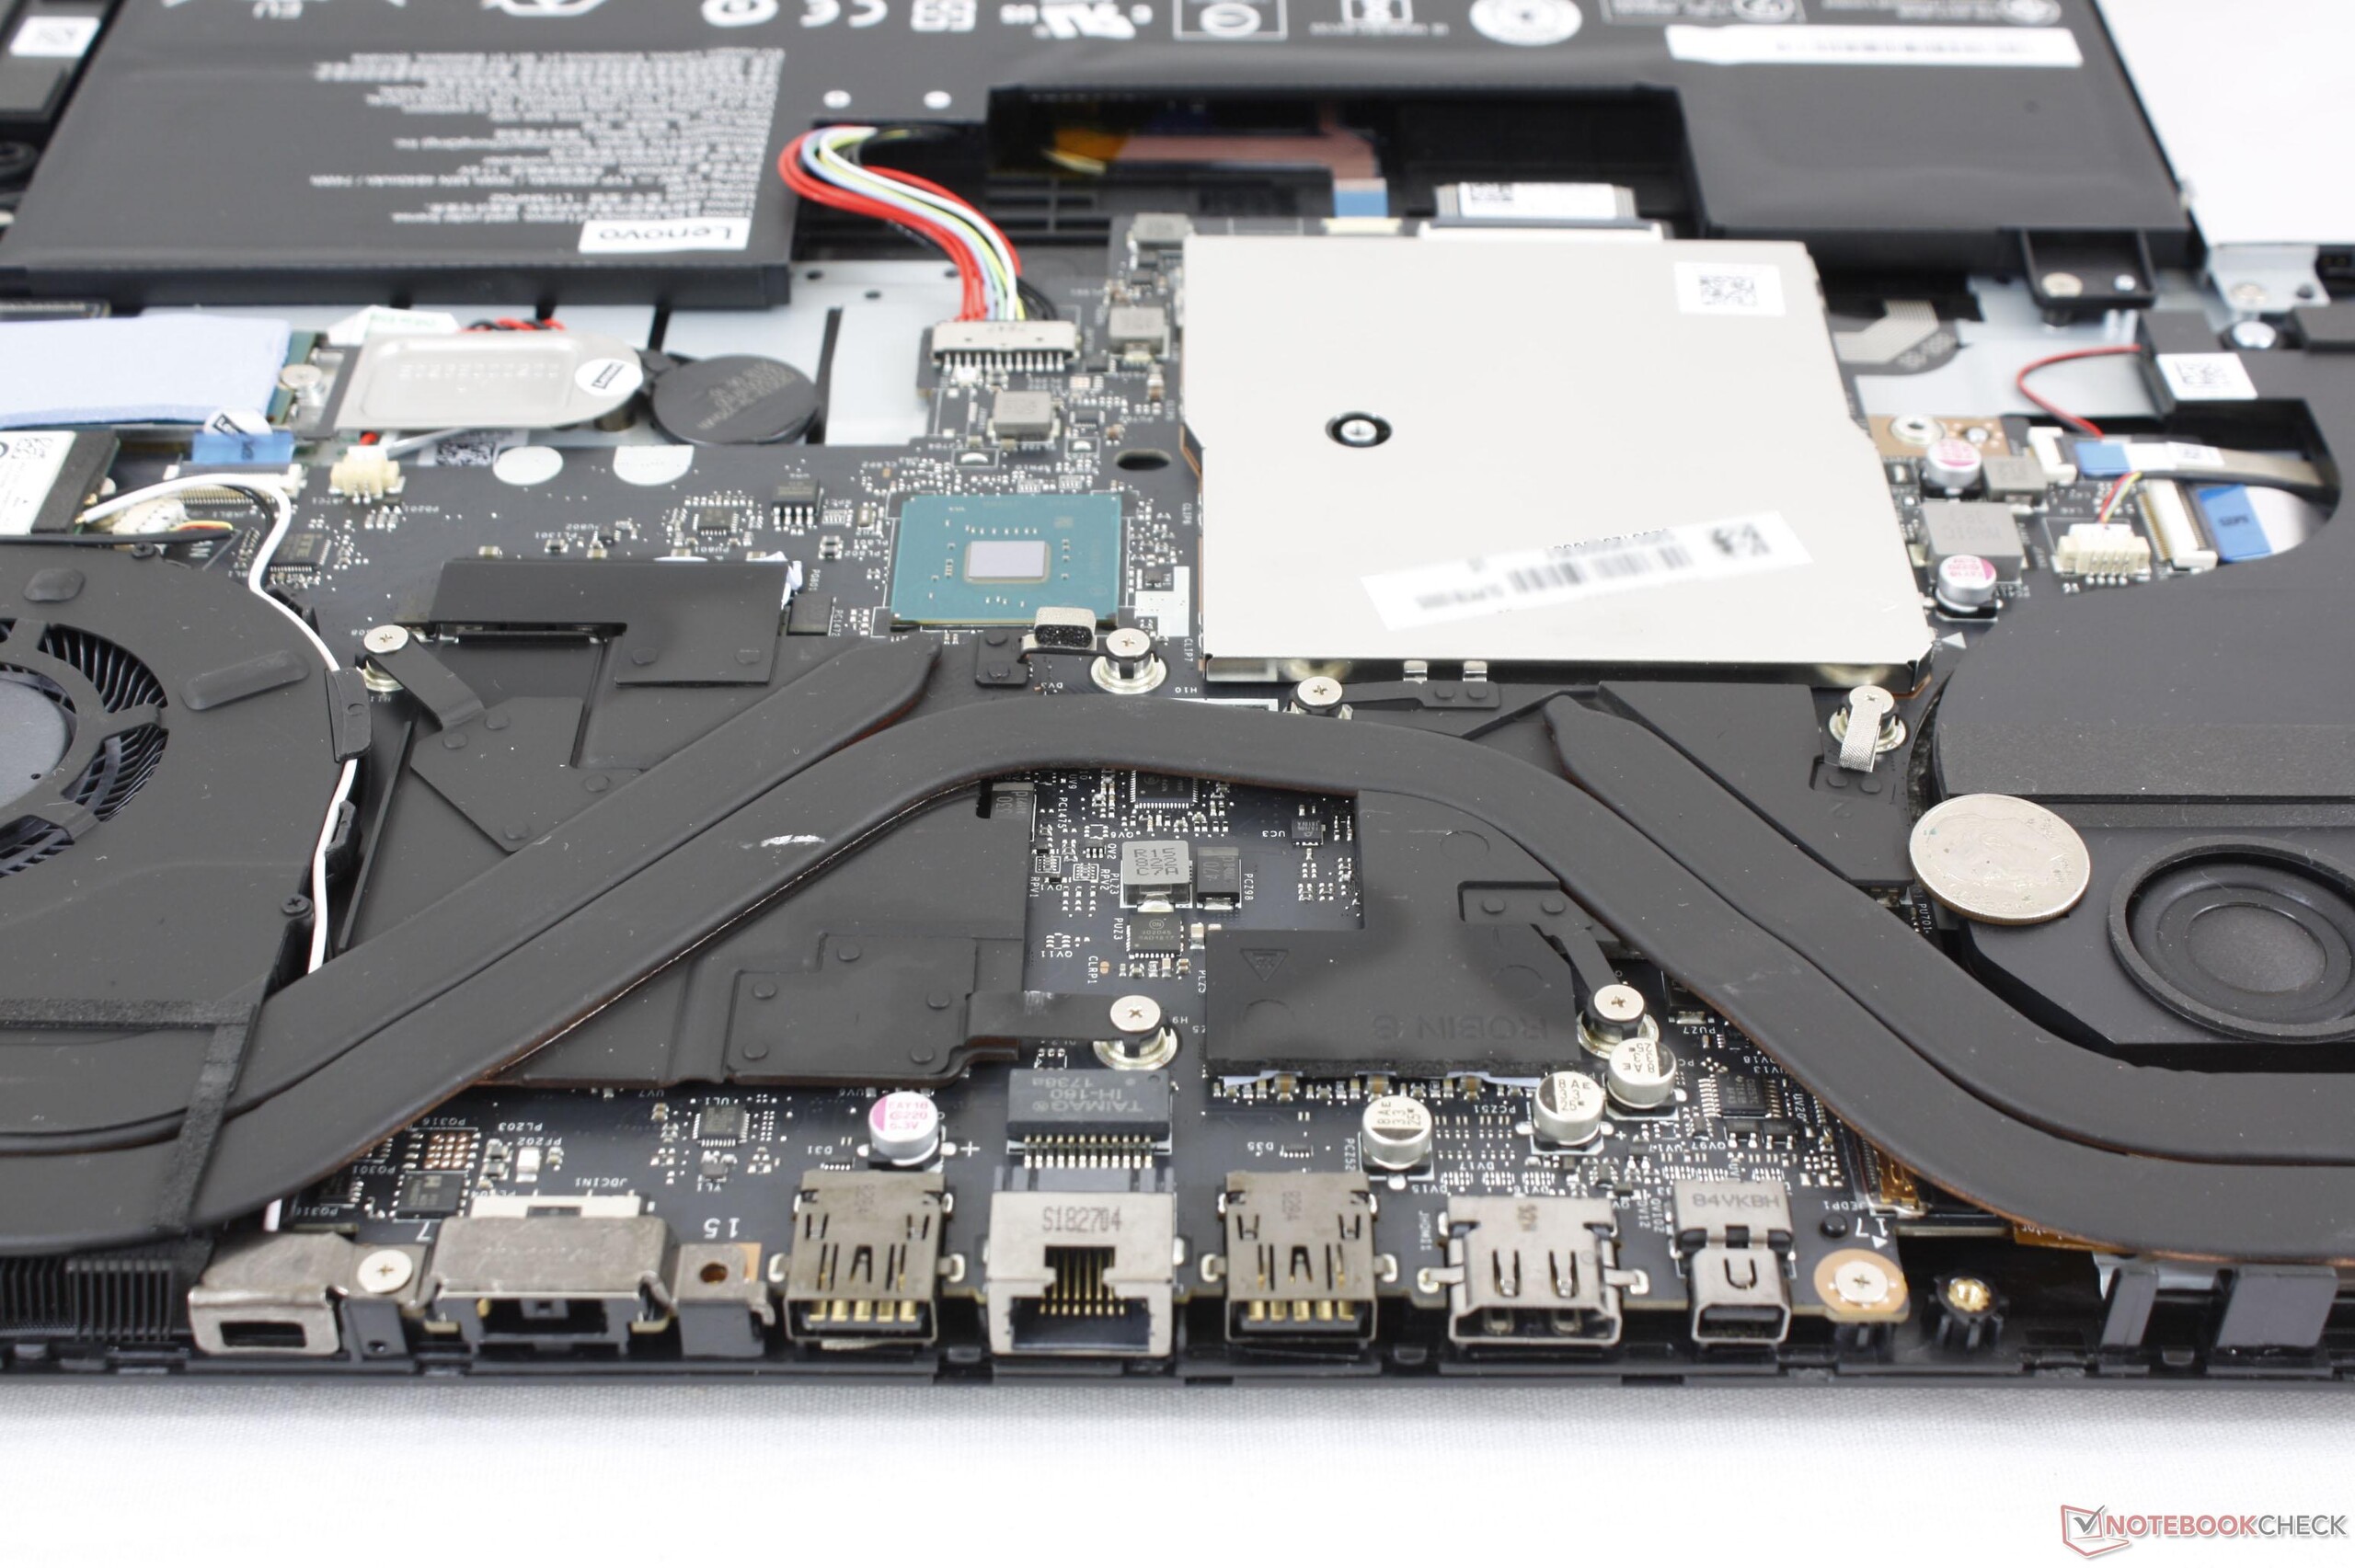
Utöver det visuella så är även prestandan på toppnivå. Dess CPU kan upprätthålla högre Turbo Boost-klockfrekvenser längre än en genomsnittlig Core i7-8750H och har även respektabla kärntemperaturer. Faktum är att med kärntemperaturer som håller sig runt 65 grader eller svalare vid spelande så kunde Lenovo ha minskat fläktarnas frekvens för en ännu tystare upplevelse. Högtalarna är utmärkta, den håller länge på batteri och den vanliga 60 Hz IPS-skärmen är perfekt med tanke på GPU:n.
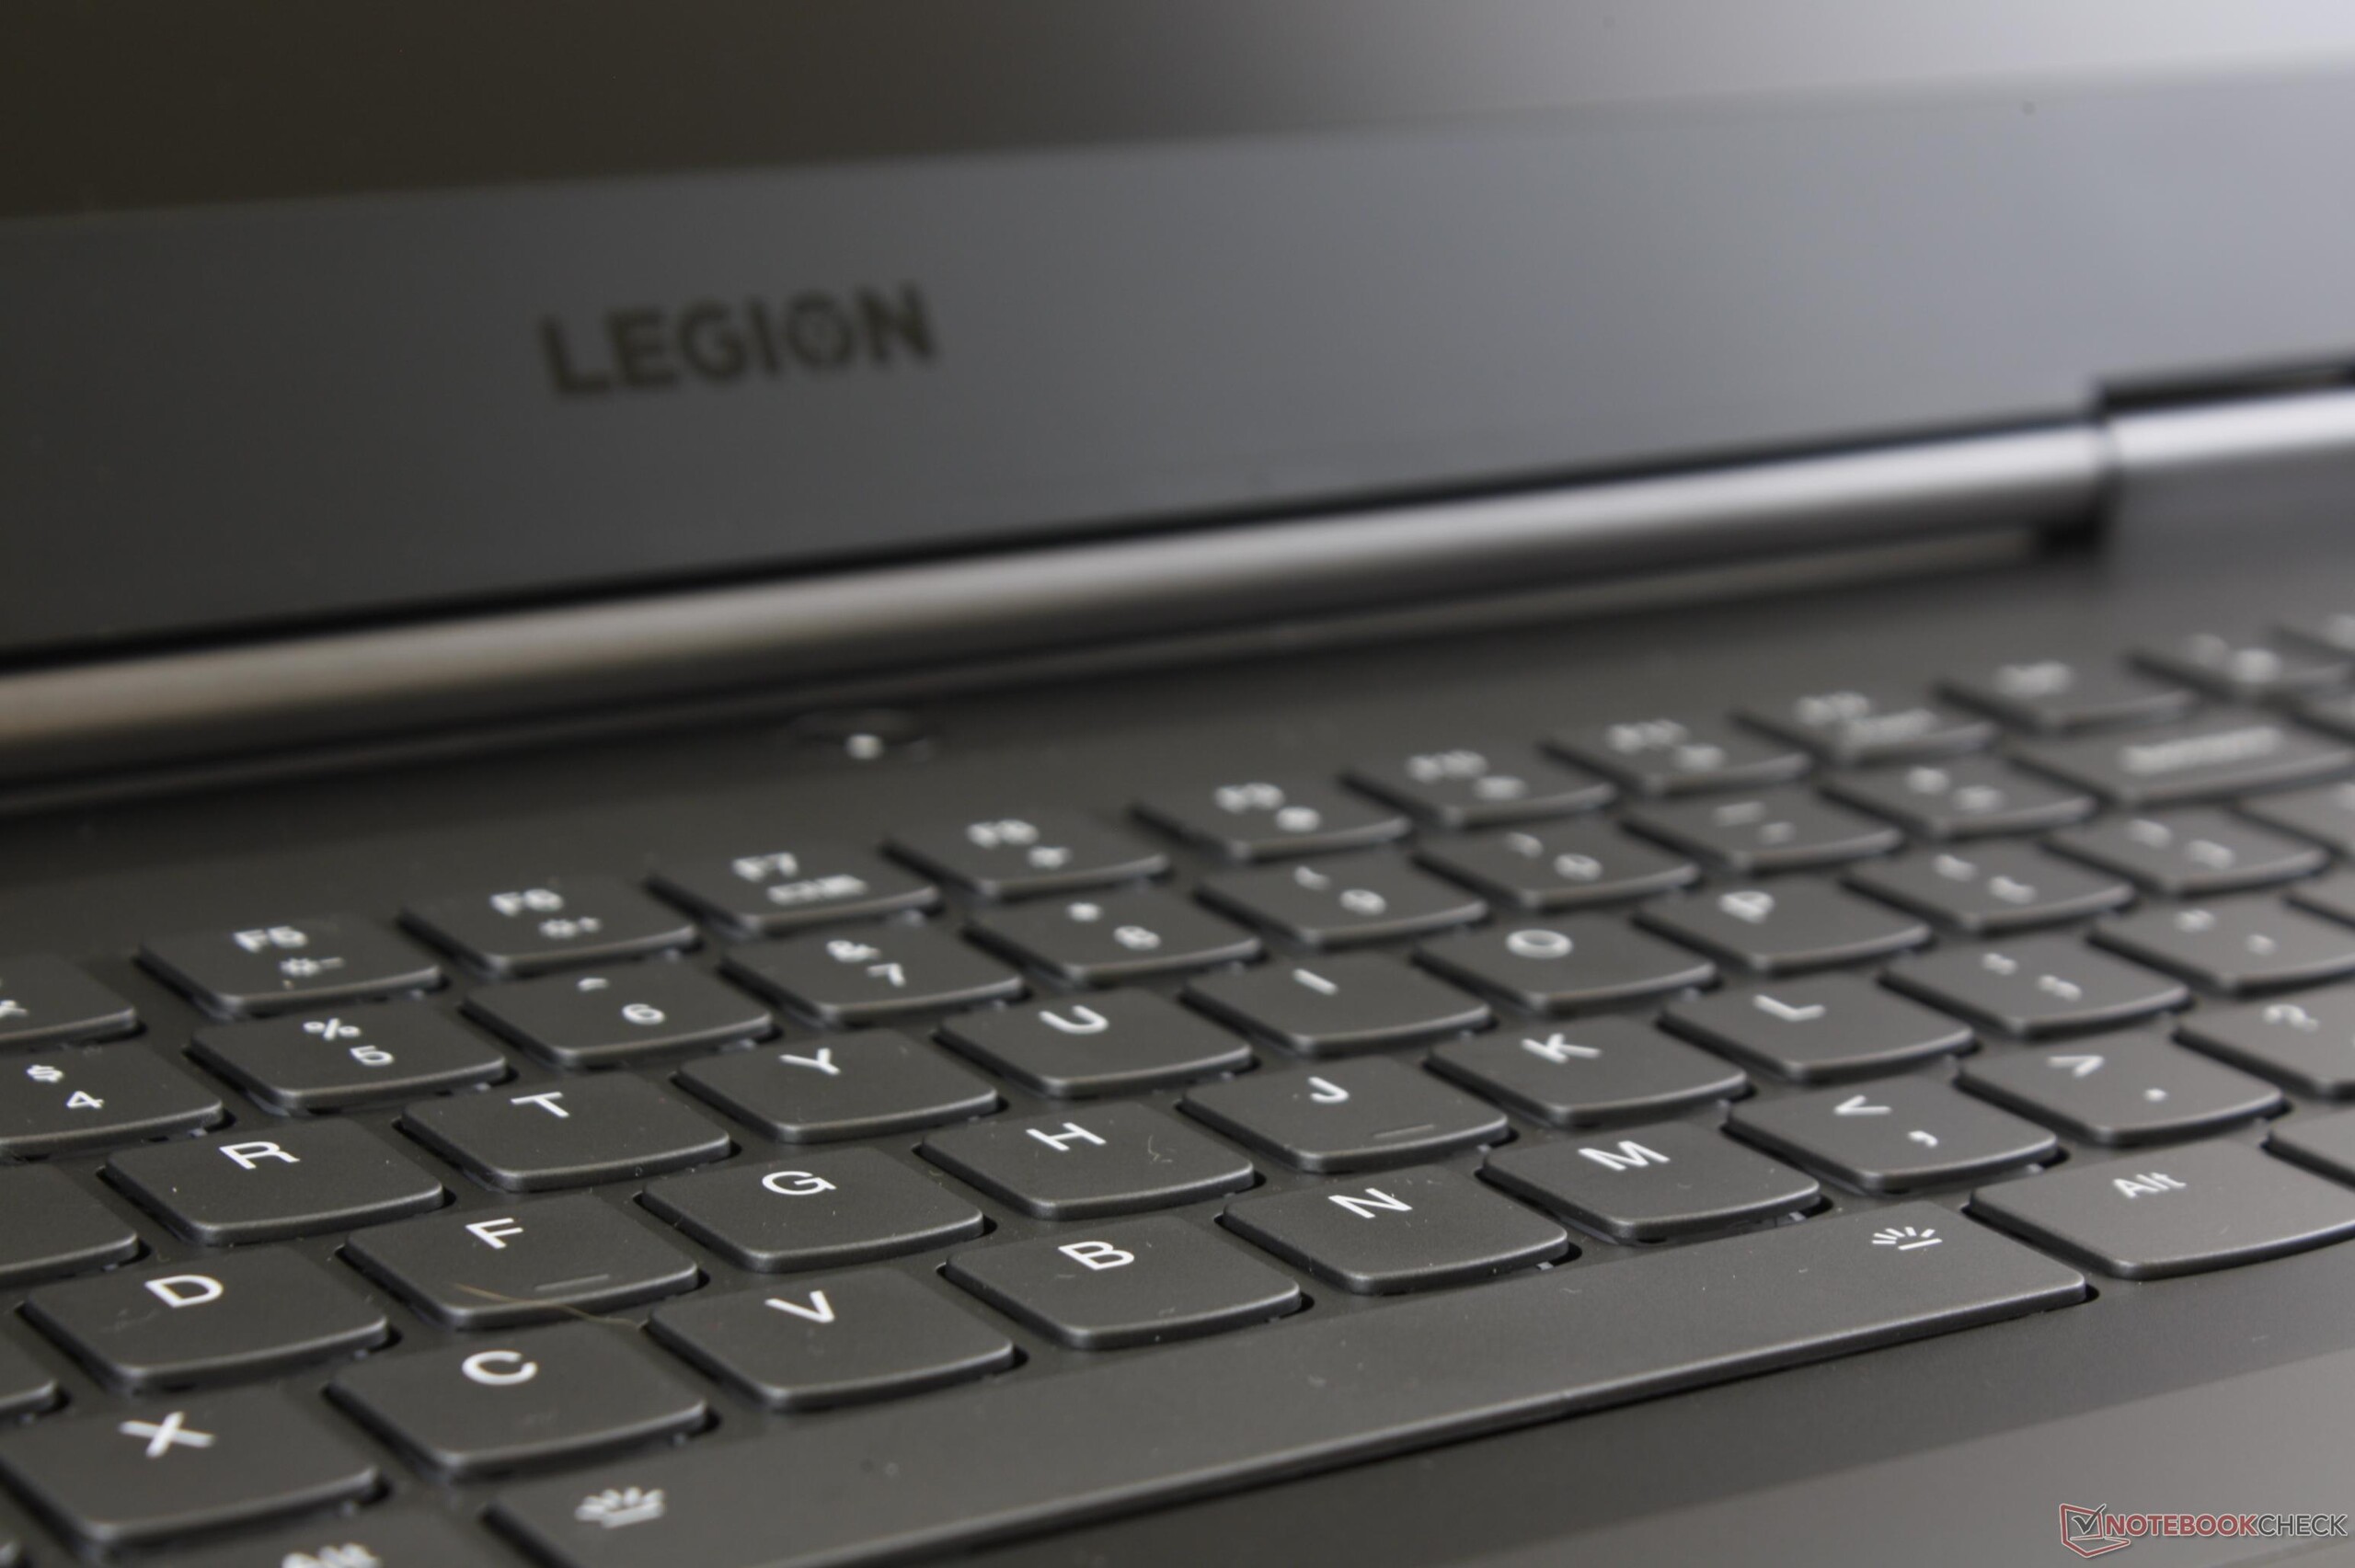
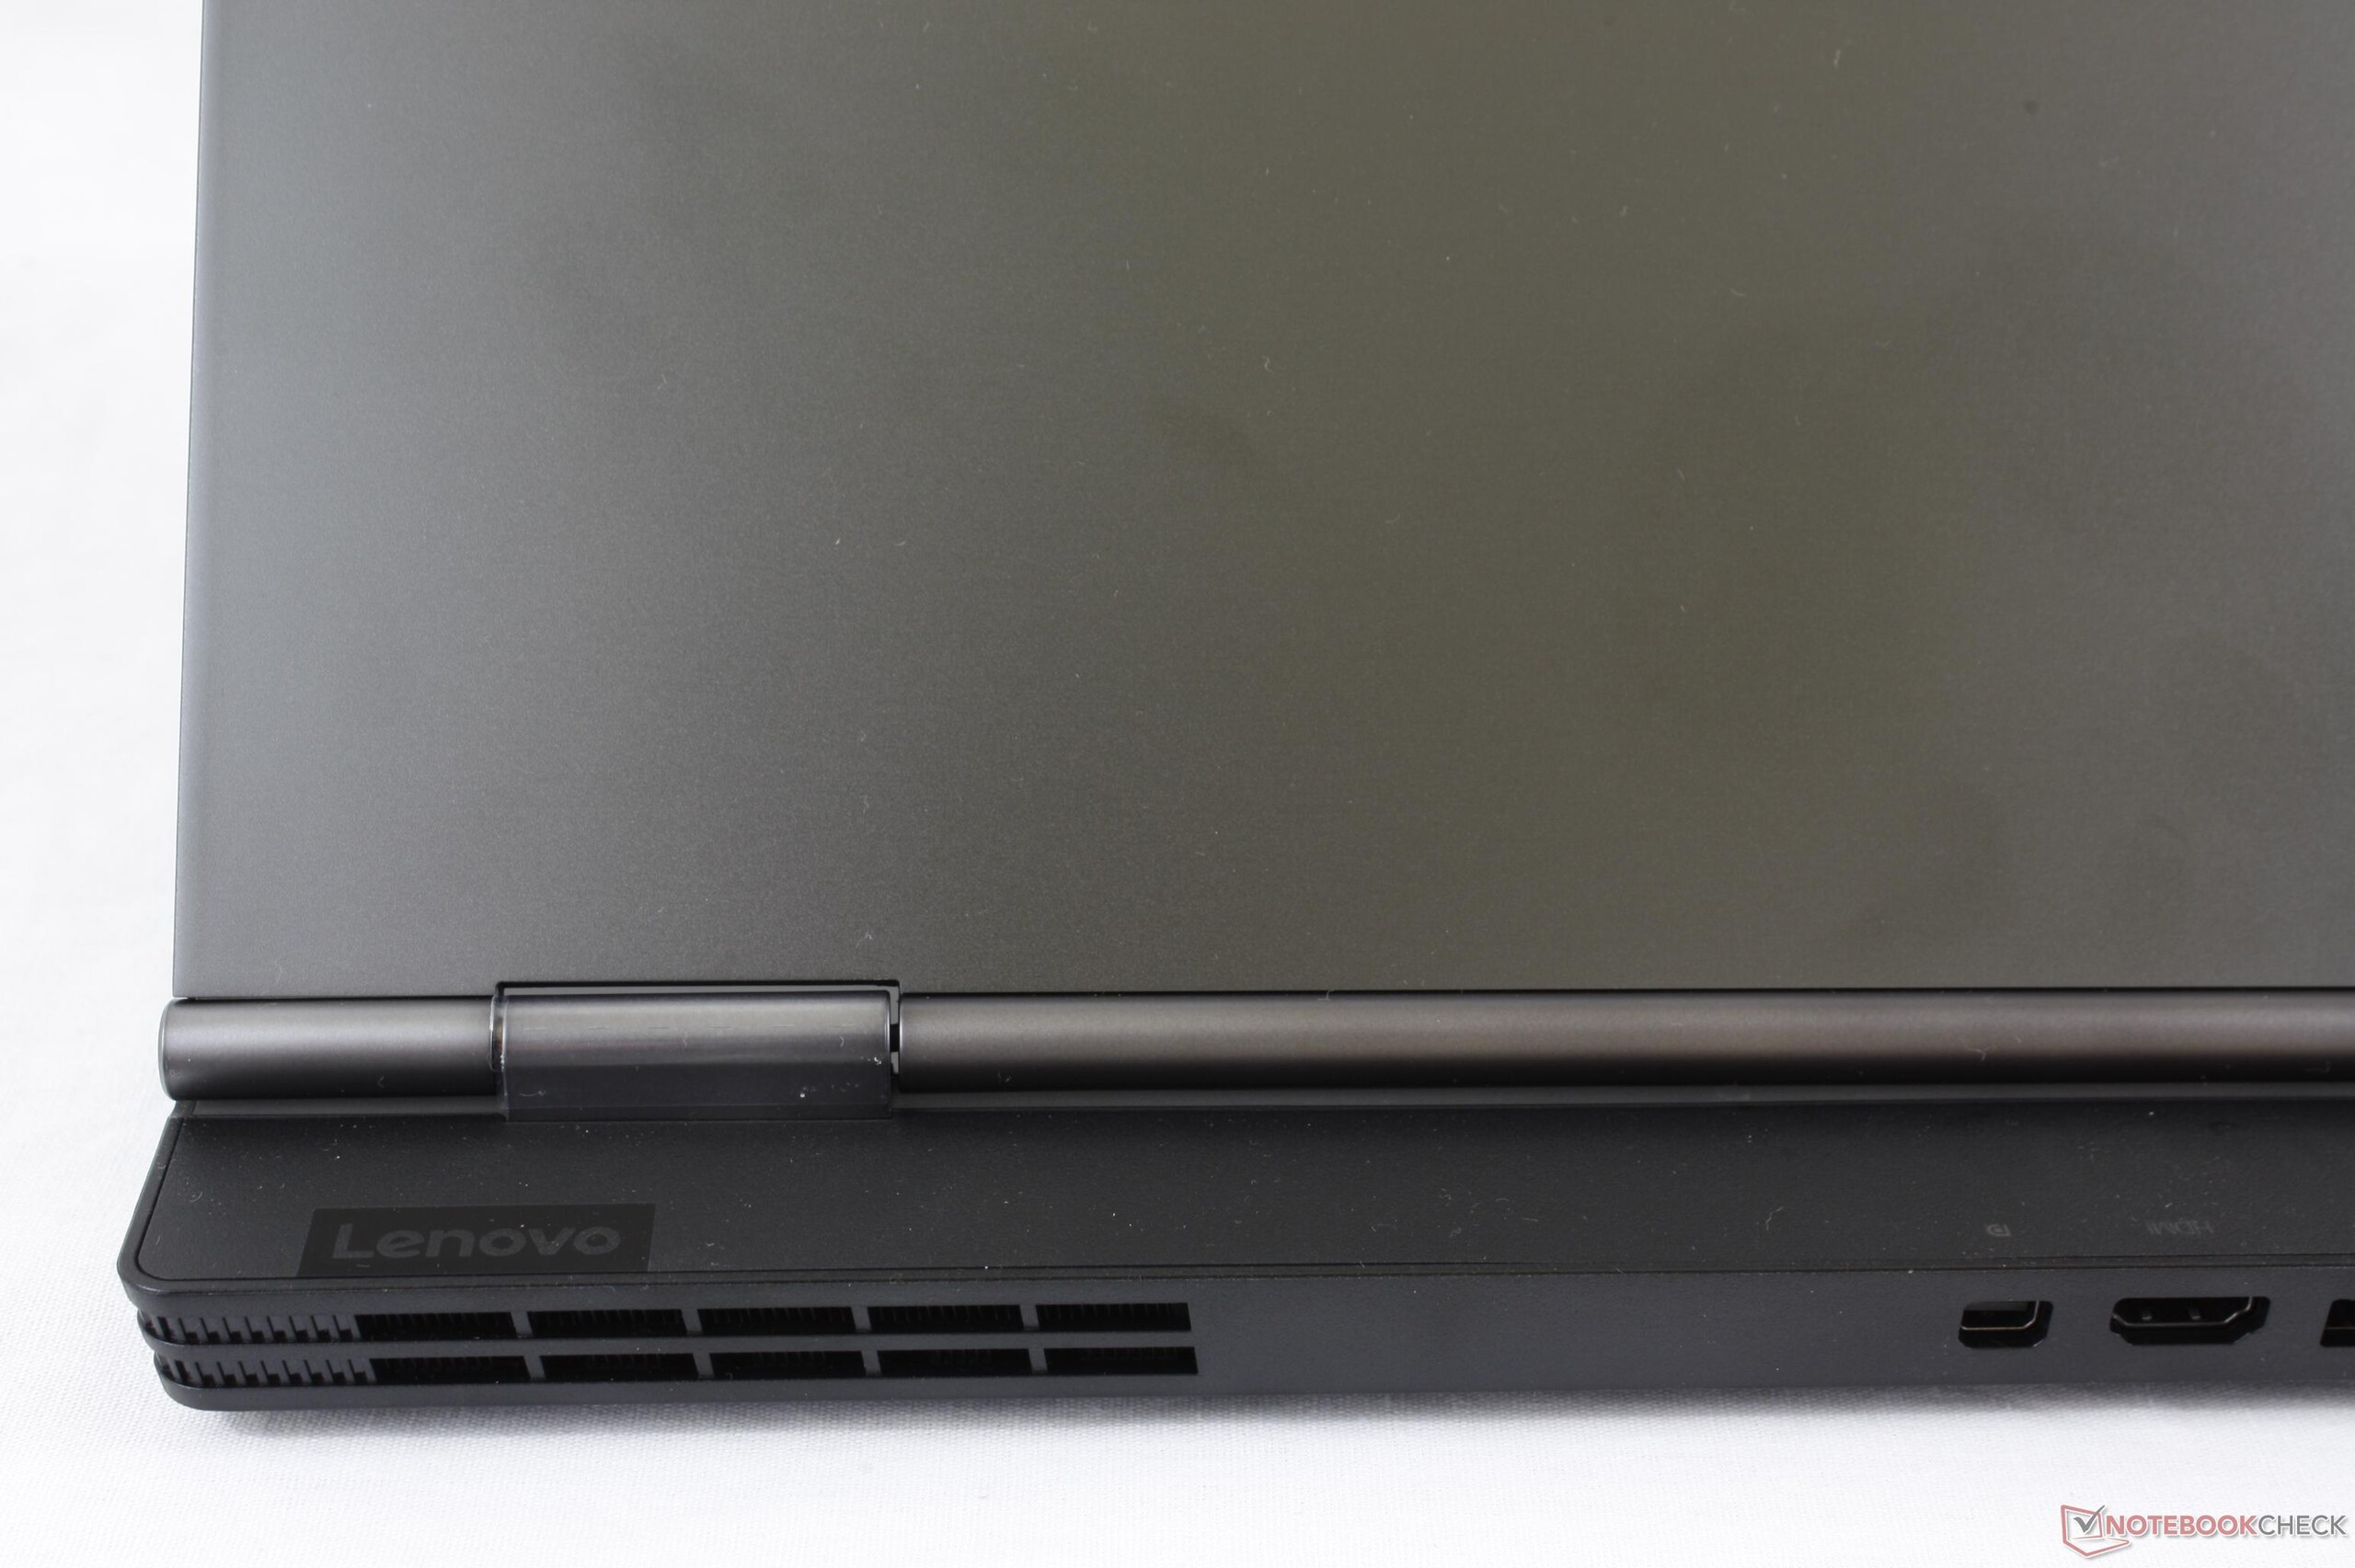
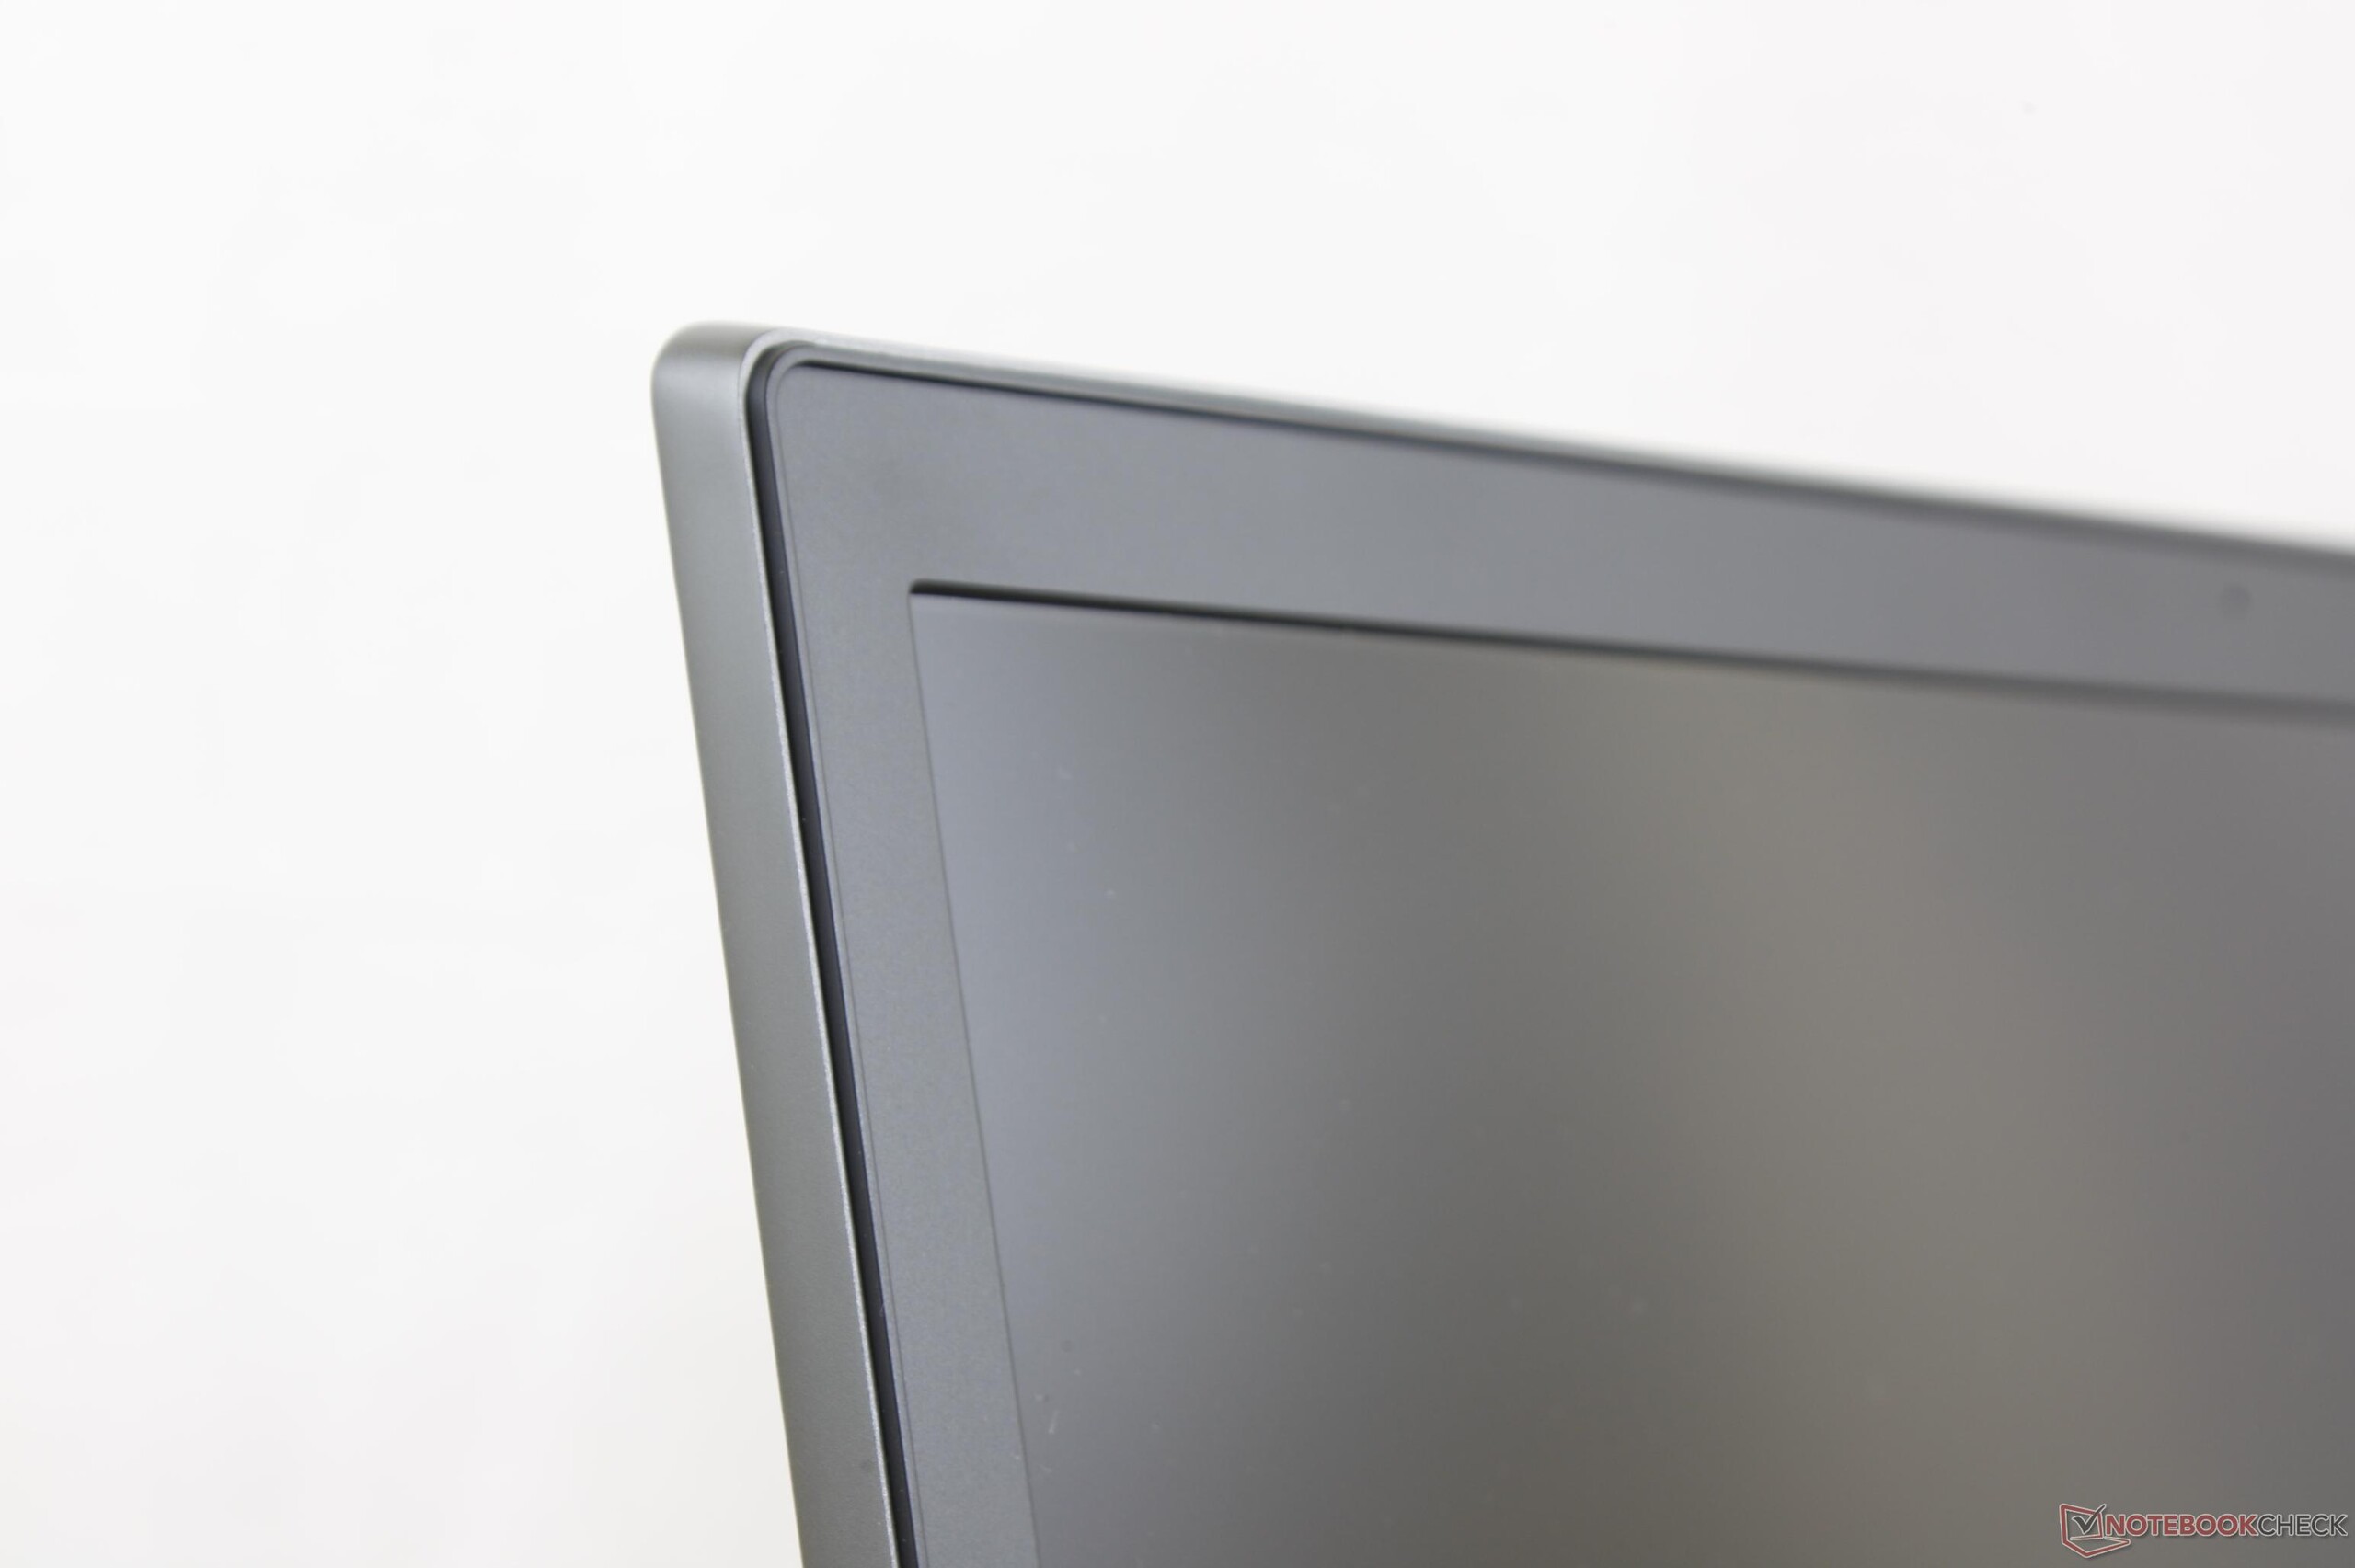
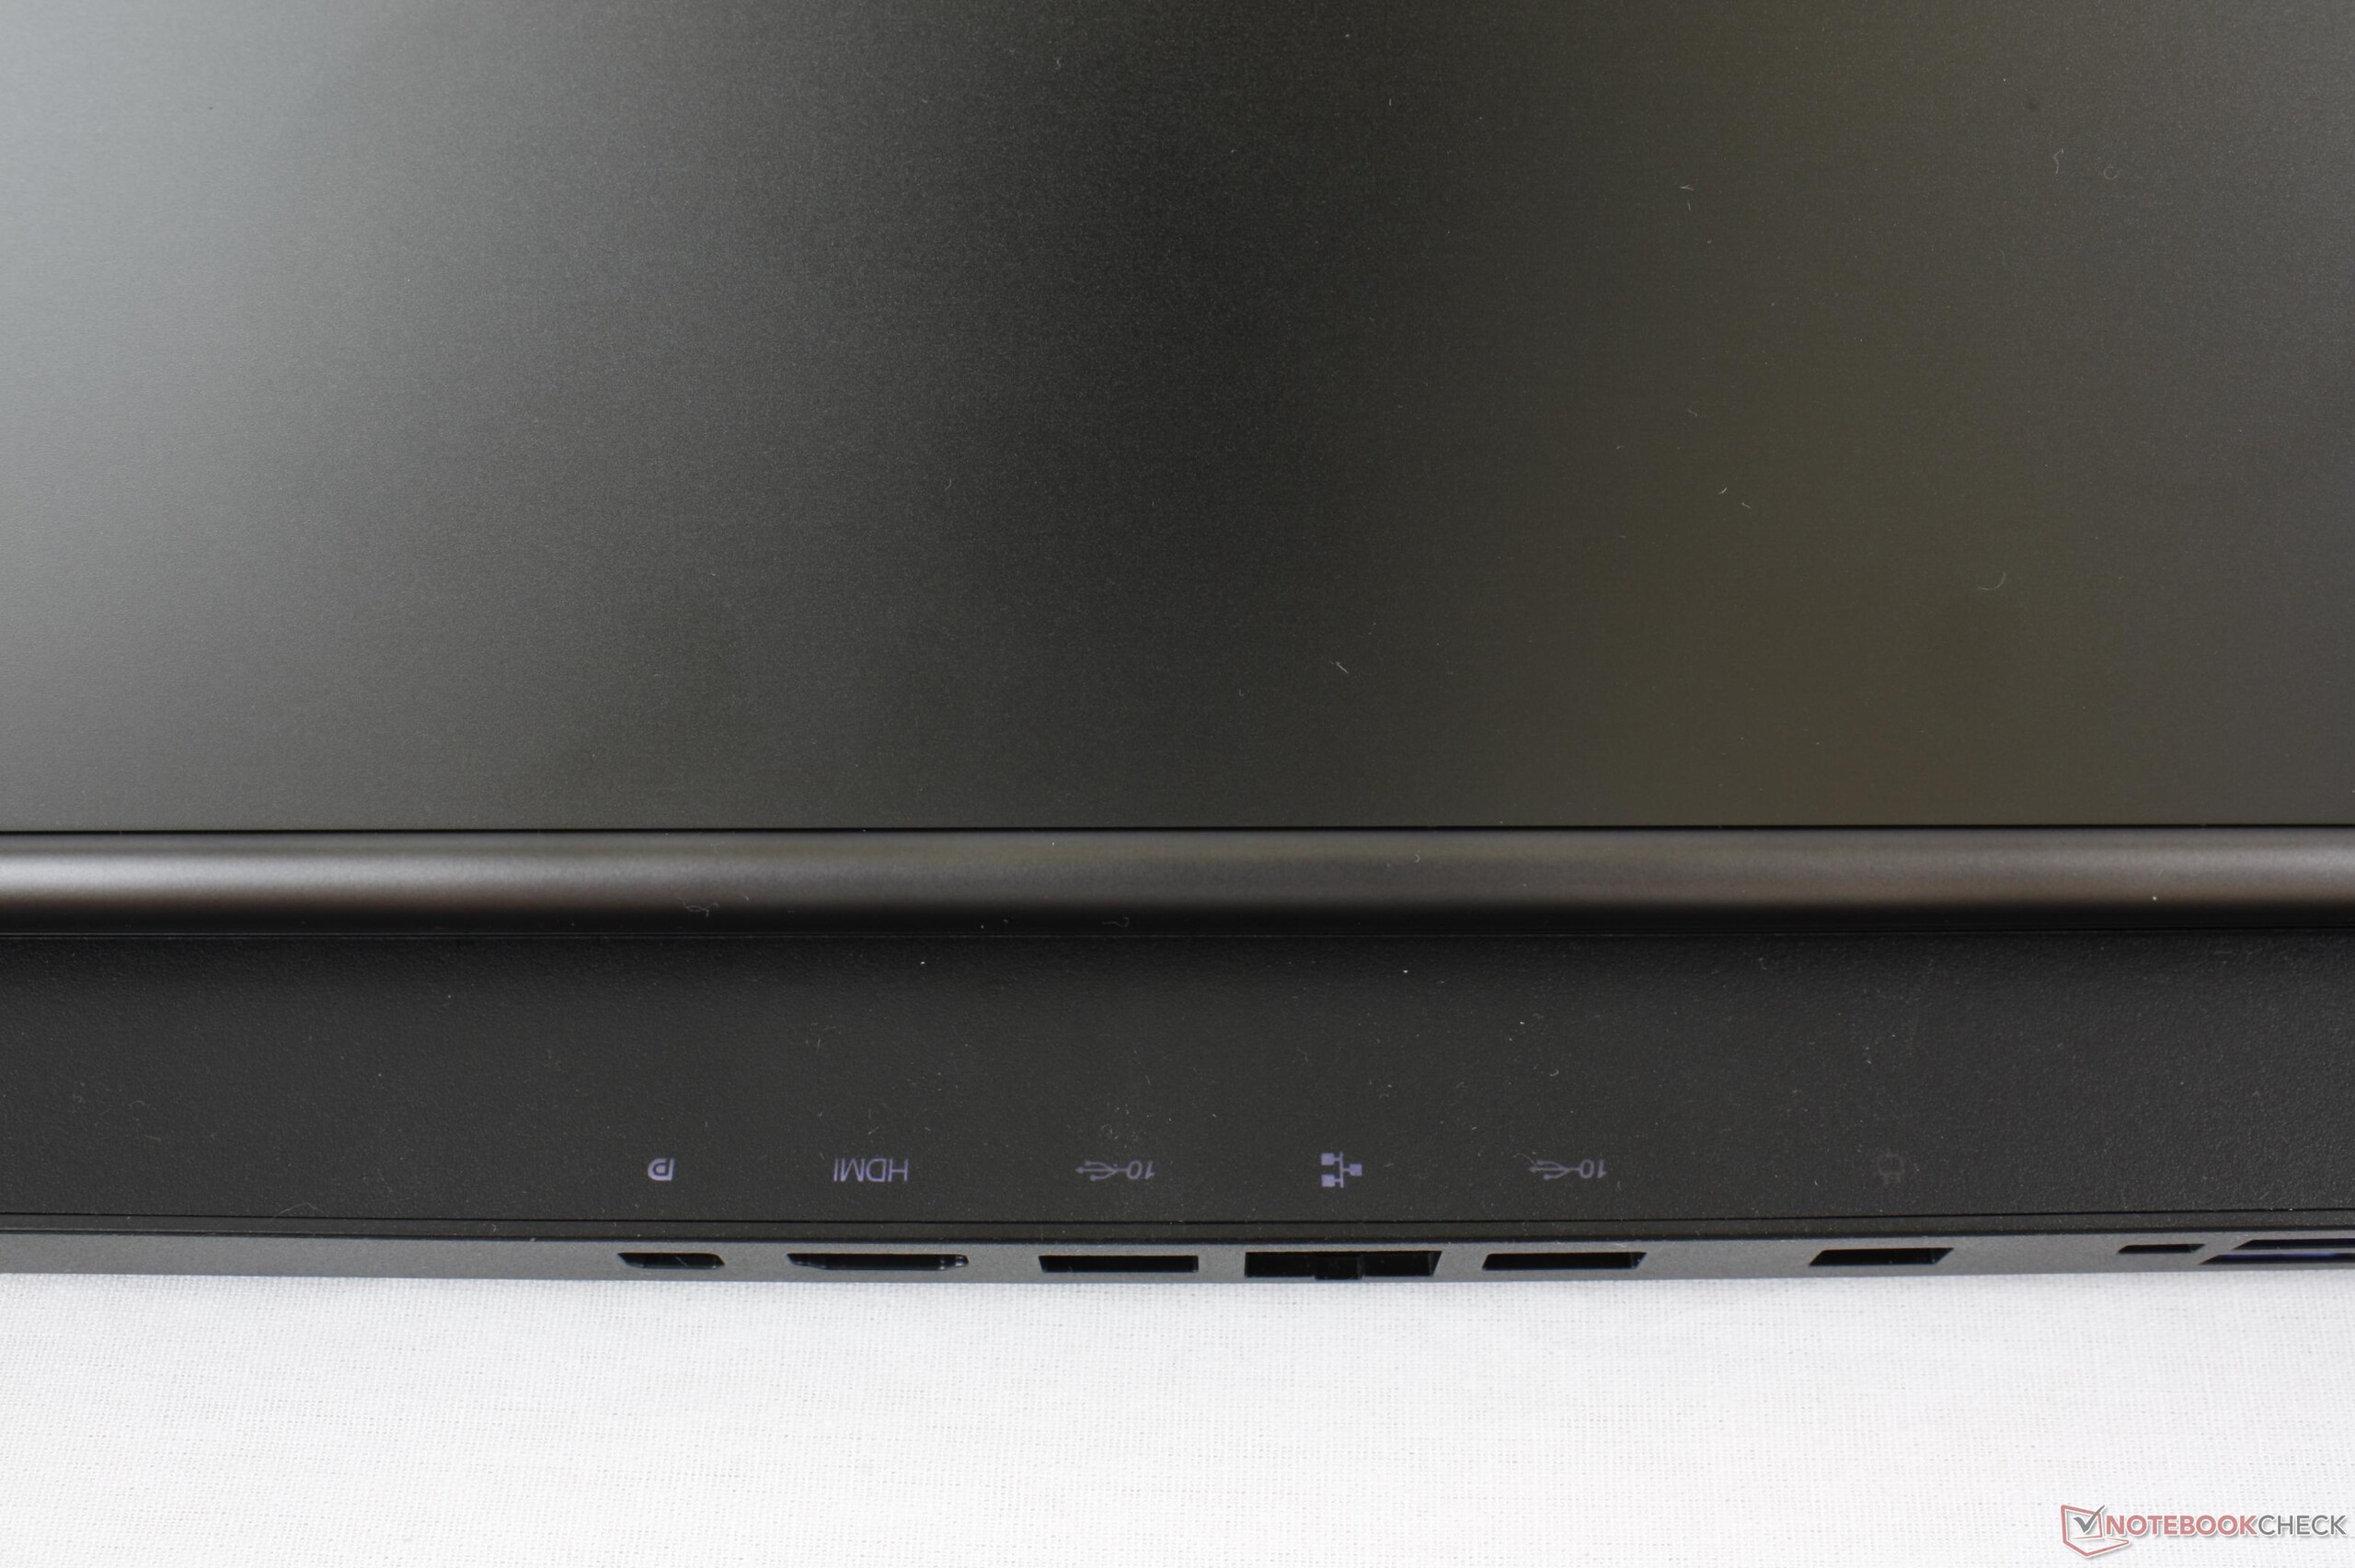
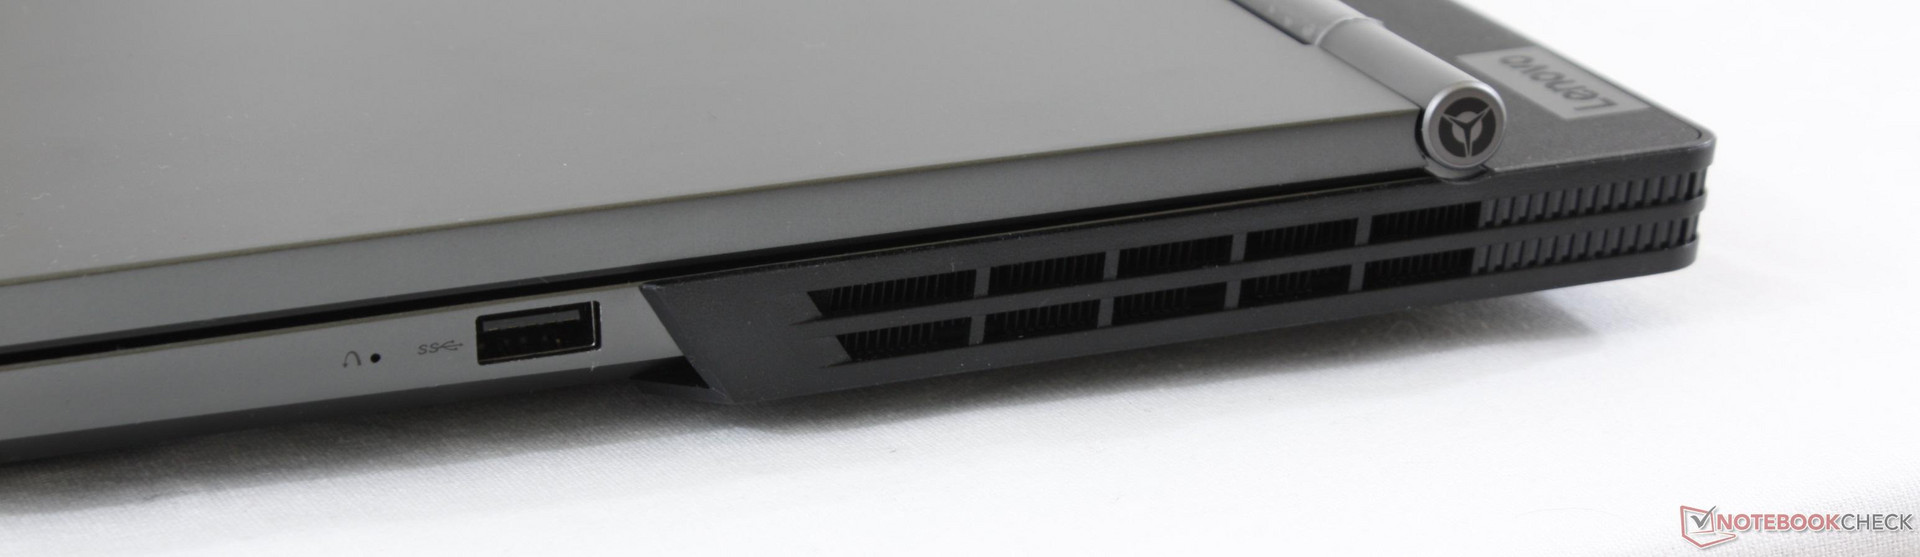
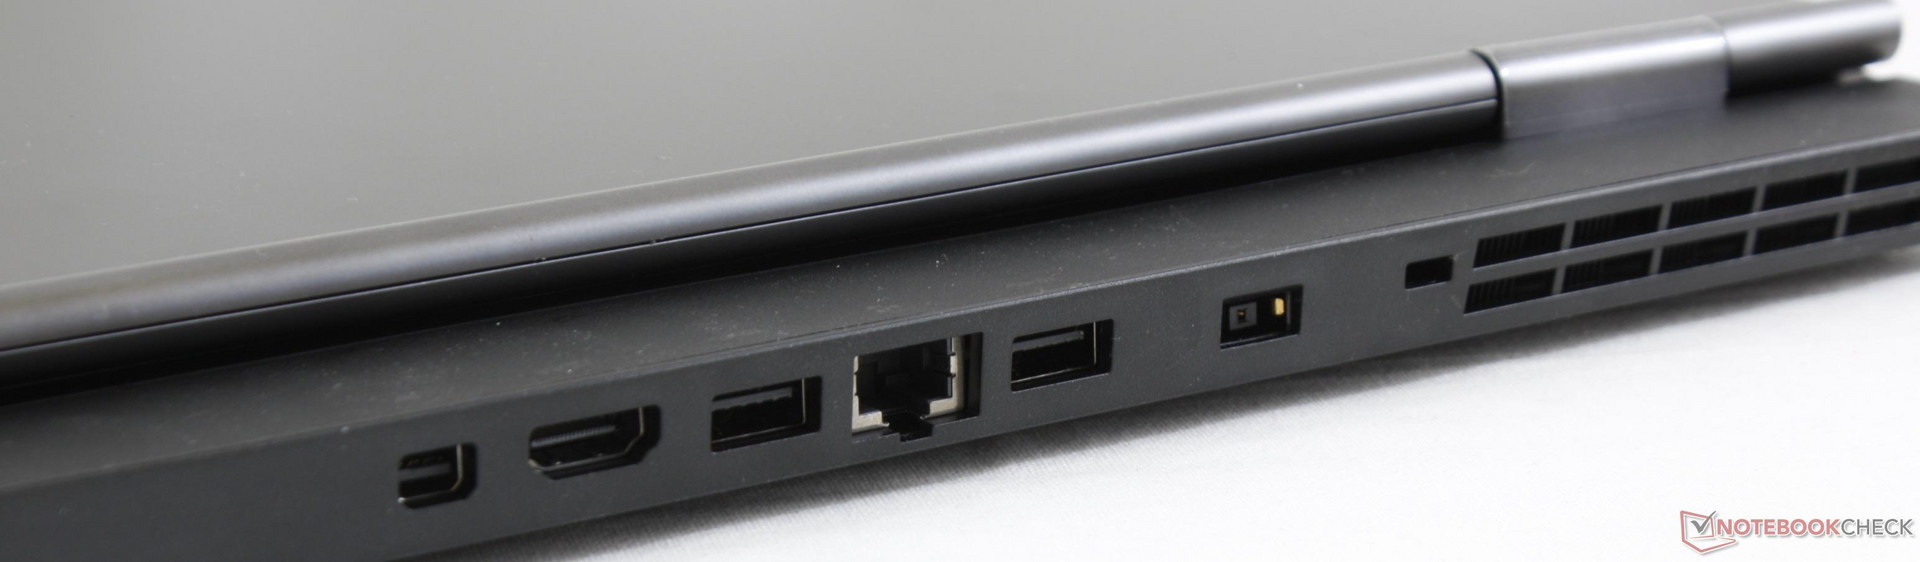
Det finns fortfarande rum för förbättring. Fläktkontroller som går att ställa in mer i detalj, bättre placering av portarna, tunnare infattning och fastare tangentåterkoppling hade gjort systemet till ett ännu bättre köp för utgångspriset på 11.000 kronor. Starkare gångjärn är utan tvekan nära toppen på vår lista precis som fler GPU-alternativ, exempelvis för GTX 1060 eller 1060 Max-Q. Det finns definitivt potential för Legion-serien att utmärka sig ytterligare jämfört med en traditionell spellaptop.
Legion Y730 lyckas förvånansvärt väl med att balansera ett ledigt företagsutseende med spelfunktioner från toppskiktet trots att den har ett lägre utgångspris än de flesta andra. Om du behöver tänka på budgeten är den enklare SKU:n med Core i5-8300H att rekommendera då i7-8750H inte kommer att förbättra spelprestandan nämnvärt när den kombineras med ett GTX 1050 Ti.
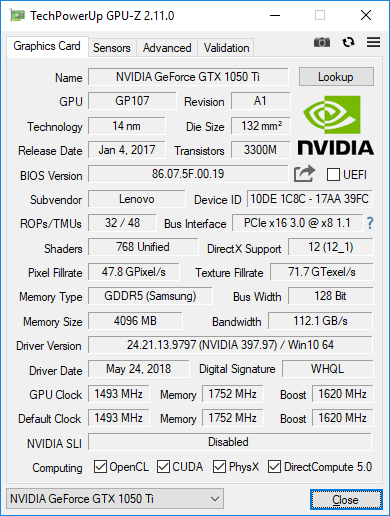
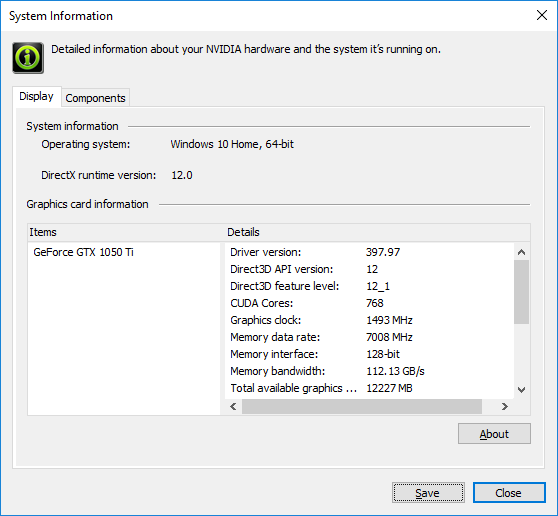
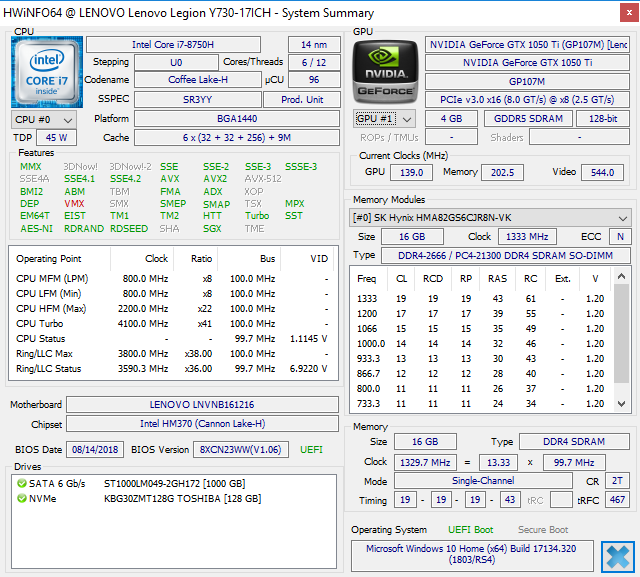
Lenovo Legion Y730-17ICH, i7-8750H
- 09/20/2019 v7 (old)
Allen Ngo
Price comparison
