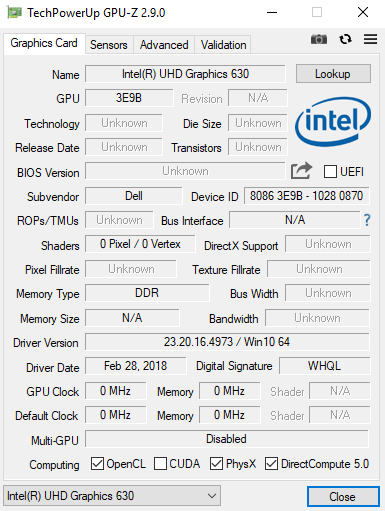
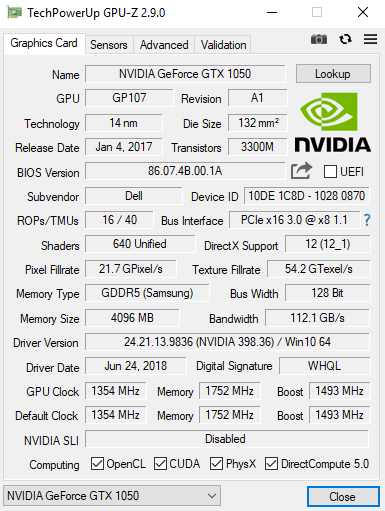
Test: Dell G3 17 3779 (i5-8300H, GTX 1050, SSD, IPS) Laptop (Sammanfattning)
| SD Card Reader - average JPG Copy Test (av. of 3 runs) | |
| Genomsnitt av klass Gaming (20.9 - 210, n=55, senaste 2 åren) | |
| Acer Predator Helios 300 PH317-52-51M6 (Toshiba Exceria Pro SDXC 64 GB UHS-II) | |
| Asus ROG Strix GL702ZC-GC204T (Toshiba Exceria Pro SDXC 64 GB UHS-II) | |
| Asus VivoBook Pro 17 N705UD-EH76 (Toshiba Exceria Pro SDXC 64 GB UHS-II) | |
| Dell G3 17 3779 (Toshiba Exceria Pro SDXC 64 GB UHS-II) | |
| Acer Aspire Nitro BE VN7-793G-5811 (Toshiba Exceria Pro SDXC 64 GB UHS-II) | |
| MSI GL72 7RDX-602 (Toshiba Exceria Pro SDXC 64 GB UHS-II) | |
| Networking | |
| iperf3 transmit AX12 | |
| Asus ROG Strix GL702ZC-GC204T | |
| Acer Predator Helios 300 PH317-52-51M6 | |
| Acer Aspire Nitro BE VN7-793G-5811 | |
| Asus VivoBook Pro 17 N705UD-EH76 | |
| MSI GL72 7RDX-602 | |
| Dell G3 17 3779 | |
| iperf3 receive AX12 | |
| Acer Predator Helios 300 PH317-52-51M6 | |
| Asus ROG Strix GL702ZC-GC204T | |
| Asus VivoBook Pro 17 N705UD-EH76 | |
| Acer Aspire Nitro BE VN7-793G-5811 | |
| MSI GL72 7RDX-602 | |
| Dell G3 17 3779 | |
| |||||||||||||||||||||||||
Distribution av ljusstyrkan: 89 %
Mitt på batteriet: 323 cd/m²
Kontrast: 1042:1 (Svärta: 0.31 cd/m²)
ΔE ColorChecker Calman: 4.96 | ∀{0.5-29.43 Ø4.71}
ΔE Greyscale Calman: 5.65 | ∀{0.09-98 Ø4.96}
90% sRGB (Argyll 1.6.3 3D)
58% AdobeRGB 1998 (Argyll 1.6.3 3D)
64.9% AdobeRGB 1998 (Argyll 3D)
89.8% sRGB (Argyll 3D)
63.9% Display P3 (Argyll 3D)
Gamma: 2.24
CCT: 7441 K
| Dell G3 17 3779 AUO, B173HAN01.3, 1920x1080, 17.3" | Acer Predator Helios 300 PH317-52-51M6 LG Philips LP173WF4-SPF5 (LGD056D), 1920x1080, 17.3" | Asus ROG Strix GL702ZC-GC204T LG Philips LP173WF4-SPF5, 1920x1080, 17.3" | MSI GL72 7RDX-602 Chi Mei CMN1735 N173HGE-E11, 1920x1080, 17.3" | Acer Aspire Nitro BE VN7-793G-5811 AU Optronics, 1920x1080, 17.3" | Asus VivoBook Pro 17 N705UD-EH76 LP173WF4-SPF5, 1920x1080, 17.3" | |
|---|---|---|---|---|---|---|
| Display | -1% | -4% | 3% | -2% | 0% | |
| Display P3 Coverage (%) | 63.9 | 67.1 5% | 65.4 2% | 65.2 2% | 63.1 -1% | 67.9 6% |
| sRGB Coverage (%) | 89.8 | 86.1 -4% | 82.6 -8% | 94.3 5% | 86.5 -4% | 86.8 -3% |
| AdobeRGB 1998 Coverage (%) | 64.9 | 63 -3% | 60.4 -7% | 65.6 1% | 63.3 -2% | 63.5 -2% |
| Response Times | 10% | 9% | 12% | -2% | 15% | |
| Response Time Grey 50% / Grey 80% * (ms) | 38 ? | 36 ? 5% | 36 ? 5% | 29 ? 24% | 38 ? -0% | 30.8 ? 19% |
| Response Time Black / White * (ms) | 26 ? | 22 ? 15% | 23 ? 12% | 26 ? -0% | 27 ? -4% | 23.2 ? 11% |
| PWM Frequency (Hz) | 122000 ? | 961 | 119000 ? | |||
| Screen | -9% | -1% | -42% | 2% | -1% | |
| Brightness middle (cd/m²) | 323 | 365 13% | 415 28% | 299 -7% | 301 -7% | 376.2 16% |
| Brightness (cd/m²) | 306 | 341 11% | 365 19% | 274 -10% | 270 -12% | 355 16% |
| Brightness Distribution (%) | 89 | 89 0% | 82 -8% | 80 -10% | 79 -11% | 89 0% |
| Black Level * (cd/m²) | 0.31 | 0.32 -3% | 0.42 -35% | 0.25 19% | 0.38 -23% | 0.42 -35% |
| Contrast (:1) | 1042 | 1141 10% | 988 -5% | 1196 15% | 792 -24% | 896 -14% |
| Colorchecker dE 2000 * | 4.96 | 6.51 -31% | 4.95 -0% | 12.92 -160% | 3.49 30% | 4.21 15% |
| Colorchecker dE 2000 max. * | 8.25 | 12.32 -49% | 9.34 -13% | 19.91 -141% | 7.49 9% | 8.31 -1% |
| Greyscale dE 2000 * | 5.65 | 7.65 -35% | 4.69 17% | 13.16 -133% | 1.88 67% | 5.5 3% |
| Gamma | 2.24 98% | 2.64 83% | 2.33 94% | 2.36 93% | 2.35 94% | 2.335 94% |
| CCT | 7441 87% | 8066 81% | 6485 100% | 15046 43% | 6587 99% | 7056 92% |
| Color Space (Percent of AdobeRGB 1998) (%) | 58 | 56 -3% | 54 -7% | 60 3% | 56 -3% | 57 -2% |
| Color Space (Percent of sRGB) (%) | 90 | 86 -4% | 82 -9% | 94 4% | 86 -4% | 87 -3% |
| Colorchecker dE 2000 calibrated * | 2.9 | 3.95 | ||||
| Totalt genomsnitt (program/inställningar) | 0% /
-5% | 1% /
-1% | -9% /
-26% | -1% /
1% | 5% /
2% |
* ... mindre är bättre
Visa svarstider
| ↔ Svarstid svart till vitt | ||
|---|---|---|
| 26 ms ... stiga ↗ och falla ↘ kombinerat | ↗ 15 ms stiga | 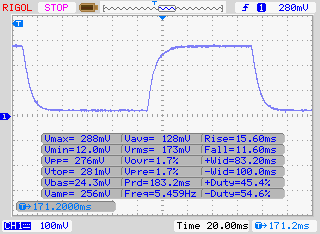 |
| ↘ 11 ms hösten | ||
| Skärmen visar relativt långsamma svarsfrekvenser i våra tester och kan vara för långsam för spelare. I jämförelse sträcker sig alla testade enheter från 0.1 (minst) till 240 (maximalt) ms. » 63 % av alla enheter är bättre. Detta innebär att den uppmätta svarstiden är sämre än genomsnittet av alla testade enheter (19.8 ms). | ||
| ↔ Svarstid 50 % grått till 80 % grått | ||
| 38 ms ... stiga ↗ och falla ↘ kombinerat | ↗ 18 ms stiga | 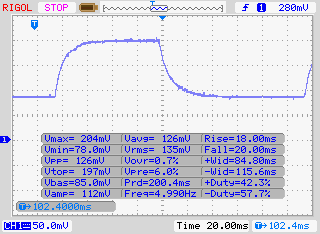 |
| ↘ 20 ms hösten | ||
| Skärmen visar långsamma svarsfrekvenser i våra tester och kommer att vara otillfredsställande för spelare. I jämförelse sträcker sig alla testade enheter från 0.165 (minst) till 636 (maximalt) ms. » 55 % av alla enheter är bättre. Detta innebär att den uppmätta svarstiden är sämre än genomsnittet av alla testade enheter (30.9 ms). | ||
Skärmflimmer / PWM (Puls-Width Modulation)
| Skärmflimmer / PWM upptäcktes inte | 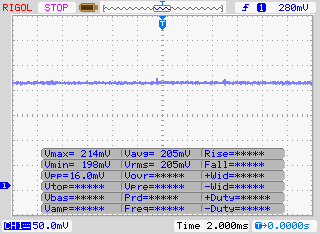 | ||
Som jämförelse: 52 % av alla testade enheter använder inte PWM för att dämpa skärmen. Om PWM upptäcktes mättes ett medelvärde av 7748 (minst: 5 - maximum: 343500) Hz. | |||
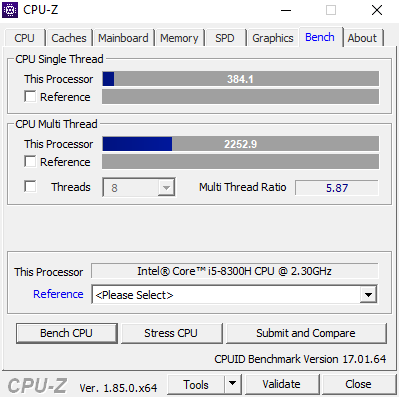
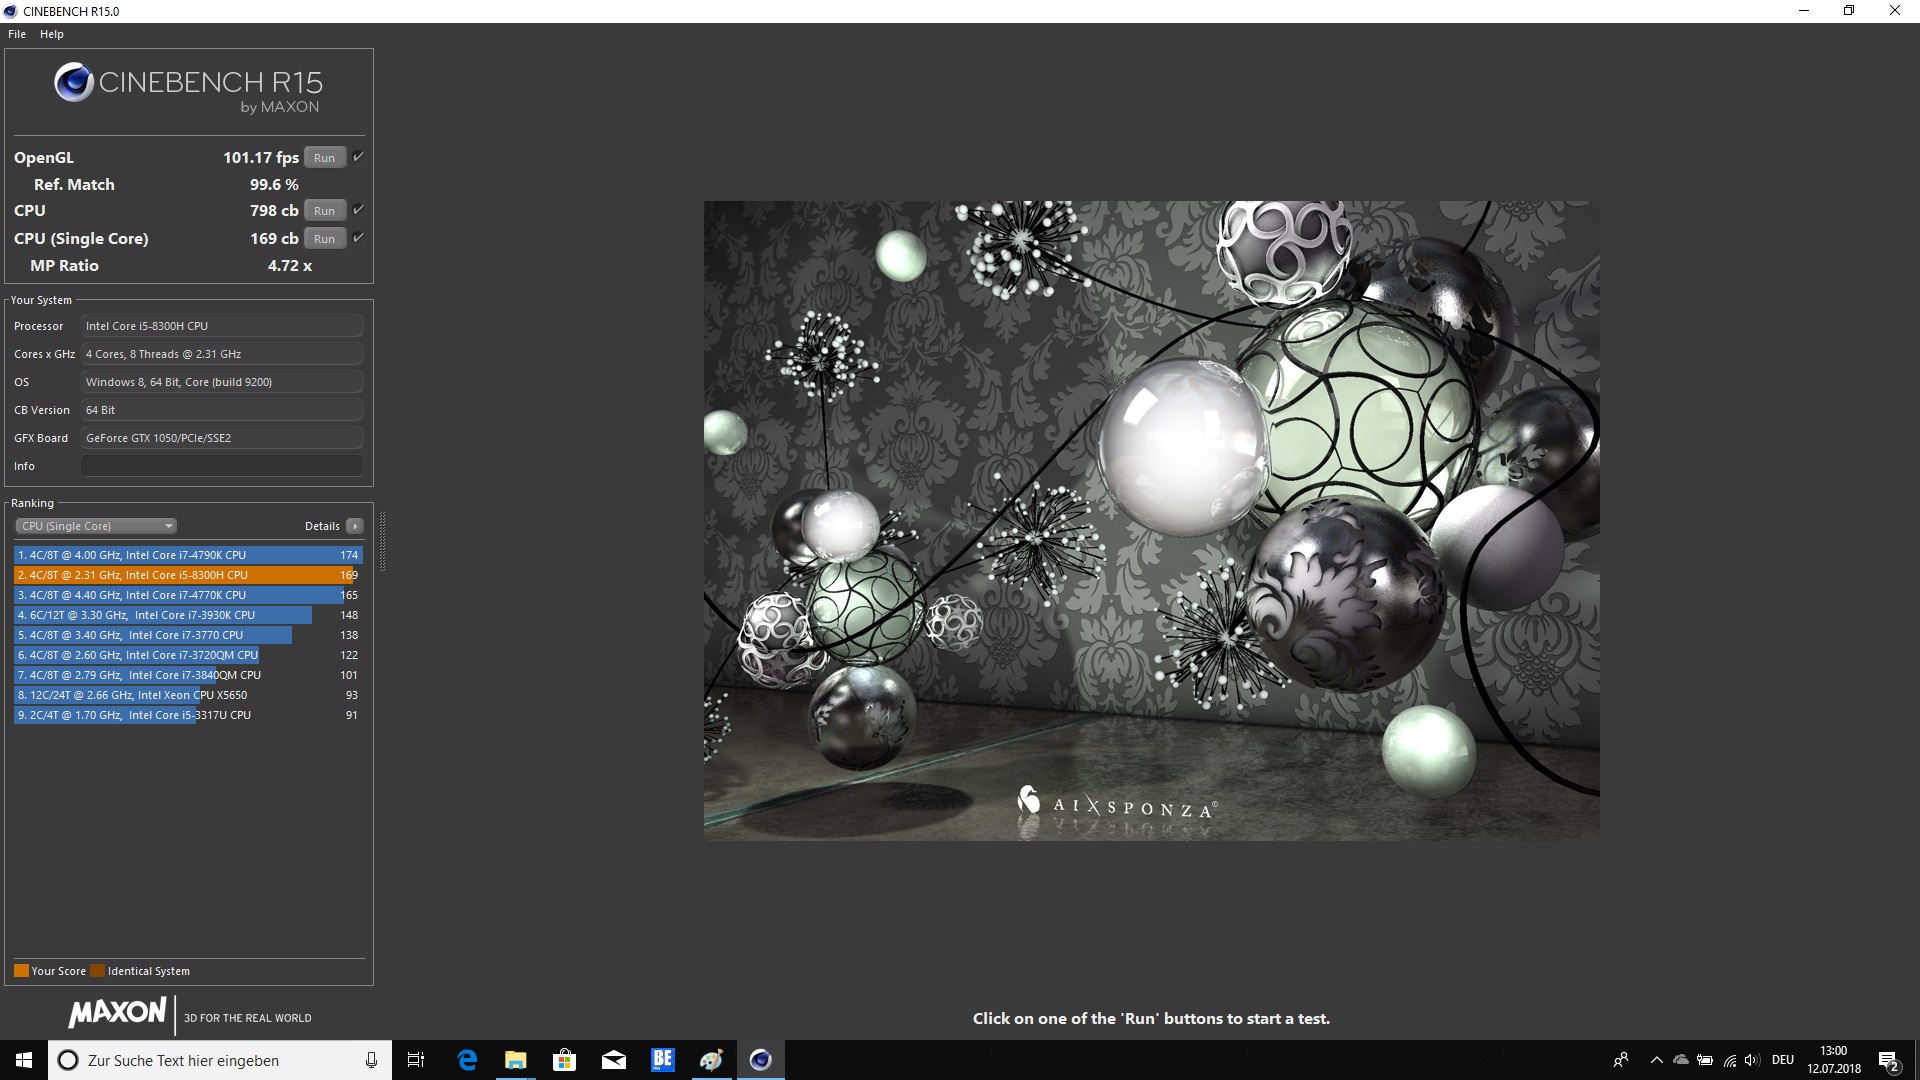
| Cinebench R15 | |
| CPU Single 64Bit | |
| Genomsnitt av klass Gaming (188.8 - 350, n=107, senaste 2 åren) | |
| Acer Predator Helios 300 PH317-52-51M6 | |
| Asus VivoBook Pro 17 N705UD-EH76 | |
| Dell G3 17 3779 | |
| Genomsnitt Intel Core i5-8300H (151 - 174, n=17) | |
| MSI GL72 7RDX-602 | |
| Acer Aspire Nitro BE VN7-793G-5811 | |
| Asus ROG Strix GL702ZC-GC204T | |
| CPU Multi 64Bit | |
| Genomsnitt av klass Gaming (1578 - 6330, n=106, senaste 2 åren) | |
| Asus ROG Strix GL702ZC-GC204T | |
| Acer Predator Helios 300 PH317-52-51M6 | |
| Dell G3 17 3779 | |
| Genomsnitt Intel Core i5-8300H (609 - 850, n=17) | |
| MSI GL72 7RDX-602 | |
| Asus VivoBook Pro 17 N705UD-EH76 | |
| Acer Aspire Nitro BE VN7-793G-5811 | |
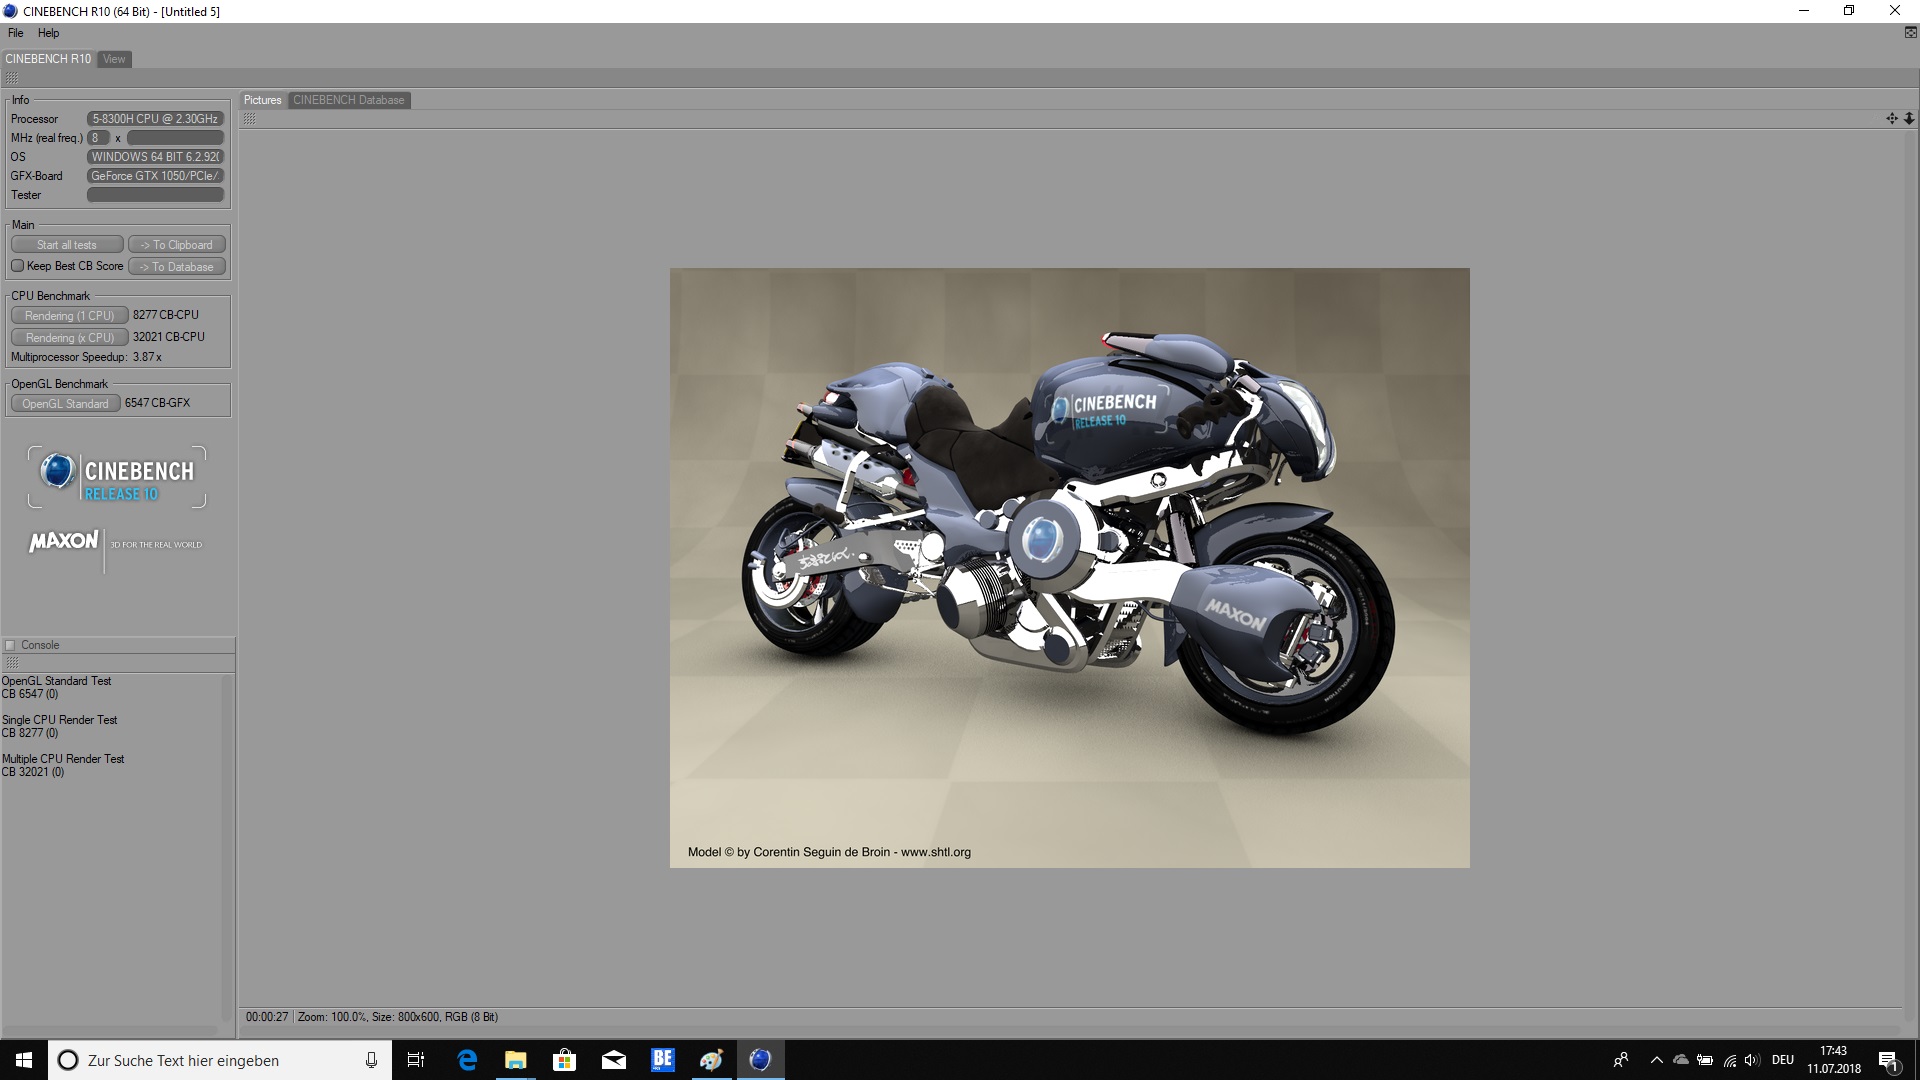
| Cinebench R10 | |
| Rendering Single CPUs 64Bit | |
| Genomsnitt av klass Gaming (17067 - 19487, n=3, senaste 2 åren) | |
| Genomsnitt Intel Core i5-8300H (8277 - 8506, n=2) | |
| Dell G3 17 3779 | |
| Rendering Multiple CPUs 64Bit | |
| Genomsnitt av klass Gaming (14159 - 165835, n=3, senaste 2 åren) | |
| Dell G3 17 3779 | |
| Genomsnitt Intel Core i5-8300H (28616 - 32021, n=2) | |
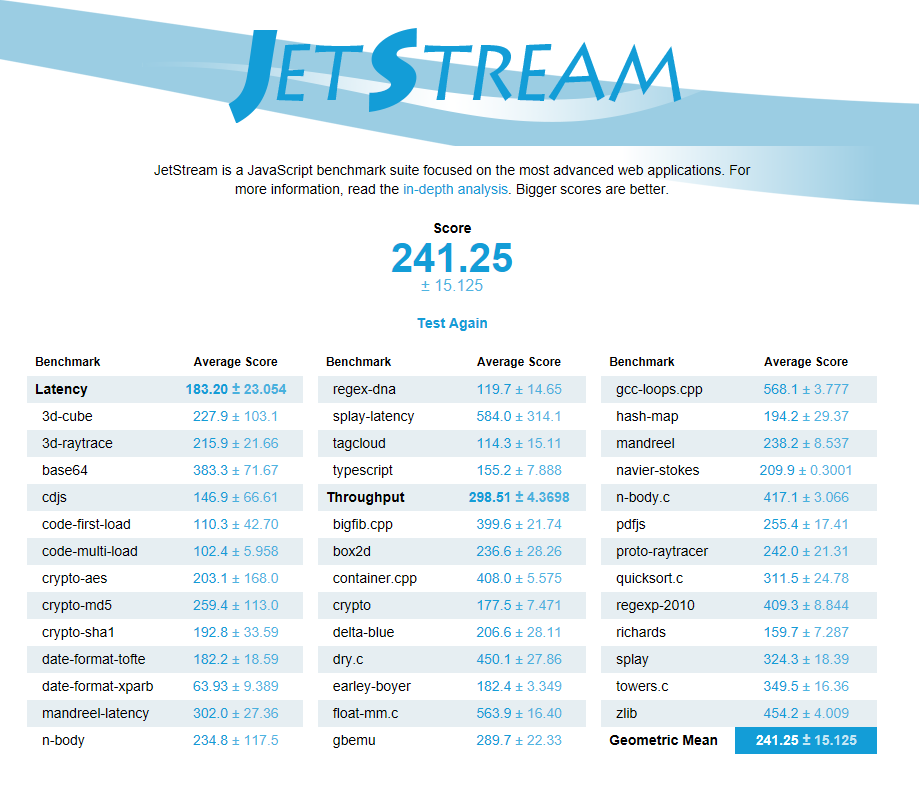
| JetStream 1.1 - 1.1 Total | |
| Genomsnitt av klass Gaming (549 - 647, n=3, senaste 2 åren) | |
| MSI GL72 7RDX-602 | |
| Asus VivoBook Pro 17 N705UD-EH76 | |
| Acer Aspire Nitro BE VN7-793G-5811 | |
| Dell G3 17 3779 | |
| Genomsnitt Intel Core i5-8300H (208 - 251, n=10) | |
| Asus ROG Strix GL702ZC-GC204T | |
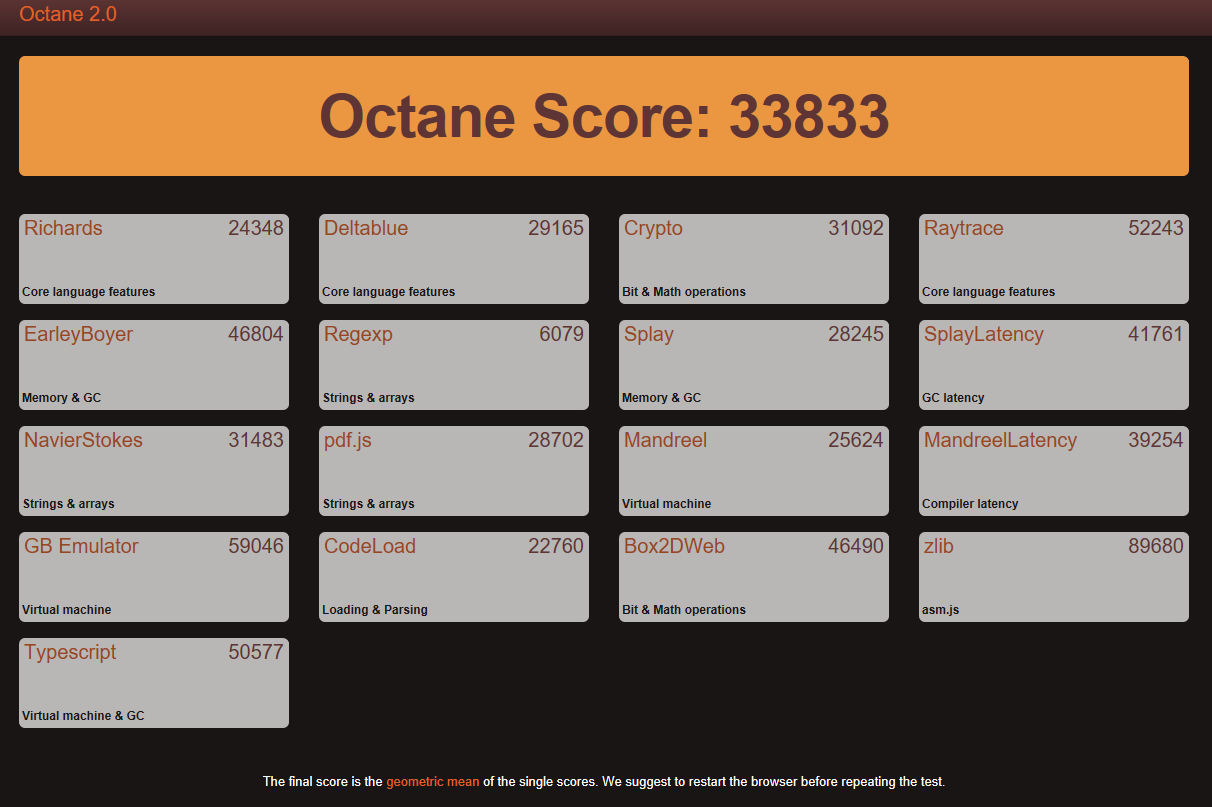
| Octane V2 - Total Score | |
| Genomsnitt av klass Gaming (93292 - 139447, n=27, senaste 2 åren) | |
| MSI GL72 7RDX-602 | |
| Asus VivoBook Pro 17 N705UD-EH76 | |
| Dell G3 17 3779 | |
| Genomsnitt Intel Core i5-8300H (30806 - 34659, n=10) | |
| Asus ROG Strix GL702ZC-GC204T | |
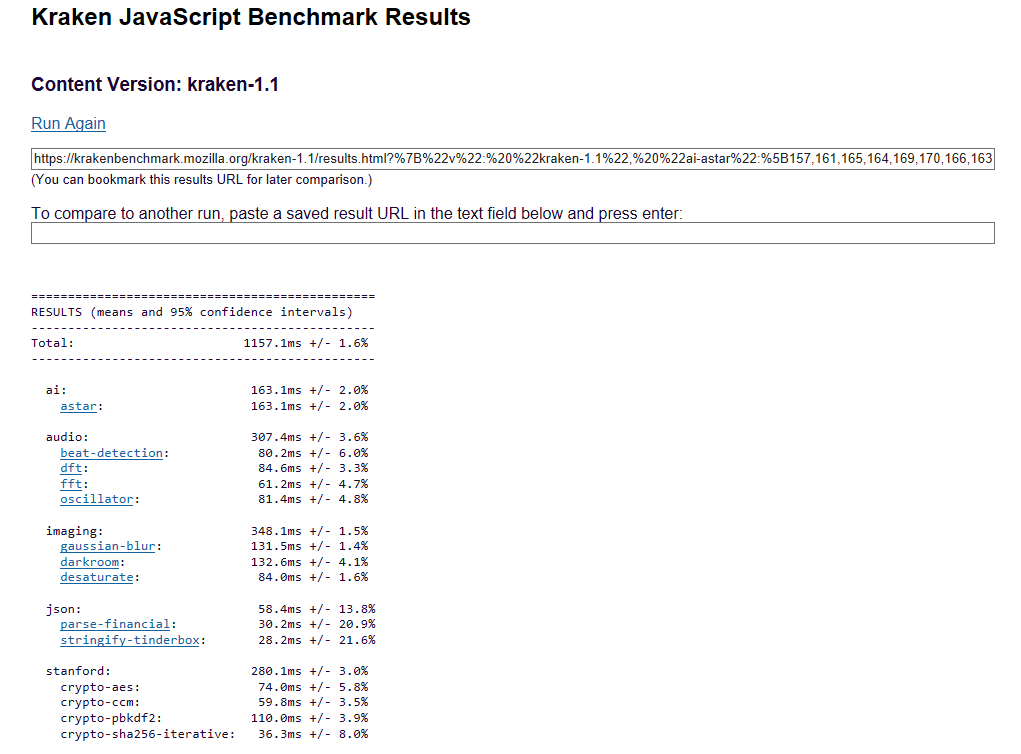
| Mozilla Kraken 1.1 - Total | |
| Dell G3 17 3779 | |
| Genomsnitt Intel Core i5-8300H (1095 - 1209, n=9) | |
| Asus VivoBook Pro 17 N705UD-EH76 | |
| Asus ROG Strix GL702ZC-GC204T | |
| MSI GL72 7RDX-602 | |
| Genomsnitt av klass Gaming (391 - 590, n=101, senaste 2 åren) | |
* ... mindre är bättre
| PCMark 8 | |
| Home Score Accelerated v2 | |
| Genomsnitt av klass Gaming (n=1senaste 2 åren) | |
| Acer Predator Helios 300 PH317-52-51M6 | |
| Asus VivoBook Pro 17 N705UD-EH76 | |
| Asus ROG Strix GL702ZC-GC204T | |
| Genomsnitt Intel Core i5-8300H, NVIDIA GeForce GTX 1050 Mobile (3704 - 4030, n=6) | |
| Dell G3 17 3779 | |
| Acer Aspire Nitro BE VN7-793G-5811 | |
| MSI GL72 7RDX-602 | |
| Work Score Accelerated v2 | |
| Acer Predator Helios 300 PH317-52-51M6 | |
| Asus VivoBook Pro 17 N705UD-EH76 | |
| Dell G3 17 3779 | |
| Genomsnitt Intel Core i5-8300H, NVIDIA GeForce GTX 1050 Mobile (4609 - 5271, n=6) | |
| Asus ROG Strix GL702ZC-GC204T | |
| MSI GL72 7RDX-602 | |
| Acer Aspire Nitro BE VN7-793G-5811 | |
| Genomsnitt av klass Gaming (n=1senaste 2 åren) | |
| PCMark 8 Home Score Accelerated v2 | 3886 poäng | |
| PCMark 8 Creative Score Accelerated v2 | 4704 poäng | |
| PCMark 8 Work Score Accelerated v2 | 5218 poäng | |
| PCMark 10 Score | 4442 poäng | |
Hjälp | ||
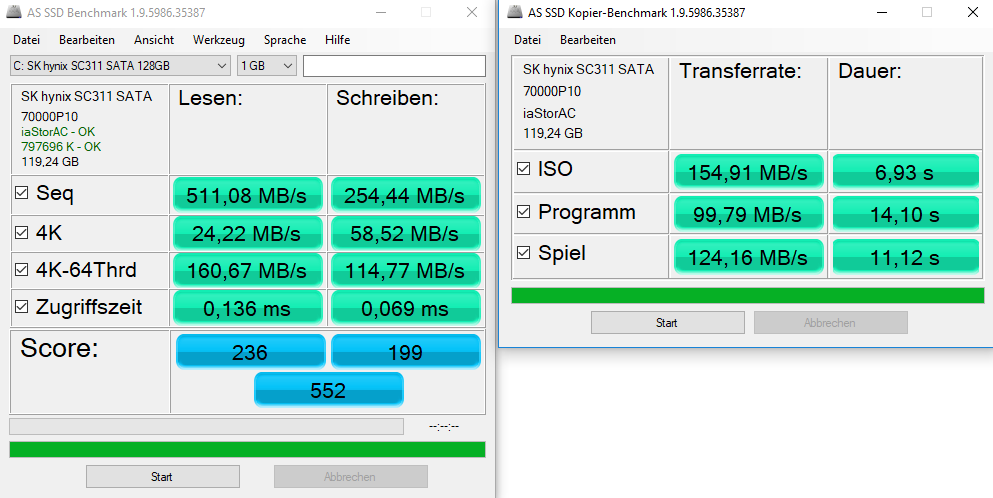
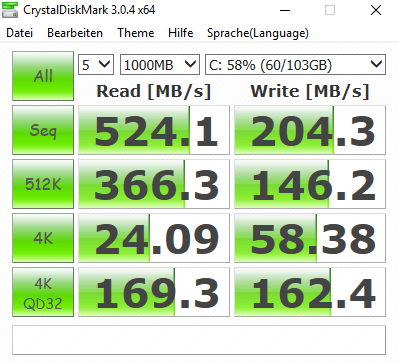
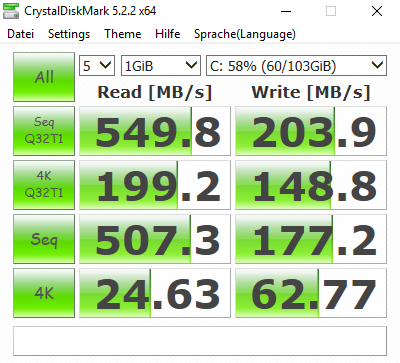
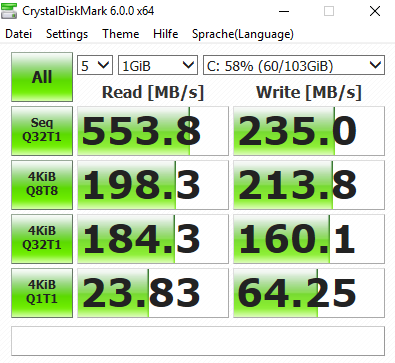
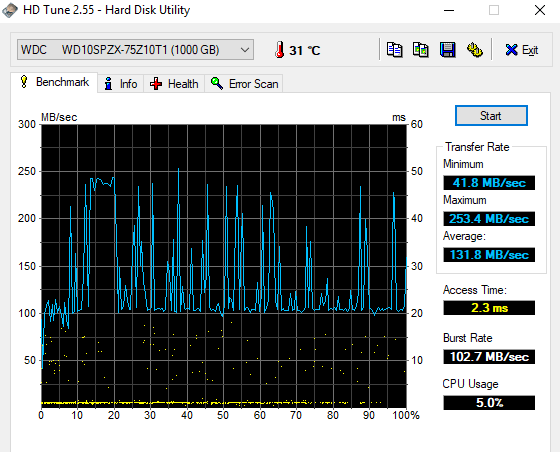
| Dell G3 17 3779 SK hynix SC311 SATA | Asus ROG Strix GL702ZC-GC204T Seagate Mobile HDD 1TB ST1000LX015-1U7172 | MSI GL72 7RDX-602 HGST Travelstar 7K1000 HTS721010A9E630 | Acer Aspire Nitro BE VN7-793G-5811 Seagate Mobile HDD 1TB ST1000LM035 | Genomsnitt SK hynix SC311 SATA | |
|---|---|---|---|---|---|
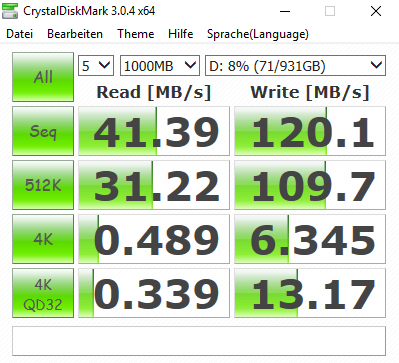
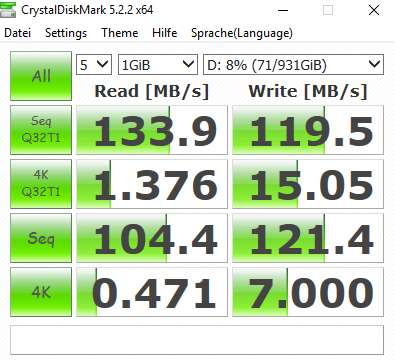
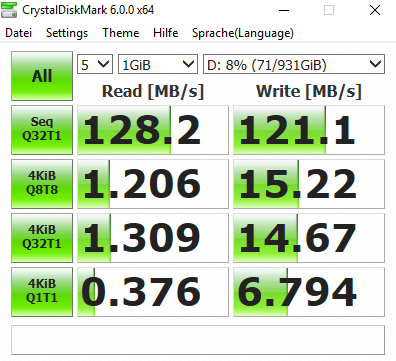
| CrystalDiskMark 3.0 | -81% | -82% | -80% | 27% | |
| Read Seq (MB/s) | 524 | 92.5 -82% | 135.3 -74% | 117.6 -78% | 507 ? -3% |
| Write Seq (MB/s) | 204.3 | 105.1 -49% | 127 -38% | 109.1 -47% | 372 ? 82% |
| Read 512 (MB/s) | 366.3 | 37.67 -90% | 45.57 -88% | 39.93 -89% | 367 ? 0% |
| Write 512 (MB/s) | 146.2 | 101.8 -30% | 58.3 -60% | 98.6 -33% | 282 ? 93% |
| Read 4k (MB/s) | 24.09 | 0.484 -98% | 0.582 -98% | 0.435 -98% | 22.9 ? -5% |
| Write 4k (MB/s) | 58.4 | 0.169 -100% | 1.022 -98% | 3.152 -95% | 50.3 ? -14% |
| Read 4k QD32 (MB/s) | 169.3 | 1.294 -99% | 1.068 -99% | 1.008 -99% | 208 ? 23% |
| Write 4k QD32 (MB/s) | 162.4 | 0.221 -100% | 1.102 -99% | 4.705 -97% | 231 ? 42% |

| 3DMark | |
| 1280x720 Cloud Gate Standard Graphics | |
| Genomsnitt av klass Gaming (86886 - 223650, n=60, senaste 2 åren) | |
| Dell G5 15 5587 | |
| Asus ROG Strix GL702ZC-GC204T | |
| Acer Predator Helios 300 PH317-52-51M6 | |
| Acer Aspire Nitro BE VN7-793G-5811 | |
| MSI GL72 7RDX-602 | |
| Dell G3 17 3779 | |
| Asus VivoBook Pro 17 N705UD-EH76 | |
| Genomsnitt NVIDIA GeForce GTX 1050 Mobile (14979 - 40201, n=40) | |
| 1920x1080 Fire Strike Graphics | |
| Genomsnitt av klass Gaming (12242 - 62849, n=116, senaste 2 åren) | |
| Asus ROG Strix GL702ZC-GC204T | |
| Dell G5 15 5587 | |
| Acer Aspire Nitro BE VN7-793G-5811 | |
| Acer Predator Helios 300 PH317-52-51M6 | |
| MSI GL72 7RDX-602 | |
| Dell G3 17 3779 | |
| Asus VivoBook Pro 17 N705UD-EH76 | |
| Genomsnitt NVIDIA GeForce GTX 1050 Mobile (4935 - 6651, n=43) | |
| 3DMark 11 - 1280x720 Performance GPU | |
| Genomsnitt av klass Gaming (21841 - 80022, n=105, senaste 2 åren) | |
| Asus ROG Strix GL702ZC-GC204T | |
| Dell G5 15 5587 | |
| Acer Aspire Nitro BE VN7-793G-5811 | |
| Acer Predator Helios 300 PH317-52-51M6 | |
| MSI GL72 7RDX-602 | |
| Dell G3 17 3779 | |
| Genomsnitt NVIDIA GeForce GTX 1050 Mobile (6744 - 8903, n=42) | |
| Asus VivoBook Pro 17 N705UD-EH76 | |
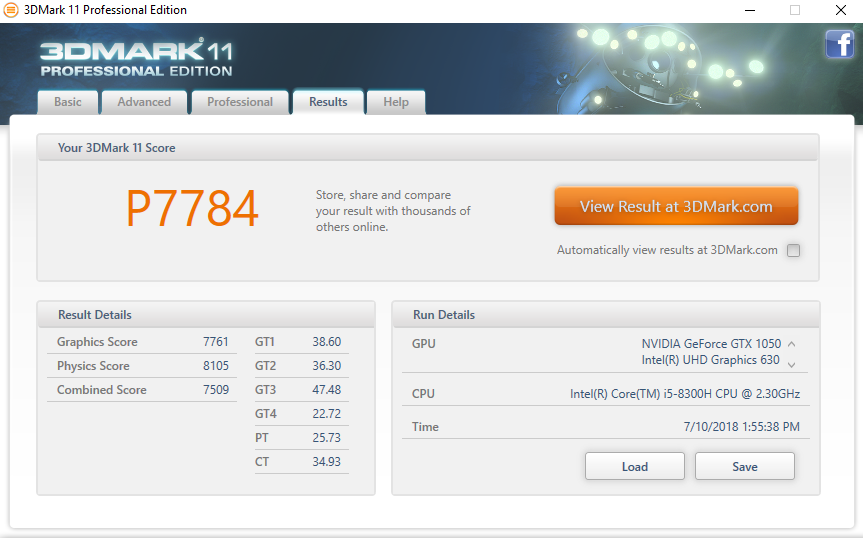
| 3DMark 11 Performance | 7784 poäng | |
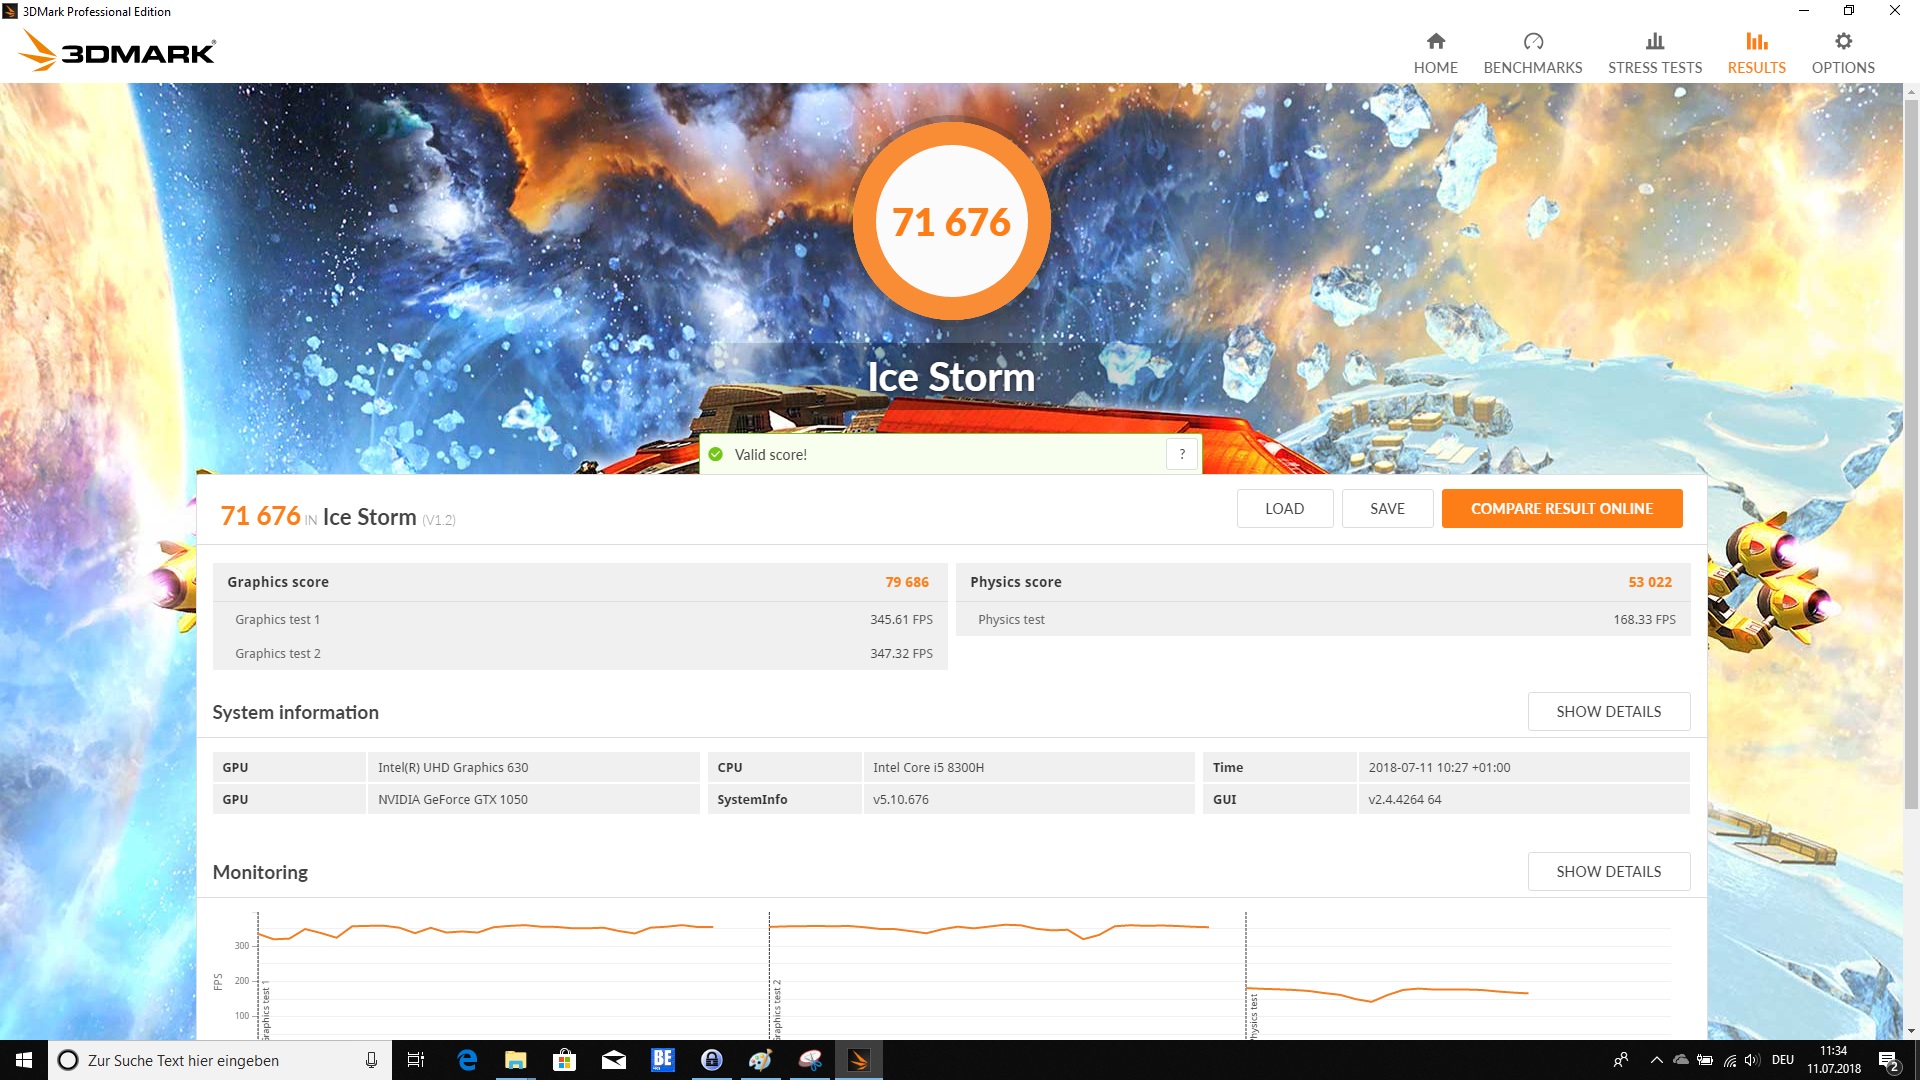
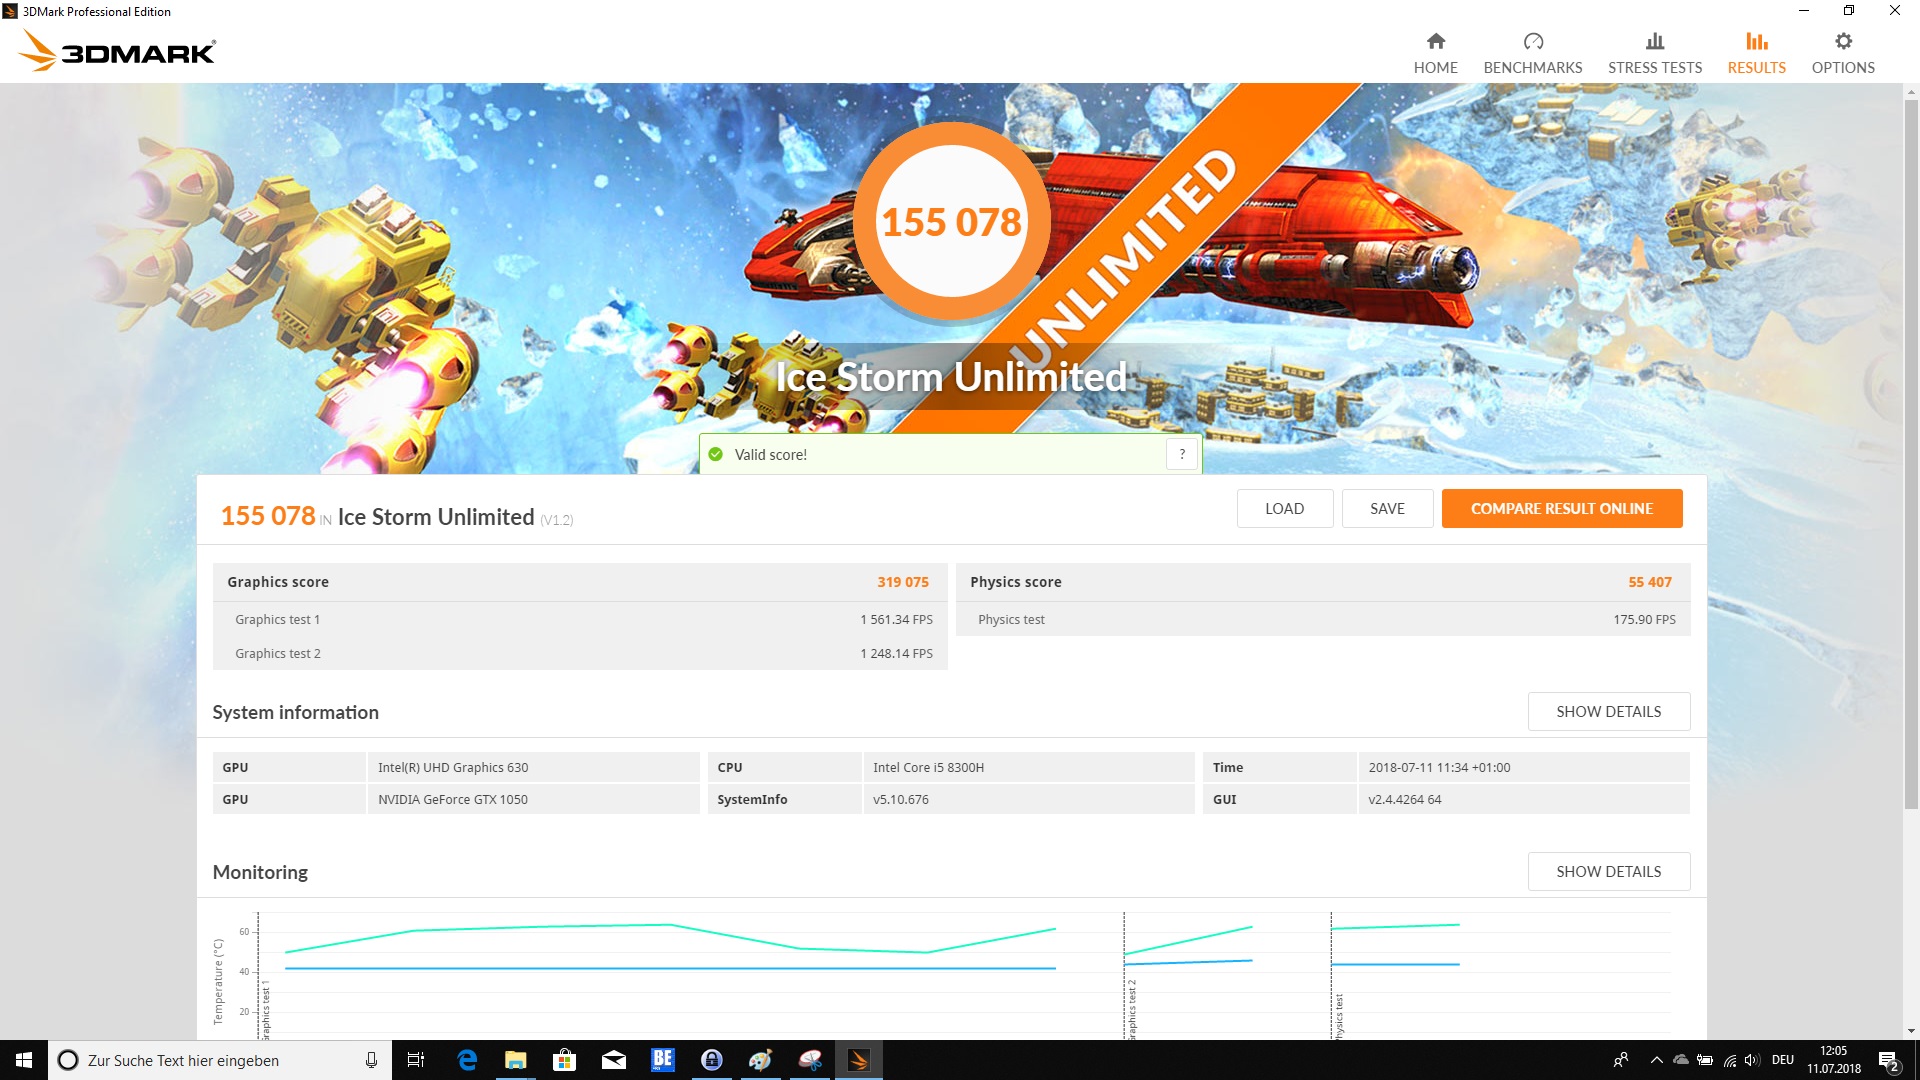
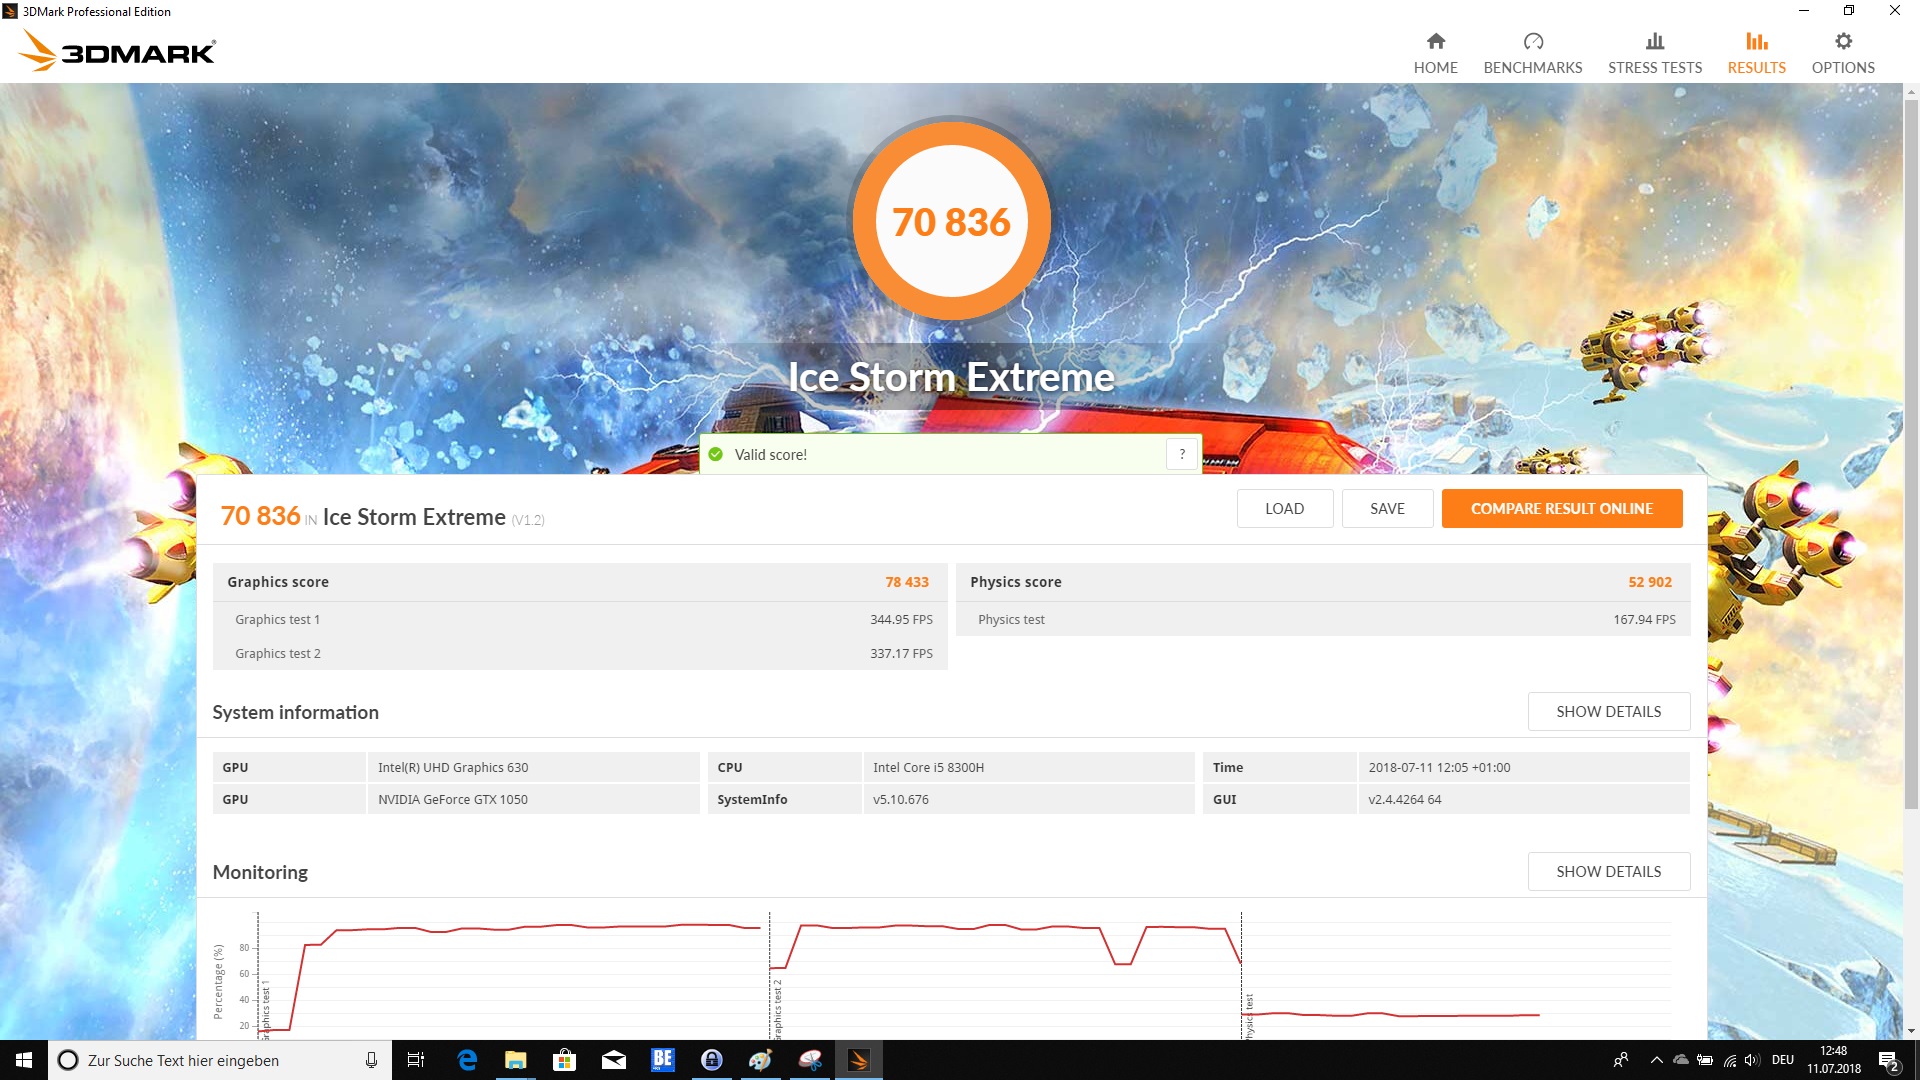
| 3DMark Ice Storm Standard Score | 71676 poäng | |
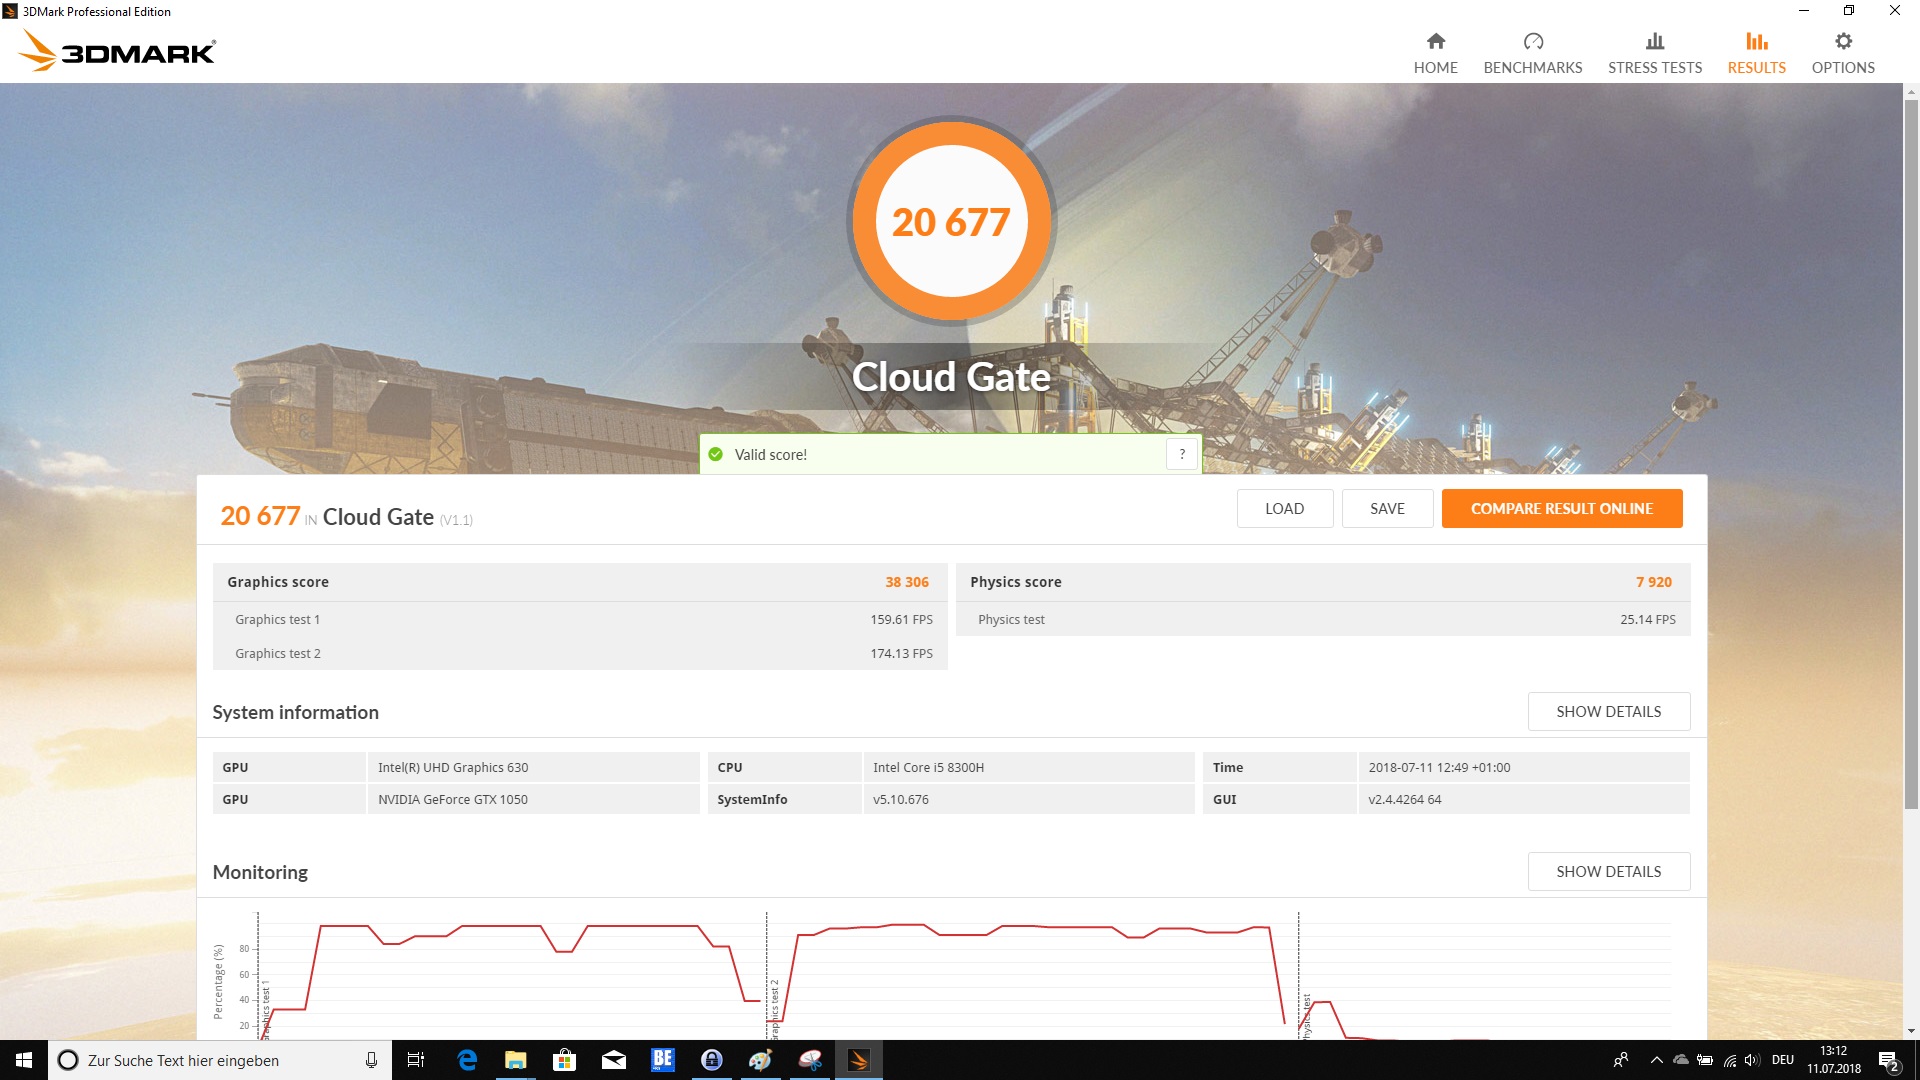
| 3DMark Cloud Gate Standard Score | 20677 poäng | |
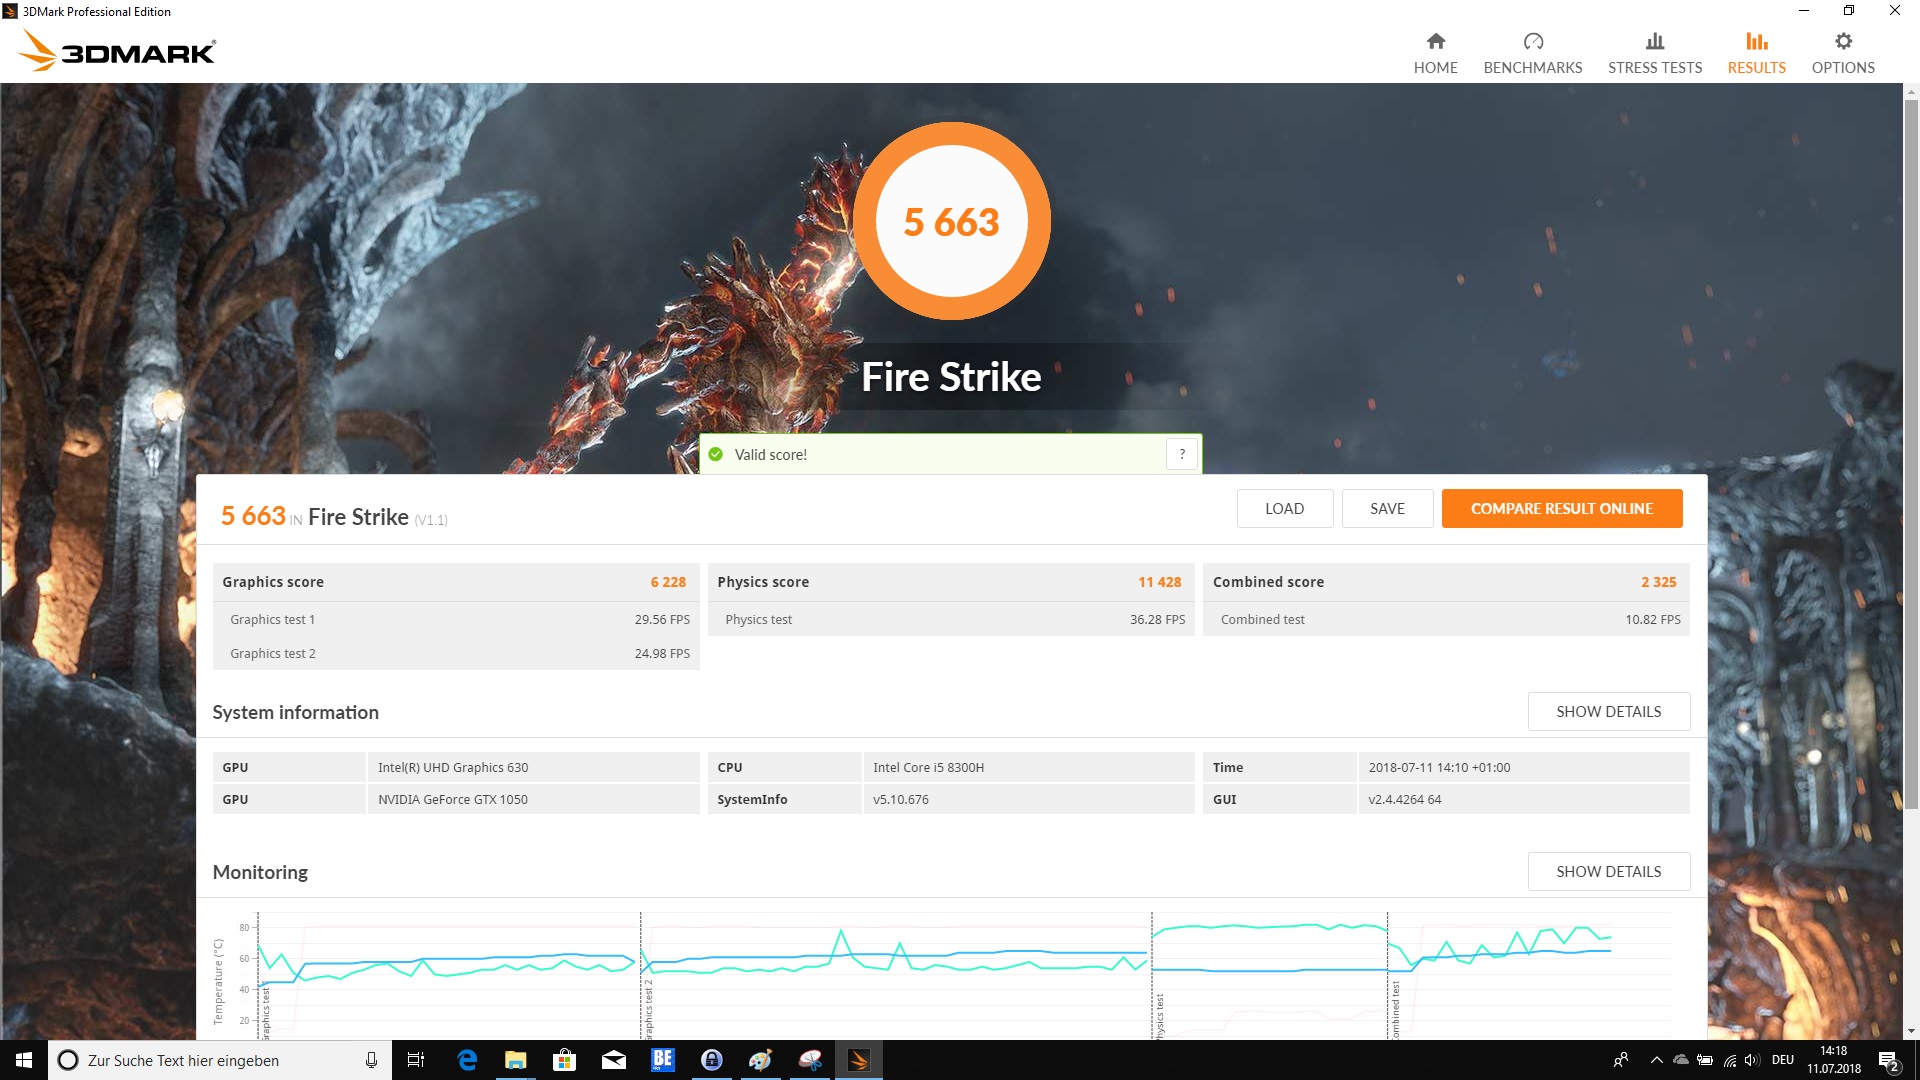
| 3DMark Fire Strike Score | 5663 poäng | |
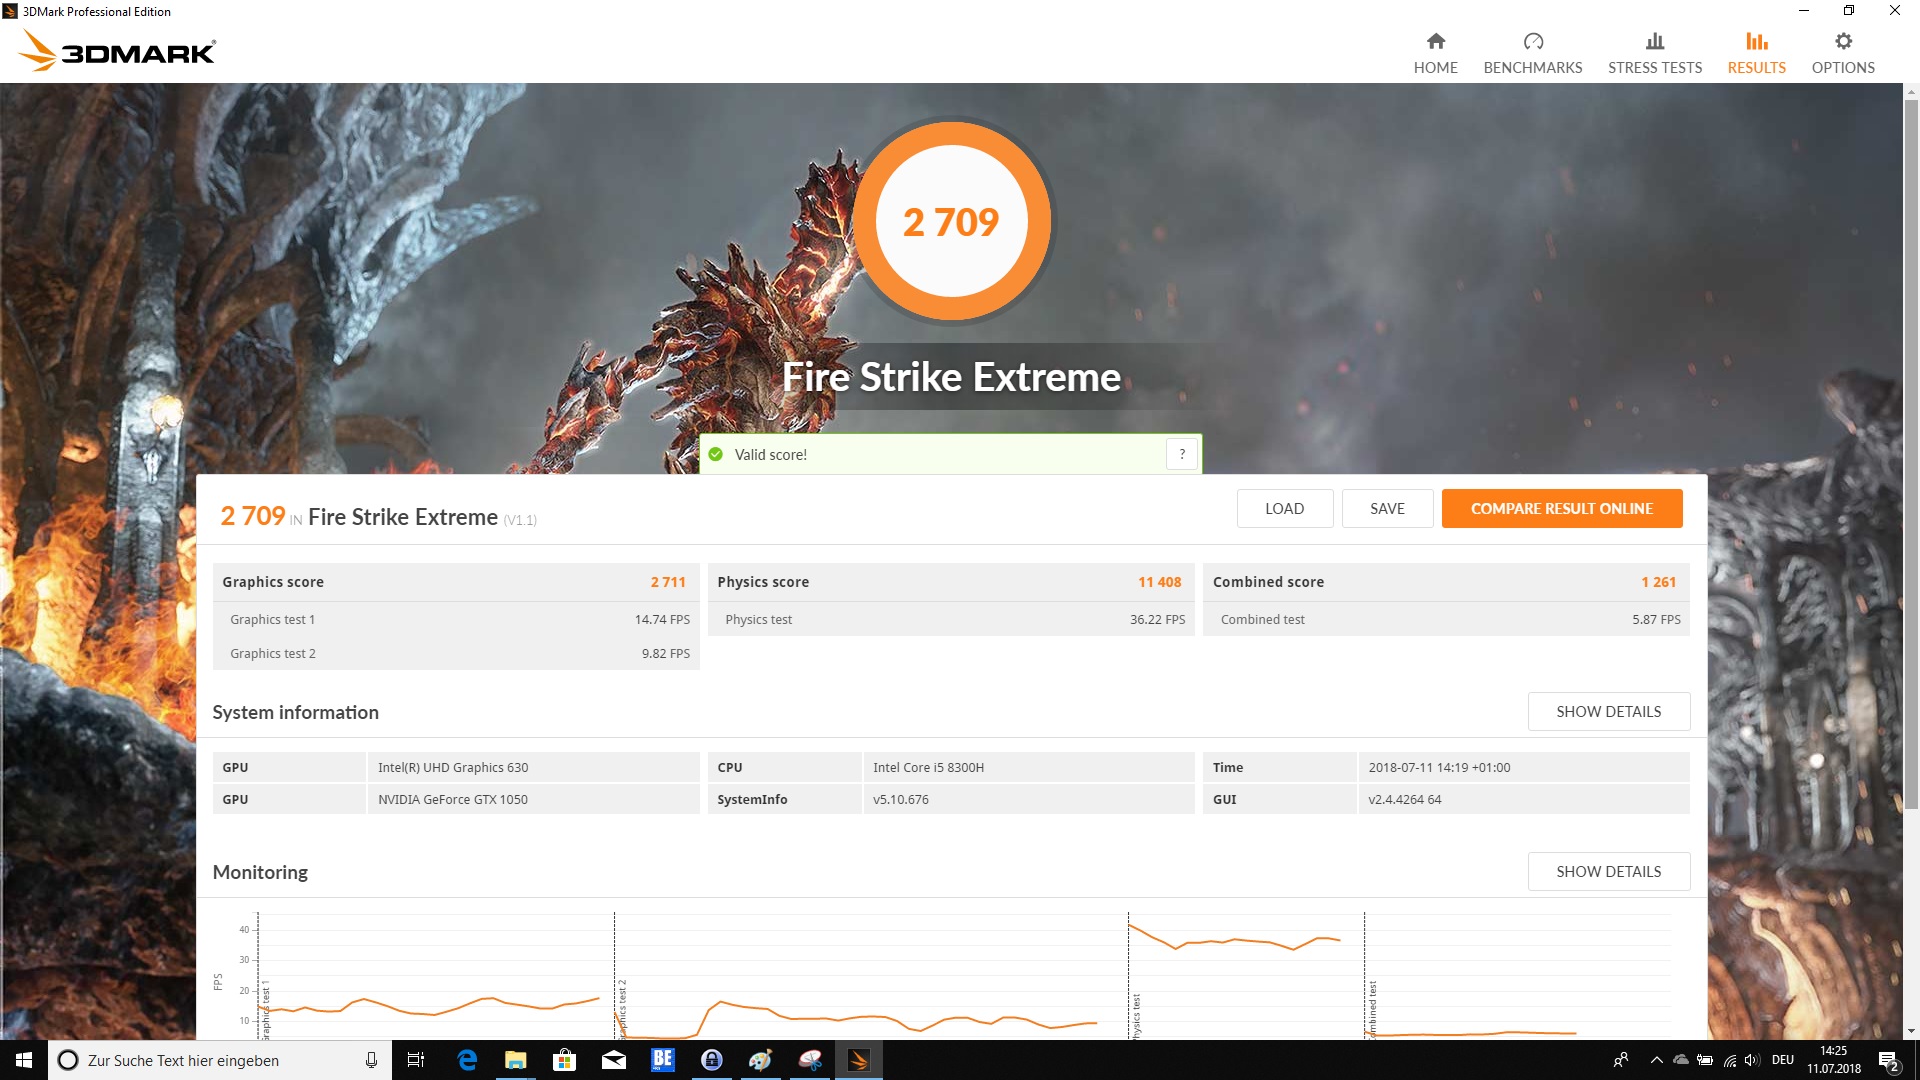
| 3DMark Fire Strike Extreme Score | 2709 poäng | |
Hjälp | ||
| låg | med. | hög | ultra | |
|---|---|---|---|---|
| BioShock Infinite (2013) | 224.2 | 176.4 | 157.8 | 64.3 |
| The Witcher 3 (2015) | 114.5 | 71 | 40.3 | 21.6 |
| Rise of the Tomb Raider (2016) | 120.7 | 69.2 | 38.2 | 33.6 |
| Far Cry 5 (2018) | 74 | 40 | 37 | 33 |
Ljudnivå
| Låg belastning |
| 30.5 / 31.1 / 32.1 dB(A) |
| Hög belastning |
| 43.4 / 39.2 dB(A) |
 | ||
30 dB tyst 40 dB(A) hörbar 50 dB(A) högt ljud |
||
min: | ||
| Dell G3 17 3779 GeForce GTX 1050 Mobile, i5-8300H, SK hynix SC311 SATA | Acer Predator Helios 300 PH317-52-51M6 GeForce GTX 1050 Ti Mobile, i5-8300H, Hynix HFS128G39TND | Asus ROG Strix GL702ZC-GC204T Radeon RX 580 (Laptop), R5 1600, Seagate Mobile HDD 1TB ST1000LX015-1U7172 | MSI GL72 7RDX-602 GeForce GTX 1050 Mobile, i7-7700HQ, HGST Travelstar 7K1000 HTS721010A9E630 | Acer Aspire Nitro BE VN7-793G-5811 GeForce GTX 1050 Ti Mobile, i5-7300HQ, Seagate Mobile HDD 1TB ST1000LM035 | Asus VivoBook Pro 17 N705UD-EH76 GeForce GTX 1050 Mobile, i5-8550U, Samsung PM961 NVMe MZVLW512HMJP | |
|---|---|---|---|---|---|---|
| Noise | -5% | -4% | -3% | 4% | 6% | |
| av / miljö * (dB) | 30.5 | 29 5% | 30.2 1% | 30.8 -1% | 29.7 3% | 28.3 7% |
| Idle Minimum * (dB) | 30.5 | 29 5% | 30.6 -0% | 32.4 -6% | 30.2 1% | 28.3 7% |
| Idle Average * (dB) | 31.1 | 31 -0% | 32.7 -5% | 32.4 -4% | 30.2 3% | 29 7% |
| Idle Maximum * (dB) | 32.1 | 33 -3% | 32.7 -2% | 32.8 -2% | 30.6 5% | 29 10% |
| Load Average * (dB) | 43.4 | 45 -4% | 38.9 10% | 40.9 6% | 33.8 22% | 36.7 15% |
| Load Maximum * (dB) | 39.2 | 51 -30% | 50.6 -29% | 43.6 -11% | 42.6 -9% | 42.8 -9% |
| Witcher 3 ultra * (dB) | 45 | 53.4 | 39.5 | 44.7 |
* ... mindre är bättre
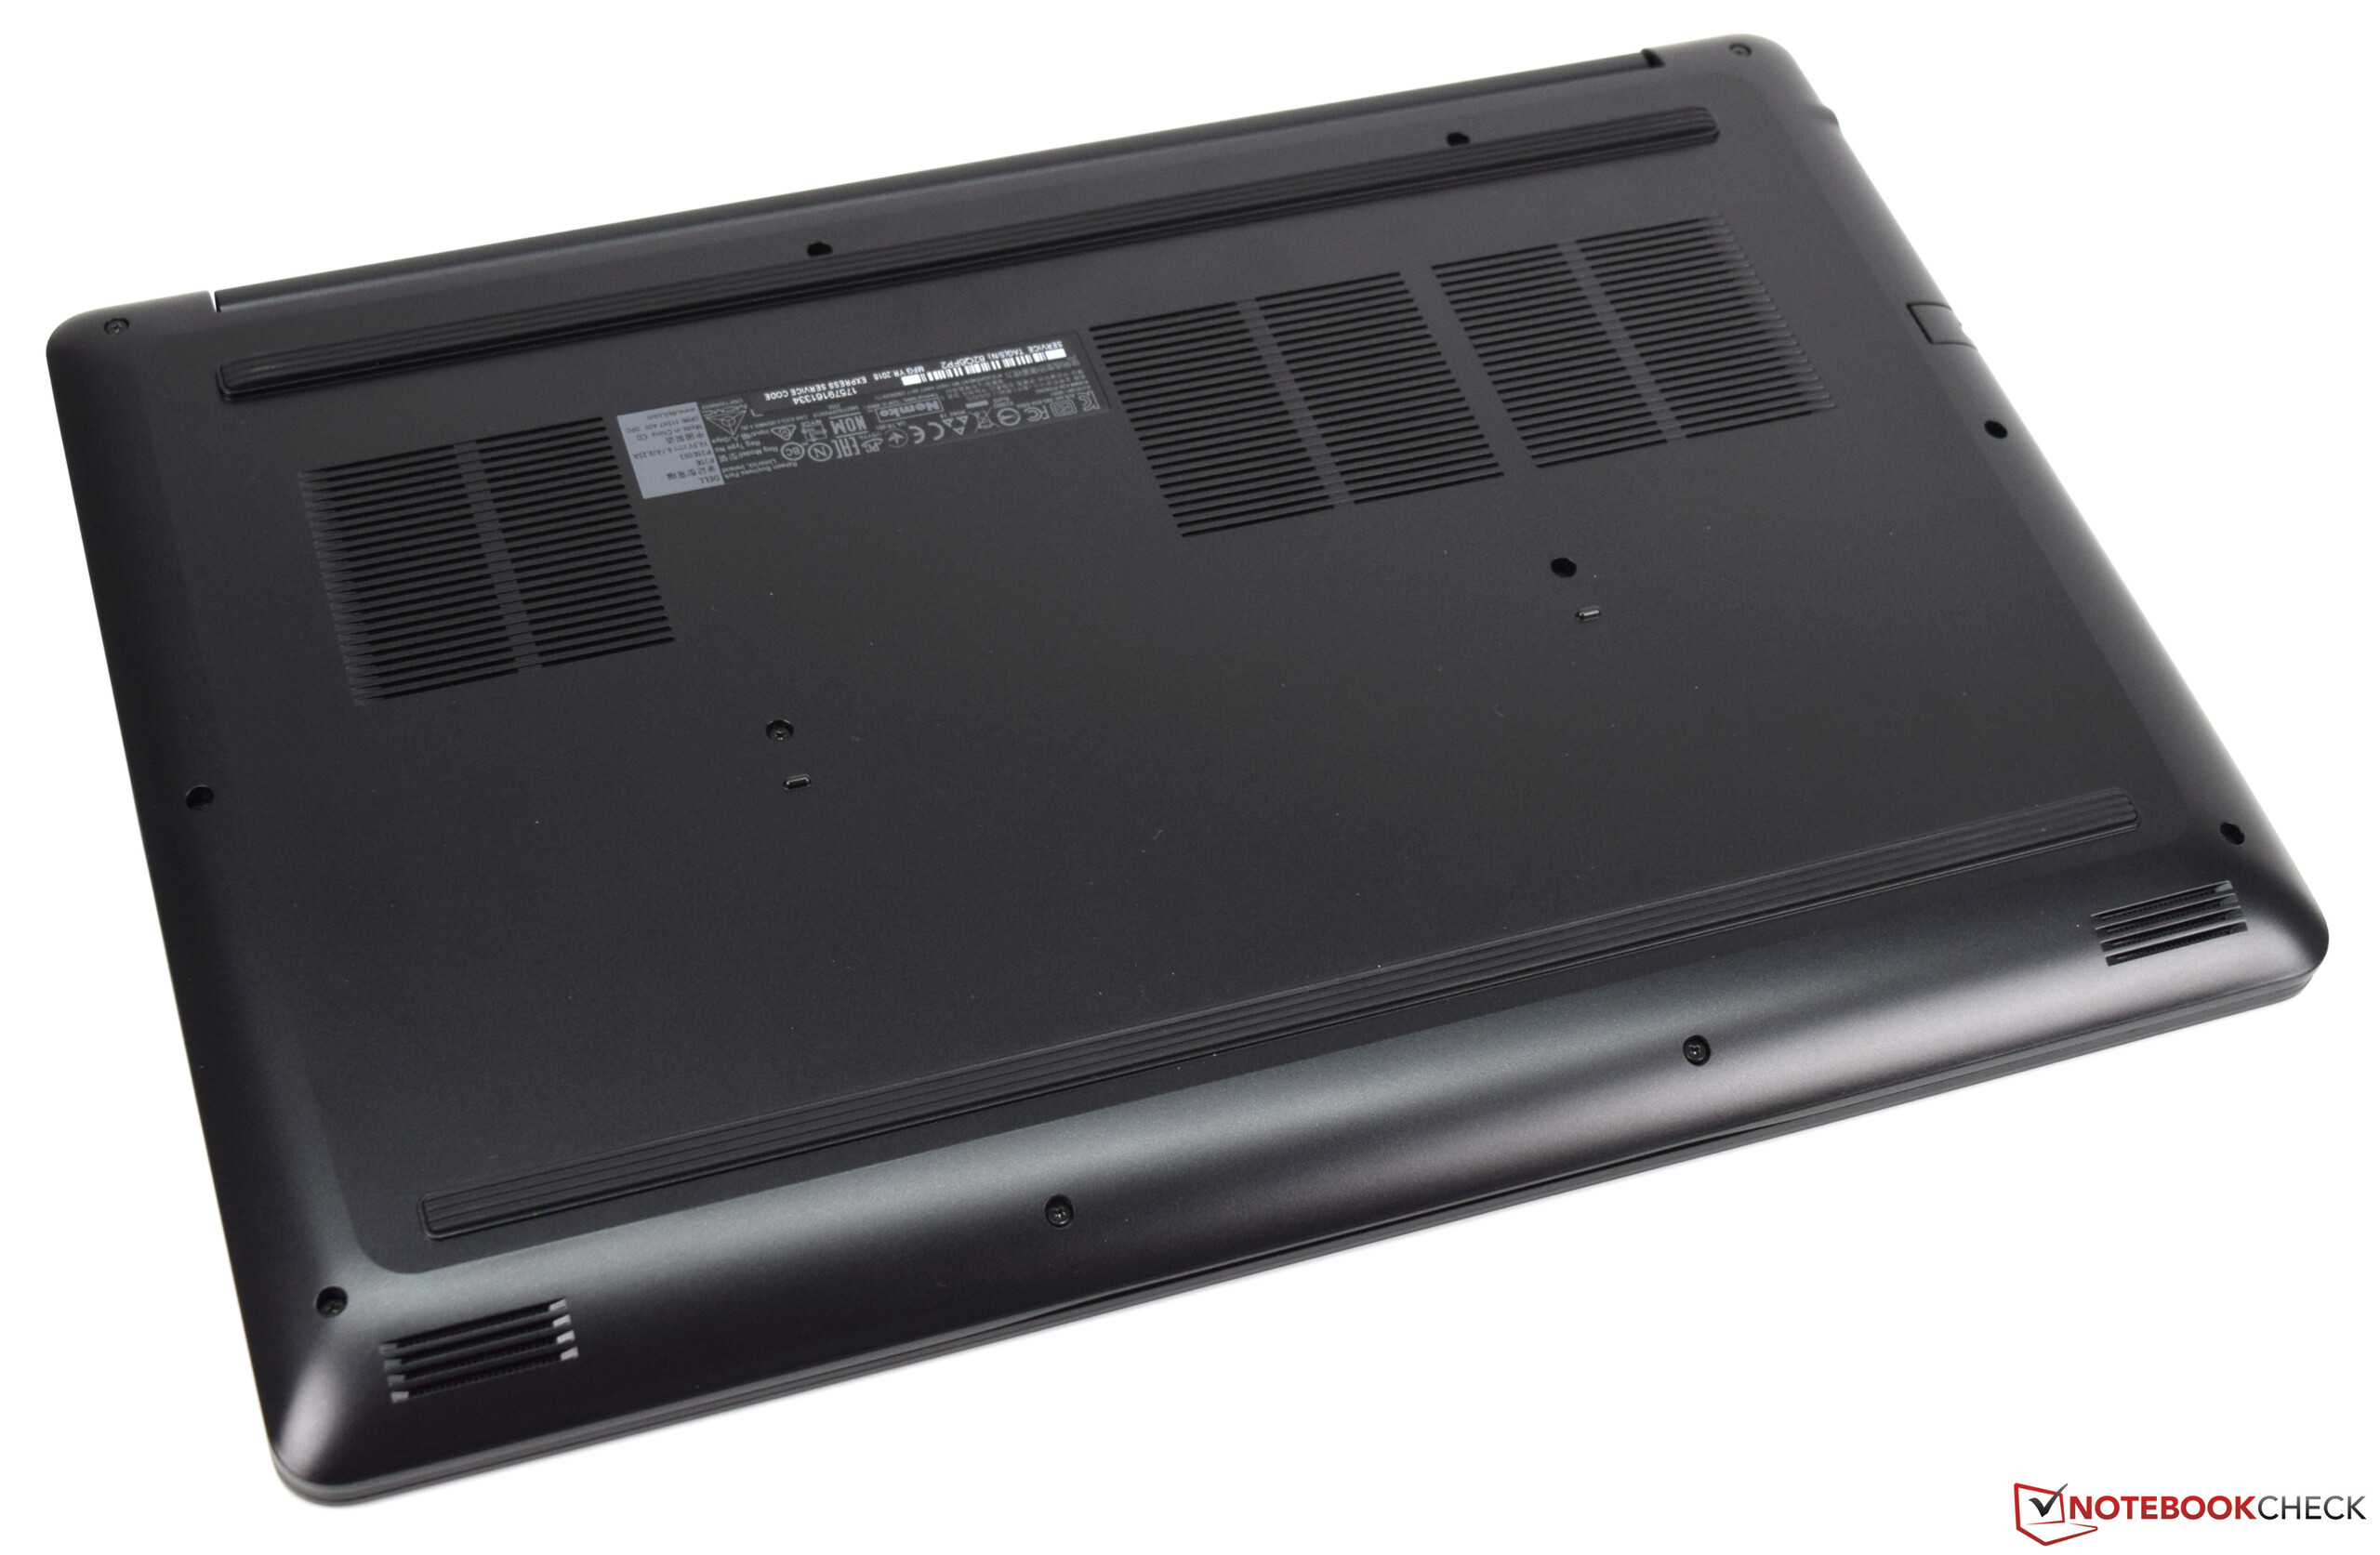
(-) Den maximala temperaturen på ovansidan är 53 °C / 127 F, jämfört med genomsnittet av 40.4 °C / 105 F , allt från 21.2 till 68.8 °C för klassen Gaming.
(-) Botten värms upp till maximalt 60.5 °C / 141 F, jämfört med genomsnittet av 43.2 °C / 110 F
(+) Vid tomgångsbruk är medeltemperaturen för ovansidan 28 °C / 82 F, jämfört med enhetsgenomsnittet på 33.9 °C / ### class_avg_f### F.
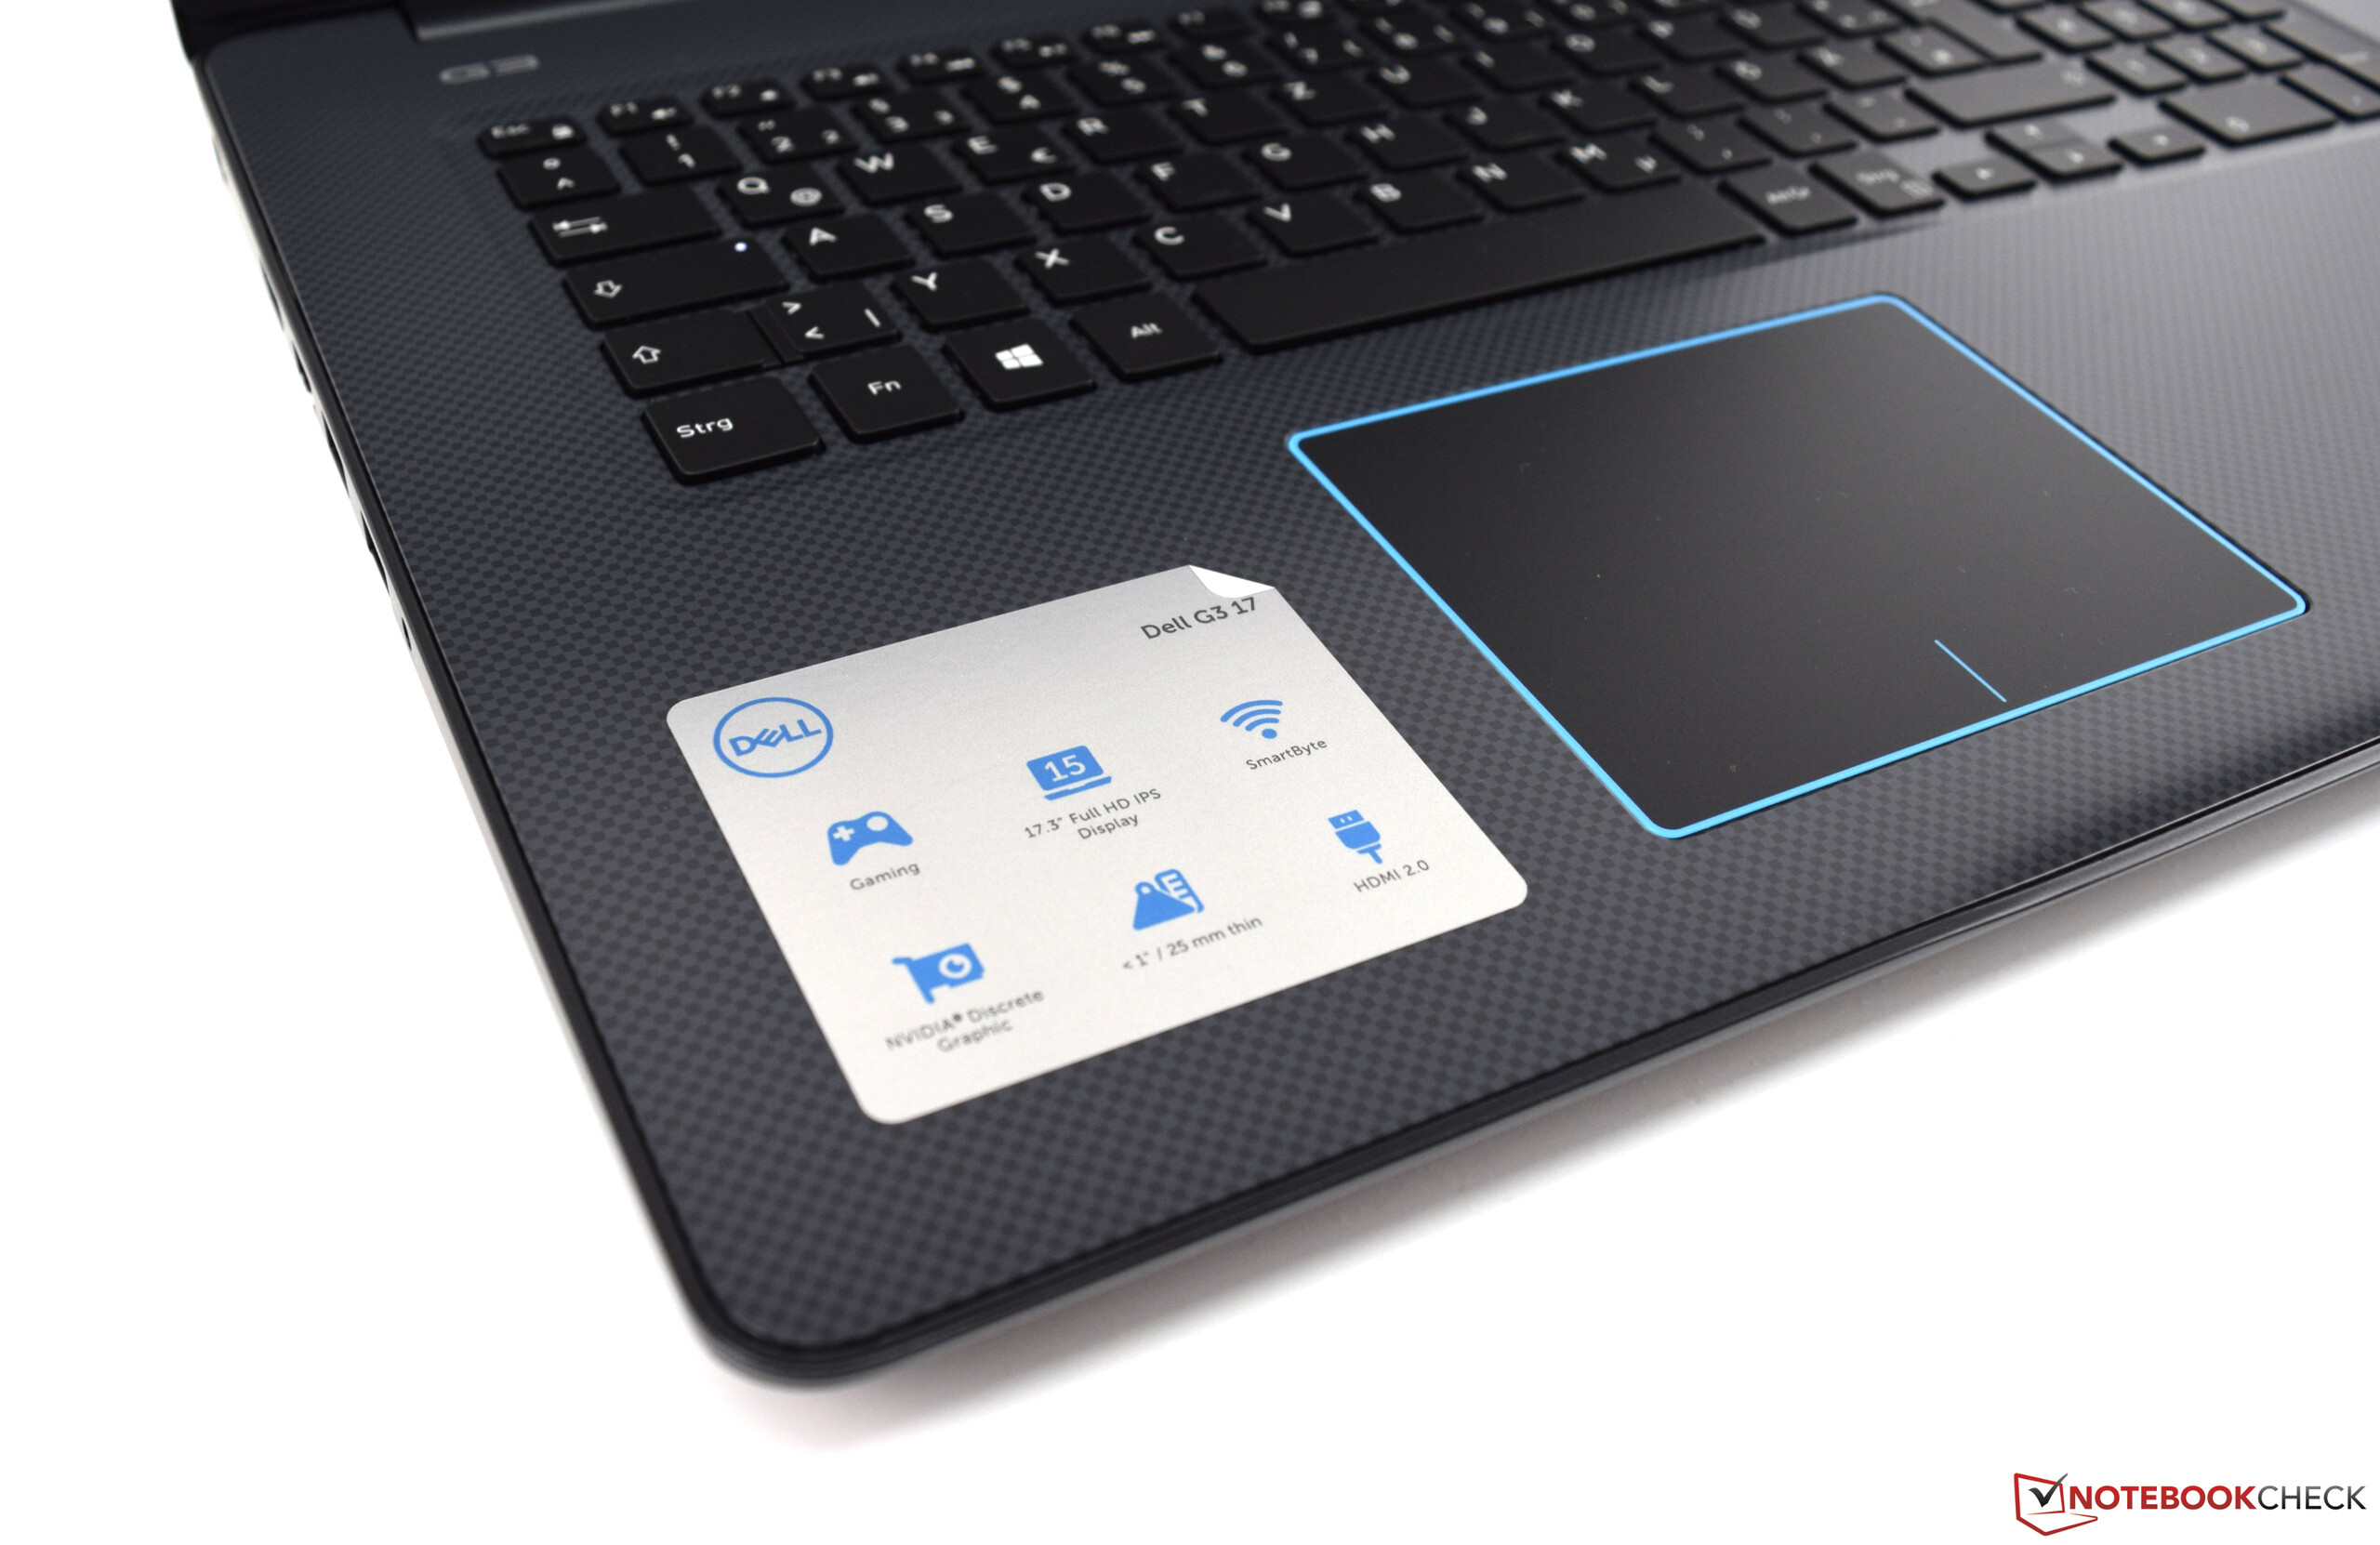
(+) Handledsstöden och pekplattan är kallare än hudtemperaturen med maximalt 27.6 °C / 81.7 F och är därför svala att ta på.
(±) Medeltemperaturen för handledsstödsområdet på liknande enheter var 28.8 °C / 83.8 F (+1.2 °C / 2.1 F).
| Dell G3 17 3779 GeForce GTX 1050 Mobile, i5-8300H, SK hynix SC311 SATA | Acer Predator Helios 300 PH317-52-51M6 GeForce GTX 1050 Ti Mobile, i5-8300H, Hynix HFS128G39TND | Asus ROG Strix GL702ZC-GC204T Radeon RX 580 (Laptop), R5 1600, Seagate Mobile HDD 1TB ST1000LX015-1U7172 | MSI GL72 7RDX-602 GeForce GTX 1050 Mobile, i7-7700HQ, HGST Travelstar 7K1000 HTS721010A9E630 | Acer Aspire Nitro BE VN7-793G-5811 GeForce GTX 1050 Ti Mobile, i5-7300HQ, Seagate Mobile HDD 1TB ST1000LM035 | Asus VivoBook Pro 17 N705UD-EH76 GeForce GTX 1050 Mobile, i5-8550U, Samsung PM961 NVMe MZVLW512HMJP | |
|---|---|---|---|---|---|---|
| Heat | 4% | -3% | 10% | 13% | 2% | |
| Maximum Upper Side * (°C) | 53 | 50 6% | 54.3 -2% | 45 15% | 48 9% | 46 13% |
| Maximum Bottom * (°C) | 60.5 | 52 14% | 51 16% | 44 27% | 40.8 33% | 56.2 7% |
| Idle Upper Side * (°C) | 30.3 | 33 -9% | 36 -19% | 29 4% | 29.9 1% | 28.6 6% |
| Idle Bottom * (°C) | 32 | 30 6% | 34.3 -7% | 34.2 -7% | 29.8 7% | 37.6 -18% |
* ... mindre är bättre
| Av/Standby | |
| Låg belastning | |
| Hög belastning |
|
Förklaring:
min: | |
| Dell G3 17 3779 i5-8300H, GeForce GTX 1050 Mobile, SK hynix SC311 SATA, IPS, 1920x1080, 17.3" | Acer Predator Helios 300 PH317-52-51M6 i5-8300H, GeForce GTX 1050 Ti Mobile, Hynix HFS128G39TND, IPS, 1920x1080, 17.3" | Asus ROG Strix GL702ZC-GC204T R5 1600, Radeon RX 580 (Laptop), Seagate Mobile HDD 1TB ST1000LX015-1U7172, IPS, 1920x1080, 17.3" | MSI GL72 7RDX-602 i7-7700HQ, GeForce GTX 1050 Mobile, HGST Travelstar 7K1000 HTS721010A9E630, TN LED, 1920x1080, 17.3" | Acer Aspire Nitro BE VN7-793G-5811 i5-7300HQ, GeForce GTX 1050 Ti Mobile, Seagate Mobile HDD 1TB ST1000LM035, IPS, 1920x1080, 17.3" | Asus VivoBook Pro 17 N705UD-EH76 i5-8550U, GeForce GTX 1050 Mobile, Samsung PM961 NVMe MZVLW512HMJP, IPS, 1920x1080, 17.3" | Genomsnitt NVIDIA GeForce GTX 1050 Mobile | Genomsnitt av klass Gaming | |
|---|---|---|---|---|---|---|---|---|
| Power Consumption | 10% | -282% | -14% | -0% | 22% | 11% | -65% | |
| Idle Minimum * (Watt) | 7.7 | 6 22% | 49 -536% | 9.6 -25% | 8.7 -13% | 5.06 34% | 6.99 ? 9% | 13 ? -69% |
| Idle Average * (Watt) | 14 | 9 36% | 60 -329% | 15 -7% | 12.4 11% | 10.3 26% | 10.7 ? 24% | 19 ? -36% |
| Idle Maximum * (Watt) | 15.5 | 13 16% | 68 -339% | 16.5 -6% | 15.4 1% | 10.7 31% | 12.7 ? 18% | 24.5 ? -58% |
| Load Average * (Watt) | 95 | 95 -0% | 150 -58% | 104 -9% | 73 23% | 83 13% | 82.9 ? 13% | 111.1 ? -17% |
| Load Maximum * (Watt) | 106 | 134 -26% | 262 -147% | 129 -22% | 130 -23% | 99.9 6% | 115.3 ? -9% | 260 ? -145% |
| Witcher 3 ultra * (Watt) | 102 | 214 | 98 | 92.4 |
* ... mindre är bättre
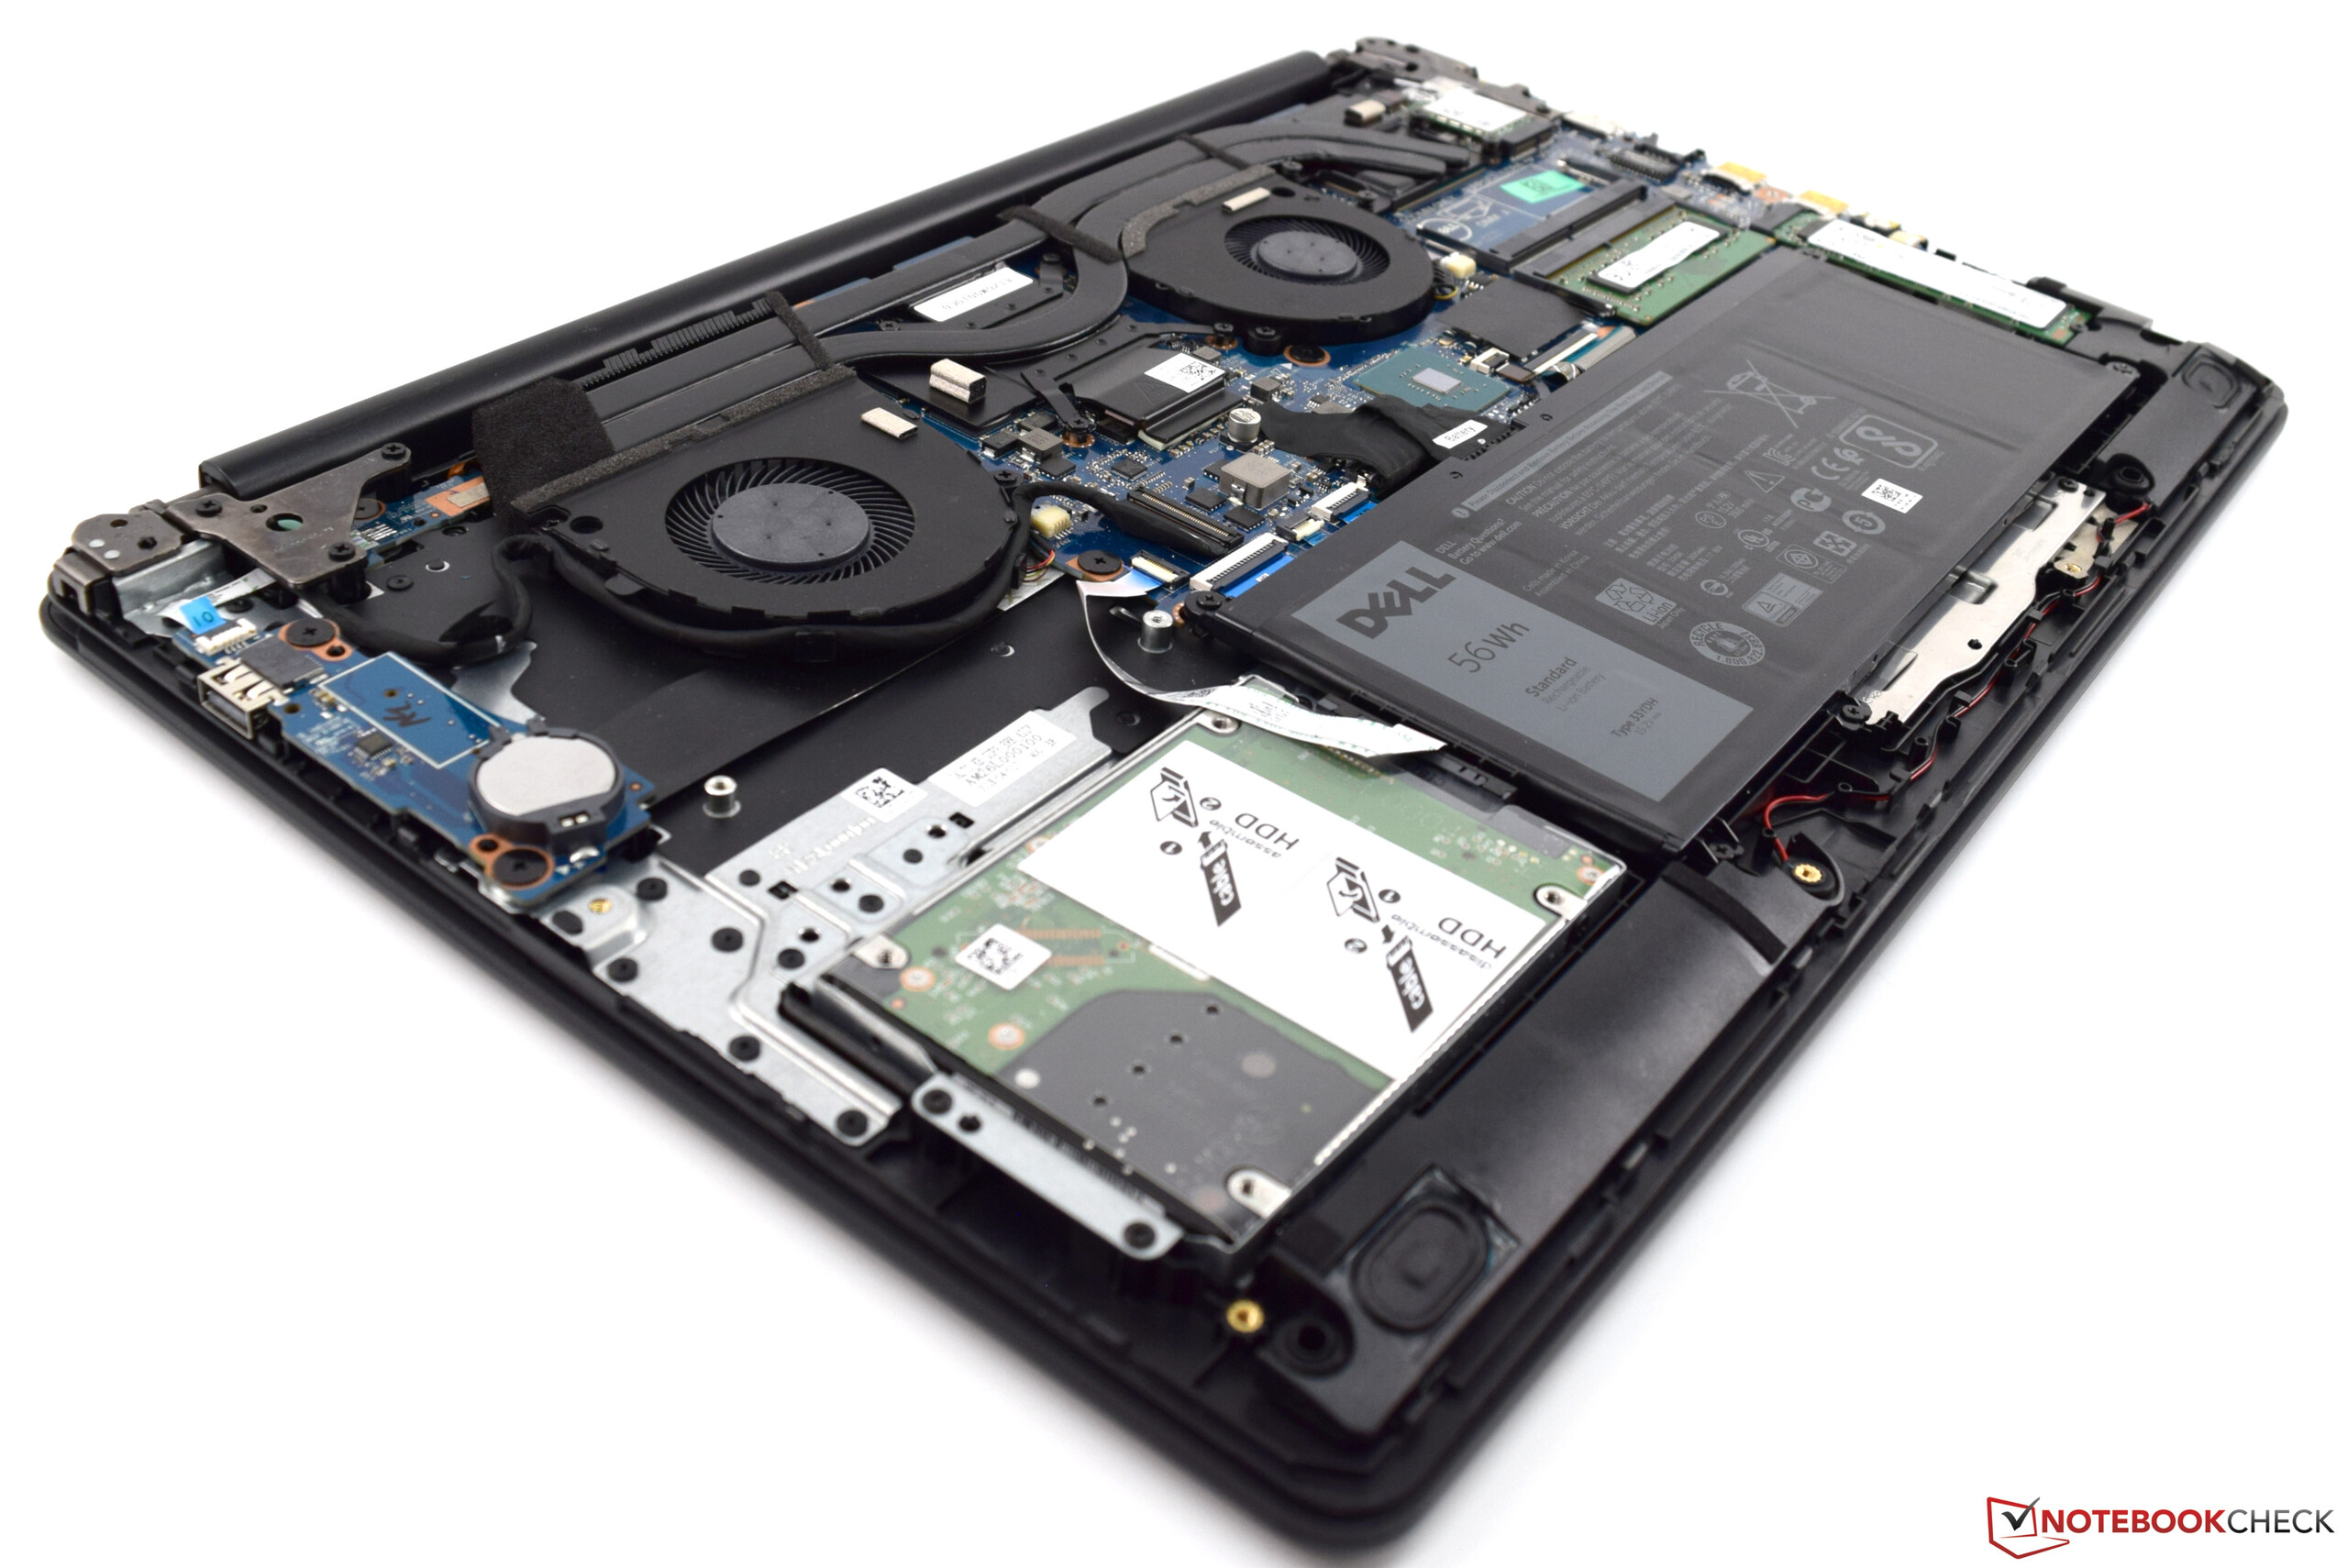
| Dell G3 17 3779 i5-8300H, GeForce GTX 1050 Mobile, 56 Wh | Acer Predator Helios 300 PH317-52-51M6 i5-8300H, GeForce GTX 1050 Ti Mobile, 48 Wh | Asus ROG Strix GL702ZC-GC204T R5 1600, Radeon RX 580 (Laptop), 74 Wh | MSI GL72 7RDX-602 i7-7700HQ, GeForce GTX 1050 Mobile, 43.2 Wh | Acer Aspire Nitro BE VN7-793G-5811 i5-7300HQ, GeForce GTX 1050 Ti Mobile, 52.5 Wh | Asus VivoBook Pro 17 N705UD-EH76 i5-8550U, GeForce GTX 1050 Mobile, 42 Wh | Genomsnitt av klass Gaming | |
|---|---|---|---|---|---|---|---|
| Batteridrifttid | -7% | -78% | -53% | -21% | -41% | 5% | |
| Reader / Idle (h) | 12.2 | 11.8 -3% | 5.5 -55% | 8.27 ? -32% | |||
| H.264 (h) | 5.3 | 2.8 -47% | 8.32 ? 57% | ||||
| WiFi v1.3 (h) | 5.8 | 5.9 2% | 1.3 -78% | 3.4 -41% | 4.6 -21% | 4.4 -24% | 7.11 ? 23% |
| Load (h) | 2.1 | 1.7 -19% | 0.7 -67% | 0.9 -57% | 1.502 ? -28% |
För
Emot

Läs den fullständiga versionen av den här recensionen på engelska här.
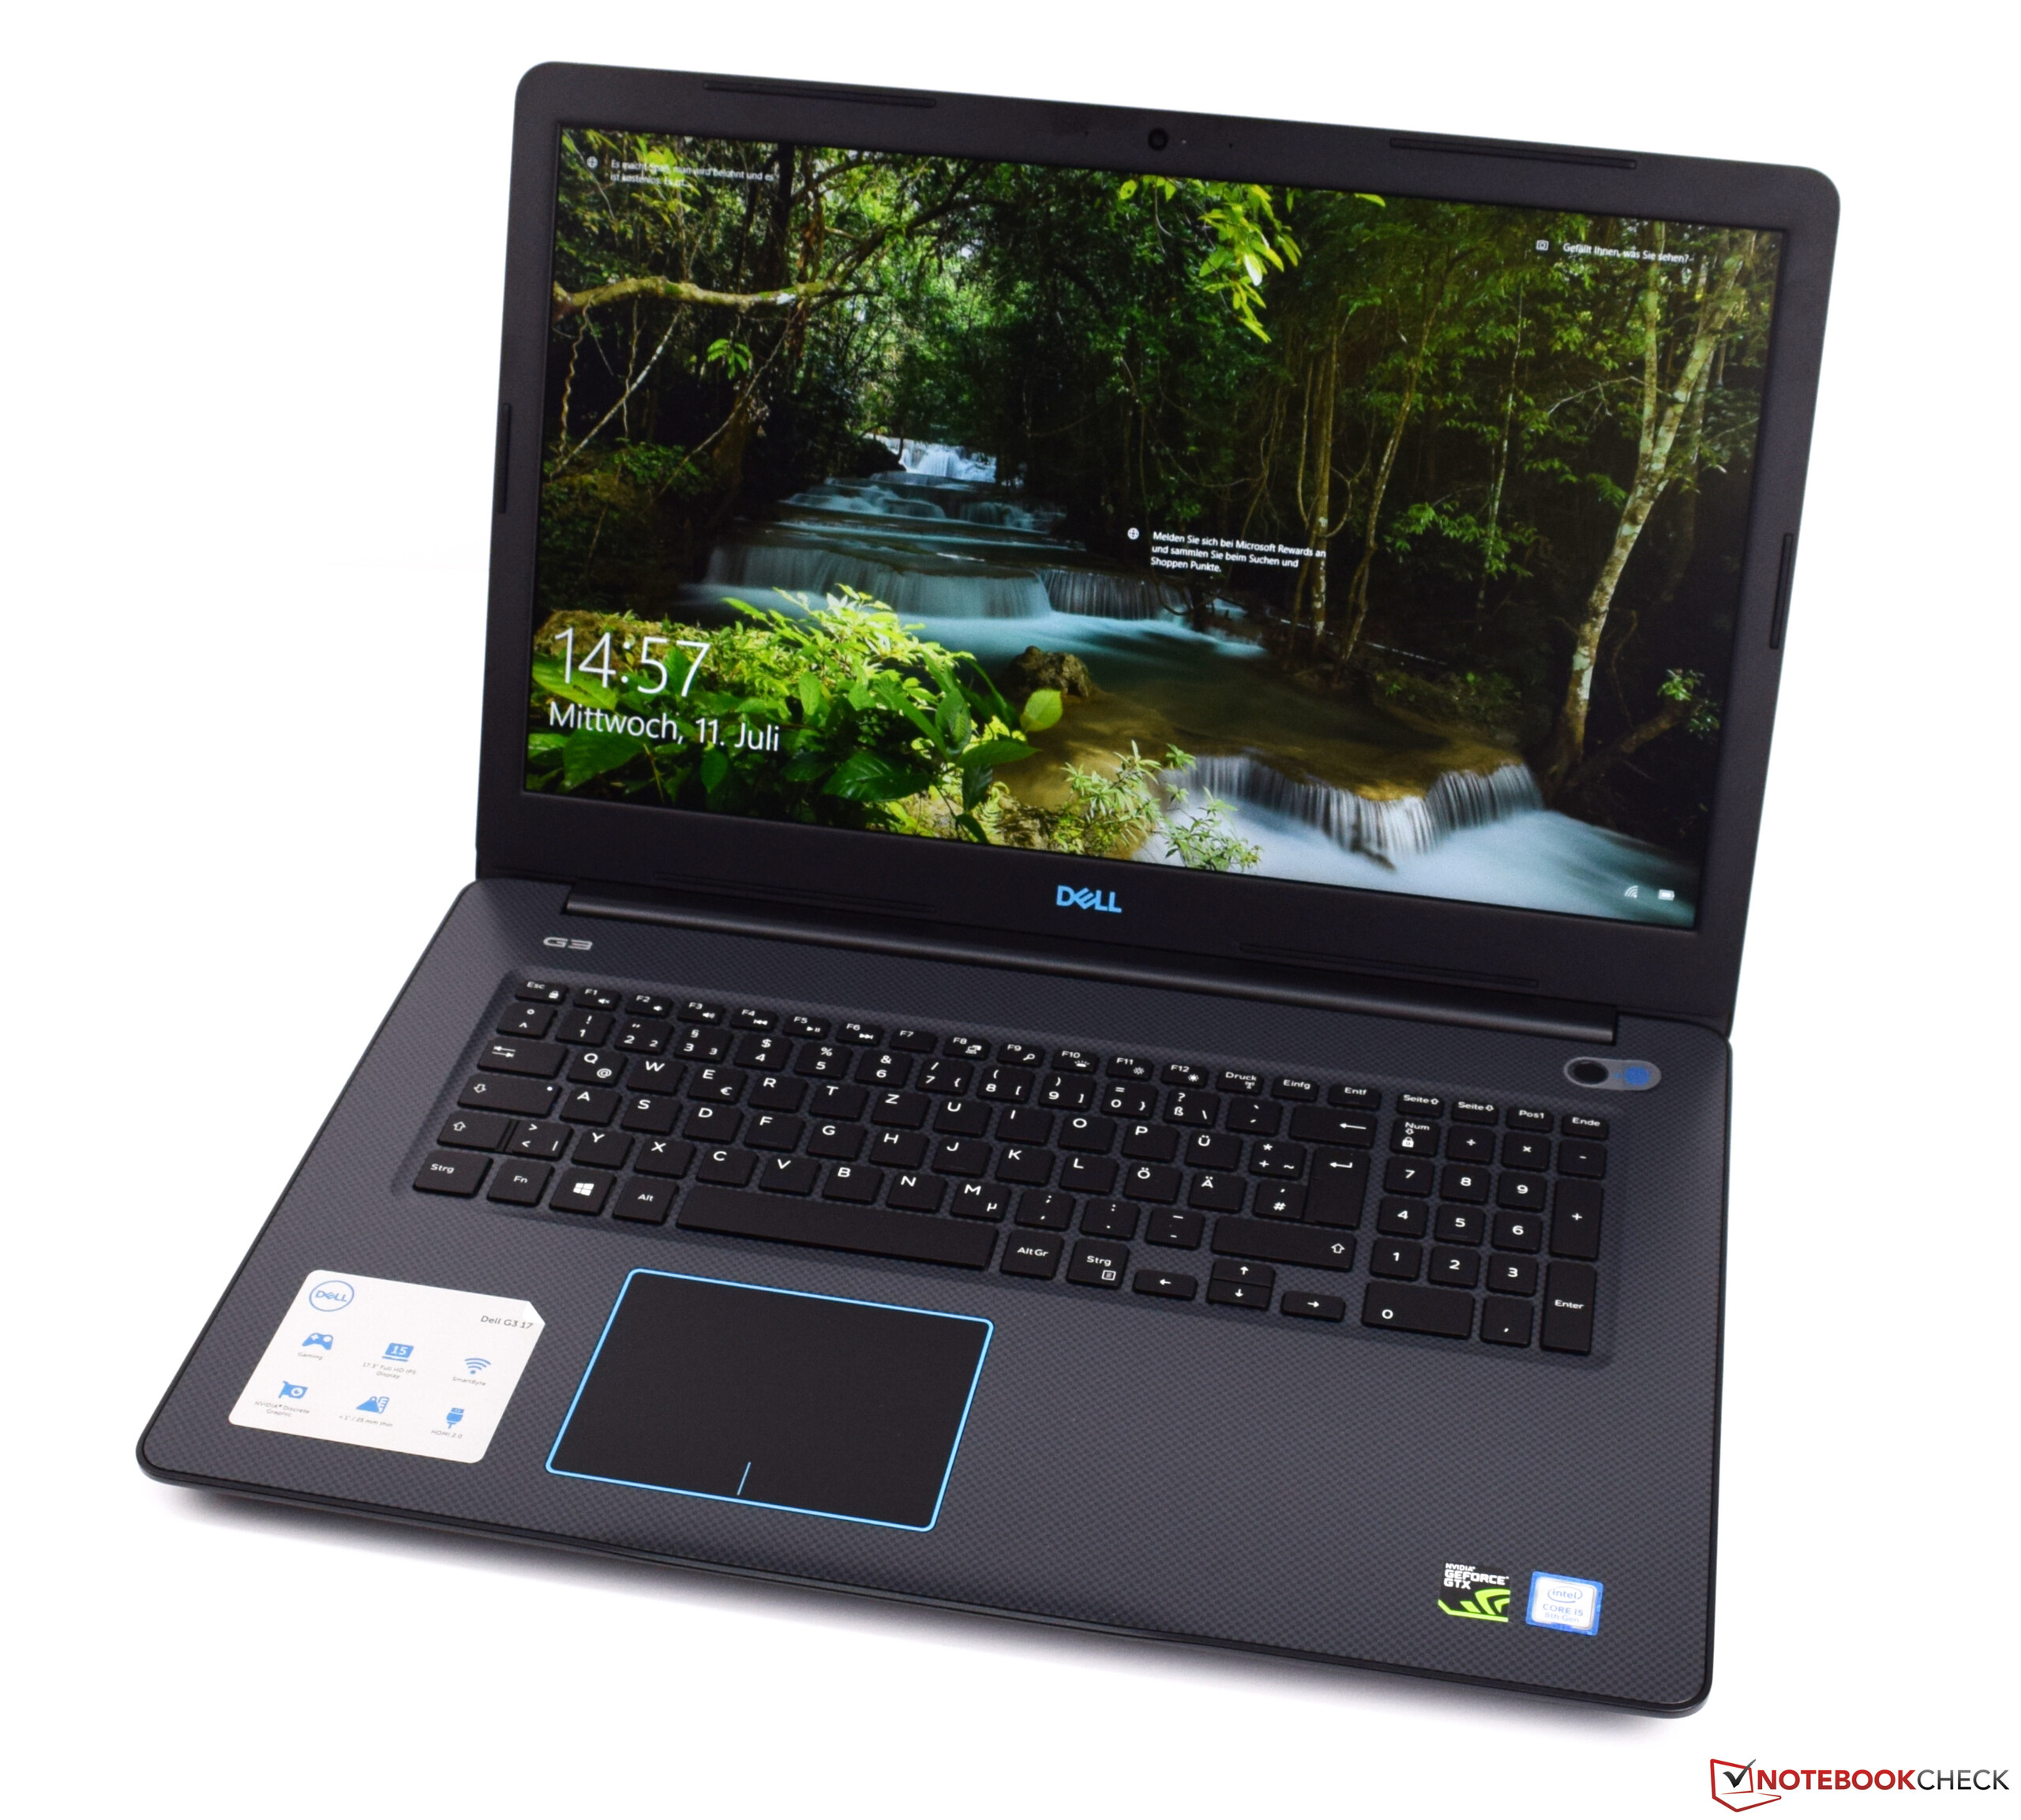
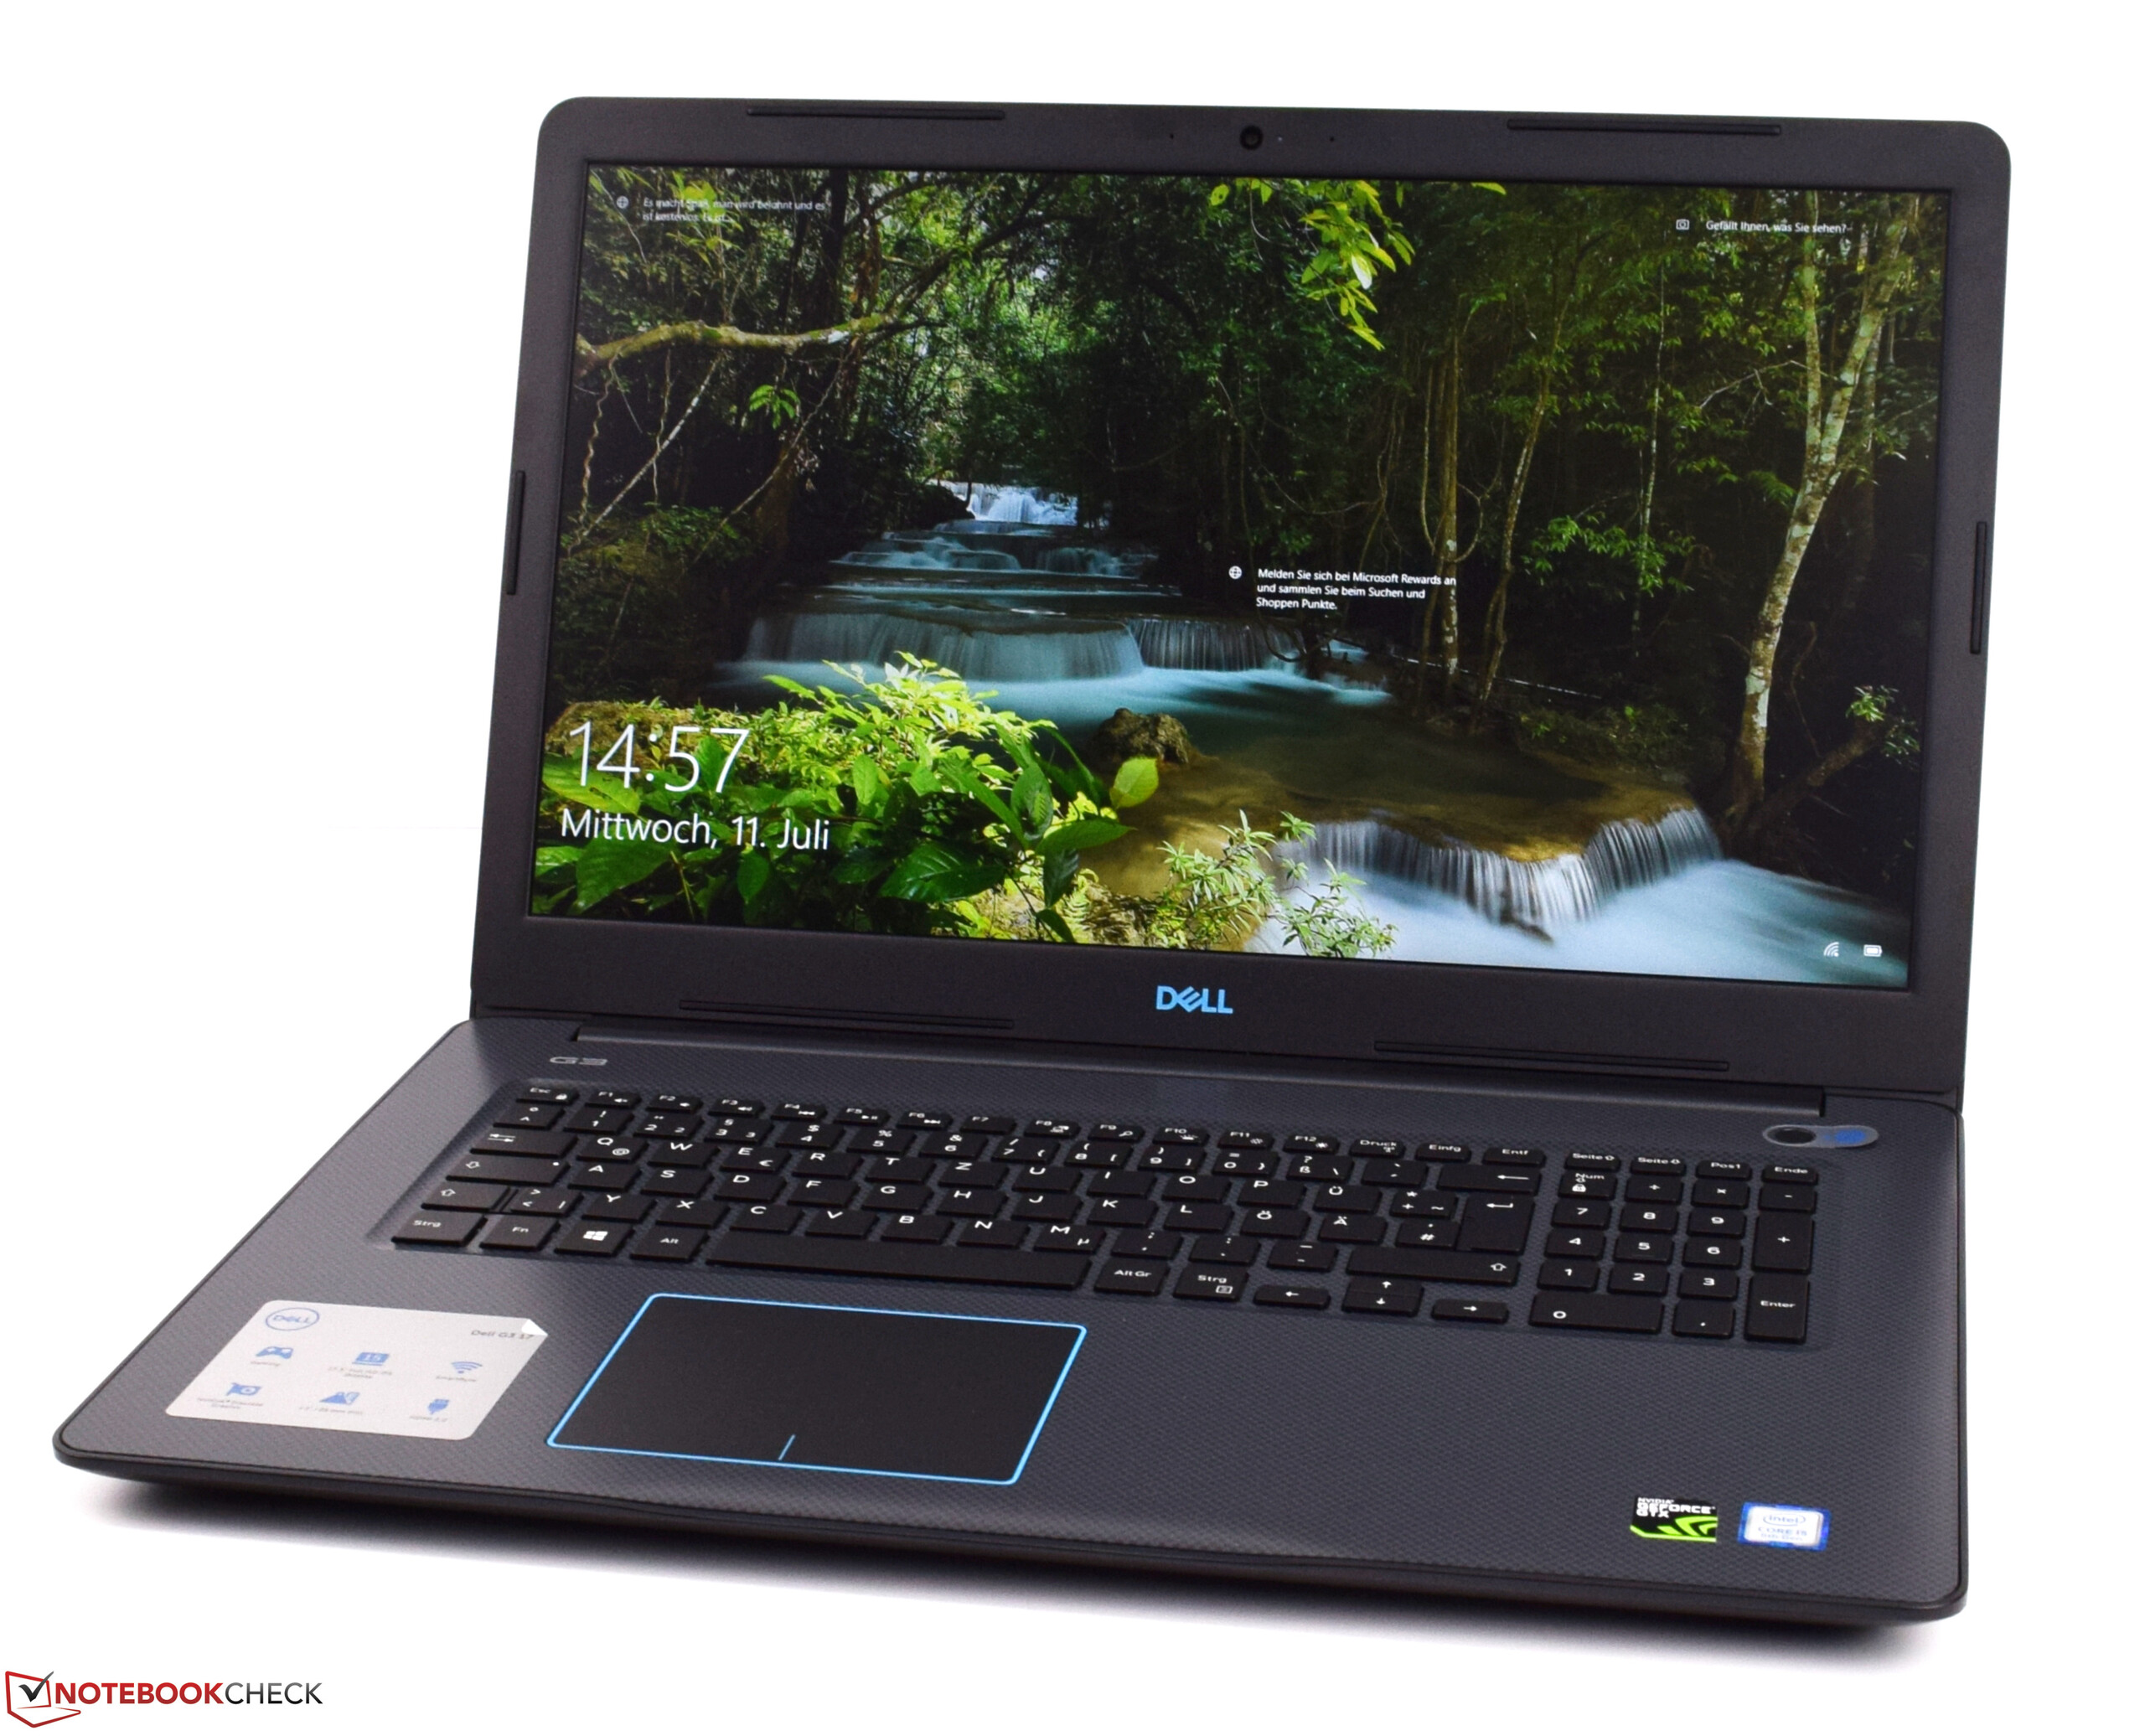
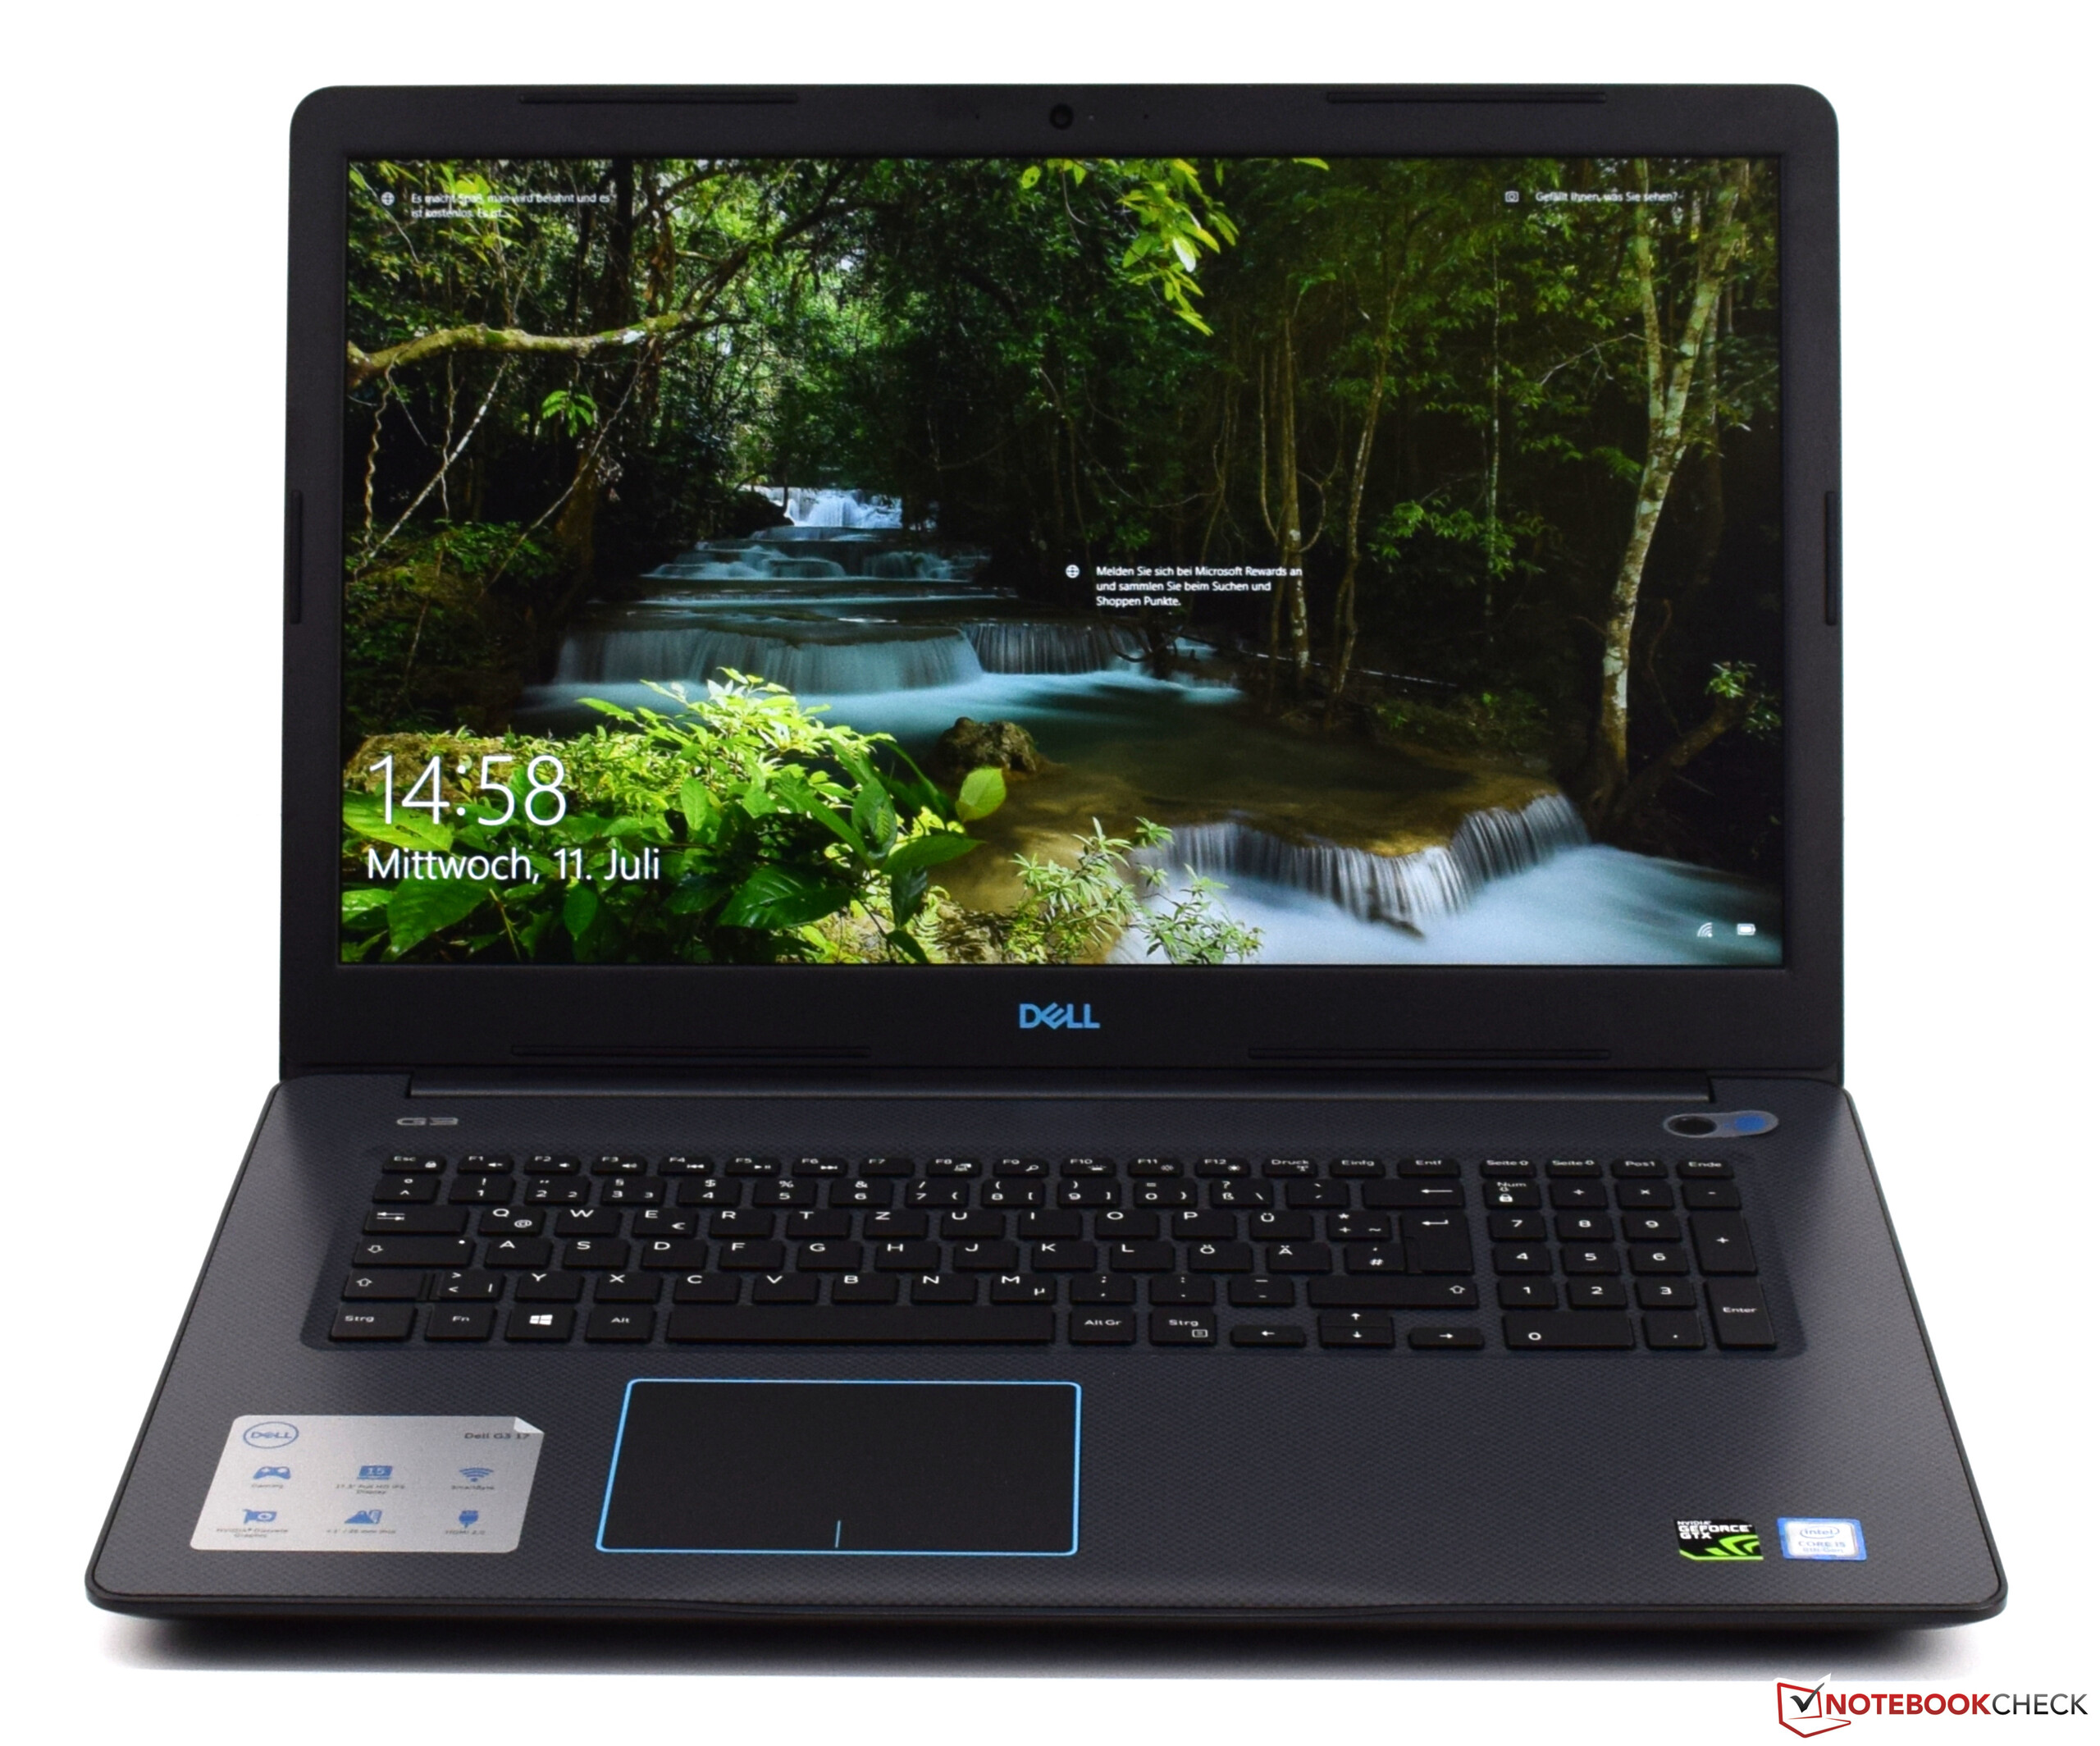
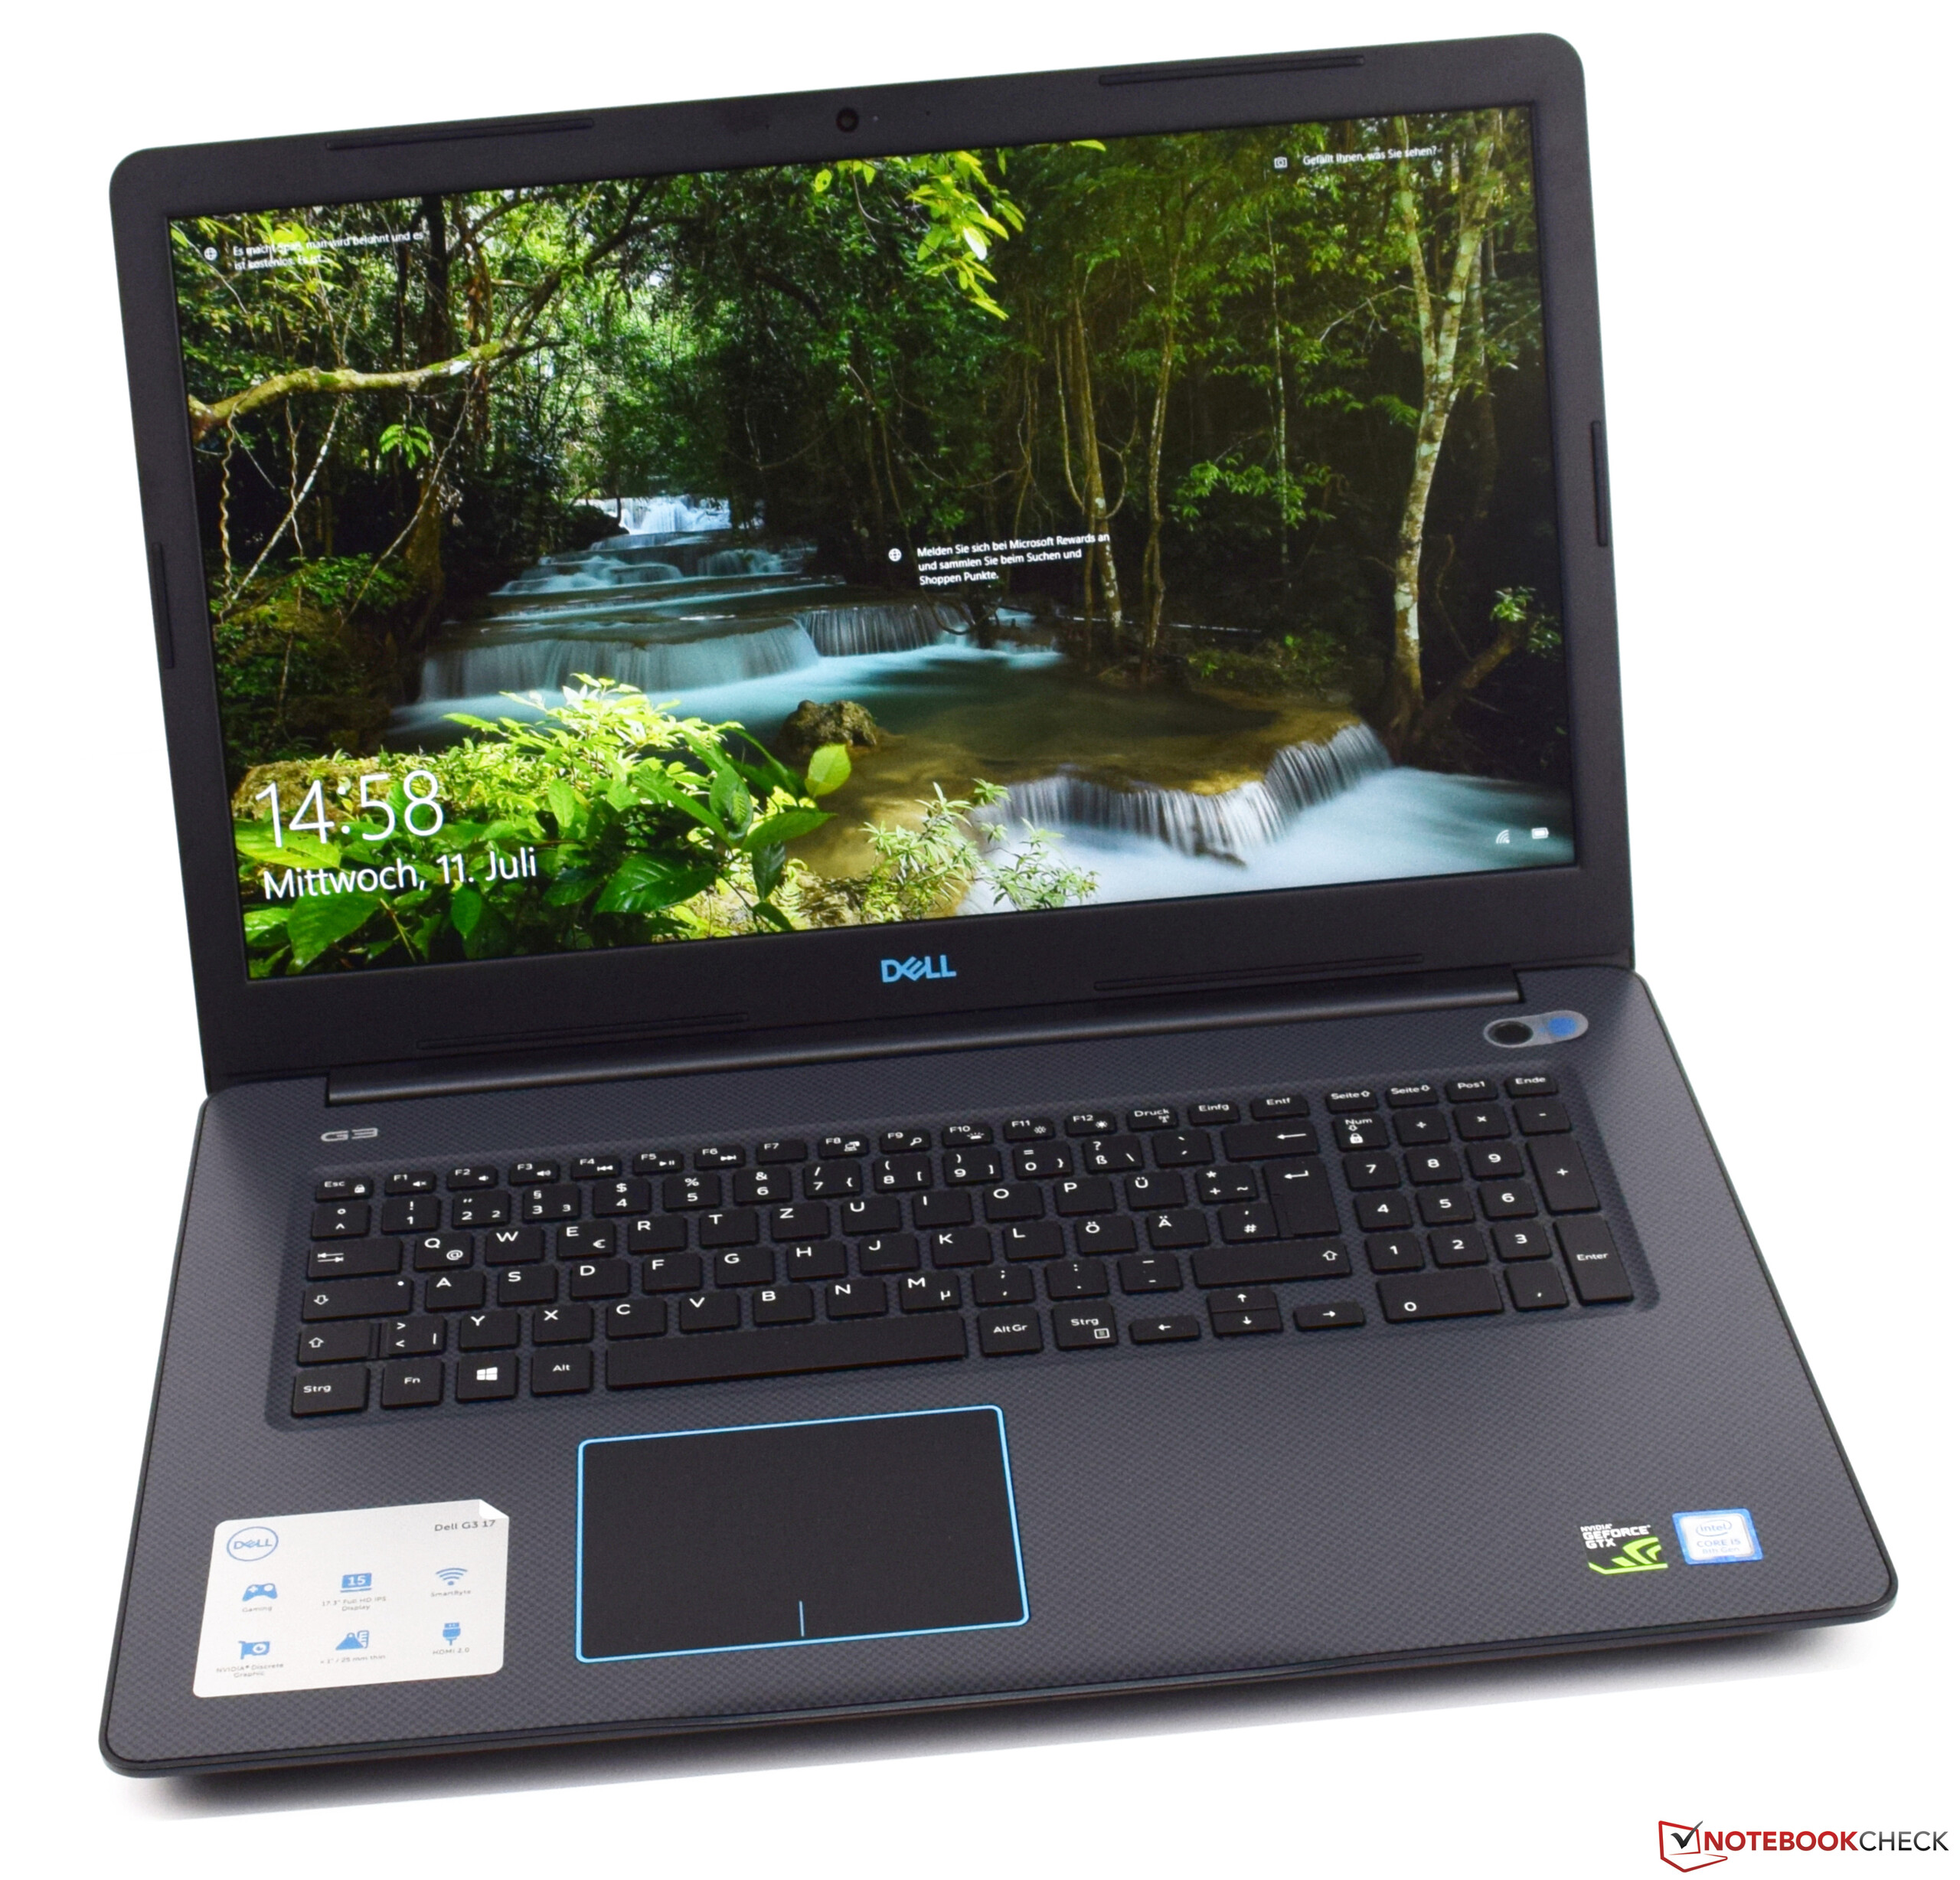
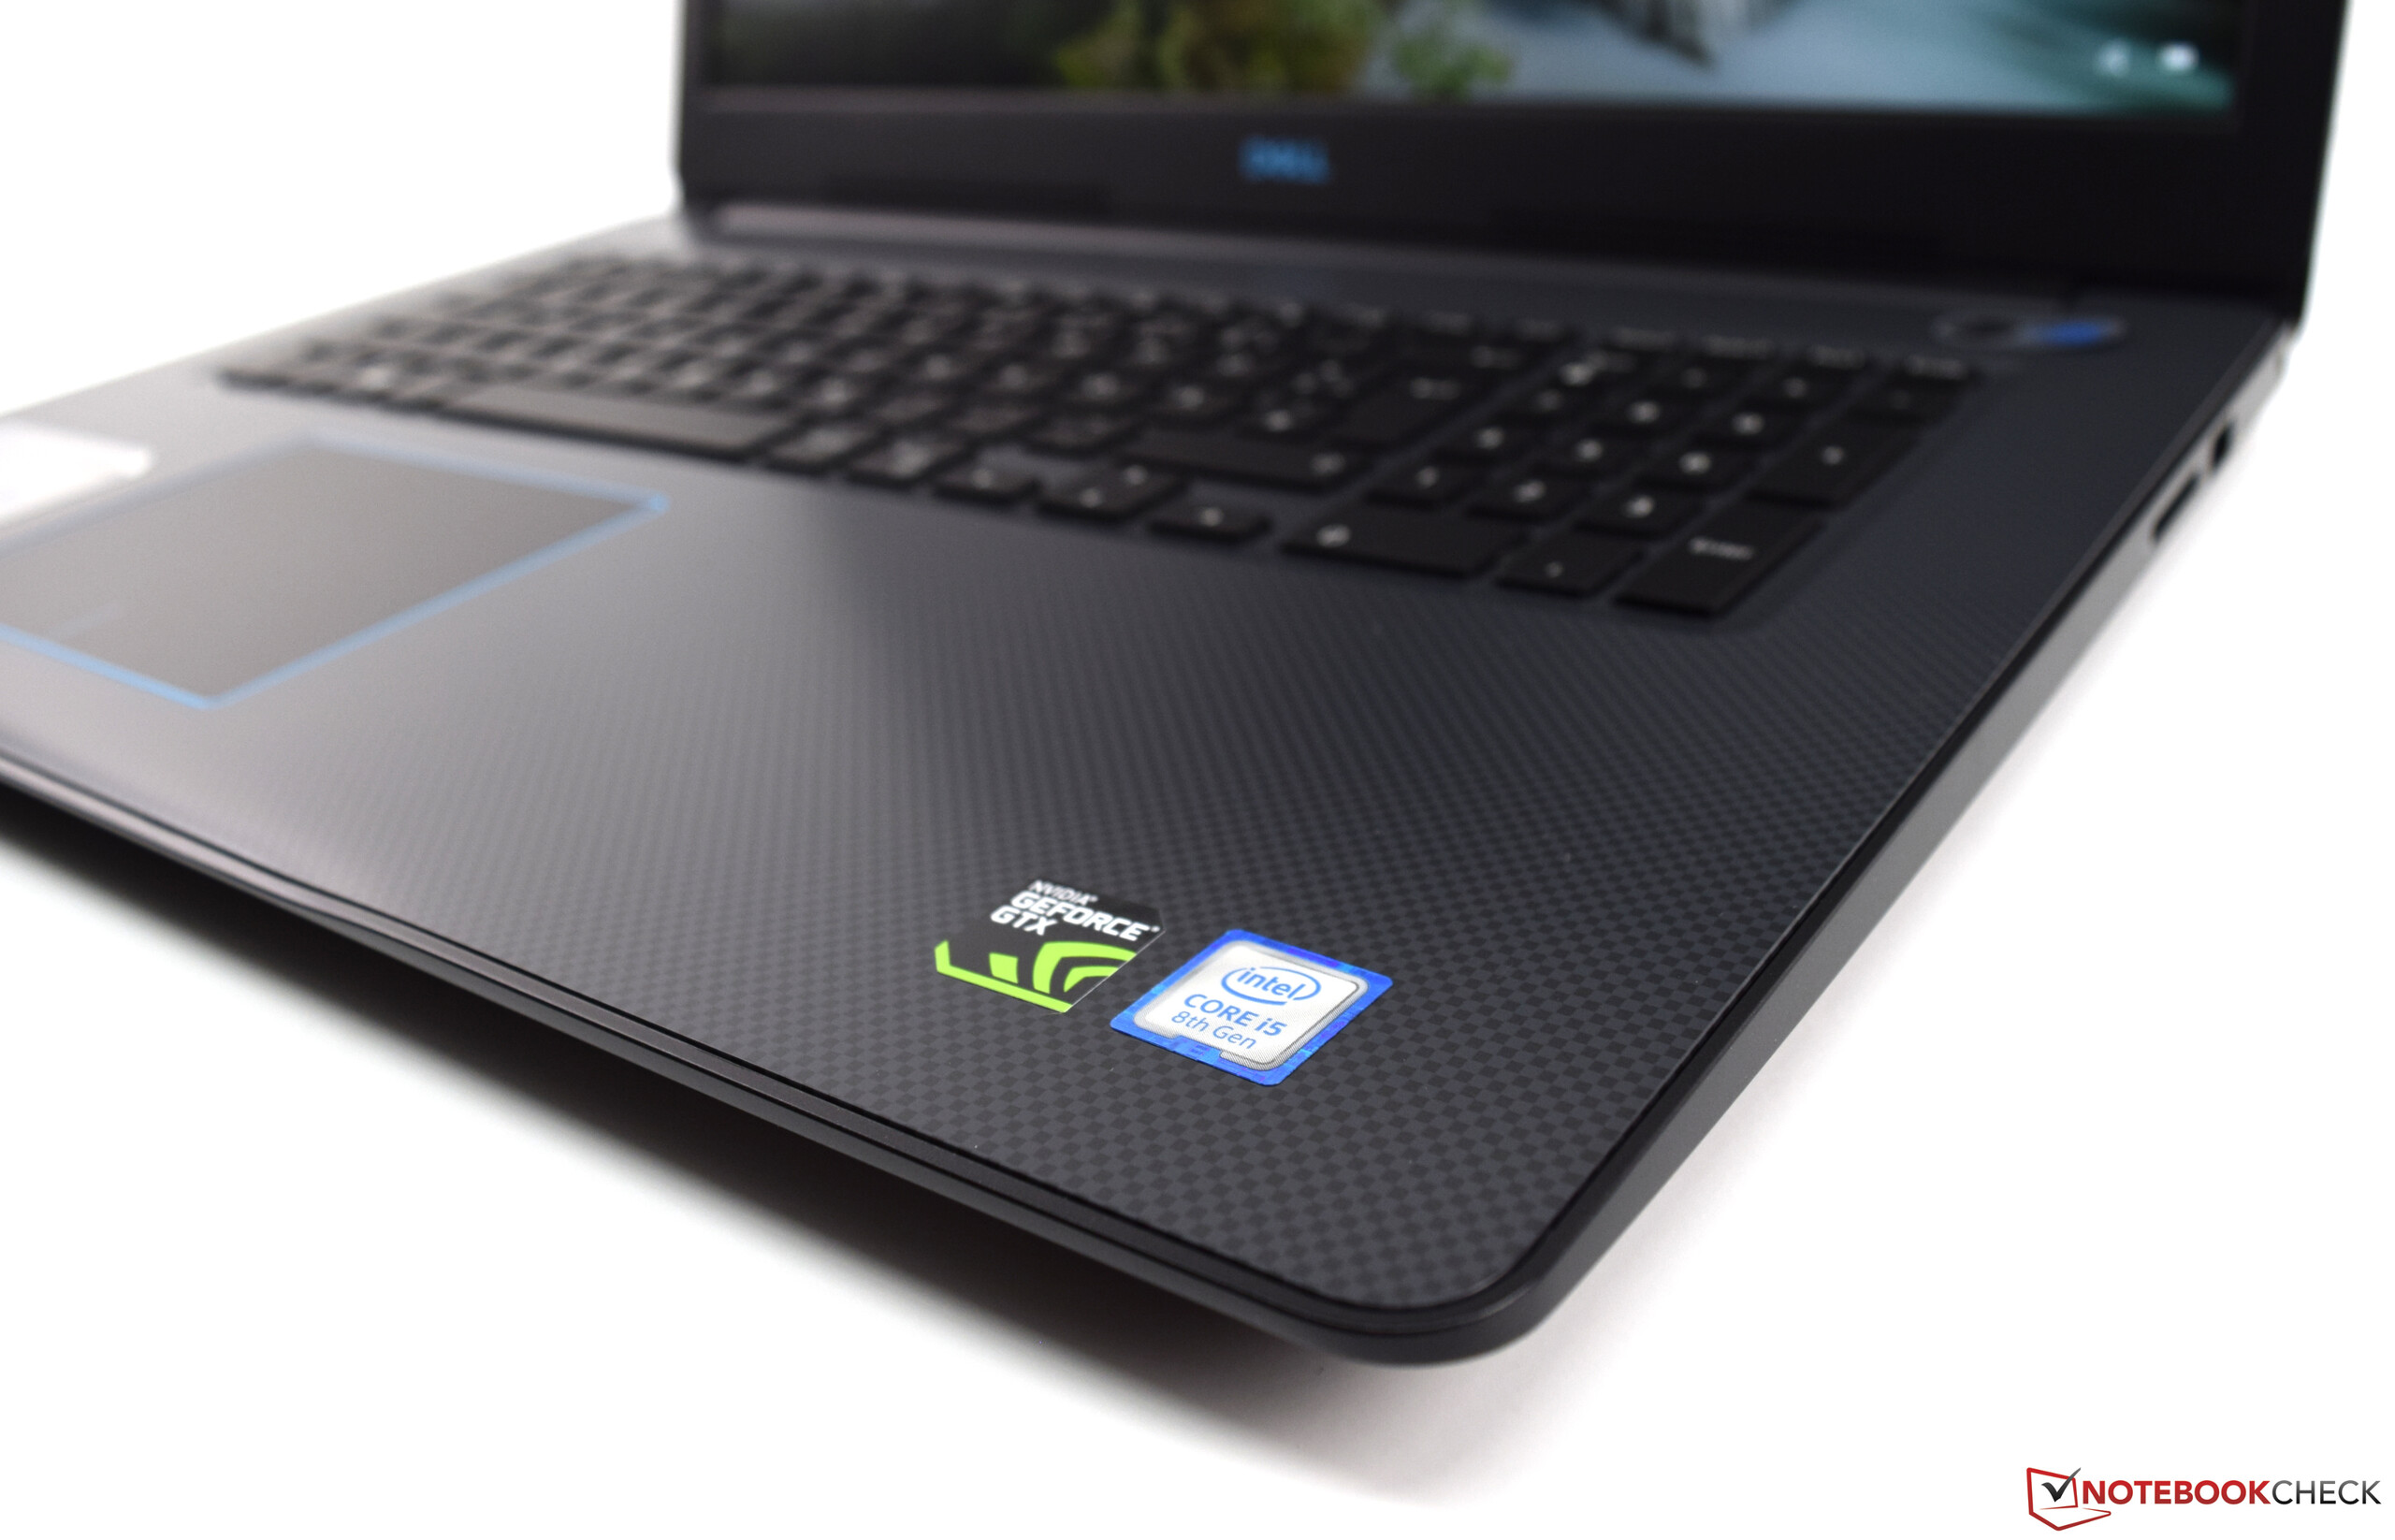
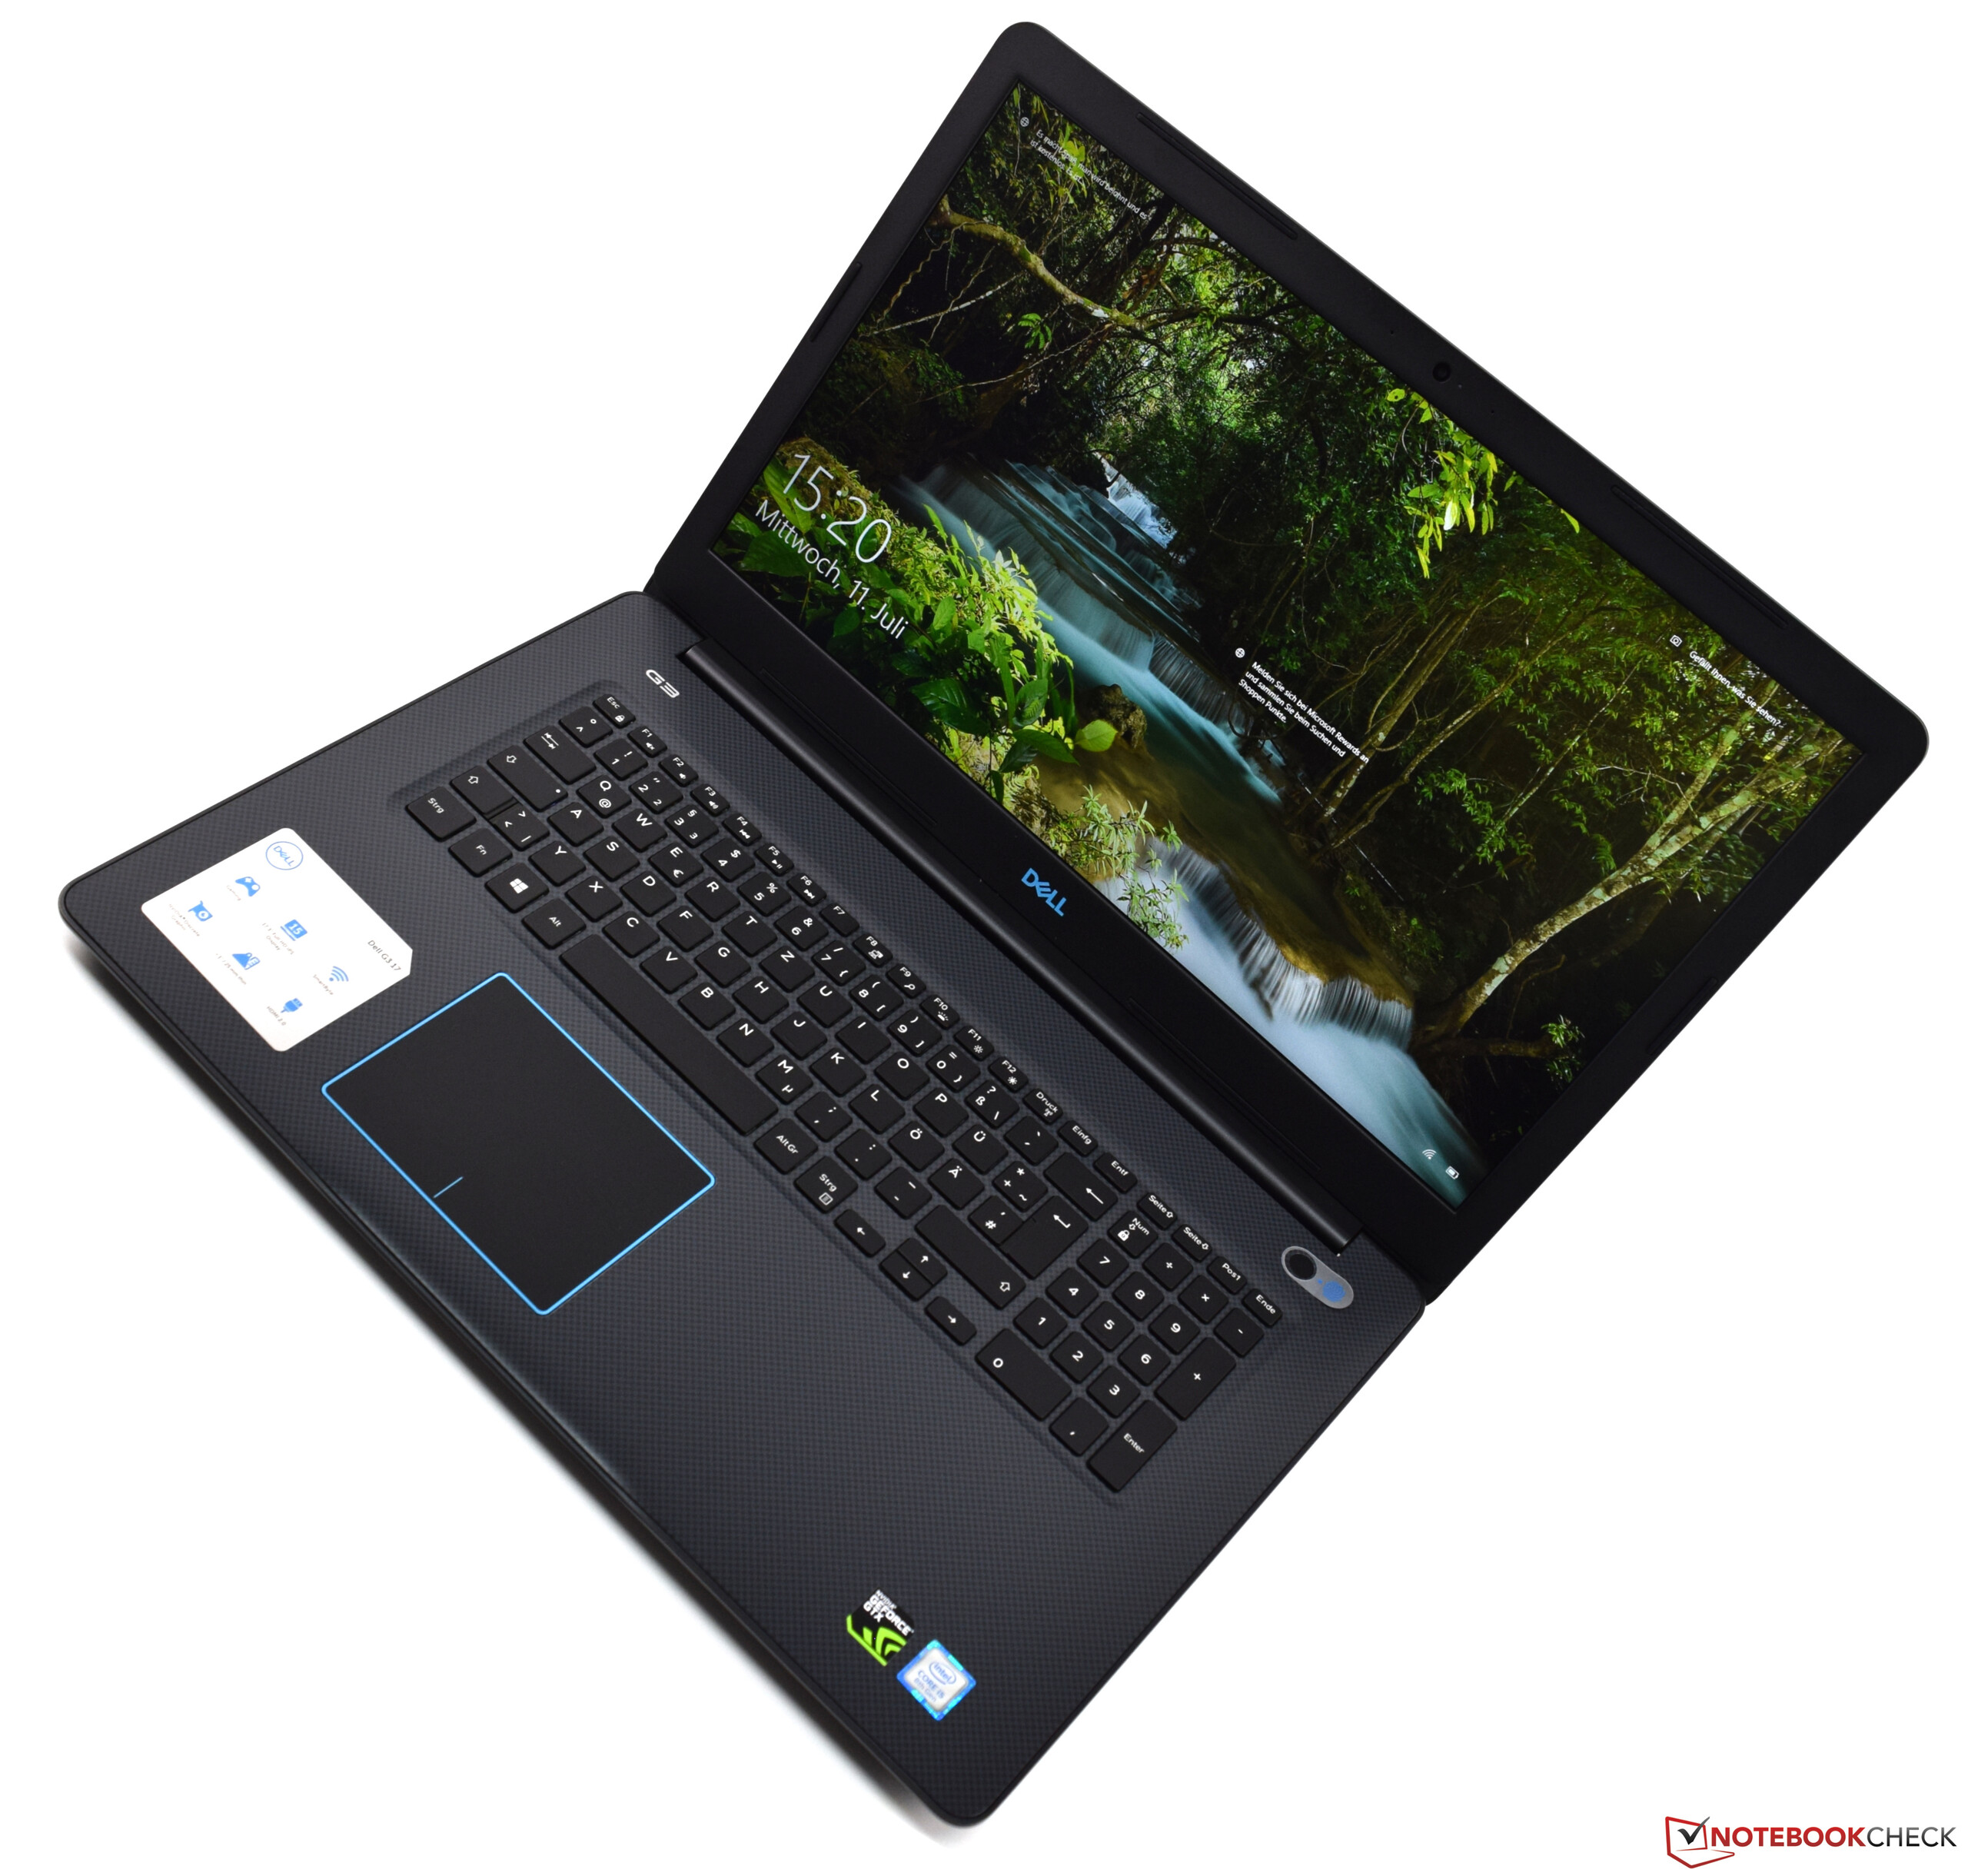
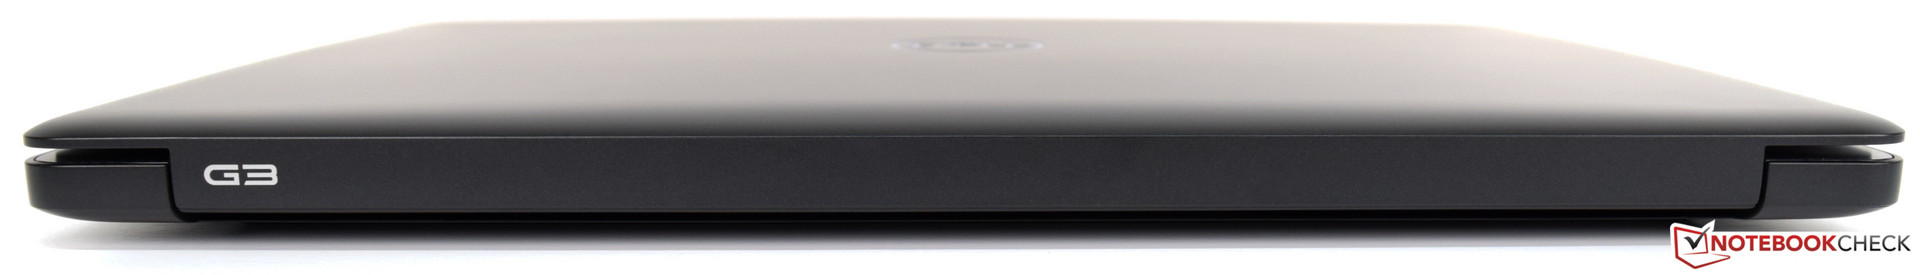
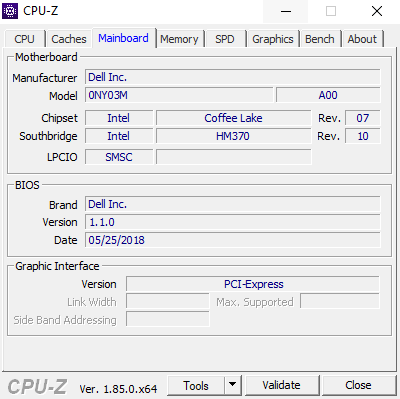
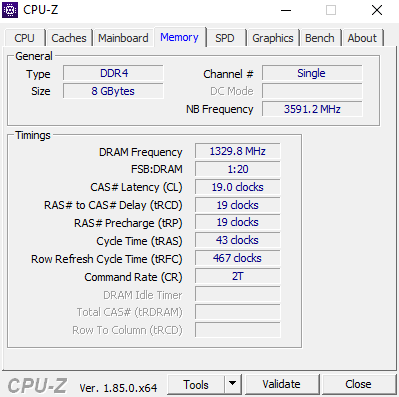
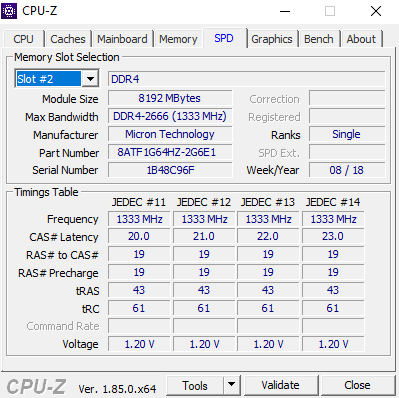
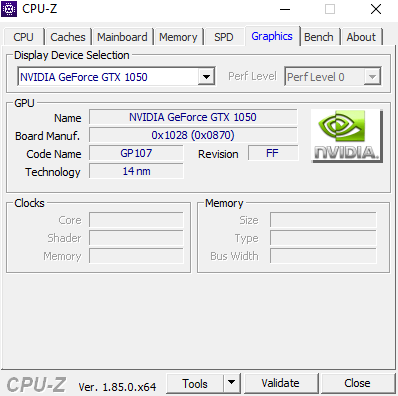
Med Dell G3 17 3779 har Dell en billig spellaptop i sitt utbud som nog kan hamna på slutlistan. Det går att välja dom senaste Coffee Lake-processorerna och med GeForce GTX 1050 så erbjuder Dell även ett skapligt grafikkort. För utgångspriset på 7.990 kronor får du även 8 GB RAM och en lagringslösning som kombinerar SSD och HDD. På så sätt utgör denna laptop på 17 tum en riktigt bra bas för att ta steget in i spelvärlden. Processorn har skaplig prestanda men anstränger ändå inte enheten vid batteridrift.
Dell G3 17 3779 lockar till stor del med ett bra förhållande mellan pris och prestanda. Mycket enhet för relativt lite pengar; det är vad Dell erbjuder med sin nya G3 17-serie.
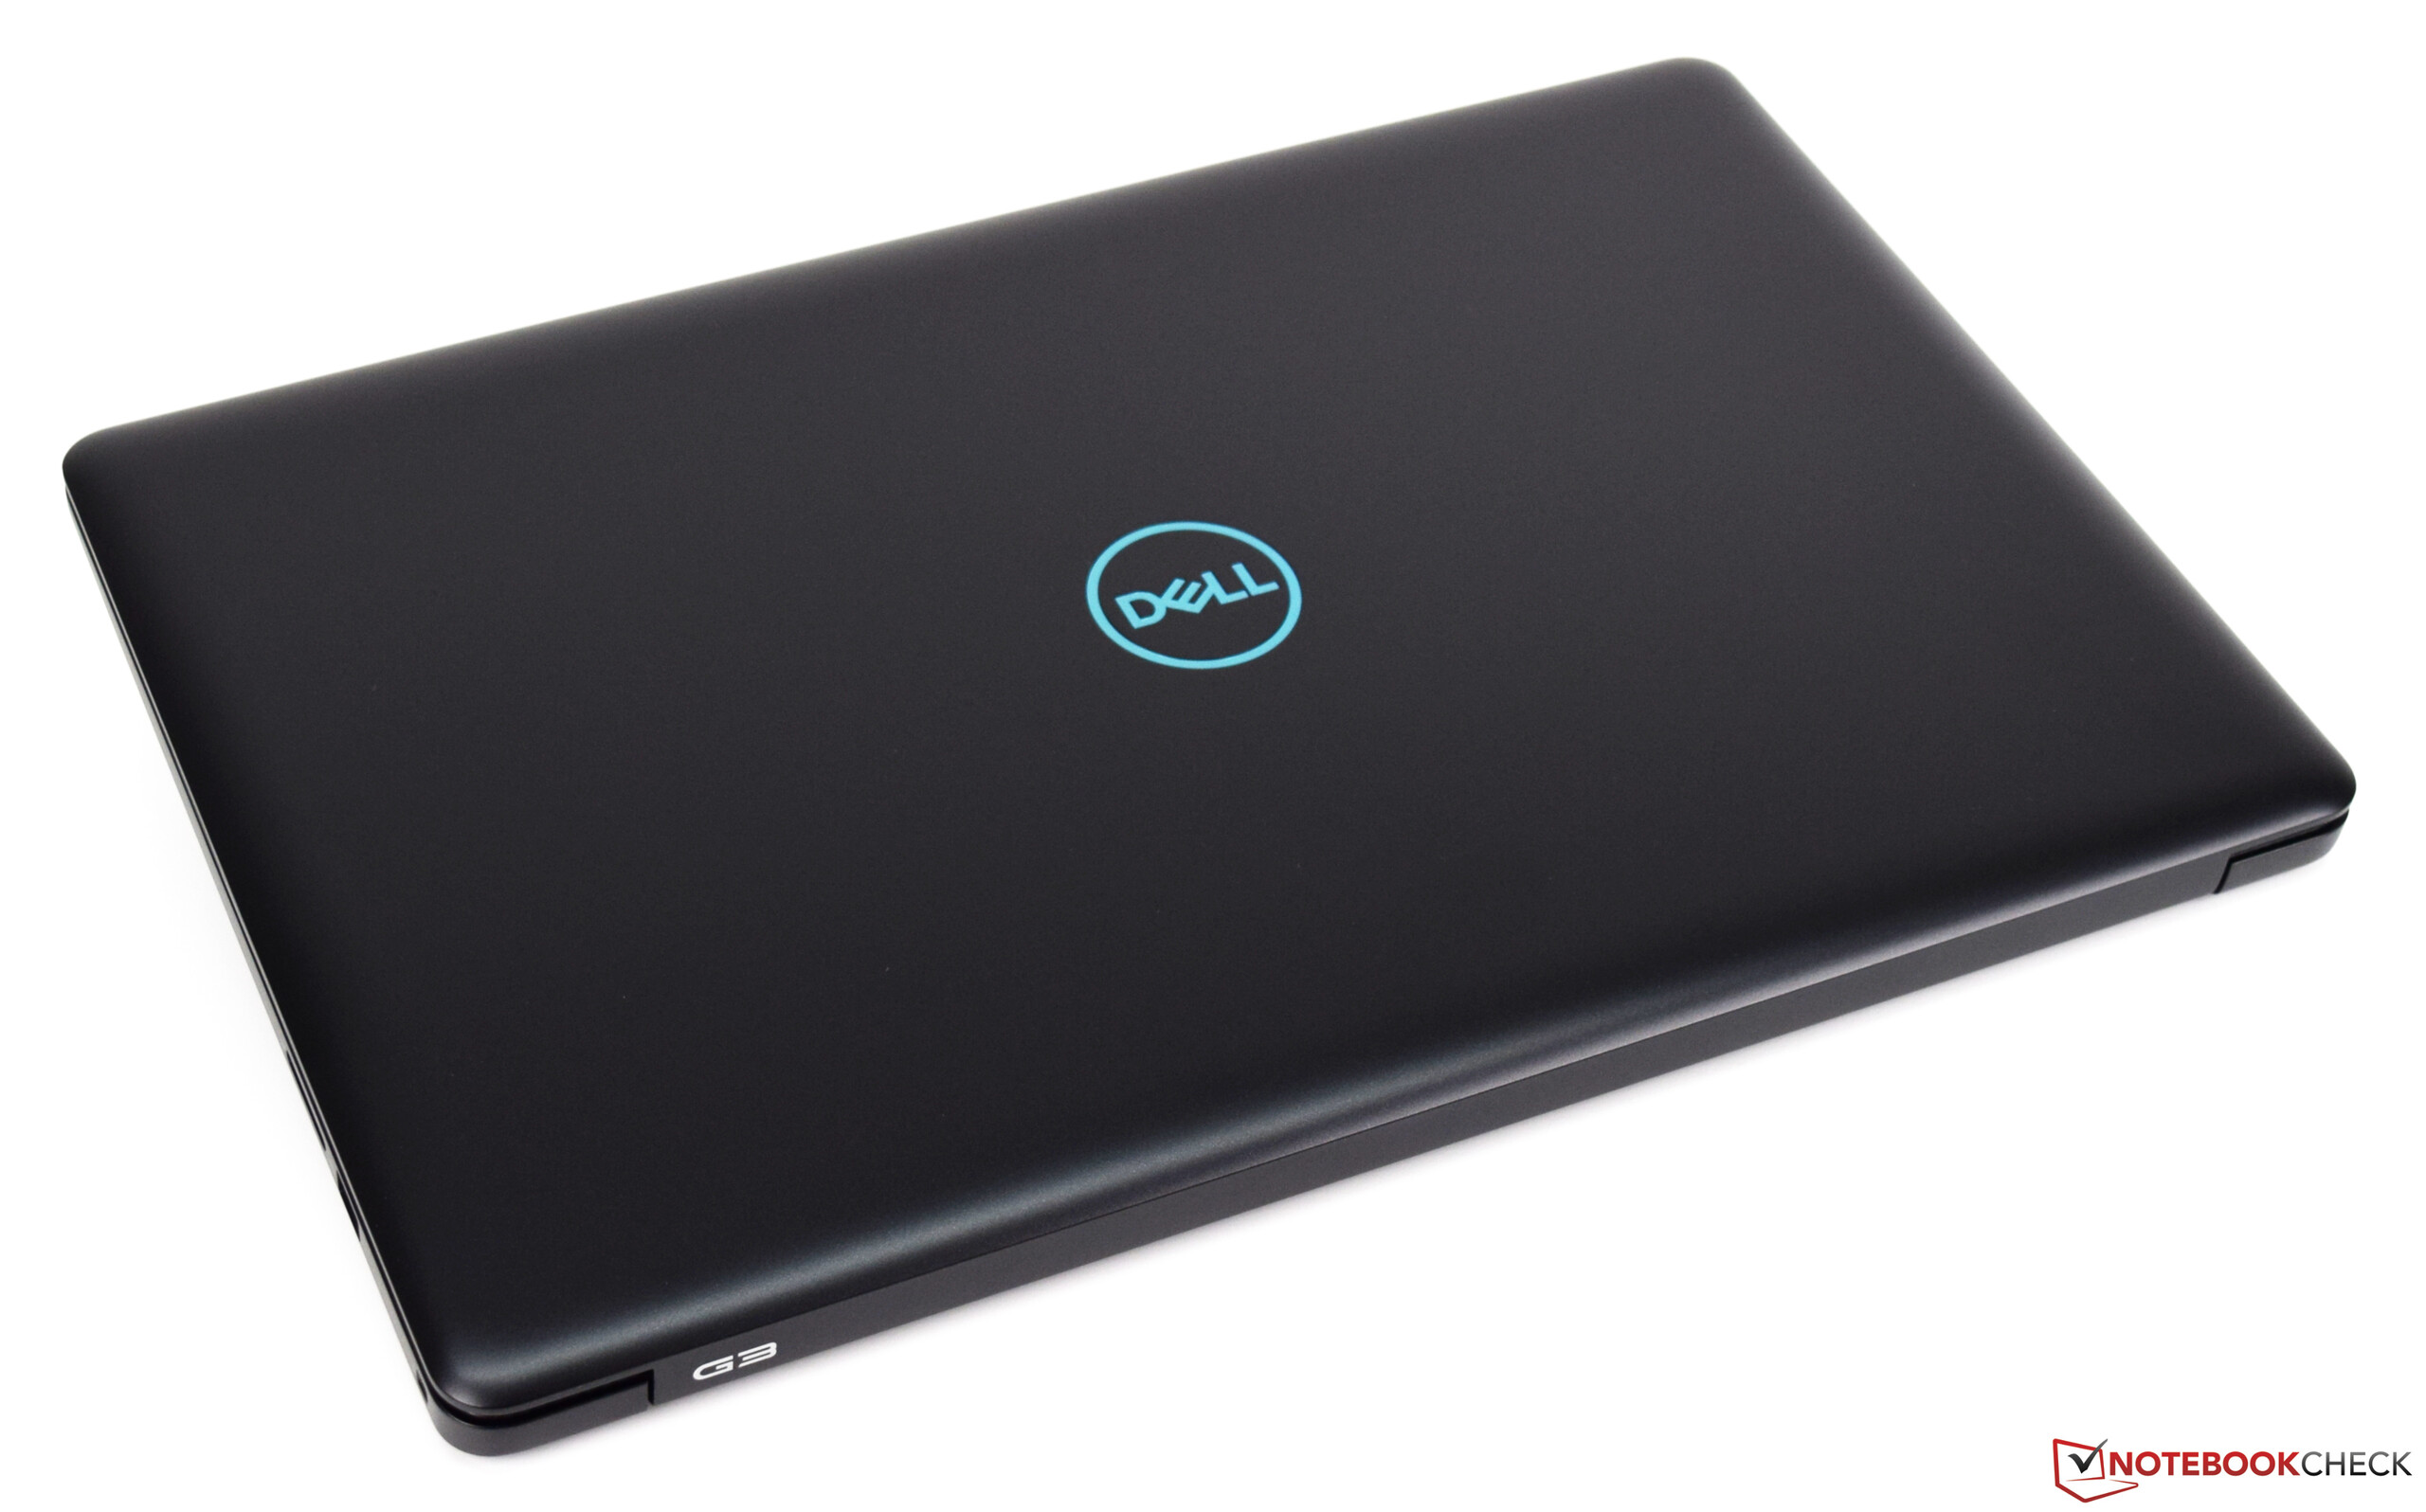
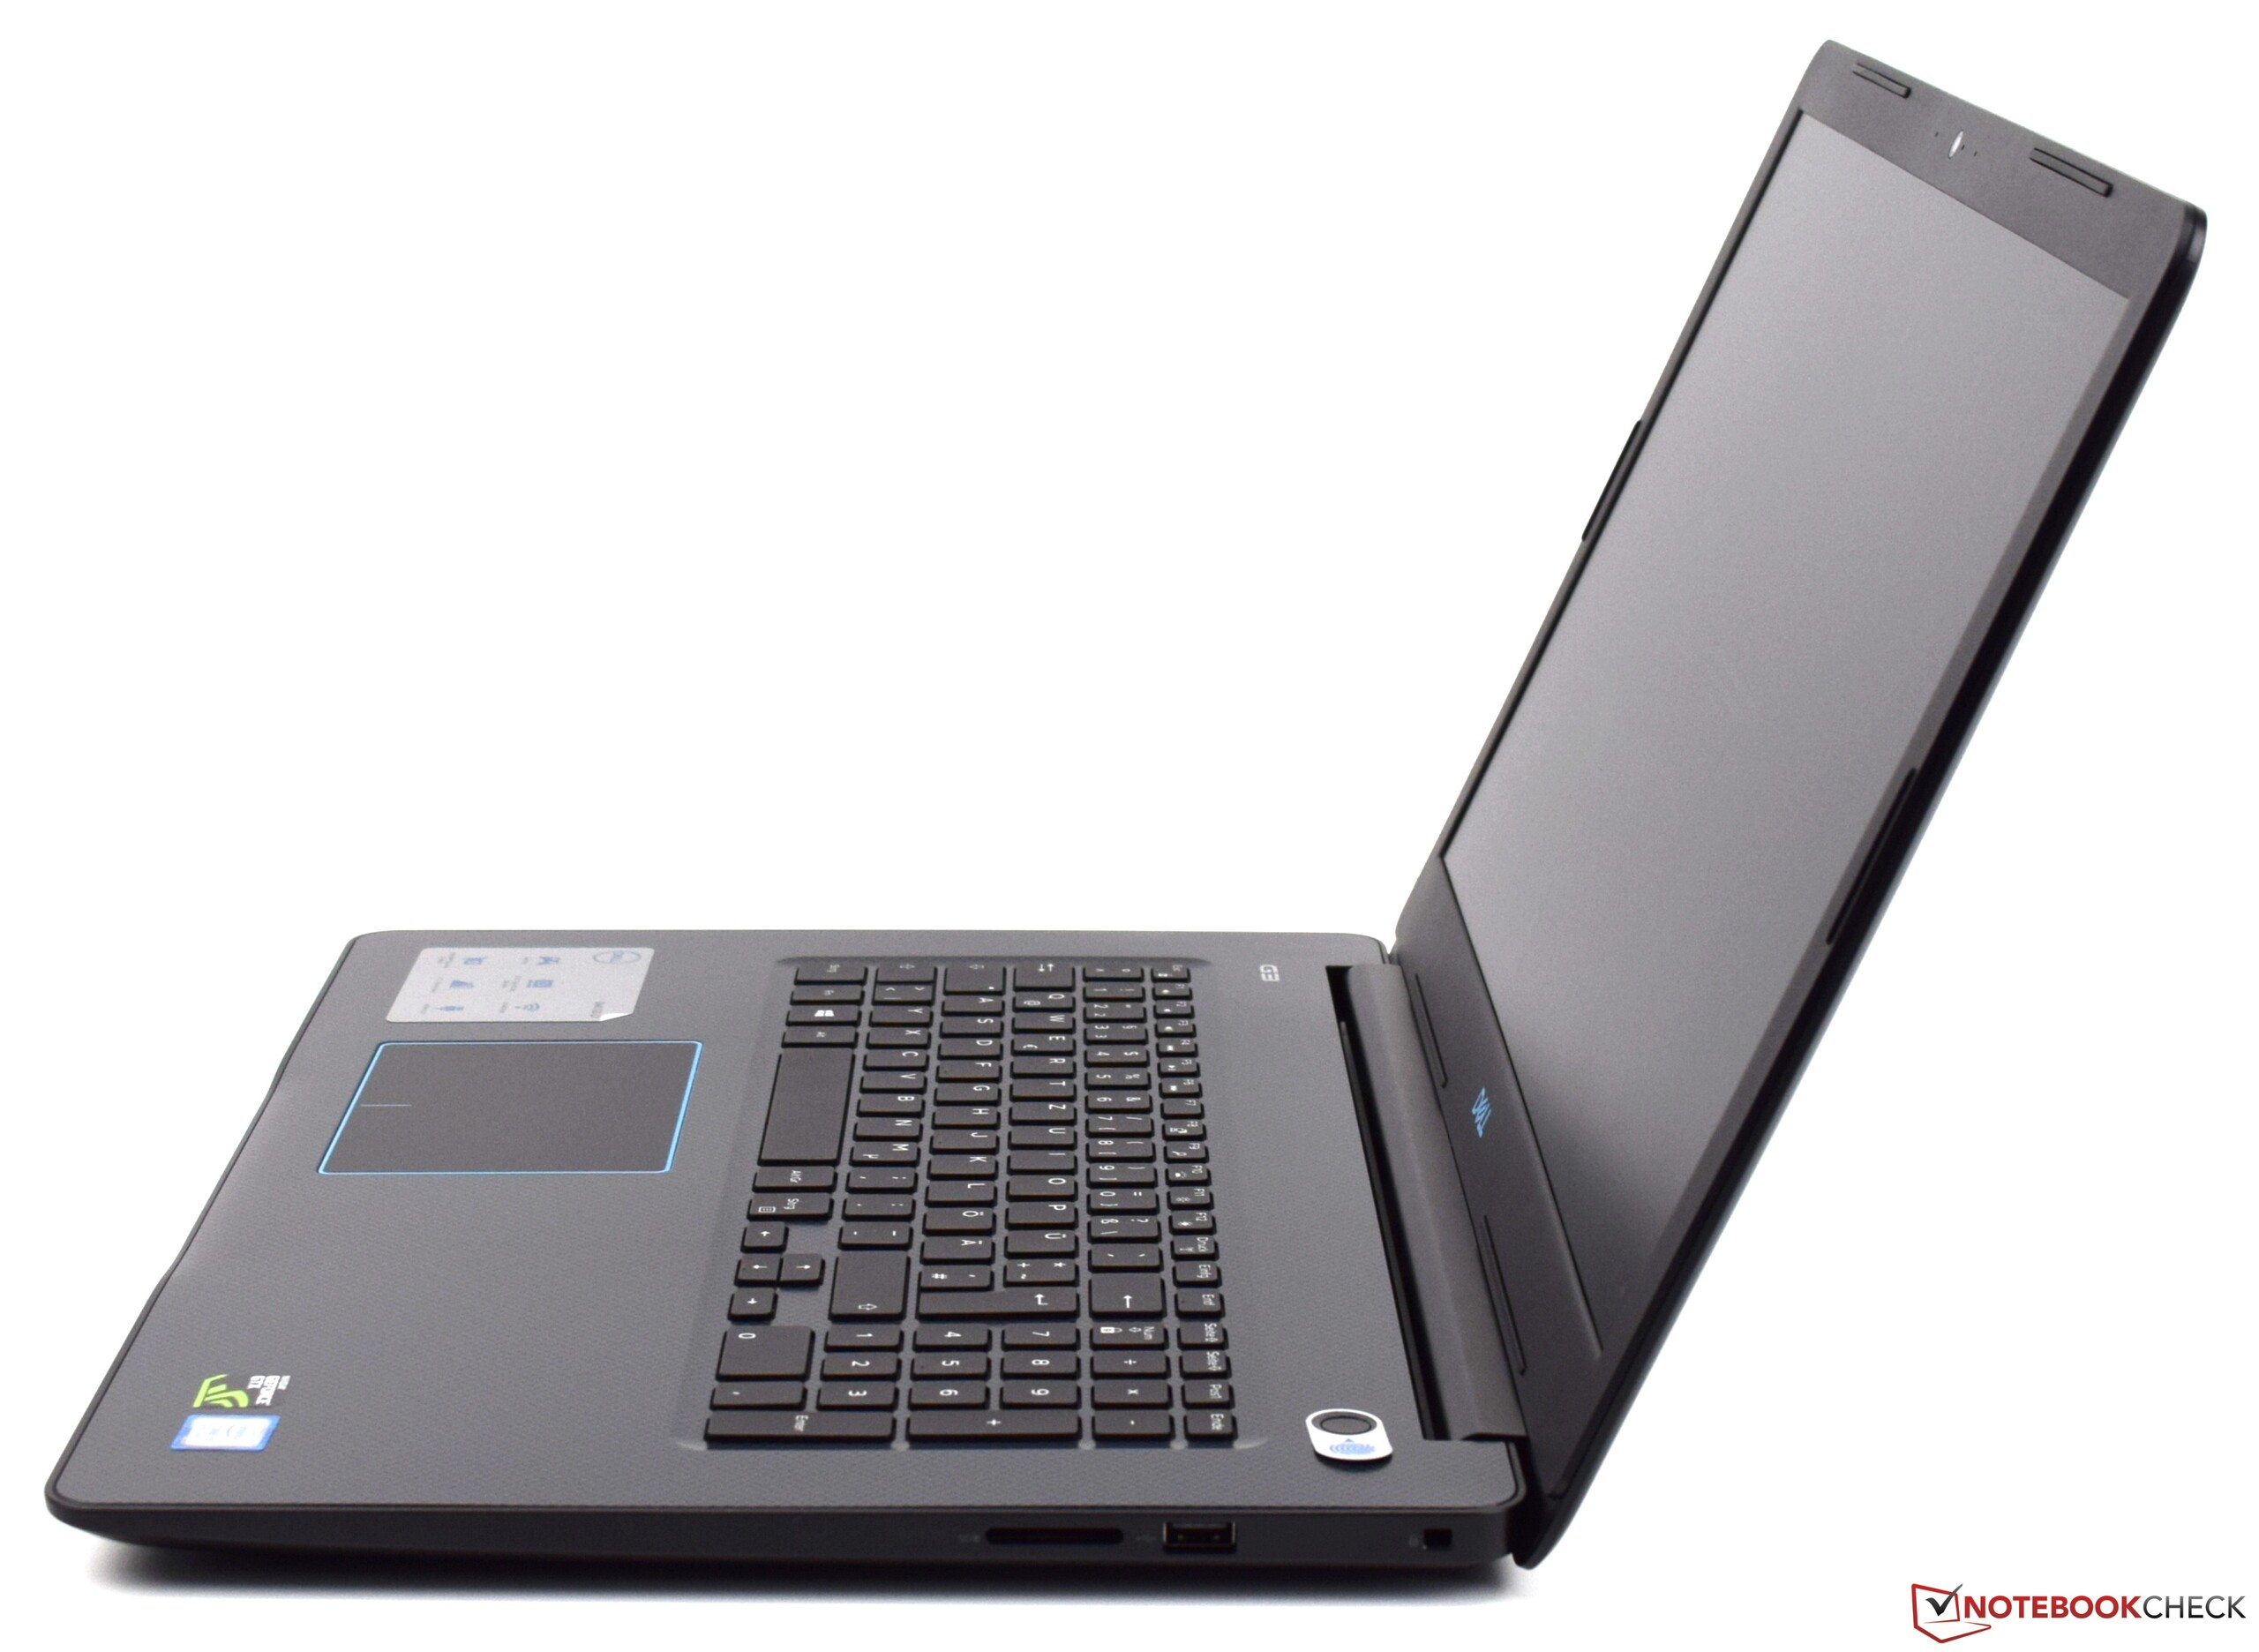
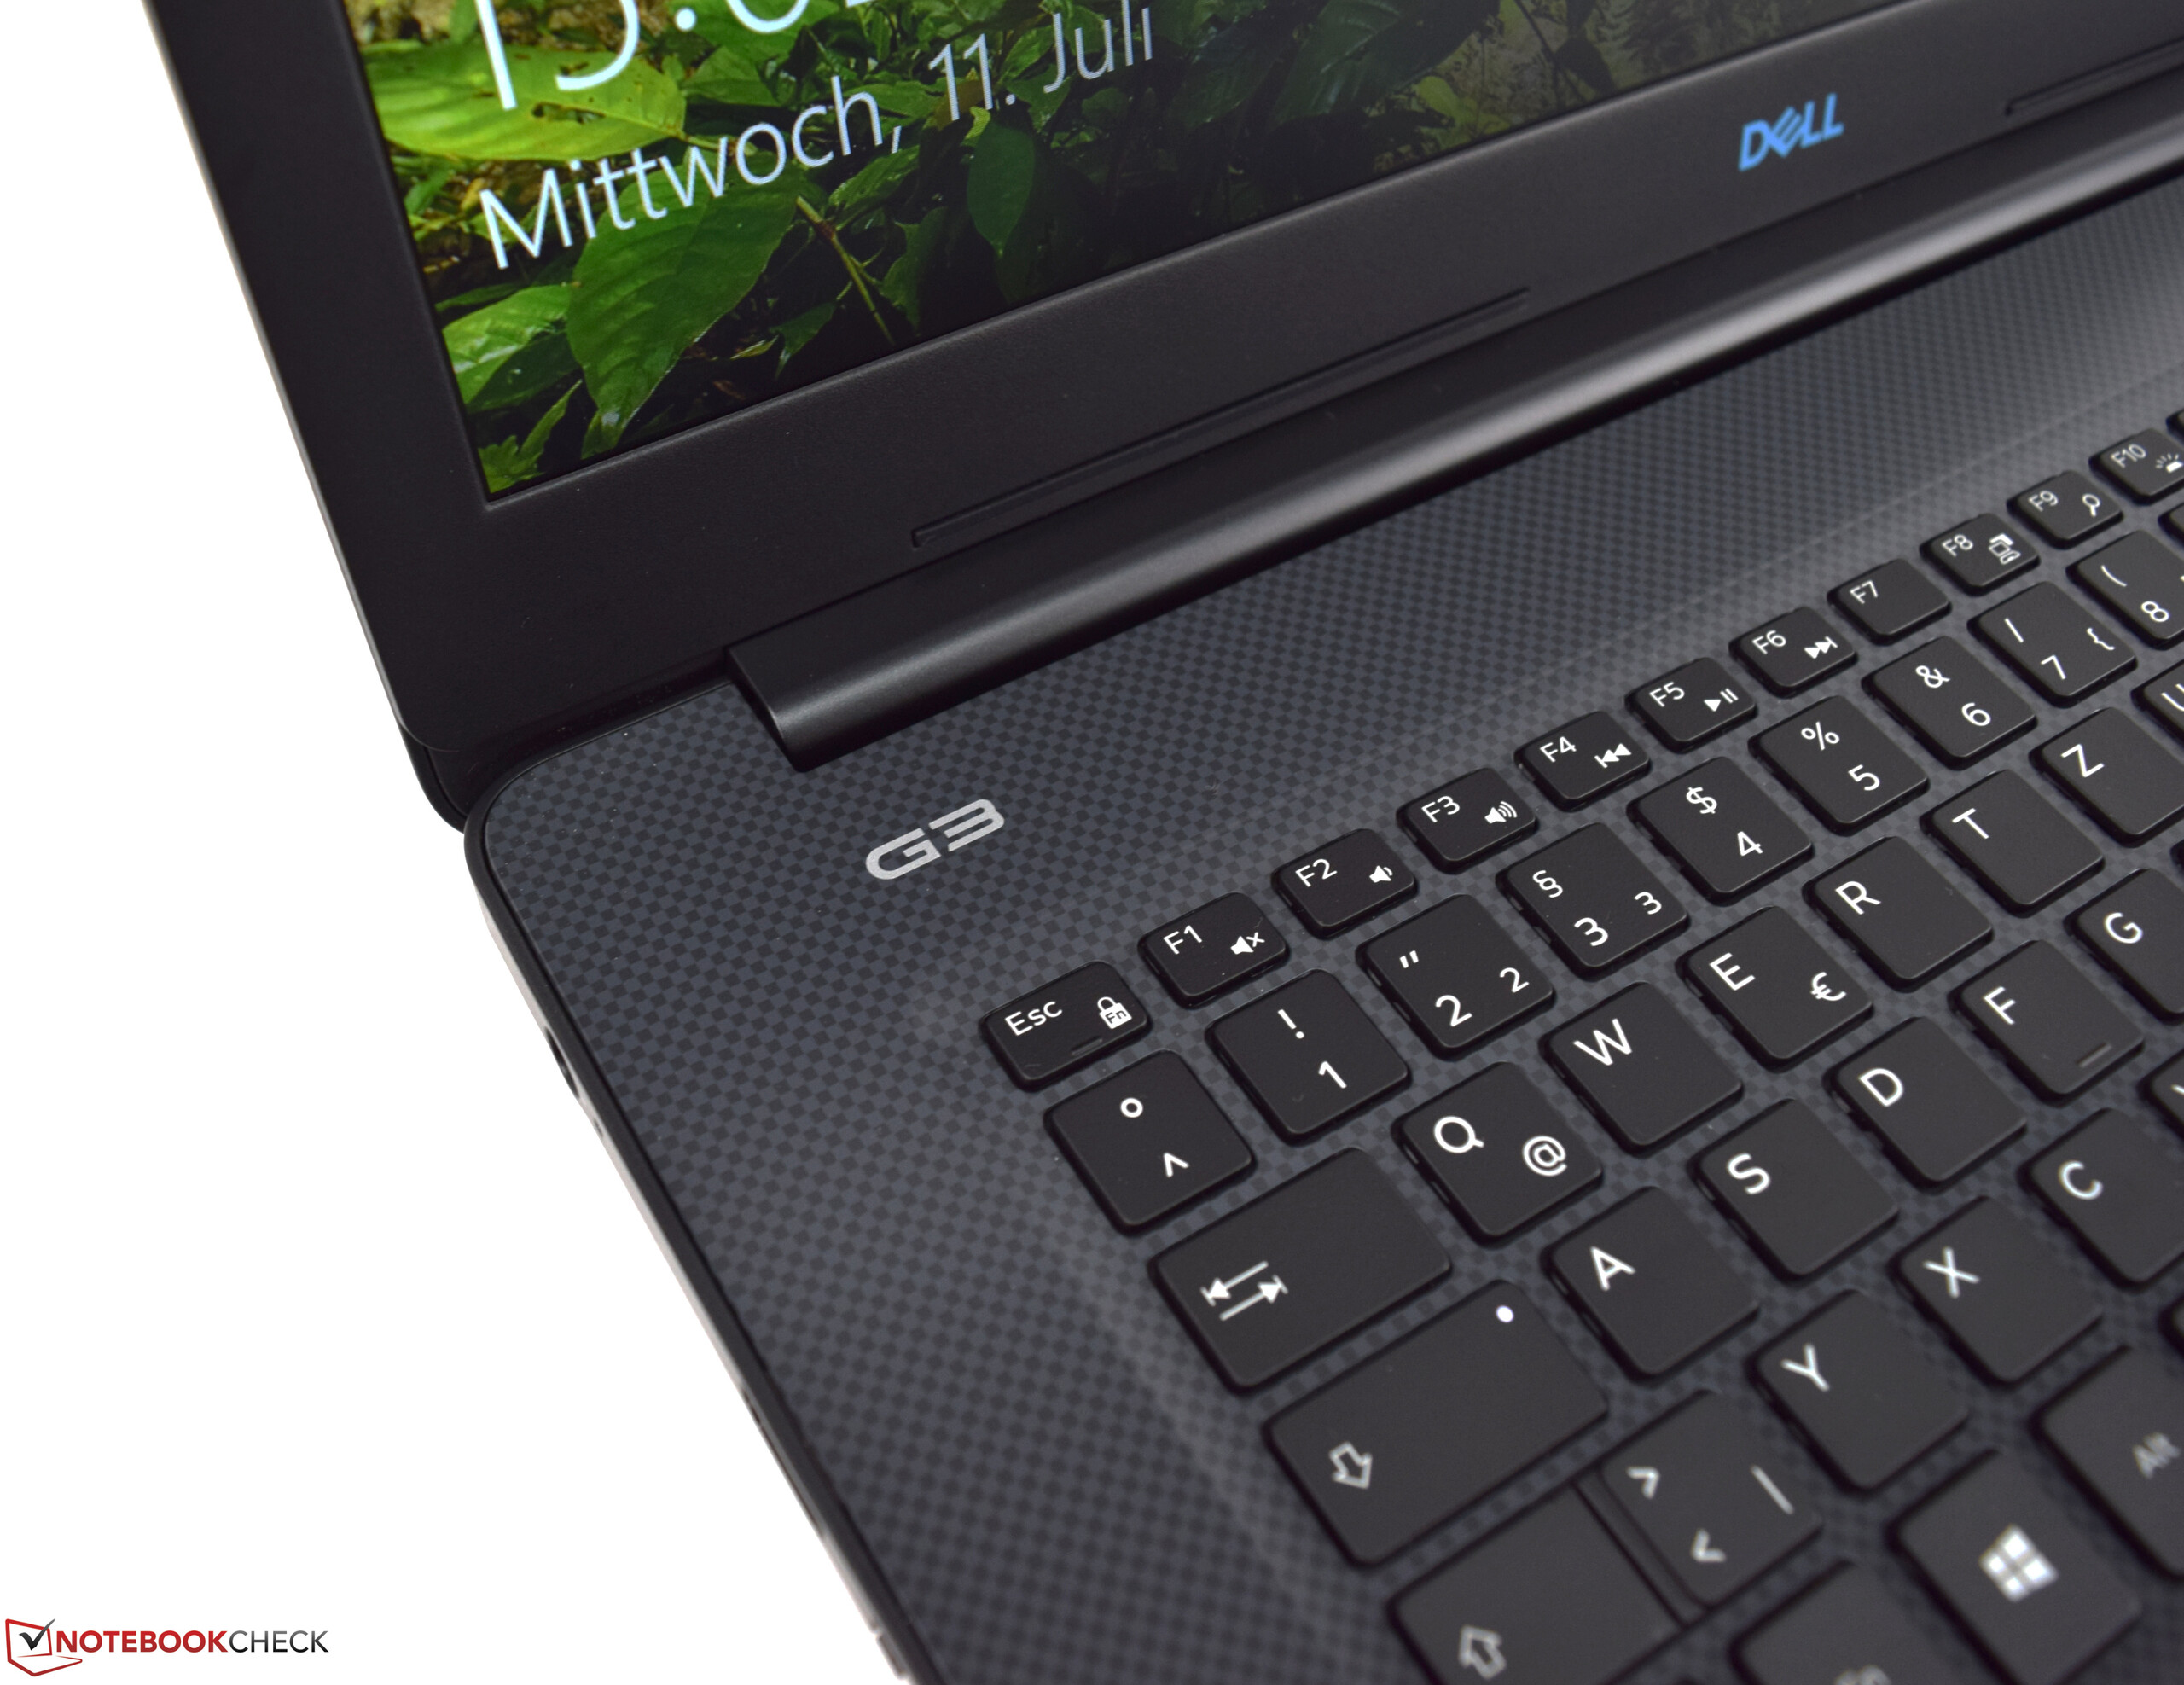
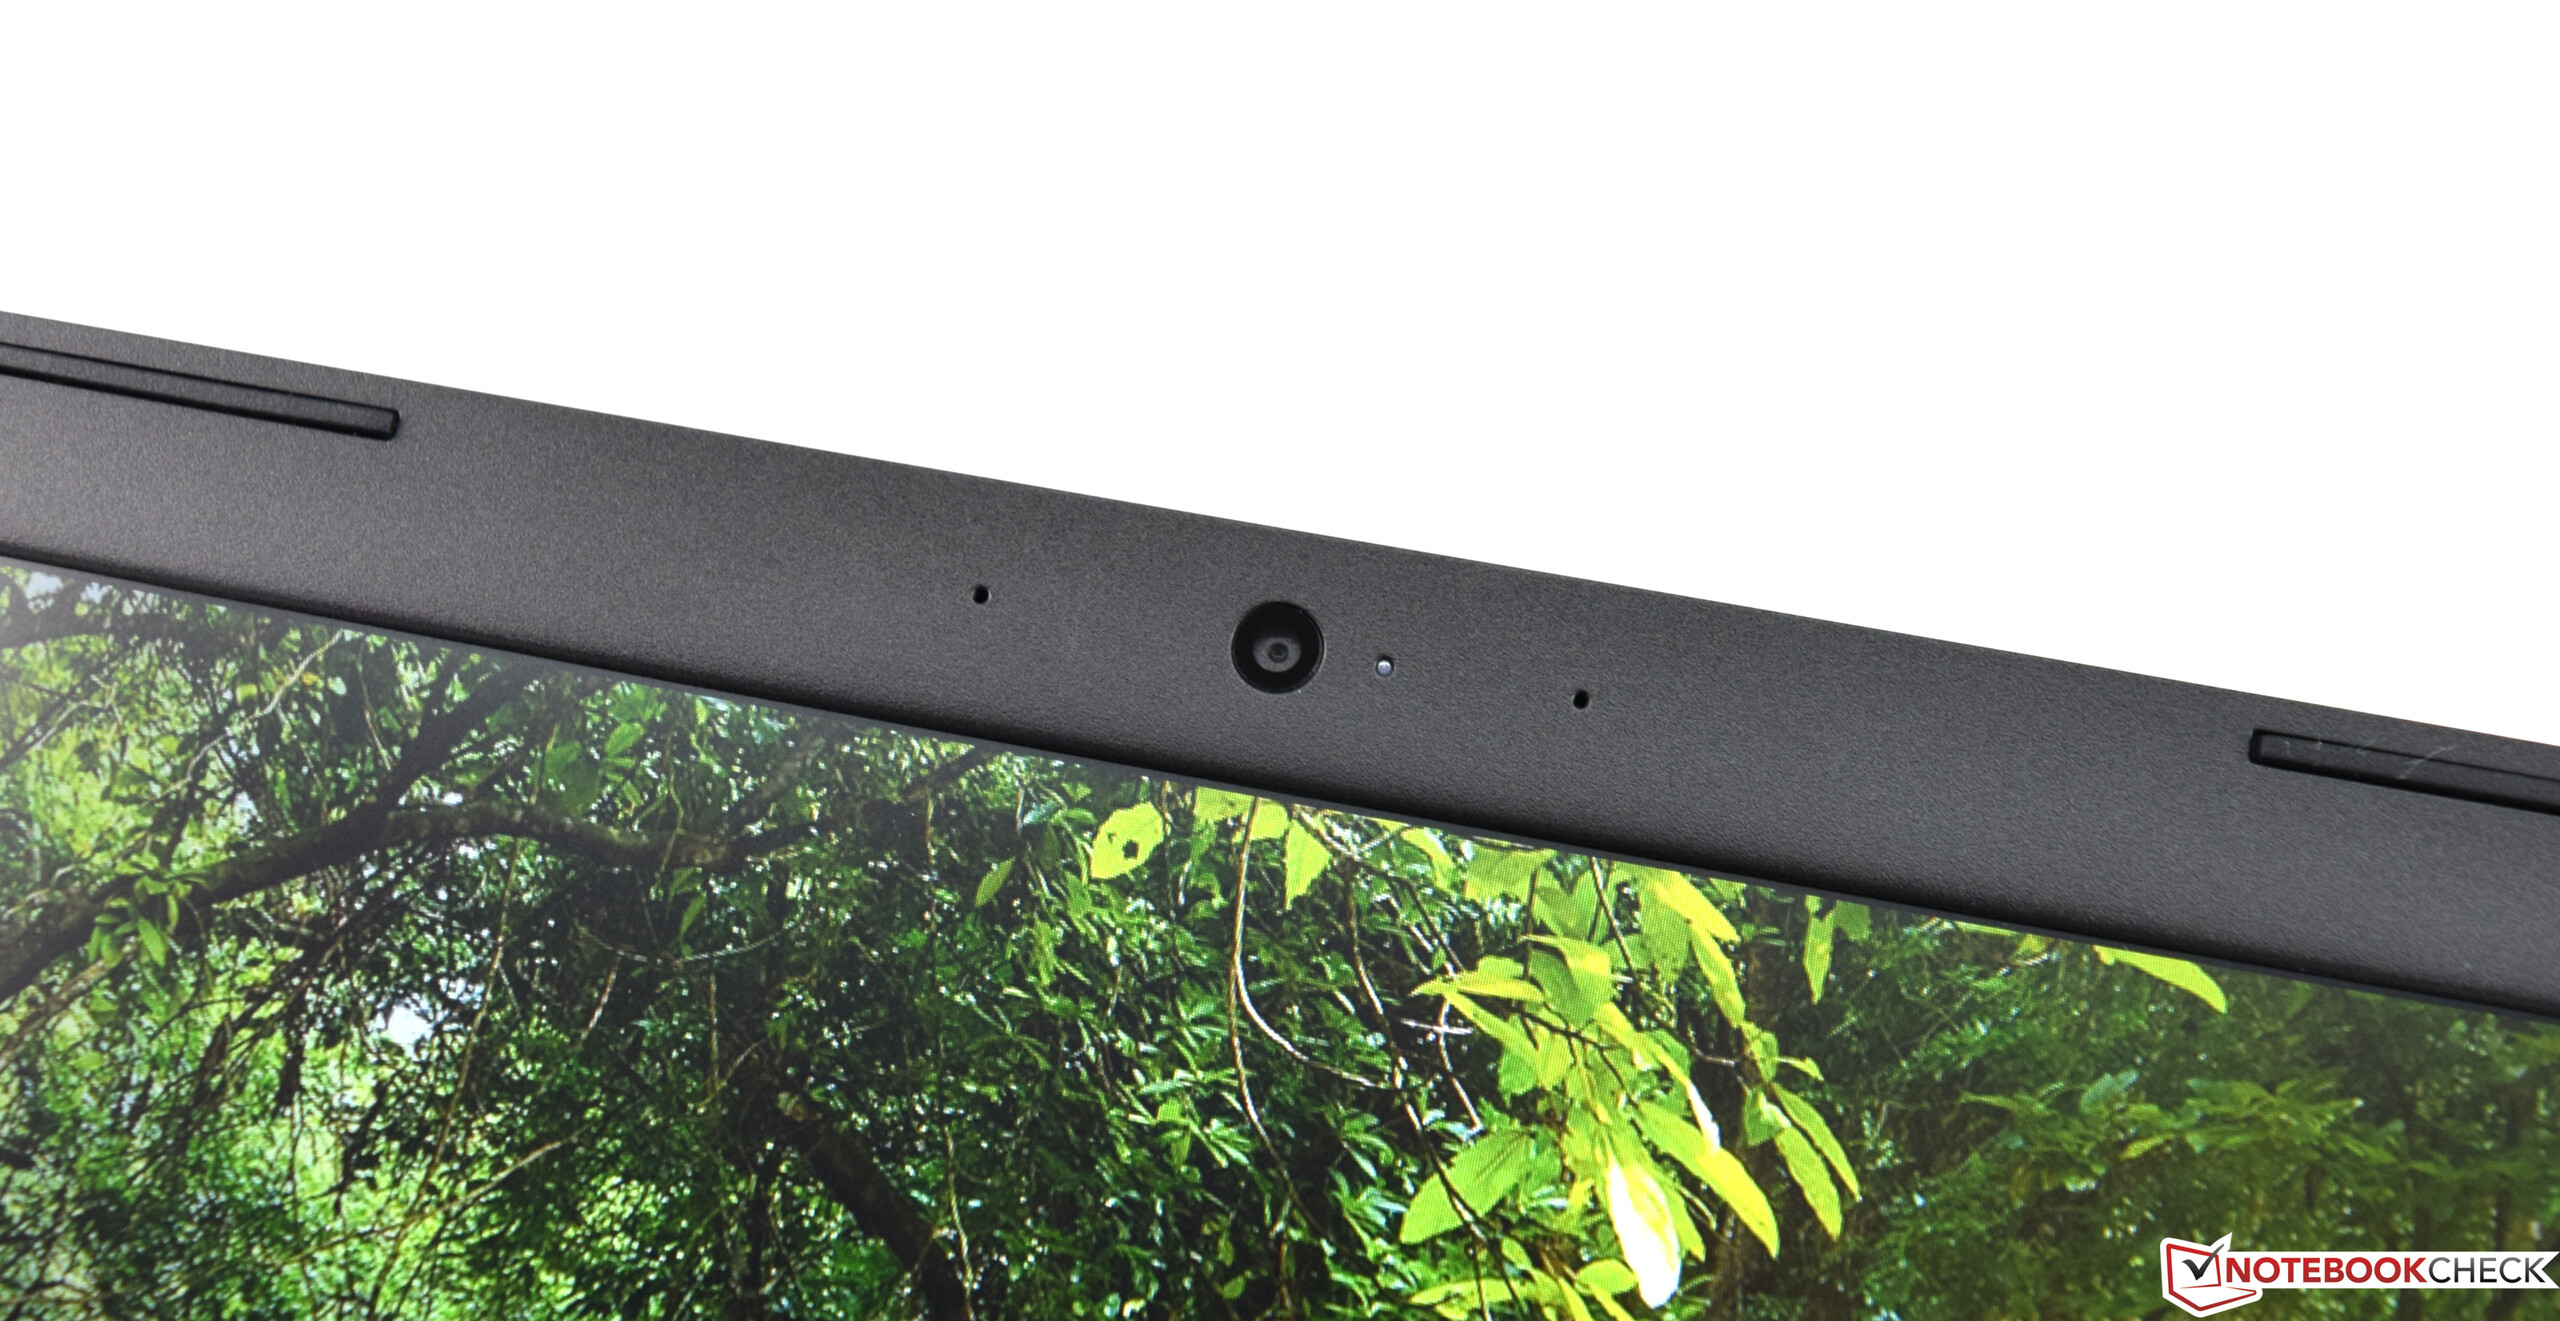
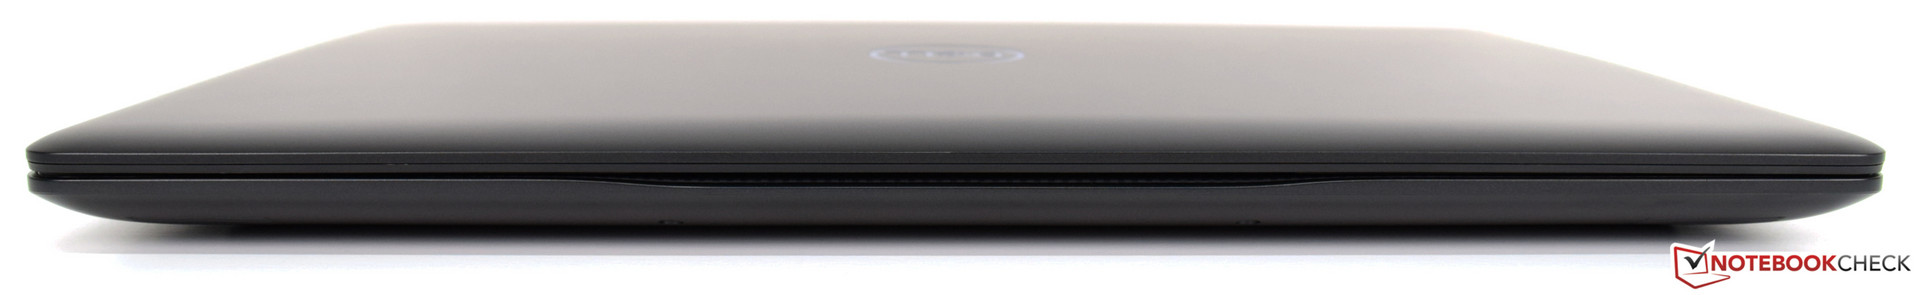
Hur bra detta än må låta så finns det anledning att klaga. Höljet, som i huvudsak är gjort av plast, lämnar inget bestående intryck och fingeravtryck blir snabbt synliga på det matta skärmlocket. Även om Dell inte gör några större misstag när det kommer till skärmen så lämnade, i vårt fall, tydligt uttalad clouding en dålig smak i munnen. I övrigt erbjuder IPS-skärmen utmärkt färgrymdstäckning, en matt skärmyta och skaplig ljusstyrka.
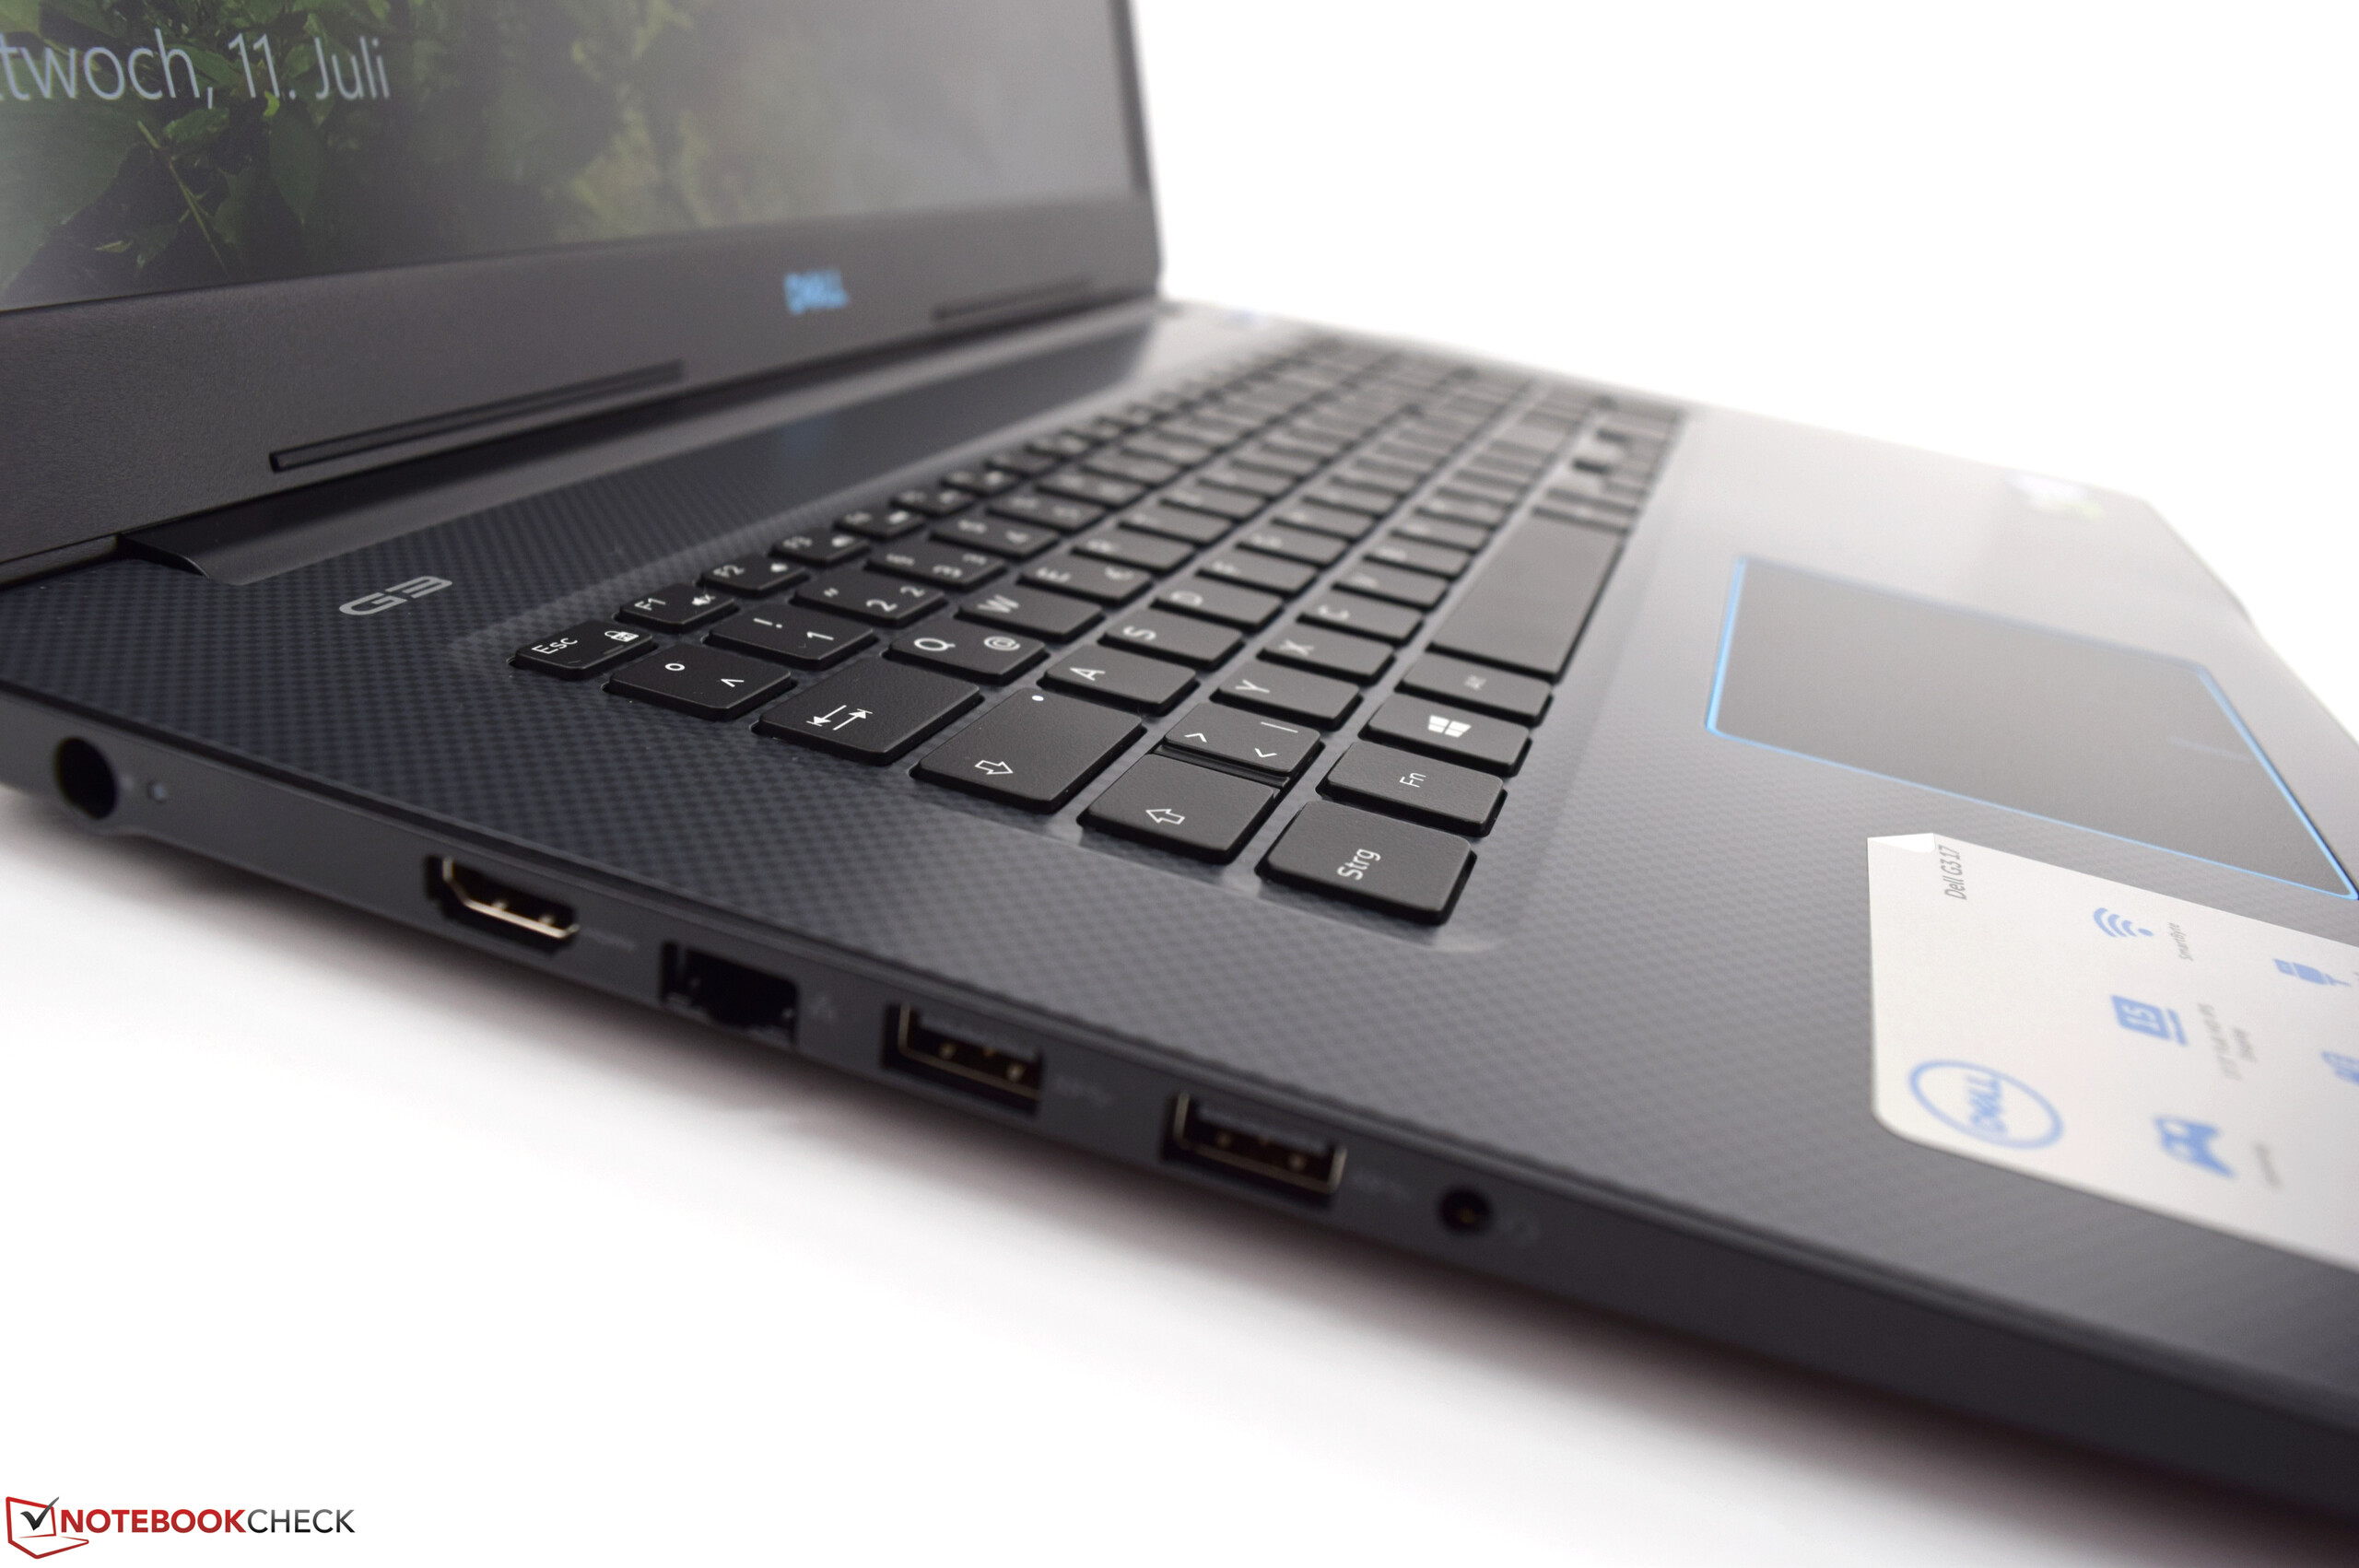
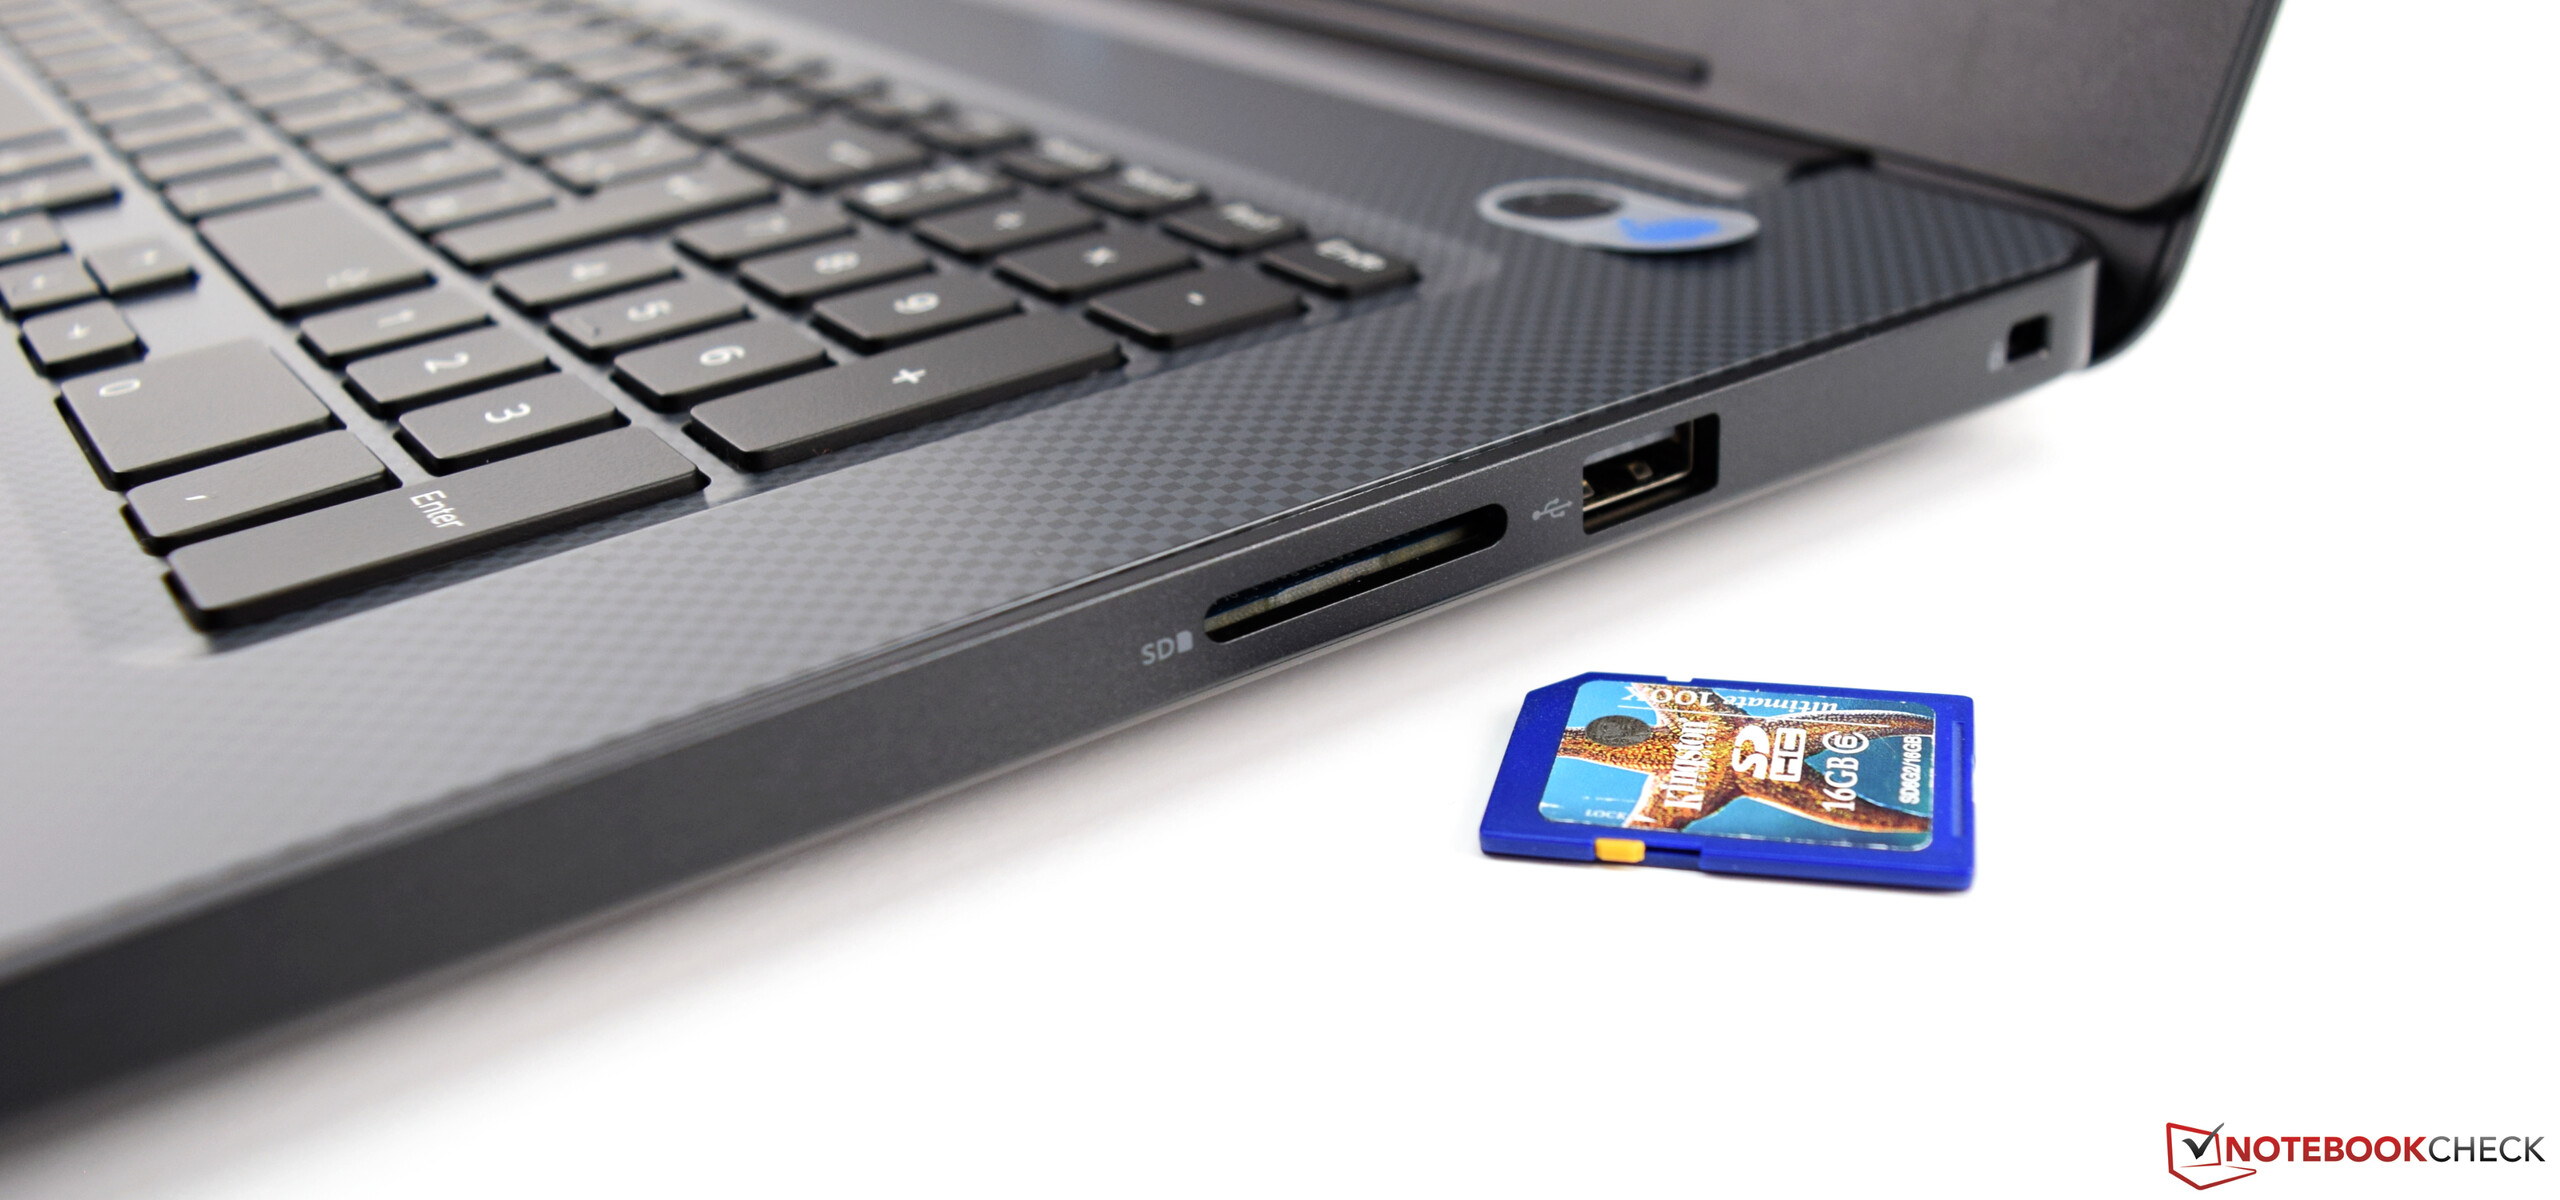
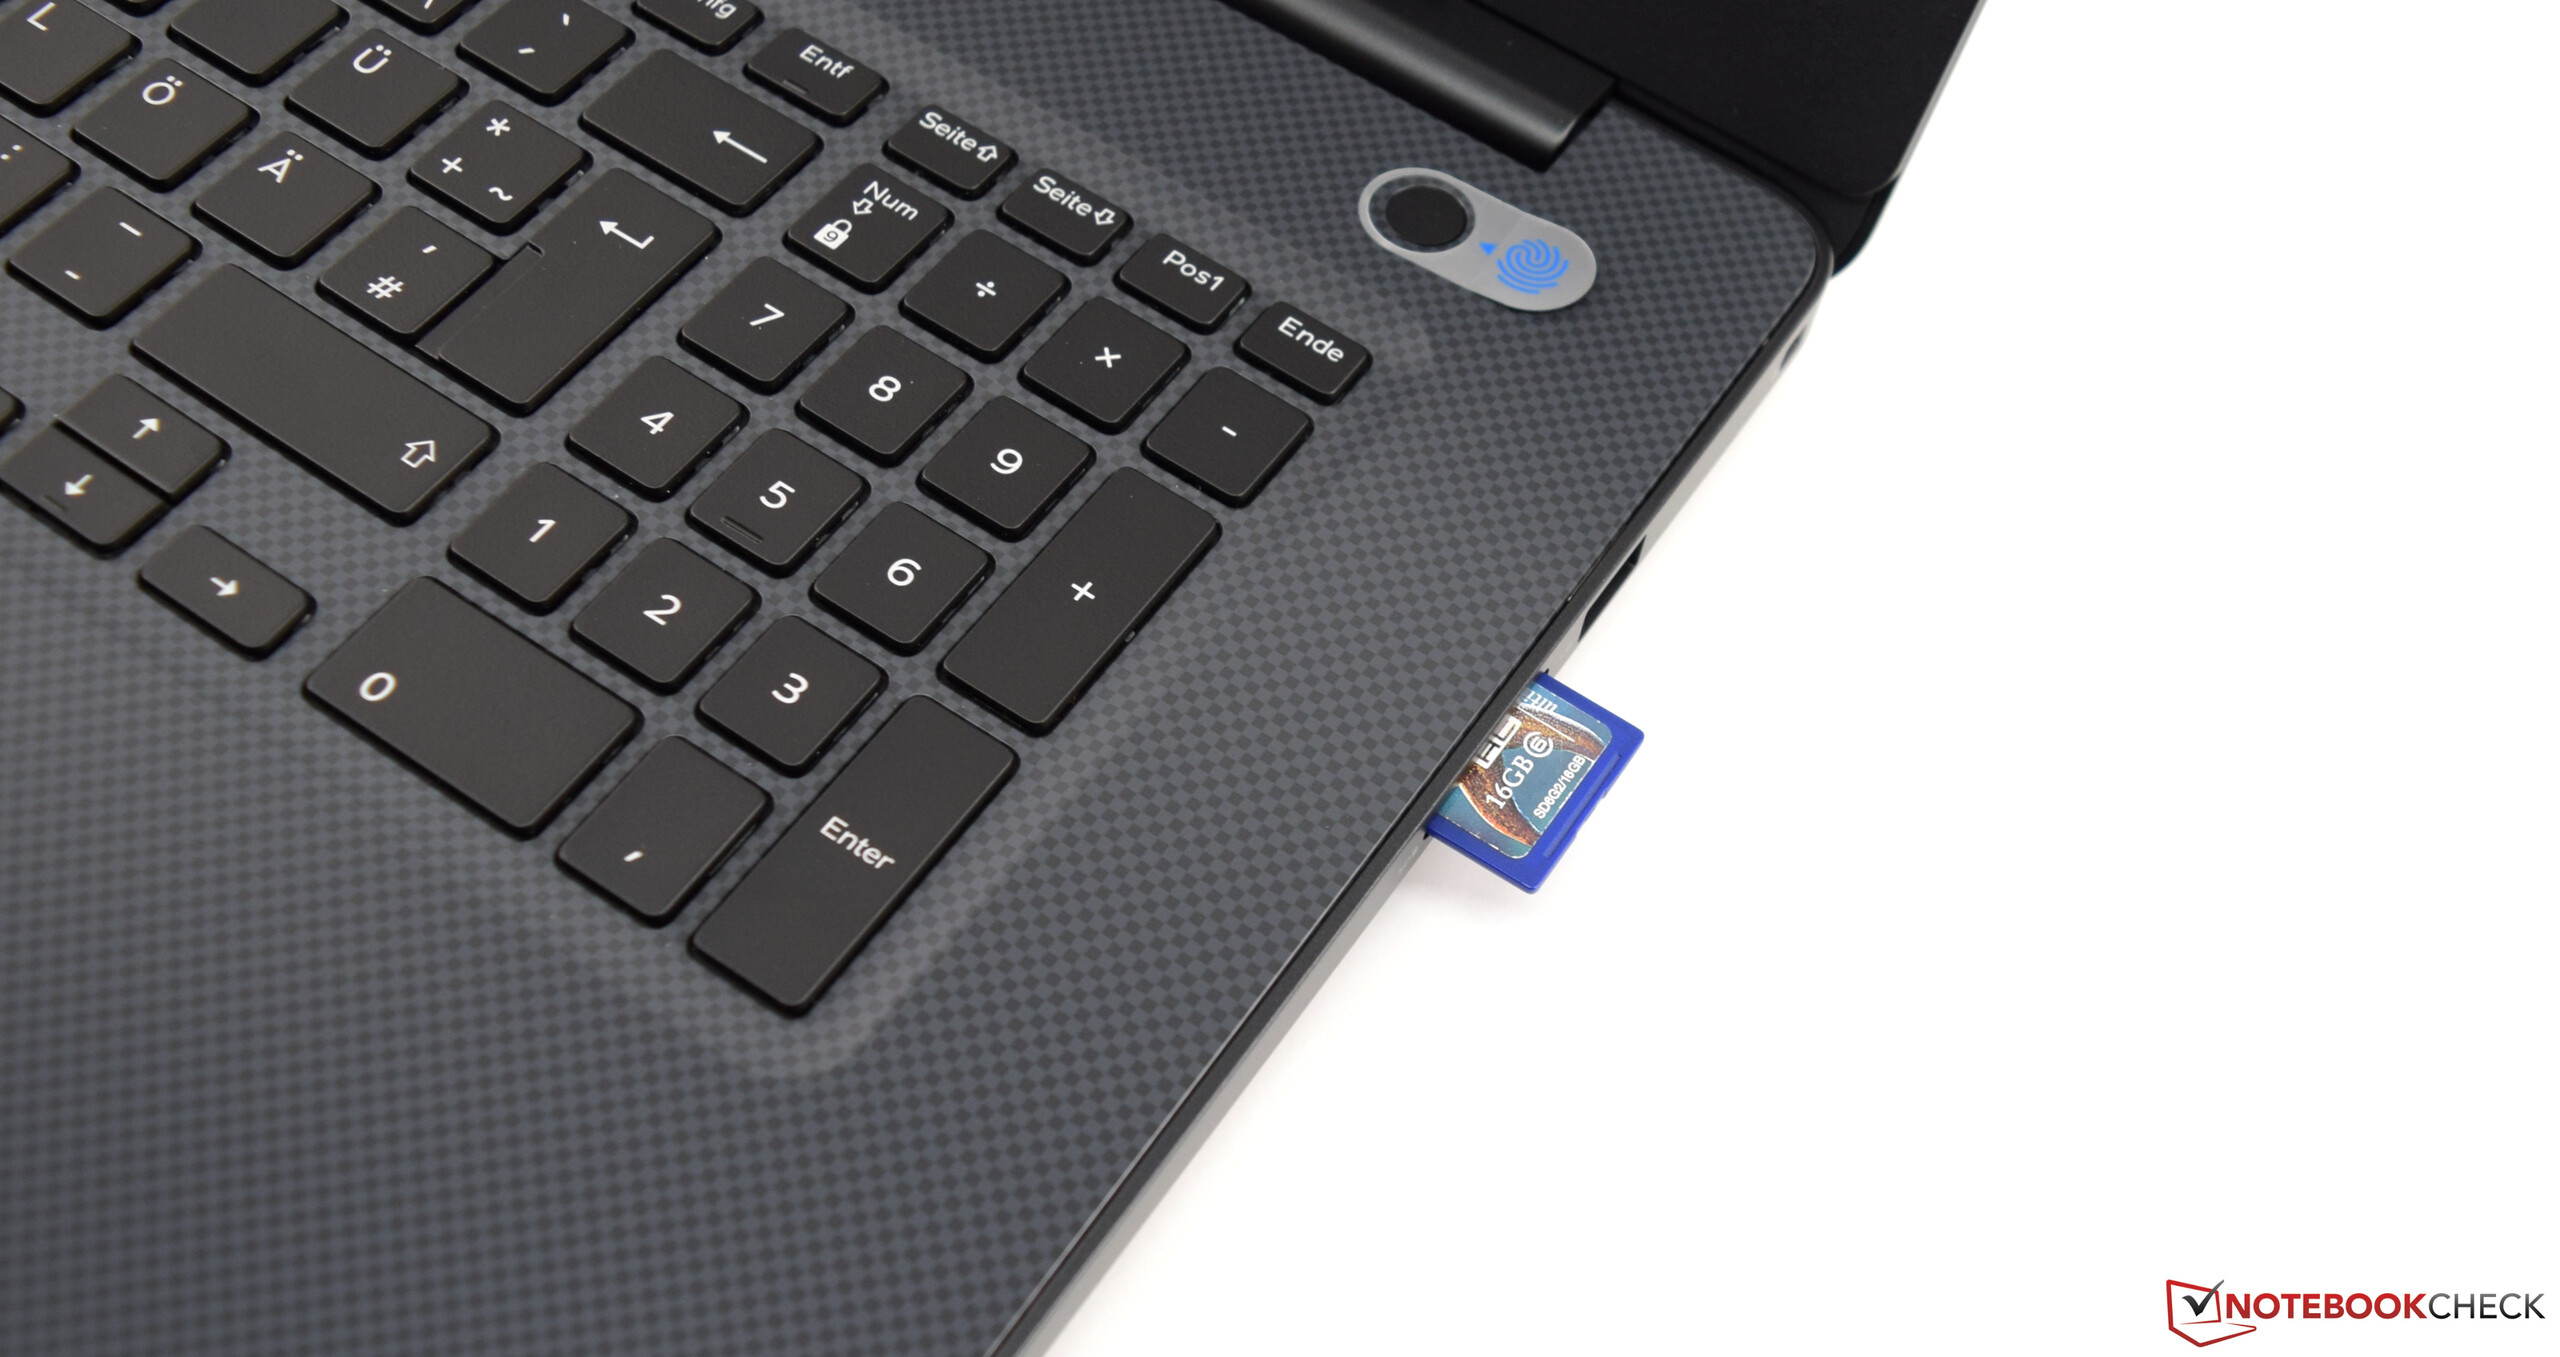
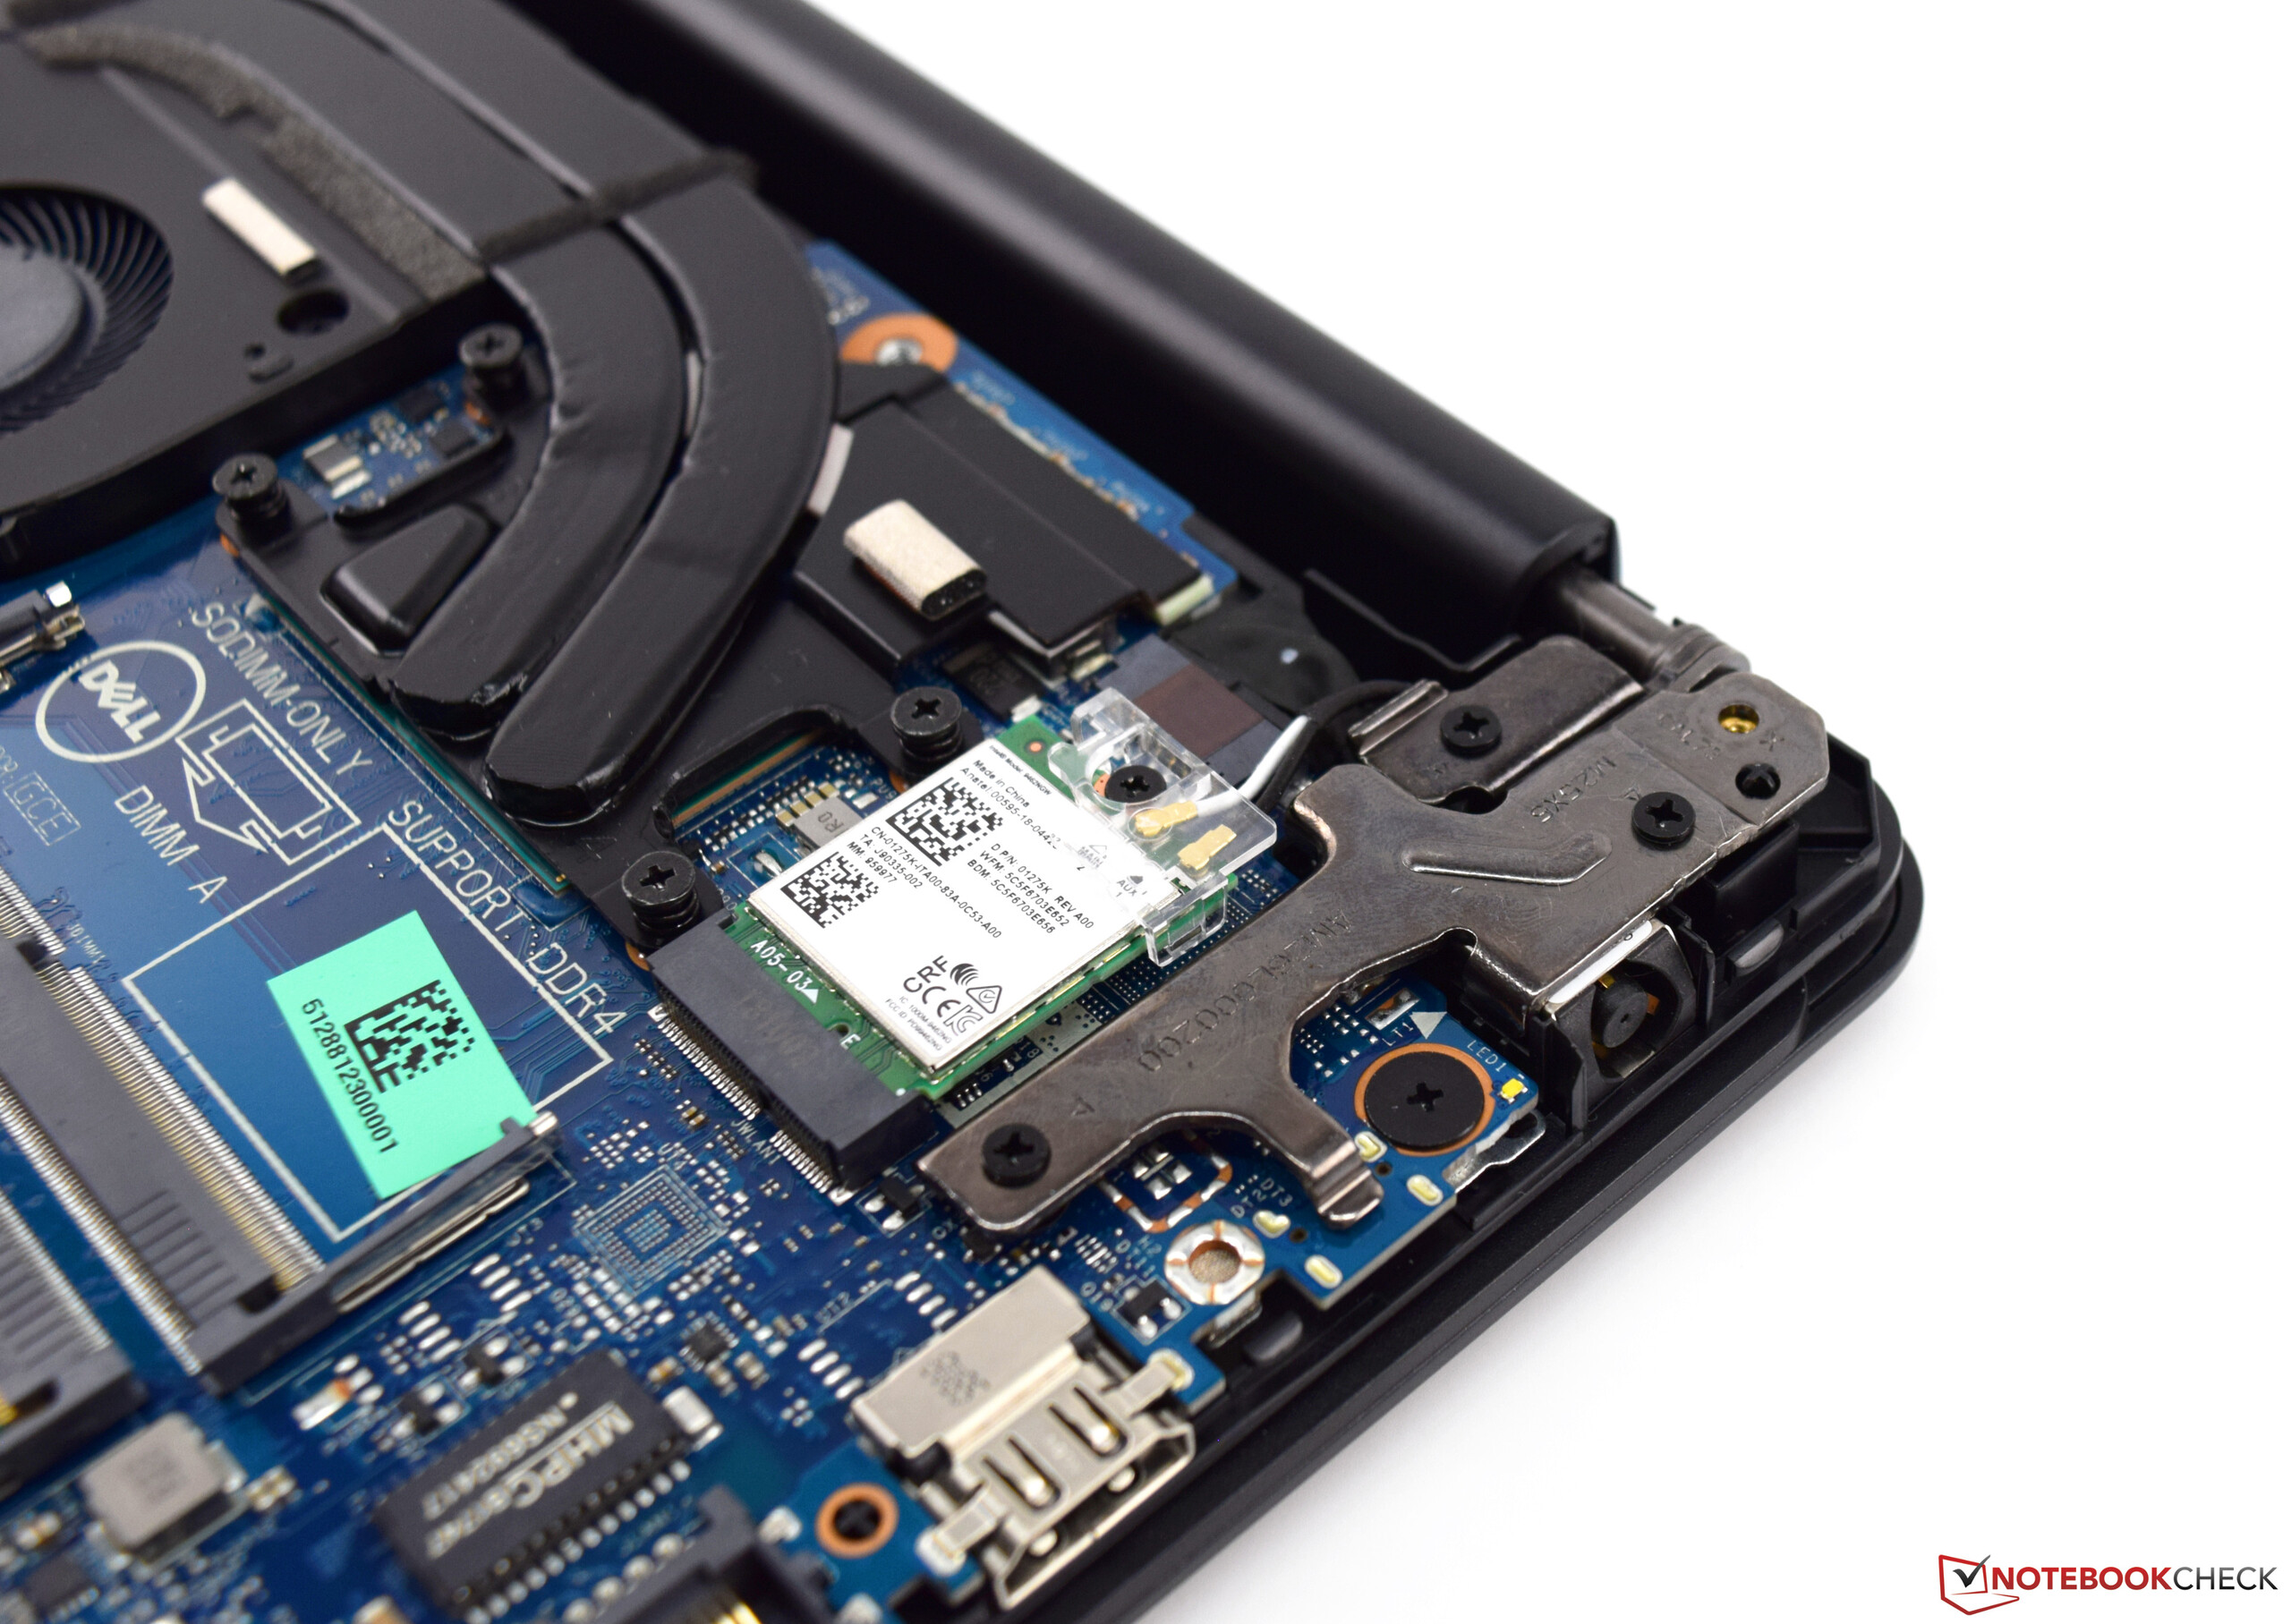
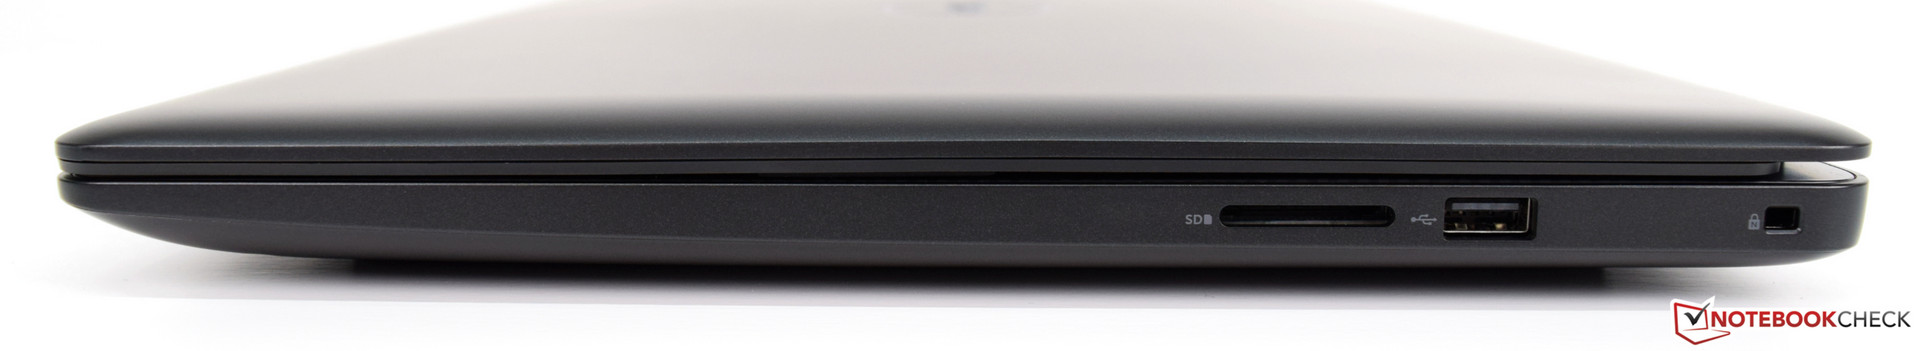
Även om kortläsaren förblir långt under genomsnittet så var vi nöjda med att Dell fortfarande erbjuder en överhuvudtaget, då den oftast tas bort utan någon ersättning. Vi hade även förväntat oss bättre WLAN-prestanda, då Dell G3 17 3779 hamnade runt 50% efter andra enheter i sin klass.
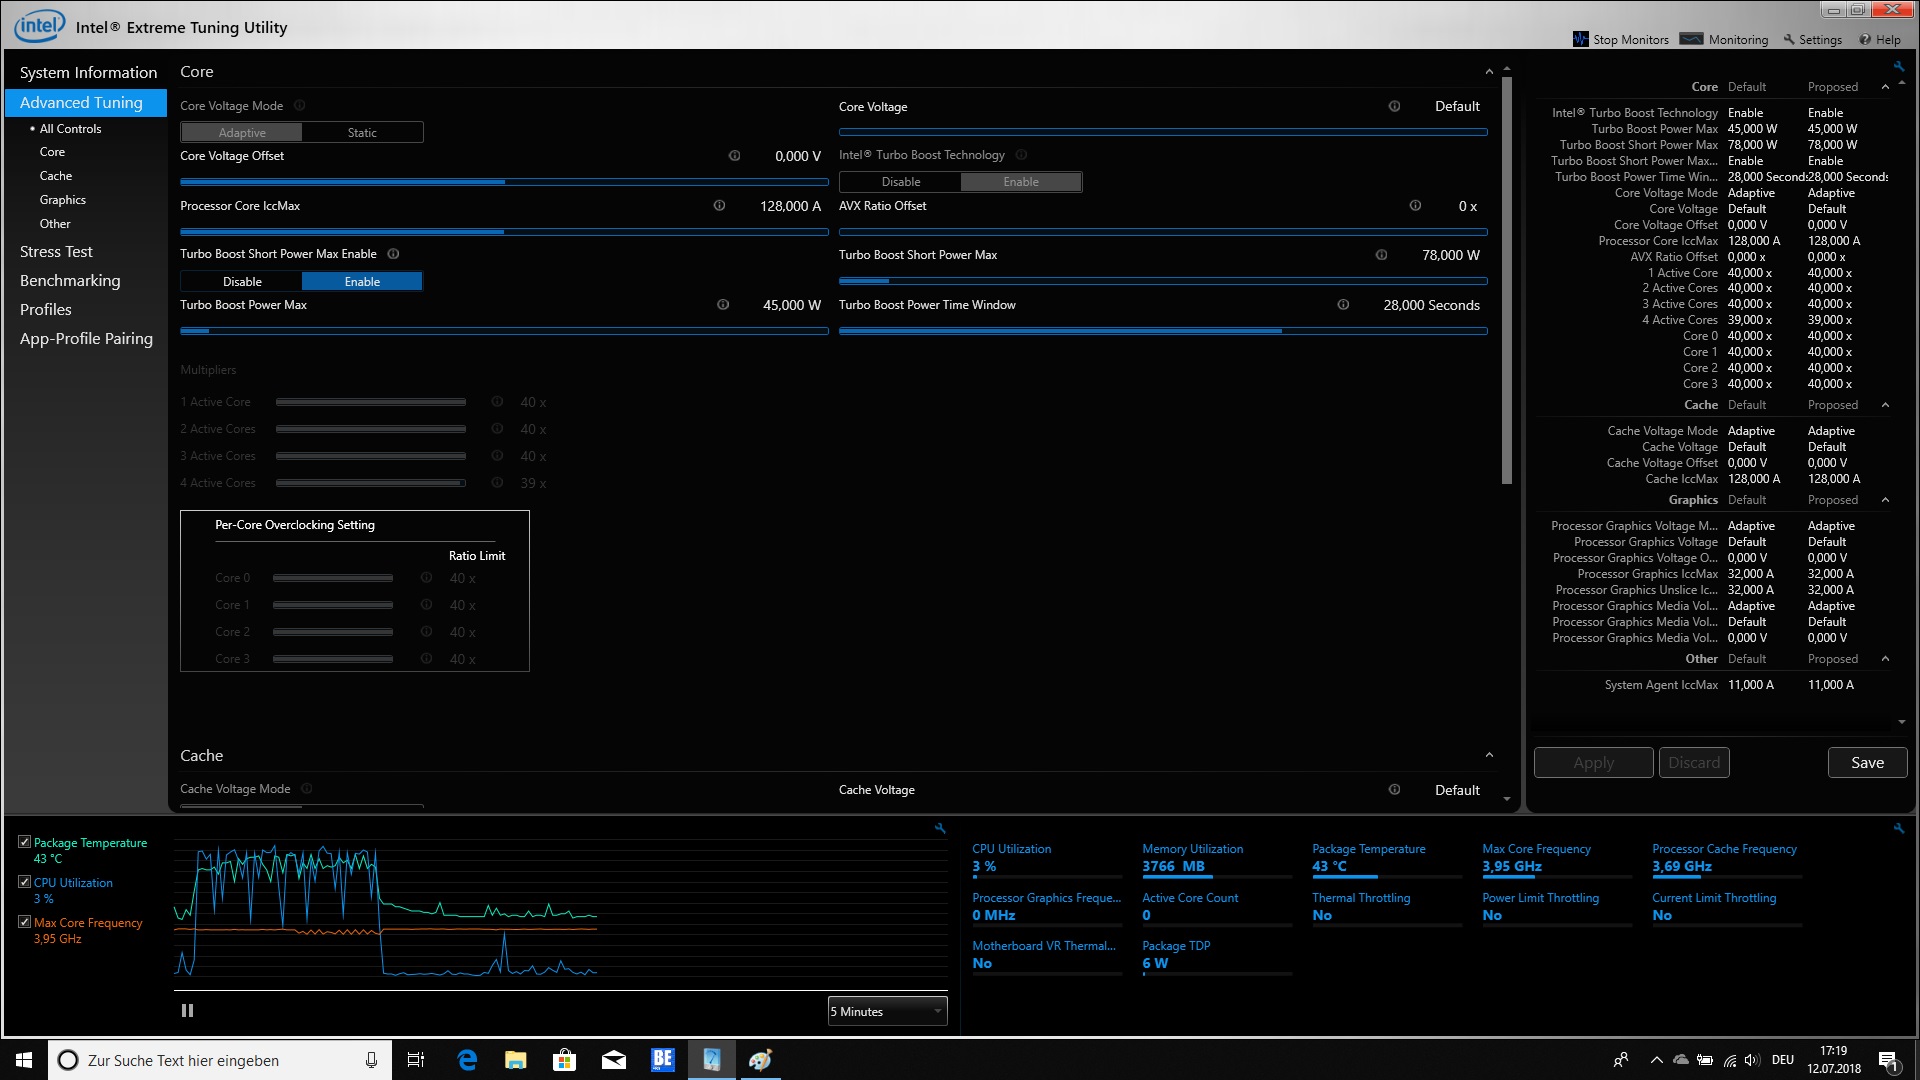
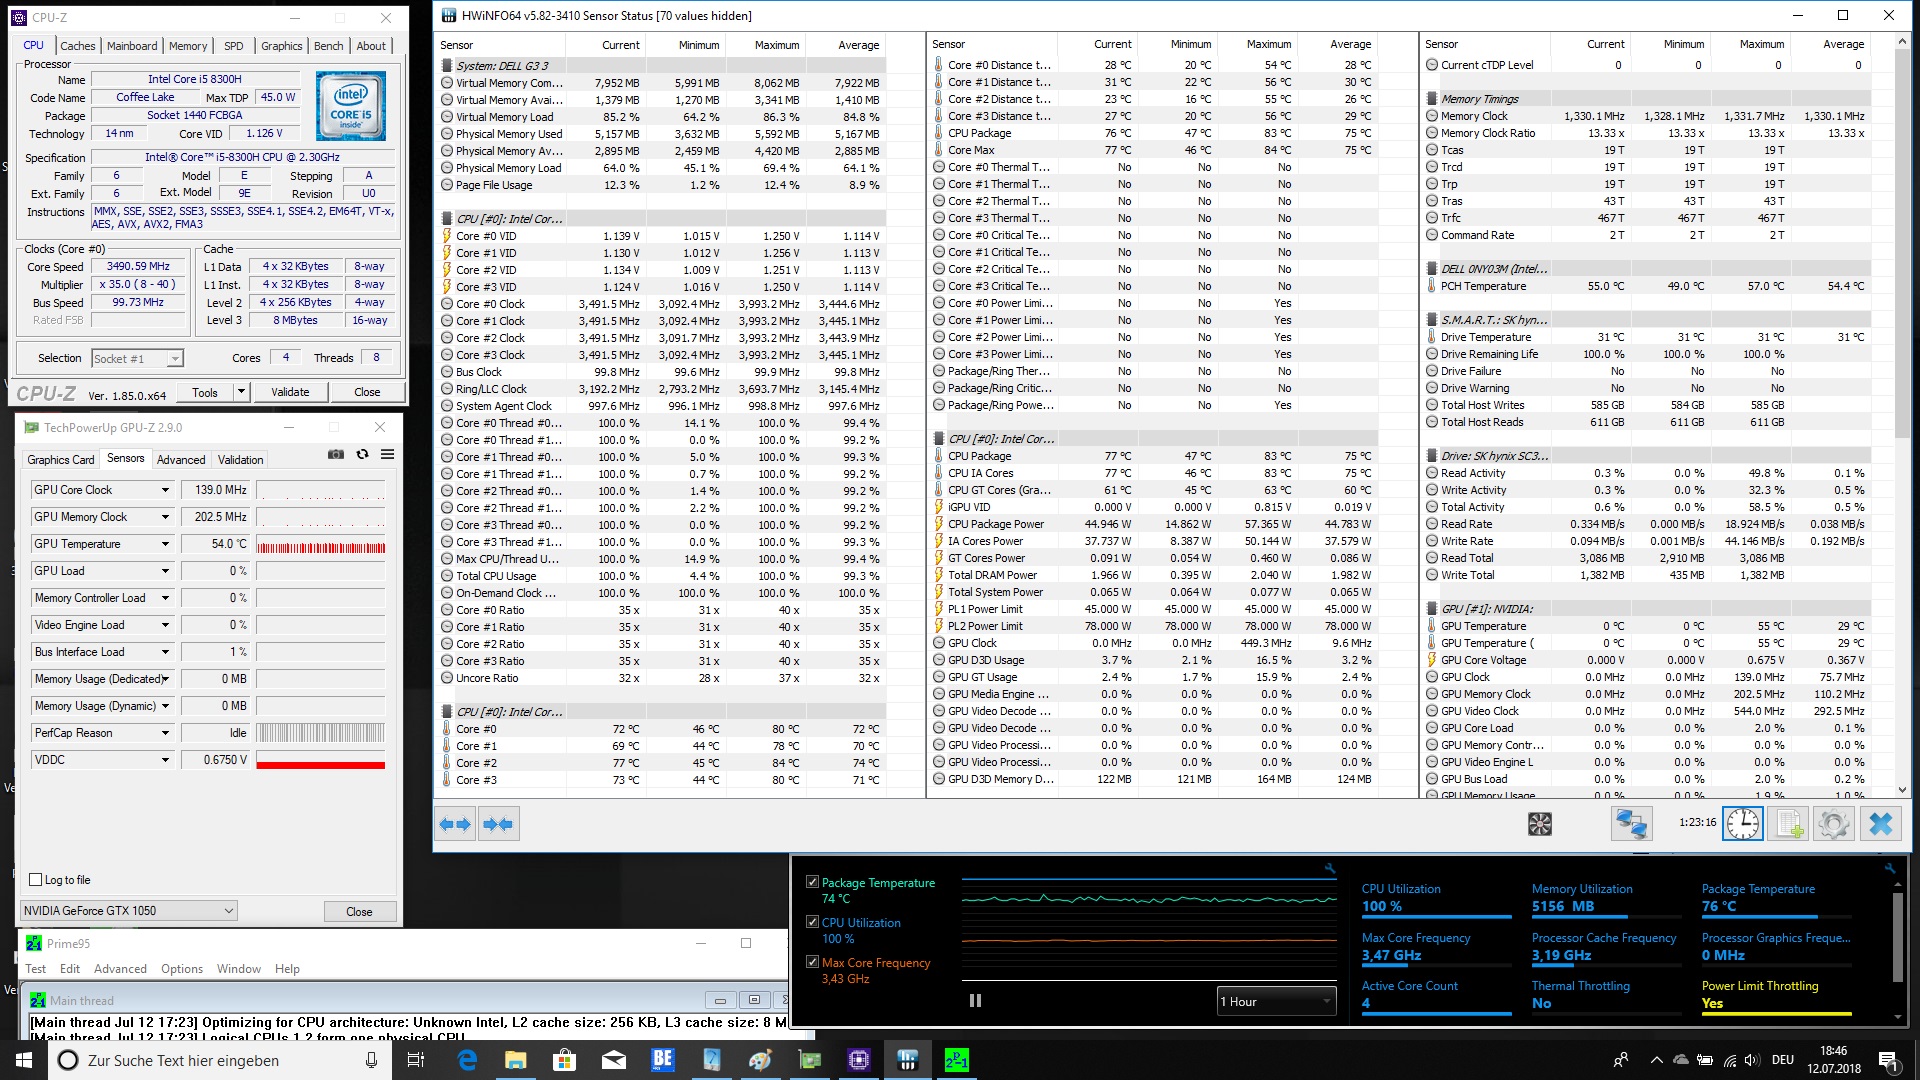
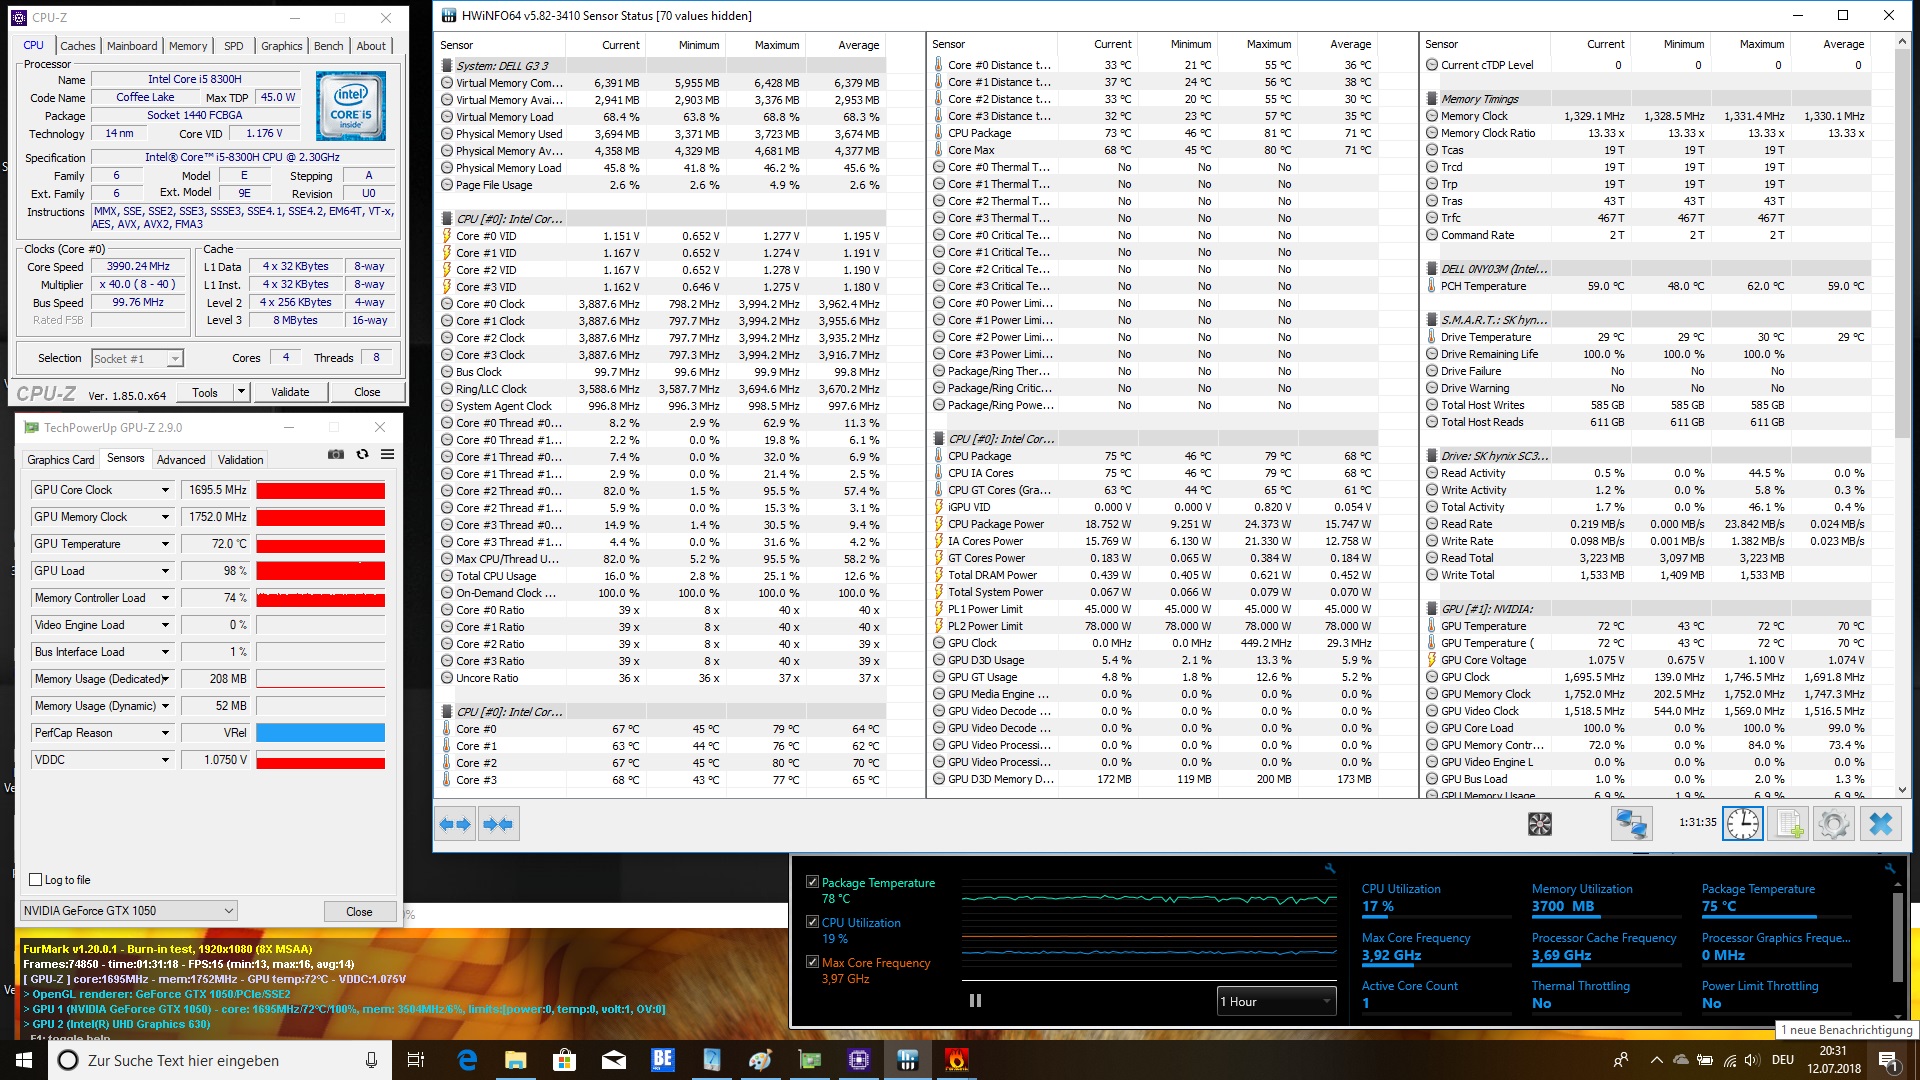
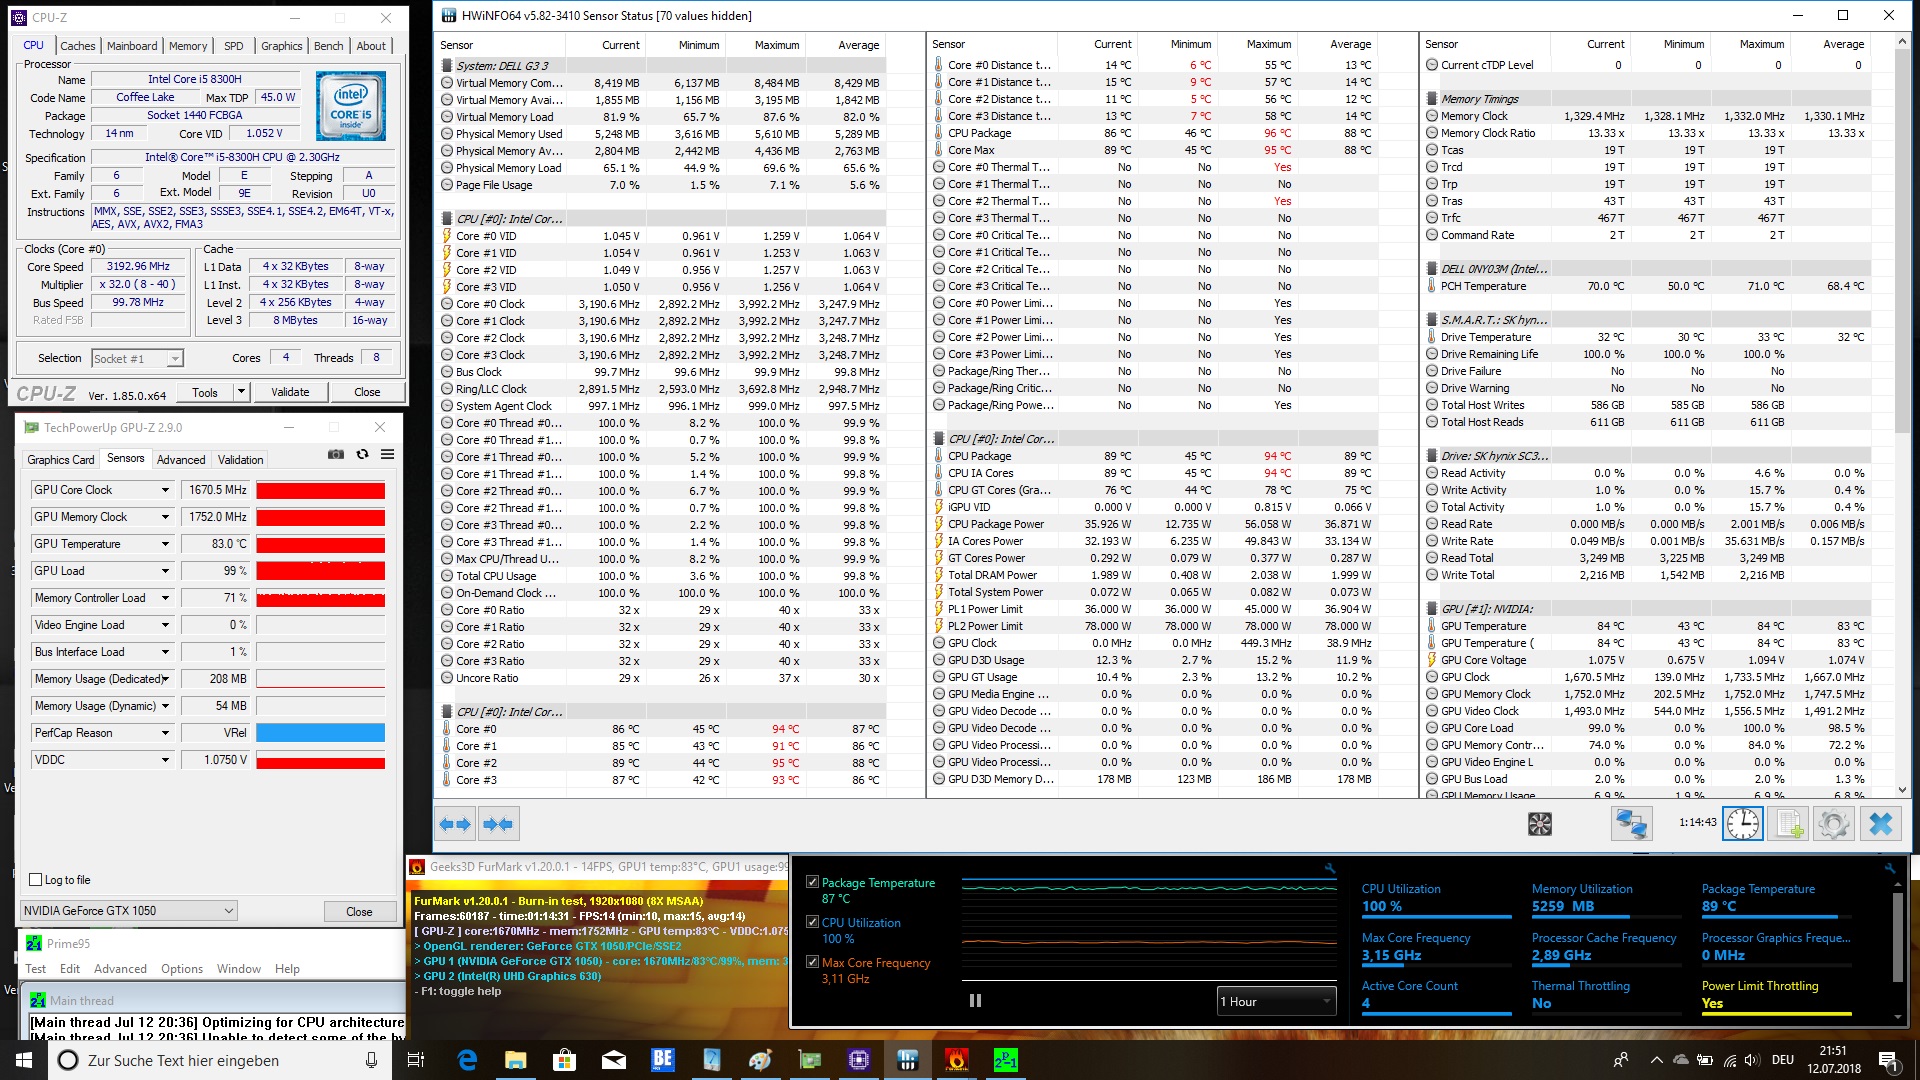
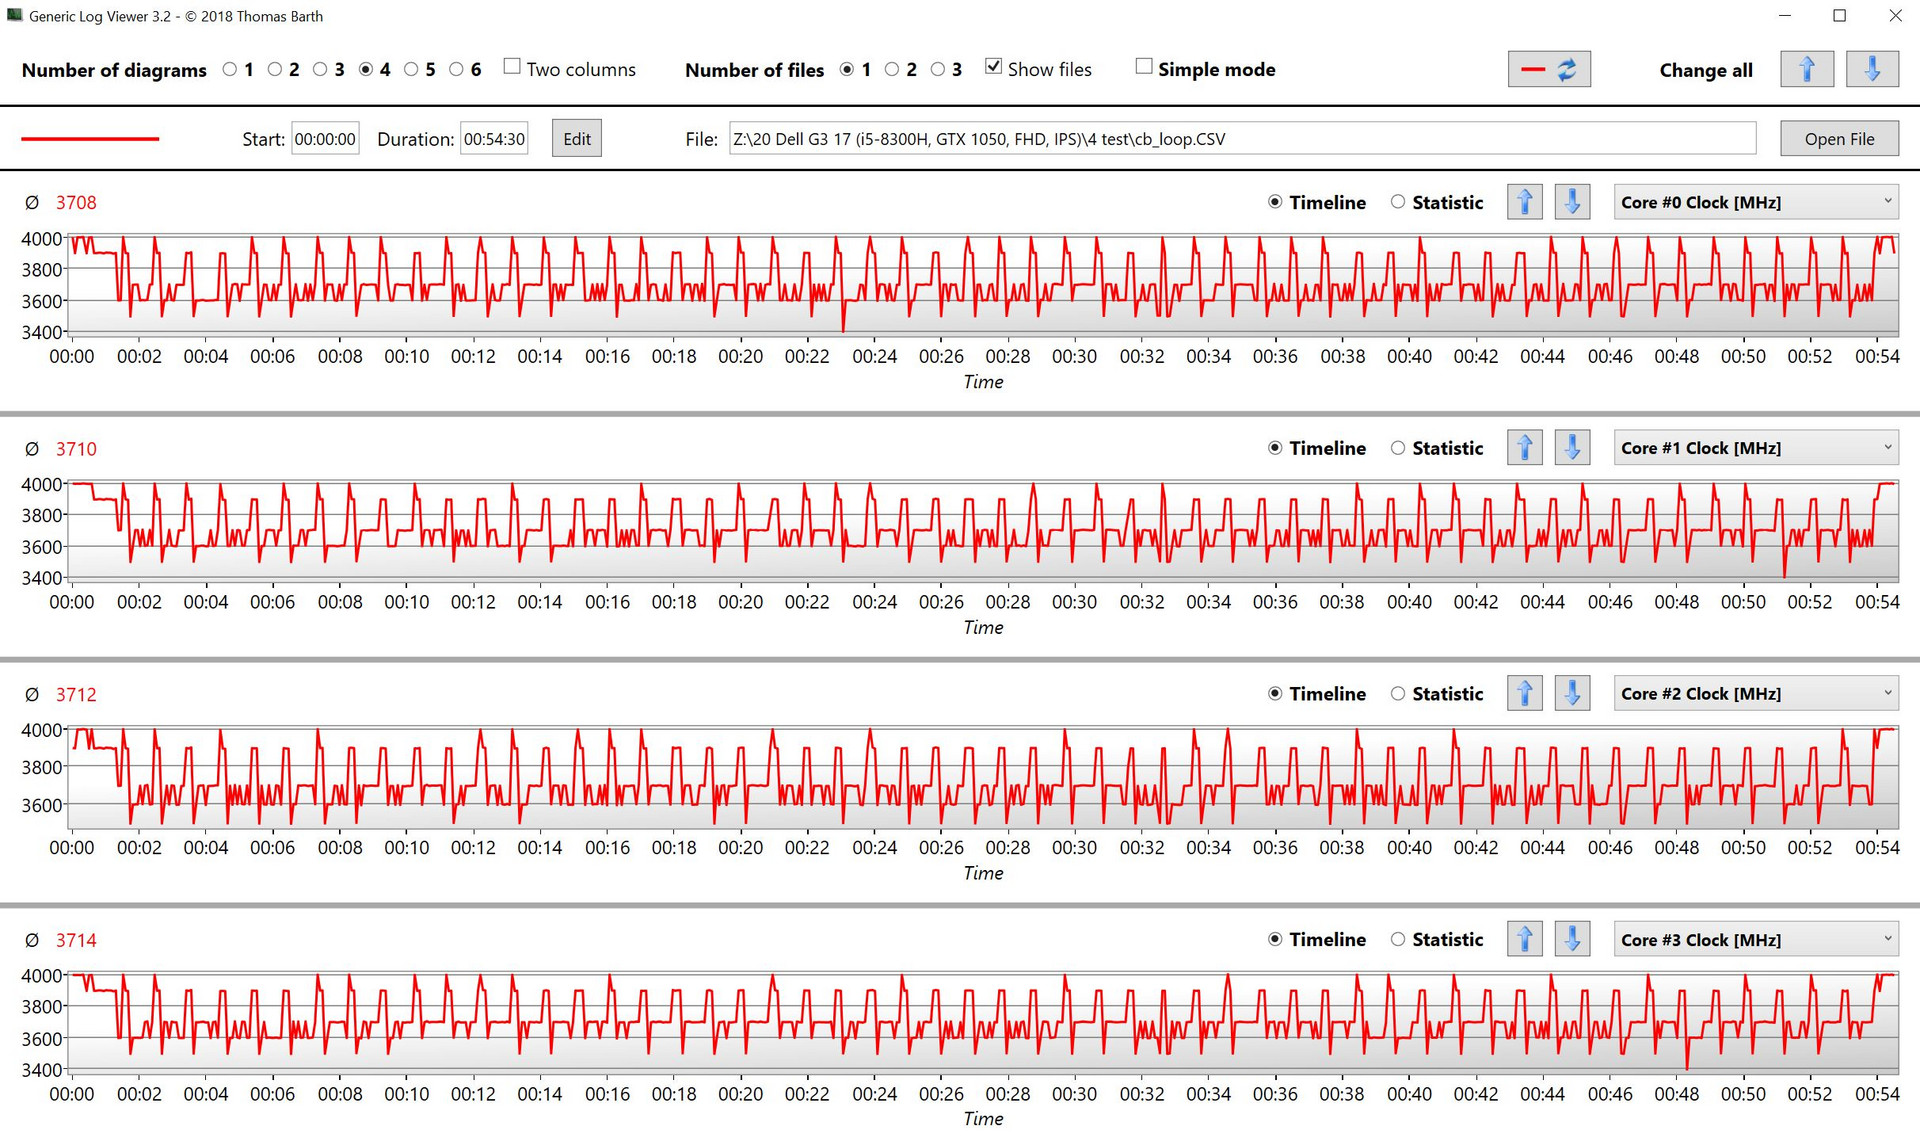
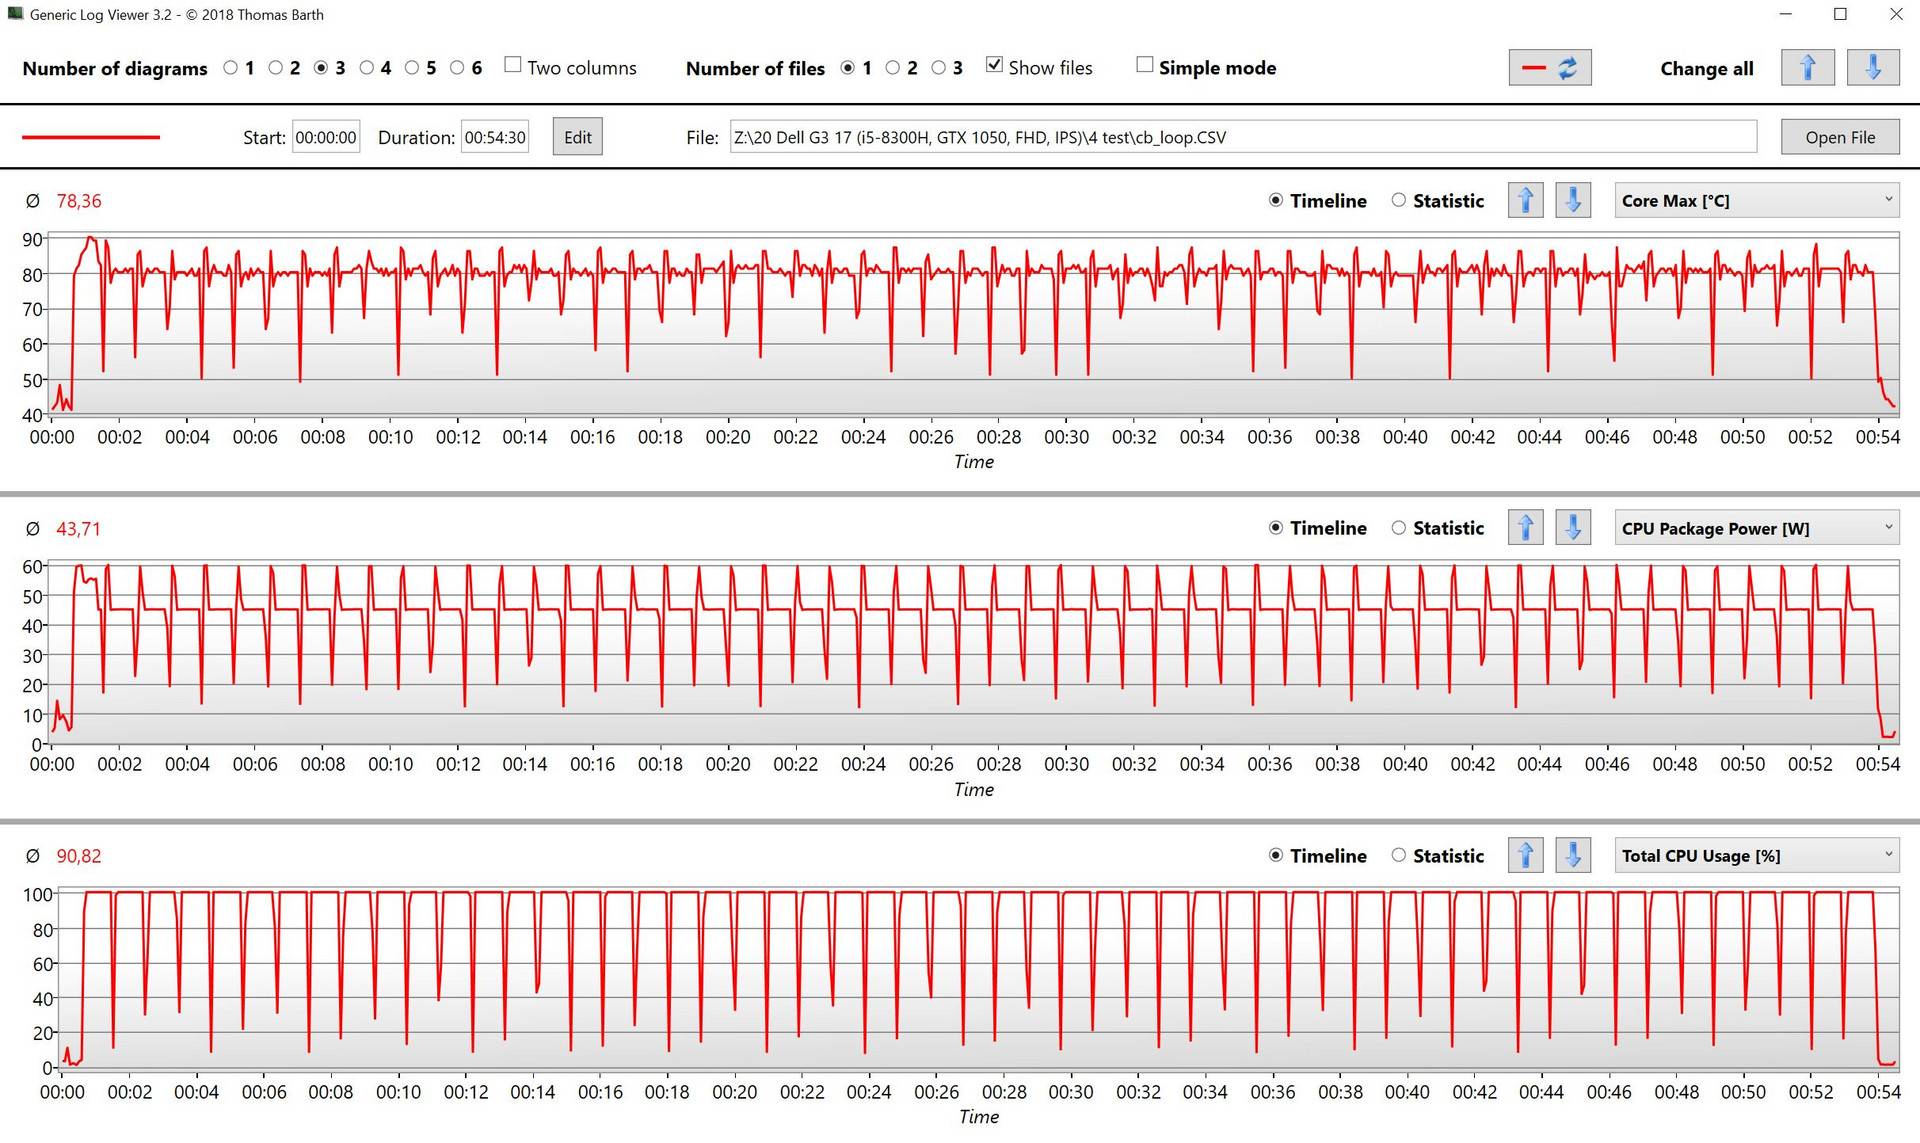
Temperaturen på höljet var i vårt tyckte lite för hög. På grund av värmekoncentrationen stryps processorn, men som tur är har det inte någon särskilt stor effekt. En Intel Core i7-8750H hade nog haft det svårare.
I slutändan kan vi konstatera att Dell erbjuder en skaplig spelenhet med sin G3 17 3779, som inte lämnar ett stort hål i hushållskassan.
Dell G3 17 3779
- 07/19/2018 v6 (old)
Sebastian Bade