Test: Asus ROG Strix GL703GM Scar Edition (8750H, GTX 1060, FHD 120 Hz) Laptop (Sammanfattning)
| SD Card Reader | |
| average JPG Copy Test (av. of 3 runs) | |
| Eurocom Q6 (Toshiba Exceria Pro SDXC 64 GB UHS-II) | |
| Asus Strix GL703GM-DS74 (Toshiba Exceria Pro SDXC 64 GB UHS-II) | |
| HP Omen 17-an014ng (Toshiba Exceria Pro SDXC 64 GB UHS-II) | |
| Razer Blade Pro RZ09-0220 (Toshiba Exceria Pro SDXC 64 GB UHS-II) | |
| MSI GE73 8RF-008 Raider RGB (Toshiba Exceria Pro SDXC 64 GB UHS-II) | |
| Acer Aspire V17 Nitro BE VN7-793-738J (Toshiba Exceria Pro SDXC 64 GB UHS-II) | |
| maximum AS SSD Seq Read Test (1GB) | |
| Eurocom Q6 (Toshiba Exceria Pro SDXC 64 GB UHS-II) | |
| Asus Strix GL703GM-DS74 (Toshiba Exceria Pro SDXC 64 GB UHS-II) | |
| HP Omen 17-an014ng (Toshiba Exceria Pro SDXC 64 GB UHS-II) | |
| Razer Blade Pro RZ09-0220 (Toshiba Exceria Pro SDXC 64 GB UHS-II) | |
| MSI GE73 8RF-008 Raider RGB (Toshiba Exceria Pro SDXC 64 GB UHS-II) | |
| Acer Aspire V17 Nitro BE VN7-793-738J (Toshiba Exceria Pro SDXC 64 GB UHS-II) | |
| |||||||||||||||||||||||||
Distribution av ljusstyrkan: 84 %
Mitt på batteriet: 297.8 cd/m²
Kontrast: 902:1 (Svärta: 0.33 cd/m²)
ΔE ColorChecker Calman: 3.68 | ∀{0.5-29.43 Ø4.73}
calibrated: 2.71
ΔE Greyscale Calman: 5 | ∀{0.09-98 Ø4.97}
99.97% sRGB (Argyll 1.6.3 3D)
84.77% AdobeRGB 1998 (Argyll 1.6.3 3D)
84.8% AdobeRGB 1998 (Argyll 3D)
100% sRGB (Argyll 3D)
90% Display P3 (Argyll 3D)
Gamma: 2.06
CCT: 6728 K
| Asus Strix GL703GM-DS74 Chi Mei CMN1747 M173JJE-G32, TN LED, 17.3", 1920x1080 | Acer Aspire V17 Nitro BE VN7-793-738J AU Optronics B173ZAN01.0, IPS, 17.3", 3840x2160 | MSI GE73 8RF-008 Raider RGB Chi Mei N173HHE-G32 (CMN1747), TN WLED, 17.3", 1920x1080 | Asus GL703GE-ES73 Chi Mei CMN1747, TN, 17.3", 1920x1080 | HP Omen 17-an014ng AUO149D, IPS, 17.3", 1920x1080 | Asus Strix GL703VM-DB74 AU Optronics B173HAN01.1, IPS, 17.3", 1920x1080 | |
|---|---|---|---|---|---|---|
| Display | 3% | 1% | -1% | -19% | -24% | |
| Display P3 Coverage (%) | 90 | 85.4 -5% | 90.8 1% | 90.1 0% | 64.6 -28% | 61.5 -32% |
| sRGB Coverage (%) | 100 | 100 0% | 99.9 0% | 99.8 0% | 92.9 -7% | 87.2 -13% |
| AdobeRGB 1998 Coverage (%) | 84.8 | 97.8 15% | 85.8 1% | 83.1 -2% | 66.1 -22% | 62.7 -26% |
| Response Times | -248% | -151% | -26% | -363% | -240% | |
| Response Time Grey 50% / Grey 80% * (ms) | 8.8 ? | 29 ? -230% | 28 ? -218% | 11.6 ? -32% | 45.2 ? -414% | 30.8 ? -250% |
| Response Time Black / White * (ms) | 7.4 ? | 27 ? -265% | 13.6 ? -84% | 8.8 ? -19% | 30.4 ? -311% | 24.4 ? -230% |
| PWM Frequency (Hz) | 25510 ? | 25000 ? | 26040 ? | |||
| Screen | 4% | 10% | 8% | 5% | -9% | |
| Brightness middle (cd/m²) | 297.8 | 380 28% | 273 -8% | 331.1 11% | 314 5% | 319.5 7% |
| Brightness (cd/m²) | 285 | 336 18% | 273 -4% | 312 9% | 309 8% | 293 3% |
| Brightness Distribution (%) | 84 | 81 -4% | 90 7% | 86 2% | 88 5% | 67 -20% |
| Black Level * (cd/m²) | 0.33 | 0.32 3% | 0.26 21% | 0.31 6% | 0.34 -3% | 0.65 -97% |
| Contrast (:1) | 902 | 1188 32% | 1050 16% | 1068 18% | 924 2% | 492 -45% |
| Colorchecker dE 2000 * | 3.68 | 5.32 -45% | 3.52 4% | 2.86 22% | 3.19 13% | 3.17 14% |
| Colorchecker dE 2000 max. * | 7.71 | 7.63 1% | 6.34 18% | 6.35 18% | 6.1 21% | 5.32 31% |
| Colorchecker dE 2000 calibrated * | 2.71 | 2.09 23% | 2.66 2% | |||
| Greyscale dE 2000 * | 5 | 4.9 2% | 3.11 38% | 4.3 14% | 3.49 30% | 1.6 68% |
| Gamma | 2.06 107% | 2.61 84% | 2.43 91% | 2.268 97% | 2.34 94% | 2.22 99% |
| CCT | 6728 97% | 6558 99% | 6999 93% | 7034 92% | 7261 90% | 6668 97% |
| Color Space (Percent of AdobeRGB 1998) (%) | 84.77 | 87.2 3% | 76 -10% | 75 -12% | 60 -29% | 56 -34% |
| Color Space (Percent of sRGB) (%) | 99.97 | 100 0% | 100 0% | 100 0% | 93 -7% | 87 -13% |
| Totalt genomsnitt (program/inställningar) | -80% /
-30% | -47% /
-12% | -6% /
2% | -126% /
-49% | -91% /
-42% |
* ... mindre är bättre
Visa svarstider
| ↔ Svarstid svart till vitt | ||
|---|---|---|
| 7.4 ms ... stiga ↗ och falla ↘ kombinerat | ↗ 5.2 ms stiga | 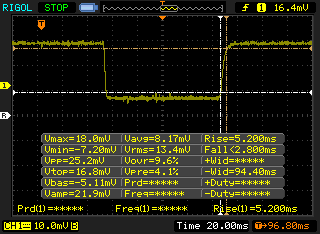 |
| ↘ 2.2 ms hösten | ||
| Skärmen visar väldigt snabba svarsfrekvenser i våra tester och borde vara mycket väl lämpad för fartfyllt spel. I jämförelse sträcker sig alla testade enheter från 0.1 (minst) till 240 (maximalt) ms. » 22 % av alla enheter är bättre. Det betyder att den uppmätta svarstiden är bättre än genomsnittet av alla testade enheter (19.9 ms). | ||
| ↔ Svarstid 50 % grått till 80 % grått | ||
| 8.8 ms ... stiga ↗ och falla ↘ kombinerat | ↗ 4.4 ms stiga | 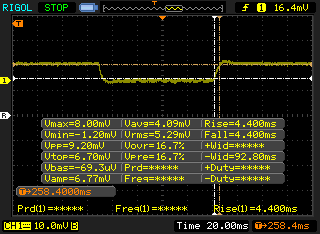 |
| ↘ 4.4 ms hösten | ||
| Skärmen visar snabba svarsfrekvenser i våra tester och bör passa för spel. I jämförelse sträcker sig alla testade enheter från 0.165 (minst) till 636 (maximalt) ms. » 22 % av alla enheter är bättre. Det betyder att den uppmätta svarstiden är bättre än genomsnittet av alla testade enheter (31.1 ms). | ||
Skärmflimmer / PWM (Puls-Width Modulation)
| Skärmflimmer / PWM upptäckt | 25510 Hz | ≤ 15 % ljusstyrka inställning | 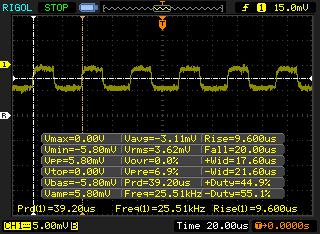 |
Displayens bakgrundsbelysning flimrar vid 25510 Hz (i värsta fall, t.ex. med PWM) Flimrande upptäckt vid en ljusstyrkeinställning på 15 % och lägre. Det ska inte finnas något flimmer eller PWM över denna ljusstyrkeinställning. Frekvensen för 25510 Hz är ganska hög, så de flesta användare som är känsliga för PWM bör inte märka något flimmer. Som jämförelse: 52 % av alla testade enheter använder inte PWM för att dämpa skärmen. Om PWM upptäcktes mättes ett medelvärde av 7794 (minst: 5 - maximum: 343500) Hz. | |||
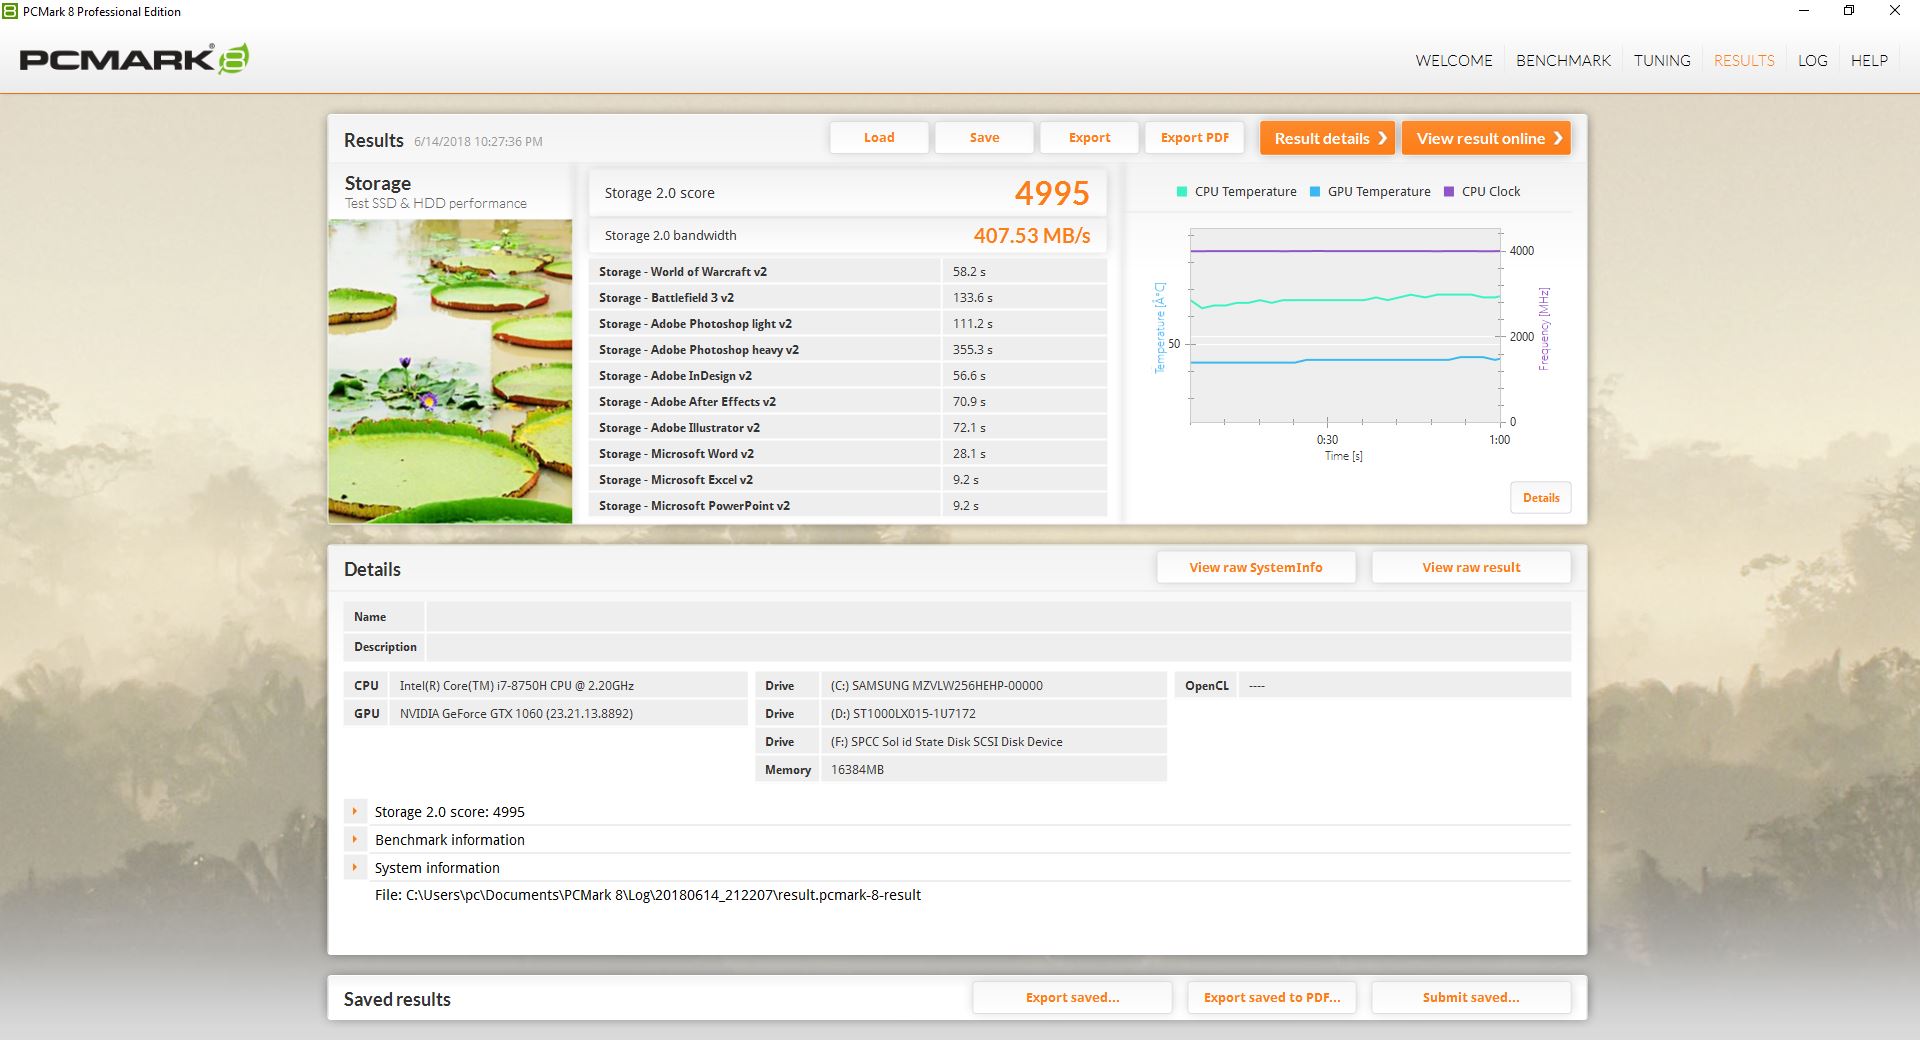
| PCMark 8 Home Score Accelerated v2 | 5371 poäng | |
| PCMark 8 Creative Score Accelerated v2 | 7765 poäng | |
| PCMark 8 Work Score Accelerated v2 | 5528 poäng | |
| PCMark 10 Score | 5525 poäng | |
Hjälp | ||
| Asus Strix GL703GM-DS74 Samsung PM961 MZVLW256HEHP | Acer Aspire V17 Nitro BE VN7-793-738J Intel SSD 600p SSDPEKKW512G7 | MSI GE73 8RF-008 Raider RGB Toshiba HG6 THNSNJ256G8NY | HP Omen 17-an014ng Samsung PM961 MZVLW256HEHP | Eurocom Q6 Samsung SSD 960 Pro 512 GB m.2 | |
|---|---|---|---|---|---|
| AS SSD | -17% | -84% | -419% | 31% | |
| Copy Game MB/s (MB/s) | 481 | 816 70% | 295.5 -39% | 633 32% | |
| Copy Program MB/s (MB/s) | 780 | 336 -57% | 192.9 -75% | 363.4 -53% | |
| Copy ISO MB/s (MB/s) | 1043 | 1092 5% | 412.5 -60% | 1768 70% | |
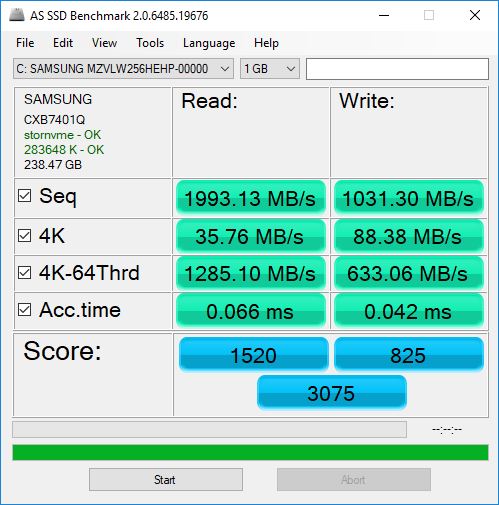
| Score Total (Points) | 3075 | 1678 -45% | 881 -71% | 2205 -28% | 3894 27% |
| Score Write (Points) | 825 | 677 -18% | 254 -69% | 161 -80% | 1693 105% |
| Score Read (Points) | 1520 | 692 -54% | 417 -73% | 1414 -7% | 1477 -3% |
| Access Time Write * (ms) | 0.042 | 0.035 17% | 0.097 -131% | 1.85 -4305% | 0.039 7% |
| Access Time Read * (ms) | 0.066 | 0.075 -14% | 0.235 -256% | 0.058 12% | 0.049 26% |
| 4K-64 Write (MB/s) | 633 | 516 -18% | 172.7 -73% | 122.9 -81% | 1403 122% |
| 4K-64 Read (MB/s) | 1285 | 503 -61% | 351.4 -73% | 1129 -12% | 1195 -7% |
| 4K Write (MB/s) | 88.4 | 104.8 19% | 38.34 -57% | 1.26 -99% | 96.2 9% |
| 4K Read (MB/s) | 35.76 | 29.75 -17% | 14.07 -61% | 47.62 33% | 29.62 -17% |
| Seq Write (MB/s) | 1031 | 566 -45% | 425.7 -59% | 365.5 -65% | 1943 88% |
| Seq Read (MB/s) | 1993 | 1590 -20% | 511 -74% | 2374 19% | 2523 27% |
* ... mindre är bättre

| 3DMark 11 Performance | 13021 poäng | |
| 3DMark Cloud Gate Standard Score | 30148 poäng | |
| 3DMark Fire Strike Score | 10198 poäng | |
| 3DMark Fire Strike Extreme Score | 5212 poäng | |
Hjälp | ||
| Rise of the Tomb Raider | |
| 1920x1080 Very High Preset AA:FX AF:16x (sortera efter värde) | |
| Asus Strix GL703GM-DS74 | |
| HP Omen 17-an014ng | |
| Razer Blade Pro RZ09-0220 | |
| Eurocom Q6 | |
| Asus Strix GL703VM-DB74 | |
| MSI GP62 7REX-1045US | |
| Genomsnitt NVIDIA GeForce GTX 1060 Mobile (51 - 68.8, n=37) | |
| 1920x1080 High Preset AA:FX AF:4x (sortera efter värde) | |
| Asus Strix GL703GM-DS74 | |
| HP Omen 17-an014ng | |
| Razer Blade Pro RZ09-0220 | |
| Eurocom Q6 | |
| MSI GP62 7REX-1045US | |
| Genomsnitt NVIDIA GeForce GTX 1060 Mobile (65.3 - 82, n=24) | |
| 1366x768 Medium Preset AF:2x (sortera efter värde) | |
| Asus Strix GL703GM-DS74 | |
| HP Omen 17-an014ng | |
| Eurocom Q6 | |
| MSI GP62 7REX-1045US | |
| Genomsnitt NVIDIA GeForce GTX 1060 Mobile (82.2 - 140, n=14) | |
| The Witcher 3 | |
| 1920x1080 Ultra Graphics & Postprocessing (HBAO+) (sortera efter värde) | |
| Asus Strix GL703GM-DS74 | |
| MSI GE73 8RF-008 Raider RGB | |
| Asus GL703GE-ES73 | |
| HP Omen 17-an014ng | |
| Razer Blade Pro RZ09-0220 | |
| Eurocom Q6 | |
| Asus Strix GL703VM-DB74 | |
| Aorus X5 v8 | |
| Genomsnitt NVIDIA GeForce GTX 1060 Mobile (24 - 42.3, n=60) | |
| 1920x1080 High Graphics & Postprocessing (Nvidia HairWorks Off) (sortera efter värde) | |
| Asus Strix GL703GM-DS74 | |
| MSI GE73 8RF-008 Raider RGB | |
| HP Omen 17-an014ng | |
| Razer Blade Pro RZ09-0220 | |
| Eurocom Q6 | |
| Aorus X5 v8 | |
| Genomsnitt NVIDIA GeForce GTX 1060 Mobile (52.6 - 80.6, n=49) | |
| 1366x768 Medium Graphics & Postprocessing (sortera efter värde) | |
| Asus Strix GL703GM-DS74 | |
| MSI GE73 8RF-008 Raider RGB | |
| HP Omen 17-an014ng | |
| Eurocom Q6 | |
| Genomsnitt NVIDIA GeForce GTX 1060 Mobile (91.7 - 138.7, n=16) | |
| låg | med. | hög | ultra | |
|---|---|---|---|---|
| BioShock Infinite (2013) | 300.4 | 257.8 | 234.2 | 115.2 |
| The Witcher 3 (2015) | 200.7 | 134.3 | 58.8 | 41 |
| Rise of the Tomb Raider (2016) | 183.8 | 140 | 76 | 64 |
Ljudnivå
| Låg belastning |
| 29.4 / 29.4 / 33.7 dB(A) |
| Hög belastning |
| 41.2 / 48.3 dB(A) |
 | ||
30 dB tyst 40 dB(A) hörbar 50 dB(A) högt ljud |
||
min: | ||
| Asus Strix GL703GM-DS74 GeForce GTX 1060 Mobile, i7-8750H, Samsung PM961 MZVLW256HEHP | Asus Strix GL703VM-DB74 GeForce GTX 1060 Mobile, i7-7700HQ, Seagate Mobile HDD 1TB ST1000LX015-1U7172 | Acer Aspire V17 Nitro BE VN7-793-738J GeForce GTX 1060 Mobile, i7-7700HQ, Intel SSD 600p SSDPEKKW512G7 | MSI GE73 8RF-008 Raider RGB GeForce GTX 1070 Mobile, i7-8750H, Toshiba HG6 THNSNJ256G8NY | HP Omen 17-an014ng GeForce GTX 1070 Mobile, i7-7700HQ, Samsung PM961 MZVLW256HEHP | |
|---|---|---|---|---|---|
| Noise | -1% | -0% | -6% | -10% | |
| av / miljö * (dB) | 28.6 | 28.4 1% | 30.8 -8% | 30 -5% | 30 -5% |
| Idle Minimum * (dB) | 29.4 | 30.2 -3% | 31.4 -7% | 32 -9% | 30 -2% |
| Idle Average * (dB) | 29.4 | 30.2 -3% | 31.4 -7% | 33 -12% | 37 -26% |
| Idle Maximum * (dB) | 33.7 | 30.2 10% | 31.4 7% | 34 -1% | 39 -16% |
| Load Average * (dB) | 41.2 | 38.4 7% | 38.6 6% | 41 -0% | 44 -7% |
| Witcher 3 ultra * (dB) | 47.3 | 49.7 -5% | 50 -6% | 47 1% | |
| Load Maximum * (dB) | 48.3 | 54.5 -13% | 44.3 8% | 54 -12% | 55 -14% |
* ... mindre är bättre
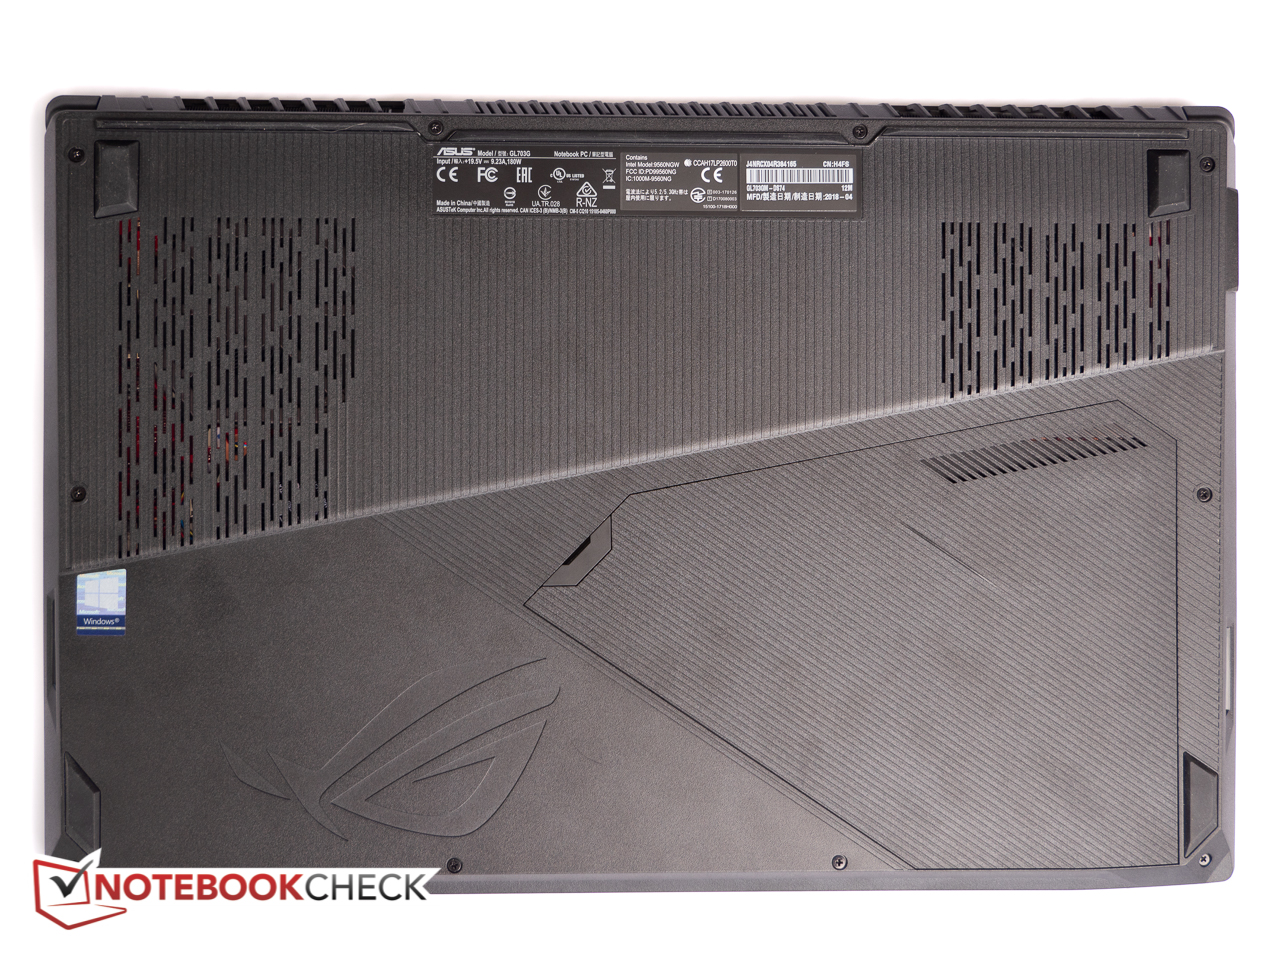
(-) Den maximala temperaturen på ovansidan är 54.6 °C / 130 F, jämfört med genomsnittet av 40.4 °C / 105 F , allt från 21.2 till 68.8 °C för klassen Gaming.
(±) Botten värms upp till maximalt 41.2 °C / 106 F, jämfört med genomsnittet av 43.2 °C / 110 F
(+) Vid tomgångsbruk är medeltemperaturen för ovansidan 28.1 °C / 83 F, jämfört med enhetsgenomsnittet på 33.9 °C / ### class_avg_f### F.
(±) När du spelar The Witcher 3 är medeltemperaturen för ovansidan 35.5 °C / 96 F, jämfört med enhetsgenomsnittet på 33.9 °C / ## #class_avg_f### F.
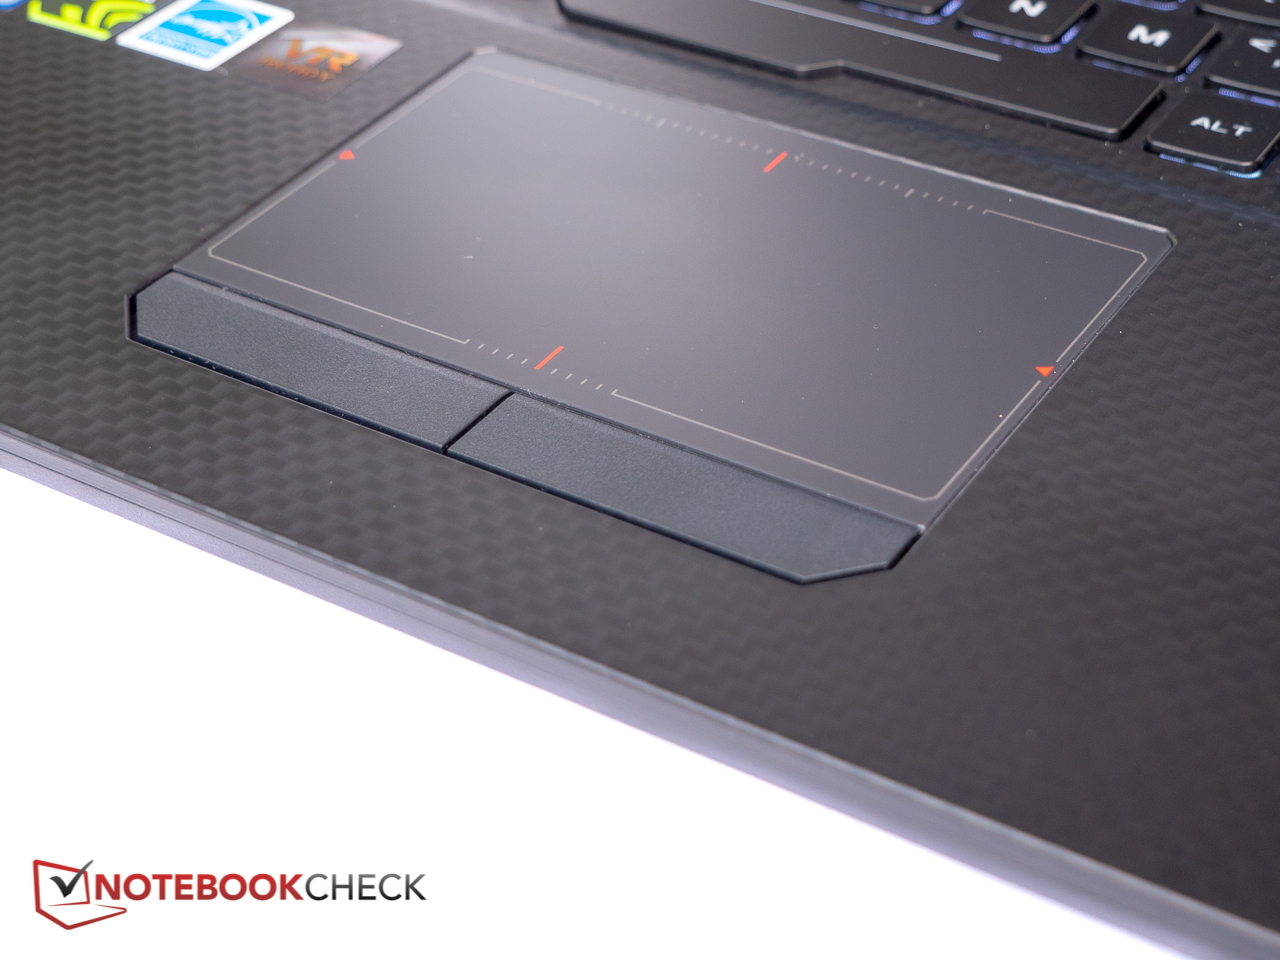
(+) Handledsstöden och pekplattan är kallare än hudtemperaturen med maximalt 28 °C / 82.4 F och är därför svala att ta på.
(±) Medeltemperaturen för handledsstödsområdet på liknande enheter var 28.8 °C / 83.8 F (+0.8 °C / 1.4 F).
Asus Strix GL703GM-DS74 ljudanalys
(-) | inte särskilt höga högtalare (69.7 dB)
Bas 100 - 315 Hz
(±) | reducerad bas - i genomsnitt 7.3% lägre än medianen
(±) | linjäriteten för basen är genomsnittlig (10.8% delta till föregående frekvens)
Mellan 400 - 2000 Hz
(+) | balanserad mellan - endast 2.2% från medianen
(+) | mids är linjära (5.6% delta till föregående frekvens)
Högsta 2 - 16 kHz
(+) | balanserade toppar - endast 4.2% från medianen
(±) | linjäriteten för toppar är genomsnittlig (13.1% delta till föregående frekvens)
Totalt 100 - 16 000 Hz
(±) | linjäriteten för det totala ljudet är genomsnittlig (15.6% skillnad mot median)
Jämfört med samma klass
» 36% av alla testade enheter i den här klassen var bättre, 6% liknande, 58% sämre
» Den bästa hade ett delta på 6%, genomsnittet var 18%, sämst var 132%
Jämfört med alla testade enheter
» 23% av alla testade enheter var bättre, 5% liknande, 72% sämre
» Den bästa hade ett delta på 4%, genomsnittet var 24%, sämst var 134%
Apple MacBook 12 (Early 2016) 1.1 GHz ljudanalys
(+) | högtalare kan spela relativt högt (83.6 dB)
Bas 100 - 315 Hz
(±) | reducerad bas - i genomsnitt 11.3% lägre än medianen
(±) | linjäriteten för basen är genomsnittlig (14.2% delta till föregående frekvens)
Mellan 400 - 2000 Hz
(+) | balanserad mellan - endast 2.4% från medianen
(+) | mids är linjära (5.5% delta till föregående frekvens)
Högsta 2 - 16 kHz
(+) | balanserade toppar - endast 2% från medianen
(+) | toppar är linjära (4.5% delta till föregående frekvens)
Totalt 100 - 16 000 Hz
(+) | det totala ljudet är linjärt (10.2% skillnad mot median)
Jämfört med samma klass
» 7% av alla testade enheter i den här klassen var bättre, 2% liknande, 91% sämre
» Den bästa hade ett delta på 5%, genomsnittet var 18%, sämst var 53%
Jämfört med alla testade enheter
» 5% av alla testade enheter var bättre, 1% liknande, 94% sämre
» Den bästa hade ett delta på 4%, genomsnittet var 24%, sämst var 134%
| Av/Standby | |
| Låg belastning | |
| Hög belastning |
|
Förklaring:
min: | |
| Asus Strix GL703GM-DS74 i7-8750H, GeForce GTX 1060 Mobile, Samsung PM961 MZVLW256HEHP, TN LED, 1920x1080, 17.3" | Asus Strix GL703VM-DB74 i7-7700HQ, GeForce GTX 1060 Mobile, Seagate Mobile HDD 1TB ST1000LX015-1U7172, IPS, 1920x1080, 17.3" | MSI GP62 7REX-1045US i7-7700HQ, GeForce GTX 1050 Ti Mobile, Toshiba NVMe THNSN5128GP, TN LED, 1920x1080, 15.6" | MSI GE73 8RF-008 Raider RGB i7-8750H, GeForce GTX 1070 Mobile, Toshiba HG6 THNSNJ256G8NY, TN WLED, 1920x1080, 17.3" | HP Omen 17-an014ng i7-7700HQ, GeForce GTX 1070 Mobile, Samsung PM961 MZVLW256HEHP, IPS, 1920x1080, 17.3" | |
|---|---|---|---|---|---|
| Power Consumption | 15% | 27% | -2% | -11% | |
| Idle Minimum * (Watt) | 18.88 | 17.3 8% | 14.6 23% | 15 21% | 22 -17% |
| Idle Average * (Watt) | 24.36 | 21.8 11% | 17.2 29% | 20 18% | 28 -15% |
| Idle Maximum * (Watt) | 32.27 | 23 29% | 17.3 46% | 26 19% | 35 -8% |
| Load Average * (Watt) | 107.74 | 79.2 26% | 82.7 23% | 97 10% | 93 14% |
| Witcher 3 ultra * (Watt) | 142 | 107 25% | 186 -31% | 157 -11% | |
| Load Maximum * (Watt) | 160.28 | 158.2 1% | 136.7 15% | 239 -49% | 208 -30% |
* ... mindre är bättre
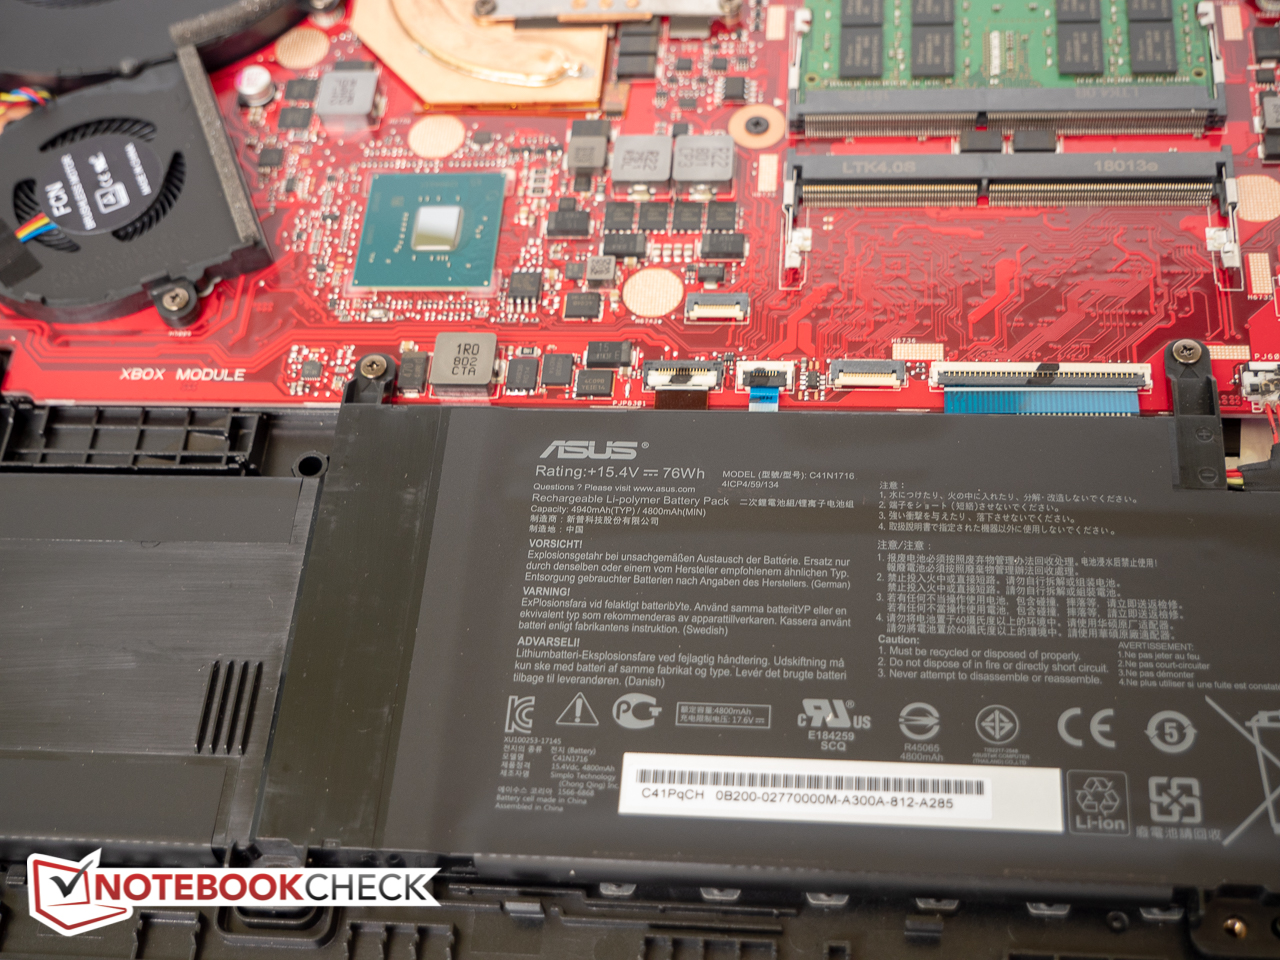
| Asus Strix GL703GM-DS74 i7-8750H, GeForce GTX 1060 Mobile, 74 Wh | Acer Aspire V17 Nitro BE VN7-793-738J i7-7700HQ, GeForce GTX 1060 Mobile, 69 Wh | MSI GE73 8RF-008 Raider RGB i7-8750H, GeForce GTX 1070 Mobile, 51 Wh | Asus GL703GE-ES73 i7-8750H, GeForce GTX 1050 Ti Mobile, 64 Wh | HP Omen 17-an014ng i7-7700HQ, GeForce GTX 1070 Mobile, 86 Wh | Razer Blade Pro RZ09-0220 i7-7700HQ, GeForce GTX 1060 Mobile, 70 Wh | Asus Strix GL703VM-DB74 i7-7700HQ, GeForce GTX 1060 Mobile, 64 Wh | MSI GP62 7REX-1045US i7-7700HQ, GeForce GTX 1050 Ti Mobile, 41 Wh | |
|---|---|---|---|---|---|---|---|---|
| Batteridrifttid | 28% | -23% | 3% | 17% | 73% | -20% | -27% | |
| Reader / Idle (h) | 5.3 | 5.1 -4% | 5.8 9% | 5.8 9% | 12 126% | 4 -25% | 4.3 -19% | |
| WiFi v1.3 (h) | 3.6 | 4.6 28% | 3.1 -14% | 4.8 33% | 4.5 25% | 7 94% | 3.2 -11% | 2.9 -19% |
| Load (h) | 1.2 | 0.6 -50% | 0.8 -33% | 1.4 17% | 1.2 0% | 0.9 -25% | 0.7 -42% |
För
Emot

Läs den fullständiga versionen av den här recensionen på engelska här.
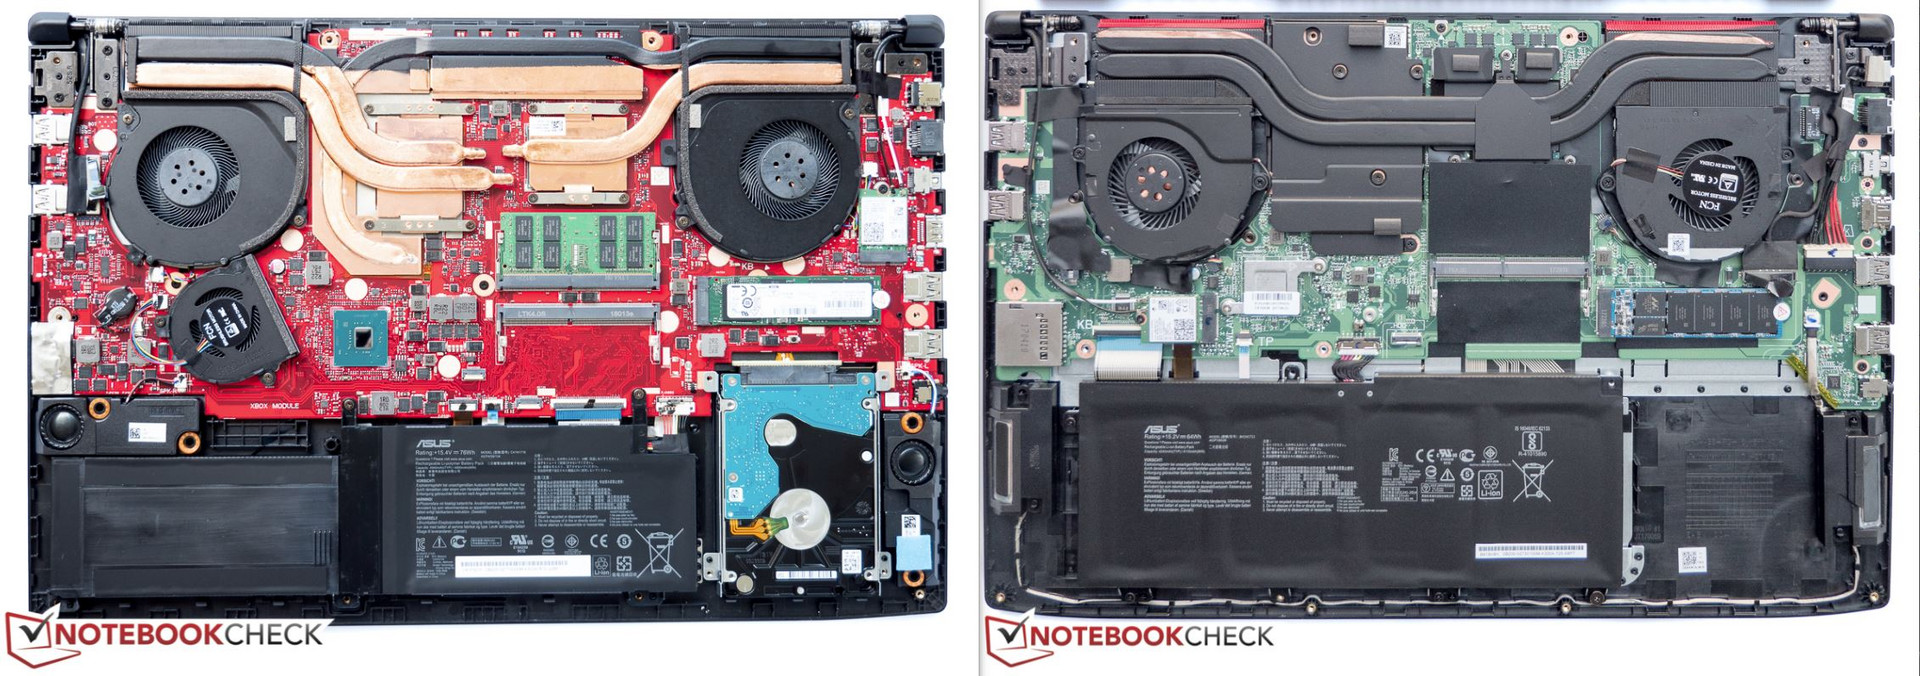
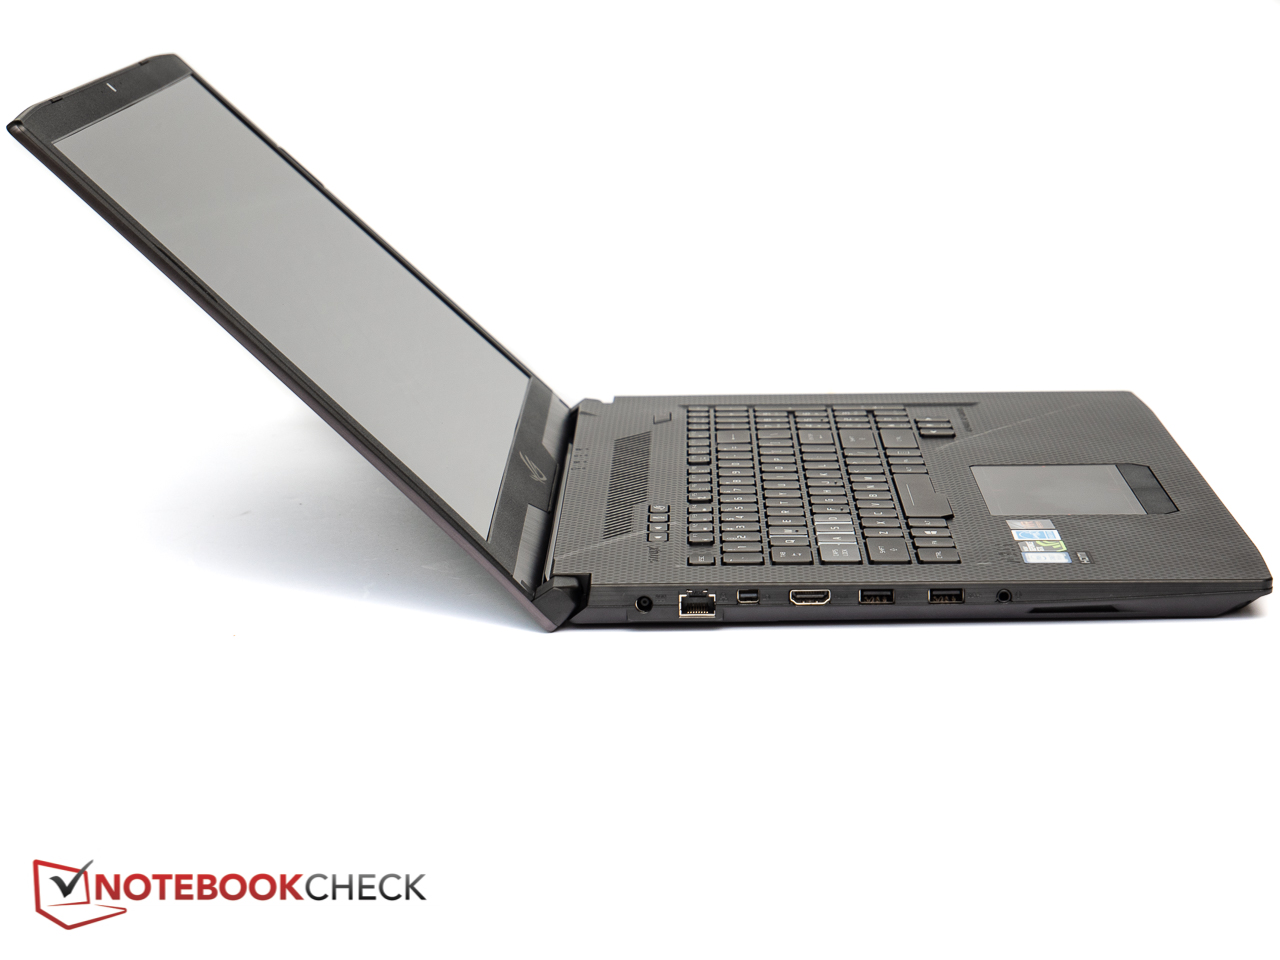
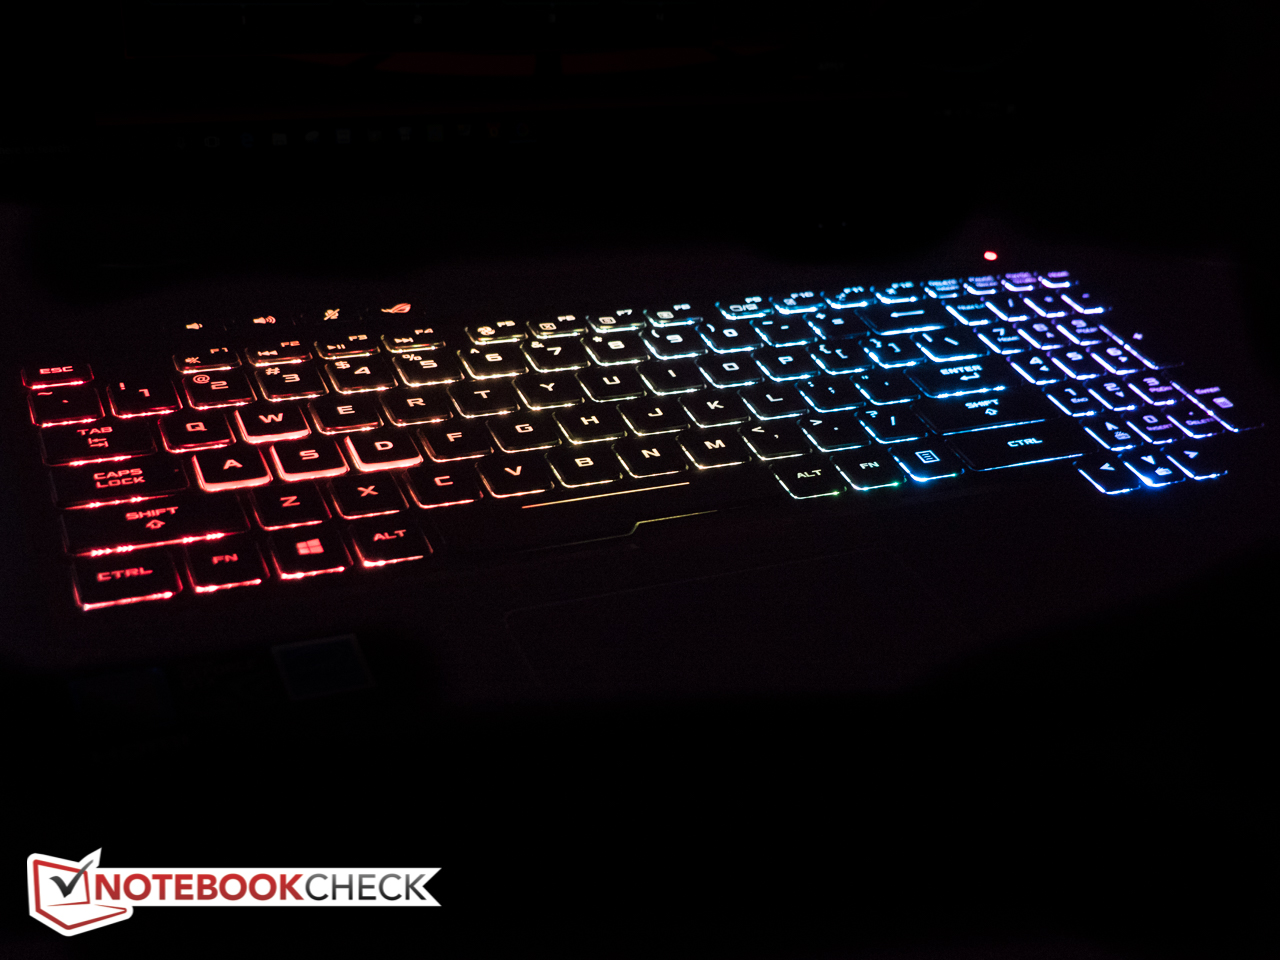
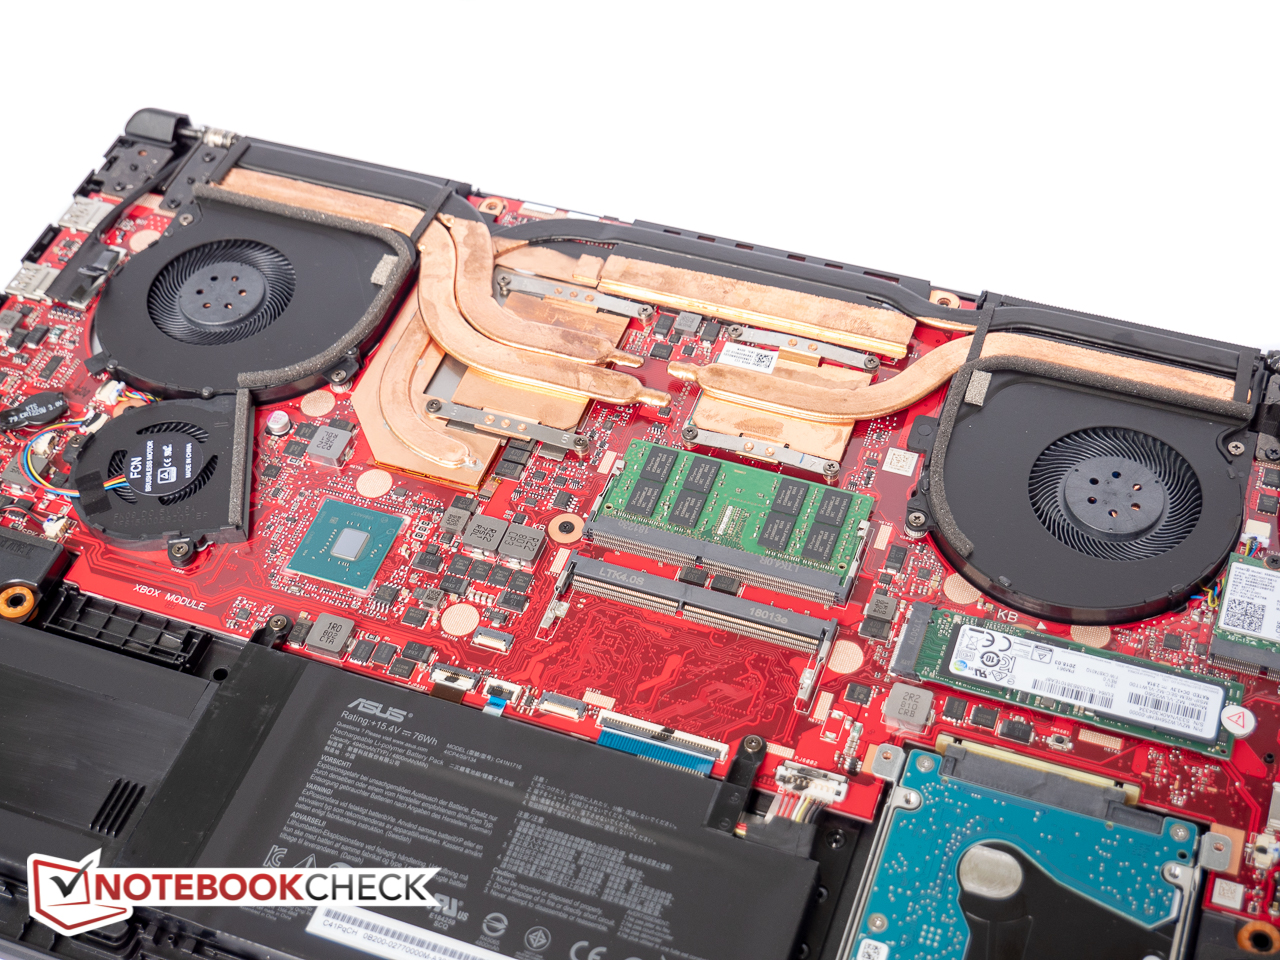
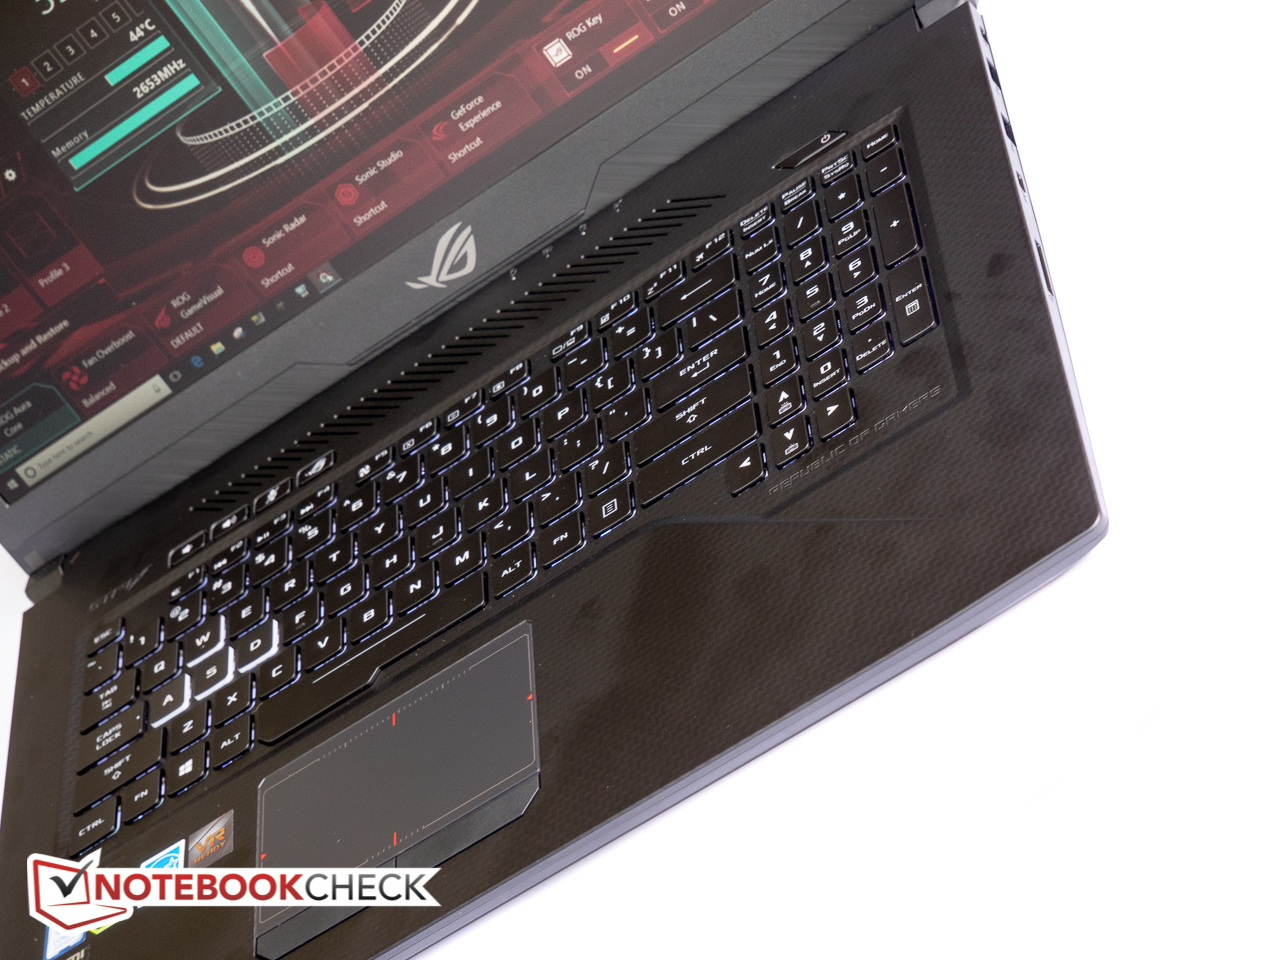
Mycket bättre värmehantering tack vare ett omgjort värmerörs- och fläktsystem, aningen lägre ljudnivå och en ökning i prestanda på runt 15 - 25 procent: GL703GM är definitivt en förbättring över GL703VD som använde förra generationens i7-processor. Skärmbytet från en 120 Hz IPS-panel till en baserad på TN-teknologi är ett tveeggat svärd, då responstider förstås är kraftigt förbättrade på bekostnad av reducerade betraktningsvinklar. Men dom flesta gamers kommer troligen välkomna denna förändring. Konstruktionskvaliteten är skaplig, inmatningsenheterna är gedigna och spelupplevelsen lämnar inget att önska.
Batteritiden förblir tyvärr oimponerande och systemets fläktar är fortfarande högljudda och låter obehagligt vid belastning. Att en Thunderbolt 3-port fortfarande saknas kan frustrera somliga.
GL703GM genererar inte i närheten så mycket värme som sin föregångare och är mycket lättare att leva med på en daglig basis, men en del konkurrenter erbjuder en liknande uppsättning funktioner för mindre pengar.
Asus ROG Strix-modeller brukar inte säljas till reapris och med ett butikspris på 16.000 kronor är GL703GM inte direkt ett undantag. HP Omen 17 med en CPU från 8:e generationen, en 144 Hz-skärm med stöd för G-Sync och en kombination av 128 GB SSD och 1 TB HDD säljs för runt 2.000 kronor mindre; kan man klara sig med den äldre fyrkärniga i7-processorn kan man köpa ett system som Acer Predator Helios 300 med ett mer avancerat GTX 1070 för runt 15.000 kronor.
Asus Strix GL703GM-DS74
- 07/01/2018 v6 (old)
Bernie Pechlaner
Price comparison
