Test: Eurocom Sky X7C (i7-8086K, GTX 1080, Clevo P775TM1-G) Laptop (Sammanfattning)

| SD Card Reader | |
| average JPG Copy Test (av. of 3 runs) | |
| Asus Chimera G703GI (Toshiba Exceria Pro SDXC 64 GB UHS-II) | |
| Eurocom Sky X7C (Toshiba Exceria Pro SDXC 64 GB UHS-II) | |
| MSI GT75 8RG-090 Titan (Toshiba Exceria Pro SDXC 64 GB UHS-II) | |
| Alienware 17 R3 (A17-9935) (Toshiba Exceria Pro SDXC 64 GB UHS-II) | |
| maximum AS SSD Seq Read Test (1GB) | |
| Asus Chimera G703GI (Toshiba Exceria Pro SDXC 64 GB UHS-II) | |
| Eurocom Sky X7C (Toshiba Exceria Pro SDXC 64 GB UHS-II) | |
| Alienware 17 R3 (A17-9935) (Toshiba Exceria Pro SDXC 64 GB UHS-II) | |
| MSI GT75 8RG-090 Titan (Toshiba Exceria Pro SDXC 64 GB UHS-II) | |
| Networking | |
| iperf3 transmit AX12 | |
| Asus Chimera G703GI | |
| MSI GT75 8RG-090 Titan | |
| Eurocom Sky X7C | |
| Aorus X7 DT v8 | |
| iperf3 receive AX12 | |
| MSI GT75 8RG-090 Titan | |
| Asus Chimera G703GI | |
| Eurocom Sky X7C | |
| Aorus X7 DT v8 | |
| |||||||||||||||||||||||||
Distribution av ljusstyrkan: 88 %
Mitt på batteriet: 333 cd/m²
Kontrast: 833:1 (Svärta: 0.4 cd/m²)
ΔE ColorChecker Calman: 5.87 | ∀{0.5-29.43 Ø4.73}
calibrated: 4.59
ΔE Greyscale Calman: 4.5 | ∀{0.09-98 Ø4.97}
100% sRGB (Argyll 1.6.3 3D)
88% AdobeRGB 1998 (Argyll 1.6.3 3D)
98.9% AdobeRGB 1998 (Argyll 3D)
99.9% sRGB (Argyll 3D)
86% Display P3 (Argyll 3D)
Gamma: 2.34
CCT: 6384 K
| Eurocom Sky X7C AU Optronics B173ZAN01.0, IPS, 17.3", 3840x2160 | MSI GT75 8RG-090 Titan CMN N173HHE-G32 (CMN1747), TN, 17.3", 1920x1080 | Alienware 17 R3 (A17-9935) CV69H_173WF4 (LGD0459), IPS, 17.3", 1920x1080 | Asus Chimera G703GI B173HAN03.2 (AUO329D), IPS, 17.3", 1920x1080 | Aorus X7 DT v8 AU Optronics B173HAN03.0 (AUO309D), IPS, 17.3", 1920x1080 | Razer Blade Pro 2017 Sharp LQ173D1JW33 (SHP145A), IGZO, 17.3", 3840x2160 | |
|---|---|---|---|---|---|---|
| Display | -2% | -25% | -21% | -22% | 1% | |
| Display P3 Coverage (%) | 86 | 90.9 6% | 66.9 -22% | 65.8 -23% | 65.3 -24% | 88.9 3% |
| sRGB Coverage (%) | 99.9 | 100 0% | 83.9 -16% | 92.6 -7% | 91.2 -9% | 100 0% |
| AdobeRGB 1998 Coverage (%) | 98.9 | 86.2 -13% | 61.4 -38% | 67 -32% | 66.3 -33% | 99.7 1% |
| Response Times | 79% | 14% | 72% | 54% | -51% | |
| Response Time Grey 50% / Grey 80% * (ms) | 38.4 ? | 8 ? 79% | 33 ? 14% | 6.4 ? 83% | 18 ? 53% | 60.8 ? -58% |
| Response Time Black / White * (ms) | 26.8 ? | 5.6 ? 79% | 23 ? 14% | 10.8 ? 60% | 12 ? 55% | 38.4 ? -43% |
| PWM Frequency (Hz) | 26000 ? | 204.9 ? | ||||
| Screen | 22% | -3% | 19% | 21% | 1% | |
| Brightness middle (cd/m²) | 333 | 240 -28% | 360 8% | 285 -14% | 297 -11% | 230 -31% |
| Brightness (cd/m²) | 330 | 248 -25% | 336 2% | 275 -17% | 281 -15% | 207 -37% |
| Brightness Distribution (%) | 88 | 83 -6% | 90 2% | 82 -7% | 84 -5% | 83 -6% |
| Black Level * (cd/m²) | 0.4 | 0.22 45% | 0.44 -10% | 0.22 45% | 0.23 43% | 0.2 50% |
| Contrast (:1) | 833 | 1091 31% | 818 -2% | 1295 55% | 1291 55% | 1150 38% |
| Colorchecker dE 2000 * | 5.87 | 2.14 64% | 4.76 19% | 3.18 46% | 2.19 63% | 5.62 4% |
| Colorchecker dE 2000 max. * | 9.74 | 5.04 48% | 10.8 -11% | 5.99 39% | 4.81 51% | 10.24 -5% |
| Colorchecker dE 2000 calibrated * | 4.59 | 1.54 66% | 1.73 62% | |||
| Greyscale dE 2000 * | 4.5 | 1.62 64% | 3.69 18% | 2.93 35% | 1.31 71% | 4.54 -1% |
| Gamma | 2.34 94% | 2.28 96% | 2.24 98% | 2.45 90% | 2.42 91% | 2.36 93% |
| CCT | 6384 102% | 6846 95% | 6091 107% | 7165 91% | 6464 101% | 6625 98% |
| Color Space (Percent of AdobeRGB 1998) (%) | 88 | 77 -12% | 55 -37% | 60 -32% | 59 -33% | 88 0% |
| Color Space (Percent of sRGB) (%) | 100 | 100 0% | 84 -16% | 93 -7% | 91 -9% | 100 0% |
| Totalt genomsnitt (program/inställningar) | 33% /
25% | -5% /
-5% | 23% /
18% | 18% /
17% | -16% /
-6% |
* ... mindre är bättre
Visa svarstider
| ↔ Svarstid svart till vitt | ||
|---|---|---|
| 26.8 ms ... stiga ↗ och falla ↘ kombinerat | ↗ 15.6 ms stiga | 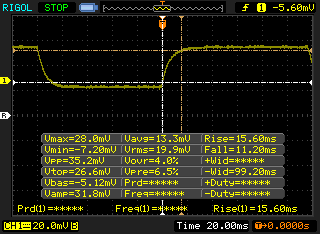 |
| ↘ 11.2 ms hösten | ||
| Skärmen visar relativt långsamma svarsfrekvenser i våra tester och kan vara för långsam för spelare. I jämförelse sträcker sig alla testade enheter från 0.1 (minst) till 240 (maximalt) ms. » 67 % av alla enheter är bättre. Detta innebär att den uppmätta svarstiden är sämre än genomsnittet av alla testade enheter (19.9 ms). | ||
| ↔ Svarstid 50 % grått till 80 % grått | ||
| 38.4 ms ... stiga ↗ och falla ↘ kombinerat | ↗ 18 ms stiga | 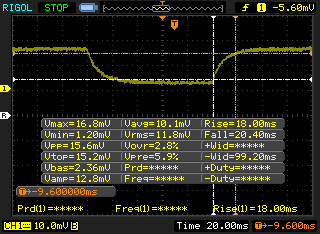 |
| ↘ 20.4 ms hösten | ||
| Skärmen visar långsamma svarsfrekvenser i våra tester och kommer att vara otillfredsställande för spelare. I jämförelse sträcker sig alla testade enheter från 0.165 (minst) till 636 (maximalt) ms. » 57 % av alla enheter är bättre. Detta innebär att den uppmätta svarstiden är sämre än genomsnittet av alla testade enheter (31.1 ms). | ||
Skärmflimmer / PWM (Puls-Width Modulation)
| Skärmflimmer / PWM upptäcktes inte |  | ||
Som jämförelse: 52 % av alla testade enheter använder inte PWM för att dämpa skärmen. Om PWM upptäcktes mättes ett medelvärde av 7794 (minst: 5 - maximum: 343500) Hz. | |||

| Cinebench R10 | |
| Rendering Multiple CPUs 32Bit | |
| no name | |
| Eurocom Sky X9C | |
| Aorus X9 DT | |
| Eurocom Sky X7C | |
| Asus GL702ZC-GC104T | |
| Eurocom Tornado F5 | |
| Asus ROG Strix GL702VI-WB74 | |
| MSI GV62 8RE-016US | |
| Aorus X5S v5 | |
| Rendering Single 32Bit | |
| Eurocom Sky X9C | |
| no name | |
| Eurocom Tornado F5 | |
| Aorus X9 DT | |
| Eurocom Sky X7C | |
| MSI GV62 8RE-016US | |
| Asus ROG Strix GL702VI-WB74 | |
| Aorus X5S v5 | |
| Asus GL702ZC-GC104T | |
| wPrime 2.10 - 1024m | |
| Asus ROG Strix GL702VI-WB74 | |
| Aorus X5S v5 | |
| MSI GV62 8RE-016US | |
| Eurocom Tornado F5 | |
| Eurocom Sky X7C | |
| no name | |
| Eurocom Sky X9C | |
* ... mindre är bättre
| PCMark 10 - Score | |
| Asus Chimera G703GI | |
| MSI GT75 8RG-090 Titan | |
| Eurocom Sky X9C | |
| Aorus X9 DT | |
| Eurocom Sky X7C | |
| Razer Blade Pro 2017 | |
| PCMark 8 - Home Score Accelerated v2 | |
| Asus Chimera G703GI | |
| Aorus X9 DT | |
| MSI GT75 8RG-090 Titan | |
| Eurocom Sky X9C | |
| Eurocom Sky X7C | |
| Razer Blade Pro 2017 | |
| PCMark 8 Home Score Accelerated v2 | 4908 poäng | |
| PCMark 10 Score | 6369 poäng | |
Hjälp | ||
| Eurocom Sky X7C 2x Samsung SSD 970 Pro 512GB (RAID 0) | MSI GT75 8RG-090 Titan 2x Samsung PM961 MZVLW256HEHP (RAID 0) | Asus Chimera G703GI 2x Intel 760p 512 GB + 1x Samsung SM961 512 GB (RAID) | Aorus X7 DT v8 Toshiba NVMe THNSN5512GPU7 | Razer Blade Pro 2017 2x Samsung SSD PM951 MZVLV256HCHP (RAID 0) | Aorus X9 DT Transcend TS1TMTE850 | |
|---|---|---|---|---|---|---|
| CrystalDiskMark 5.2 / 6 | -20% | 30% | -43% | -28% | -45% | |
| Write 4K (MB/s) | 152.2 | 111.8 -27% | 130.2 -14% | 88.6 -42% | 124 -19% | 104.4 -31% |
| Read 4K (MB/s) | 60.4 | 42.09 -30% | 57.3 -5% | 30.76 -49% | 40.68 -33% | 35.69 -41% |
| Write Seq (MB/s) | 3002 | 2288 -24% | 4049 35% | 1340 -55% | 618 -79% | 1015 -66% |
| Read Seq (MB/s) | 3329 | 3321 0% | 5325 60% | 1362 -59% | 2446 -27% | 1283 -61% |
| Write 4K Q32T1 (MB/s) | 432.9 | 308.3 -29% | 383.2 -11% | 305.7 -29% | 554 28% | 308.9 -29% |
| Read 4K Q32T1 (MB/s) | 494 | 364.9 -26% | 424.9 -14% | 366.8 -26% | 627 27% | 371.9 -25% |
| Write Seq Q32T1 (MB/s) | 3391 | 2440 -28% | 4316 27% | 1562 -54% | 620 -82% | 1056 -69% |
| Read Seq Q32T1 (MB/s) | 3405 | 3485 2% | 8905 162% | 2414 -29% | 2228 -35% | 2204 -35% |

| 3DMark 11 | |
| 1280x720 Performance GPU | |
| Eurocom Sky X9C | |
| MSI Gaming X GeForce GTX 1080 Desktop PC | |
| Genomsnitt NVIDIA GeForce GTX 1080 Mobile (24868 - 31412, n=26) | |
| Eurocom Sky X7C | |
| Asus Zephyrus GX501 | |
| Eurocom X8 | |
| Eurocom Q8 | |
| Eurocom Q6 | |
| Asus ROG Strix GL702ZC-GC204T | |
| Asus Strix GL703GM-DS74 | |
| Asus Strix GL502VY-DS71 | |
| 1280x720 Performance Combined | |
| Eurocom Sky X7C | |
| Eurocom Sky X9C | |
| Eurocom Q8 | |
| MSI Gaming X GeForce GTX 1080 Desktop PC | |
| Genomsnitt NVIDIA GeForce GTX 1080 Mobile (7533 - 16949, n=26) | |
| Eurocom Q6 | |
| Asus Strix GL703GM-DS74 | |
| Asus Zephyrus GX501 | |
| Eurocom X8 | |
| Asus Strix GL502VY-DS71 | |
| Asus ROG Strix GL702ZC-GC204T | |
| 3DMark 11 Performance | 22653 poäng | |
Hjälp | ||
| låg | med. | hög | ultra | |
|---|---|---|---|---|
| BioShock Infinite (2013) | 379.5 | 320.7 | 303.4 | 178.5 |
| The Witcher 3 (2015) | 72 |
Ljudnivå
| Låg belastning |
| 28.2 / 28.2 / 29 dB(A) |
| Hög belastning |
| 41.8 / 42.2 dB(A) |
 | ||
30 dB tyst 40 dB(A) hörbar 50 dB(A) högt ljud |
||
min: | ||
| Eurocom Sky X7C GeForce GTX 1080 Mobile, i7-8086K, 2x Samsung SSD 970 Pro 512GB (RAID 0) | MSI GT75 8RG-090 Titan GeForce GTX 1080 Mobile, i9-8950HK, 2x Samsung PM961 MZVLW256HEHP (RAID 0) | Alienware 17 R3 (A17-9935) GeForce GTX 980M, 6700HQ, Samsung PM951 NVMe 512 GB | Asus Chimera G703GI GeForce GTX 1080 Mobile, i9-8950HK, 2x Intel 760p 512 GB + 1x Samsung SM961 512 GB (RAID) | Aorus X7 DT v8 GeForce GTX 1080 Mobile, i7-8850H, Toshiba NVMe THNSN5512GPU7 | Razer Blade Pro 2017 GeForce GTX 1080 Mobile, i7-7820HK, 2x Samsung SSD PM951 MZVLV256HCHP (RAID 0) | |
|---|---|---|---|---|---|---|
| Noise | -22% | -9% | -21% | -22% | -15% | |
| av / miljö * (dB) | 28.2 | 30 -6% | 30 -6% | 29 -3% | 29 -3% | 30 -6% |
| Idle Minimum * (dB) | 28.2 | 32 -13% | 31 -10% | 30 -6% | 35 -24% | 30 -6% |
| Idle Average * (dB) | 28.2 | 34 -21% | 32 -13% | 34 -21% | 36 -28% | 31 -10% |
| Idle Maximum * (dB) | 29 | 37 -28% | 33 -14% | 42 -45% | 41 -41% | 33 -14% |
| Load Average * (dB) | 41.8 | 43 -3% | 38 9% | 53 -27% | 43 -3% | 43 -3% |
| Witcher 3 ultra * (dB) | 42.2 | 57 -35% | 51 -21% | 53 -26% | 55 -30% | |
| Load Maximum * (dB) | 42.2 | 62 -47% | 50 -18% | 53 -26% | 54 -28% | 58 -37% |
* ... mindre är bättre
(±) Den maximala temperaturen på ovansidan är 42 °C / 108 F, jämfört med genomsnittet av 40.4 °C / 105 F , allt från 21.2 till 68.8 °C för klassen Gaming.
(±) Botten värms upp till maximalt 40.2 °C / 104 F, jämfört med genomsnittet av 43.2 °C / 110 F
(+) Vid tomgångsbruk är medeltemperaturen för ovansidan 24.4 °C / 76 F, jämfört med enhetsgenomsnittet på 33.9 °C / ### class_avg_f### F.
(+) När du spelar The Witcher 3 är medeltemperaturen för ovansidan 29.6 °C / 85 F, jämfört med enhetsgenomsnittet på 33.9 °C / ## #class_avg_f### F.
(+) Handledsstöden och pekplattan är kallare än hudtemperaturen med maximalt 25 °C / 77 F och är därför svala att ta på.
(+) Medeltemperaturen för handledsstödsområdet på liknande enheter var 28.8 °C / 83.8 F (+3.8 °C / 6.8 F).
Eurocom Sky X7C ljudanalys
(-) | inte särskilt höga högtalare (63.2 dB)
Bas 100 - 315 Hz
(±) | reducerad bas - i genomsnitt 5.3% lägre än medianen
(±) | linjäriteten för basen är genomsnittlig (14.8% delta till föregående frekvens)
Mellan 400 - 2000 Hz
(+) | balanserad mellan - endast 2.3% från medianen
(±) | linjäriteten för mids är genomsnittlig (7% delta till föregående frekvens)
Högsta 2 - 16 kHz
(+) | balanserade toppar - endast 1% från medianen
(+) | toppar är linjära (4.6% delta till föregående frekvens)
Totalt 100 - 16 000 Hz
(+) | det totala ljudet är linjärt (12% skillnad mot median)
Jämfört med samma klass
» 12% av alla testade enheter i den här klassen var bättre, 4% liknande, 84% sämre
» Den bästa hade ett delta på 6%, genomsnittet var 18%, sämst var 132%
Jämfört med alla testade enheter
» 9% av alla testade enheter var bättre, 2% liknande, 88% sämre
» Den bästa hade ett delta på 4%, genomsnittet var 24%, sämst var 134%
Apple MacBook 12 (Early 2016) 1.1 GHz ljudanalys
(+) | högtalare kan spela relativt högt (83.6 dB)
Bas 100 - 315 Hz
(±) | reducerad bas - i genomsnitt 11.3% lägre än medianen
(±) | linjäriteten för basen är genomsnittlig (14.2% delta till föregående frekvens)
Mellan 400 - 2000 Hz
(+) | balanserad mellan - endast 2.4% från medianen
(+) | mids är linjära (5.5% delta till föregående frekvens)
Högsta 2 - 16 kHz
(+) | balanserade toppar - endast 2% från medianen
(+) | toppar är linjära (4.5% delta till föregående frekvens)
Totalt 100 - 16 000 Hz
(+) | det totala ljudet är linjärt (10.2% skillnad mot median)
Jämfört med samma klass
» 7% av alla testade enheter i den här klassen var bättre, 2% liknande, 91% sämre
» Den bästa hade ett delta på 5%, genomsnittet var 18%, sämst var 53%
Jämfört med alla testade enheter
» 5% av alla testade enheter var bättre, 1% liknande, 94% sämre
» Den bästa hade ett delta på 4%, genomsnittet var 24%, sämst var 134%
| Av/Standby | |
| Låg belastning | |
| Hög belastning |
|
Förklaring:
min: | |
| Eurocom Sky X7C i7-8086K, GeForce GTX 1080 Mobile, 2x Samsung SSD 970 Pro 512GB (RAID 0), IPS, 3840x2160, 17.3" | MSI GT75 8RG-090 Titan i9-8950HK, GeForce GTX 1080 Mobile, 2x Samsung PM961 MZVLW256HEHP (RAID 0), TN, 1920x1080, 17.3" | Alienware 17 R3 (A17-9935) 6700HQ, GeForce GTX 980M, Samsung PM951 NVMe 512 GB, IPS, 1920x1080, 17.3" | Asus Chimera G703GI i9-8950HK, GeForce GTX 1080 Mobile, 2x Intel 760p 512 GB + 1x Samsung SM961 512 GB (RAID), IPS, 1920x1080, 17.3" | Aorus X7 DT v8 i7-8850H, GeForce GTX 1080 Mobile, Toshiba NVMe THNSN5512GPU7, IPS, 1920x1080, 17.3" | Razer Blade Pro 2017 i7-7820HK, GeForce GTX 1080 Mobile, 2x Samsung SSD PM951 MZVLV256HCHP (RAID 0), IGZO, 3840x2160, 17.3" | Aorus X9 DT i9-8950HK, GeForce GTX 1080 Mobile, Transcend TS1TMTE850, IPS, 1920x1080, 17.3" | |
|---|---|---|---|---|---|---|---|
| Power Consumption | -28% | 35% | -27% | -6% | -9% | -19% | |
| Idle Minimum * (Watt) | 33.3 | 31 7% | 12 64% | 29 13% | 23 31% | 31 7% | 28 16% |
| Idle Average * (Watt) | 40.1 | 35 13% | 18 55% | 37 8% | 33 18% | 36 10% | 37 8% |
| Idle Maximum * (Watt) | 42.1 | 45 -7% | 26 38% | 46 -9% | 37 12% | 44 -5% | 40 5% |
| Load Average * (Watt) | 95.6 | 130 -36% | 95 1% | 156 -63% | 115 -20% | 107 -12% | 109 -14% |
| Witcher 3 ultra * (Watt) | 152.9 | 268 -75% | 252 -65% | 225 -47% | 212 -39% | 256 -67% | |
| Load Maximum * (Watt) | 220 | 374 -70% | 188 15% | 314 -43% | 281 -28% | 258 -17% | 353 -60% |
* ... mindre är bättre
| Eurocom Sky X7C i7-8086K, GeForce GTX 1080 Mobile, 82 Wh | MSI GT75 8RG-090 Titan i9-8950HK, GeForce GTX 1080 Mobile, 75 Wh | Asus Chimera G703GI i9-8950HK, GeForce GTX 1080 Mobile, 71 Wh | Aorus X7 DT v8 i7-8850H, GeForce GTX 1080 Mobile, 94.24 Wh | Razer Blade Pro 2017 i7-7820HK, GeForce GTX 1080 Mobile, 99 Wh | Eurocom Sky X9C i7-8700K, GeForce GTX 1080 SLI (Laptop), 89 Wh | Aorus X9 DT i9-8950HK, GeForce GTX 1080 Mobile, 94.24 Wh | |
|---|---|---|---|---|---|---|---|
| Batteridrifttid | -8% | 58% | 38% | -46% | 33% | ||
| WiFi v1.3 (h) | 2.4 | 2.2 -8% | 3.8 58% | 3.3 38% | 1.3 -46% | 3.2 33% | |
| Reader / Idle (h) | 3.8 | 2.8 | 4.9 | 4.2 | 1.4 | 4.2 | |
| Load (h) | 1.1 | 0.9 | 1.3 | 1.4 | 0.8 | 1.3 |
För
Emot

Läs den fullständiga versionen av den här recensionen på engelska här.
Innan vi delger våra tankar om Sky X7C är det av största vikt att den som köpt systemet uppdaterar sin mjukvara till den senaste versionen som finns här. Äldre versioner av Control Center har en bekräftad bugg som gör att GPU:n stryps i vissa spel såsom Witcher 3. Oturligt nog för oss så levererades vår testenhet med den buggiga versionen av mjukvaran och våra testresultat reflekterar således detta. Vi observerade samma resultat även i vår recension av Eurocom Q8.
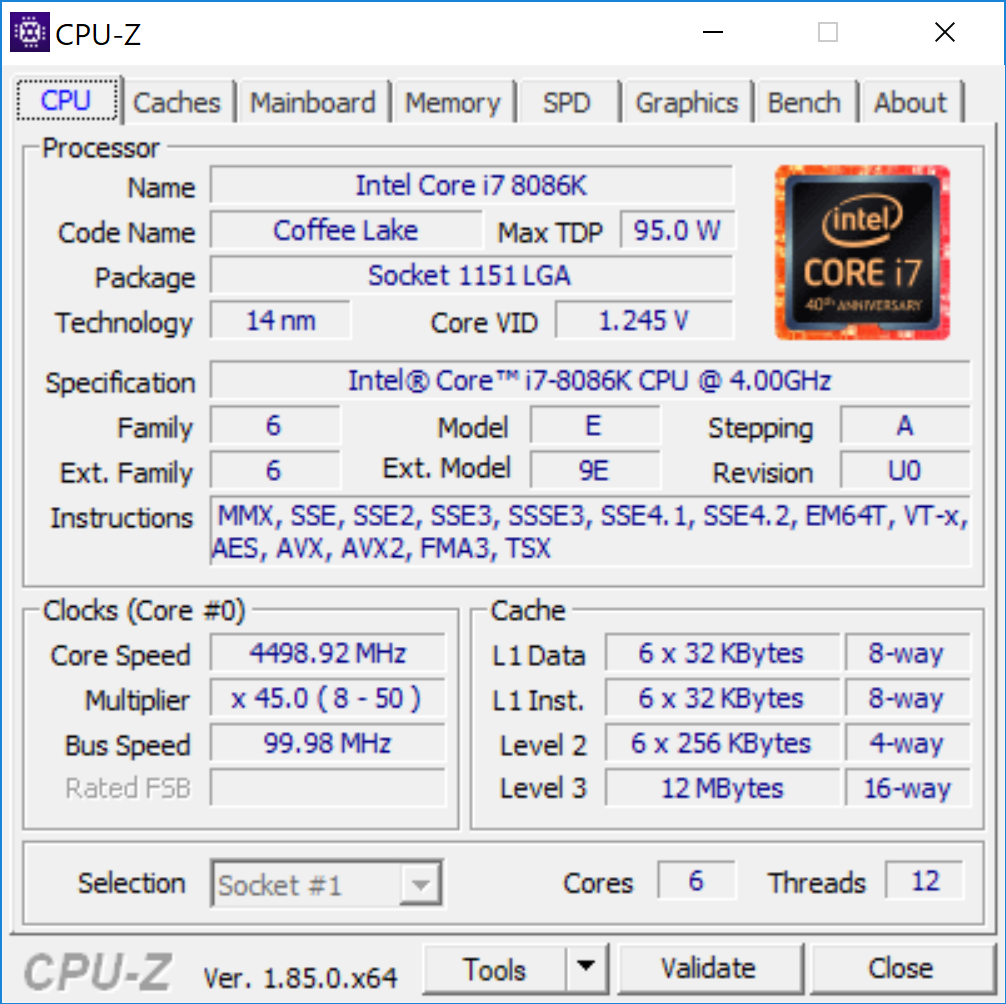
Med den varningen överstökad så är den omodifierade Core i7-8086K i Eurocom som bäst 5 till 10 procent snabbare i rå prestanda än både i7-8700K i Sky X9C och i9-8950HK i Aorus X9 DT. Full belastning vid basklockfrekvensen på 4.0 GHz resulterar i en stabil kärntemperatur på 83 C. Prestandafördelarna i spel är minst sagt marginella.
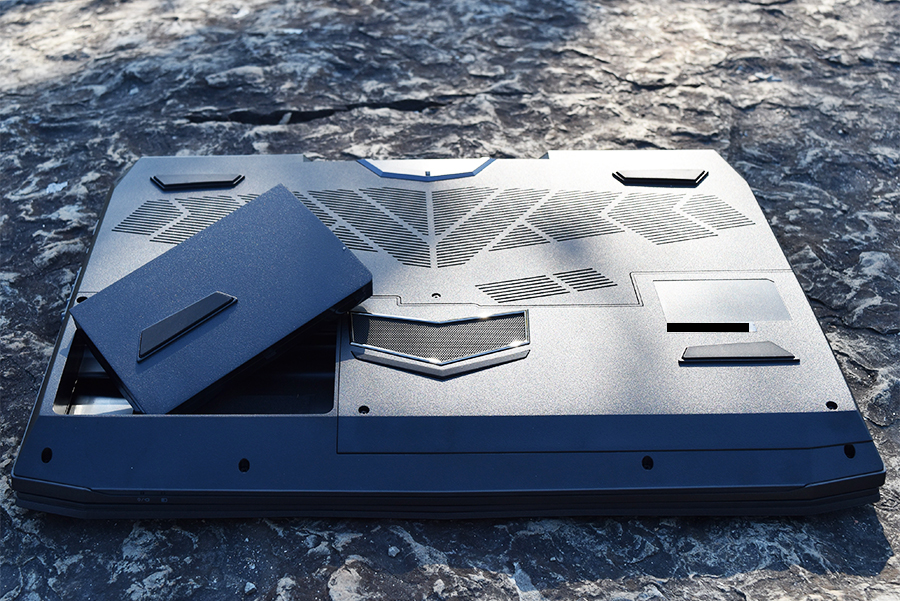
Den bästa aspekten av Sky X7C är fortfarande dess modularitet. Entusiaster som önskar varje droppe av flerkärnig prestanda kan vilja överväga den billigare Ryzen 1800X framför i7-8086K. Innan sådana AMD-alternativ blir tillgängliga är Sky X7C dock den ultimata DTR-modellen på 17 tum.
Sky X7C inhyser en av de snabbaste processorerna från Intel som för tillfället finns tillgänglig i en mobil formfaktor. Men vi hoppas ändå på att Threadripper-alternativ kommer bli tillgängliga i framtiden helt enkelt för att AMD har varit extremt konkurrenskraftiga på desktop-marknaden det senaste.
Price comparison
