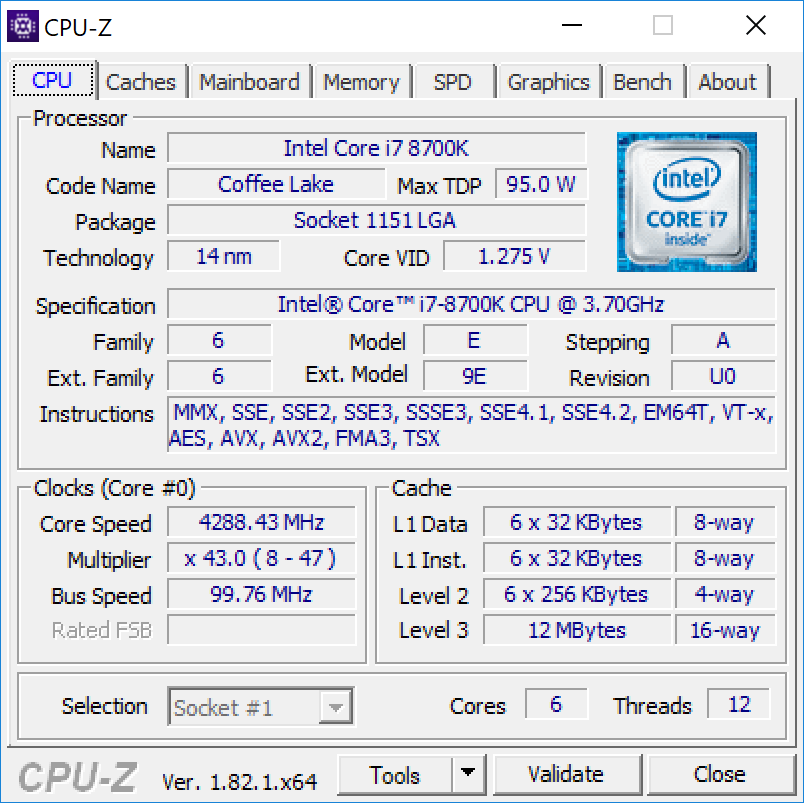
Test: Eurocom Sky X9C (i7-8700K, GTX 1080 SLI, Clevo P870TM1-G) Laptop (Sammanfattning)
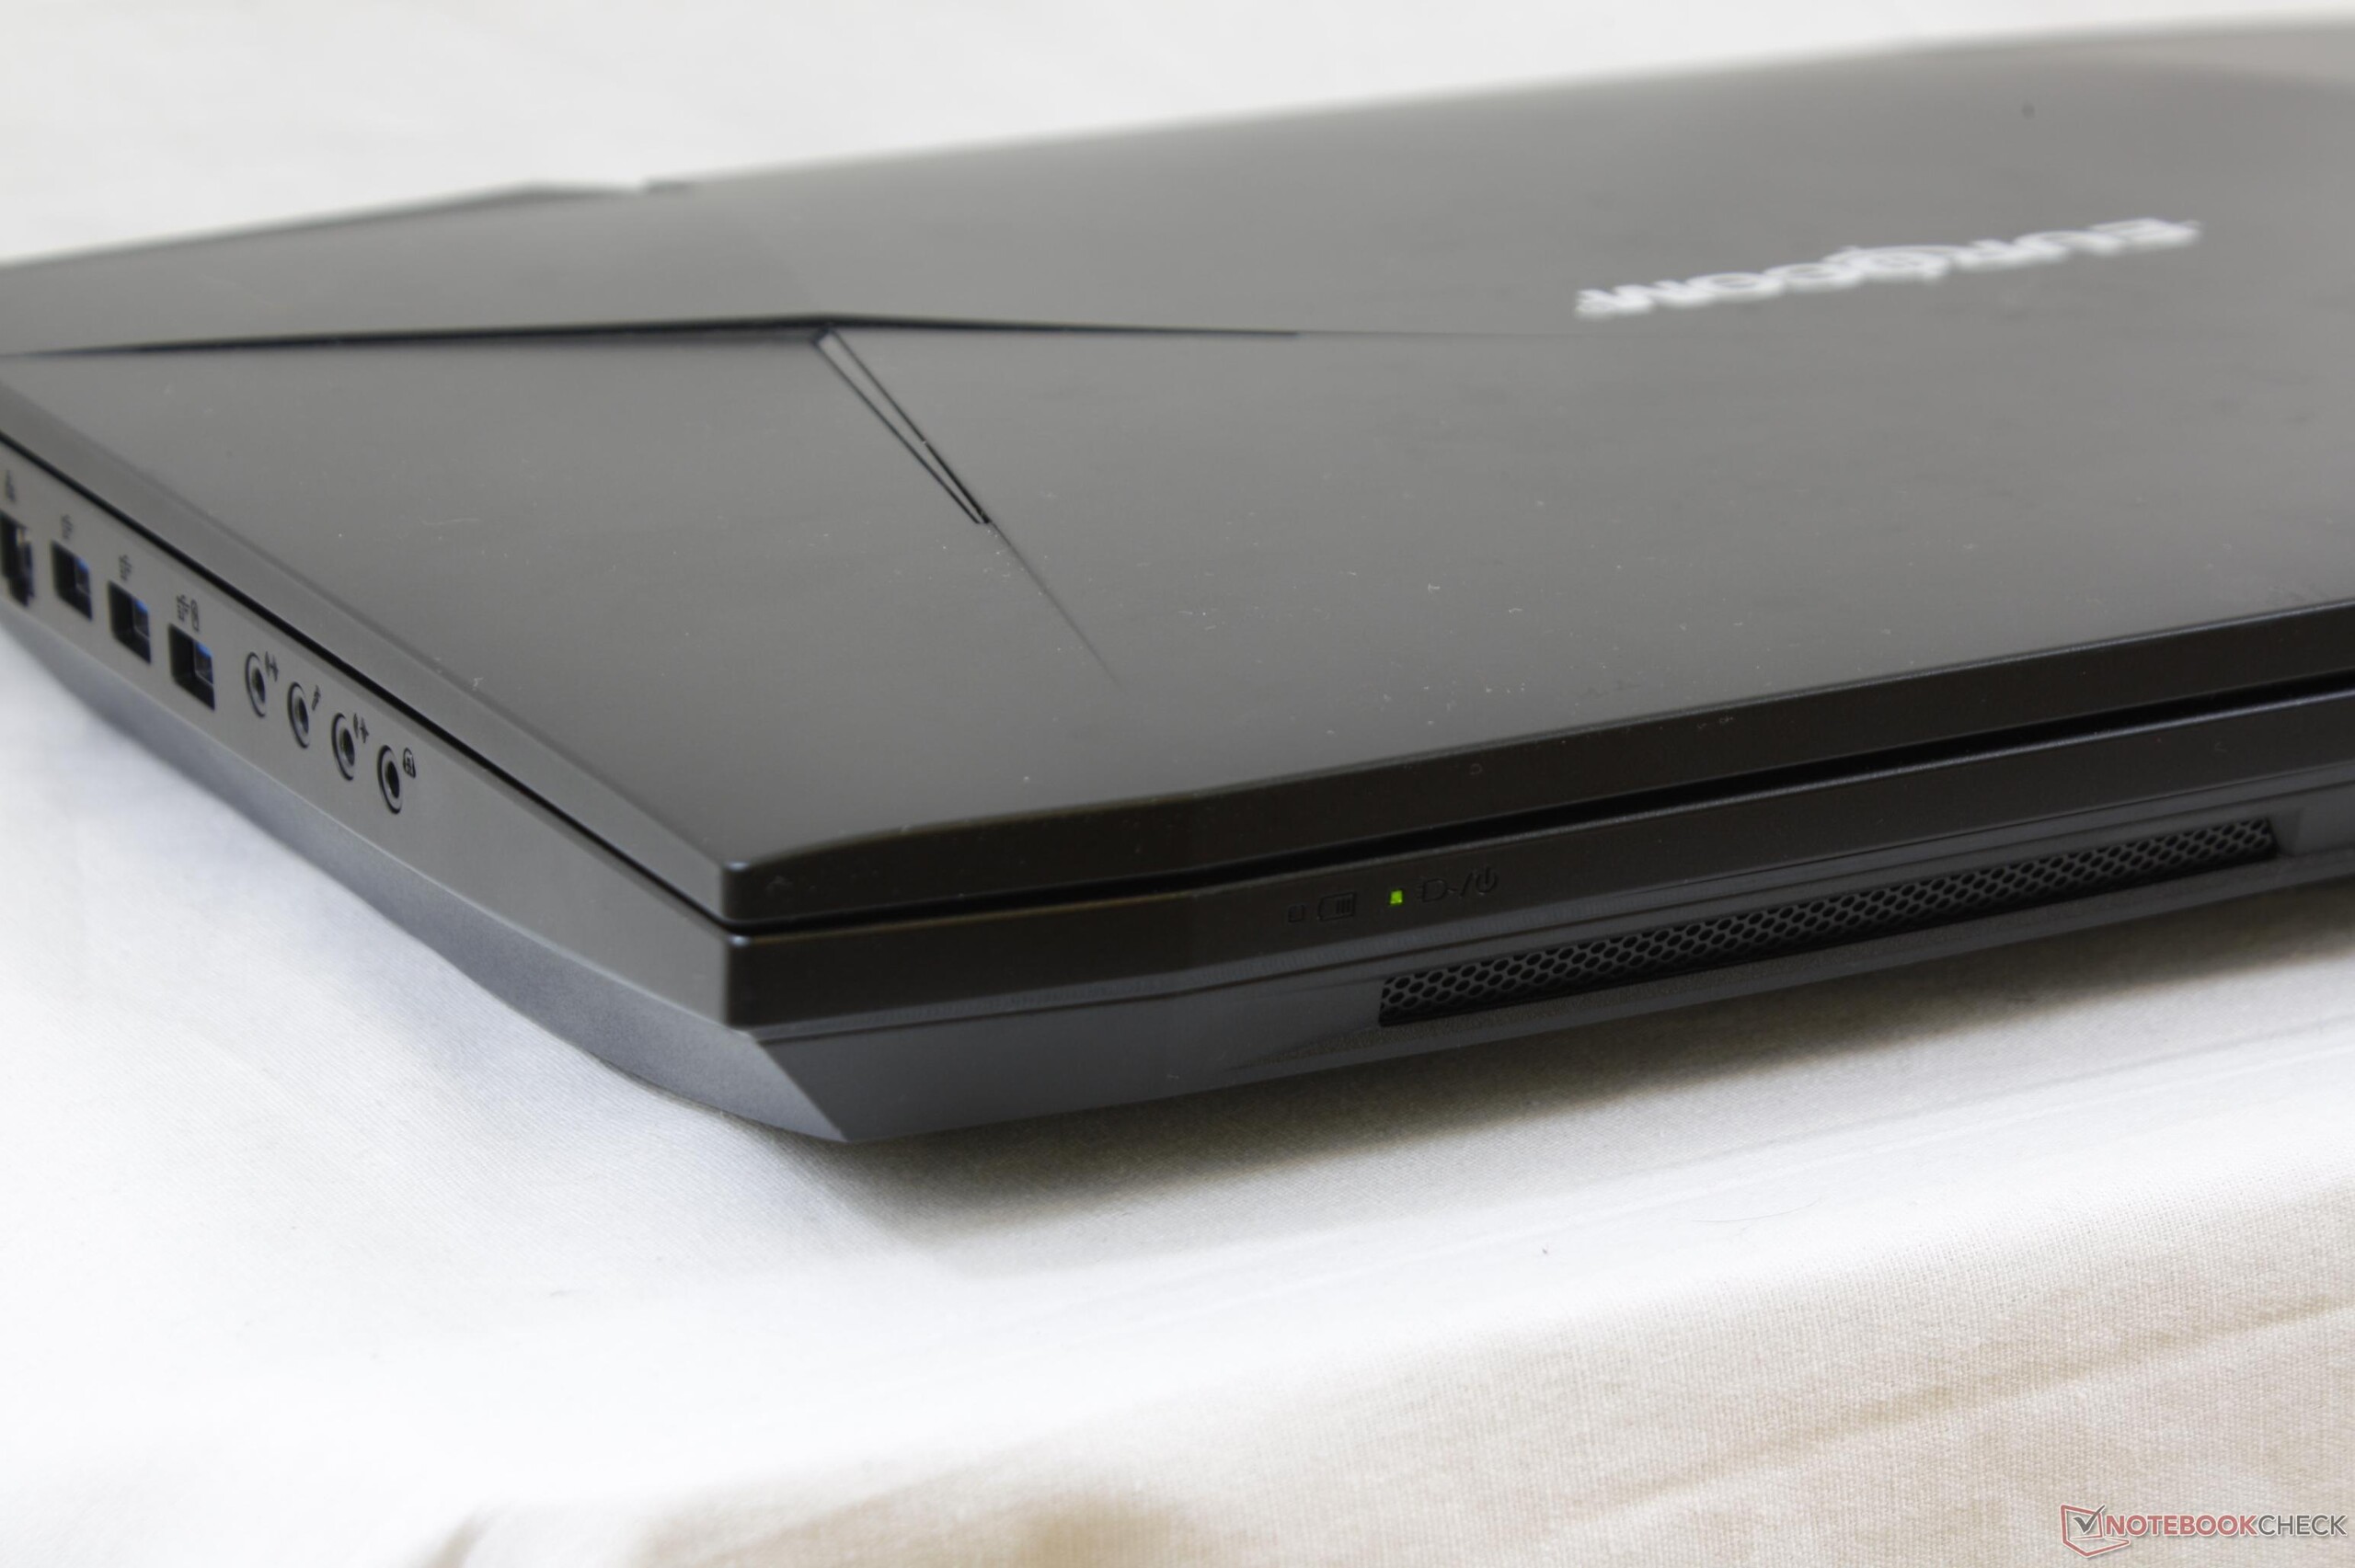
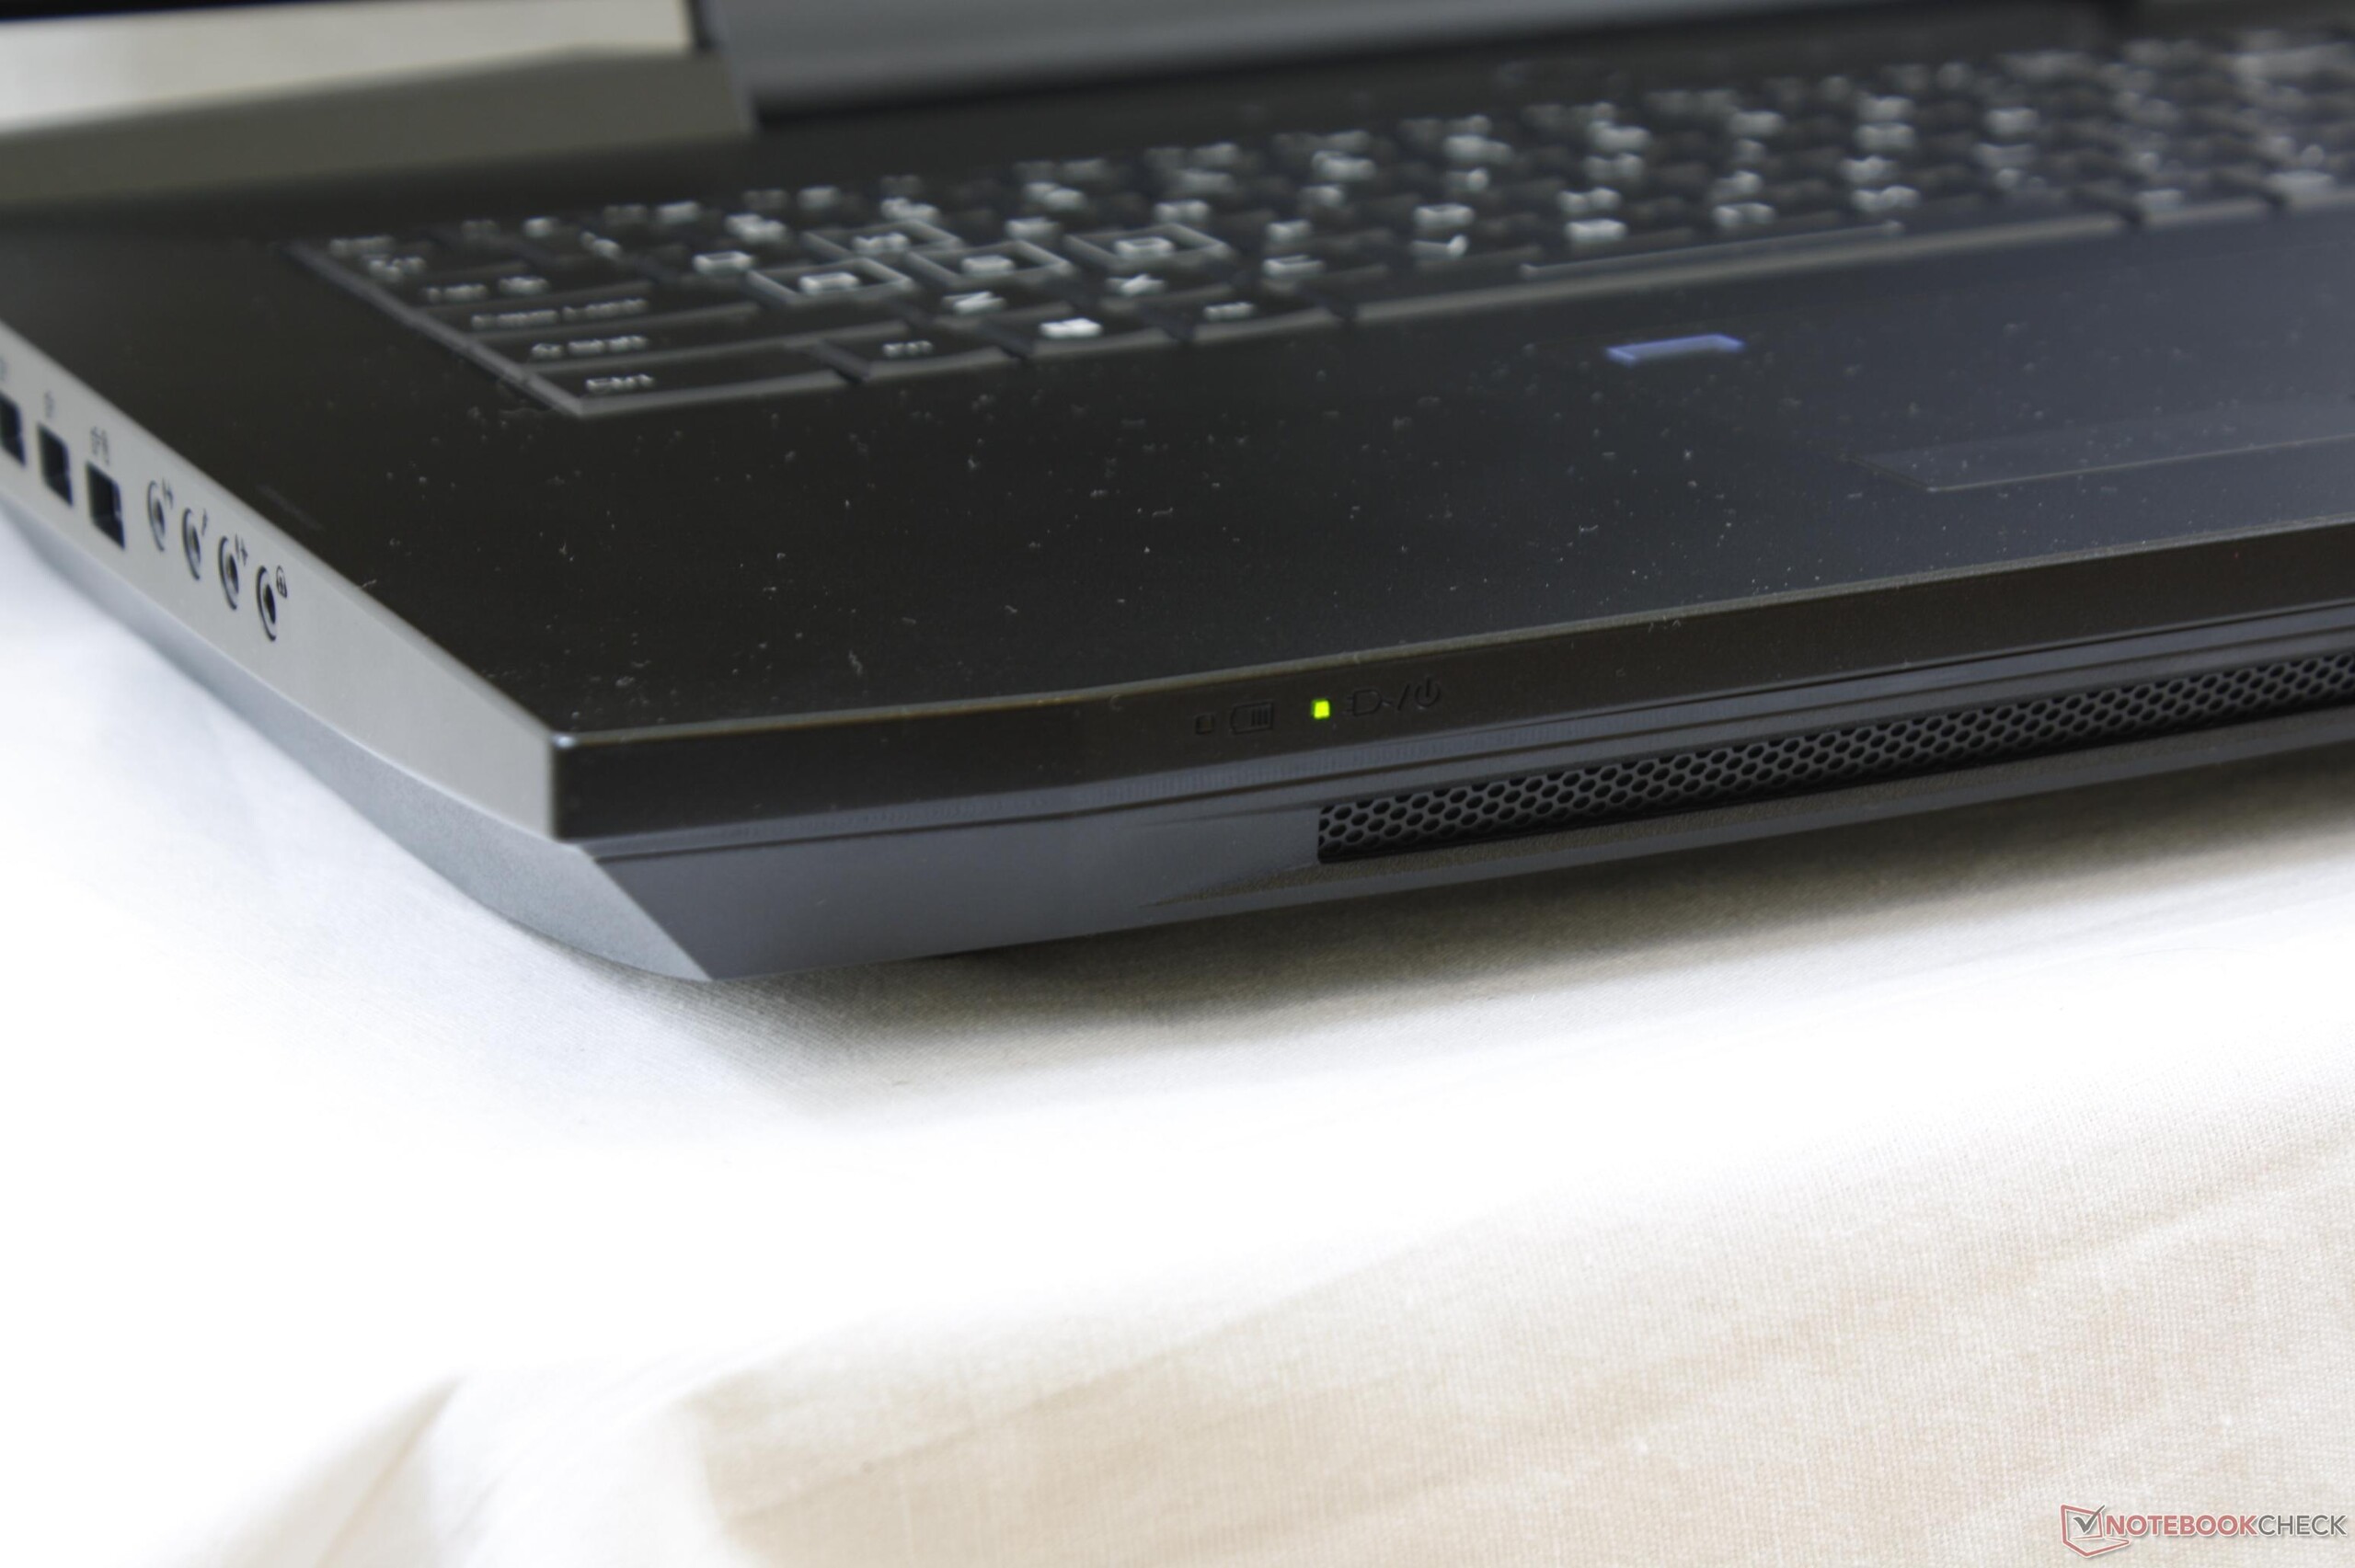
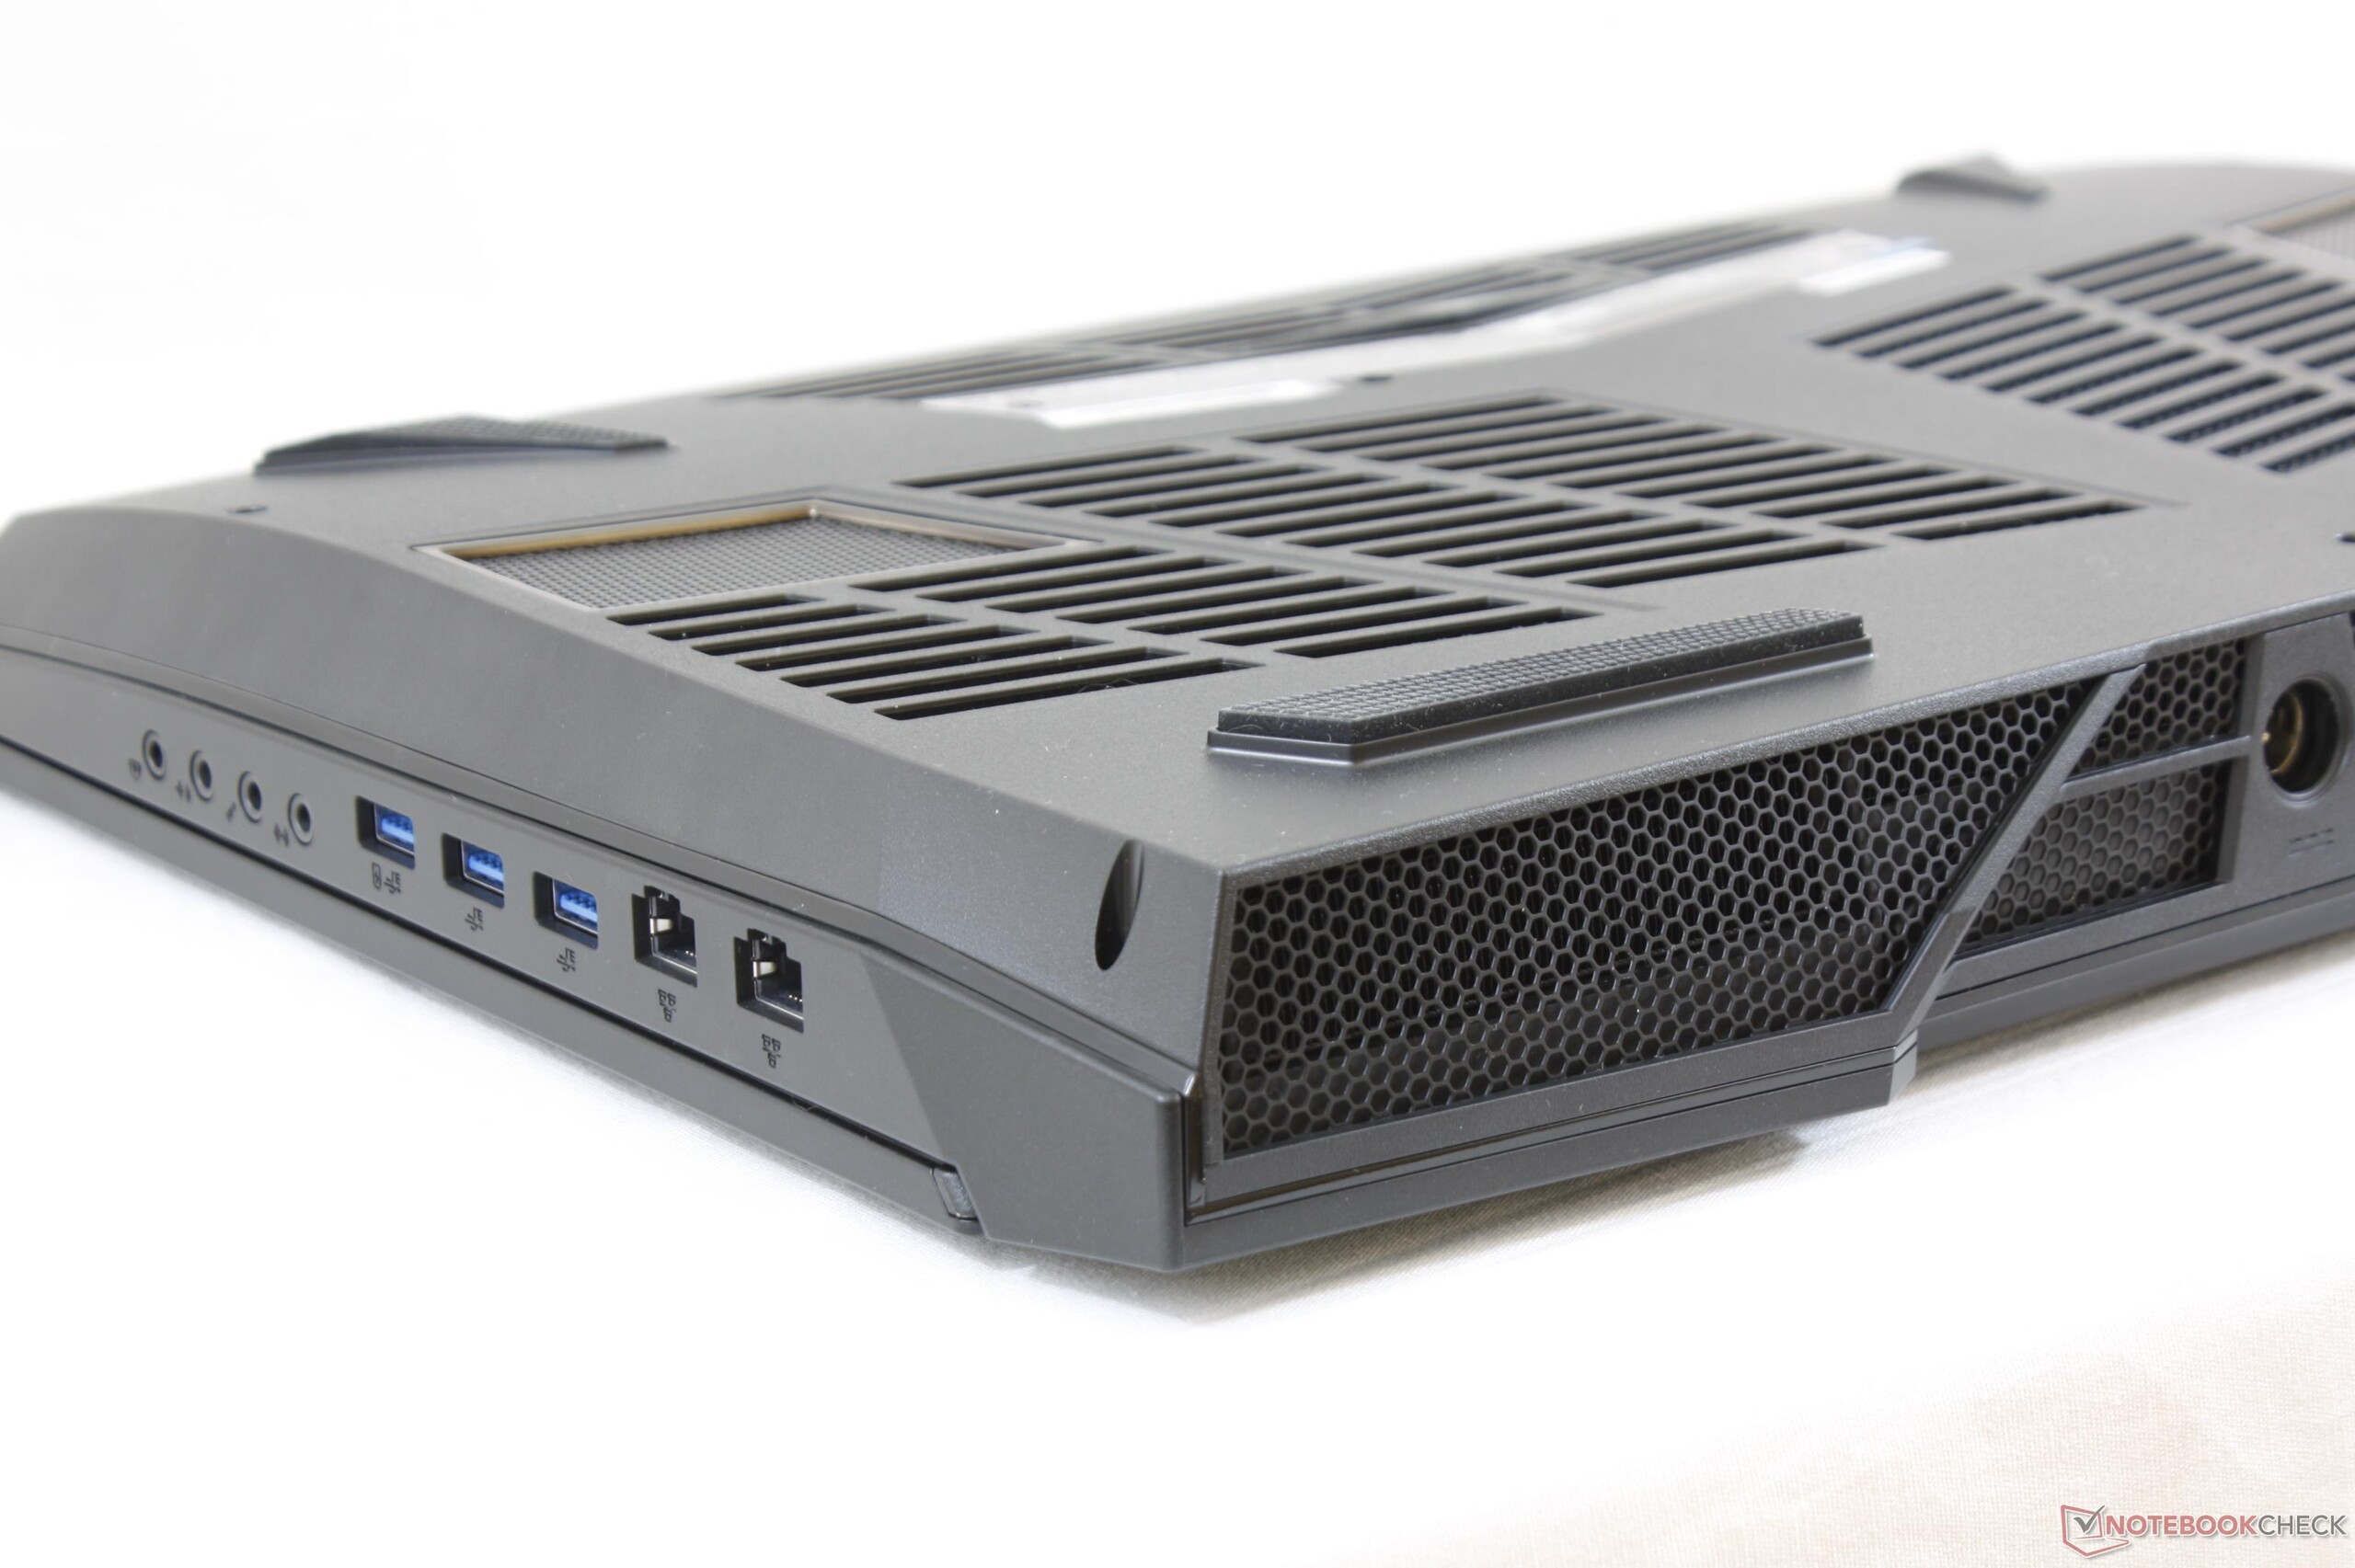
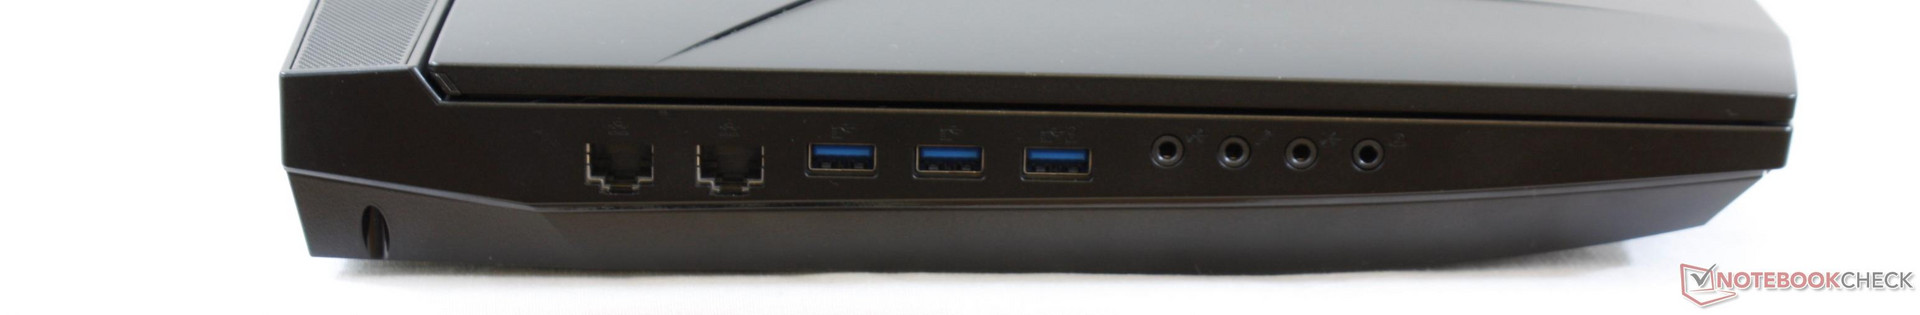
| SD Card Reader | |
| average JPG Copy Test (av. of 3 runs) | |
| Eurocom Sky X9C | |
| Eurocom Tornado F5 Killer Edition | |
| MSI GT75VR 7RF-012 Titan Pro | |
| maximum AS SSD Seq Read Test (1GB) | |
| Eurocom Tornado F5 Killer Edition | |
| Eurocom Sky X9C | |
| MSI GT75VR 7RF-012 Titan Pro | |
| Networking | |
| iperf3 transmit AX12 | |
| Eurocom Sky X9C | |
| Alienware 17 R4 | |
| MSI GT75VR 7RF-012 Titan Pro | |
| iperf3 receive AX12 | |
| MSI GT75VR 7RF-012 Titan Pro | |
| Eurocom Sky X9C | |
| Alienware 17 R4 | |
| |||||||||||||||||||||||||
Distribution av ljusstyrkan: 87 %
Mitt på batteriet: 347.7 cd/m²
Kontrast: 869:1 (Svärta: 0.4 cd/m²)
ΔE ColorChecker Calman: 6.39 | ∀{0.5-29.43 Ø4.72}
ΔE Greyscale Calman: 5.4 | ∀{0.09-98 Ø4.97}
100% sRGB (Argyll 1.6.3 3D)
87.8% AdobeRGB 1998 (Argyll 1.6.3 3D)
99.4% AdobeRGB 1998 (Argyll 3D)
100% sRGB (Argyll 3D)
86.6% Display P3 (Argyll 3D)
Gamma: 2.4
CCT: 6271 K
| Eurocom Sky X9C ID: AUO109B, Name: AU Optronics B173ZAN01.0, IPS, 17.3", 3840x2160 | Alienware 17 R4 TN LED, 17.3", 2560x1440 | MSI GT75VR 7RF-012 Titan Pro CMN N173HHE-G32 (CMN1747), TN LED, 17.3", 1920x1080 | Asus G701VIK-BA049T B173HAN01.1 (AUO119D), IPS, 17.3", 1920x1080 | Razer Blade Pro 2017 Sharp LQ173D1JW33 (SHP145A), IGZO, 17.3", 3840x2160 | Schenker XMG U727 2017 AU Optronics B173ZAN01.0 (AUO109B), AHVA, 17.3", 3840x2160 | |
|---|---|---|---|---|---|---|
| Display | -28% | -3% | -23% | 1% | 0% | |
| Display P3 Coverage (%) | 86.6 | 61.2 -29% | 90.3 4% | 68.8 -21% | 88.9 3% | 86.6 0% |
| sRGB Coverage (%) | 100 | 82.9 -17% | 99.6 0% | 87.7 -12% | 100 0% | 99.9 0% |
| AdobeRGB 1998 Coverage (%) | 99.4 | 60.5 -39% | 86.8 -13% | 64.1 -36% | 99.7 0% | 99.5 0% |
| Response Times | 44% | 75% | 22% | -36% | 1% | |
| Response Time Grey 50% / Grey 80% * (ms) | 43.6 ? | 30 ? 31% | 11.6 ? 73% | 38 ? 13% | 60.8 ? -39% | 44 ? -1% |
| Response Time Black / White * (ms) | 28.8 ? | 12.8 ? 56% | 6.8 ? 76% | 20 ? 31% | 38.4 ? -33% | 28 ? 3% |
| PWM Frequency (Hz) | 25000 ? | 204.9 ? | ||||
| Screen | -8% | 23% | 9% | 3% | 20% | |
| Brightness middle (cd/m²) | 347.7 | 402.3 16% | 274 -21% | 306 -12% | 230 -34% | 362 4% |
| Brightness (cd/m²) | 324 | 372 15% | 262 -19% | 299 -8% | 207 -36% | 344 6% |
| Brightness Distribution (%) | 87 | 86 -1% | 87 0% | 91 5% | 83 -5% | 85 -2% |
| Black Level * (cd/m²) | 0.4 | 0.62 -55% | 0.26 35% | 0.27 32% | 0.2 50% | 0.35 13% |
| Contrast (:1) | 869 | 649 -25% | 1054 21% | 1133 30% | 1150 32% | 1034 19% |
| Colorchecker dE 2000 * | 6.39 | 5.6 12% | 1.36 79% | 3.98 38% | 5.62 12% | 2.46 62% |
| Colorchecker dE 2000 max. * | 9.69 | 9.8 -1% | 4.1 58% | 7.29 25% | 10.24 -6% | 4.26 56% |
| Greyscale dE 2000 * | 5.4 | 4.7 13% | 0.64 88% | 4.15 23% | 4.54 16% | 2.9 46% |
| Gamma | 2.4 92% | 2.14 103% | 2.19 100% | 2.45 90% | 2.36 93% | 2.31 95% |
| CCT | 6271 104% | 7519 86% | 6551 99% | 7386 88% | 6625 98% | 6120 106% |
| Color Space (Percent of AdobeRGB 1998) (%) | 87.8 | 53.7 -39% | 77 -12% | 58 -34% | 88 0% | 88 0% |
| Color Space (Percent of sRGB) (%) | 100 | 82.2 -18% | 100 0% | 89 -11% | 100 0% | 100 0% |
| Totalt genomsnitt (program/inställningar) | 3% /
-5% | 32% /
25% | 3% /
4% | -11% /
-3% | 7% /
14% |
* ... mindre är bättre
Visa svarstider
| ↔ Svarstid svart till vitt | ||
|---|---|---|
| 28.8 ms ... stiga ↗ och falla ↘ kombinerat | ↗ 17.2 ms stiga | 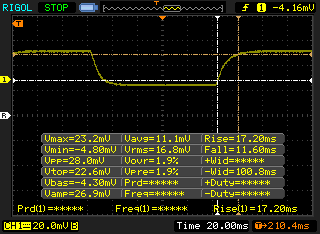 |
| ↘ 11.6 ms hösten | ||
| Skärmen visar relativt långsamma svarsfrekvenser i våra tester och kan vara för långsam för spelare. I jämförelse sträcker sig alla testade enheter från 0.1 (minst) till 240 (maximalt) ms. » 76 % av alla enheter är bättre. Detta innebär att den uppmätta svarstiden är sämre än genomsnittet av alla testade enheter (19.8 ms). | ||
| ↔ Svarstid 50 % grått till 80 % grått | ||
| 43.6 ms ... stiga ↗ och falla ↘ kombinerat | ↗ 24 ms stiga | 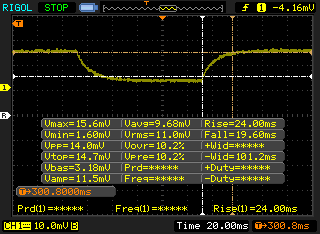 |
| ↘ 19.6 ms hösten | ||
| Skärmen visar långsamma svarsfrekvenser i våra tester och kommer att vara otillfredsställande för spelare. I jämförelse sträcker sig alla testade enheter från 0.165 (minst) till 636 (maximalt) ms. » 73 % av alla enheter är bättre. Detta innebär att den uppmätta svarstiden är sämre än genomsnittet av alla testade enheter (31 ms). | ||
Skärmflimmer / PWM (Puls-Width Modulation)
| Skärmflimmer / PWM upptäcktes inte | 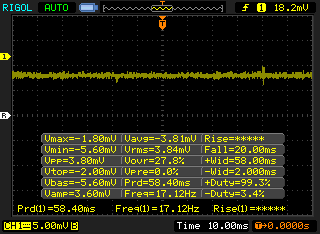 | ||
Som jämförelse: 52 % av alla testade enheter använder inte PWM för att dämpa skärmen. Om PWM upptäcktes mättes ett medelvärde av 7769 (minst: 5 - maximum: 343500) Hz. | |||
| Cinebench R10 | |
| Rendering Multiple CPUs 32Bit | |
| no name | |
| Eurocom Sky X9C | |
| Asus GL702ZC-GC104T | |
| Eurocom Tornado F5 | |
| Eurocom Sky X7E2 | |
| MSI GT80 Titan SLI | |
| Razer Blade Pro RZ09-0220 | |
| Razer Blade (2016) FHD | |
| HP Spectre x360 15t-bl100 | |
| Rendering Single 32Bit | |
| Eurocom Sky X9C | |
| no name | |
| Eurocom Tornado F5 | |
| HP Spectre x360 15t-bl100 | |
| Eurocom Sky X7E2 | |
| MSI GT80 Titan SLI | |
| Razer Blade (2016) FHD | |
| Razer Blade Pro RZ09-0220 | |
| Asus GL702ZC-GC104T | |
| wPrime 2.10 - 1024m | |
| HP Spectre x360 15t-bl100 | |
| Razer Blade Pro RZ09-0220 | |
| Eurocom Sky X7E2 | |
| Eurocom Tornado F5 | |
| no name | |
| Eurocom Sky X9C | |
* ... mindre är bättre
| PCMark 8 | |
| Home Score Accelerated v2 | |
| Eurocom Tornado F5 | |
| MSI GT83VR 7RF-206 Titan SLI | |
| Eurocom Sky X9C | |
| Eurocom Sky X7E2 | |
| Razer Blade Pro RZ09-0220 | |
| Work Score Accelerated v2 | |
| Eurocom Tornado F5 | |
| MSI GT83VR 7RF-206 Titan SLI | |
| Razer Blade Pro RZ09-0220 | |
| Eurocom Sky X9C | |
| Eurocom Sky X7E2 | |
| Creative Score Accelerated v2 | |
| Eurocom Sky X9C | |
| Eurocom Tornado F5 | |
| Eurocom Sky X7E2 | |
| Razer Blade Pro RZ09-0220 | |
| PCMark 8 Home Score Accelerated v2 | 5005 poäng | |
| PCMark 8 Creative Score Accelerated v2 | 9529 poäng | |
| PCMark 8 Work Score Accelerated v2 | 5095 poäng | |
| PCMark 10 Score | 6495 poäng | |
Hjälp | ||
| Eurocom Sky X9C 2x Samsung SSD 960 Pro 1TB m.2 NVMe (RAID 0) | MSI GT75VR 7RF-012 Titan Pro 2x Samsung SM961 MZVPW256HEGL NVMe (RAID 0) | Razer Blade Pro RZ09-0220 Samsung SSD PM951 MZVLV256HCHP | Asus GL702ZC-GC104T SanDisk SD8SN8U256G1002 | HP Spectre x360 15t-bl100 Samsung PM961 NVMe MZVLW512HMJP | |
|---|---|---|---|---|---|
| CrystalDiskMark 5.2 / 6 | 1% | -46% | -67% | -22% | |
| Write 4K (MB/s) | 152 | 165 9% | 155.1 2% | 96.1 -37% | 174.1 15% |
| Read 4K (MB/s) | 54.7 | 55.9 2% | 44.22 -19% | 38.91 -29% | 48.07 -12% |
| Write Seq (MB/s) | 2702 | 2612 -3% | 311.2 -88% | 467.9 -83% | 1444 -47% |
| Read Seq (MB/s) | 3261 | 3377 4% | 1247 -62% | 494.2 -85% | 1008 -69% |
| Write 4K Q32T1 (MB/s) | 528 | 548 4% | 310.3 -41% | 188.9 -64% | 512 -3% |
| Read 4K Q32T1 (MB/s) | 630 | 625 -1% | 551 -13% | 205.9 -67% | 632 0% |
| Write Seq Q32T1 (MB/s) | 3074 | 2944 -4% | 311.5 -90% | 461.2 -85% | 1522 -50% |
| Read Seq Q32T1 (MB/s) | 3425 | 3407 -1% | 1560 -54% | 450.8 -87% | 3111 -9% |

| 3DMark | |
| 1920x1080 Fire Strike Graphics | |
| MSI GT83VR 7RF-206 Titan SLI | |
| Eurocom Sky X9C | |
| Desktop PC Ryzen 7 1800X + Zotac GeForce GTX 1070 SLI | |
| Aorus X9 | |
| Nvidia GeForce GTX 1080 Ti Founders Edition | |
| MSI GT75VR 7RF-012 Titan Pro | |
| Nvidia GeForce GTX 1080 Founders Edition | |
| MSI GT80-2QES32SR311BW | |
| Asus Zephyrus GX501 | |
| Razer Blade Pro RZ09-0220 | |
| 3840x2160 Fire Strike Ultra Graphics | |
| Eurocom Sky X9C | |
| Desktop PC Ryzen 7 1800X + Zotac GeForce GTX 1070 SLI | |
| Nvidia GeForce GTX 1080 Ti Founders Edition | |
| Nvidia GeForce GTX 1080 Founders Edition | |
| Asus Zephyrus GX501 | |
| Razer Blade Pro RZ09-0220 | |
| 1920x1080 Fire Strike Combined | |
| Eurocom Sky X9C | |
| Nvidia GeForce GTX 1080 Ti Founders Edition | |
| Nvidia GeForce GTX 1080 Founders Edition | |
| Aorus X9 | |
| MSI GT83VR 7RF-206 Titan SLI | |
| MSI GT75VR 7RF-012 Titan Pro | |
| Asus Zephyrus GX501 | |
| Desktop PC Ryzen 7 1800X + Zotac GeForce GTX 1070 SLI | |
| MSI GT80-2QES32SR311BW | |
| Razer Blade Pro RZ09-0220 | |
| 3DMark 11 | |
| 1280x720 Performance GPU | |
| MSI GT83VR 7RF-206 Titan SLI | |
| Eurocom Sky X9C | |
| Desktop PC Ryzen 7 1800X + Zotac GeForce GTX 1070 SLI | |
| Aorus X9 | |
| Nvidia GeForce GTX 1080 Ti Founders Edition | |
| Nvidia GeForce GTX 1080 Founders Edition | |
| MSI GT75VR 7RF-012 Titan Pro | |
| Asus Zephyrus GX501 | |
| MSI GT80-2QES32SR311BW | |
| Razer Blade Pro RZ09-0220 | |
| 1280x720 Performance Combined | |
| Eurocom Sky X9C | |
| Nvidia GeForce GTX 1080 Founders Edition | |
| Desktop PC Ryzen 7 1800X + Zotac GeForce GTX 1070 SLI | |
| Nvidia GeForce GTX 1080 Ti Founders Edition | |
| MSI GT80-2QES32SR311BW | |
| Aorus X9 | |
| MSI GT75VR 7RF-012 Titan Pro | |
| MSI GT83VR 7RF-206 Titan SLI | |
| Asus Zephyrus GX501 | |
| Razer Blade Pro RZ09-0220 | |
| 3DMark 11 Performance | 30042 poäng | |
| 3DMark Ice Storm Standard Score | 192638 poäng | |
| 3DMark Cloud Gate Standard Score | 45068 poäng | |
| 3DMark Fire Strike Score | 26751 poäng | |
| 3DMark Fire Strike Extreme Score | 17060 poäng | |
Hjälp | ||
| Rise of the Tomb Raider - 3840x2160 High Preset AA:FX AF:4x | |
| Eurocom Sky X9C | |
| Asus GX800VH Prototype | |
| Desktop PC Ryzen 7 1800X + Zotac GeForce GTX 1070 SLI | |
| Nvidia GeForce GTX 1080 Ti Founders Edition | |
| Nvidia GeForce GTX 1080 Ti Founders Edition | |
| MSI Gaming X GeForce GTX 1080 Desktop PC | |
| Nvidia GeForce GTX 1070 Ti Founders Edition | |
| Asus Zephyrus GX501 | |
| Asus GL702ZC-GC104T | |
| Destiny 2 - 3840x2160 Highest Preset AA:SM AF:16x | |
| Eurocom Sky X9C | |
| Desktop PC Ryzen 7 1800X + Zotac GeForce GTX 1070 SLI | |
| Nvidia GeForce GTX 1080 Ti Founders Edition | |
| Middle-earth: Shadow of War - 3840x2160 Ultra Preset AA:T | |
| Eurocom Sky X9C | |
| Nvidia GeForce GTX 1080 Ti Founders Edition | |
| Desktop PC Ryzen 7 1800X + Zotac GeForce GTX 1070 SLI | |
| Nvidia GeForce GTX 1070 Ti Founders Edition | |
| Ashes of the Singularity - 3840x2160 crazy | |
| Nvidia GeForce GTX 1080 Ti Founders Edition | |
| Eurocom Sky X9C | |
| Mafia 3 - 3840x2160 High Preset | |
| Nvidia GeForce GTX 1080 Ti Founders Edition | |
| Eurocom Sky X9C | |
| MSI Gaming X GeForce GTX 1080 Desktop PC | |
| låg | med. | hög | ultra | 4K | |
|---|---|---|---|---|---|
| Guild Wars 2 (2012) | 150.3 | 84.3 | 77.8 | ||
| BioShock Infinite (2013) | 398.4 | 347.3 | 295.5 | 265.6 | |
| Metro: Last Light (2013) | 196 | 194.8 | 192.8 | 172.1 | |
| Thief (2014) | 150.1 | 147.5 | 144.5 | 141.9 | |
| The Witcher 3 (2015) | 357 | 229.8 | 184.3 | 106.4 | 87.1 |
| Batman: Arkham Knight (2015) | 202 | 186 | 150 | 99 | 57 |
| Metal Gear Solid V (2015) | 60 | 60 | 60 | 60 | 60 |
| Fallout 4 (2015) | 212.9 | 219.5 | 174.5 | 167.6 | 100 |
| Rise of the Tomb Raider (2016) | 122.8 | 110.6 | 99.8 | 103.5 | 87.4 |
| Ashes of the Singularity (2016) | 109.8 | 105.9 | 100.6 | 46.7 | |
| Overwatch (2016) | 300 | 300 | 300 | 300 | 216.3 |
| Mafia 3 (2016) | 134.4 | 115 | 79.9 | 33.4 | |
| Prey (2017) | 144 | 144 | 144 | 143 | 84 |
| Dirt 4 (2017) | 360.8 | 245.7 | 122.5 | 82.6 | 54.9 |
| F1 2017 (2017) | 237 | 178 | 152 | 109 | 56 |
| Middle-earth: Shadow of War (2017) | 98 | 123 | 106 | 92 | 55 |
| Destiny 2 (2017) | 148.4 | 121.9 | 116.2 | 113.1 | 80.3 |
Ljudnivå
| Låg belastning |
| 34.2 / 39.6 / 39.6 dB(A) |
| Hög belastning |
| 48.5 / 56.5 dB(A) |
 | ||
30 dB tyst 40 dB(A) hörbar 50 dB(A) högt ljud |
||
min: | ||
| Eurocom Sky X9C GeForce GTX 1080 SLI (Laptop), i7-8700K, 2x Samsung SSD 960 Pro 1TB m.2 NVMe (RAID 0) | Alienware 17 R4 GeForce GTX 1080 Mobile, i7-7820HK, SK Hynix PC300 NVMe 512 GB | MSI GT83VR 7RF-206 Titan SLI GeForce GTX 1080 SLI (Laptop), i7-7920HQ, 2x Toshiba NVMe THNSN5256GPU7 (RAID 0) | Eurocom Sky X7E2 GeForce GTX 1080 Mobile, 6700K, Samsung SM951 MZVPV512HDGL m.2 PCI-e | Aorus X9 GeForce GTX 1070 SLI (Laptop), i7-7820HK, Samsung SM961 MZVKW512HMJP m.2 PCI-e | Razer Blade Pro 2017 GeForce GTX 1080 Mobile, i7-7820HK, 2x Samsung SSD PM951 MZVLV256HCHP (RAID 0) | |
|---|---|---|---|---|---|---|
| Noise | 4% | -3% | 8% | -3% | 7% | |
| av / miljö * (dB) | 28.4 | 28.2 1% | 31 -9% | 28.9 -2% | 30 -6% | 30 -6% |
| Idle Minimum * (dB) | 34.2 | 35.6 -4% | 35 -2% | 28.9 15% | 35 -2% | 30 12% |
| Idle Average * (dB) | 39.6 | 35.6 10% | 38 4% | 30.6 23% | 37 7% | 31 22% |
| Idle Maximum * (dB) | 39.6 | 35.7 10% | 41 -4% | 35.7 10% | 43 -9% | 33 17% |
| Load Average * (dB) | 48.5 | 50.2 -4% | 52 -7% | 49 -1% | 49 -1% | 43 11% |
| Witcher 3 ultra * (dB) | 54 | 50.2 7% | 53 2% | 56 -4% | 55 -2% | |
| Load Maximum * (dB) | 56.5 | 50.2 11% | 59 -4% | 55 3% | 60 -6% | 58 -3% |
* ... mindre är bättre
(±) Den maximala temperaturen på ovansidan är 44.6 °C / 112 F, jämfört med genomsnittet av 40.4 °C / 105 F , allt från 21.2 till 68.8 °C för klassen Gaming.
(-) Botten värms upp till maximalt 48 °C / 118 F, jämfört med genomsnittet av 43.2 °C / 110 F
(+) Vid tomgångsbruk är medeltemperaturen för ovansidan 27.9 °C / 82 F, jämfört med enhetsgenomsnittet på 33.9 °C / ### class_avg_f### F.
(+) När du spelar The Witcher 3 är medeltemperaturen för ovansidan 30.6 °C / 87 F, jämfört med enhetsgenomsnittet på 33.9 °C / ## #class_avg_f### F.
(±) Handledsstöden och pekplattan kan bli väldigt varma vid beröring med maximalt 38.4 °C / 101.1 F.
(-) Medeltemperaturen för handledsstödsområdet på liknande enheter var 28.8 °C / 83.8 F (-9.6 °C / -17.3 F).
Eurocom Sky X9C ljudanalys
(-) | inte särskilt höga högtalare (69.1 dB)
Bas 100 - 315 Hz
(±) | reducerad bas - i genomsnitt 7.2% lägre än medianen
(±) | linjäriteten för basen är genomsnittlig (14.7% delta till föregående frekvens)
Mellan 400 - 2000 Hz
(±) | högre mellan - i genomsnitt 5.6% högre än median
(+) | mids är linjära (5.5% delta till föregående frekvens)
Högsta 2 - 16 kHz
(±) | reducerade toppar - i genomsnitt 5.3% lägre än medianen
(±) | linjäriteten för toppar är genomsnittlig (11.4% delta till föregående frekvens)
Totalt 100 - 16 000 Hz
(±) | linjäriteten för det totala ljudet är genomsnittlig (24.4% skillnad mot median)
Jämfört med samma klass
» 88% av alla testade enheter i den här klassen var bättre, 3% liknande, 8% sämre
» Den bästa hade ett delta på 6%, genomsnittet var 18%, sämst var 132%
Jämfört med alla testade enheter
» 74% av alla testade enheter var bättre, 6% liknande, 20% sämre
» Den bästa hade ett delta på 4%, genomsnittet var 24%, sämst var 134%
Apple MacBook 12 (Early 2016) 1.1 GHz ljudanalys
(+) | högtalare kan spela relativt högt (83.6 dB)
Bas 100 - 315 Hz
(±) | reducerad bas - i genomsnitt 11.3% lägre än medianen
(±) | linjäriteten för basen är genomsnittlig (14.2% delta till föregående frekvens)
Mellan 400 - 2000 Hz
(+) | balanserad mellan - endast 2.4% från medianen
(+) | mids är linjära (5.5% delta till föregående frekvens)
Högsta 2 - 16 kHz
(+) | balanserade toppar - endast 2% från medianen
(+) | toppar är linjära (4.5% delta till föregående frekvens)
Totalt 100 - 16 000 Hz
(+) | det totala ljudet är linjärt (10.2% skillnad mot median)
Jämfört med samma klass
» 7% av alla testade enheter i den här klassen var bättre, 2% liknande, 91% sämre
» Den bästa hade ett delta på 5%, genomsnittet var 18%, sämst var 53%
Jämfört med alla testade enheter
» 5% av alla testade enheter var bättre, 1% liknande, 94% sämre
» Den bästa hade ett delta på 4%, genomsnittet var 24%, sämst var 134%
| Av/Standby | |
| Låg belastning | |
| Hög belastning |
|
Förklaring:
min: | |
| Eurocom Sky X9C i7-8700K, GeForce GTX 1080 SLI (Laptop), 2x Samsung SSD 960 Pro 1TB m.2 NVMe (RAID 0), IPS, 3840x2160, 17.3" | Alienware 17 R4 i7-7820HK, GeForce GTX 1080 Mobile, SK Hynix PC300 NVMe 512 GB, TN LED, 2560x1440, 17.3" | MSI GT83VR 7RF-206 Titan SLI i7-7920HQ, GeForce GTX 1080 SLI (Laptop), 2x Toshiba NVMe THNSN5256GPU7 (RAID 0), IPS, 1920x1080, 18.4" | Aorus X9 i7-7820HK, GeForce GTX 1070 SLI (Laptop), Samsung SM961 MZVKW512HMJP m.2 PCI-e, TN, 2560x1440, 17.3" | MSI GT80-2QES32SR311BW 4980HQ, GeForce GTX 980M SLI, 4x Toshiba HG6 THNSNJ256G8NU (RAID 0), Wide View, Super PLS, 1920x1080, 18.4" | |
|---|---|---|---|---|---|
| Power Consumption | 34% | -9% | 28% | 19% | |
| Idle Minimum * (Watt) | 54.7 | 37.5 31% | 45 18% | 29 47% | 34.3 37% |
| Idle Average * (Watt) | 55.7 | 37.6 32% | 54 3% | 35 37% | 41.9 25% |
| Idle Maximum * (Watt) | 56.8 | 37.6 34% | 62 -9% | 42 26% | 49.3 13% |
| Load Average * (Watt) | 183.7 | 122.4 33% | 178 3% | 140 24% | 140.2 24% |
| Witcher 3 ultra * (Watt) | 454.8 | 180.3 60% | 380 16% | 295 35% | |
| Load Maximum * (Watt) | 321.8 | 277.4 14% | 586 -82% | 334 -4% | 328.6 -2% |
* ... mindre är bättre
| Eurocom Sky X9C i7-8700K, GeForce GTX 1080 SLI (Laptop), 89 Wh | Alienware 17 R4 i7-7820HK, GeForce GTX 1080 Mobile, 99 Wh | MSI GT83VR 7RF-206 Titan SLI i7-7920HQ, GeForce GTX 1080 SLI (Laptop), 75.24 Wh | Aorus X9 i7-7820HK, GeForce GTX 1070 SLI (Laptop), 94.24 Wh | Eurocom Sky X7E2 6700K, GeForce GTX 1080 Mobile, 89 Wh | Asus GL702ZC-GC104T R7 1700, Radeon RX 580 (Laptop), 76 Wh | |
|---|---|---|---|---|---|---|
| Batteridrifttid | 137% | 50% | 75% | 57% | 16% | |
| Reader / Idle (h) | 1.4 | 4.6 229% | 2.4 71% | 2.9 107% | 2.3 64% | 1.7 21% |
| WiFi v1.3 (h) | 1.3 | 3 131% | 2 54% | 2.2 69% | 1.7 31% | 1.5 15% |
| Load (h) | 0.8 | 1.2 50% | 1 25% | 1.2 50% | 1.4 75% | 0.9 13% |
För
Emot
Vi har sen länge varit tydliga med vad vi tycker om SLI. För spelsyften har SLI alltid varit en blandad upplevelse. Ankomsten av DX12 i synnerhet har gjort SLI ännu svårare att rekommendera då detta API nu delegerar optimering för flera GPU:er till varje individuell utvecklare snarare än till Nvidia. Pålitligt SLI-stöd har på grund av detta blivit väldigt osäkert och mediokra prestandatest-siffror stärker den uppfattningen. Användare som vill ha SLI i en laptop borde ha en väldigt specifik anledning att skaffa sig denna teknik då den extra GPU:n i många fall kan bli värre än bara extra tyngd.
Med det sagt så har Eurocom Sky X9C snabbt toppat dom flesta av prestandatesterna i vår databas på grund av sin extrema konfiguration och Core i7-8700K. Dess modulära komponenter och breda hårdvarustöd är fortfarande höjdpunkten med att äga en Eurocom framför alternativ från mer välkända tillverkare.
Samma nackdelar som med nästan alla Eurocom-laptops vi testat kvarstår. Den väldigt täta prestandaprofilen för med sig högt fläktljud (54 dB(A)), väldigt varma kärntemperaturer (>85 C), hög vikt (5.6 kg) och kort batteritid som i princip kan mätas i minuter. Även om vikt och batteritid inte är viktiga faktorer för en spellaptop så begränsar dom varma kärntemperaturerna påtagligt potentialen för överklockning och det höga fläktljudet är en fiende vid spelande precis lika mycket som något annat hinder på skärmen. Vi kan inte låta bli att undra hur detta system hade presterat om man tog bort SLI och minskat antalet kylrör för dess CPU och GPU. Vi vågar gissa att dom resulterande lägre temperaturerna, tystare fläktarna, högre Boost-klockfrekvenserna och den större potentialen för överklockning hade lett till bättre spelprestanda även om de syntetiska prestandatest-poängen hade varit längre än hos en SLI-konfiguration.
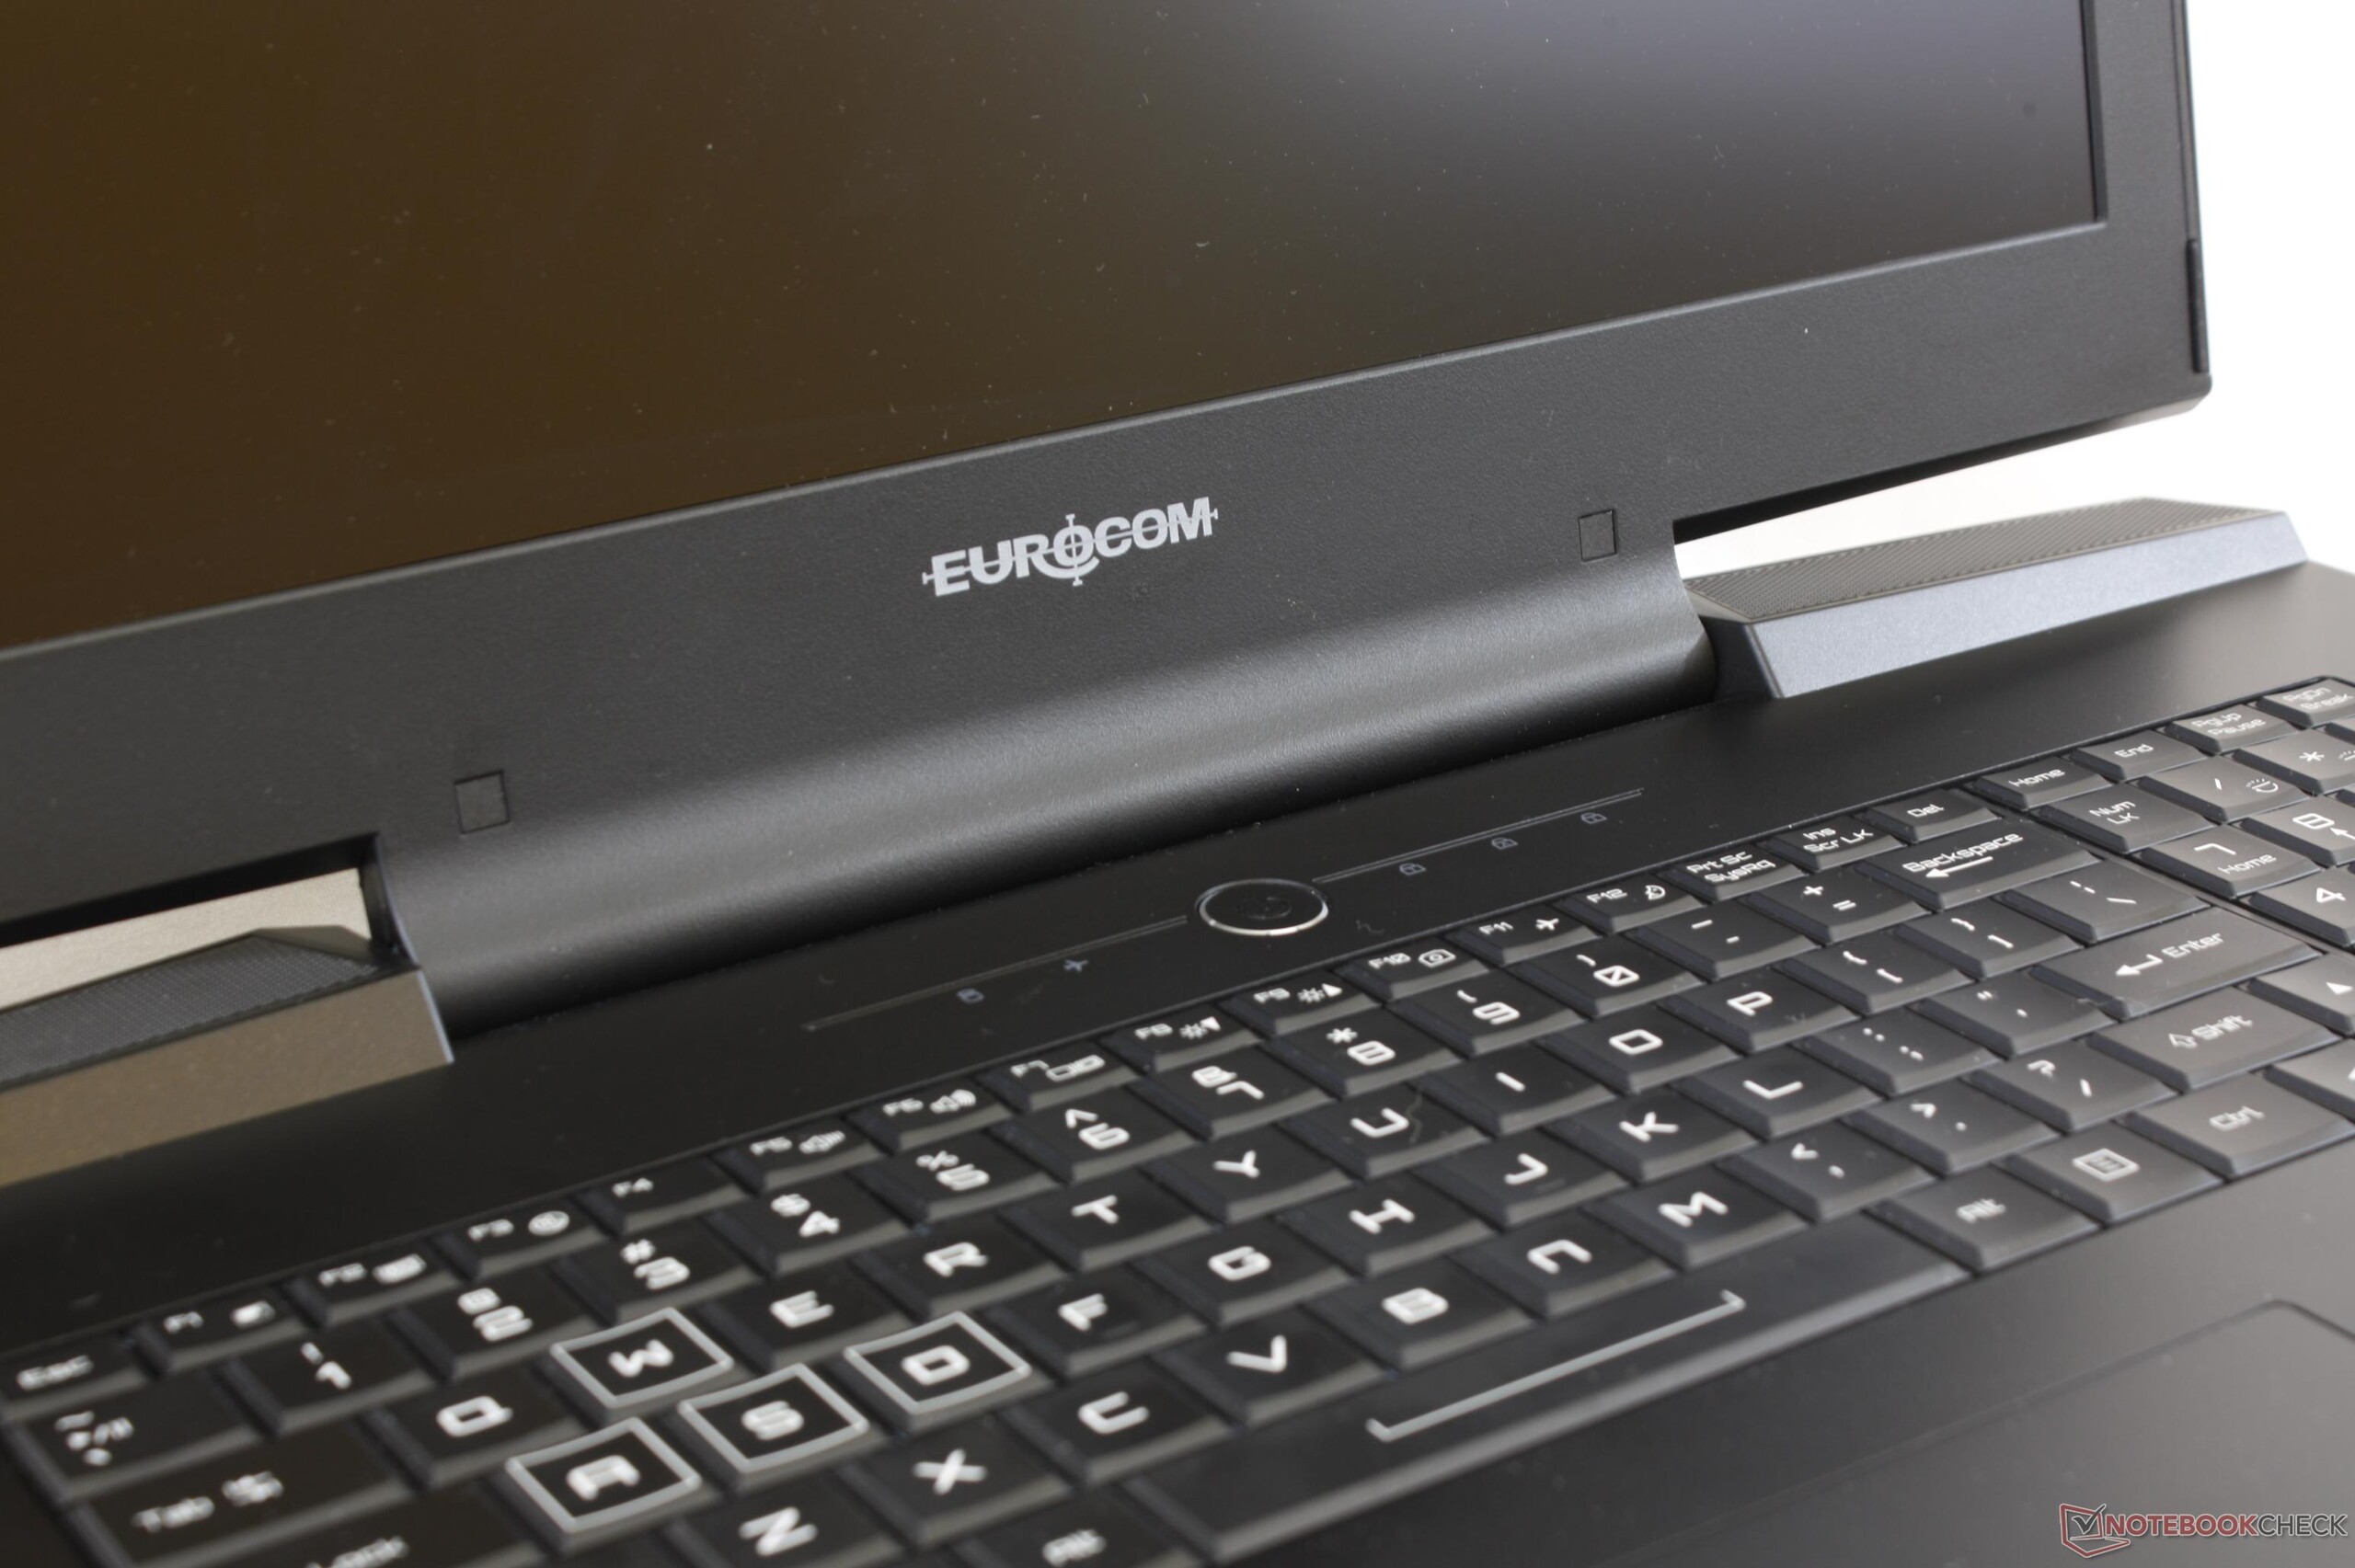
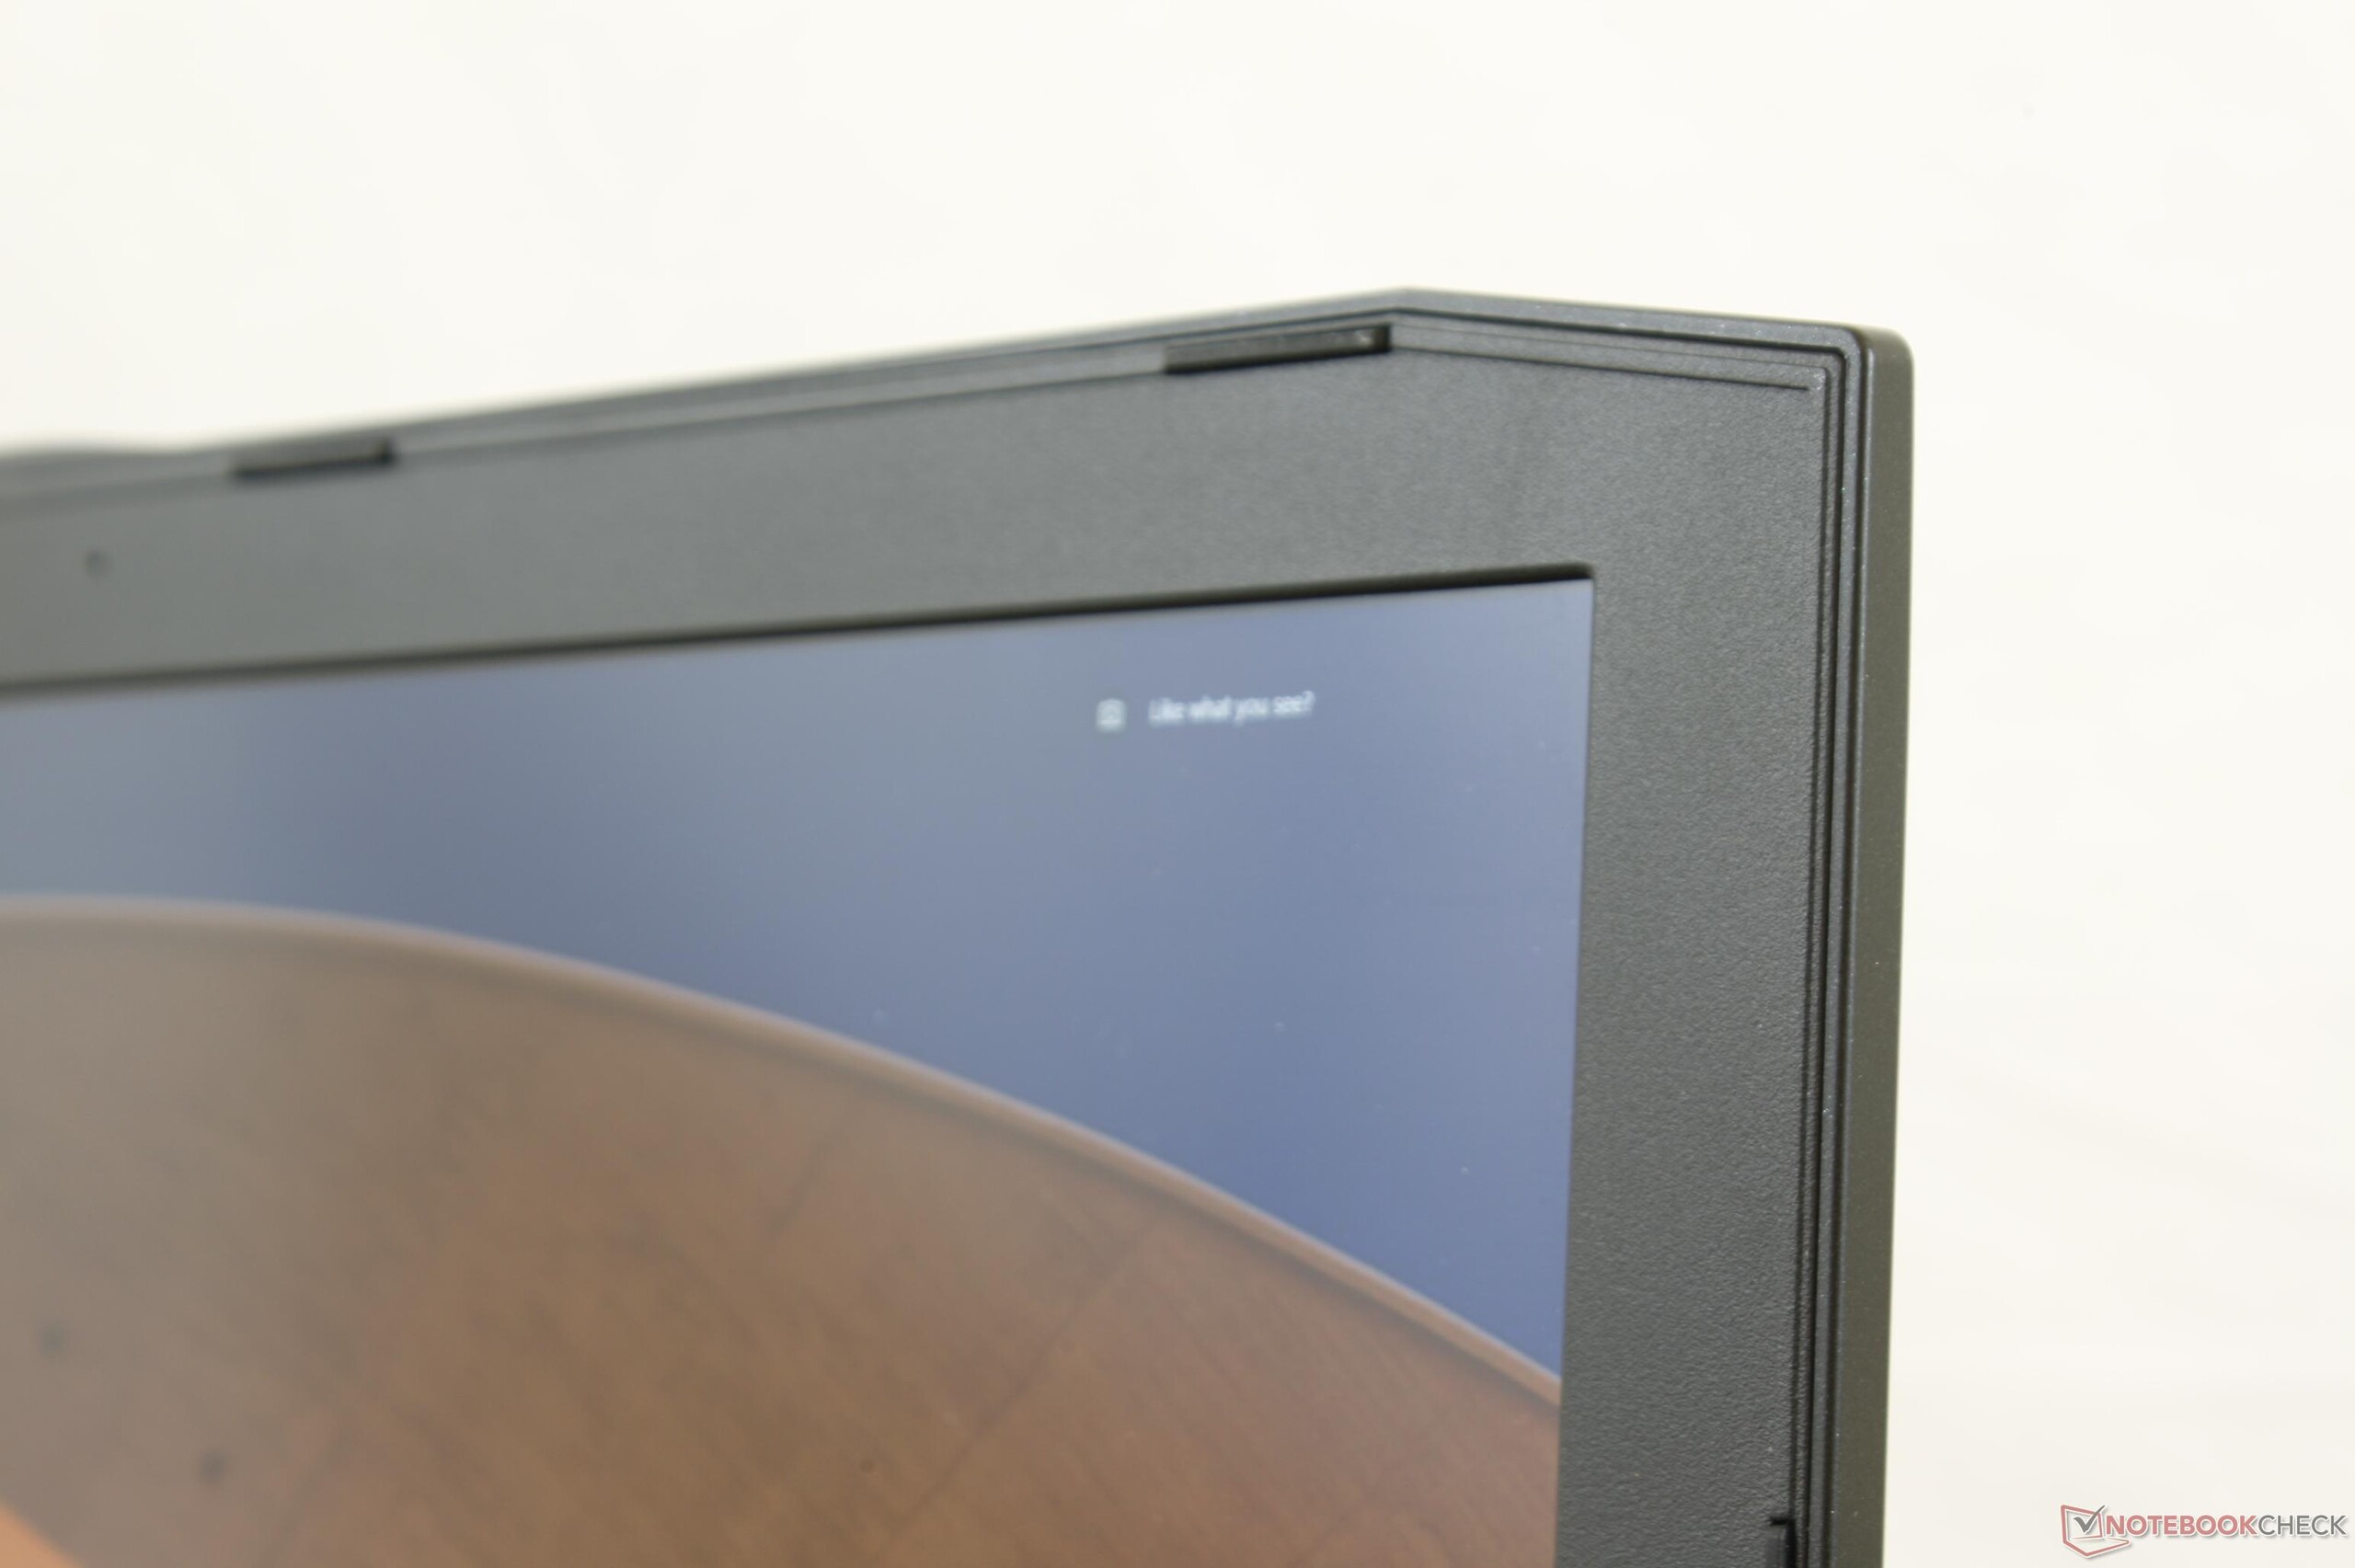
En del aspekter hos höljet och mjukvaran verkar fast i det förflutna. Avsaknaden av individuellt upplysta RGB-knappar blir allt svårare att förlåta och skärmens inre plastinfattning känns fortfarande billig jämfört med en Alienware-design. Kontrollcentret och överklockningsverktygen fokuserar mer på att skapa ett attraktivt "Fisher-Price" GUI med stora typsnitt snarare än ett rent gränssnitt med inställningar som är lätta att nå och inte är gömda under ett flertal fönster. Funktioner som faktiskt är mer användbara för gamers såsom datainspelning, videoinspelning, direkt RPM justering/avläsning för varje fläkt och prestanda-overlay saknas fortfarande i den förinstallerade mjukvaran.
För den totalt sett bästa spelupplevelsen är det nog bättre att konfigurera Sky X9C med ett enkelt GTX 1080 och sen överklocka det. Mer budgetmedvetna gamers kan i princip få samma spelprestanda från en mindre krävande 45 W HQ-processor då dom flesta titlar inte är begränsade av CPU:n. Se till att du har ett bra par hörlurar när du spelar!
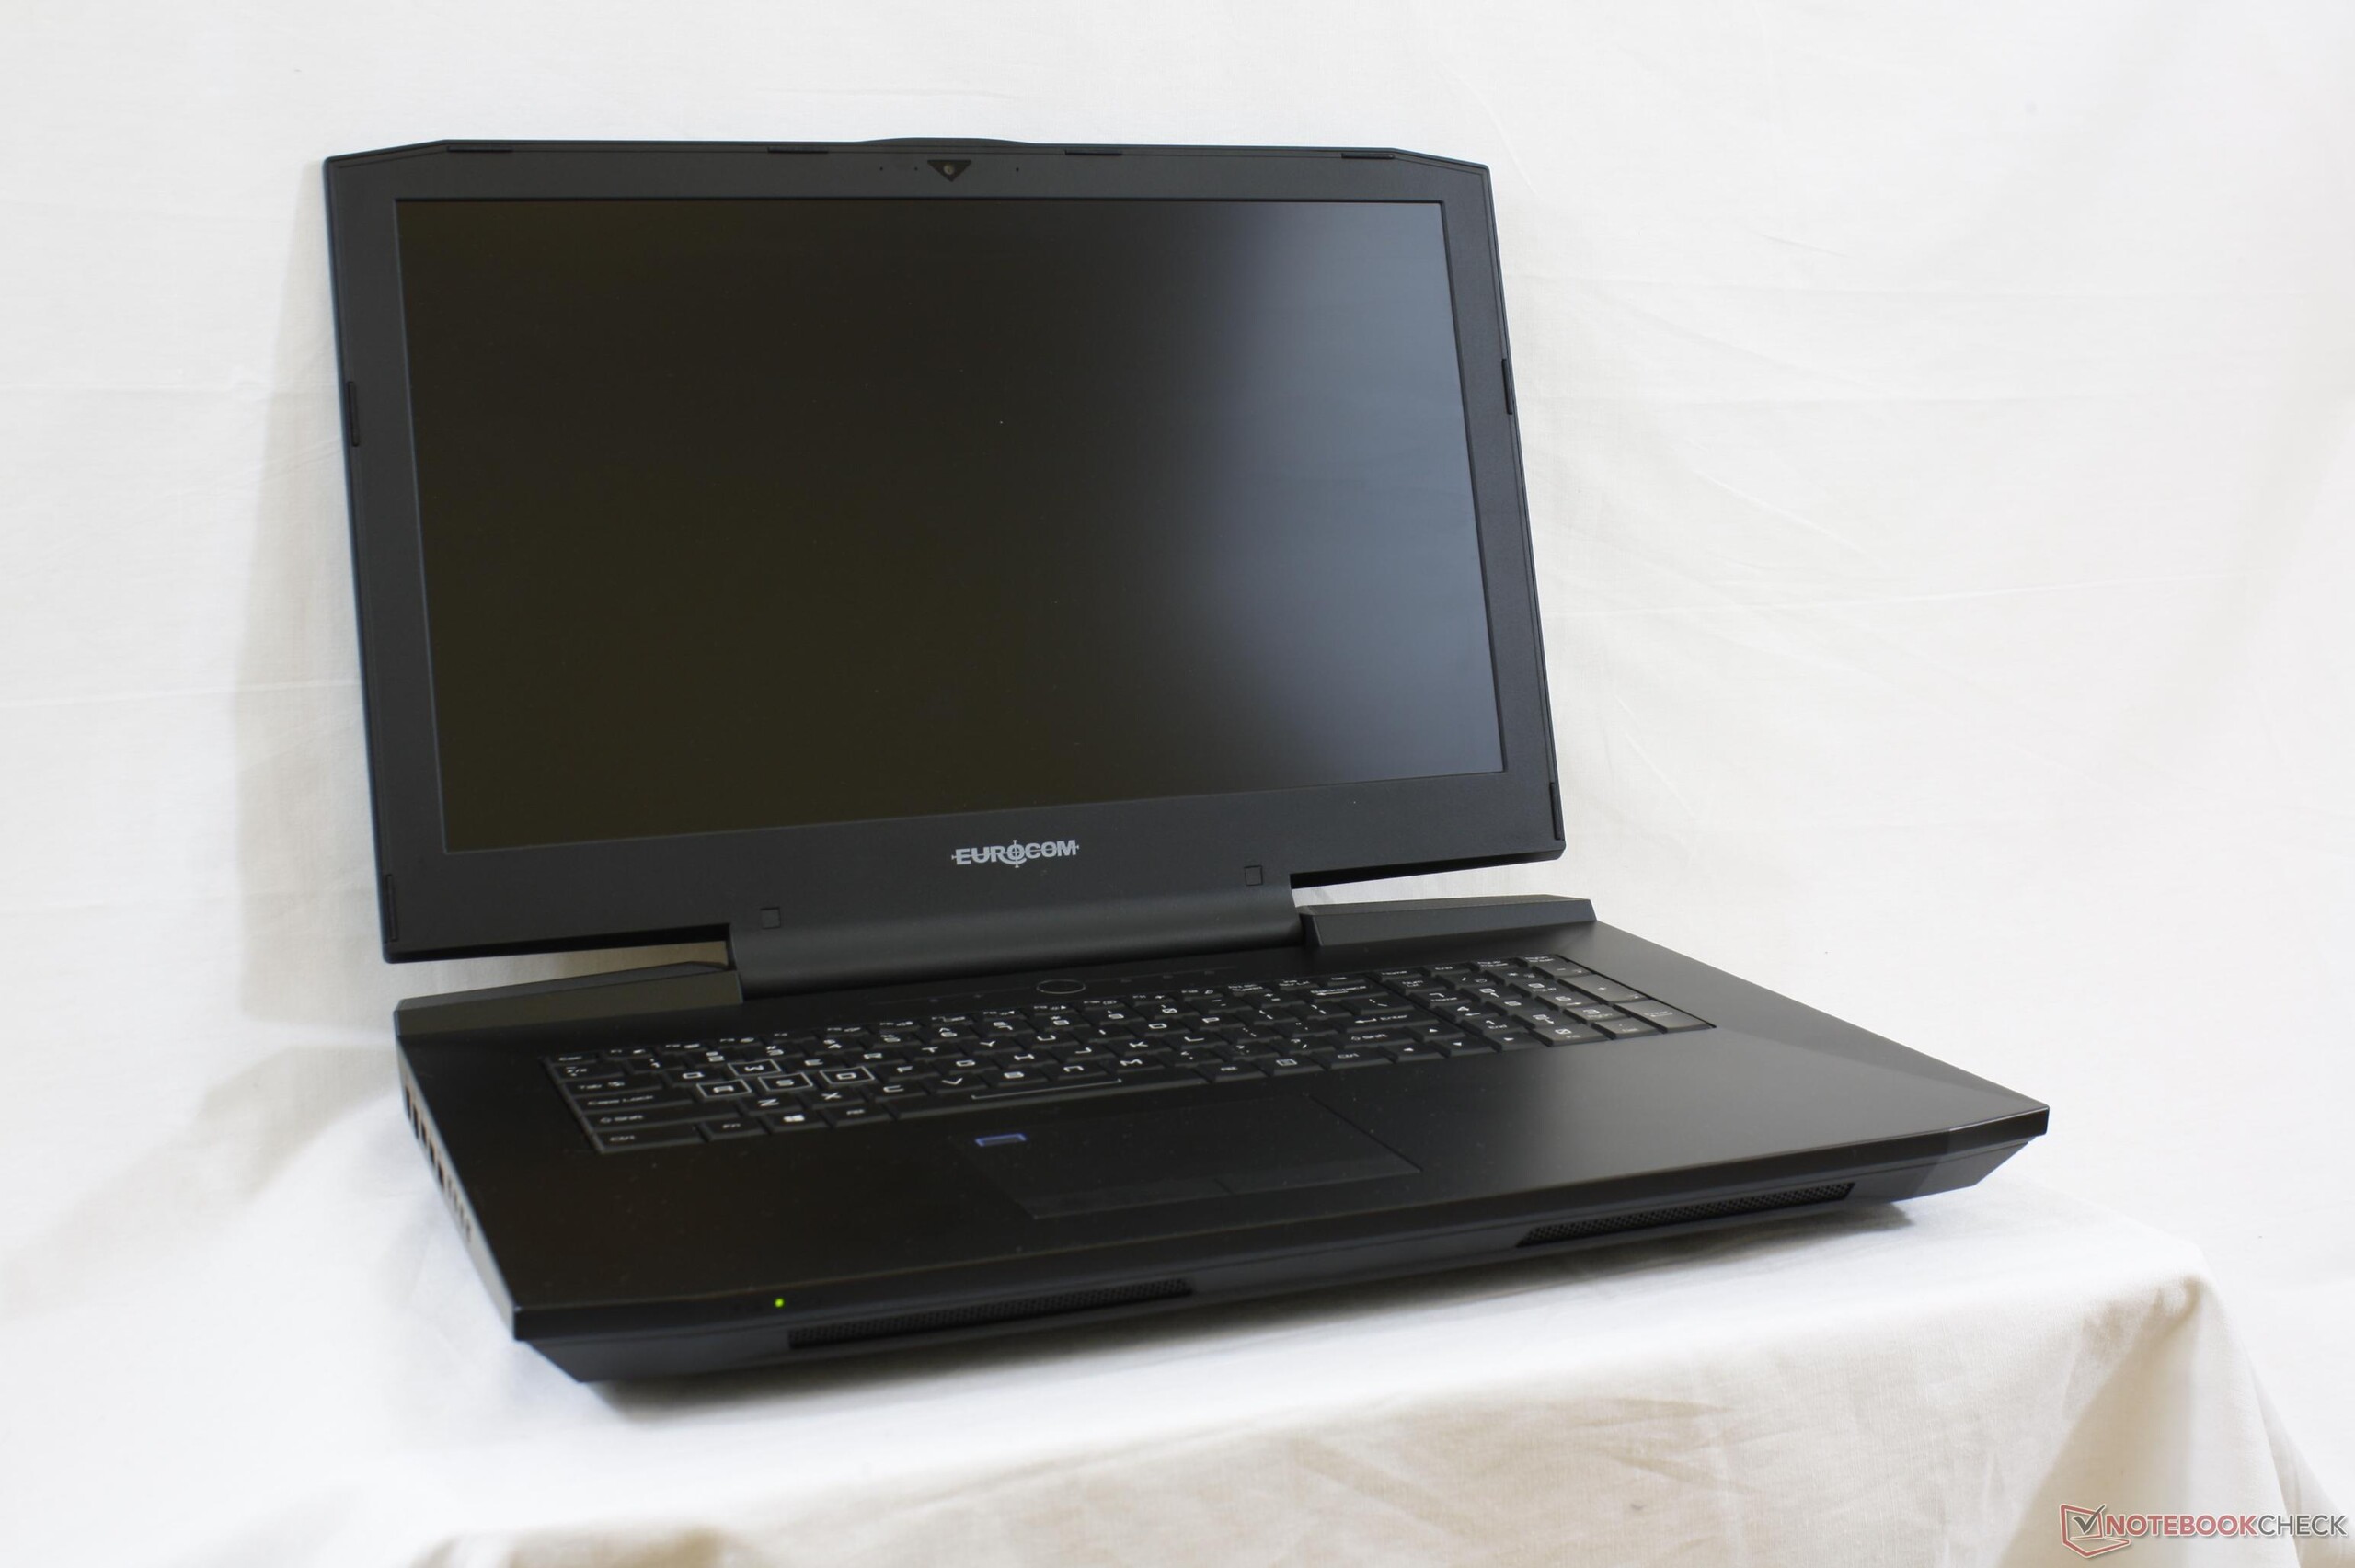
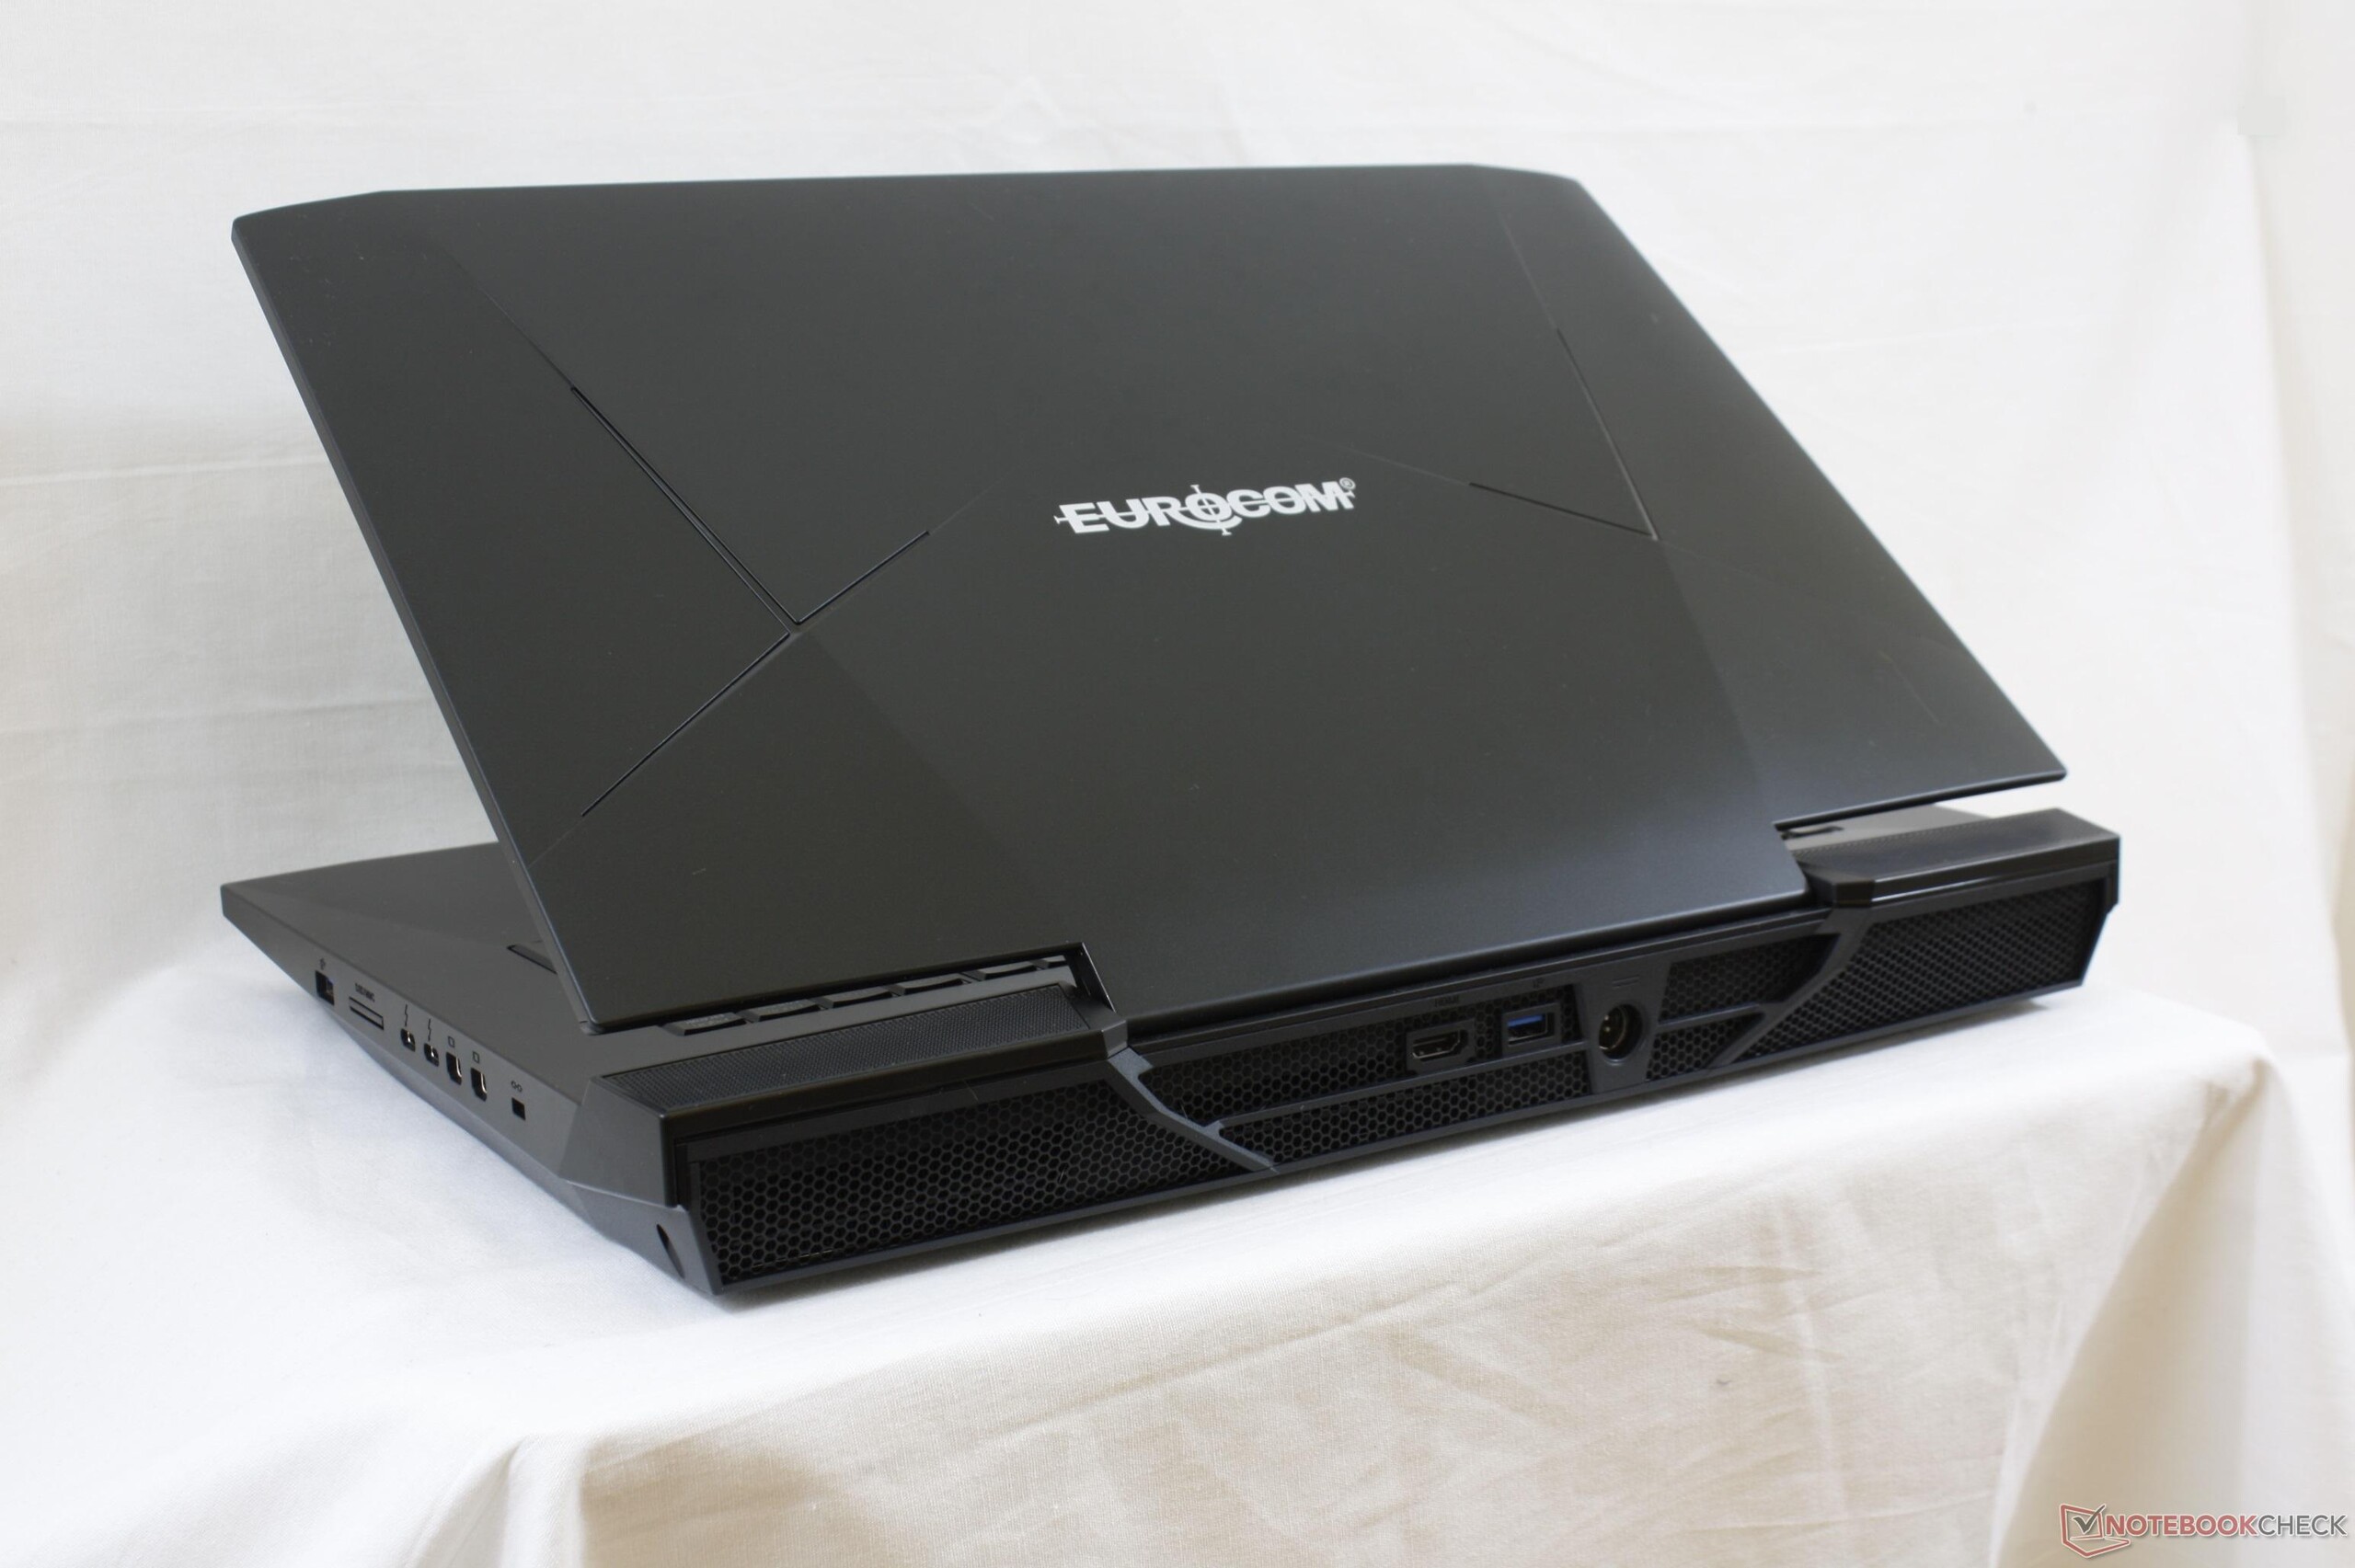
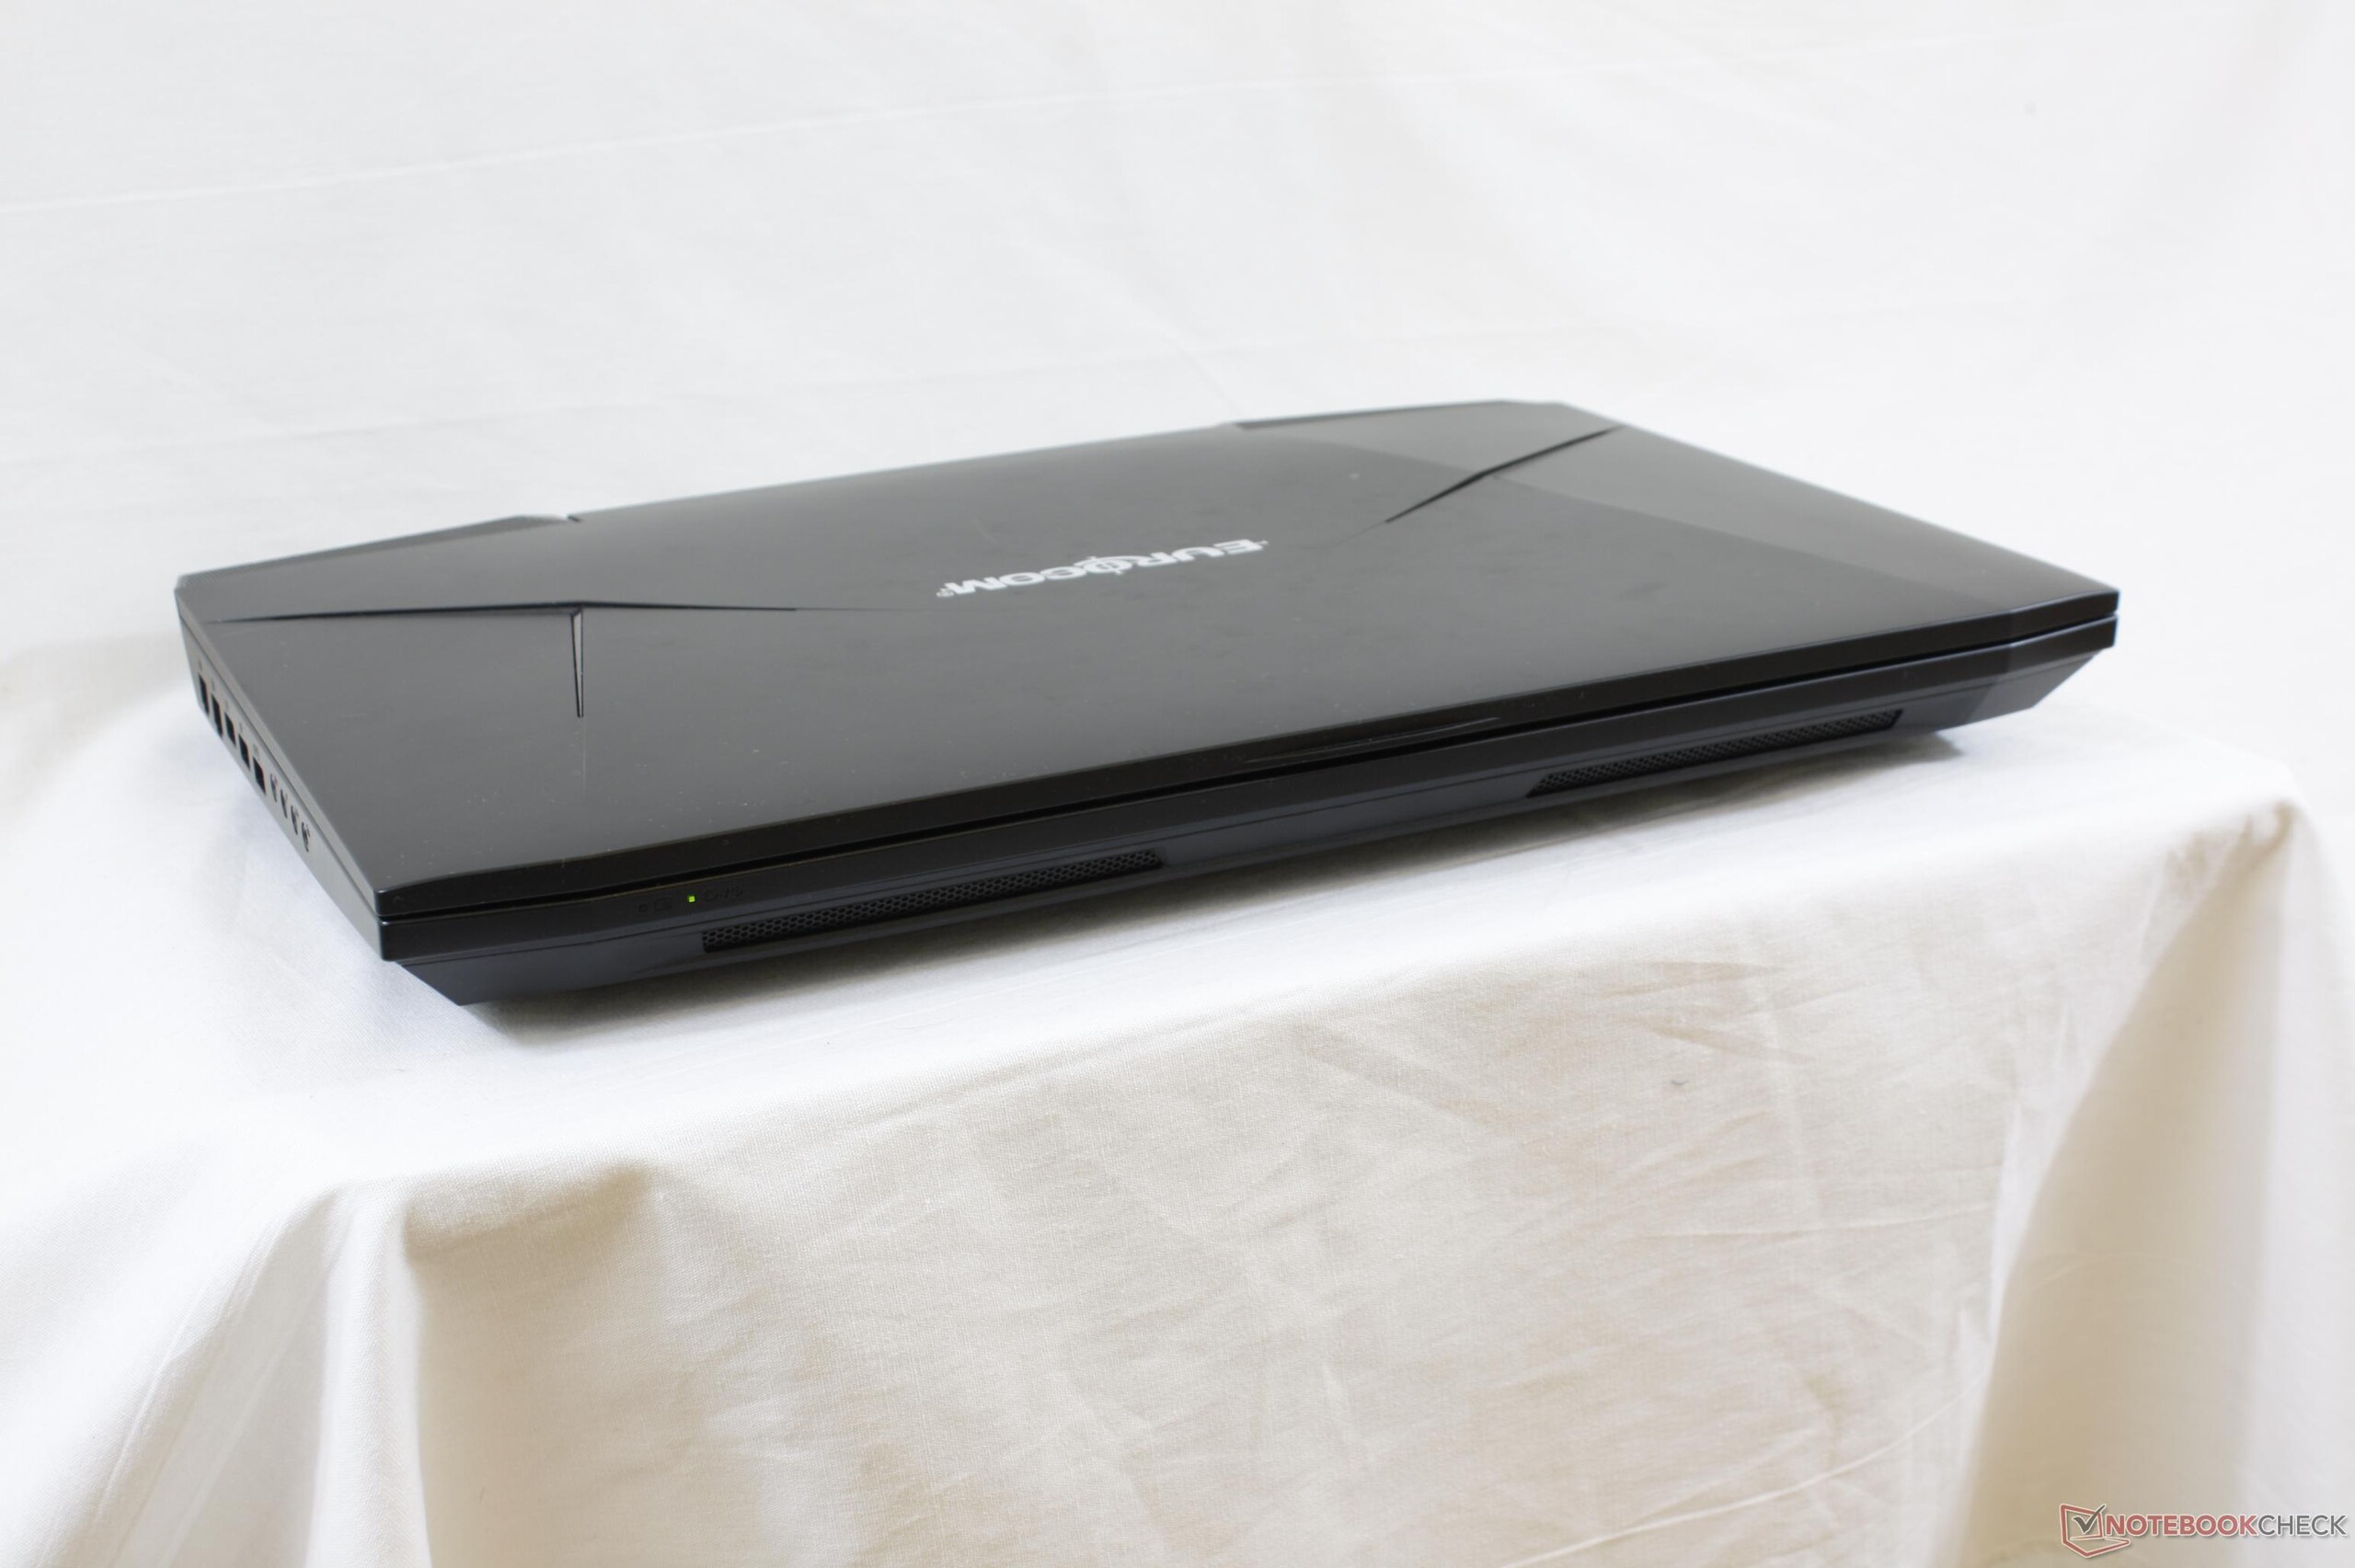
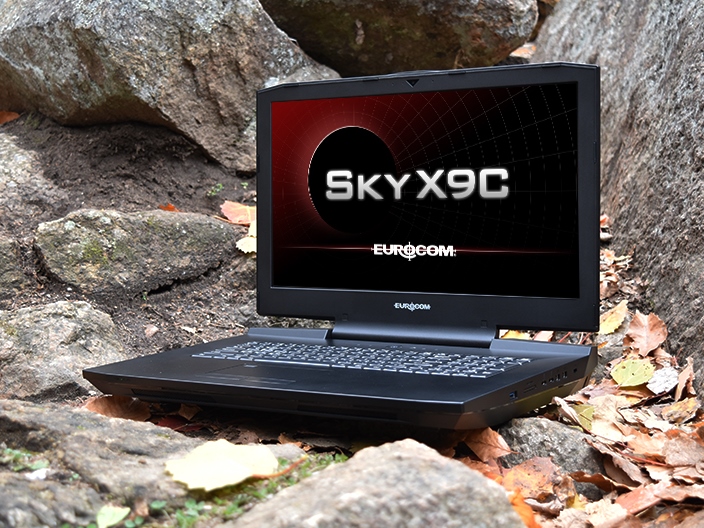
Eurocom Sky X9C
- 12/29/2017 v6 (old)
Allen Ngo
Price comparison
