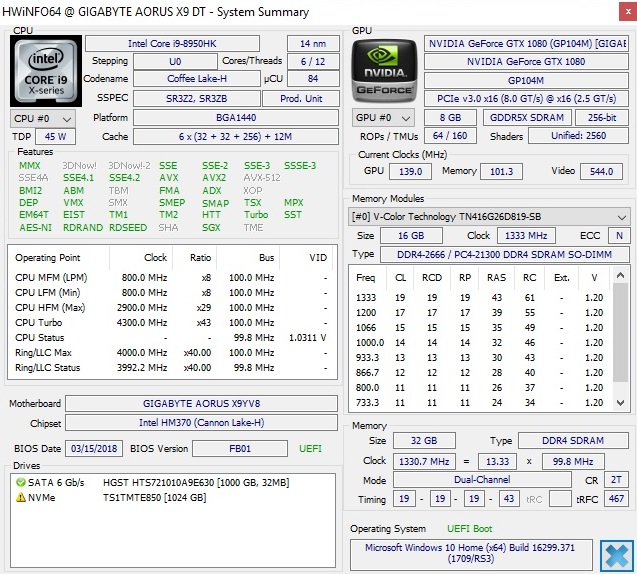
Test: Aorus X9 DT (i9-8950HK, GTX 1080, FHD) Laptop (Sammanfattning)
| SD Card Reader | |
| average JPG Copy Test (av. of 3 runs) | |
| Aorus X9 DT (Toshiba Exceria Pro SDXC 64 GB UHS-II) | |
| Aorus X9 (Toshiba Exceria Pro SDXC 64 GB UHS-II) | |
| Asus G703 (Toshiba Exceria Pro SDXC 64 GB UHS-II) | |
| Genomsnitt av klass Gaming (20.9 - 210, n=55, senaste 2 åren) | |
| MSI GT75VR 7RF-012 Titan Pro (Toshiba Exceria Pro SDXC 64 GB UHS-II) | |
| Acer Predator 17 X GX-792-76DL (Toshiba Exceria Pro SDXC 64 GB UHS-II) | |
| HP Omen X 17-ap0xx (Toshiba Exceria Pro SDXC 64 GB UHS-II) | |
| maximum AS SSD Seq Read Test (1GB) | |
| Aorus X9 DT (Toshiba Exceria Pro SDXC 64 GB UHS-II) | |
| Aorus X9 (Toshiba Exceria Pro SDXC 64 GB UHS-II) | |
| Asus G703 (Toshiba Exceria Pro SDXC 64 GB UHS-II) | |
| Genomsnitt av klass Gaming (25.5 - 261, n=52, senaste 2 åren) | |
| Acer Predator 17 X GX-792-76DL (Toshiba Exceria Pro SDXC 64 GB UHS-II) | |
| MSI GT75VR 7RF-012 Titan Pro (Toshiba Exceria Pro SDXC 64 GB UHS-II) | |
| HP Omen X 17-ap0xx (Toshiba Exceria Pro SDXC 64 GB UHS-II) | |
| |||||||||||||||||||||||||
Distribution av ljusstyrkan: 86 %
Mitt på batteriet: 280 cd/m²
Kontrast: 1273:1 (Svärta: 0.22 cd/m²)
ΔE ColorChecker Calman: 1.78 | ∀{0.5-29.43 Ø4.71}
ΔE Greyscale Calman: 0.74 | ∀{0.09-98 Ø4.96}
92% sRGB (Argyll 1.6.3 3D)
60% AdobeRGB 1998 (Argyll 1.6.3 3D)
67.3% AdobeRGB 1998 (Argyll 3D)
92.1% sRGB (Argyll 3D)
66.8% Display P3 (Argyll 3D)
Gamma: 2.43
CCT: 6494 K
| Aorus X9 DT AUO B173HAN03.0 (AUO309D), IPS, 1920x1080 | Aorus X9 AUO B173QTN01.3 (AUO1396), TN, 2560x1440 | HP Omen X 17-ap0xx AU Optronics B173HW01, IPS, 1920x1080 | Acer Predator 17 X GX-792-76DL LP173WF4-SPF5 (LGD056D), IPS, 1920x1080 | MSI GT75VR 7RF-012 Titan Pro CMN N173HHE-G32 (CMN1747), TN LED, 1920x1080 | Asus G703 AUO B173HAN03.0 (AUO309D), IPS, 1920x1080 | |
|---|---|---|---|---|---|---|
| Display | -9% | -5% | -6% | 24% | -1% | |
| Display P3 Coverage (%) | 66.8 | 60.6 -9% | 63.7 -5% | 66 -1% | 90.3 35% | 65.5 -2% |
| sRGB Coverage (%) | 92.1 | 84 -9% | 88.2 -4% | 83.7 -9% | 99.6 8% | 92.4 0% |
| AdobeRGB 1998 Coverage (%) | 67.3 | 61.1 -9% | 64.2 -5% | 61.2 -9% | 86.8 29% | 66.6 -1% |
| Response Times | 14% | -151% | -139% | 40% | 6% | |
| Response Time Grey 50% / Grey 80% * (ms) | 18.4 ? | 21.6 ? -17% | 44 ? -139% | 45 ? -145% | 11.6 ? 37% | 17.6 ? 4% |
| Response Time Black / White * (ms) | 12 ? | 6.6 ? 45% | 31.6 ? -163% | 28 ? -133% | 6.8 ? 43% | 11.2 ? 7% |
| PWM Frequency (Hz) | 25000 ? | |||||
| Screen | -119% | -40% | -70% | 3% | -74% | |
| Brightness middle (cd/m²) | 280 | 346 24% | 343 23% | 380 36% | 274 -2% | 274 -2% |
| Brightness (cd/m²) | 262 | 326 24% | 332 27% | 362 38% | 262 0% | 268 2% |
| Brightness Distribution (%) | 86 | 88 2% | 83 -3% | 91 6% | 87 1% | 80 -7% |
| Black Level * (cd/m²) | 0.22 | 0.54 -145% | 0.35 -59% | 0.37 -68% | 0.26 -18% | 0.29 -32% |
| Contrast (:1) | 1273 | 641 -50% | 980 -23% | 1027 -19% | 1054 -17% | 945 -26% |
| Colorchecker dE 2000 * | 1.78 | 5.98 -236% | 3.35 -88% | 4.12 -131% | 1.36 24% | 3.99 -124% |
| Colorchecker dE 2000 max. * | 3.91 | 9.77 -150% | 5.62 -44% | 8.19 -109% | 4.1 -5% | 7.33 -87% |
| Greyscale dE 2000 * | 0.74 | 5.47 -639% | 2.4 -224% | 3.95 -434% | 0.64 14% | 4.14 -459% |
| Gamma | 2.43 91% | 2.21 100% | 2.35 94% | 2.47 89% | 2.19 100% | 2.58 85% |
| CCT | 6494 100% | 7721 84% | 6495 100% | 6539 99% | 6551 99% | 7352 88% |
| Color Space (Percent of AdobeRGB 1998) (%) | 60 | 55 -8% | 57 -5% | 55 -8% | 77 28% | 60 0% |
| Color Space (Percent of sRGB) (%) | 92 | 84 -9% | 88 -4% | 84 -9% | 100 9% | 92 0% |
| Colorchecker dE 2000 calibrated * | 2.5 | 1.79 | ||||
| Totalt genomsnitt (program/inställningar) | -38% /
-79% | -65% /
-48% | -72% /
-66% | 22% /
12% | -23% /
-48% |
* ... mindre är bättre
Visa svarstider
| ↔ Svarstid svart till vitt | ||
|---|---|---|
| 12 ms ... stiga ↗ och falla ↘ kombinerat | ↗ 6.8 ms stiga | 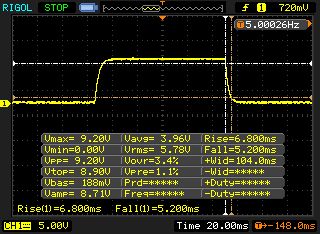 |
| ↘ 5.2 ms hösten | ||
| Skärmen visar bra svarsfrekvens i våra tester, men kan vara för långsam för konkurrenskraftiga spelare. I jämförelse sträcker sig alla testade enheter från 0.1 (minst) till 240 (maximalt) ms. » 32 % av alla enheter är bättre. Det betyder att den uppmätta svarstiden är bättre än genomsnittet av alla testade enheter (19.8 ms). | ||
| ↔ Svarstid 50 % grått till 80 % grått | ||
| 18.4 ms ... stiga ↗ och falla ↘ kombinerat | ↗ 9.2 ms stiga | 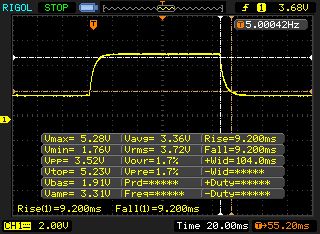 |
| ↘ 9.2 ms hösten | ||
| Skärmen visar bra svarsfrekvens i våra tester, men kan vara för långsam för konkurrenskraftiga spelare. I jämförelse sträcker sig alla testade enheter från 0.165 (minst) till 636 (maximalt) ms. » 32 % av alla enheter är bättre. Det betyder att den uppmätta svarstiden är bättre än genomsnittet av alla testade enheter (30.9 ms). | ||
Skärmflimmer / PWM (Puls-Width Modulation)
| Skärmflimmer / PWM upptäcktes inte | 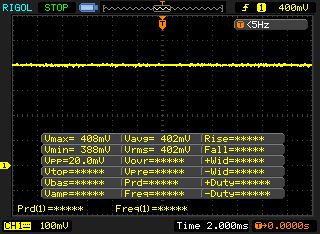 | ||
Som jämförelse: 52 % av alla testade enheter använder inte PWM för att dämpa skärmen. Om PWM upptäcktes mättes ett medelvärde av 7748 (minst: 5 - maximum: 343500) Hz. | |||
| PCMark 10 - Score | |
| Genomsnitt av klass Gaming (5828 - 12414, n=94, senaste 2 åren) | |
| Aorus X9 DT | |
| Aorus X9 | |
| HP Omen X 17-ap0xx | |
| MSI GT75VR 7RF-012 Titan Pro | |
| Asus G703 | |
| PCMark 8 Home Score Accelerated v2 | 5859 poäng | |
| PCMark 8 Work Score Accelerated v2 | 6055 poäng | |
| PCMark 10 Score | 6387 poäng | |
Hjälp | ||
| Aorus X9 DT Transcend TS1TMTE850 | Aorus X9 Samsung SM961 MZVKW512HMJP m.2 PCI-e | HP Omen X 17-ap0xx Samsung PM961 MZVLW256HEHP | Acer Predator 17 X GX-792-76DL Toshiba NVMe THNSN5512GPU7 | MSI GT75VR 7RF-012 Titan Pro 2x Samsung SM961 MZVPW256HEGL NVMe (RAID 0) | Asus G703 2x Samsung SM961 MZVKW512HMJP NVMe (RAID 0) | |
|---|---|---|---|---|---|---|
| AS SSD | 75% | 40% | 36% | 80% | 96% | |
| Seq Read (MB/s) | 1518 | 2695 78% | 2352 55% | 2261 49% | 3137 107% | 3177 109% |
| Seq Write (MB/s) | 1019 | 1678 65% | 1145 12% | 1338 31% | 2352 131% | 2556 151% |
| 4K Read (MB/s) | 22.23 | 50.6 128% | 44.81 102% | 39.52 78% | 50.1 125% | 47.61 114% |
| 4K Write (MB/s) | 98.9 | 134.3 36% | 116.2 17% | 133.8 35% | 128.8 30% | 148.4 50% |
| Score Read (Points) | 828 | 1534 85% | 1248 51% | 1118 35% | 1412 71% | 1633 97% |
| Score Write (Points) | 916 | 1478 61% | 1029 12% | 930 2% | 1289 41% | 1519 66% |
| Score Total (Points) | 2145 | 3753 75% | 2862 33% | 2581 20% | 3392 58% | 3962 85% |

| 3DMark - 1920x1080 Fire Strike Graphics | |
| Genomsnitt av klass Gaming (12242 - 62849, n=116, senaste 2 åren) | |
| Aorus X9 | |
| Acer Predator 17 X GX-792-76DL | |
| Aorus X9 DT | |
| Asus G703 | |
| MSI GT75VR 7RF-012 Titan Pro | |
| HP Omen X 17-ap0xx | |
| 3DMark 06 Standard Score | 40395 poäng | |
| 3DMark 11 Performance | 22703 poäng | |
| 3DMark Ice Storm Standard Score | 194505 poäng | |
| 3DMark Cloud Gate Standard Score | 42659 poäng | |
| 3DMark Fire Strike Score | 19250 poäng | |
Hjälp | ||
| The Witcher 3 - 1920x1080 Ultra Graphics & Postprocessing (HBAO+) | |
| Genomsnitt av klass Gaming (104.7 - 240, n=7, senaste 2 åren) | |
| Aorus X9 | |
| Asus G703 | |
| Aorus X9 DT | |
| MSI GT75VR 7RF-012 Titan Pro | |
| Acer Predator 17 X GX-792-76DL | |
| HP Omen X 17-ap0xx | |
| låg | med. | hög | ultra | |
|---|---|---|---|---|
| The Witcher 3 (2015) | 146 | 77.4 | ||
| Dirt 4 (2017) | 157 | 105 | ||
| F1 2017 (2017) | 167 | 115 | ||
| Middle-earth: Shadow of War (2017) | 126 | 99 | ||
| The Evil Within 2 (2017) | 77.7 | 75.3 | ||
| ELEX (2017) | 121 | 99.2 | ||
| Wolfenstein II: The New Colossus (2017) | 139 | 123 | ||
| Assassin´s Creed Origins (2017) | 107 | 86 | ||
| Call of Duty WWII (2017) | 175 | 149 | ||
| Fortnite (2018) | 207 | 160 | ||
| Final Fantasy XV Benchmark (2018) | 77.6 | |||
| Kingdom Come: Deliverance (2018) | 104 | 77.5 | ||
| Far Cry 5 (2018) | 120 | 113 |
Ljudnivå
| Låg belastning |
| 36 / 37 / 43 dB(A) |
| Hårddisk |
| 33 dB(A) |
| Hög belastning |
| 50 / 61 dB(A) |
 | ||
30 dB tyst 40 dB(A) hörbar 50 dB(A) högt ljud |
||
min: | ||
| Aorus X9 DT GeForce GTX 1080 Mobile, i9-8950HK | Aorus X9 GeForce GTX 1070 SLI (Laptop), i7-7820HK | HP Omen X 17-ap0xx GeForce GTX 1080 Mobile, i7-7820HK | Acer Predator 17 X GX-792-76DL GeForce GTX 1080 Mobile, i7-7820HK | MSI GT75VR 7RF-012 Titan Pro GeForce GTX 1080 Mobile, i7-7820HK | Asus G703 GeForce GTX 1080 Mobile, i7-7820HK | Genomsnitt av klass Gaming | |
|---|---|---|---|---|---|---|---|
| Noise | 1% | 17% | 11% | 6% | 8% | 21% | |
| av / miljö * (dB) | 30 | 30 -0% | 28.3 6% | 30 -0% | 30 -0% | 30 -0% | 24.1 ? 20% |
| Idle Minimum * (dB) | 36 | 35 3% | 31.5 12% | 33 8% | 33 8% | 35 3% | 26 ? 28% |
| Idle Average * (dB) | 37 | 37 -0% | 31.6 15% | 35 5% | 34 8% | 36 3% | 27.5 ? 26% |
| Idle Maximum * (dB) | 43 | 43 -0% | 31.6 27% | 37 14% | 38 12% | 38 12% | 30.1 ? 30% |
| Load Average * (dB) | 50 | 49 2% | 36.8 26% | 40 20% | 44 12% | 46 8% | 43.8 ? 12% |
| Witcher 3 ultra * (dB) | 57 | 56 2% | 48.2 15% | 56 2% | 48 16% | ||
| Load Maximum * (dB) | 61 | 60 2% | 52.1 15% | 50 18% | 62 -2% | 54 11% | 54.3 ? 11% |
* ... mindre är bättre
(±) Den maximala temperaturen på ovansidan är 43 °C / 109 F, jämfört med genomsnittet av 40.4 °C / 105 F , allt från 21.2 till 68.8 °C för klassen Gaming.
(-) Botten värms upp till maximalt 55 °C / 131 F, jämfört med genomsnittet av 43.2 °C / 110 F
(+) Vid tomgångsbruk är medeltemperaturen för ovansidan 25.2 °C / 77 F, jämfört med enhetsgenomsnittet på 33.9 °C / ### class_avg_f### F.
(±) När du spelar The Witcher 3 är medeltemperaturen för ovansidan 37.8 °C / 100 F, jämfört med enhetsgenomsnittet på 33.9 °C / ## #class_avg_f### F.
(±) Handledsstöden och pekplattan kan bli väldigt varma vid beröring med maximalt 38 °C / 100.4 F.
(-) Medeltemperaturen för handledsstödsområdet på liknande enheter var 28.8 °C / 83.8 F (-9.2 °C / -16.6 F).
| Aorus X9 DT GeForce GTX 1080 Mobile, i9-8950HK | Aorus X9 GeForce GTX 1070 SLI (Laptop), i7-7820HK | HP Omen X 17-ap0xx GeForce GTX 1080 Mobile, i7-7820HK | Acer Predator 17 X GX-792-76DL GeForce GTX 1080 Mobile, i7-7820HK | MSI GT75VR 7RF-012 Titan Pro GeForce GTX 1080 Mobile, i7-7820HK | Asus G703 GeForce GTX 1080 Mobile, i7-7820HK | Genomsnitt av klass Gaming | |
|---|---|---|---|---|---|---|---|
| Heat | -9% | 16% | -4% | -15% | -11% | -7% | |
| Maximum Upper Side * (°C) | 43 | 47 -9% | 35.6 17% | 44.2 -3% | 46 -7% | 55 -28% | 45.2 ? -5% |
| Maximum Bottom * (°C) | 55 | 62 -13% | 39 29% | 43 22% | 57 -4% | 54 2% | 48.2 ? 12% |
| Idle Upper Side * (°C) | 27 | 30 -11% | 24.2 10% | 32.4 -20% | 34 -26% | 29 -7% | 31 ? -15% |
| Idle Bottom * (°C) | 29 | 30 -3% | 27.4 6% | 32.8 -13% | 35 -21% | 32 -10% | 34.2 ? -18% |
* ... mindre är bättre
Aorus X9 DT ljudanalys
(±) | högtalarljudstyrkan är genomsnittlig men bra (78 dB)
Bas 100 - 315 Hz
(±) | reducerad bas - i genomsnitt 9.3% lägre än medianen
(±) | linjäriteten för basen är genomsnittlig (9.6% delta till föregående frekvens)
Mellan 400 - 2000 Hz
(+) | balanserad mellan - endast 2.5% från medianen
(+) | mids är linjära (3.9% delta till föregående frekvens)
Högsta 2 - 16 kHz
(±) | reducerade toppar - i genomsnitt 5.2% lägre än medianen
(±) | linjäriteten för toppar är genomsnittlig (7.4% delta till föregående frekvens)
Totalt 100 - 16 000 Hz
(+) | det totala ljudet är linjärt (14.4% skillnad mot median)
Jämfört med samma klass
» 27% av alla testade enheter i den här klassen var bättre, 8% liknande, 66% sämre
» Den bästa hade ett delta på 6%, genomsnittet var 18%, sämst var 132%
Jämfört med alla testade enheter
» 18% av alla testade enheter var bättre, 4% liknande, 78% sämre
» Den bästa hade ett delta på 4%, genomsnittet var 23%, sämst var 134%
HP Omen X 17-ap0xx ljudanalys
(-) | inte särskilt höga högtalare (65.7 dB)
Bas 100 - 315 Hz
(-) | nästan ingen bas - i genomsnitt 18.1% lägre än medianen
(±) | linjäriteten för basen är genomsnittlig (9.9% delta till föregående frekvens)
Mellan 400 - 2000 Hz
(+) | balanserad mellan - endast 3.4% från medianen
(+) | mids är linjära (6.3% delta till föregående frekvens)
Högsta 2 - 16 kHz
(+) | balanserade toppar - endast 2.3% från medianen
(±) | linjäriteten för toppar är genomsnittlig (9.8% delta till föregående frekvens)
Totalt 100 - 16 000 Hz
(±) | linjäriteten för det totala ljudet är genomsnittlig (22.3% skillnad mot median)
Jämfört med samma klass
» 80% av alla testade enheter i den här klassen var bättre, 6% liknande, 14% sämre
» Den bästa hade ett delta på 6%, genomsnittet var 18%, sämst var 132%
Jämfört med alla testade enheter
» 65% av alla testade enheter var bättre, 6% liknande, 29% sämre
» Den bästa hade ett delta på 4%, genomsnittet var 23%, sämst var 134%
| Av/Standby | |
| Låg belastning | |
| Hög belastning |
|
Förklaring:
min: | |
| Aorus X9 DT GeForce GTX 1080 Mobile, i9-8950HK | Aorus X9 GeForce GTX 1070 SLI (Laptop), i7-7820HK | HP Omen X 17-ap0xx GeForce GTX 1080 Mobile, i7-7820HK | Acer Predator 17 X GX-792-76DL GeForce GTX 1080 Mobile, i7-7820HK | MSI GT75VR 7RF-012 Titan Pro GeForce GTX 1080 Mobile, i7-7820HK | Asus G703 GeForce GTX 1080 Mobile, i7-7820HK | Genomsnitt av klass Gaming | |
|---|---|---|---|---|---|---|---|
| Power Consumption | -7% | 26% | 10% | -8% | 4% | 33% | |
| Idle Minimum * (Watt) | 28 | 29 -4% | 21.6 23% | 27 4% | 34 -21% | 26 7% | 13 ? 54% |
| Idle Average * (Watt) | 37 | 35 5% | 26.4 29% | 32 14% | 41 -11% | 30 19% | 19 ? 49% |
| Idle Maximum * (Watt) | 40 | 42 -5% | 26.6 33% | 41 -2% | 50 -25% | 37 7% | 24.5 ? 39% |
| Load Average * (Watt) | 109 | 140 -28% | 95.6 12% | 102 6% | 106 3% | 123 -13% | 111.1 ? -2% |
| Witcher 3 ultra * (Watt) | 256 | 295 -15% | 221.7 13% | 257 -0% | 257 -0% | ||
| Load Maximum * (Watt) | 353 | 334 5% | 199.6 43% | 248 30% | 320 9% | 341 3% | 260 ? 26% |
* ... mindre är bättre
| Aorus X9 DT GeForce GTX 1080 Mobile, i9-8950HK, 94.24 Wh | Aorus X9 GeForce GTX 1070 SLI (Laptop), i7-7820HK, 94.24 Wh | HP Omen X 17-ap0xx GeForce GTX 1080 Mobile, i7-7820HK, 99 Wh | Acer Predator 17 X GX-792-76DL GeForce GTX 1080 Mobile, i7-7820HK, 88.8 Wh | MSI GT75VR 7RF-012 Titan Pro GeForce GTX 1080 Mobile, i7-7820HK, 75 Wh | Asus G703 GeForce GTX 1080 Mobile, i7-7820HK, 71 Wh | Genomsnitt av klass Gaming | |
|---|---|---|---|---|---|---|---|
| Batteridrifttid | -23% | 56% | 23% | -23% | -25% | 78% | |
| Reader / Idle (h) | 4.2 | 2.9 -31% | 5.8 38% | 5.2 24% | 3 -29% | 3.3 -21% | 8.27 ? 97% |
| WiFi v1.3 (h) | 3.2 | 2.2 -31% | 5.6 75% | 4.2 31% | 2.4 -25% | 2.5 -22% | 7.11 ? 122% |
| Load (h) | 1.3 | 1.2 -8% | 2 54% | 1.5 15% | 1.1 -15% | 0.9 -31% | 1.502 ? 16% |
| H.264 (h) | 2.3 | 3.4 | 2.5 | 2.4 | 8.32 ? |
För
Emot
Läs den fullständiga versionen av den här recensionen på engelska här.
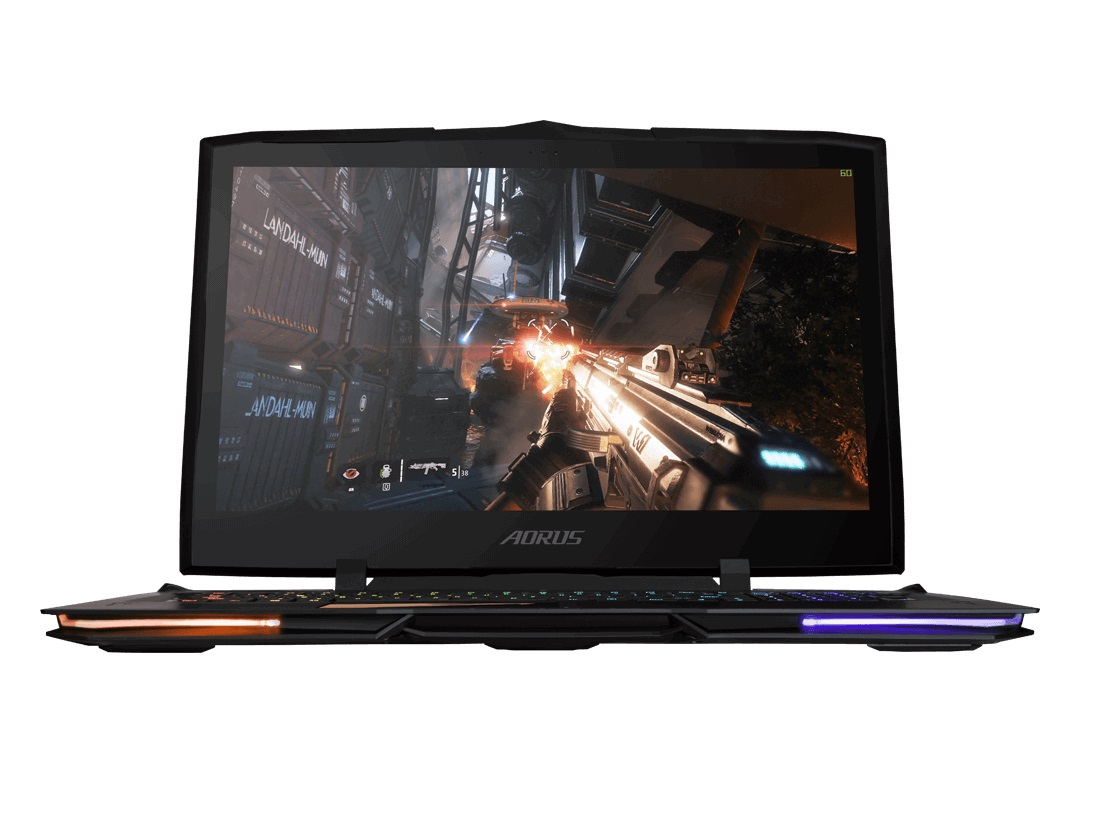
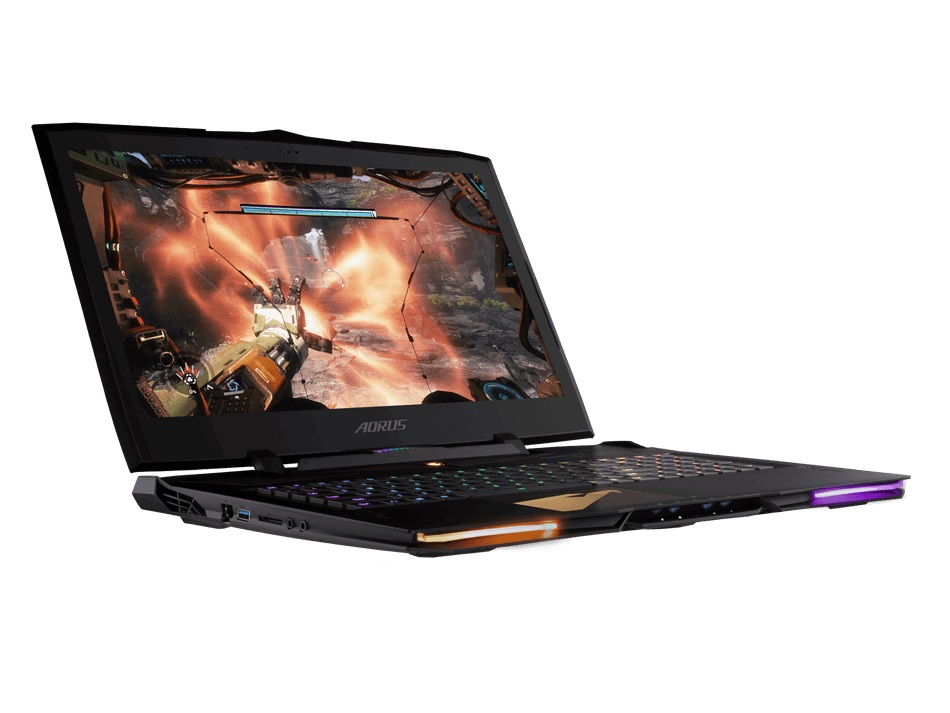
2018 års version av Gigabyte Aorus X9 DT är en blandad kompott. Ja, jämfört med andra toppskikts-modeller för spel så är höljet behagligt tunt (3 cm) och ja, med en vikt på bara 3.7 kg är den dessutom jämförelsevis lätt. Men platsbesparingen kommer på bekostnad av kylprestandan.
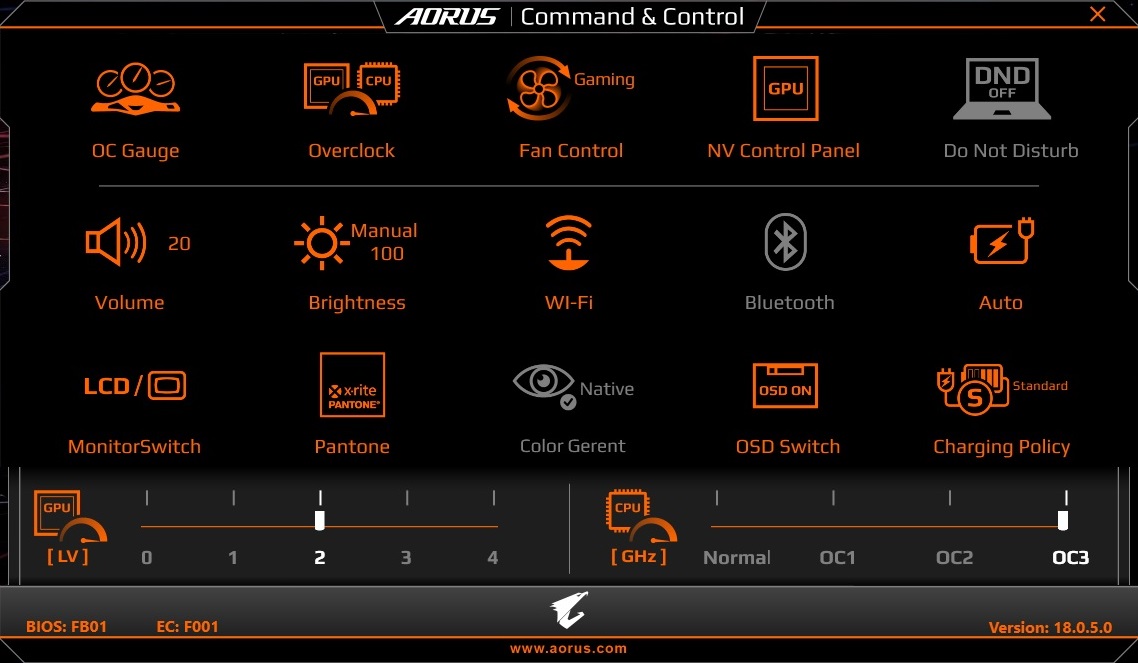
När "Gaming"-läget är aktiverat och med en lätt överklockning inställd så blir denna laptop på 17 tum så enormt högljudd av det helt och hållet förstörde upplevelsen. Med dom inställningarna så har Aorus X9 DT satt ett nytt rekord och sänkt den nedre gränsen avsevärt. Som tur är var "Normal"- och "Quiet"-lägena mycket bättre.
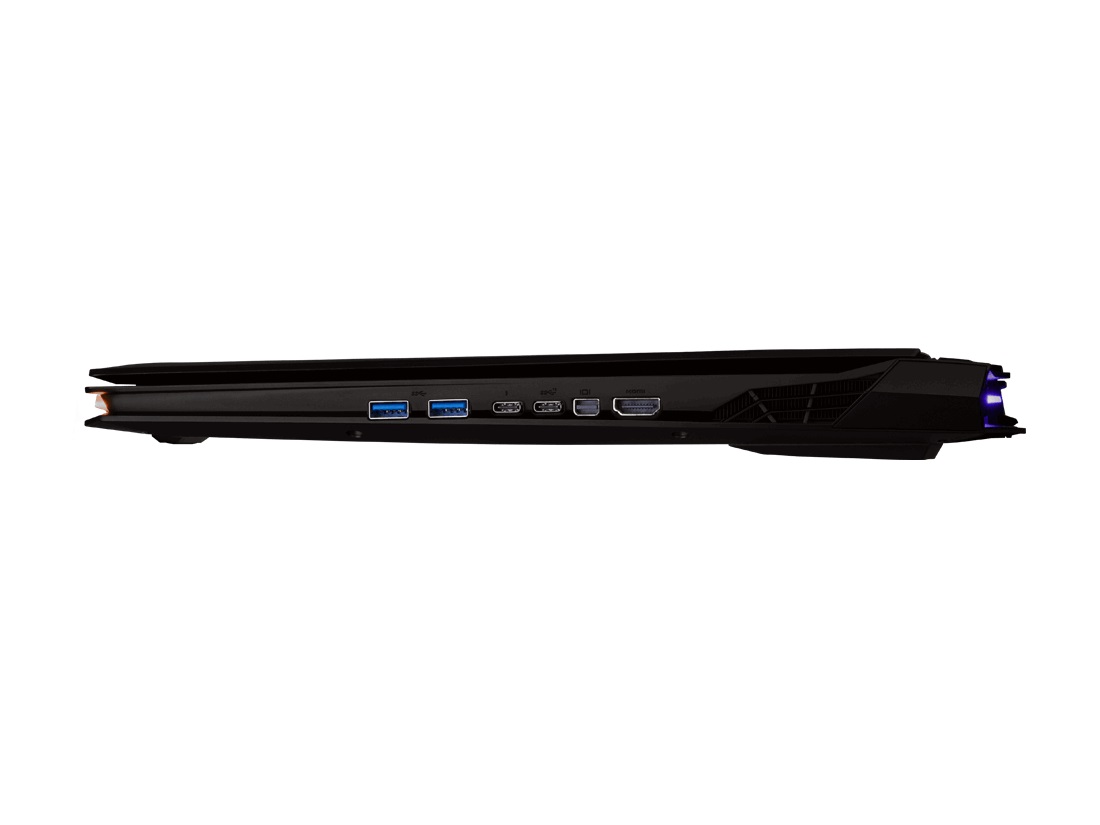
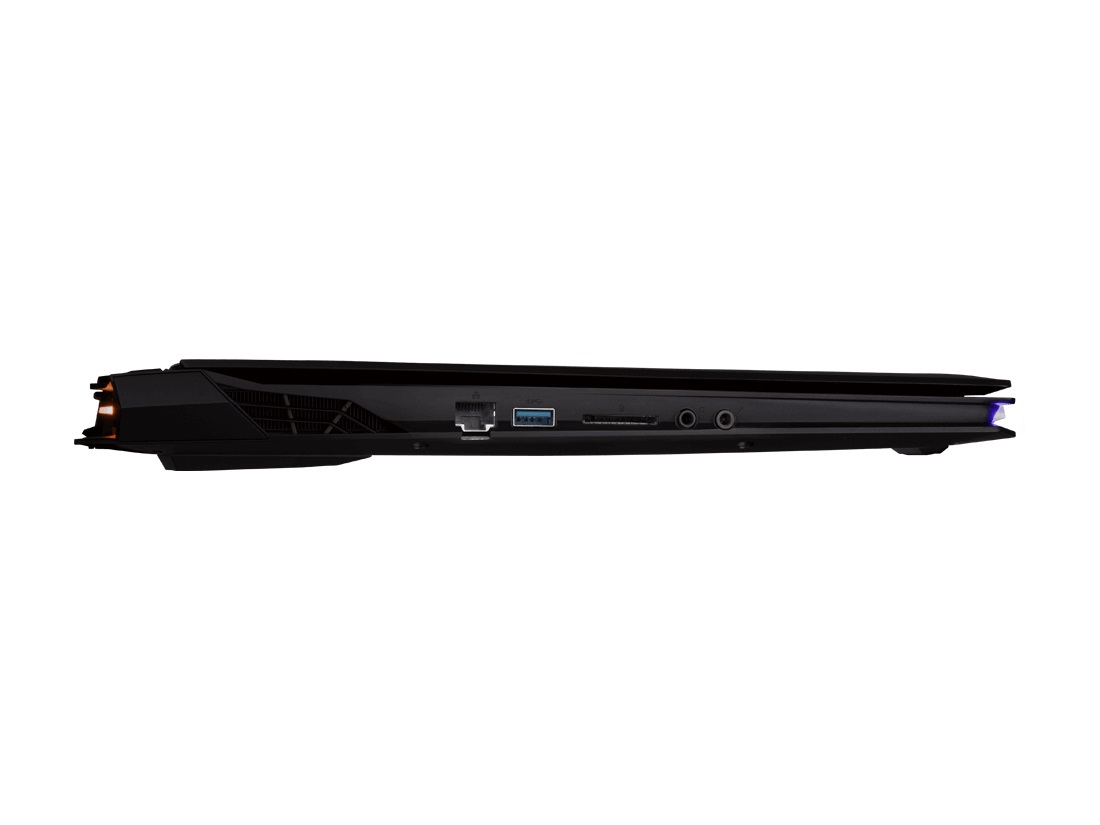
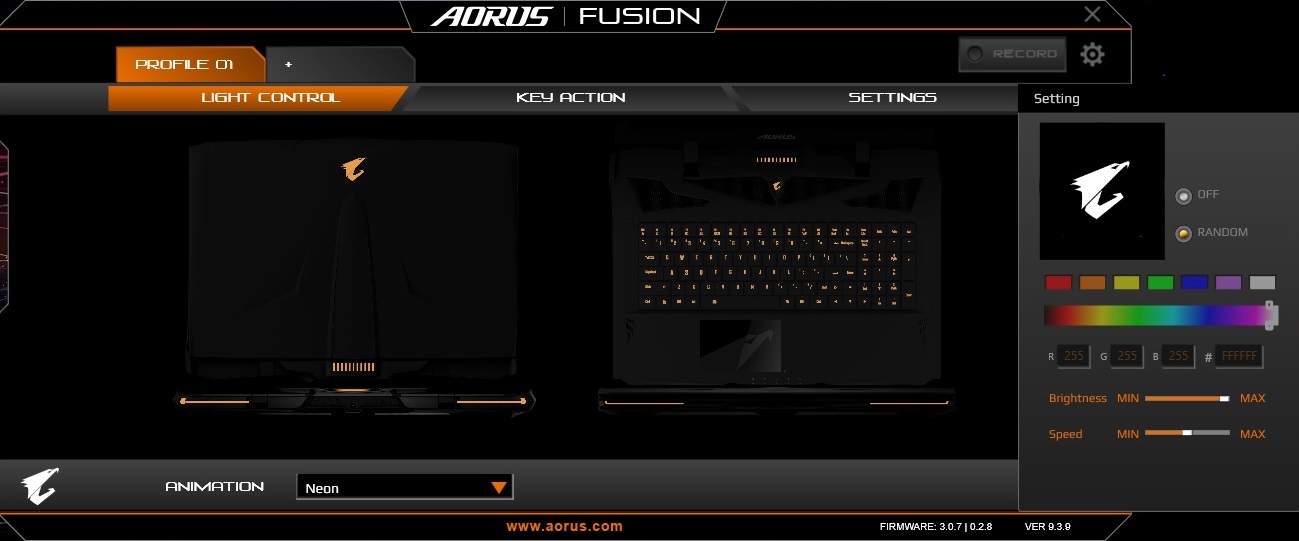
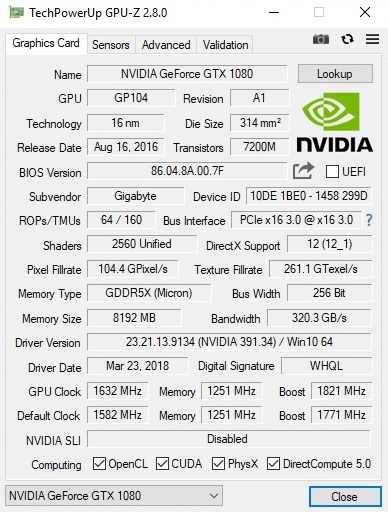
Bortsett från dom extremt höga ljudnivåerna så har Gigabyte gjort ett ganska bra jobb. Det mekaniska tangentbordet med tydlig återkoppling och ljusstark RGB-bakgrundsbelysning var ett nöje att använda. Anslutbarheten var hyfsad och inkluderar Thunderbolt 3. Och 144 Hz-skärmen i kombination med Core i9-8950HK, GeForce GTX 1080, and Nvidias G-Sync teknologi var definitivt en höjdpunkt.
Aorus X9 DT
- 04/16/2018 v6 (old)
Florian Glaser
Price comparison