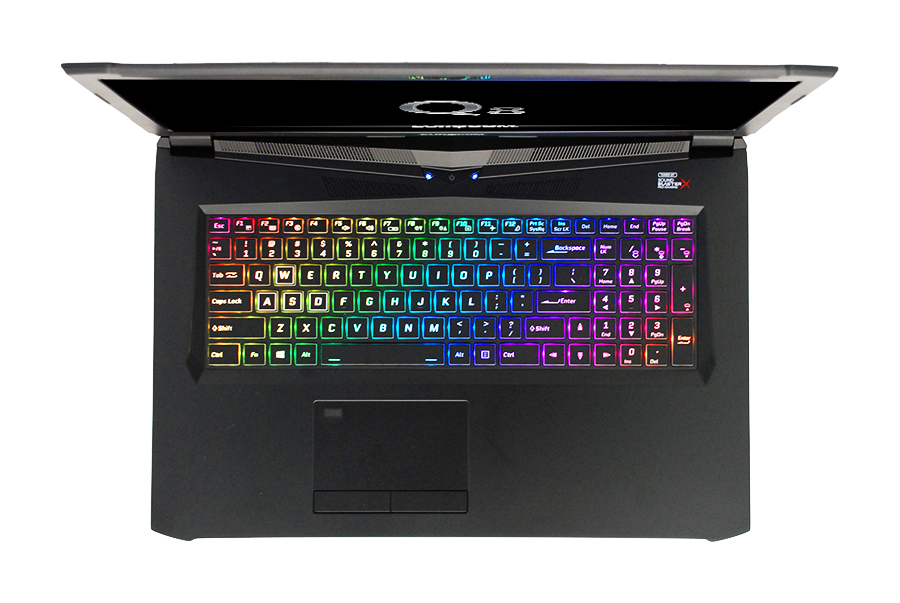
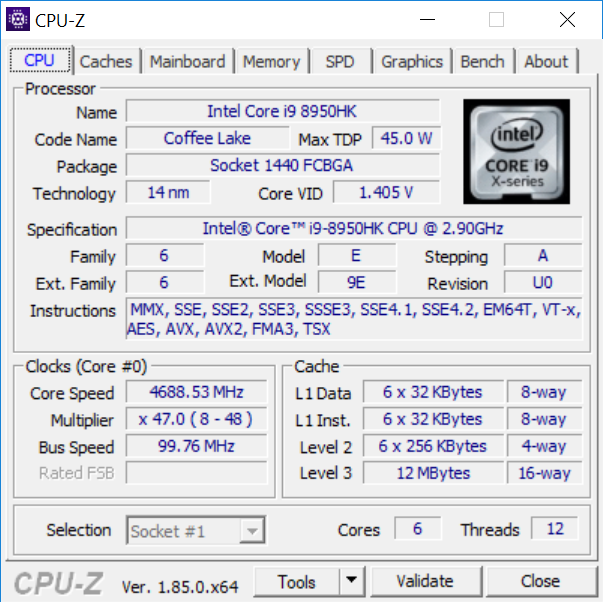
Test: Eurocom Q8 (i9-8950HK, GTX 1070, QHD) Laptop (Sammanfattning)
| SD Card Reader | |
| average JPG Copy Test (av. of 3 runs) | |
| Aorus X7 v7 (Toshiba Exceria Pro SDXC 64 GB UHS-II) | |
| Eurocom Q8 (Toshiba Exceria Pro SDXC 64 GB UHS-II) | |
| MSI GS73VR 7RG (Toshiba Exceria Pro SDXC 64 GB UHS-II) | |
| Asus GL703GE-ES73 (Toshiba Exceria Pro SDXC 64 GB UHS-II) | |
| maximum AS SSD Seq Read Test (1GB) | |
| Aorus X7 v7 (Toshiba Exceria Pro SDXC 64 GB UHS-II) | |
| MSI GS73VR 7RG (Toshiba Exceria Pro SDXC 64 GB UHS-II) | |
| Eurocom Q8 (Toshiba Exceria Pro SDXC 64 GB UHS-II) | |
| Asus GL703GE-ES73 (Toshiba Exceria Pro SDXC 64 GB UHS-II) | |
| Networking | |
| iperf3 transmit AX12 | |
| Eurocom Q8 | |
| Asus Zephyrus M GM501 | |
| Aorus X7 v7 | |
| MSI GS73VR 7RG | |
| iperf3 receive AX12 | |
| Asus Zephyrus M GM501 | |
| Eurocom Q8 | |
| MSI GS73VR 7RG | |
| Aorus X7 v7 | |
| |||||||||||||||||||||||||
Distribution av ljusstyrkan: 84 %
Mitt på batteriet: 367.9 cd/m²
Kontrast: 669:1 (Svärta: 0.55 cd/m²)
ΔE ColorChecker Calman: 9.86 | ∀{0.5-29.43 Ø4.72}
calibrated: 4.43
ΔE Greyscale Calman: 12.4 | ∀{0.09-98 Ø4.97}
80.5% sRGB (Argyll 1.6.3 3D)
52.5% AdobeRGB 1998 (Argyll 1.6.3 3D)
58.9% AdobeRGB 1998 (Argyll 3D)
81% sRGB (Argyll 3D)
58.7% Display P3 (Argyll 3D)
Gamma: 2.09
CCT: 11064 K
| Eurocom Q8 AU Optronics B173QTN01.0, Dell P/N WJGD4, TN LED, 17.3", 2560x1440 | MSI GS73VR 7RG ID: CMN1747, Name: Chi Mei N173HHE-G32, TN LED, 17.3", 1920x1080 | Asus GL703GE-ES73 Chi Mei CMN1747, TN, 17.3", 1920x1080 | Razer Blade Pro RZ09-0220 ID: AUO169D, Name: AU Optronics B173HAN01.6, IPS, 17.3", 1920x1080 | Alienware 17 R4 TN LED, 17.3", 2560x1440 | Aorus X7 v7 AU Optronics B173QTN01.4 (AUO1496), TN LED, 17.3", 2560x1440 | |
|---|---|---|---|---|---|---|
| Display | 41% | 39% | 10% | 3% | 8% | |
| Display P3 Coverage (%) | 58.7 | 89.6 53% | 90.1 53% | 64 9% | 61.2 4% | 63 7% |
| sRGB Coverage (%) | 81 | 100 23% | 99.8 23% | 89.7 11% | 82.9 2% | 87.1 8% |
| AdobeRGB 1998 Coverage (%) | 58.9 | 86.9 48% | 83.1 41% | 64.9 10% | 60.5 3% | 63.7 8% |
| Response Times | -1% | 24% | -192% | -41% | 11% | |
| Response Time Grey 50% / Grey 80% * (ms) | 21.6 ? | 23.6 ? -9% | 11.6 ? 46% | 36.8 ? -70% | 30 ? -39% | 24 ? -11% |
| Response Time Black / White * (ms) | 9 ? | 8.4 ? 7% | 8.8 ? 2% | 37.2 ? -313% | 12.8 ? -42% | 6 ? 33% |
| PWM Frequency (Hz) | 26040 ? | 26040 ? | ||||
| Screen | 20% | 36% | 32% | 16% | 15% | |
| Brightness middle (cd/m²) | 367.9 | 350.9 -5% | 331.1 -10% | 367.4 0% | 402.3 9% | 375 2% |
| Brightness (cd/m²) | 346 | 311 -10% | 312 -10% | 363 5% | 372 8% | 353 2% |
| Brightness Distribution (%) | 84 | 79 -6% | 86 2% | 86 2% | 86 2% | 85 1% |
| Black Level * (cd/m²) | 0.55 | 0.33 40% | 0.31 44% | 0.32 42% | 0.62 -13% | 0.58 -5% |
| Contrast (:1) | 669 | 1063 59% | 1068 60% | 1148 72% | 649 -3% | 647 -3% |
| Colorchecker dE 2000 * | 9.86 | 7.7 22% | 2.86 71% | 3.8 61% | 5.6 43% | 6.06 39% |
| Colorchecker dE 2000 max. * | 17.56 | 14.4 18% | 6.35 64% | 10.4 41% | 9.8 44% | 10.54 40% |
| Colorchecker dE 2000 calibrated * | 4.43 | 2.66 40% | ||||
| Greyscale dE 2000 * | 12.4 | 11.1 10% | 4.3 65% | 3.5 72% | 4.7 62% | 5.68 54% |
| Gamma | 2.09 105% | 2.11 104% | 2.268 97% | 2.18 101% | 2.14 103% | 2.3 96% |
| CCT | 11064 59% | 11813 55% | 7034 92% | 6467 101% | 7519 86% | 7998 81% |
| Color Space (Percent of AdobeRGB 1998) (%) | 52.5 | 77.74 48% | 75 43% | 58.1 11% | 53.7 2% | 57 9% |
| Color Space (Percent of sRGB) (%) | 80.5 | 100 24% | 100 24% | 89.3 11% | 82.2 2% | 87 8% |
| Totalt genomsnitt (program/inställningar) | 20% /
21% | 33% /
35% | -50% /
-2% | -7% /
6% | 11% /
13% |
* ... mindre är bättre
Visa svarstider
| ↔ Svarstid svart till vitt | ||
|---|---|---|
| 9 ms ... stiga ↗ och falla ↘ kombinerat | ↗ 6.8 ms stiga | 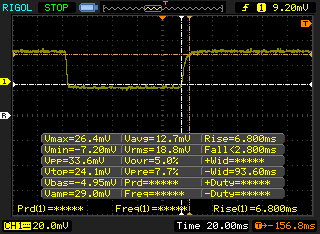 |
| ↘ 2.2 ms hösten | ||
| Skärmen visar snabba svarsfrekvenser i våra tester och bör passa för spel. I jämförelse sträcker sig alla testade enheter från 0.1 (minst) till 240 (maximalt) ms. » 25 % av alla enheter är bättre. Det betyder att den uppmätta svarstiden är bättre än genomsnittet av alla testade enheter (19.8 ms). | ||
| ↔ Svarstid 50 % grått till 80 % grått | ||
| 21.6 ms ... stiga ↗ och falla ↘ kombinerat | ↗ 12.4 ms stiga | 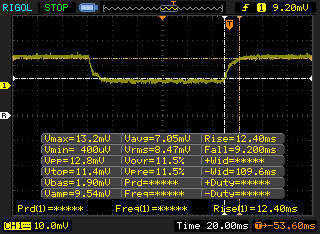 |
| ↘ 9.2 ms hösten | ||
| Skärmen visar bra svarsfrekvens i våra tester, men kan vara för långsam för konkurrenskraftiga spelare. I jämförelse sträcker sig alla testade enheter från 0.165 (minst) till 636 (maximalt) ms. » 33 % av alla enheter är bättre. Det betyder att den uppmätta svarstiden är bättre än genomsnittet av alla testade enheter (31 ms). | ||
Skärmflimmer / PWM (Puls-Width Modulation)
| Skärmflimmer / PWM upptäcktes inte | 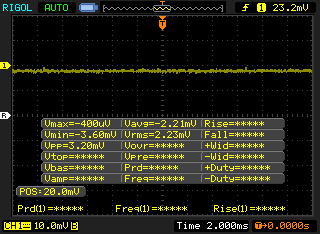 | ||
Som jämförelse: 52 % av alla testade enheter använder inte PWM för att dämpa skärmen. Om PWM upptäcktes mättes ett medelvärde av 7763 (minst: 5 - maximum: 343500) Hz. | |||
| Cinebench R15 | |
| CPU Single 64Bit | |
| Eurocom Q8 | |
| Genomsnitt Intel Core i9-8950HK (185 - 206, n=14) | |
| Eurocom Sky X4C | |
| Intel Hades Canyon NUC8i7HVK | |
| Eurocom Q6 | |
| Eurocom Sky X7E2 | |
| Eurocom Sky MX5 R3 | |
| Eurocom Q5 | |
| Asus GL702ZC-GC104T | |
| Apple MacBook Pro 15 2016 (2.6 GHz, 450) | |
| CPU Multi 64Bit | |
| Asus GL702ZC-GC104T | |
| Eurocom Sky X4C | |
| Genomsnitt Intel Core i9-8950HK (1051 - 1391, n=14) | |
| Eurocom Q8 | |
| Eurocom Q6 | |
| Eurocom Sky X7E2 | |
| Intel Hades Canyon NUC8i7HVK | |
| Eurocom Sky MX5 R3 | |
| Eurocom Q5 | |
| Apple MacBook Pro 15 2016 (2.6 GHz, 450) | |
| PCMark 10 - Score | |
| Eurocom Sky X4C | |
| Eurocom Q8 | |
| Aorus X7 v7 | |
| HP Omen X 17-ap0xx | |
| MSI GS73VR 7RG | |
| Razer Blade Pro RZ09-0220 | |
| Apple MacBook Pro 15 2017 (2.9 GHz, 560) | |
| PCMark 8 - Home Score Accelerated v2 | |
| Eurocom Sky X4C | |
| HP Omen X 17-ap0xx | |
| Eurocom Q8 | |
| Aorus X7 v7 | |
| Alienware 17 R4 | |
| MSI GS73VR 7RG | |
| Razer Blade Pro RZ09-0220 | |
| Apple MacBook Pro 15 2017 (2.9 GHz, 560) | |
| PCMark 8 Home Score Accelerated v2 | 5111 poäng | |
| PCMark 10 Score | 6331 poäng | |
Hjälp | ||
| Eurocom Q8 Samsung SSD 960 Pro 512 GB m.2 | MSI GS73VR 7RG Samsung SSD PM871 MZNLN512HMJP | Razer Blade Pro RZ09-0220 Samsung SSD PM951 MZVLV256HCHP | Alienware 17 R4 SK Hynix PC300 NVMe 512 GB | Aorus X7 v7 Samsung SM961 MZVPW256HEGL | |
|---|---|---|---|---|---|
| AS SSD | -52% | -36% | -44% | -7% | |
| Copy Game MB/s (MB/s) | 958 | 381.5 -60% | 724 -24% | 574 -40% | 758 -21% |
| Copy Program MB/s (MB/s) | 406.7 | 229.8 -43% | 228.3 -44% | 446.1 10% | 327.2 -20% |
| Copy ISO MB/s (MB/s) | 1596 | 423.5 -73% | 1193 -25% | 1227 -23% | 1504 -6% |
| Score Total (Points) | 3840 | 1064 -72% | 1951 -49% | 2072 -46% | 3668 -4% |
| Score Write (Points) | 1579 | 417 -74% | 406 -74% | 858 -46% | 1021 -35% |
| Score Read (Points) | 1515 | 421 -72% | 1056 -30% | 831 -45% | 1803 19% |
| Access Time Write * (ms) | 0.035 | 0.032 9% | 0.034 3% | 0.123 -251% | 0.031 11% |
| Access Time Read * (ms) | 0.043 | 0.051 -19% | 0.06 -40% | 0.042 2% | 0.059 -37% |
| 4K-64 Write (MB/s) | 1285 | 273.6 -79% | 267.2 -79% | 671 -48% | 791 -38% |
| 4K-64 Read (MB/s) | 1232 | 337.7 -73% | 871 -29% | 620 -50% | 1485 21% |
| 4K Write (MB/s) | 107.9 | 96.8 -10% | 109.9 2% | 113.4 5% | 123.3 14% |
| 4K Read (MB/s) | 35.57 | 33.69 -5% | 38.31 8% | 35.61 0% | 48.35 36% |
| Seq Write (MB/s) | 1869 | 465.1 -75% | 291.8 -84% | 735 -61% | 1067 -43% |
| Seq Read (MB/s) | 2481 | 497.9 -80% | 1464 -41% | 1752 -29% | 2690 8% |
* ... mindre är bättre

| 3DMark 11 | |
| 1280x720 Performance GPU | |
| Eurocom Sky X4C | |
| Nvidia GeForce GTX 1070 Founders Edition | |
| Genomsnitt NVIDIA GeForce GTX 1070 Mobile (13760 - 25604, n=58) | |
| Eurocom Q8 | |
| Eurocom Q6 | |
| MSI GV62 8RE-016US | |
| Asus Strix GL502VY-DS71 | |
| Dell XPS 15 2018 i5 FHD 97Wh | |
| 1280x720 Performance Combined | |
| Eurocom Sky X4C | |
| Eurocom Q8 | |
| Nvidia GeForce GTX 1070 Founders Edition | |
| Eurocom Q6 | |
| Genomsnitt NVIDIA GeForce GTX 1070 Mobile (7137 - 12565, n=58) | |
| Asus Strix GL502VY-DS71 | |
| MSI GV62 8RE-016US | |
| Dell XPS 15 2018 i5 FHD 97Wh | |
| 3DMark | |
| 1280x720 Cloud Gate Standard Graphics | |
| Eurocom Sky X4C | |
| Eurocom Q6 | |
| Nvidia GeForce GTX 1070 Founders Edition | |
| Genomsnitt NVIDIA GeForce GTX 1070 Mobile (64973 - 125922, n=51) | |
| MSI GV62 8RE-016US | |
| Asus Strix GL502VY-DS71 | |
| Dell XPS 15 2018 i5 FHD 97Wh | |
| 1920x1080 Fire Strike Graphics | |
| Eurocom Sky X4C | |
| Genomsnitt NVIDIA GeForce GTX 1070 Mobile (15718 - 19059, n=56) | |
| Nvidia GeForce GTX 1070 Founders Edition | |
| Eurocom Q6 | |
| MSI GV62 8RE-016US | |
| Asus Strix GL502VY-DS71 | |
| Dell XPS 15 2018 i5 FHD 97Wh | |
| 1920x1080 Ice Storm Extreme Graphics | |
| Eurocom Sky X4C | |
| Genomsnitt NVIDIA GeForce GTX 1070 Mobile (116033 - 368933, n=24) | |
| Asus Strix GL502VY-DS71 | |
| 3DMark 11 Performance | 18243 poäng | |
Hjälp | ||
| låg | med. | hög | ultra | |
|---|---|---|---|---|
| BioShock Infinite (2013) | 384.1 | 316.2 | 291.1 | 154.2 |
| The Witcher 3 (2015) | 48.2 |
Ljudnivå
| Låg belastning |
| 28.2 / 31.8 / 36.3 dB(A) |
| Hög belastning |
| 46.7 / 49.7 dB(A) |
 | ||
30 dB tyst 40 dB(A) hörbar 50 dB(A) högt ljud |
||
min: | ||
| Eurocom Q8 GeForce GTX 1070 Mobile, i9-8950HK, Samsung SSD 960 Pro 512 GB m.2 | Eurocom Sky X4C GeForce GTX 1080 Mobile, i7-8700K, Samsung SSD 960 Pro 1TB m.2 NVMe | Razer Blade Pro RZ09-0220 GeForce GTX 1060 Mobile, i7-7700HQ, Samsung SSD PM951 MZVLV256HCHP | Alienware 17 R4 GeForce GTX 1080 Mobile, i7-7820HK, SK Hynix PC300 NVMe 512 GB | Aorus X7 v7 GeForce GTX 1070 Mobile, i7-7820HK, Samsung SM961 MZVPW256HEGL | MSI GS73VR 7RG GeForce GTX 1070 Max-Q, i7-7700HQ, Samsung SSD PM871 MZNLN512HMJP | |
|---|---|---|---|---|---|---|
| Noise | 2% | 7% | -7% | -6% | 4% | |
| av / miljö * (dB) | 28 | 28.6 -2% | 28.1 -0% | 28.2 -1% | 30 -7% | 28 -0% |
| Idle Minimum * (dB) | 28.2 | 28.6 -1% | 29.5 -5% | 35.6 -26% | 33 -17% | 29.4 -4% |
| Idle Average * (dB) | 31.8 | 28.6 10% | 29.6 7% | 35.6 -12% | 36 -13% | 30.7 3% |
| Idle Maximum * (dB) | 36.3 | 31.1 14% | 29.6 18% | 35.7 2% | 41 -13% | 34 6% |
| Load Average * (dB) | 46.7 | 42.2 10% | 31.6 32% | 50.2 -7% | 41 12% | 42 10% |
| Witcher 3 ultra * (dB) | 46.9 | 53.8 -15% | 46 2% | 50.2 -7% | 45 4% | 45.8 2% |
| Load Maximum * (dB) | 49.7 | 50 -1% | 51.8 -4% | 50.2 -1% | 52 -5% | 45.8 8% |
* ... mindre är bättre
(±) Den maximala temperaturen på ovansidan är 43.4 °C / 110 F, jämfört med genomsnittet av 40.4 °C / 105 F , allt från 21.2 till 68.8 °C för klassen Gaming.
(±) Botten värms upp till maximalt 44 °C / 111 F, jämfört med genomsnittet av 43.2 °C / 110 F
(+) Vid tomgångsbruk är medeltemperaturen för ovansidan 29.3 °C / 85 F, jämfört med enhetsgenomsnittet på 33.9 °C / ### class_avg_f### F.
(±) När du spelar The Witcher 3 är medeltemperaturen för ovansidan 34.7 °C / 94 F, jämfört med enhetsgenomsnittet på 33.9 °C / ## #class_avg_f### F.
(+) Handledsstöden och pekplattan är kallare än hudtemperaturen med maximalt 31 °C / 87.8 F och är därför svala att ta på.
(-) Medeltemperaturen för handledsstödsområdet på liknande enheter var 28.8 °C / 83.8 F (-2.2 °C / -4 F).
Eurocom Q8 ljudanalys
(-) | inte särskilt höga högtalare (66.6 dB)
Bas 100 - 315 Hz
(±) | reducerad bas - i genomsnitt 13.4% lägre än medianen
(±) | linjäriteten för basen är genomsnittlig (12.1% delta till föregående frekvens)
Mellan 400 - 2000 Hz
(±) | högre mellan - i genomsnitt 5.4% högre än median
(±) | linjäriteten för mids är genomsnittlig (12.1% delta till föregående frekvens)
Högsta 2 - 16 kHz
(+) | balanserade toppar - endast 4.3% från medianen
(±) | linjäriteten för toppar är genomsnittlig (11.5% delta till föregående frekvens)
Totalt 100 - 16 000 Hz
(-) | det totala ljudet är inte linjärt (30.3% skillnad mot median)
Jämfört med samma klass
» 96% av alla testade enheter i den här klassen var bättre, 2% liknande, 3% sämre
» Den bästa hade ett delta på 6%, genomsnittet var 18%, sämst var 132%
Jämfört med alla testade enheter
» 89% av alla testade enheter var bättre, 3% liknande, 9% sämre
» Den bästa hade ett delta på 4%, genomsnittet var 23%, sämst var 134%
Apple MacBook 12 (Early 2016) 1.1 GHz ljudanalys
(+) | högtalare kan spela relativt högt (83.6 dB)
Bas 100 - 315 Hz
(±) | reducerad bas - i genomsnitt 11.3% lägre än medianen
(±) | linjäriteten för basen är genomsnittlig (14.2% delta till föregående frekvens)
Mellan 400 - 2000 Hz
(+) | balanserad mellan - endast 2.4% från medianen
(+) | mids är linjära (5.5% delta till föregående frekvens)
Högsta 2 - 16 kHz
(+) | balanserade toppar - endast 2% från medianen
(+) | toppar är linjära (4.5% delta till föregående frekvens)
Totalt 100 - 16 000 Hz
(+) | det totala ljudet är linjärt (10.2% skillnad mot median)
Jämfört med samma klass
» 7% av alla testade enheter i den här klassen var bättre, 2% liknande, 91% sämre
» Den bästa hade ett delta på 5%, genomsnittet var 18%, sämst var 53%
Jämfört med alla testade enheter
» 5% av alla testade enheter var bättre, 1% liknande, 94% sämre
» Den bästa hade ett delta på 4%, genomsnittet var 23%, sämst var 134%
| Av/Standby | |
| Låg belastning | |
| Hög belastning |
|
Förklaring:
min: | |
| Eurocom Q8 i9-8950HK, GeForce GTX 1070 Mobile, Samsung SSD 960 Pro 512 GB m.2, TN LED, 2560x1440, 17.3" | Razer Blade Pro RZ09-0220 i7-7700HQ, GeForce GTX 1060 Mobile, Samsung SSD PM951 MZVLV256HCHP, IPS, 1920x1080, 17.3" | Alienware 17 R4 i7-7820HK, GeForce GTX 1080 Mobile, SK Hynix PC300 NVMe 512 GB, TN LED, 2560x1440, 17.3" | Aorus X7 v7 i7-7820HK, GeForce GTX 1070 Mobile, Samsung SM961 MZVPW256HEGL, TN LED, 2560x1440, 17.3" | Asus Strix GL703GM-DS74 i7-8750H, GeForce GTX 1060 Mobile, Samsung PM961 MZVLW256HEHP, TN LED, 1920x1080, 17.3" | |
|---|---|---|---|---|---|
| Power Consumption | 35% | -33% | -20% | 8% | |
| Idle Minimum * (Watt) | 26.3 | 10.6 60% | 37.5 -43% | 27 -3% | 18.88 28% |
| Idle Average * (Watt) | 29 | 16 45% | 37.6 -30% | 33 -14% | 24.36 16% |
| Idle Maximum * (Watt) | 32.3 | 16.4 49% | 37.6 -16% | 40 -24% | 32.27 -0% |
| Load Average * (Watt) | 82.4 | 75.9 8% | 122.4 -49% | 107 -30% | 107.74 -31% |
| Witcher 3 ultra * (Watt) | 192 | 111.2 42% | 180.3 6% | 190 1% | 142 26% |
| Load Maximum * (Watt) | 170.2 | 163.8 4% | 277.4 -63% | 259 -52% | 160.28 6% |
* ... mindre är bättre
| Eurocom Q8 i9-8950HK, GeForce GTX 1070 Mobile, 66 Wh | MSI GS73VR 7RG i7-7700HQ, GeForce GTX 1070 Max-Q, 51 Wh | Razer Blade Pro RZ09-0220 i7-7700HQ, GeForce GTX 1060 Mobile, 70 Wh | Alienware 17 R4 i7-7820HK, GeForce GTX 1080 Mobile, 99 Wh | Aorus X7 v7 i7-7820HK, GeForce GTX 1070 Mobile, 94 Wh | Asus Zephyrus M GM501 i7-8750H, GeForce GTX 1070 Mobile, 55 Wh | |
|---|---|---|---|---|---|---|
| Batteridrifttid | 23% | 169% | 15% | 15% | 4% | |
| WiFi v1.3 (h) | 2.6 | 3.2 23% | 7 169% | 3 15% | 3 15% | 2.7 4% |
| Reader / Idle (h) | 5.8 | 12 | 4.6 | 3.7 | 4 | |
| Load (h) | 1 | 1.2 | 1.2 | 1.4 | 1.2 |
För
Emot
Läs den fullständiga versionen av den här recensionen på engelska här.
Eurocom Q8 har ett utgångspris på 23.000 kronor för både i9-8950HK-processorn och GTX 1070 GPU:n. För spelsyften erbjuder Intels 8:e generations Coffee Lake-H CPU bara minimala ökningar i bilduppdatering jämfört med 7:e generationens Kaby Lake-alternativ. Det går eventuellt att spara pengar genom att överväga äldre laptops med Core i7-7700HQ och GTX 1070 och ändå få nästan samma prestanda i spel som med Eurocom Q8.
Det underliga strypningsbeteendet Q8 uppvisar när man spelar gör det svårt att för tillfället rekommendera systemet. Det är möjligt att detta bara påverkar vår specifika testenhet. Men oavsett så används inte dess Core i9 fullt ut och även om den hade kunnat göra det reflekterar den lilla spelfördelen jämfört med billigare modeller såsom i7-8750H eller till och med i7-7700HQ inte det mycket högre utgångspriset.
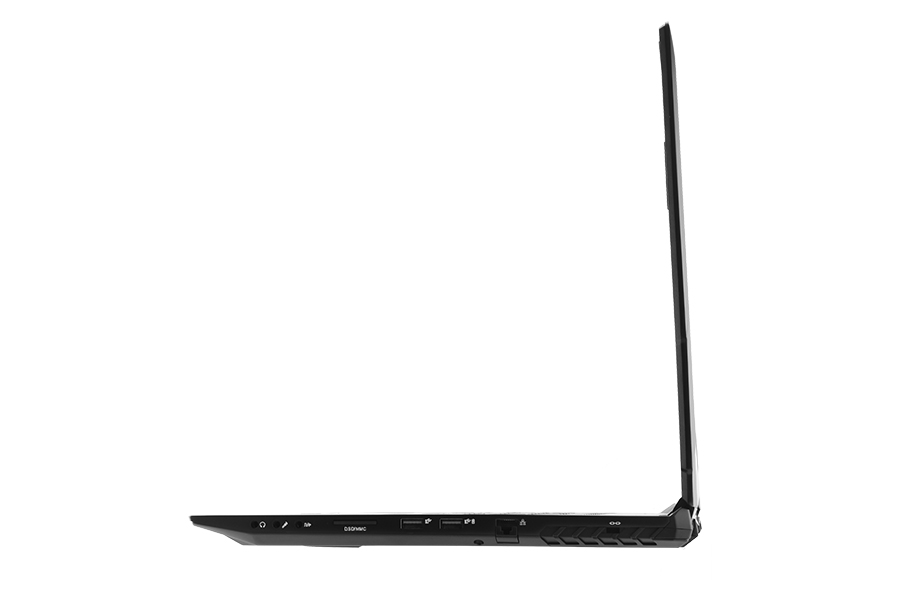
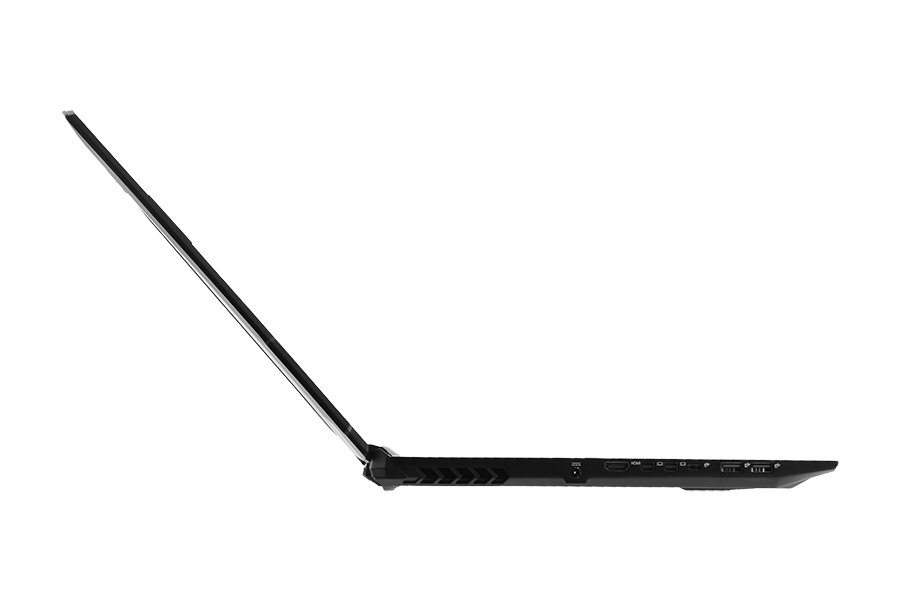
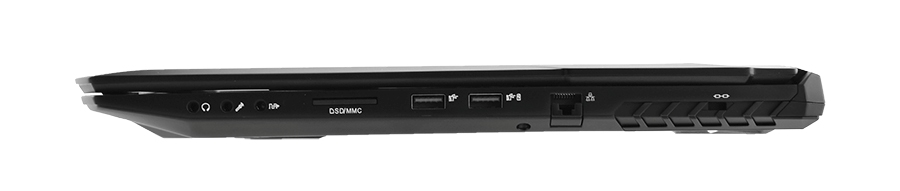
Eurocom Q8 lämnar ett bra första intryck när det kommer till servicemöjligheter och anslutbarhet. Prestandan är skakig och den har låg prestanda per krona jämfört med traditionella Core i7-alternativ.
Eurocom Q8
- 07/03/2018 v6 (old)
Allen Ngo
Price comparison
