Test: Asus ZenBook UX530UX (i7-7500U, GTX 950M) Laptop (Sammanfattning)
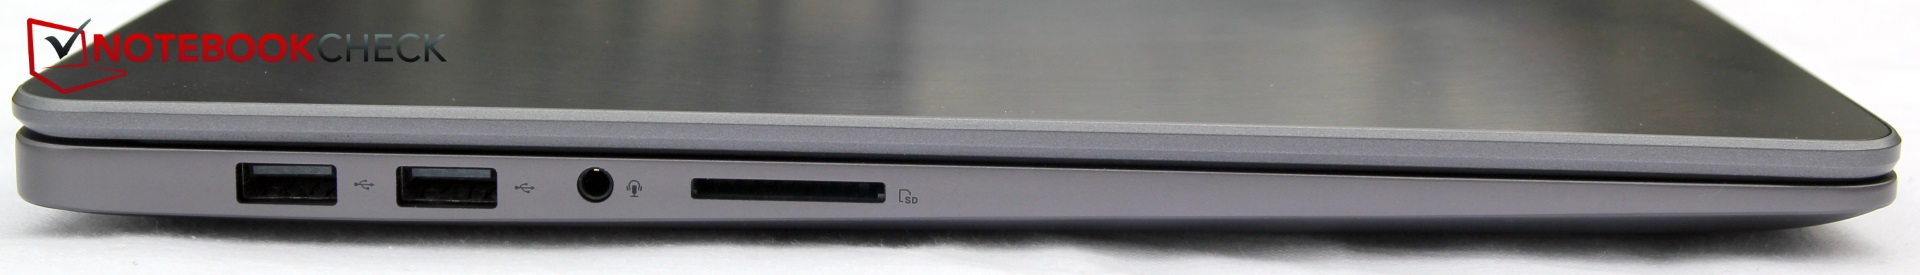
| SD Card Reader | |
| average JPG Copy Test (av. of 3 runs) | |
| Asus ZenBook Pro UX550VD (Toshiba Exceria Pro M501) | |
| Lenovo ThinkPad E570-20H6S00000 (Toshiba Exceria Pro SDXC 64 GB UHS-II) | |
| Acer Aspire E5-575G-549D (Toshiba Exceria Pro SDXC 64 GB UHS-II) | |
| Asus ZenBook UX530UX-FY070T (Toshiba Exceria Pro SDXC 64 GB UHS-II) | |
| maximum AS SSD Seq Read Test (1GB) | |
| Lenovo ThinkPad E570-20H6S00000 (Toshiba Exceria Pro SDXC 64 GB UHS-II) | |
| Acer Aspire E5-575G-549D (Toshiba Exceria Pro SDXC 64 GB UHS-II) | |
| Asus ZenBook UX530UX-FY070T (Toshiba Exceria Pro SDXC 64 GB UHS-II) | |
| Networking | |
| iperf3 transmit AX12 | |
| Asus ZenBook UX530UX-FY070T | |
| Lenovo ThinkPad E570-20H6S00000 | |
| Asus ZenBook Pro UX550VD | |
| iperf3 receive AX12 | |
| Asus ZenBook Pro UX550VD | |
| Asus ZenBook UX530UX-FY070T | |
| Lenovo ThinkPad E570-20H6S00000 | |
| |||||||||||||||||||||||||
Distribution av ljusstyrkan: 80 %
Kontrast: 1288:1 (Svärta: 0.24 cd/m²)
ΔE ColorChecker Calman: 4.09 | ∀{0.5-29.43 Ø4.71}
ΔE Greyscale Calman: 4.75 | ∀{0.09-98 Ø4.96}
90% sRGB (Argyll 1.6.3 3D)
58% AdobeRGB 1998 (Argyll 1.6.3 3D)
65.2% AdobeRGB 1998 (Argyll 3D)
90.6% sRGB (Argyll 3D)
64.3% Display P3 (Argyll 3D)
Gamma: 2.39
CCT: 7034 K
| Asus ZenBook UX530UX-FY070T Chi Mei CMN15E8, , 1920x1080, 15.6" | Lenovo ThinkPad E570-20H6S00000 AUO B156HAN04.4, , 1920x1080, 15.6" | Acer Aspire E5-575G-549D Chi Mei CMN15C4, , 1920x1080, 15.6" | Asus ZenBook Pro UX550VD CMN15E8 (N156HCE-EN1), , 1920x1080, 15.6" | |
|---|---|---|---|---|
| Display | -38% | -39% | 1% | |
| Display P3 Coverage (%) | 64.3 | 38.65 -40% | 38.57 -40% | 65.7 2% |
| sRGB Coverage (%) | 90.6 | 58 -36% | 57.4 -37% | 90.3 0% |
| AdobeRGB 1998 Coverage (%) | 65.2 | 39.94 -39% | 39.89 -39% | 65.9 1% |
| Response Times | -2% | 8% | 3% | |
| Response Time Grey 50% / Grey 80% * (ms) | 40 ? | 44.8 ? -12% | 39 ? 2% | 38.8 ? 3% |
| Response Time Black / White * (ms) | 28 ? | 25.6 ? 9% | 24 ? 14% | 27.2 ? 3% |
| PWM Frequency (Hz) | 25000 ? | 25910 ? | ||
| Screen | -16% | -61% | -4% | |
| Brightness middle (cd/m²) | 309 | 242 -22% | 176 -43% | 335 8% |
| Brightness (cd/m²) | 296 | 243 -18% | 169 -43% | 313 6% |
| Brightness Distribution (%) | 80 | 75 -6% | 91 14% | 83 4% |
| Black Level * (cd/m²) | 0.24 | 0.24 -0% | 0.47 -96% | 0.27 -13% |
| Contrast (:1) | 1288 | 1008 -22% | 374 -71% | 1241 -4% |
| Colorchecker dE 2000 * | 4.09 | 4.65 -14% | 8.83 -116% | 4.7 -15% |
| Colorchecker dE 2000 max. * | 7.44 | 9.64 -30% | 14.01 -88% | 8.1 -9% |
| Greyscale dE 2000 * | 4.75 | 3.39 29% | 8.97 -89% | 5.8 -22% |
| Gamma | 2.39 92% | 2.7 81% | 2.43 91% | 2.06 107% |
| CCT | 7034 92% | 6246 104% | 10234 64% | 6518 100% |
| Color Space (Percent of AdobeRGB 1998) (%) | 58 | 36.69 -37% | 36.8 -37% | 58.7 1% |
| Color Space (Percent of sRGB) (%) | 90 | 57.66 -36% | 57.3 -36% | 90.1 0% |
| Totalt genomsnitt (program/inställningar) | -19% /
-18% | -31% /
-47% | 0% /
-2% |
* ... mindre är bättre
Visa svarstider
| ↔ Svarstid svart till vitt | ||
|---|---|---|
| 28 ms ... stiga ↗ och falla ↘ kombinerat | ↗ 16 ms stiga | 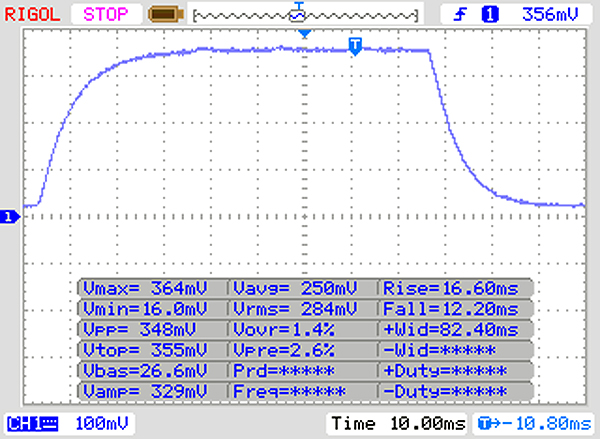 |
| ↘ 12 ms hösten | ||
| Skärmen visar relativt långsamma svarsfrekvenser i våra tester och kan vara för långsam för spelare. I jämförelse sträcker sig alla testade enheter från 0.1 (minst) till 240 (maximalt) ms. » 71 % av alla enheter är bättre. Detta innebär att den uppmätta svarstiden är sämre än genomsnittet av alla testade enheter (19.8 ms). | ||
| ↔ Svarstid 50 % grått till 80 % grått | ||
| 40 ms ... stiga ↗ och falla ↘ kombinerat | ↗ 22 ms stiga | 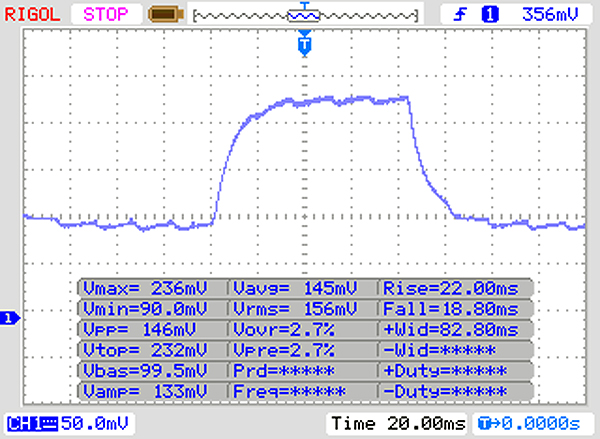 |
| ↘ 18 ms hösten | ||
| Skärmen visar långsamma svarsfrekvenser i våra tester och kommer att vara otillfredsställande för spelare. I jämförelse sträcker sig alla testade enheter från 0.165 (minst) till 636 (maximalt) ms. » 61 % av alla enheter är bättre. Detta innebär att den uppmätta svarstiden är sämre än genomsnittet av alla testade enheter (31 ms). | ||
Skärmflimmer / PWM (Puls-Width Modulation)
| Skärmflimmer / PWM upptäckt | 25000 Hz | ≤ 20 % ljusstyrka inställning | 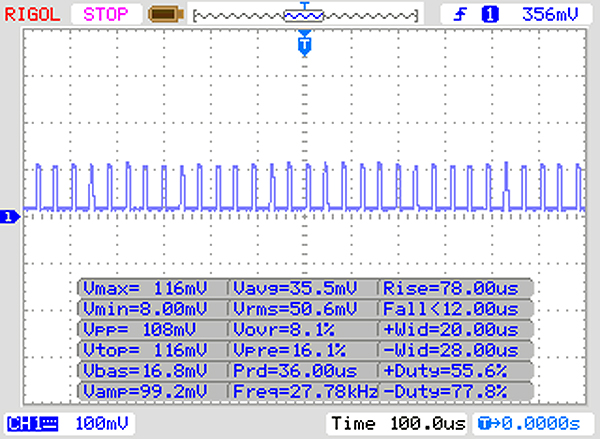 |
Displayens bakgrundsbelysning flimrar vid 25000 Hz (i värsta fall, t.ex. med PWM) Flimrande upptäckt vid en ljusstyrkeinställning på 20 % och lägre. Det ska inte finnas något flimmer eller PWM över denna ljusstyrkeinställning. Frekvensen för 25000 Hz är ganska hög, så de flesta användare som är känsliga för PWM bör inte märka något flimmer. Som jämförelse: 52 % av alla testade enheter använder inte PWM för att dämpa skärmen. Om PWM upptäcktes mättes ett medelvärde av 7751 (minst: 5 - maximum: 343500) Hz. | |||
| Cinebench R15 | |
| CPU Single 64Bit | |
| Asus ZenBook Pro UX550VD | |
| Genomsnitt Intel Core i7-7500U (110 - 149, n=53) | |
| Asus ZenBook UX530UX-FY070T | |
| Acer Aspire E5-575G-549D | |
| Lenovo ThinkPad E570-20H6S00000 | |
| CPU Multi 64Bit | |
| Asus ZenBook Pro UX550VD | |
| Genomsnitt Intel Core i7-7500U (265 - 376, n=53) | |
| Acer Aspire E5-575G-549D | |
| Lenovo ThinkPad E570-20H6S00000 | |
| Asus ZenBook UX530UX-FY070T | |
| PCMark 8 | |
| Home Score Accelerated v2 | |
| Genomsnitt av klass Multimedia (n=1senaste 2 åren) | |
| Asus ZenBook Pro UX550VD | |
| Lenovo ThinkPad E570-20H6S00000 | |
| Asus ZenBook UX530UX-FY070T | |
| Genomsnitt Intel Core i7-7500U, NVIDIA GeForce GTX 950M (n=1) | |
| Acer Aspire E5-575G-549D | |
| Work Score Accelerated v2 | |
| Asus ZenBook Pro UX550VD | |
| Lenovo ThinkPad E570-20H6S00000 | |
| Asus ZenBook UX530UX-FY070T | |
| Genomsnitt Intel Core i7-7500U, NVIDIA GeForce GTX 950M (n=1) | |
| Acer Aspire E5-575G-549D | |
| PCMark 8 Home Score Accelerated v2 | 3515 poäng | |
| PCMark 8 Work Score Accelerated v2 | 4661 poäng | |
Hjälp | ||
| Asus ZenBook UX530UX-FY070T SK Hynix HFS256G39TND-N210A | Lenovo ThinkPad E570-20H6S00000 Toshiba THNSF5256GPUK | Acer Aspire E5-575G-549D Toshiba MQ01ABD100 | Asus ZenBook Pro UX550VD Samsung PM961 NVMe MZVLW512HMJP | |
|---|---|---|---|---|
| CrystalDiskMark 3.0 | 188% | -86% | 334% | |
| Read Seq (MB/s) | 282.2 | 1140 304% | 95.3 -66% | 1434 408% |
| Write Seq (MB/s) | 184.5 | 468.1 154% | 85.6 -54% | 1365 640% |
| Read 512 (MB/s) | 233.5 | 759 225% | 29.32 -87% | 614 163% |
| Write 512 (MB/s) | 140.1 | 414 196% | 25.93 -81% | 688 391% |
| Read 4k (MB/s) | 24.42 | 34.3 40% | 0.366 -99% | 60.6 148% |
| Write 4k (MB/s) | 48.98 | 123.4 152% | 0.726 -99% | 158 223% |
| Read 4k QD32 (MB/s) | 170 | 530 212% | 0.647 -100% | 617 263% |
| Write 4k QD32 (MB/s) | 98.5 | 319.2 224% | 0.722 -99% | 525 433% |

| 3DMark 11 - 1280x720 Performance GPU | |
| Asus ZenBook Pro UX550VD | |
| Genomsnitt NVIDIA GeForce GTX 950M (4046 - 4678, n=28) | |
| Acer Aspire E5-575G-549D | |
| Lenovo ThinkPad E570-20H6S00000 | |
| Asus ZenBook UX530UX-FY070T | |
| 3DMark | |
| 1280x720 Cloud Gate Standard Graphics | |
| Asus ZenBook Pro UX550VD | |
| Acer Aspire E5-575G-549D | |
| Lenovo ThinkPad E570-20H6S00000 | |
| Genomsnitt NVIDIA GeForce GTX 950M (18547 - 25900, n=28) | |
| Asus ZenBook UX530UX-FY070T | |
| 1920x1080 Fire Strike Graphics | |
| Asus ZenBook Pro UX550VD | |
| Acer Aspire E5-575G-549D | |
| Lenovo ThinkPad E570-20H6S00000 | |
| Asus ZenBook UX530UX-FY070T | |
| Genomsnitt NVIDIA GeForce GTX 950M (2931 - 3638, n=28) | |
| 3DMark 11 Performance | 4006 poäng | |
| 3DMark Cloud Gate Standard Score | 1262 poäng | |
| 3DMark Fire Strike Score | 2638 poäng | |
Hjälp | ||
| låg | med. | hög | ultra | |
|---|---|---|---|---|
| The Witcher 3 (2015) | 42.5 | 36.04 | 20.02 | 10.71 |
| Rise of the Tomb Raider (2016) | 67.1 | 37.32 | 21.49 | 17.89 |
| Rocket League (2017) | 143.2 | 54.8 | 40.33 |
| The Witcher 3 | |
| 1024x768 Low Graphics & Postprocessing | |
| Genomsnitt NVIDIA GeForce GTX 950M (42.5 - 67, n=7) | |
| Asus ZenBook UX530UX-FY070T | |
| 1366x768 Medium Graphics & Postprocessing | |
| Asus ZenBook Pro UX550VD | |
| Genomsnitt NVIDIA GeForce GTX 950M (33 - 40.7, n=8) | |
| Asus ZenBook UX530UX-FY070T | |
| 1920x1080 High Graphics & Postprocessing (Nvidia HairWorks Off) | |
| Asus ZenBook Pro UX550VD | |
| Asus ZenBook UX530UX-FY070T | |
| Genomsnitt NVIDIA GeForce GTX 950M (16.2 - 22.3, n=7) | |
| Rocket League | |
| 1280x720 Performance | |
| Asus ZenBook UX530UX-FY070T | |
| Genomsnitt NVIDIA GeForce GTX 950M (n=1) | |
| 1920x1080 Quality AA:Medium FX | |
| Asus ZenBook UX530UX-FY070T | |
| Genomsnitt NVIDIA GeForce GTX 950M (n=1) | |
| 1920x1080 High Quality AA:High FX | |
| Genomsnitt NVIDIA GeForce GTX 950M (40.3 - 68.4, n=2) | |
| Asus ZenBook UX530UX-FY070T | |
| Rise of the Tomb Raider | |
| 1024x768 Lowest Preset | |
| Lenovo ThinkPad E570-20H6S00000 | |
| Asus ZenBook UX530UX-FY070T | |
| Genomsnitt NVIDIA GeForce GTX 950M (42.6 - 71.4, n=9) | |
| Acer Aspire E5-575G-549D | |
| 1366x768 Medium Preset AF:2x | |
| Asus ZenBook Pro UX550VD | |
| Lenovo ThinkPad E570-20H6S00000 | |
| Asus ZenBook UX530UX-FY070T | |
| Genomsnitt NVIDIA GeForce GTX 950M (28.8 - 41, n=10) | |
| Acer Aspire E5-575G-549D | |
| 1920x1080 High Preset AA:FX AF:4x | |
| Asus ZenBook Pro UX550VD | |
| Asus ZenBook UX530UX-FY070T | |
| Lenovo ThinkPad E570-20H6S00000 | |
| Genomsnitt NVIDIA GeForce GTX 950M (16.9 - 23.1, n=10) | |
| Acer Aspire E5-575G-549D | |
| Asus ZenBook UX530UX-FY070T GeForce GTX 950M, i7-7500U, SK Hynix HFS256G39TND-N210A | Lenovo ThinkPad E570-20H6S00000 GeForce GTX 950M, i5-7200U, Toshiba THNSF5256GPUK | Acer Aspire E5-575G-549D GeForce GTX 950M, i5-7200U, Toshiba MQ01ABD100 | Asus ZenBook Pro UX550VD GeForce GTX 1050 Mobile, i7-7700HQ, Samsung PM961 NVMe MZVLW512HMJP | |
|---|---|---|---|---|
| Noise | 3% | 0% | -0% | |
| av / miljö * (dB) | 30.2 | 29 4% | 28.9 4% | 29.4 3% |
| Idle Minimum * (dB) | 30.2 | 29 4% | 30.8 -2% | 29.4 3% |
| Idle Average * (dB) | 30.2 | 29 4% | 30.8 -2% | 29.9 1% |
| Idle Maximum * (dB) | 31.6 | 29 8% | 30.8 3% | 29.9 5% |
| Load Average * (dB) | 36 | 34.3 5% | 33.4 7% | 38.3 -6% |
| Load Maximum * (dB) | 36.6 | 40.1 -10% | 40.1 -10% | 39.6 -8% |
| Witcher 3 ultra * (dB) | 39.8 |
* ... mindre är bättre
Ljudnivå
| Låg belastning |
| 30.2 / 30.2 / 31.6 dB(A) |
| Hög belastning |
| 36 / 36.6 dB(A) |
 | ||
30 dB tyst 40 dB(A) hörbar 50 dB(A) högt ljud |
||
min: | ||
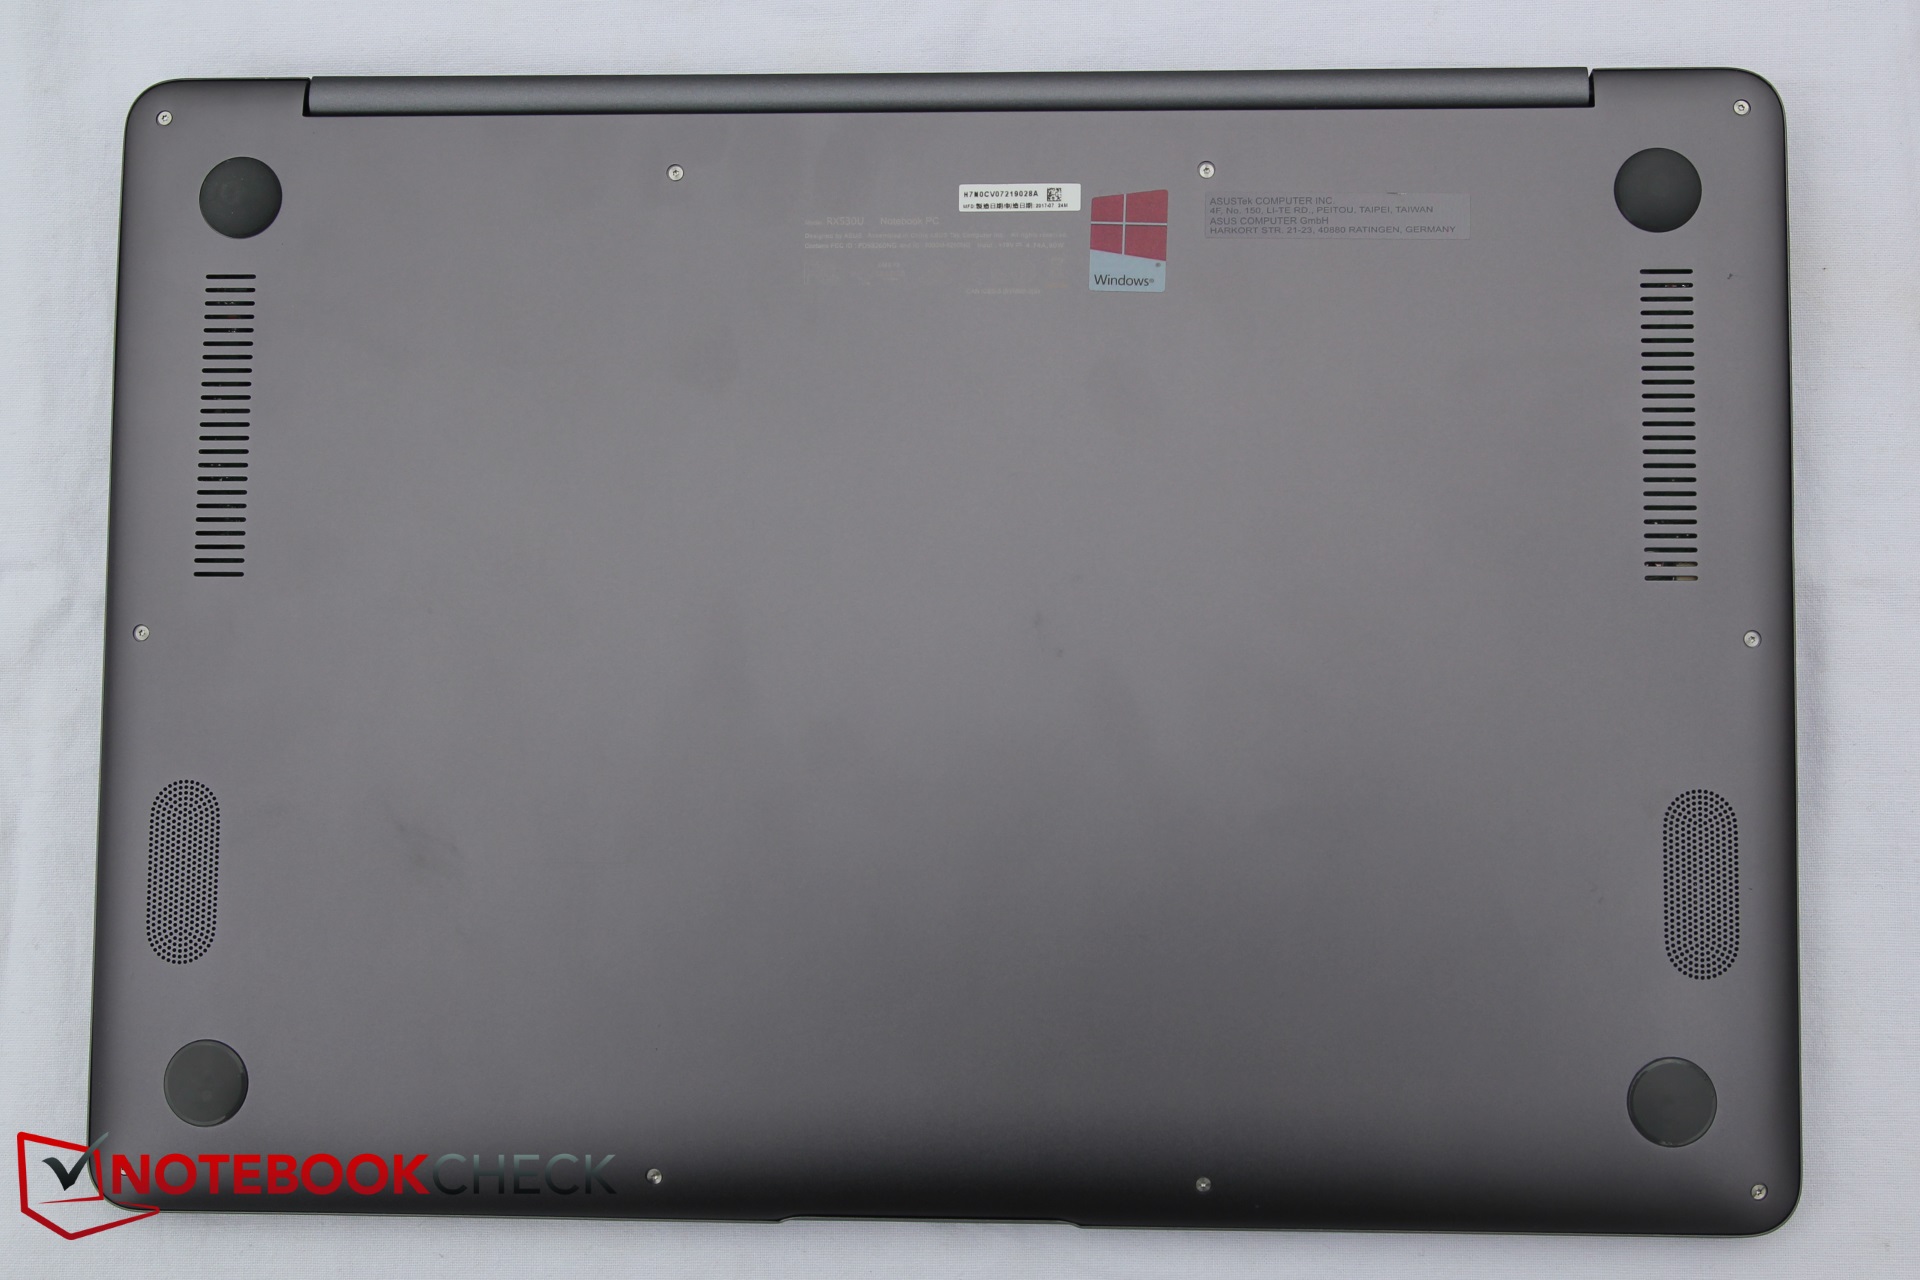
(-) Den maximala temperaturen på ovansidan är 48.2 °C / 119 F, jämfört med genomsnittet av 36.8 °C / 98 F , allt från 21 till 71 °C för klassen Multimedia.
(-) Botten värms upp till maximalt 45.8 °C / 114 F, jämfört med genomsnittet av 39.1 °C / 102 F
(+) Vid tomgångsbruk är medeltemperaturen för ovansidan 24.3 °C / 76 F, jämfört med enhetsgenomsnittet på 31.3 °C / ### class_avg_f### F.
(+) Handledsstöden och pekplattan är kallare än hudtemperaturen med maximalt 29.8 °C / 85.6 F och är därför svala att ta på.
(±) Medeltemperaturen för handledsstödsområdet på liknande enheter var 28.7 °C / 83.7 F (-1.1 °C / -1.9 F).
| Asus ZenBook UX530UX-FY070T GeForce GTX 950M, i7-7500U, SK Hynix HFS256G39TND-N210A | Lenovo ThinkPad E570-20H6S00000 GeForce GTX 950M, i5-7200U, Toshiba THNSF5256GPUK | Acer Aspire E5-575G-549D GeForce GTX 950M, i5-7200U, Toshiba MQ01ABD100 | Asus ZenBook Pro UX550VD GeForce GTX 1050 Mobile, i7-7700HQ, Samsung PM961 NVMe MZVLW512HMJP | |
|---|---|---|---|---|
| Heat | -1% | -21% | -2% | |
| Maximum Upper Side * (°C) | 48.2 | 46.6 3% | 48.1 -0% | 43.6 10% |
| Maximum Bottom * (°C) | 45.8 | 49.1 -7% | 60.8 -33% | 44.5 3% |
| Idle Upper Side * (°C) | 25 | 24.6 2% | 30.8 -23% | 28 -12% |
| Idle Bottom * (°C) | 24.9 | 25.1 -1% | 31.9 -28% | 26.7 -7% |
* ... mindre är bättre
Asus ZenBook UX530UX-FY070T ljudanalys
(-) | inte särskilt höga högtalare (67.1 dB)
Bas 100 - 315 Hz
(-) | nästan ingen bas - i genomsnitt 15.8% lägre än medianen
(±) | linjäriteten för basen är genomsnittlig (7.6% delta till föregående frekvens)
Mellan 400 - 2000 Hz
(+) | balanserad mellan - endast 3.9% från medianen
(+) | mids är linjära (5.4% delta till föregående frekvens)
Högsta 2 - 16 kHz
(±) | högre toppar - i genomsnitt 5.9% högre än medianen
(±) | linjäriteten för toppar är genomsnittlig (9.7% delta till föregående frekvens)
Totalt 100 - 16 000 Hz
(±) | linjäriteten för det totala ljudet är genomsnittlig (23.8% skillnad mot median)
Jämfört med samma klass
» 84% av alla testade enheter i den här klassen var bättre, 6% liknande, 10% sämre
» Den bästa hade ett delta på 5%, genomsnittet var 17%, sämst var 45%
Jämfört med alla testade enheter
» 71% av alla testade enheter var bättre, 6% liknande, 22% sämre
» Den bästa hade ett delta på 4%, genomsnittet var 23%, sämst var 134%
Lenovo ThinkPad E570-20H6S00000 ljudanalys
(±) | högtalarljudstyrkan är genomsnittlig men bra (80.7 dB)
Bas 100 - 315 Hz
(-) | nästan ingen bas - i genomsnitt 16.8% lägre än medianen
(-) | basen är inte linjär (16.4% delta till föregående frekvens)
Mellan 400 - 2000 Hz
(±) | högre mellan - i genomsnitt 5.1% högre än median
(±) | linjäriteten för mids är genomsnittlig (9.5% delta till föregående frekvens)
Högsta 2 - 16 kHz
(+) | balanserade toppar - endast 2.7% från medianen
(+) | toppar är linjära (6.5% delta till föregående frekvens)
Totalt 100 - 16 000 Hz
(±) | linjäriteten för det totala ljudet är genomsnittlig (19.6% skillnad mot median)
Jämfört med samma klass
» 64% av alla testade enheter i den här klassen var bättre, 7% liknande, 29% sämre
» Den bästa hade ett delta på 5%, genomsnittet var 17%, sämst var 45%
Jämfört med alla testade enheter
» 49% av alla testade enheter var bättre, 7% liknande, 44% sämre
» Den bästa hade ett delta på 4%, genomsnittet var 23%, sämst var 134%
| Av/Standby | |
| Låg belastning | |
| Hög belastning |
|
Förklaring:
min: | |
| Asus ZenBook UX530UX-FY070T i7-7500U, GeForce GTX 950M, SK Hynix HFS256G39TND-N210A, IPS, 1920x1080, 15.6" | Lenovo ThinkPad E570-20H6S00000 i5-7200U, GeForce GTX 950M, Toshiba THNSF5256GPUK, IPS LED, 1920x1080, 15.6" | Acer Aspire E5-575G-549D i5-7200U, GeForce GTX 950M, Toshiba MQ01ABD100, TN, 1920x1080, 15.6" | Asus ZenBook Pro UX550VD i7-7700HQ, GeForce GTX 1050 Mobile, Samsung PM961 NVMe MZVLW512HMJP, IPS, 1920x1080, 15.6" | |
|---|---|---|---|---|
| Power Consumption | 6% | -29% | -51% | |
| Idle Minimum * (Watt) | 3.5 | 2.8 20% | 6 -71% | 5.05 -44% |
| Idle Average * (Watt) | 5.3 | 6.3 -19% | 8.1 -53% | 8.2 -55% |
| Idle Maximum * (Watt) | 9.1 | 6.9 24% | 9.8 -8% | 12.2 -34% |
| Load Average * (Watt) | 60 | 51.6 14% | 52.5 12% | 82 -37% |
| Load Maximum * (Watt) | 65 | 69.7 -7% | 81.6 -26% | 120 -85% |
| Witcher 3 ultra * (Watt) | 93.1 |
* ... mindre är bättre
| Asus ZenBook UX530UX-FY070T i7-7500U, GeForce GTX 950M, 50 Wh | Lenovo ThinkPad E570-20H6S00000 i5-7200U, GeForce GTX 950M, 41 Wh | Acer Aspire E5-575G-549D i5-7200U, GeForce GTX 950M, 62 Wh | Asus ZenBook Pro UX550VD i7-7700HQ, GeForce GTX 1050 Mobile, 73 Wh | |
|---|---|---|---|---|
| Batteridrifttid | 38% | 12% | 31% | |
| Reader / Idle (h) | 8.8 | 14.7 67% | 12.8 45% | 17.7 101% |
| H.264 (h) | 7 | 7.7 10% | 7.8 11% | |
| WiFi v1.3 (h) | 6.2 | 7.7 24% | 7.5 21% | 8.9 44% |
| Load (h) | 1.8 | 2.2 22% | 1.3 -28% | 1.2 -33% |
| Witcher 3 ultra (h) | 1.1 |
För
Emot
Läs den fullständiga versionen av den här recensionen på engelska här.
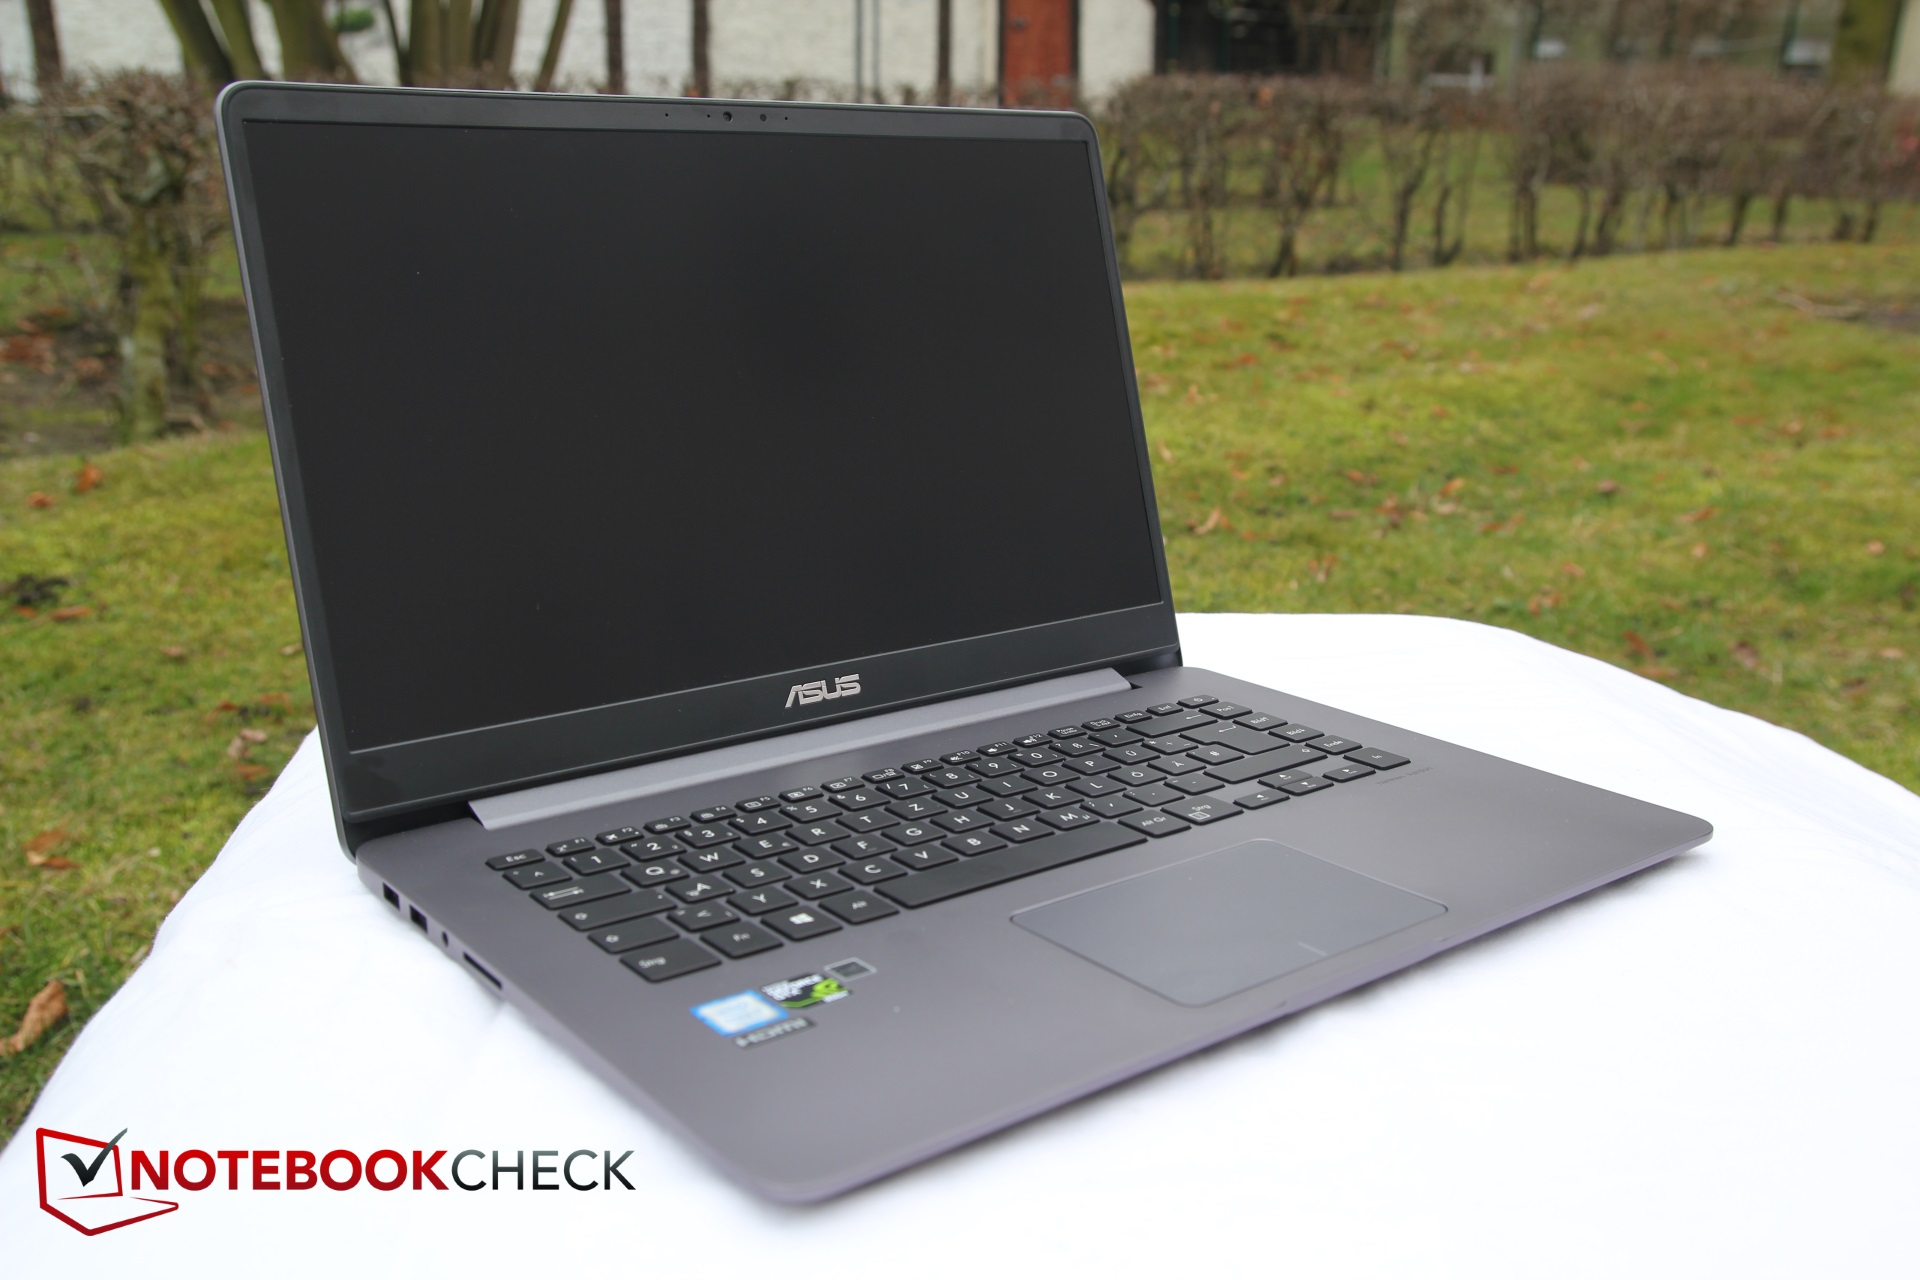
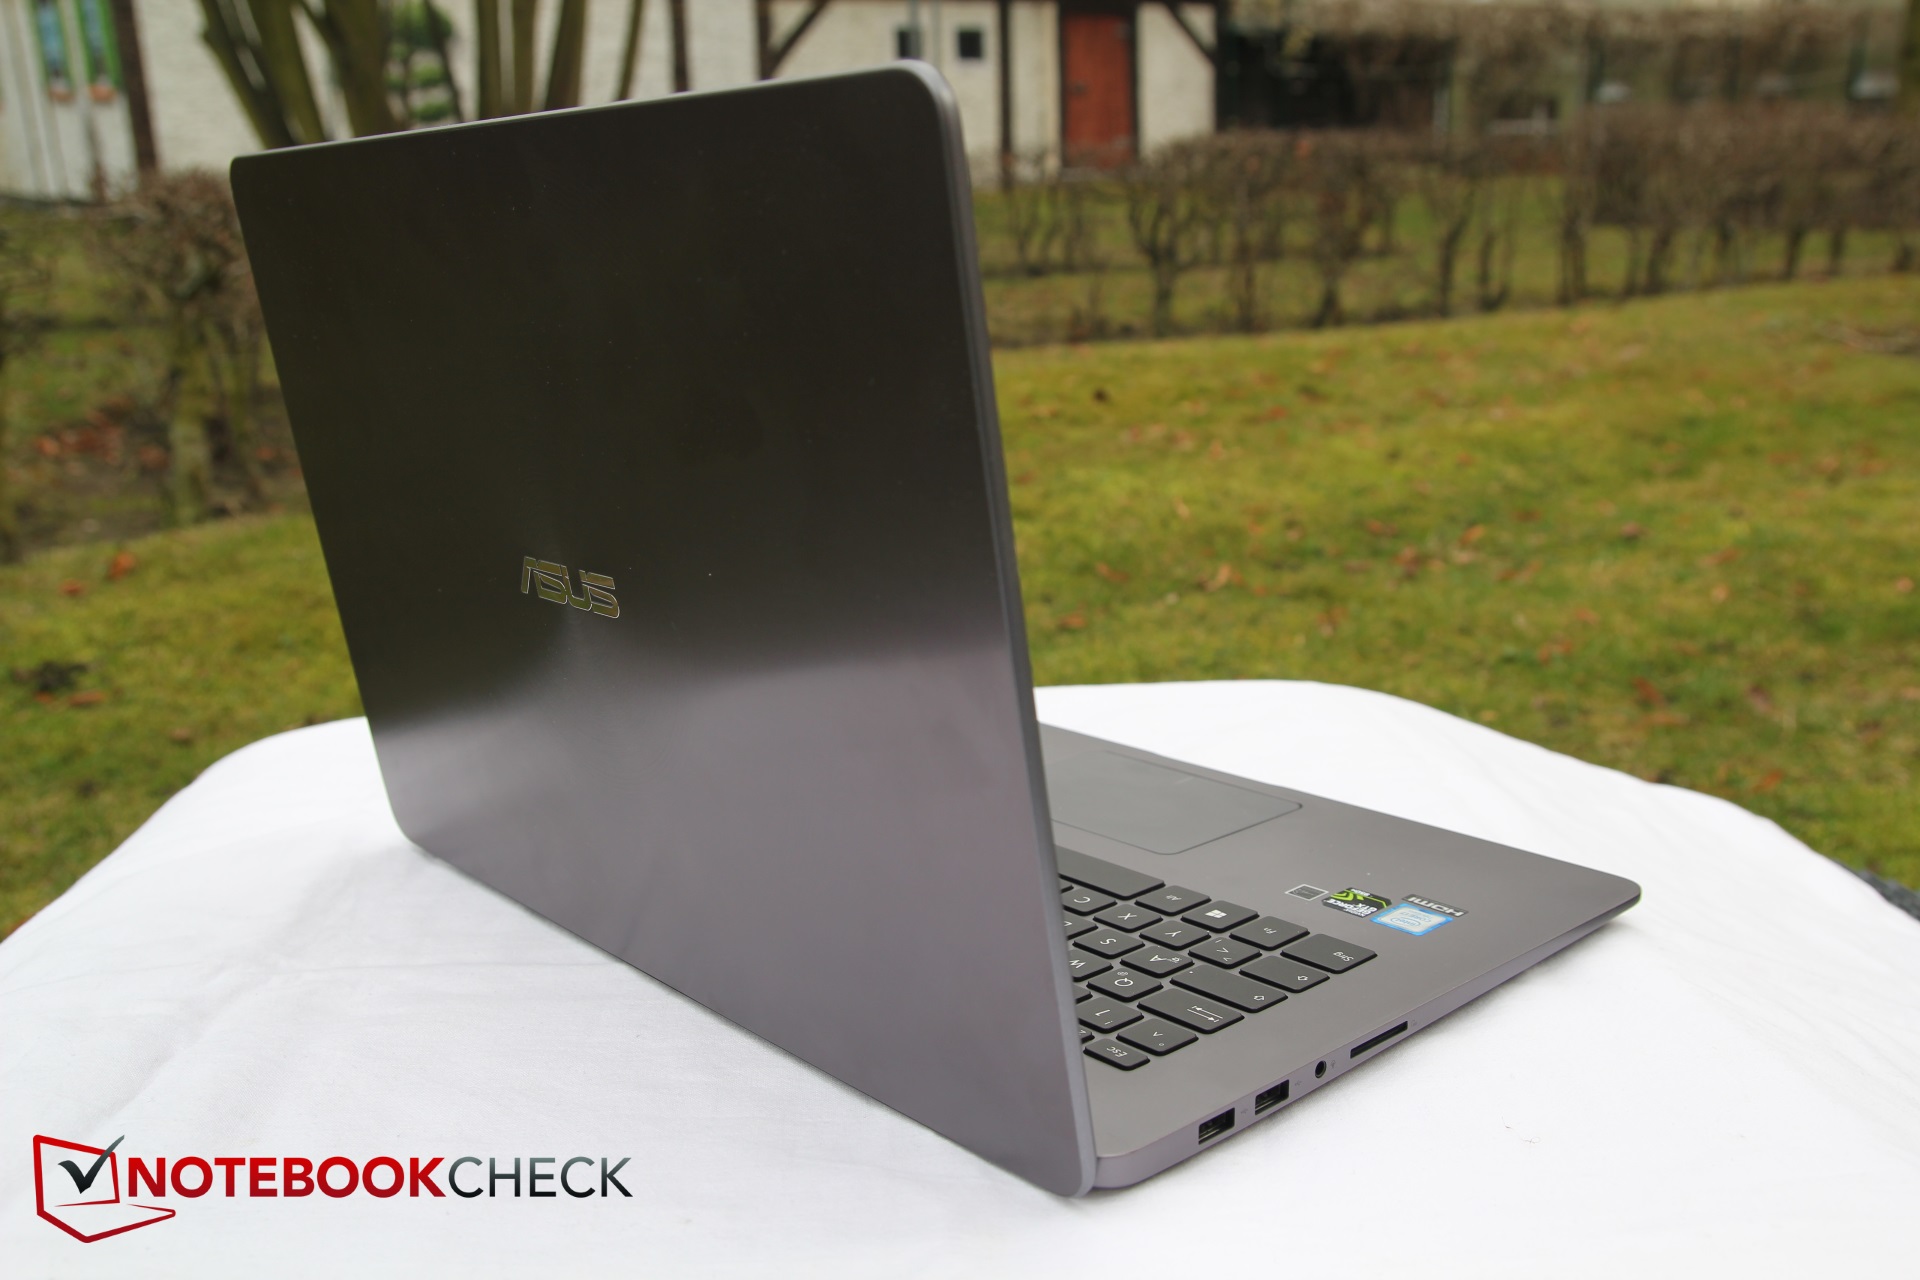
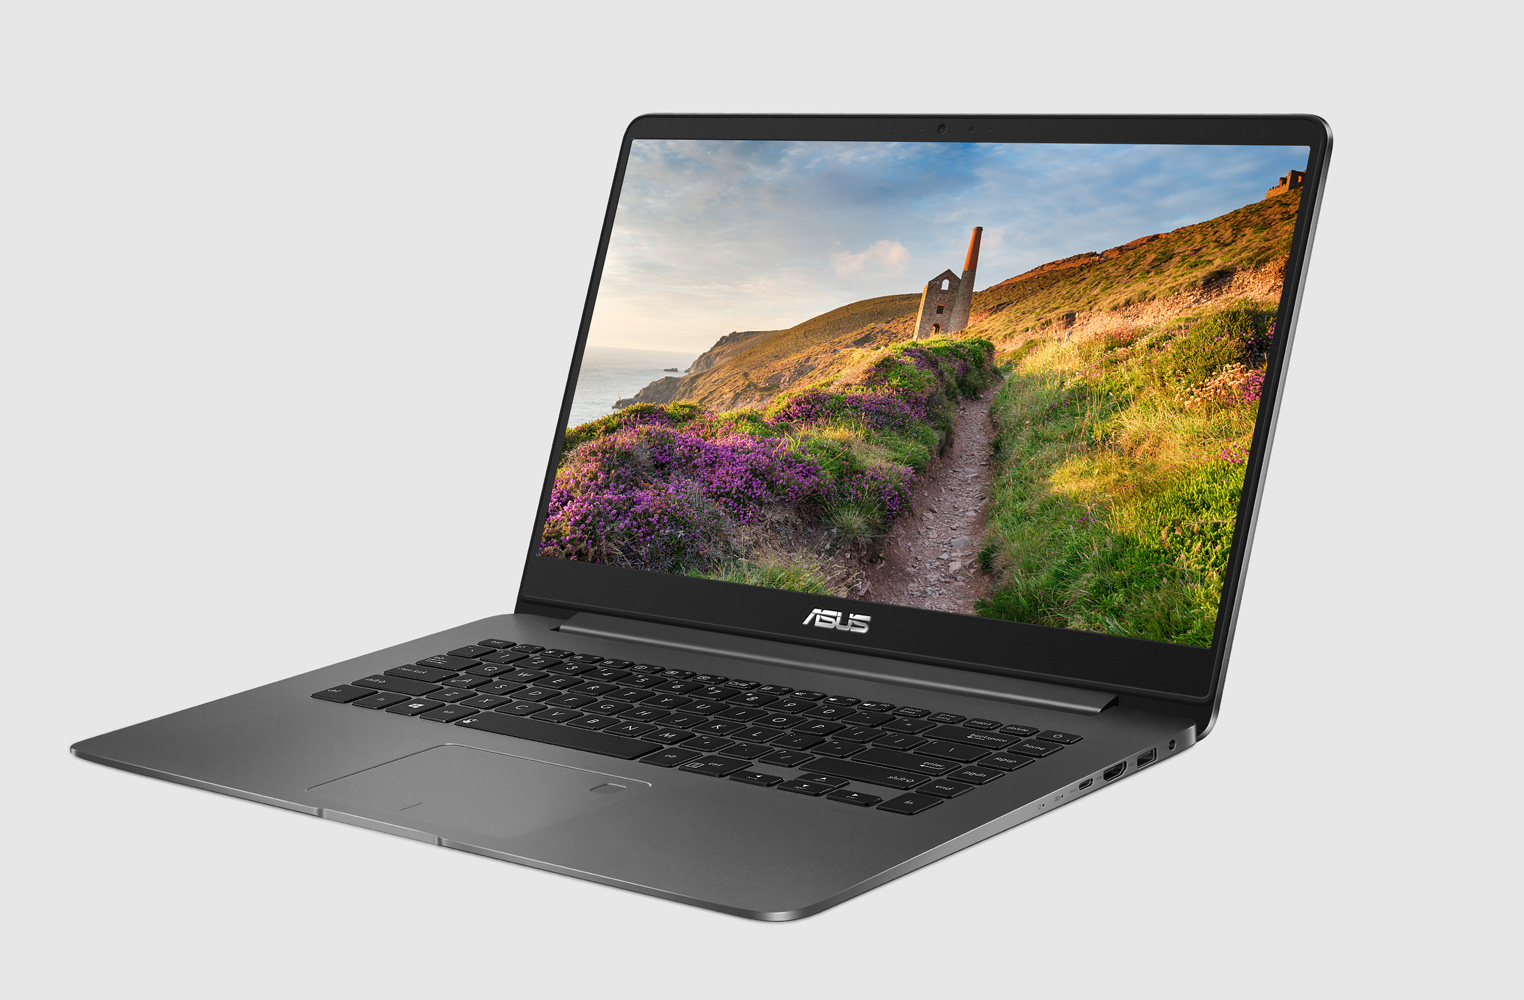
Det är ganska uppenbart vilken publik Asus ZenBook UX530UX är riktad åt: Personer som vill vara mobila men ändå inte vill vara utan en skärm på 15 tum och har pengar att spendera. Den nya ZenBook-modellen är liten, lätt, elegant och är högkvalitativt byggd. Den har en bra skärm och den håller sig behagligt sval och ganska tyst.
Den som inte bryr sig särskilt mycket om vikt och mobiltet borde leta efter en ny enhet någon annanstans. Från ett prestandaperspektiv kommer ZenBook inte skapa mycket entusiasm då den stryper för kraftigt. Den installerade SSD-enheten ligger i mittenskiktet som bäst och ännu bättre prestanda finns tillgänglig för betydligt mindre pengar. Som exempel, Lenovo ThinkPad E570, som är större och tyngre men är lik prestanda-mässigt kostar nästan 5 000 kronor mindre!
Priset på Asus ZenBook UX530 är definitivt för högt för prestandan som erbjuds. Man betalar därför mindre för dess prestanda och mer för att få tag på en av dom tunnaste och lättaste enheterna på 15 tum som existerar. Om den aspekten inte är så viktig för användaren kommer denne vara gladare någon annanstans. Men denna nya ZenBook erbjuder hög mobilitet tillsammans med acceptabel prestanda, det är bara batteritiden som kunde varit bättre.
Asus ZenBook UX530UX-FY070T
- 01/31/2018 v6 (old)
Christian Hintze