Test: Dell Latitude 3400 - En billig kontorslaptop med lång batteritid (Sammanfattning)
Gradering | Datum | Modell | Vikt | Höjd | Storlek | Upplösning | Pris |
|---|---|---|---|---|---|---|---|
| 83 % v7 (old) | 10/2019 | Dell Latitude 3400 i3-8145U, UHD Graphics 620 | 1.7 kg | 18.65 mm | 14.00" | 1920x1080 | |
| 85.9 % v7 (old) | 08/2019 | Lenovo ThinkPad E490-20N8000RGE i5-8265U, UHD Graphics 620 | 1.8 kg | 19.9 mm | 14.00" | 1920x1080 | |
| 84.2 % v7 (old) | 11/2020 | Lenovo ThinkPad E495-20NE000JGE R5 3500U, Vega 8 | 1.8 kg | 19.9 mm | 14.00" | 1920x1080 | |
| 86.3 % v6 (old) | 03/2019 | HP ProBook 440 G6-5TK01EA i7-8565U, UHD Graphics 620 | 1.6 kg | 18 mm | 14.00" | 1920x1080 | |
| 83.7 % v6 (old) | HP ProBook 445 G6 R5 2500U, Vega 8 | 1.6 kg | 18 mm | 14.00" | 1920x1080 |
Anslutbarhet
| SD Card Reader | |
| average JPG Copy Test (av. of 3 runs) | |
| Lenovo ThinkPad E495-20NE000JGE (Toshiba Exceria Pro M501) | |
| HP ProBook 440 G6-5TK01EA (Toshiba Exceria Pro SDXC 64 GB UHS-II) | |
| HP ProBook 445 G6 (Toshiba Exceria Pro SDXC 64 GB UHS-II) | |
| Lenovo ThinkPad E490-20N8000RGE (Toshiba Exceria Pro M501) | |
| Genomsnitt av klass Office (19.8 - 198.5, n=22, senaste 2 åren) | |
| Dell Latitude 3490 (Toshiba Exceria Pro SDXC 64 GB UHS-II) | |
| Dell Latitude 3400 (Toshiba Exceria Pro SDXC 64 GB UHS-II) | |
| maximum AS SSD Seq Read Test (1GB) | |
| Lenovo ThinkPad E495-20NE000JGE (Toshiba Exceria Pro M501) | |
| HP ProBook 445 G6 (Toshiba Exceria Pro SDXC 64 GB UHS-II) | |
| Lenovo ThinkPad E490-20N8000RGE (Toshiba Exceria Pro M501) | |
| HP ProBook 440 G6-5TK01EA (Toshiba Exceria Pro SDXC 64 GB UHS-II) | |
| Genomsnitt av klass Office (27.4 - 249, n=21, senaste 2 åren) | |
| Dell Latitude 3400 (Toshiba Exceria Pro SDXC 64 GB UHS-II) | |
| Dell Latitude 3490 (Toshiba Exceria Pro SDXC 64 GB UHS-II) | |
| Networking | |
| iperf3 transmit AX12 | |
| Lenovo ThinkPad E490-20N8000RGE | |
| HP ProBook 440 G6-5TK01EA | |
| Dell Latitude 3400 | |
| Lenovo ThinkPad E495-20NE000JGE | |
| Dell Latitude 3490 | |
| HP ProBook 445 G6 | |
| iperf3 receive AX12 | |
| Dell Latitude 3400 | |
| Lenovo ThinkPad E495-20NE000JGE | |
| HP ProBook 440 G6-5TK01EA | |
| Lenovo ThinkPad E490-20N8000RGE | |
| Dell Latitude 3490 | |
| HP ProBook 445 G6 | |
| |||||||||||||||||||||||||
Distribution av ljusstyrkan: 79 %
Mitt på batteriet: 240 cd/m²
Kontrast: 500:1 (Svärta: 0.48 cd/m²)
ΔE ColorChecker Calman: 4.2 | ∀{0.5-29.43 Ø4.72}
ΔE Greyscale Calman: 1.75 | ∀{0.09-98 Ø4.97}
59% sRGB (Argyll 1.6.3 3D)
38% AdobeRGB 1998 (Argyll 1.6.3 3D)
42.03% AdobeRGB 1998 (Argyll 3D)
59.3% sRGB (Argyll 3D)
40.68% Display P3 (Argyll 3D)
Gamma: 2.36
CCT: 6387 K
| Dell Latitude 3400 IPS, 1920x1080, 14" | Lenovo ThinkPad E490-20N8000RGE IPS, 1920x1080, 14" | Lenovo ThinkPad E495-20NE000JGE IPS, 1920x1080, 14" | HP ProBook 440 G6-5TK01EA IPS, 1920x1080, 14" | HP ProBook 445 G6 IPS, 1920x1080, 14" | Dell Latitude 3490 IPS LED, 1920x1080, 14" | |
|---|---|---|---|---|---|---|
| Display | -2% | 5% | -5% | 3% | -1% | |
| Display P3 Coverage (%) | 40.68 | 39.85 -2% | 42.37 4% | 38.08 -6% | 41.53 2% | 39.81 -2% |
| sRGB Coverage (%) | 59.3 | 58.6 -1% | 63.5 7% | 57.2 -4% | 62 5% | 59.6 1% |
| AdobeRGB 1998 Coverage (%) | 42.03 | 41.18 -2% | 43.8 4% | 39.37 -6% | 42.94 2% | 41.16 -2% |
| Response Times | -1% | 17% | 20% | 24% | 30% | |
| Response Time Grey 50% / Grey 80% * (ms) | 44 ? | 48.4 ? -10% | 40.8 ? 7% | 41.6 ? 5% | 40 ? 9% | 36.4 ? 17% |
| Response Time Black / White * (ms) | 42 ? | 38.4 ? 9% | 30.8 ? 27% | 27.2 ? 35% | 26 ? 38% | 24 ? 43% |
| PWM Frequency (Hz) | 1000 ? | 1250 ? | 25000 ? | 208 ? | ||
| Screen | 7% | 2% | -13% | 5% | -20% | |
| Brightness middle (cd/m²) | 240 | 305 27% | 241 0% | 256 7% | 200 -17% | 250 4% |
| Brightness (cd/m²) | 227 | 295 30% | 230 1% | 238 5% | 196 -14% | 241 6% |
| Brightness Distribution (%) | 79 | 90 14% | 75 -5% | 85 8% | 67 -15% | 81 3% |
| Black Level * (cd/m²) | 0.48 | 0.23 52% | 0.17 65% | 0.23 52% | 0.17 65% | 0.25 48% |
| Contrast (:1) | 500 | 1326 165% | 1418 184% | 1113 123% | 1176 135% | 1000 100% |
| Colorchecker dE 2000 * | 4.2 | 5.3 -26% | 4.7 -12% | 6.2 -48% | 4.26 -1% | 5.5 -31% |
| Colorchecker dE 2000 max. * | 7.16 | 18.9 -164% | 19.7 -175% | 18.2 -154% | 9.7 -35% | 23.5 -228% |
| Greyscale dE 2000 * | 1.75 | 2.3 -31% | 2.6 -49% | 3.8 -117% | 3.15 -80% | 3.5 -100% |
| Gamma | 2.36 93% | 2.09 105% | 2.12 104% | 2.5 88% | 2.31 95% | 2.27 97% |
| CCT | 6387 102% | 6246 104% | 6507 100% | 6643 98% | 6882 94% | 7049 92% |
| Color Space (Percent of AdobeRGB 1998) (%) | 38 | 37.7 -1% | 40.3 6% | 36.1 -5% | 40 5% | 37.9 0% |
| Color Space (Percent of sRGB) (%) | 59 | 58.2 -1% | 63.3 7% | 56.9 -4% | 62 5% | 59.4 1% |
| Colorchecker dE 2000 calibrated * | 5 | 4.2 | 5.2 | 4.8 | ||
| Totalt genomsnitt (program/inställningar) | 1% /
4% | 8% /
5% | 1% /
-7% | 11% /
7% | 3% /
-9% |
* ... mindre är bättre
Visa svarstider
| ↔ Svarstid svart till vitt | ||
|---|---|---|
| 42 ms ... stiga ↗ och falla ↘ kombinerat | ↗ 28 ms stiga | 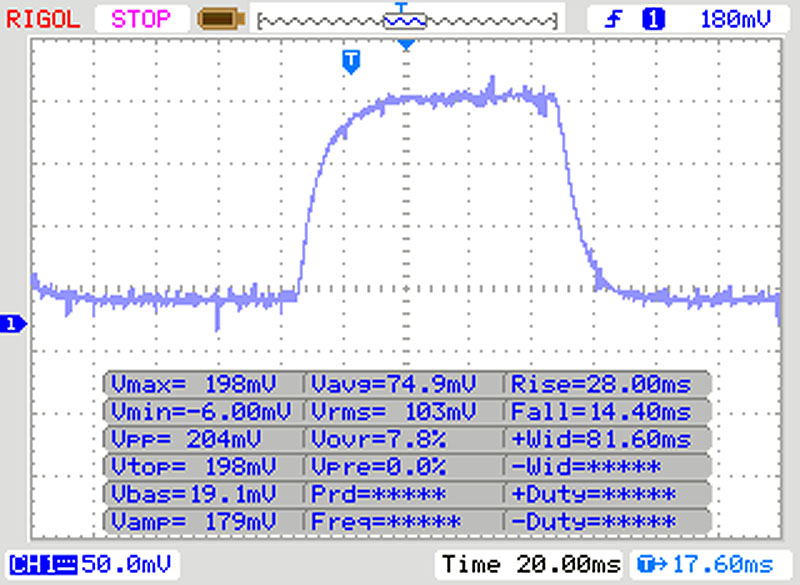 |
| ↘ 14 ms hösten | ||
| Skärmen visar långsamma svarsfrekvenser i våra tester och kommer att vara otillfredsställande för spelare. I jämförelse sträcker sig alla testade enheter från 0.1 (minst) till 240 (maximalt) ms. » 98 % av alla enheter är bättre. Detta innebär att den uppmätta svarstiden är sämre än genomsnittet av alla testade enheter (19.8 ms). | ||
| ↔ Svarstid 50 % grått till 80 % grått | ||
| 44 ms ... stiga ↗ och falla ↘ kombinerat | ↗ 22 ms stiga | 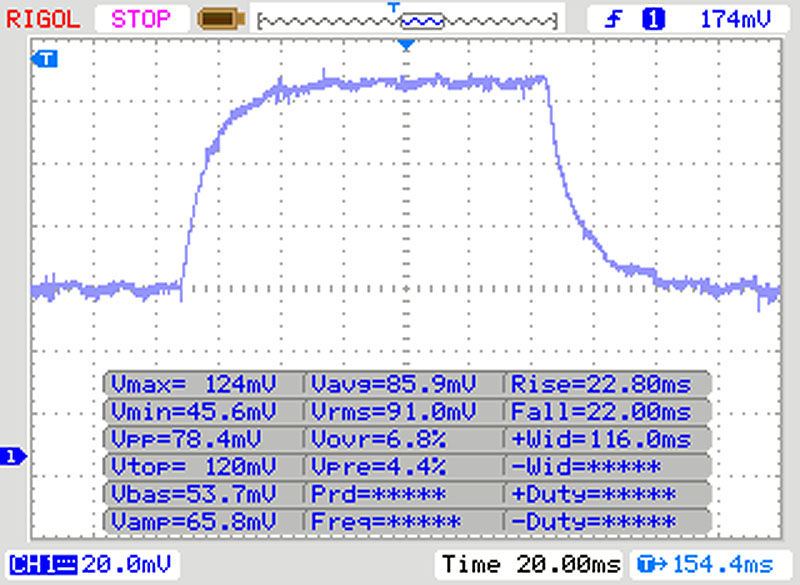 |
| ↘ 22 ms hösten | ||
| Skärmen visar långsamma svarsfrekvenser i våra tester och kommer att vara otillfredsställande för spelare. I jämförelse sträcker sig alla testade enheter från 0.165 (minst) till 636 (maximalt) ms. » 73 % av alla enheter är bättre. Detta innebär att den uppmätta svarstiden är sämre än genomsnittet av alla testade enheter (31 ms). | ||
Skärmflimmer / PWM (Puls-Width Modulation)
| Skärmflimmer / PWM upptäckt | 1000 Hz | ≤ 90 % ljusstyrka inställning | 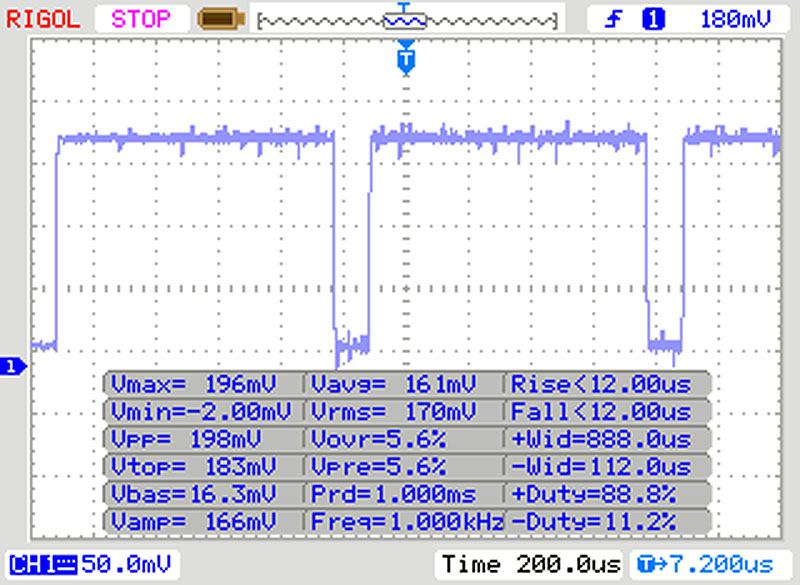 |
Displayens bakgrundsbelysning flimrar vid 1000 Hz (i värsta fall, t.ex. med PWM) Flimrande upptäckt vid en ljusstyrkeinställning på 90 % och lägre. Det ska inte finnas något flimmer eller PWM över denna ljusstyrkeinställning. Frekvensen för 1000 Hz är ganska hög, så de flesta användare som är känsliga för PWM bör inte märka något flimmer. Som jämförelse: 52 % av alla testade enheter använder inte PWM för att dämpa skärmen. Om PWM upptäcktes mättes ett medelvärde av 7763 (minst: 5 - maximum: 343500) Hz. | |||
| Cinebench R10 | |
| Rendering Single 32Bit | |
| Genomsnitt av klass Office (4212 - 10817, n=15, senaste 2 åren) | |
| HP ProBook 440 G6-5TK01EA | |
| Lenovo ThinkPad E490-20N8000RGE | |
| Genomsnitt Intel Core i3-8145U (5925 - 5953, n=2) | |
| Dell Latitude 3400 | |
| HP ProBook 445 G6 | |
| Rendering Multiple CPUs 32Bit | |
| Genomsnitt av klass Office (7657 - 60850, n=15, senaste 2 åren) | |
| HP ProBook 440 G6-5TK01EA | |
| Lenovo ThinkPad E490-20N8000RGE | |
| HP ProBook 445 G6 | |
| Genomsnitt Intel Core i3-8145U (11790 - 13074, n=2) | |
| Dell Latitude 3400 | |
| Cinebench R20 | |
| CPU (Single Core) | |
| Genomsnitt av klass Office (345 - 816, n=73, senaste 2 åren) | |
| Lenovo ThinkPad E490-20N8000RGE | |
| HP ProBook 445 G6 | |
| Lenovo ThinkPad E495-20NE000JGE | |
| Dell Latitude 3400 | |
| Genomsnitt Intel Core i3-8145U (n=1) | |
| CPU (Multi Core) | |
| Genomsnitt av klass Office (648 - 8840, n=73, senaste 2 åren) | |
| Lenovo ThinkPad E495-20NE000JGE | |
| HP ProBook 445 G6 | |
| Lenovo ThinkPad E490-20N8000RGE | |
| Dell Latitude 3400 | |
| Genomsnitt Intel Core i3-8145U (n=1) | |
| Geekbench 3 | |
| 32 Bit Multi-Core Score | |
| Lenovo ThinkPad E490-20N8000RGE | |
| HP ProBook 445 G6 | |
| Dell Latitude 3400 | |
| Genomsnitt Intel Core i3-8145U (6870 - 7572, n=3) | |
| 32 Bit Single-Core Score | |
| Lenovo ThinkPad E490-20N8000RGE | |
| Dell Latitude 3400 | |
| Genomsnitt Intel Core i3-8145U (3350 - 3457, n=3) | |
| HP ProBook 445 G6 | |
| Geekbench 4.4 | |
| 64 Bit Multi-Core Score | |
| Genomsnitt av klass Office (23754 - 41544, n=9, senaste 2 åren) | |
| HP ProBook 440 G6-5TK01EA | |
| Lenovo ThinkPad E490-20N8000RGE | |
| Lenovo ThinkPad E495-20NE000JGE | |
| HP ProBook 445 G6 | |
| Dell Latitude 3400 | |
| Genomsnitt Intel Core i3-8145U (7780 - 8455, n=3) | |
| 64 Bit Single-Core Score | |
| Genomsnitt av klass Office (4564 - 8042, n=9, senaste 2 åren) | |
| HP ProBook 440 G6-5TK01EA | |
| Lenovo ThinkPad E490-20N8000RGE | |
| Dell Latitude 3400 | |
| Genomsnitt Intel Core i3-8145U (4090 - 4421, n=3) | |
| Lenovo ThinkPad E495-20NE000JGE | |
| HP ProBook 445 G6 | |
| Geekbench 5.0 | |
| 5.0 Multi-Core | |
| Genomsnitt av klass Office (5706 - 11112, n=8, senaste 2 åren) | |
| Dell Latitude 3400 | |
| Genomsnitt Intel Core i3-8145U (n=1) | |
| 5.0 Single-Core | |
| Genomsnitt av klass Office (990 - 1992, n=8, senaste 2 åren) | |
| Dell Latitude 3400 | |
| Genomsnitt Intel Core i3-8145U (n=1) | |
| Mozilla Kraken 1.1 - Total | |
| HP ProBook 445 G6 (Edge 44) | |
| Lenovo ThinkPad E495-20NE000JGE (Edge 44.17763.1.0) | |
| Genomsnitt Intel Core i3-8145U (1252 - 1314, n=2) | |
| Dell Latitude 3400 (Edge 44) | |
| Dell Latitude 3490 (Edge) | |
| Lenovo ThinkPad E490-20N8000RGE (Edge 44) | |
| HP ProBook 440 G6-5TK01EA (EDGE: 42.17134.1.0) | |
| Genomsnitt av klass Office (391 - 1297, n=76, senaste 2 åren) | |
| Octane V2 - Total Score | |
| Genomsnitt av klass Office (49011 - 126830, n=20, senaste 2 åren) | |
| HP ProBook 440 G6-5TK01EA (EDGE: 42.17134.1.0) | |
| Lenovo ThinkPad E490-20N8000RGE (Edge 44) | |
| Dell Latitude 3490 (Edge) | |
| Genomsnitt Intel Core i3-8145U (28265 - 29392, n=2) | |
| Dell Latitude 3400 (Edge 44) | |
| Lenovo ThinkPad E495-20NE000JGE (Edge 44.17763.1.0) | |
| HP ProBook 445 G6 (Edge 44) | |
| JetStream 1.1 - 1.1 Total | |
| HP ProBook 440 G6-5TK01EA (EDGE: 42.17134.1.0) | |
| Lenovo ThinkPad E490-20N8000RGE (Edge 44) | |
| Dell Latitude 3490 (Edge) | |
| Genomsnitt Intel Core i3-8145U (205 - 227, n=3) | |
| Dell Latitude 3400 (Edge 44) | |
| Lenovo ThinkPad E495-20NE000JGE (Edge 44.17763.1.0) | |
* ... mindre är bättre
| PCMark 8 Home Score Accelerated v2 | 2959 poäng | |
| PCMark 8 Creative Score Accelerated v2 | 3016 poäng | |
| PCMark 8 Work Score Accelerated v2 | 4552 poäng | |
| PCMark 10 Score | 3399 poäng | |
Hjälp | ||
| PCMark 8 - Home Score Accelerated v2 | |
| Genomsnitt av klass Office (n=1senaste 2 åren) | |
| Dell Latitude 3490 | |
| HP ProBook 440 G6-5TK01EA | |
| Lenovo ThinkPad E490-20N8000RGE | |
| HP ProBook 445 G6 | |
| Genomsnitt Intel Core i3-8145U, Intel UHD Graphics 620 (2959 - 3281, n=2) | |
| Dell Latitude 3400 | |

| Dell Latitude 3400 WDC PC SN520 SDAPNUW-256G | Lenovo ThinkPad E490-20N8000RGE SK hynix BC501 HFM256GDHTNG | Lenovo ThinkPad E495-20NE000JGE SK hynix BC501 HFM256GDHTNG | HP ProBook 440 G6-5TK01EA Toshiba XG5 KXG50ZNV512G | HP ProBook 445 G6 SK Hynix BC501 NVMe 256 GB | Dell Latitude 3490 SK hynix SC311 M.2 | Genomsnitt WDC PC SN520 SDAPNUW-256G | Genomsnitt av klass Office | |
|---|---|---|---|---|---|---|---|---|
| CrystalDiskMark 5.2 / 6 | -10% | -13% | 7% | -15% | -47% | -5% | 113% | |
| Write 4K (MB/s) | 107.9 | 110.7 3% | 121.3 12% | 117.6 9% | 110.4 2% | 71.7 -34% | 118.5 ? 10% | 154.4 ? 43% |
| Read 4K (MB/s) | 40.27 | 41.02 2% | 41.24 2% | 32.61 -19% | 39.46 -2% | 28.66 -29% | 42 ? 4% | 73.1 ? 82% |
| Write Seq (MB/s) | 1253 | 757 -40% | 814 -35% | 527 -58% | 808 -36% | 415.9 -67% | 1123 ? -10% | 2558 ? 104% |
| Read Seq (MB/s) | 1298 | 1037 -20% | 1098 -15% | 2181 68% | 1130 -13% | 500 -61% | 1208 ? -7% | 3237 ? 149% |
| Write 4K Q32T1 (MB/s) | 415 | 359 -13% | 267 -36% | 508 22% | 260.8 -37% | 278 -33% | 324 ? -22% | 424 ? 2% |
| Read 4K Q32T1 (MB/s) | 313.3 | 402.4 28% | 334.6 7% | 352.1 12% | 308 -2% | 252.9 -19% | 322 ? 3% | 513 ? 64% |
| Write Seq Q32T1 (MB/s) | 1297 | 833 -36% | 819 -37% | 526 -59% | 816 -37% | 502 -61% | 1091 ? -16% | 4030 ? 211% |
| Read Seq Q32T1 (MB/s) | 1728 | 1635 -5% | 1646 -5% | 3135 81% | 1783 3% | 553 -68% | 1729 ? 0% | 5985 ? 246% |
| 3DMark 11 Performance | 1598 poäng | |
| 3DMark Ice Storm Standard Score | 50752 poäng | |
| 3DMark Cloud Gate Standard Score | 6028 poäng | |
| 3DMark Fire Strike Score | 873 poäng | |
| 3DMark Time Spy Score | 353 poäng | |
Hjälp | ||
| 3DMark 11 - 1280x720 Performance GPU | |
| Genomsnitt av klass Office (2551 - 18313, n=70, senaste 2 åren) | |
| HP ProBook 445 G6 | |
| Lenovo ThinkPad E495-20NE000JGE | |
| HP ProBook 440 G6-5TK01EA | |
| Genomsnitt Intel UHD Graphics 620 (1144 - 3432, n=244) | |
| Lenovo ThinkPad E490-20N8000RGE | |
| Dell Latitude 3490 | |
| Dell Latitude 3400 (Dual-Channel) | |
| Dell Latitude 3400 | |
| 3DMark | |
| 1920x1080 Fire Strike Graphics | |
| Genomsnitt av klass Office (736 - 21871, n=73, senaste 2 åren) | |
| HP ProBook 445 G6 | |
| Lenovo ThinkPad E495-20NE000JGE | |
| HP ProBook 440 G6-5TK01EA | |
| Genomsnitt Intel UHD Graphics 620 (557 - 2608, n=213) | |
| Lenovo ThinkPad E490-20N8000RGE | |
| Dell Latitude 3490 | |
| Dell Latitude 3400 | |
| 1280x720 Cloud Gate Standard Graphics | |
| Genomsnitt av klass Office (11640 - 118515, n=37, senaste 2 åren) | |
| HP ProBook 445 G6 | |
| HP ProBook 440 G6-5TK01EA | |
| Genomsnitt Intel UHD Graphics 620 (6205 - 16400, n=225) | |
| Lenovo ThinkPad E490-20N8000RGE | |
| Dell Latitude 3490 | |
| Dell Latitude 3400 | |
| 2560x1440 Time Spy Graphics | |
| Genomsnitt av klass Office (493 - 6679, n=68, senaste 2 åren) | |
| HP ProBook 445 G6 | |
| Genomsnitt Intel UHD Graphics 620 (299 - 797, n=88) | |
| Lenovo ThinkPad E490-20N8000RGE | |
| Dell Latitude 3400 | |
| låg | med. | hög | ultra | |
|---|---|---|---|---|
| BioShock Infinite (2013) | 44.6 | 26.8 | 22.4 | 7 |
| BioShock Infinite - 1280x720 Very Low Preset | |
| HP ProBook 445 G6 | |
| Lenovo ThinkPad E495-20NE000JGE | |
| Dell Latitude 3400 (Dual-Channel) | |
| Genomsnitt Intel UHD Graphics 620 (18.3 - 90.2, n=187) | |
| HP ProBook 440 G6-5TK01EA | |
| Lenovo ThinkPad E490-20N8000RGE | |
| Dell Latitude 3490 | |
| Dell Latitude 3400 | |
Ljudnivå
| Låg belastning |
| 30.2 / 30.2 / 32.8 dB(A) |
| Hög belastning |
| 38.1 / 37.9 dB(A) |
 | ||
30 dB tyst 40 dB(A) hörbar 50 dB(A) högt ljud |
||
min: | ||
(±) Den maximala temperaturen på ovansidan är 40.8 °C / 105 F, jämfört med genomsnittet av 34.3 °C / 94 F , allt från 21.2 till 62.5 °C för klassen Office.
(+) Botten värms upp till maximalt 39.8 °C / 104 F, jämfört med genomsnittet av 36.8 °C / 98 F
(+) Vid tomgångsbruk är medeltemperaturen för ovansidan 26.8 °C / 80 F, jämfört med enhetsgenomsnittet på 29.5 °C / ### class_avg_f### F.
(+) Handledsstöden och pekplattan är kallare än hudtemperaturen med maximalt 26.7 °C / 80.1 F och är därför svala att ta på.
(±) Medeltemperaturen för handledsstödsområdet på liknande enheter var 27.5 °C / 81.5 F (+0.8 °C / 1.4 F).
Dell Latitude 3400 ljudanalys
(-) | inte särskilt höga högtalare (65.9 dB)
Bas 100 - 315 Hz
(-) | nästan ingen bas - i genomsnitt 26.6% lägre än medianen
(+) | basen är linjär (5.8% delta till föregående frekvens)
Mellan 400 - 2000 Hz
(±) | reducerade mids - i genomsnitt 5.7% lägre än median
(±) | linjäriteten för mids är genomsnittlig (11.6% delta till föregående frekvens)
Högsta 2 - 16 kHz
(+) | balanserade toppar - endast 1.5% från medianen
(+) | toppar är linjära (4.3% delta till föregående frekvens)
Totalt 100 - 16 000 Hz
(±) | linjäriteten för det totala ljudet är genomsnittlig (24.2% skillnad mot median)
Jämfört med samma klass
» 70% av alla testade enheter i den här klassen var bättre, 8% liknande, 22% sämre
» Den bästa hade ett delta på 7%, genomsnittet var 21%, sämst var 53%
Jämfört med alla testade enheter
» 73% av alla testade enheter var bättre, 6% liknande, 21% sämre
» Den bästa hade ett delta på 4%, genomsnittet var 24%, sämst var 134%
| Av/Standby | |
| Låg belastning | |
| Hög belastning |
|
Förklaring:
min: | |
| Battery Runtime - WiFi Websurfing | |
| Genomsnitt av klass Office (3.83 - 31.5, n=75, senaste 2 åren) | |
| Dell Latitude 3490 | |
| Dell Latitude 3400 | |
| HP ProBook 440 G6-5TK01EA | |
| Lenovo ThinkPad E495-20NE000JGE | |
| Lenovo ThinkPad E490-20N8000RGE | |
| HP ProBook 445 G6 | |
För
Emot

Läs den fullständiga versionen av den här recensionen på engelska här.
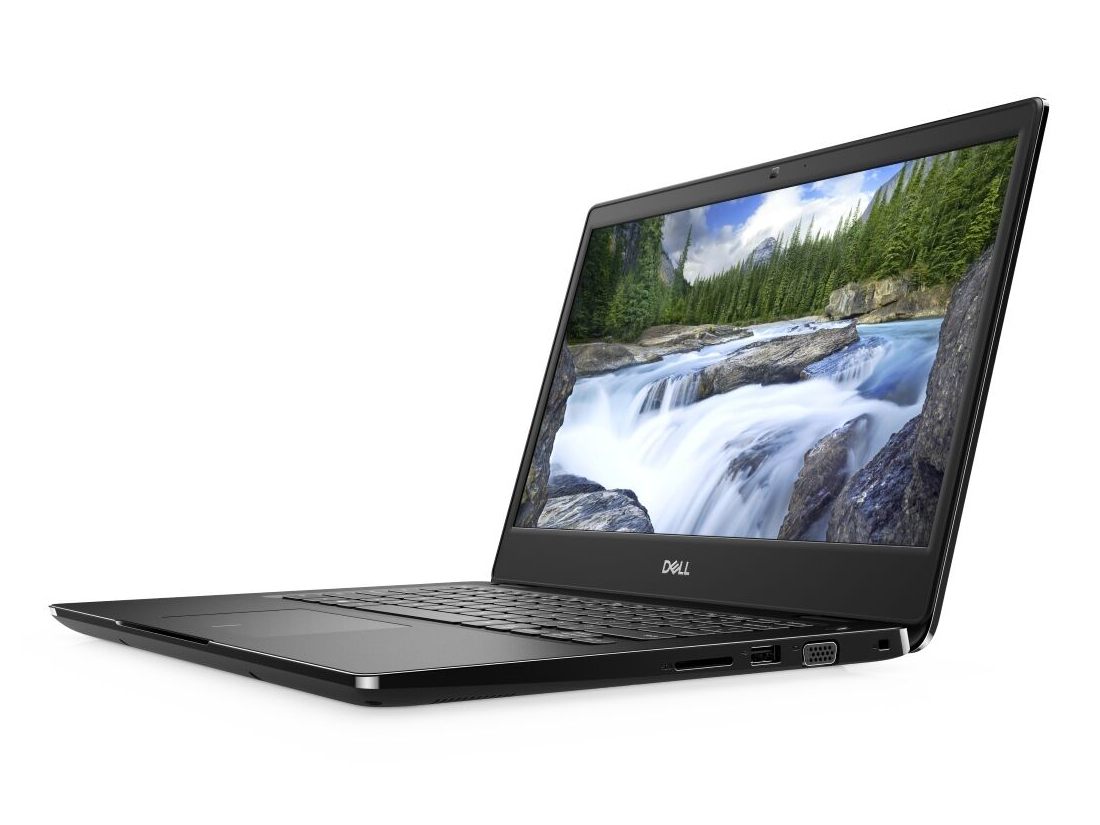
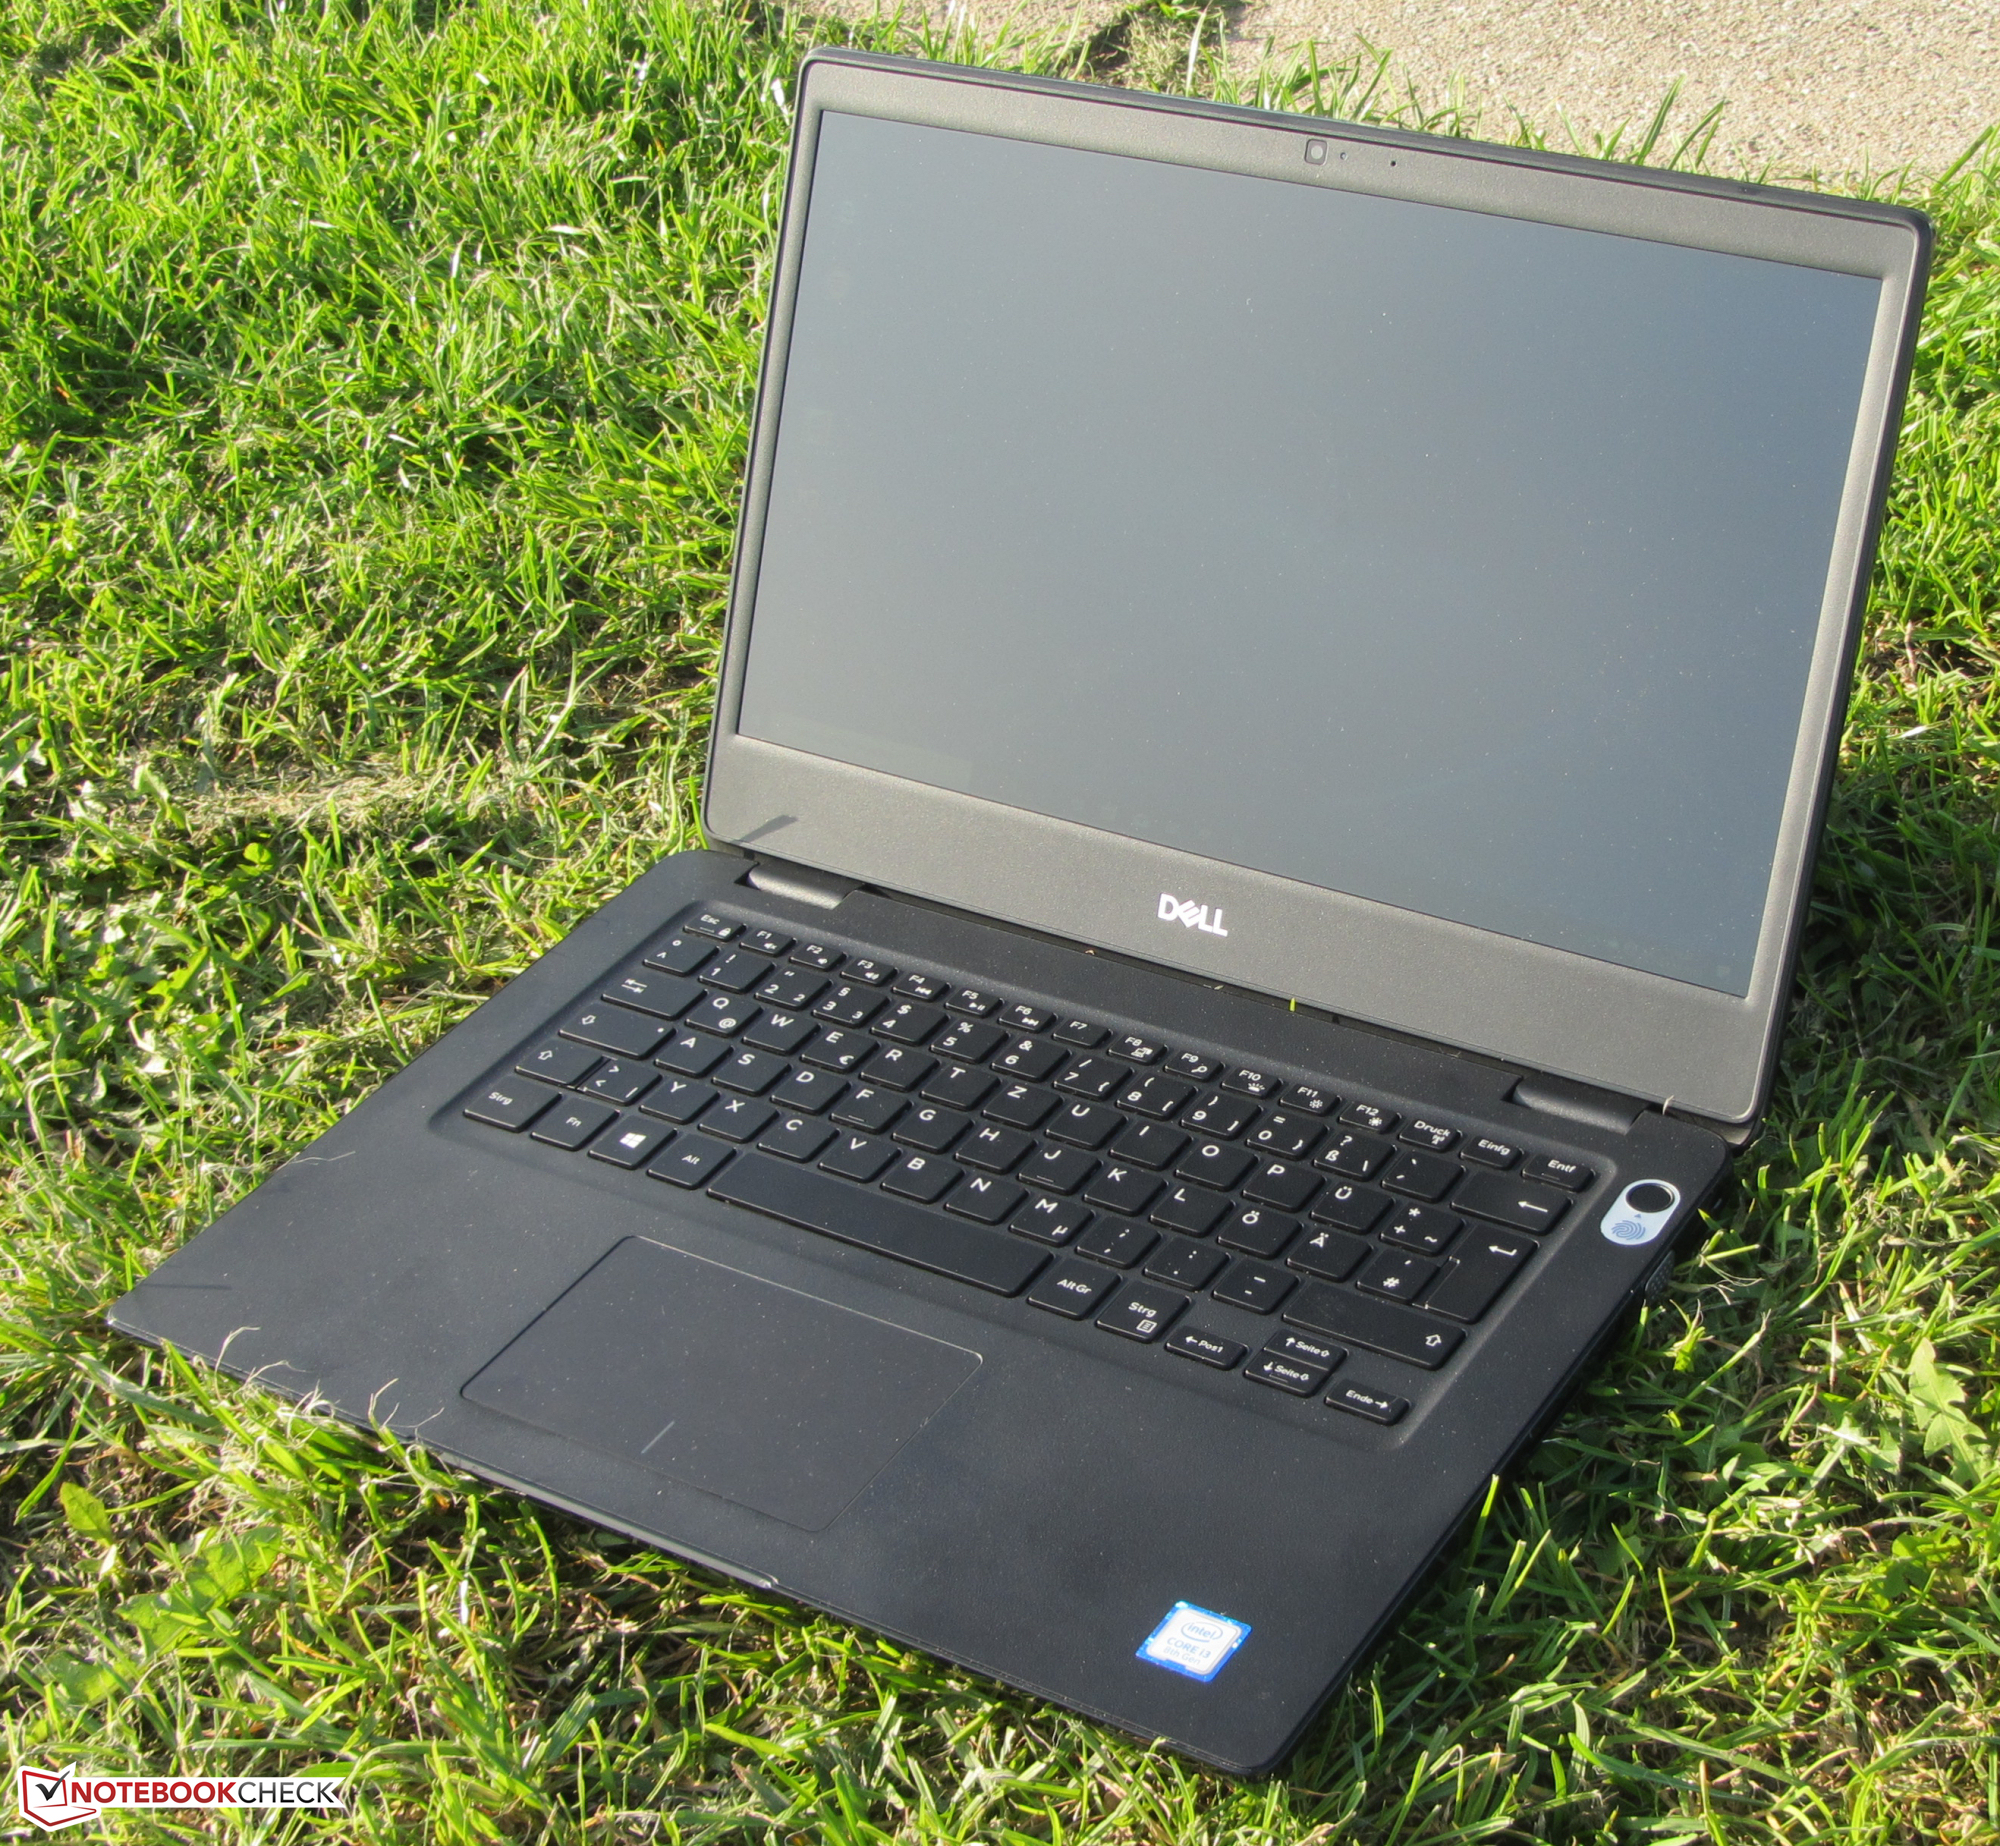
Dell Latitude 3400 är en vardaglig kontorslaptop, särskilt när den kommer med en Intel Core i3-8145U processor. Men den är tillräckligt kraftfull för alla vanliga kontors- och internetrelaterade uppgifter. Den blir heller aldrig för varm eller för högljudd.
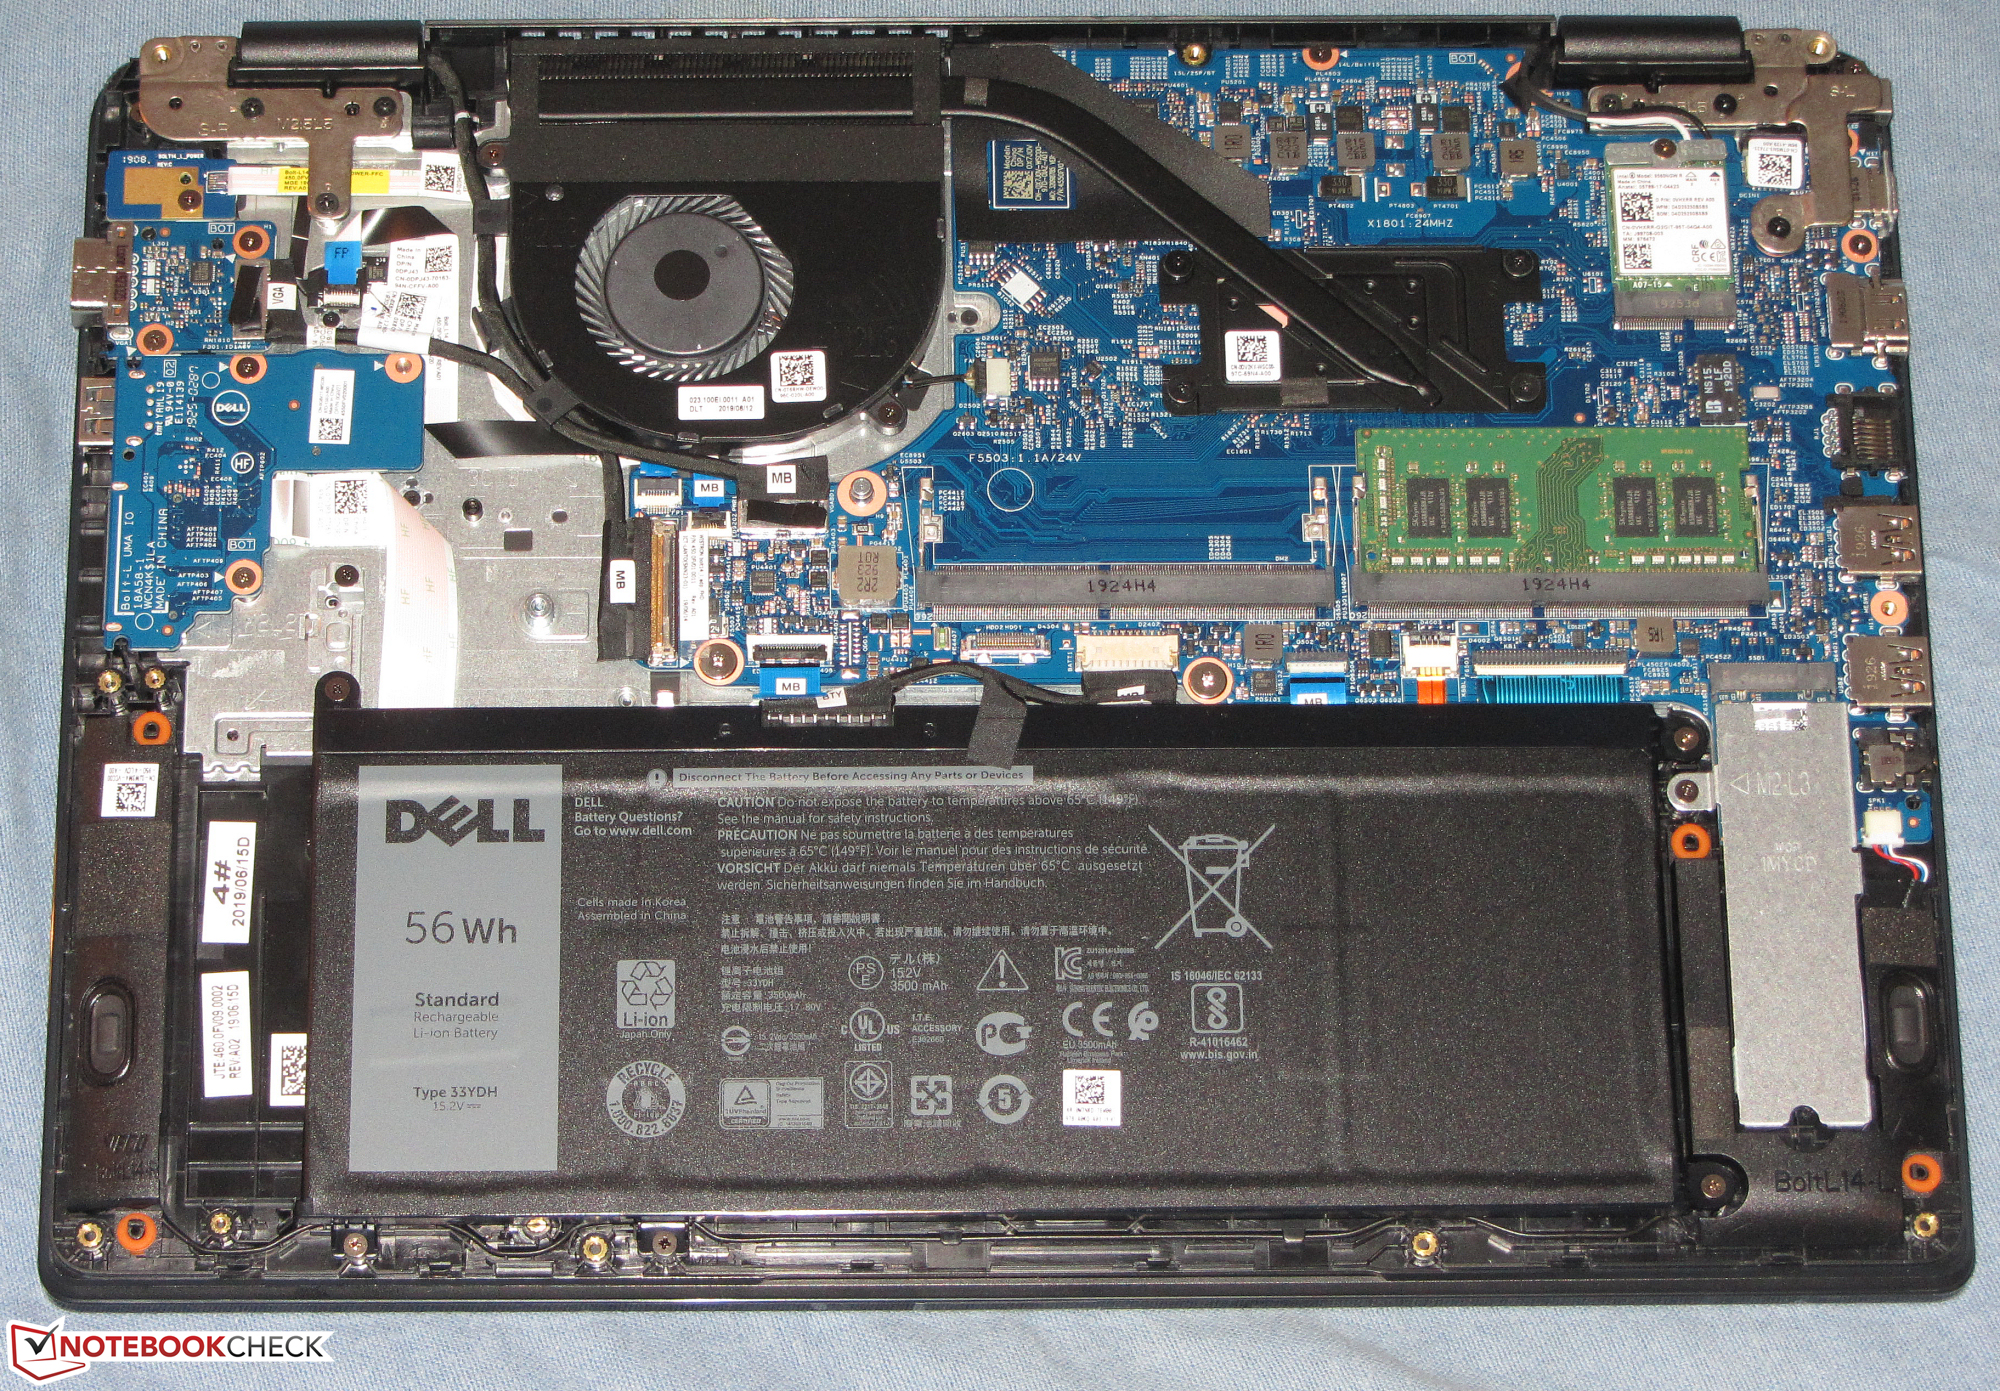
En snabb NVMe SSD-enhet säkrar dessutom att systemet känns smidigt och du kan byta ut den mot en enhet med större kapacitet om du skulle behöva. Men då får du montera isär enheten först.
Dell Latitude 3400 är en gedigen och billig kontorslaptop på 14 tum som inte kommer göra dig besviken när du arbetar.
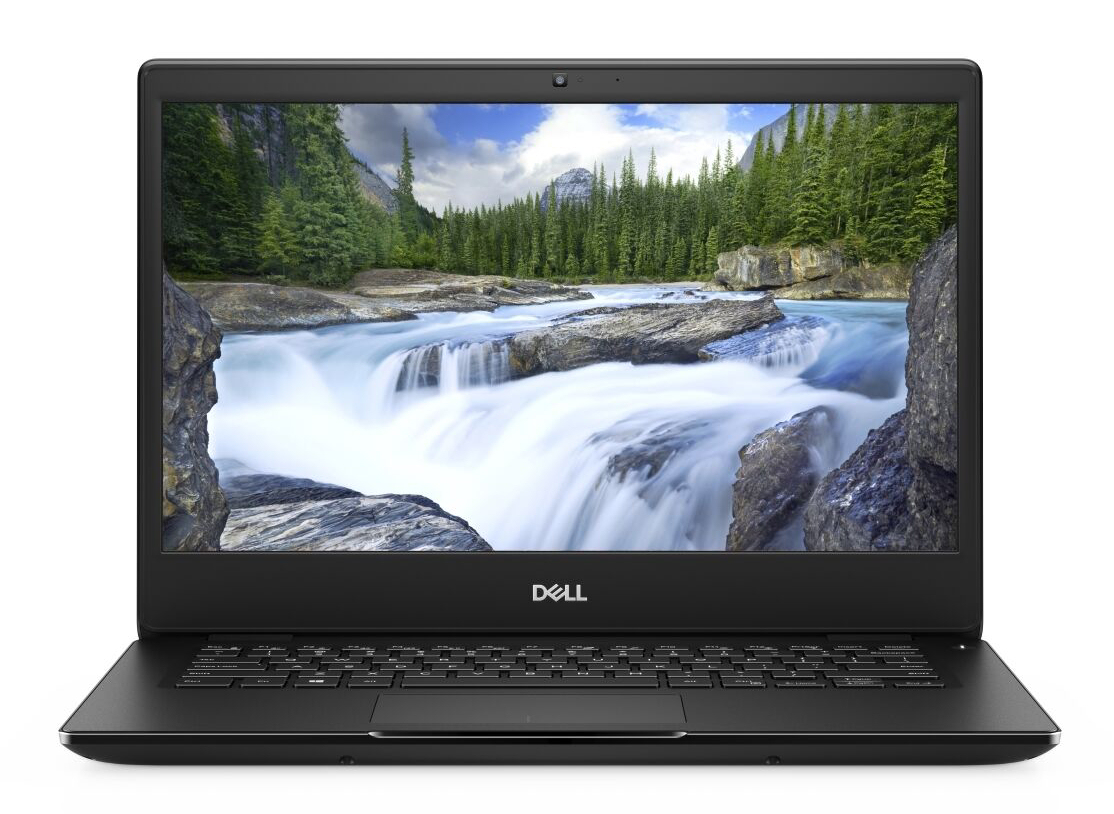
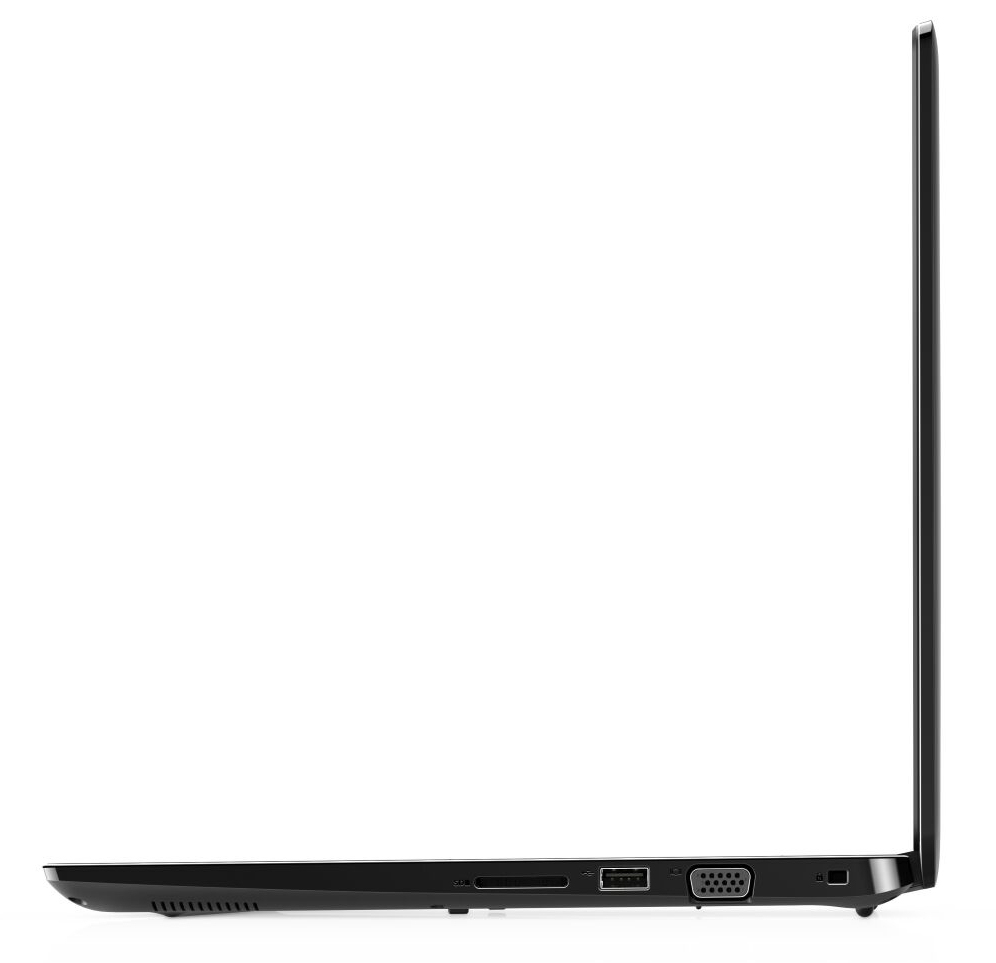
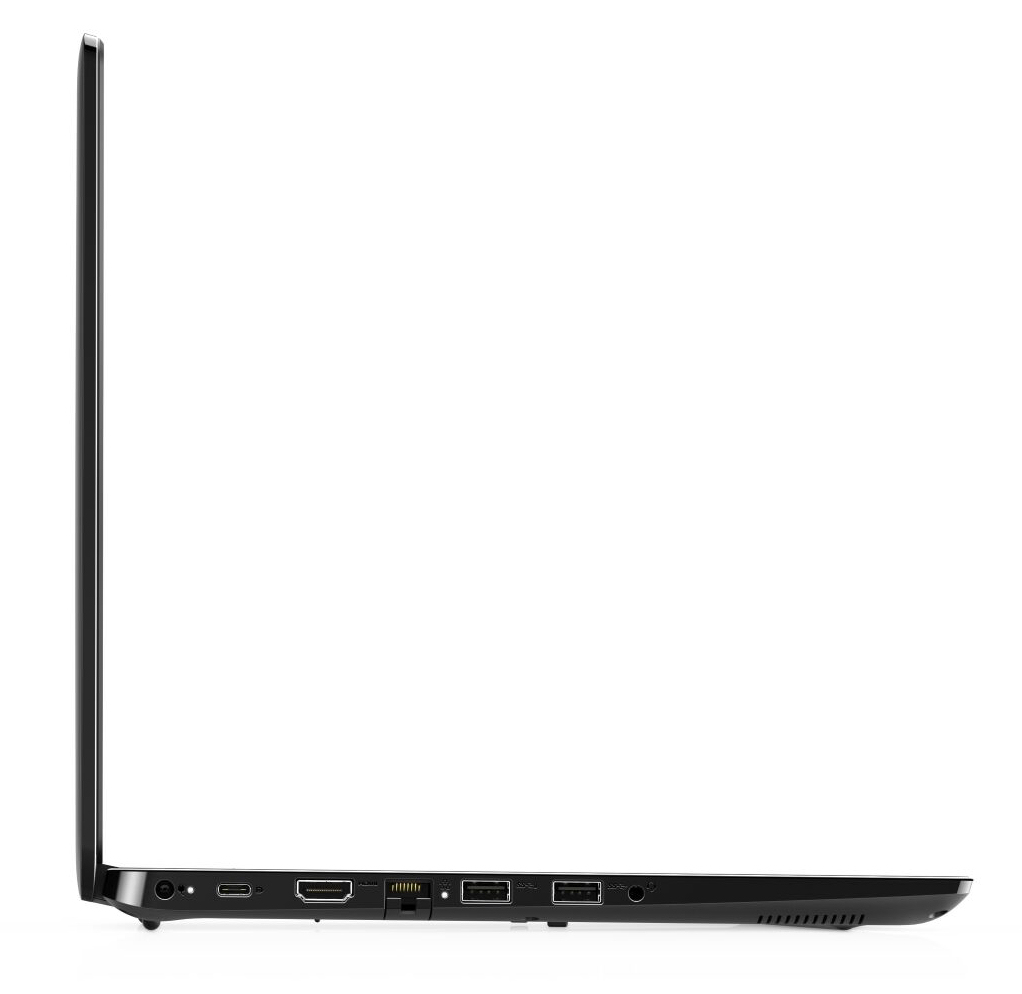
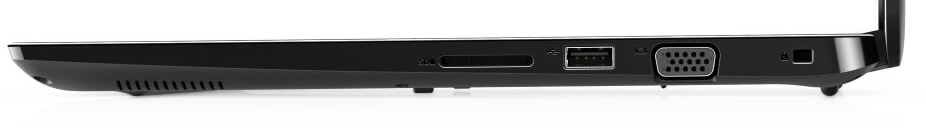
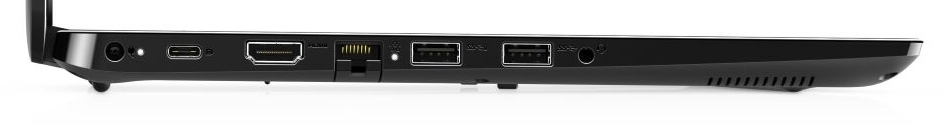
Vi är också fans av tangentbordet och styrplattan, för att inte tala om batteritiden. På samma sätt har Latitude 3400 ett bra utbud av portar, inklusive USB Typ C med stöd för DisplayPort och USB PD. Men den mörka skärmen med låg kontrast gjorde oss besvikna och det är synd att den har en långsam kortläsare och bara 12 månaders standardgaranti. För att sammanfatta så är Dell Latitude 3400 en skaplig kontorslaptop som kommer att tilltala den som har en begränsad budget.
Dell Latitude 3400
- 09/29/2019 v7 (old)
Sascha Mölck
Price comparison
