Test: Asus ROG Zephyrus M GM501 (i7-8750H, GTX 1070, Full-HD) Laptop (Sammanfattning)
| Networking | |
| iperf3 transmit AX12 | |
| Asus Zephyrus M GM501 | |
| Acer Predator Triton 700 | |
| MSI GS63VR 7RG-005 | |
| Asus Zephyrus GX501 | |
| Gigabyte Aero 15X | |
| iperf3 receive AX12 | |
| MSI GS63VR 7RG-005 | |
| Gigabyte Aero 15X | |
| Asus Zephyrus GX501 | |
| Asus Zephyrus M GM501 | |
| Acer Predator Triton 700 | |
| |||||||||||||||||||||||||
Distribution av ljusstyrkan: 89 %
Mitt på batteriet: 307 cd/m²
Kontrast: 1228:1 (Svärta: 0.25 cd/m²)
ΔE ColorChecker Calman: 5.74 | ∀{0.5-29.43 Ø4.71}
calibrated: 1.94
ΔE Greyscale Calman: 6.44 | ∀{0.09-98 Ø4.96}
93% sRGB (Argyll 1.6.3 3D)
60% AdobeRGB 1998 (Argyll 1.6.3 3D)
67.2% AdobeRGB 1998 (Argyll 3D)
92.7% sRGB (Argyll 3D)
66.1% Display P3 (Argyll 3D)
Gamma: 2.48
CCT: 8395 K
| Asus Zephyrus M GM501 AUO B156HAN07.1 (AUO71ED), IPS, 1920x1080 | Asus Zephyrus GX501 AUO B156HAN04.2 (AUO42ED), IPS, 1920x1080 | Acer Predator Triton 700 AUO B156HAN04.2 (AUO42ED), IPS, 1920x1080 | Gigabyte Aero 15X Chi Mei N156HCA-EA1 (CMN15D7), IPS, 1920x1080 | MSI GS63VR 7RG-005 Chi Mei N156HHE-GA1 (CMN15F4), TN LED, 1920x1080 | |
|---|---|---|---|---|---|
| Display | -2% | -5% | -2% | 25% | |
| Display P3 Coverage (%) | 66.1 | 64.8 -2% | 62.5 -5% | 64.7 -2% | 91.6 39% |
| sRGB Coverage (%) | 92.7 | 91.8 -1% | 88.7 -4% | 90.4 -2% | 100 8% |
| AdobeRGB 1998 Coverage (%) | 67.2 | 65.9 -2% | 63.5 -6% | 65.7 -2% | 86.6 29% |
| Response Times | -322% | -382% | -364% | -11% | |
| Response Time Grey 50% / Grey 80% * (ms) | 6.6 ? | 40.4 ? -512% | 44.8 ? -579% | 43.2 ? -555% | 10.4 ? -58% |
| Response Time Black / White * (ms) | 10.4 ? | 24 ? -131% | 29.6 ? -185% | 28.4 ? -173% | 6.6 ? 37% |
| PWM Frequency (Hz) | 26000 ? | 25510 ? | |||
| Screen | 2% | 0% | -7% | 18% | |
| Brightness middle (cd/m²) | 307 | 328 7% | 291 -5% | 338 10% | 269 -12% |
| Brightness (cd/m²) | 296 | 305 3% | 277 -6% | 324 9% | 254 -14% |
| Brightness Distribution (%) | 89 | 83 -7% | 84 -6% | 88 -1% | 85 -4% |
| Black Level * (cd/m²) | 0.25 | 0.25 -0% | 0.22 12% | 0.34 -36% | 0.21 16% |
| Contrast (:1) | 1228 | 1312 7% | 1323 8% | 994 -19% | 1281 4% |
| Colorchecker dE 2000 * | 5.74 | 6.02 -5% | 5.52 4% | 5.92 -3% | 3 48% |
| Colorchecker dE 2000 max. * | 11.32 | 10.14 10% | 10.72 5% | 11.77 -4% | 5.62 50% |
| Colorchecker dE 2000 calibrated * | 1.94 | ||||
| Greyscale dE 2000 * | 6.44 | 6.32 2% | 6.59 -2% | 7.45 -16% | 3.18 51% |
| Gamma | 2.48 89% | 2.28 96% | 2.44 90% | 2.58 85% | 2.25 98% |
| CCT | 8395 77% | 8194 79% | 7816 83% | 6366 102% | 7274 89% |
| Color Space (Percent of AdobeRGB 1998) (%) | 60 | 60 0% | 58 -3% | 59 -2% | 77 28% |
| Color Space (Percent of sRGB) (%) | 93 | 92 -1% | 89 -4% | 90 -3% | 100 8% |
| Totalt genomsnitt (program/inställningar) | -107% /
-42% | -129% /
-52% | -124% /
-53% | 11% /
15% |
* ... mindre är bättre
Visa svarstider
| ↔ Svarstid svart till vitt | ||
|---|---|---|
| 10.4 ms ... stiga ↗ och falla ↘ kombinerat | ↗ 5.2 ms stiga | 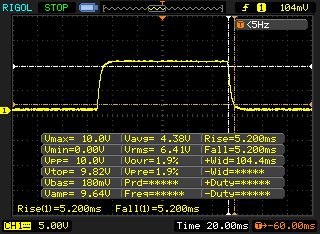 |
| ↘ 5.2 ms hösten | ||
| Skärmen visar bra svarsfrekvens i våra tester, men kan vara för långsam för konkurrenskraftiga spelare. I jämförelse sträcker sig alla testade enheter från 0.1 (minst) till 240 (maximalt) ms. » 28 % av alla enheter är bättre. Det betyder att den uppmätta svarstiden är bättre än genomsnittet av alla testade enheter (19.8 ms). | ||
| ↔ Svarstid 50 % grått till 80 % grått | ||
| 6.6 ms ... stiga ↗ och falla ↘ kombinerat | ↗ 3.4 ms stiga | 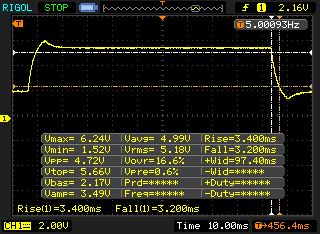 |
| ↘ 3.2 ms hösten | ||
| Skärmen visar väldigt snabba svarsfrekvenser i våra tester och borde vara mycket väl lämpad för fartfyllt spel. I jämförelse sträcker sig alla testade enheter från 0.165 (minst) till 636 (maximalt) ms. » 20 % av alla enheter är bättre. Det betyder att den uppmätta svarstiden är bättre än genomsnittet av alla testade enheter (31 ms). | ||
Skärmflimmer / PWM (Puls-Width Modulation)
| Skärmflimmer / PWM upptäcktes inte | 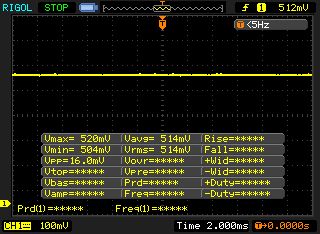 | ||
Som jämförelse: 52 % av alla testade enheter använder inte PWM för att dämpa skärmen. Om PWM upptäcktes mättes ett medelvärde av 7757 (minst: 5 - maximum: 343500) Hz. | |||
| PCMark 8 Home Score Accelerated v2 | 4627 poäng | |
| PCMark 8 Work Score Accelerated v2 | 5662 poäng | |
| PCMark 10 Score | 5194 poäng | |
Hjälp | ||
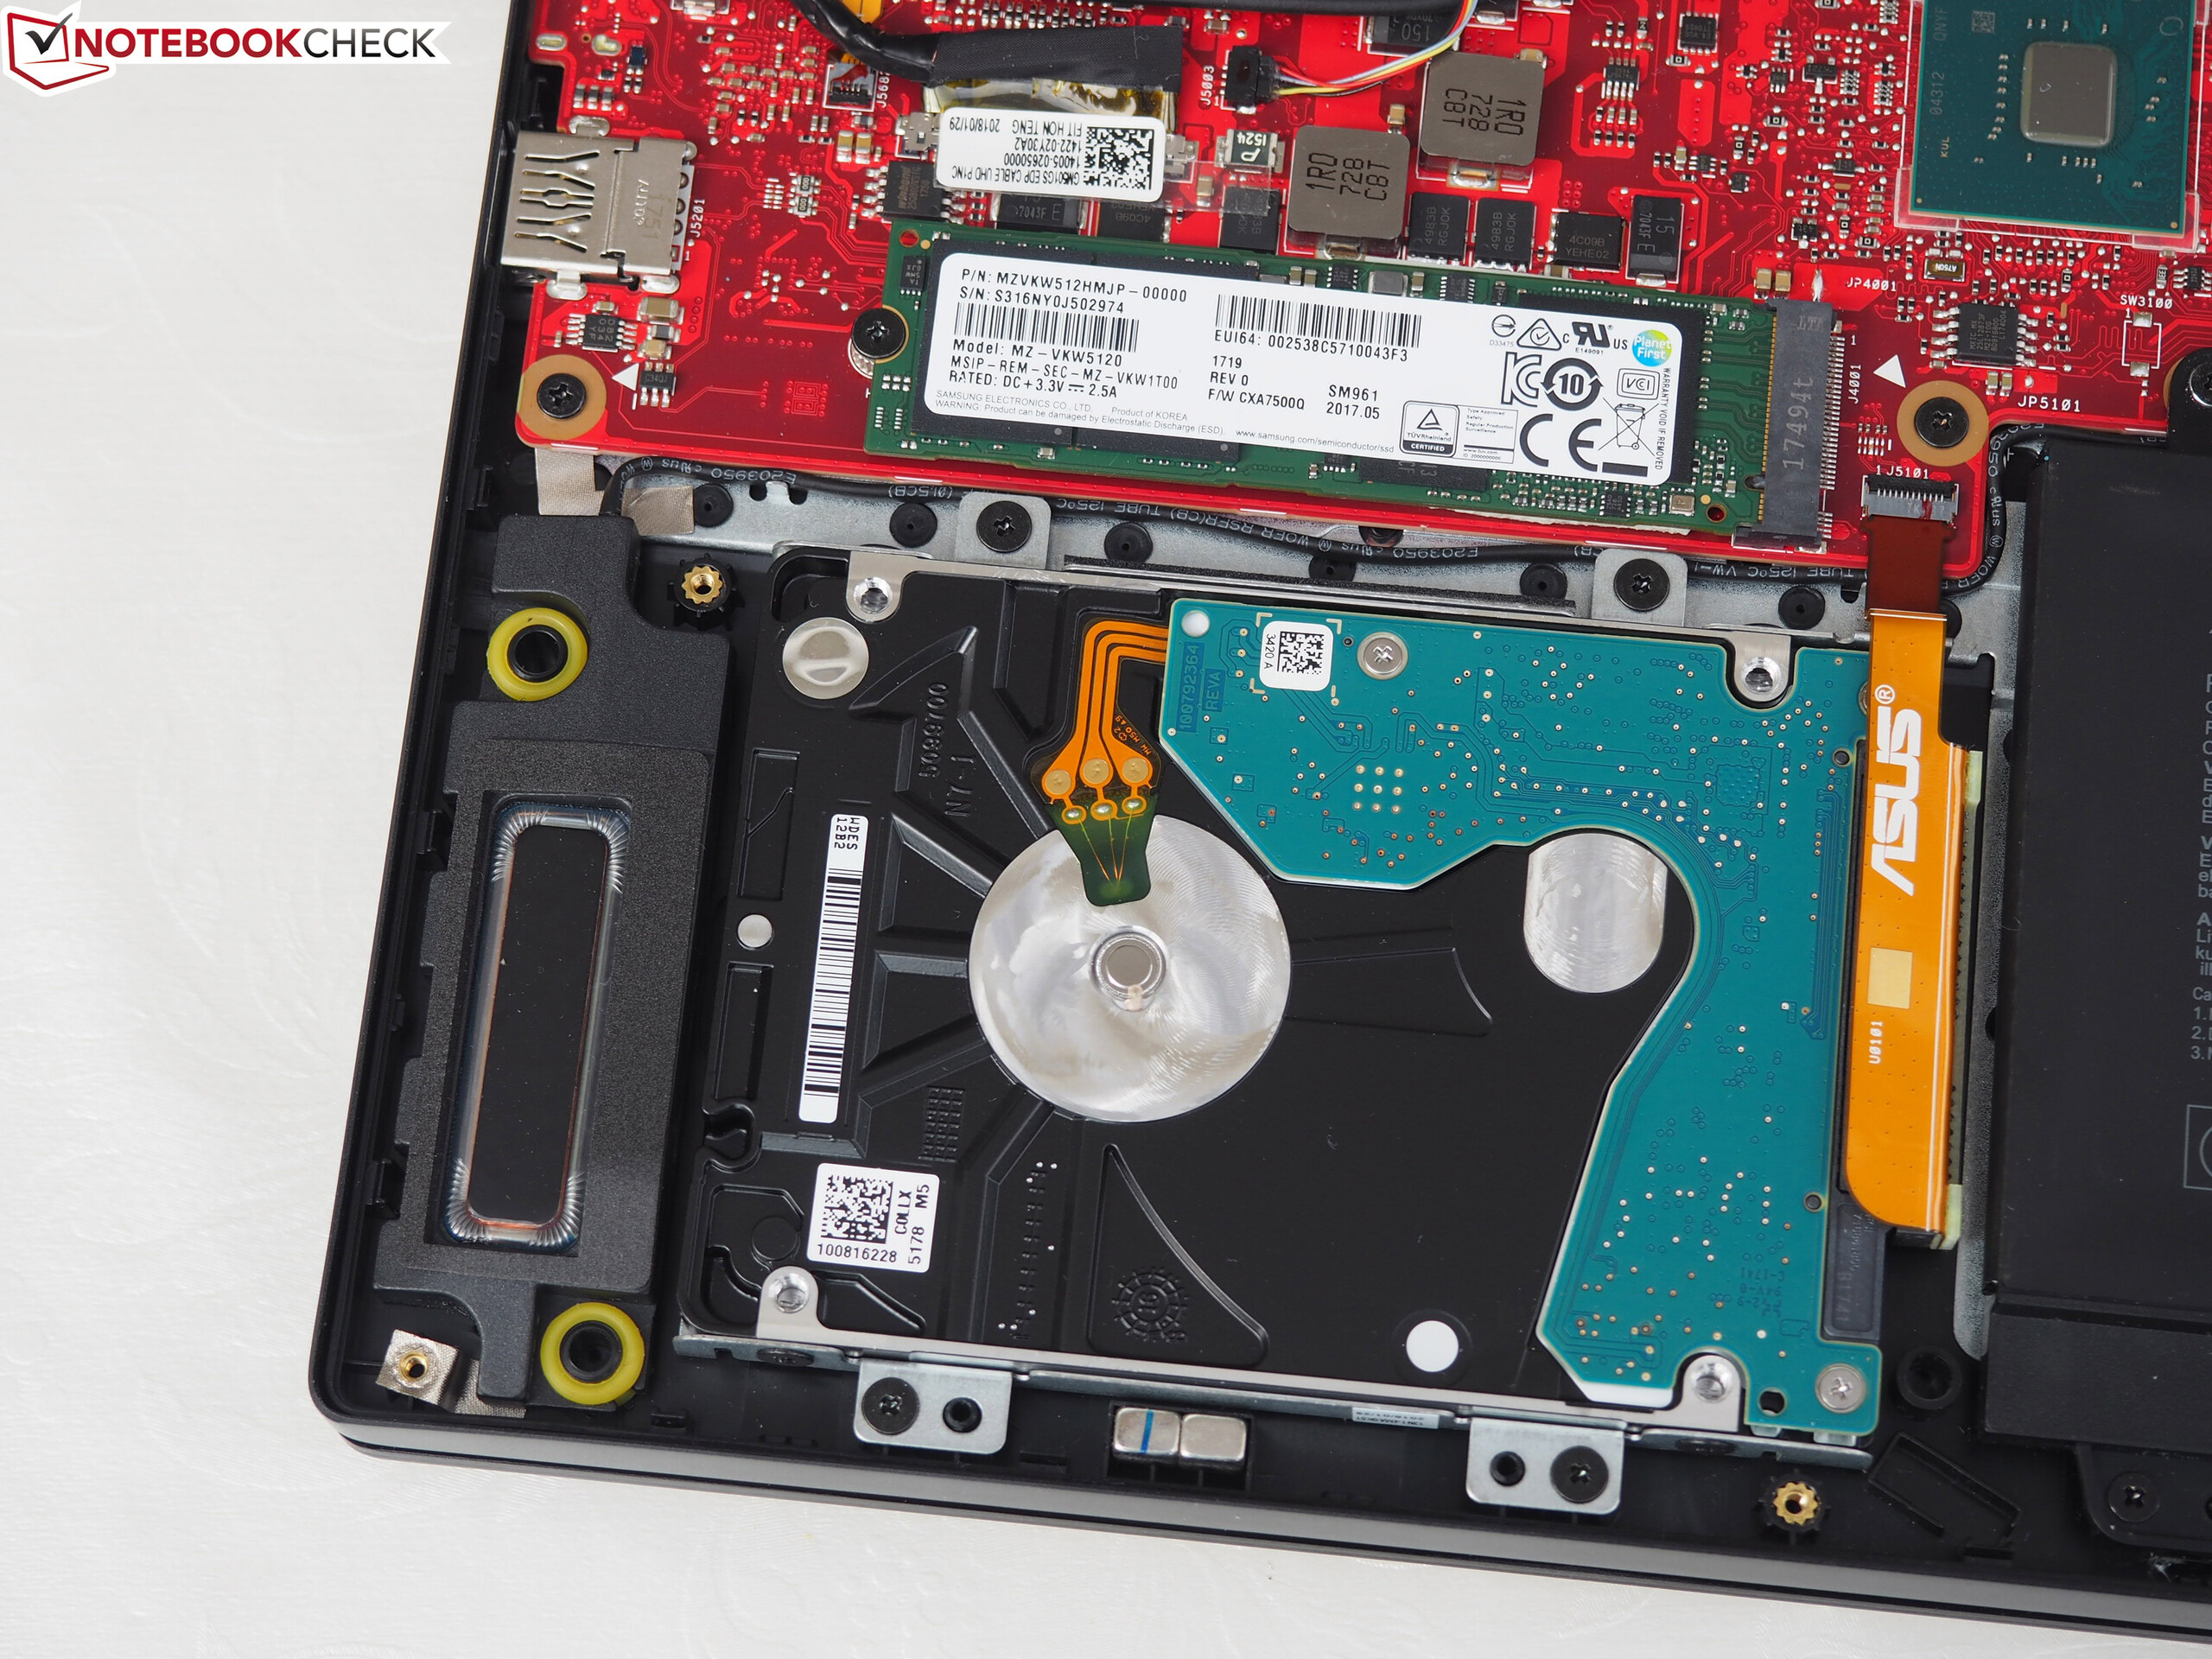
| Asus Zephyrus M GM501 Samsung SM961 MZVKW512HMJP m.2 PCI-e | Asus Zephyrus GX501 Samsung SSD SM961 1TB M.2 MZVKW1T0HMLH | Acer Predator Triton 700 2x SK Hynix Canvas SC300 512GB M.2 (HFS512G39MND) (RAID 0) | Gigabyte Aero 15X Samsung SM961 MZVKW512HMJP m.2 PCI-e | MSI GS63VR 7RG-005 Samsung SM961 MZVPW256HEGL | Genomsnitt Samsung SM961 MZVKW512HMJP m.2 PCI-e | |
|---|---|---|---|---|---|---|
| AS SSD | 5% | 2% | 8% | 5% | ||
| Seq Read (MB/s) | 2091 | 2517 20% | 2508 20% | 2382 14% | 2576 ? 23% | |
| Seq Write (MB/s) | 1580 | 2372 50% | 1124 -29% | 1281 -19% | 1438 ? -9% | |
| 4K Read (MB/s) | 43.42 | 41.47 -4% | 46.56 7% | 51 17% | 47.8 ? 10% | |
| 4K Write (MB/s) | 90.2 | 93 3% | 113.8 26% | 124.7 38% | 114.2 ? 27% | |
| Score Read (Points) | 1471 | 1350 -8% | 1522 3% | 1795 22% | 1475 ? 0% | |
| Score Write (Points) | 1446 | 1243 -14% | 1333 -8% | 1185 -18% | 1267 ? -12% | |
| Score Total (Points) | 3649 | 3282 -10% | 3570 -2% | 3848 5% | 3447 ? -6% |

| 3DMark 06 Standard Score | 31045 poäng | |
| 3DMark 11 Performance | 18278 poäng | |
| 3DMark Cloud Gate Standard Score | 36015 poäng | |
| 3DMark Fire Strike Score | 14945 poäng | |
Hjälp | ||
| The Witcher 3 - 1920x1080 Ultra Graphics & Postprocessing (HBAO+) | |
| Genomsnitt av klass Gaming (104.7 - 240, n=7, senaste 2 åren) | |
| Acer Predator Triton 700 | |
| Asus Zephyrus GX501 | |
| Asus Zephyrus M GM501 | |
| Genomsnitt NVIDIA GeForce GTX 1070 Mobile (48.2 - 68.4, n=41) | |
| Gigabyte Aero 15X | |
| MSI GS63VR 7RG-005 | |
| låg | med. | hög | ultra | |
|---|---|---|---|---|
| The Witcher 3 (2015) | 106 | 59.4 | ||
| Rocket League (2017) | 143 | |||
| Dirt 4 (2017) | 126 | 78.4 | ||
| Playerunknown's Battlegrounds (PUBG) (2017) | 131 | 86.2 | ||
| F1 2017 (2017) | 119 | 88 | ||
| Middle-earth: Shadow of War (2017) | 102 | 75 | ||
| The Evil Within 2 (2017) | 59.6 | 58.1 | ||
| ELEX (2017) | 99.1 | 75 | ||
| Call of Duty WWII (2017) | 144 | 117 | ||
| Kingdom Come: Deliverance (2018) | 75.6 | 54.2 |
Ljudnivå
| Låg belastning |
| 30 / 31 / 33 dB(A) |
| Hög belastning |
| 49 / 52 dB(A) |
 | ||
30 dB tyst 40 dB(A) hörbar 50 dB(A) högt ljud |
||
min: | ||
| Asus Zephyrus M GM501 GeForce GTX 1070 Mobile, i7-8750H | Asus Zephyrus GX501 GeForce GTX 1080 Max-Q, i7-7700HQ | Acer Predator Triton 700 GeForce GTX 1080 Max-Q, i7-7700HQ | Gigabyte Aero 15X GeForce GTX 1070 Max-Q, i7-7700HQ | MSI GS63VR 7RG-005 GeForce GTX 1070 Max-Q, i7-7700HQ | Genomsnitt NVIDIA GeForce GTX 1070 Mobile | Genomsnitt av klass Gaming | |
|---|---|---|---|---|---|---|---|
| Noise | 4% | -1% | 2% | 2% | -3% | 10% | |
| av / miljö * (dB) | 29 | 31 -7% | 31 -7% | 30 -3% | 30 -3% | 29.8 ? -3% | 24.1 ? 17% |
| Idle Minimum * (dB) | 30 | 32 -7% | 33 -10% | 31 -3% | 31 -3% | 31.9 ? -6% | 26 ? 13% |
| Idle Average * (dB) | 31 | 33 -6% | 34 -10% | 32 -3% | 34 -10% | 33.4 ? -8% | 27.4 ? 12% |
| Idle Maximum * (dB) | 33 | 34 -3% | 40 -21% | 36 -9% | 35 -6% | 36.3 ? -10% | 30.1 ? 9% |
| Load Average * (dB) | 49 | 39 20% | 41 16% | 39 20% | 42 14% | 44.5 ? 9% | 43.6 ? 11% |
| Witcher 3 ultra * (dB) | 50 | 42 16% | 43 14% | 44 12% | 44 12% | ||
| Load Maximum * (dB) | 52 | 46 12% | 48 8% | 52 -0% | 46 12% | 51.4 ? 1% | 54.2 ? -4% |
* ... mindre är bättre
(-) Den maximala temperaturen på ovansidan är 52 °C / 126 F, jämfört med genomsnittet av 40.4 °C / 105 F , allt från 21.2 till 68.8 °C för klassen Gaming.
(-) Botten värms upp till maximalt 49 °C / 120 F, jämfört med genomsnittet av 43.2 °C / 110 F
(+) Vid tomgångsbruk är medeltemperaturen för ovansidan 28.8 °C / 84 F, jämfört med enhetsgenomsnittet på 33.9 °C / ### class_avg_f### F.
(-) När du spelar The Witcher 3 är medeltemperaturen för ovansidan 43.3 °C / 110 F, jämfört med enhetsgenomsnittet på 33.9 °C / ## #class_avg_f### F.
(±) Handledsstöden och pekplattan kan bli väldigt varma vid beröring med maximalt 38 °C / 100.4 F.
(-) Medeltemperaturen för handledsstödsområdet på liknande enheter var 28.8 °C / 83.8 F (-9.2 °C / -16.6 F).
| Asus Zephyrus M GM501 GeForce GTX 1070 Mobile, i7-8750H | Asus Zephyrus GX501 GeForce GTX 1080 Max-Q, i7-7700HQ | Acer Predator Triton 700 GeForce GTX 1080 Max-Q, i7-7700HQ | Gigabyte Aero 15X GeForce GTX 1070 Max-Q, i7-7700HQ | MSI GS63VR 7RG-005 GeForce GTX 1070 Max-Q, i7-7700HQ | Genomsnitt NVIDIA GeForce GTX 1070 Mobile | Genomsnitt av klass Gaming | |
|---|---|---|---|---|---|---|---|
| Heat | -6% | -14% | 6% | 3% | 2% | 1% | |
| Maximum Upper Side * (°C) | 52 | 57 -10% | 61 -17% | 51 2% | 47 10% | 47.1 ? 9% | 45.2 ? 13% |
| Maximum Bottom * (°C) | 49 | 54 -10% | 69 -41% | 58 -18% | 63 -29% | 50.9 ? -4% | 48.1 ? 2% |
| Idle Upper Side * (°C) | 31 | 32 -3% | 29 6% | 25 19% | 25 19% | 30.6 ? 1% | 31 ? -0% |
| Idle Bottom * (°C) | 31 | 31 -0% | 32 -3% | 25 19% | 27 13% | 30.3 ? 2% | 34.2 ? -10% |
* ... mindre är bättre
Asus Zephyrus M GM501 ljudanalys
(+) | högtalare kan spela relativt högt (86 dB)
Bas 100 - 315 Hz
(+) | bra bas - bara 4.8% från medianen
(±) | linjäriteten för basen är genomsnittlig (8.3% delta till föregående frekvens)
Mellan 400 - 2000 Hz
(+) | balanserad mellan - endast 3.2% från medianen
(+) | mids är linjära (3.6% delta till föregående frekvens)
Högsta 2 - 16 kHz
(±) | högre toppar - i genomsnitt 5.8% högre än medianen
(+) | toppar är linjära (6.5% delta till föregående frekvens)
Totalt 100 - 16 000 Hz
(+) | det totala ljudet är linjärt (11.5% skillnad mot median)
Jämfört med samma klass
» 10% av alla testade enheter i den här klassen var bättre, 3% liknande, 87% sämre
» Den bästa hade ett delta på 6%, genomsnittet var 18%, sämst var 132%
Jämfört med alla testade enheter
» 8% av alla testade enheter var bättre, 2% liknande, 90% sämre
» Den bästa hade ett delta på 4%, genomsnittet var 23%, sämst var 134%
Acer Predator Triton 700 ljudanalys
(+) | högtalare kan spela relativt högt (83 dB)
Bas 100 - 315 Hz
(-) | nästan ingen bas - i genomsnitt 15.2% lägre än medianen
(±) | linjäriteten för basen är genomsnittlig (10.1% delta till föregående frekvens)
Mellan 400 - 2000 Hz
(±) | högre mellan - i genomsnitt 8% högre än median
(+) | mids är linjära (6.7% delta till föregående frekvens)
Högsta 2 - 16 kHz
(+) | balanserade toppar - endast 2% från medianen
(+) | toppar är linjära (4.9% delta till föregående frekvens)
Totalt 100 - 16 000 Hz
(±) | linjäriteten för det totala ljudet är genomsnittlig (19.9% skillnad mot median)
Jämfört med samma klass
» 70% av alla testade enheter i den här klassen var bättre, 6% liknande, 24% sämre
» Den bästa hade ett delta på 6%, genomsnittet var 18%, sämst var 132%
Jämfört med alla testade enheter
» 51% av alla testade enheter var bättre, 7% liknande, 42% sämre
» Den bästa hade ett delta på 4%, genomsnittet var 23%, sämst var 134%
| Av/Standby | |
| Låg belastning | |
| Hög belastning |
|
Förklaring:
min: | |
| Asus Zephyrus M GM501 GeForce GTX 1070 Mobile, i7-8750H | Asus Zephyrus GX501 GeForce GTX 1080 Max-Q, i7-7700HQ | Acer Predator Triton 700 GeForce GTX 1080 Max-Q, i7-7700HQ | Gigabyte Aero 15X GeForce GTX 1070 Max-Q, i7-7700HQ | MSI GS63VR 7RG-005 GeForce GTX 1070 Max-Q, i7-7700HQ | Genomsnitt NVIDIA GeForce GTX 1070 Mobile | Genomsnitt av klass Gaming | |
|---|---|---|---|---|---|---|---|
| Power Consumption | -1% | -33% | 28% | 21% | -21% | 0% | |
| Idle Minimum * (Watt) | 16 | 18 -13% | 28 -75% | 10 37% | 12 25% | 21 ? -31% | 13 ? 19% |
| Idle Average * (Watt) | 19 | 23 -21% | 33 -74% | 13 32% | 16 16% | 26.4 ? -39% | 19 ? -0% |
| Idle Maximum * (Watt) | 26 | 31 -19% | 41 -58% | 20 23% | 21 19% | 31.8 ? -22% | 24.6 ? 5% |
| Load Average * (Watt) | 103 | 79 23% | 94 9% | 79 23% | 85 17% | 117.7 ? -14% | 110.7 ? -7% |
| Witcher 3 ultra * (Watt) | 164 | 148 10% | 160 2% | 120 27% | 128 22% | ||
| Load Maximum * (Watt) | 223 | 196 12% | 222 -0% | 165 26% | 162 27% | 219 ? 2% | 259 ? -16% |
* ... mindre är bättre
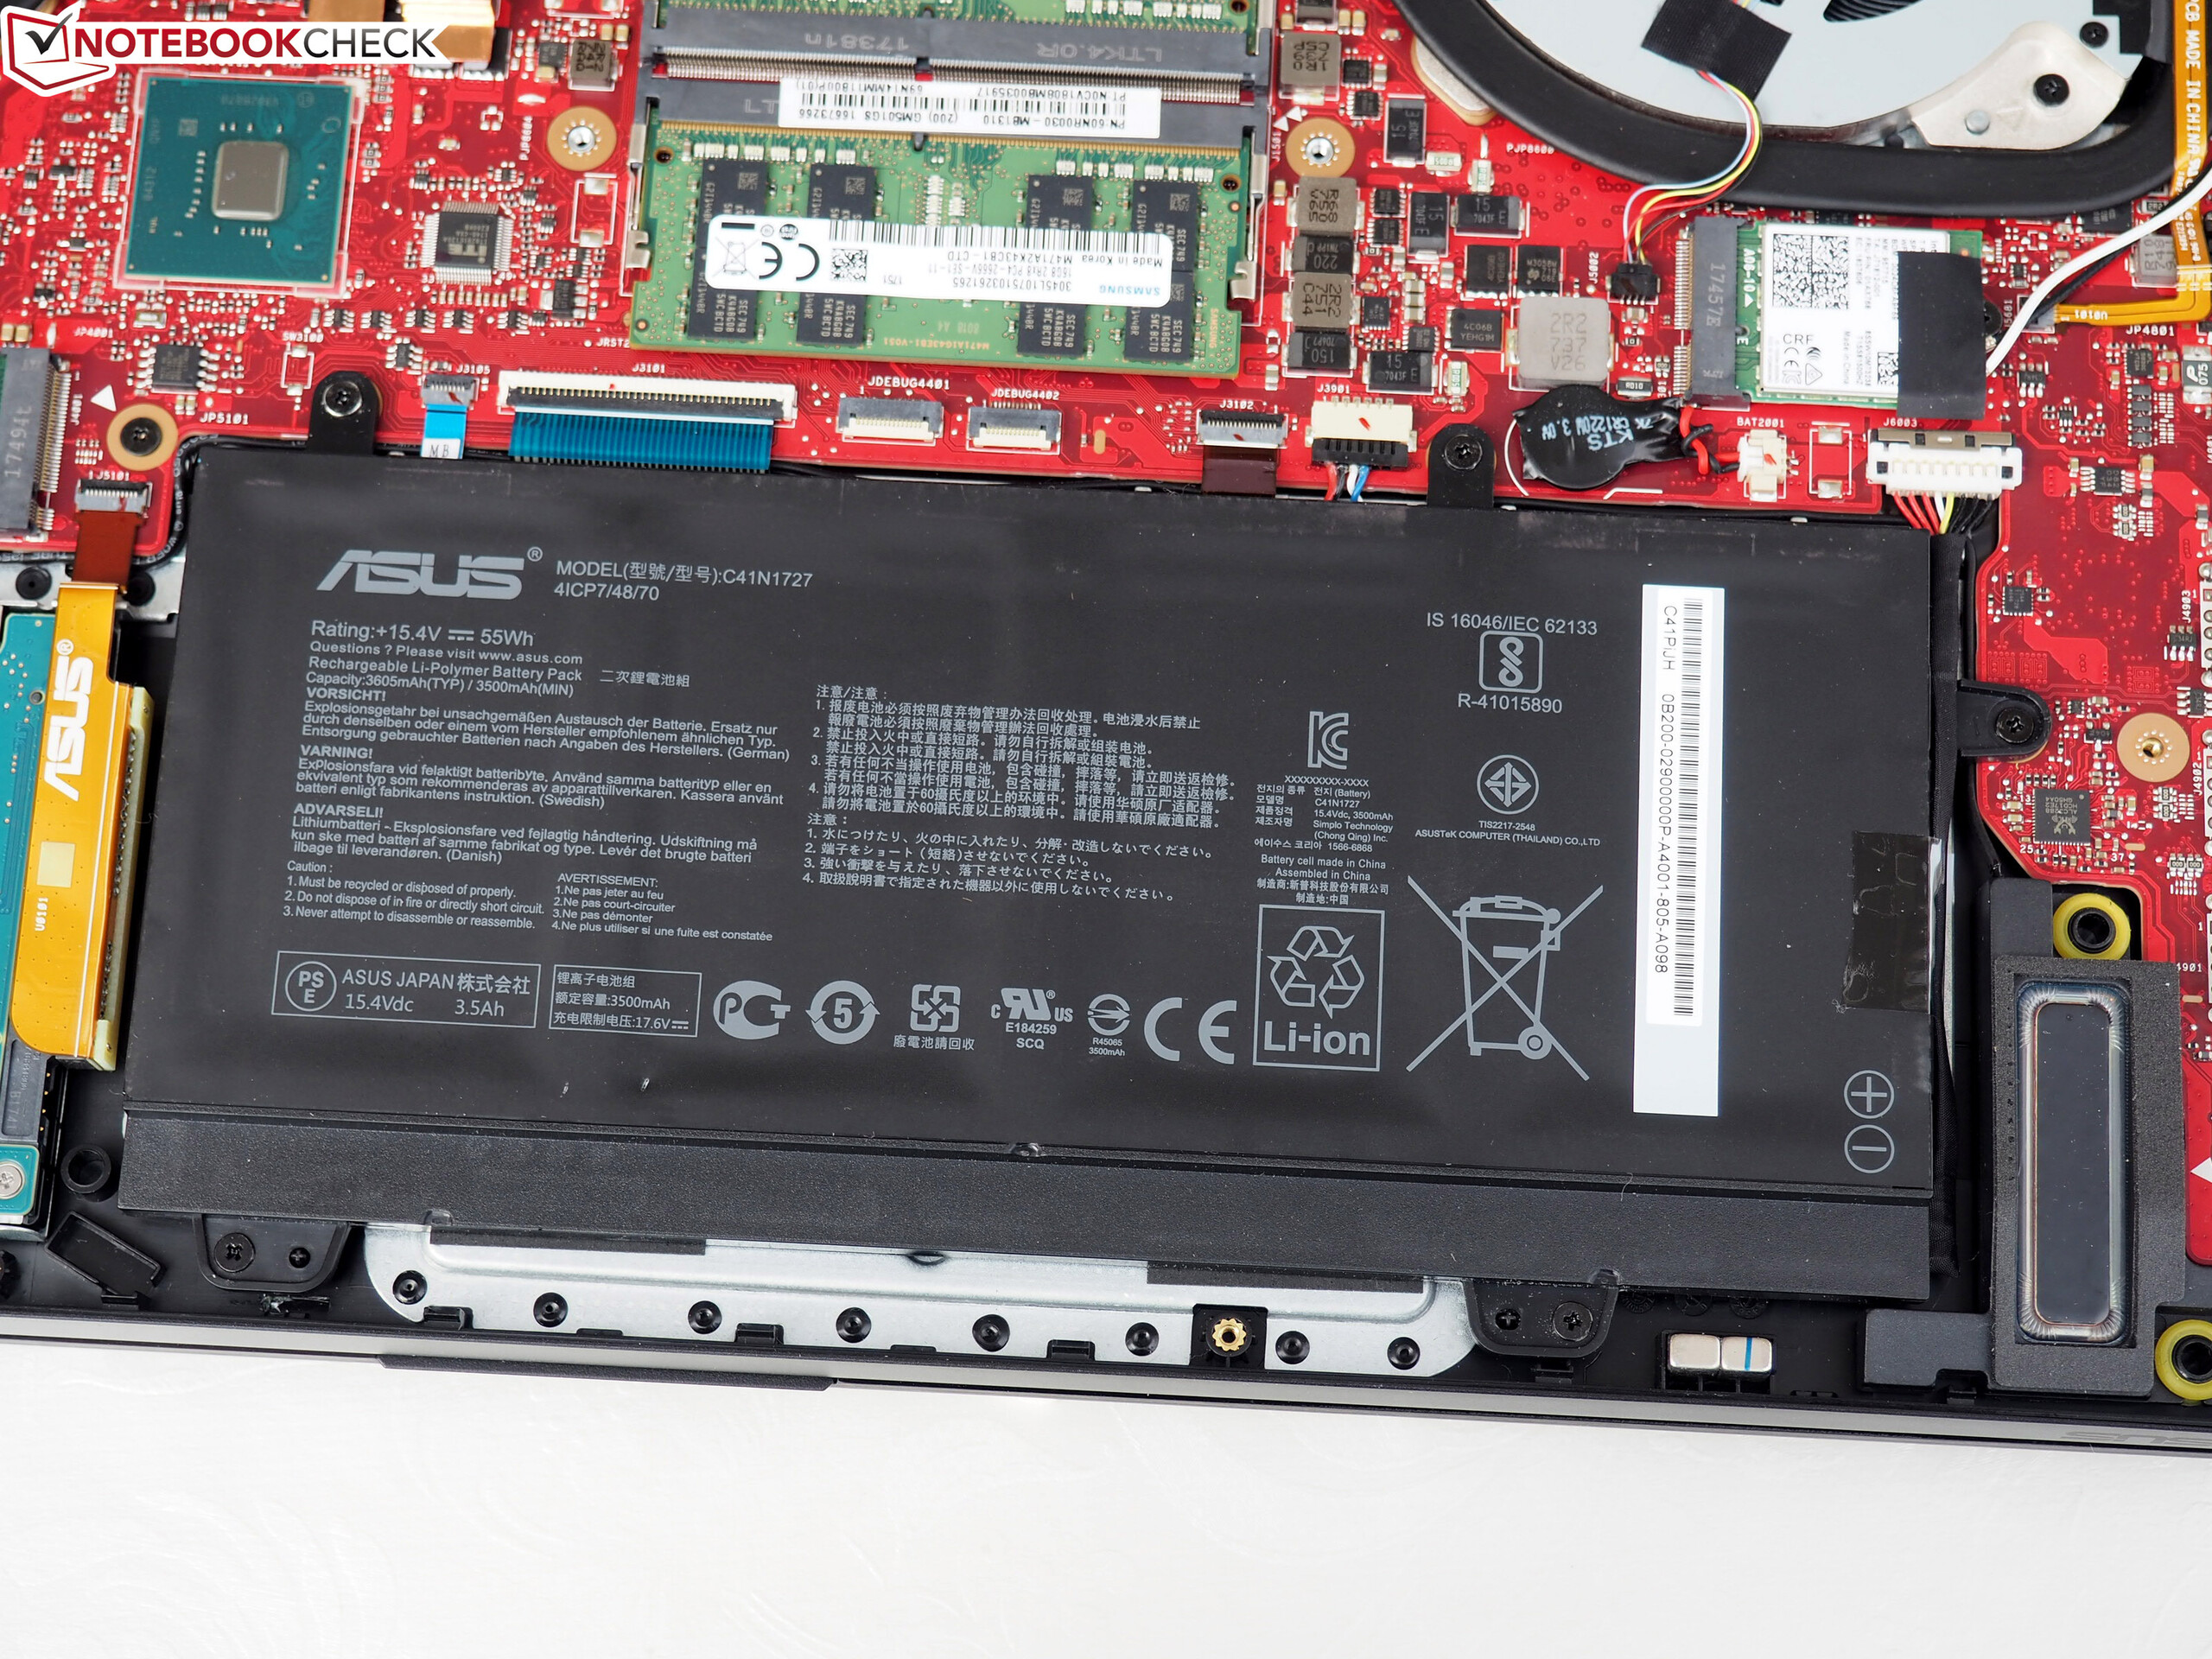
| Asus Zephyrus M GM501 GeForce GTX 1070 Mobile, i7-8750H, 55 Wh | Asus Zephyrus GX501 GeForce GTX 1080 Max-Q, i7-7700HQ, 50 Wh | Acer Predator Triton 700 GeForce GTX 1080 Max-Q, i7-7700HQ, 54 Wh | Gigabyte Aero 15X GeForce GTX 1070 Max-Q, i7-7700HQ, 94.2 Wh | MSI GS63VR 7RG-005 GeForce GTX 1070 Max-Q, i7-7700HQ, 52.4 Wh | Genomsnitt av klass Gaming | |
|---|---|---|---|---|---|---|
| Batteridrifttid | -26% | -20% | 182% | 28% | 126% | |
| Reader / Idle (h) | 4 | 3.1 -22% | 2.5 -37% | 13 225% | 5.7 43% | 8.27 ? 107% |
| H.264 (h) | 2.7 | 2.2 -19% | 1.8 -33% | 7.6 181% | 3.8 41% | 8.32 ? 208% |
| WiFi v1.3 (h) | 2.7 | 2.2 -19% | 2.4 -11% | 8.2 204% | 3.9 44% | 7.11 ? 163% |
| Load (h) | 1.2 | 0.7 -42% | 1.2 0% | 2.6 117% | 1 -17% | 1.502 ? 25% |
För
Emot
Läs den fullständiga versionen av den här recensionen på engelska här.
Om du behöver välja mellan ROG Zephyrus GX501VI (GTX 1080 Max-Q) och ROG Zephyrus M GM501GS (GeForce GTX 1070) så hade vi personligen valt det senare alternativet. Även om GM501 är betydligt mer högljudd när den kör 3D-applikationer så är den mycket billigare samtidigt som den erbjuder nästan identisk spelprestanda och har, tycker vi, bättre inmatningsenheter. 144 Hz-skärmen har hög kontrast och stöd för G-Sync, och möjligheten till grafik-byte (Optimus) är också en stark anledning till köp.
Tyvärr kan GM501 inte klara av särskilt långa batteritider på grund av sin Optimus-teknik. Den hade behövt ett större batteri. På grund av det förblir Aero 15X nummer 1 när det kommer till portabla toppskikts-laptops på 15 tum. Konkurrensen från Acer (Predator Triton 700) samt MSI:s GS63VR kan hållas i shack av vår Zephyrus M. Gamers som reser mycket och förväntar sig hög prestanda såväl som ett tunt, behagligt lätt och snyggt hölje borde bli nöjda med GM501.
Intels sexkärniga arkitektur, som vi nu för första gången har testat i en mobil enhet, garanterar en generös ökning i prestandan hos applikationer med stöd för flera kärnor. Detta behövdes verkligen efter att AMD släppt Ryzen-baserade chips med sex och åtta kärnor. Eller som man säger: Konkurrens är bra för affärerna.
Förresten, recensioner för den splitter nya MSI GS65 och den uppdaterade Gigabyte Aero 15X (båda med Coffee Lake) kommer snart finnas tillgängliga - och dom kommer troligen vara starka konkurrenter till Zephyrus M.
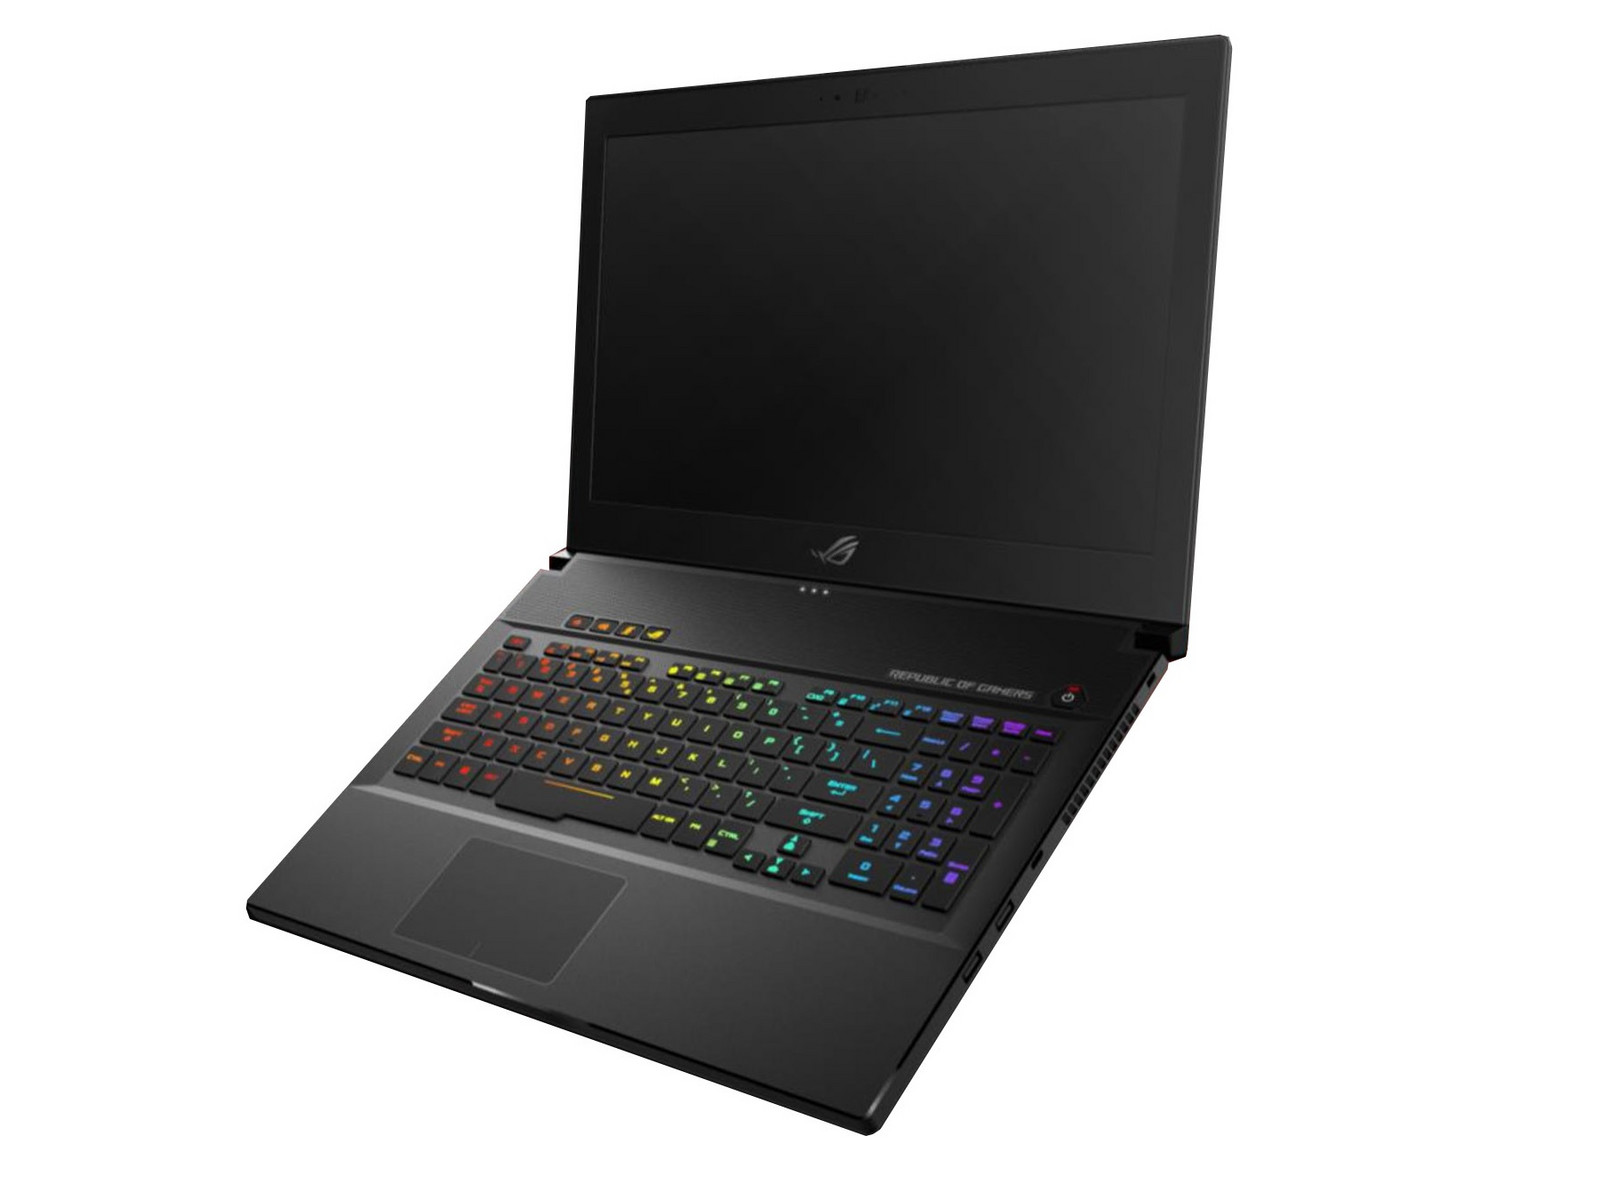
Asus Zephyrus M GM501
- 04/02/2018 v6 (old)
Florian Glaser
Price comparison