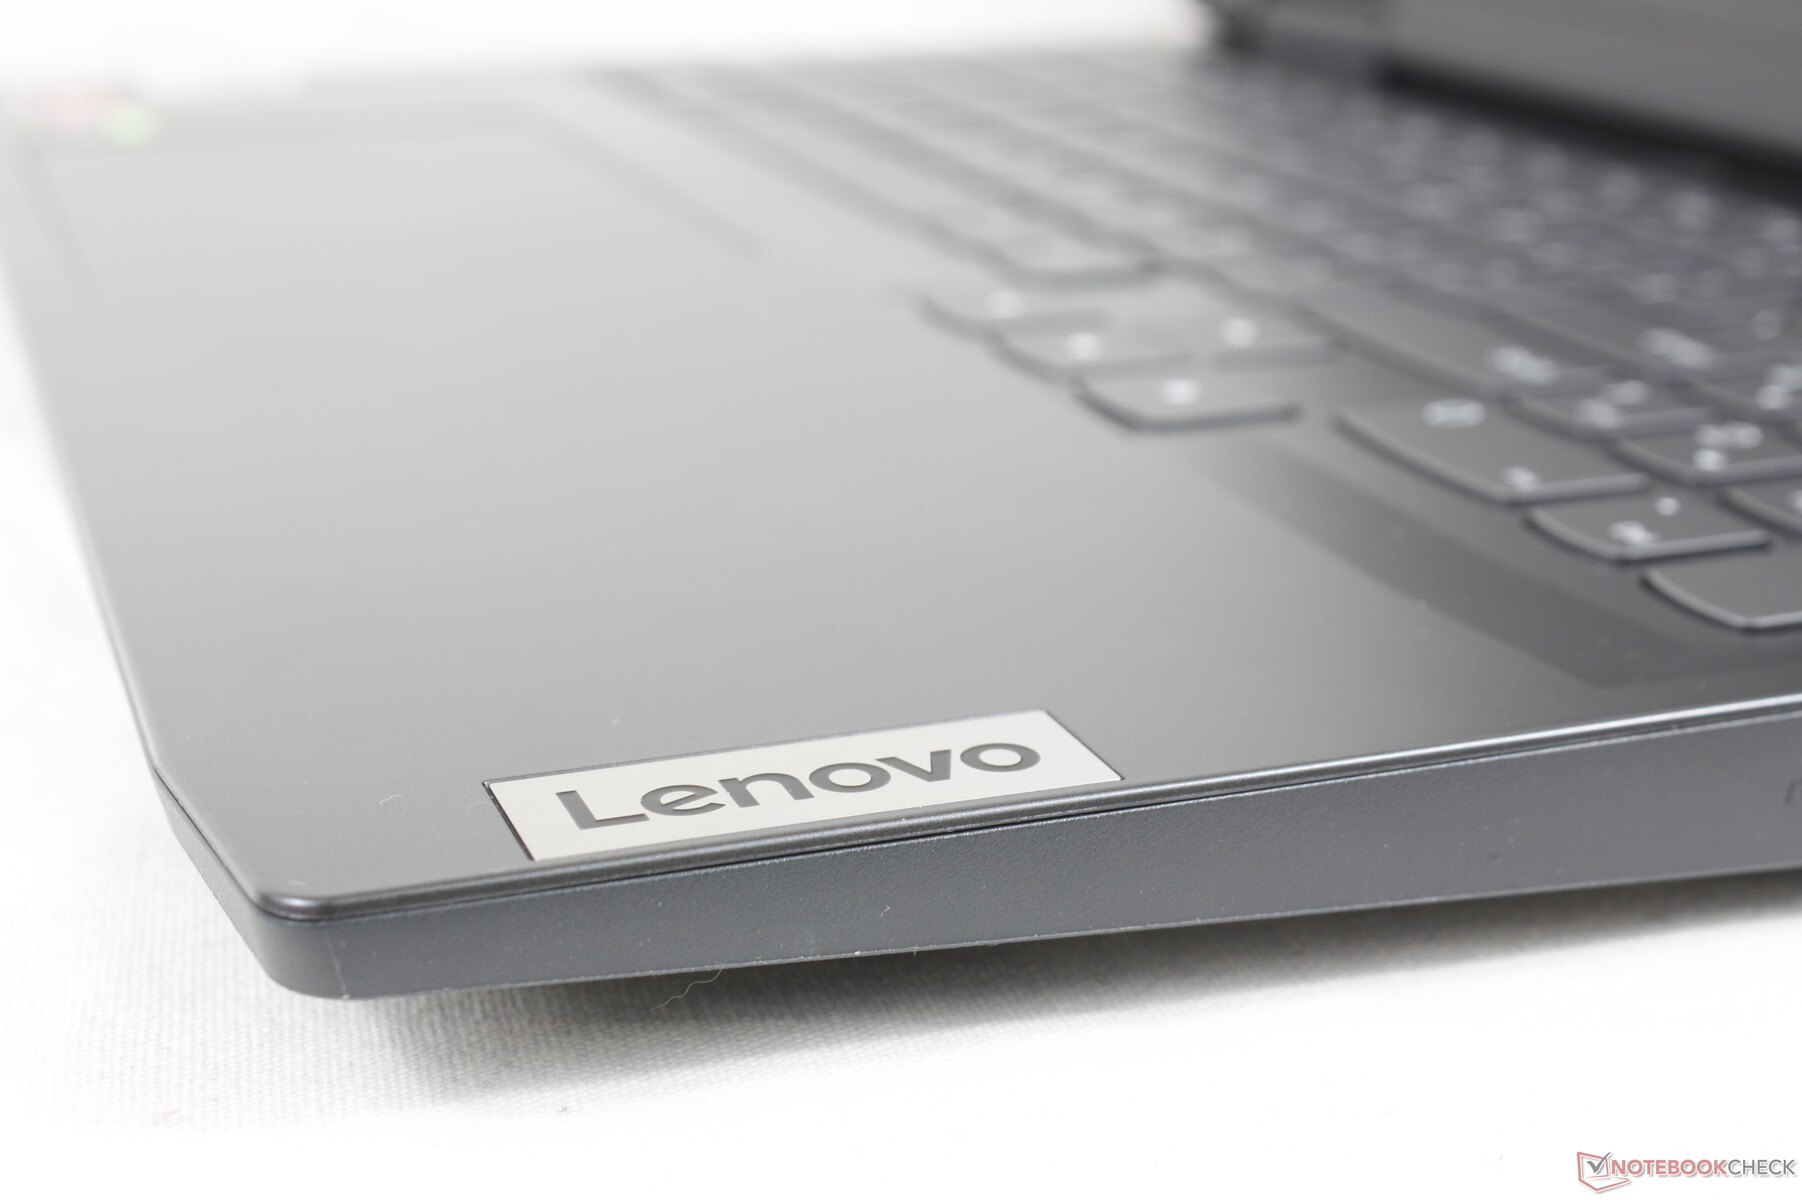
Recension av Lenovo IdeaPad Gaming 3 15ARH7 - Prestandadebut för Ryzen 5 6600H
IdeaPad Gaming 3-serien är hemvist för några av Lenovos billigaste bärbara datorer för spel, som kontrast till mellanklassen Legion 5 Pro-serien och den mer avancerade Legion 7-serien. Denna senaste 2022-modell är anmärkningsvärd för att vara en av de första med AMD Zen 3+ Ryzen 5 6600H CPU:n som ersätter den 10:e generationens Intel-lösning i 2020 IdeaPad Gaming 3i. Den introducerar också en ny chassidesign för att ytterligare skilja sig från modeller av äldre generation
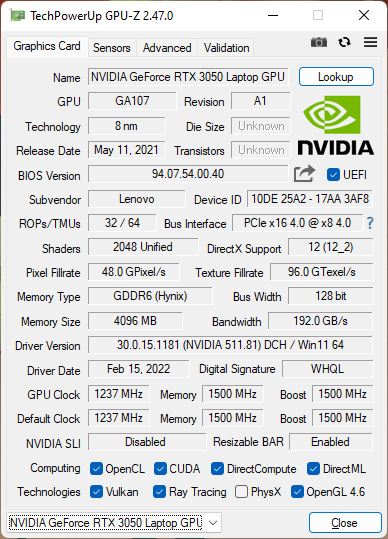
Konfigurationer inkluderar antingen Ryzen 5 6600H eller Ryzen 7 6800H CPU med antingen 85 W GeForce RTX 3050 eller 3050 Ti GPU. Samma 120 Hz 1080p IPS-panel med 1080p finns på alla SKU:er. Vår specifika granskningsenhet med 6600H, RTX 3050, 256 GB SSD och 8 GB RAM är det lägsta alternativet för cirka 800 USD i detaljhandeln
Bland konkurrenterna finns andra billiga bärbara 15,6- eller 16-tums gamingdatorer som t.ex Acer Nitro 5, HP Victus, Asus TUF Dash 15eller MSI GF-serien
Fler recensioner av Lenovo
Potentiella konkurrenter i jämförelse
Gradering | Datum | Modell | Vikt | Höjd | Storlek | Upplösning | Pris |
|---|---|---|---|---|---|---|---|
| 80.8 % v7 (old) | 09/2022 | Lenovo IdeaPad Gaming 3 15ARH7 R5 6600H, GeForce RTX 3050 4GB Laptop GPU | 2.4 kg | 21.8 mm | 15.60" | 1920x1080 | |
| 78.4 % v7 (old) | 08/2020 | Lenovo IdeaPad Gaming 3i 15IMH05 i5-10300H, GeForce GTX 1650 Mobile | 2.2 kg | 24.9 mm | 15.60" | 1920x1080 | |
| 82.6 % v7 (old) | 05/2022 | Lenovo Legion 5 15ACH6A-82NW0010GE R5 5600H, Radeon RX 6600M | 2.5 kg | 25.75 mm | 15.60" | 1920x1080 | |
| 82.3 % v7 (old) | 09/2022 | Gigabyte A5 K1 R5 5600H, GeForce RTX 3060 Laptop GPU | 2.2 kg | 34 mm | 15.60" | 1920x1080 | |
| 85.8 % v7 (old) | 07/2022 | Asus TUF Dash F15 FX517ZR i7-12650H, GeForce RTX 3070 Laptop GPU | 2 kg | 20.7 mm | 15.60" | 2560x1440 | |
| 81 % v7 (old) | 06/2022 | Dell G15 5510 i5-10500H, GeForce RTX 3050 4GB Laptop GPU | 2.5 kg | 23 mm | 15.60" | 1920x1080 |
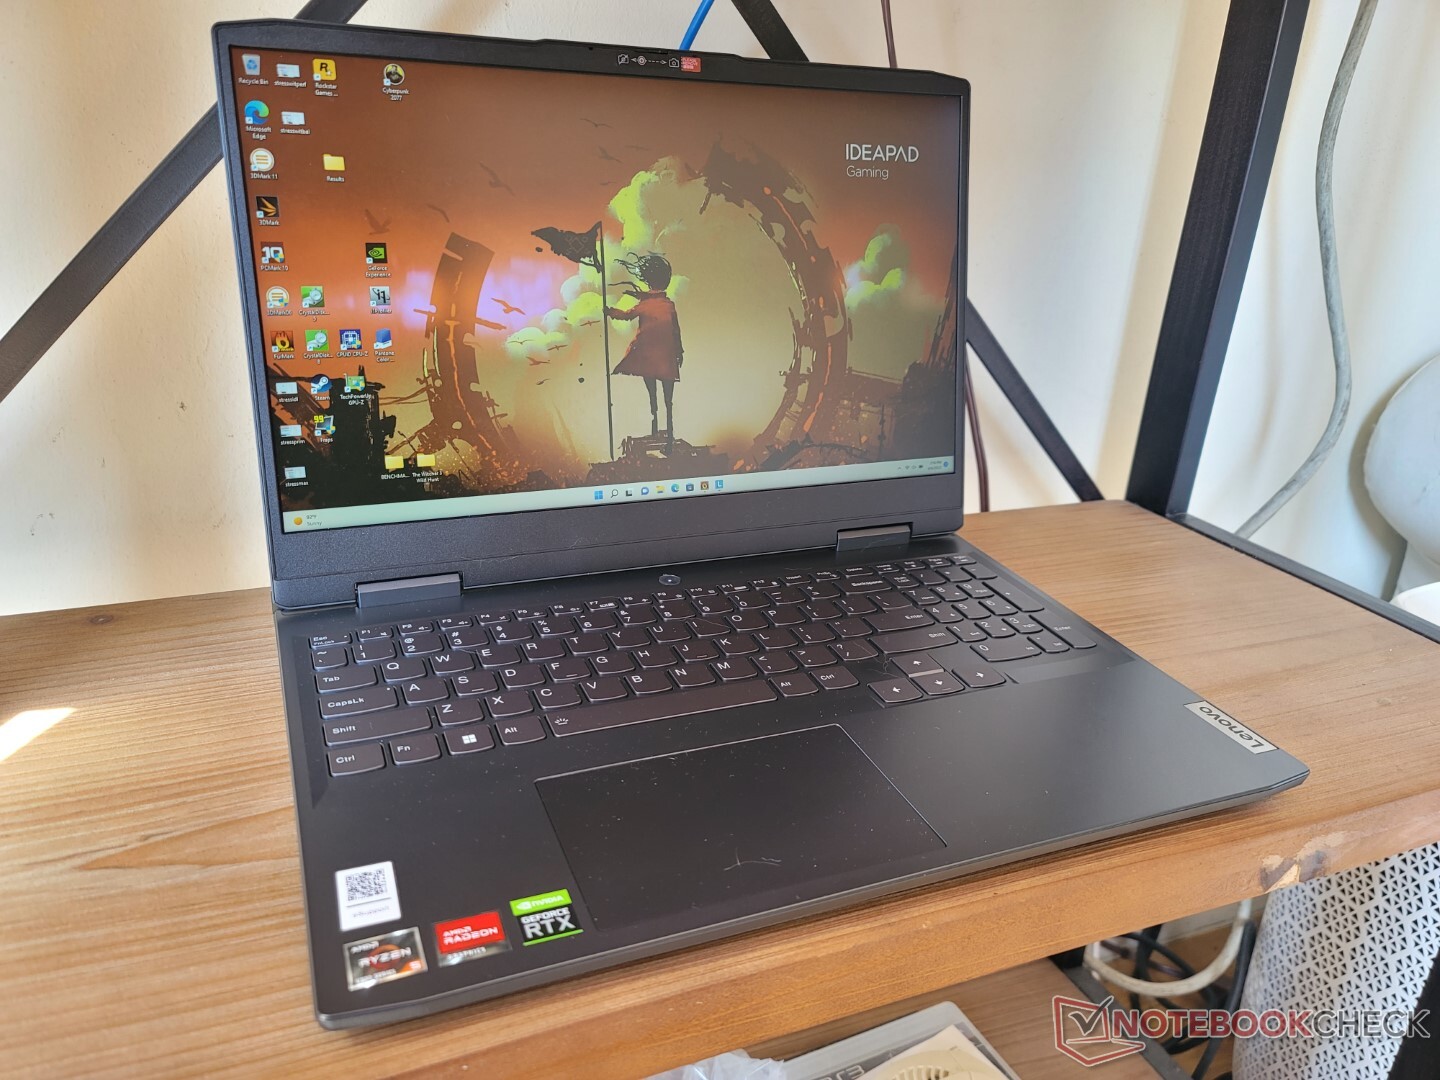
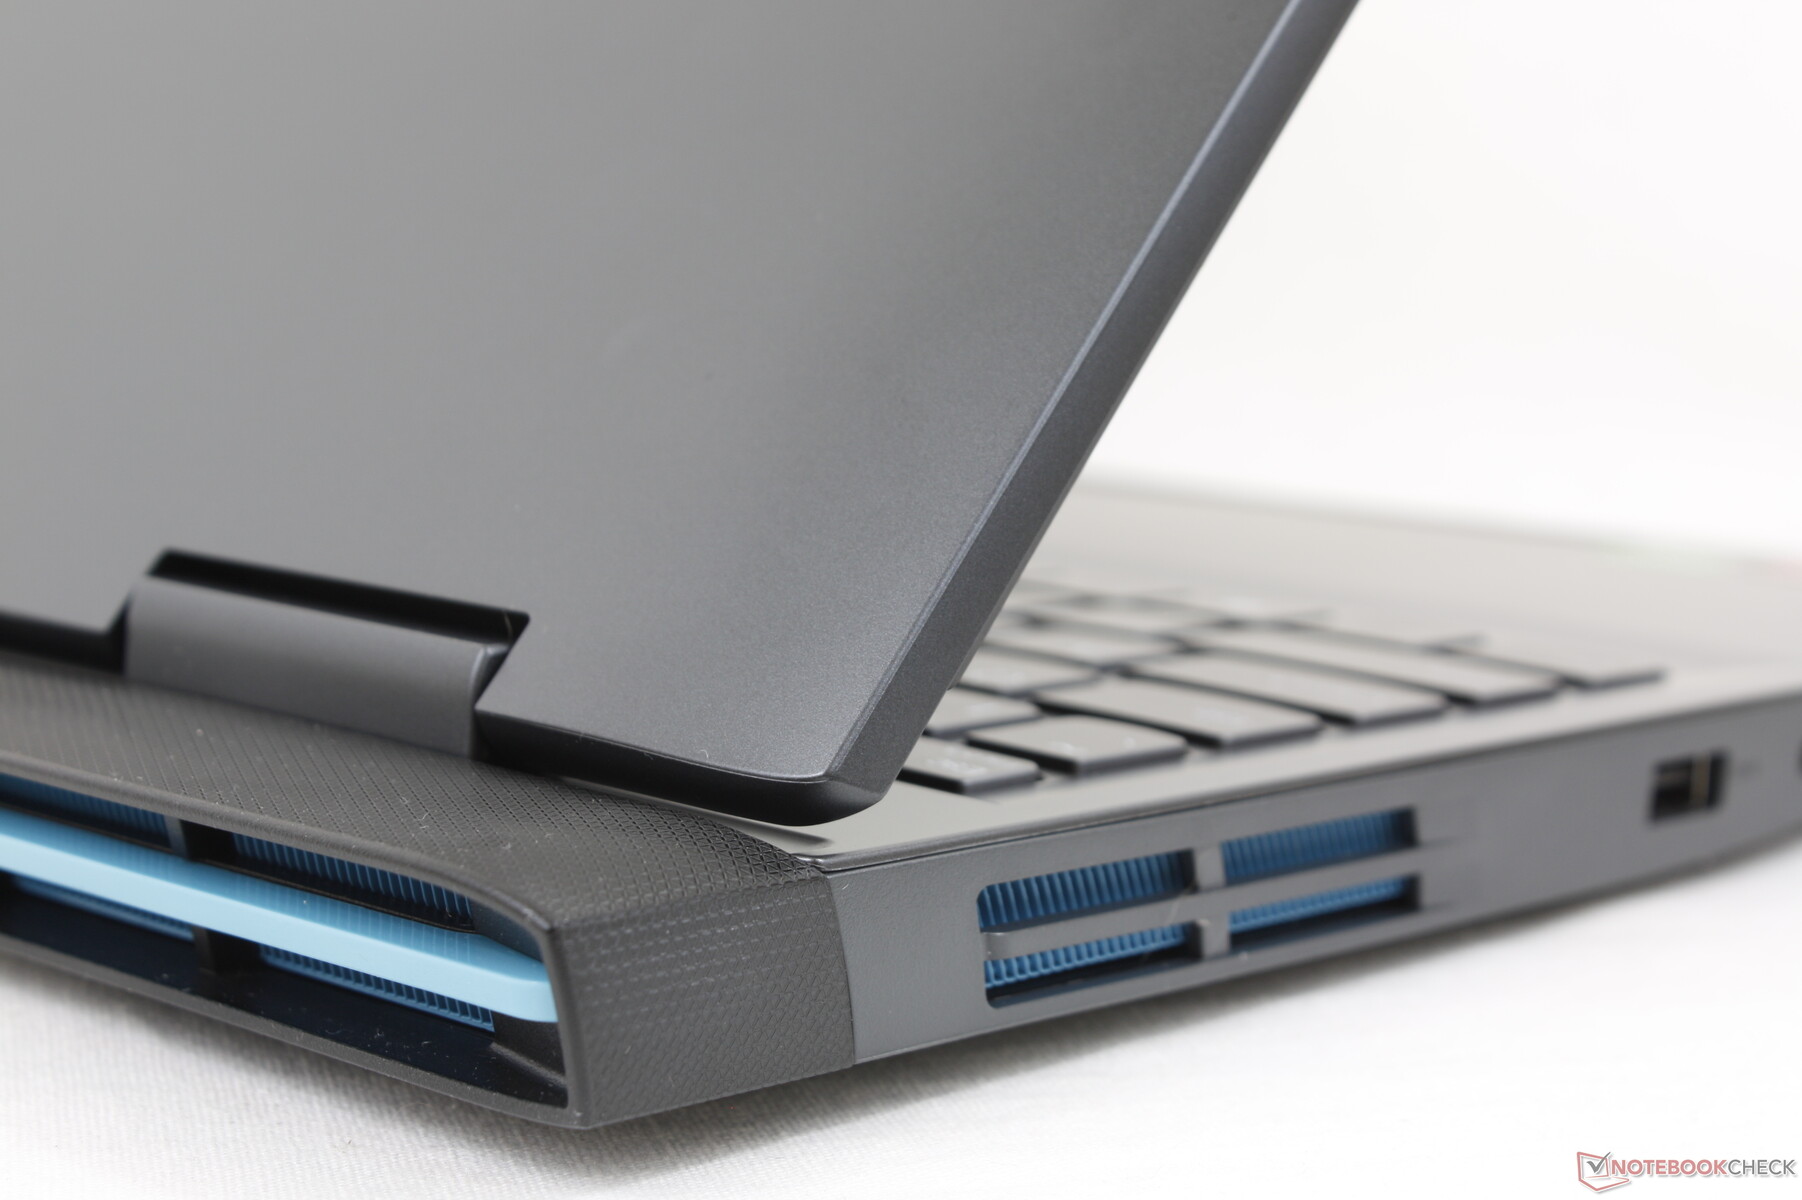
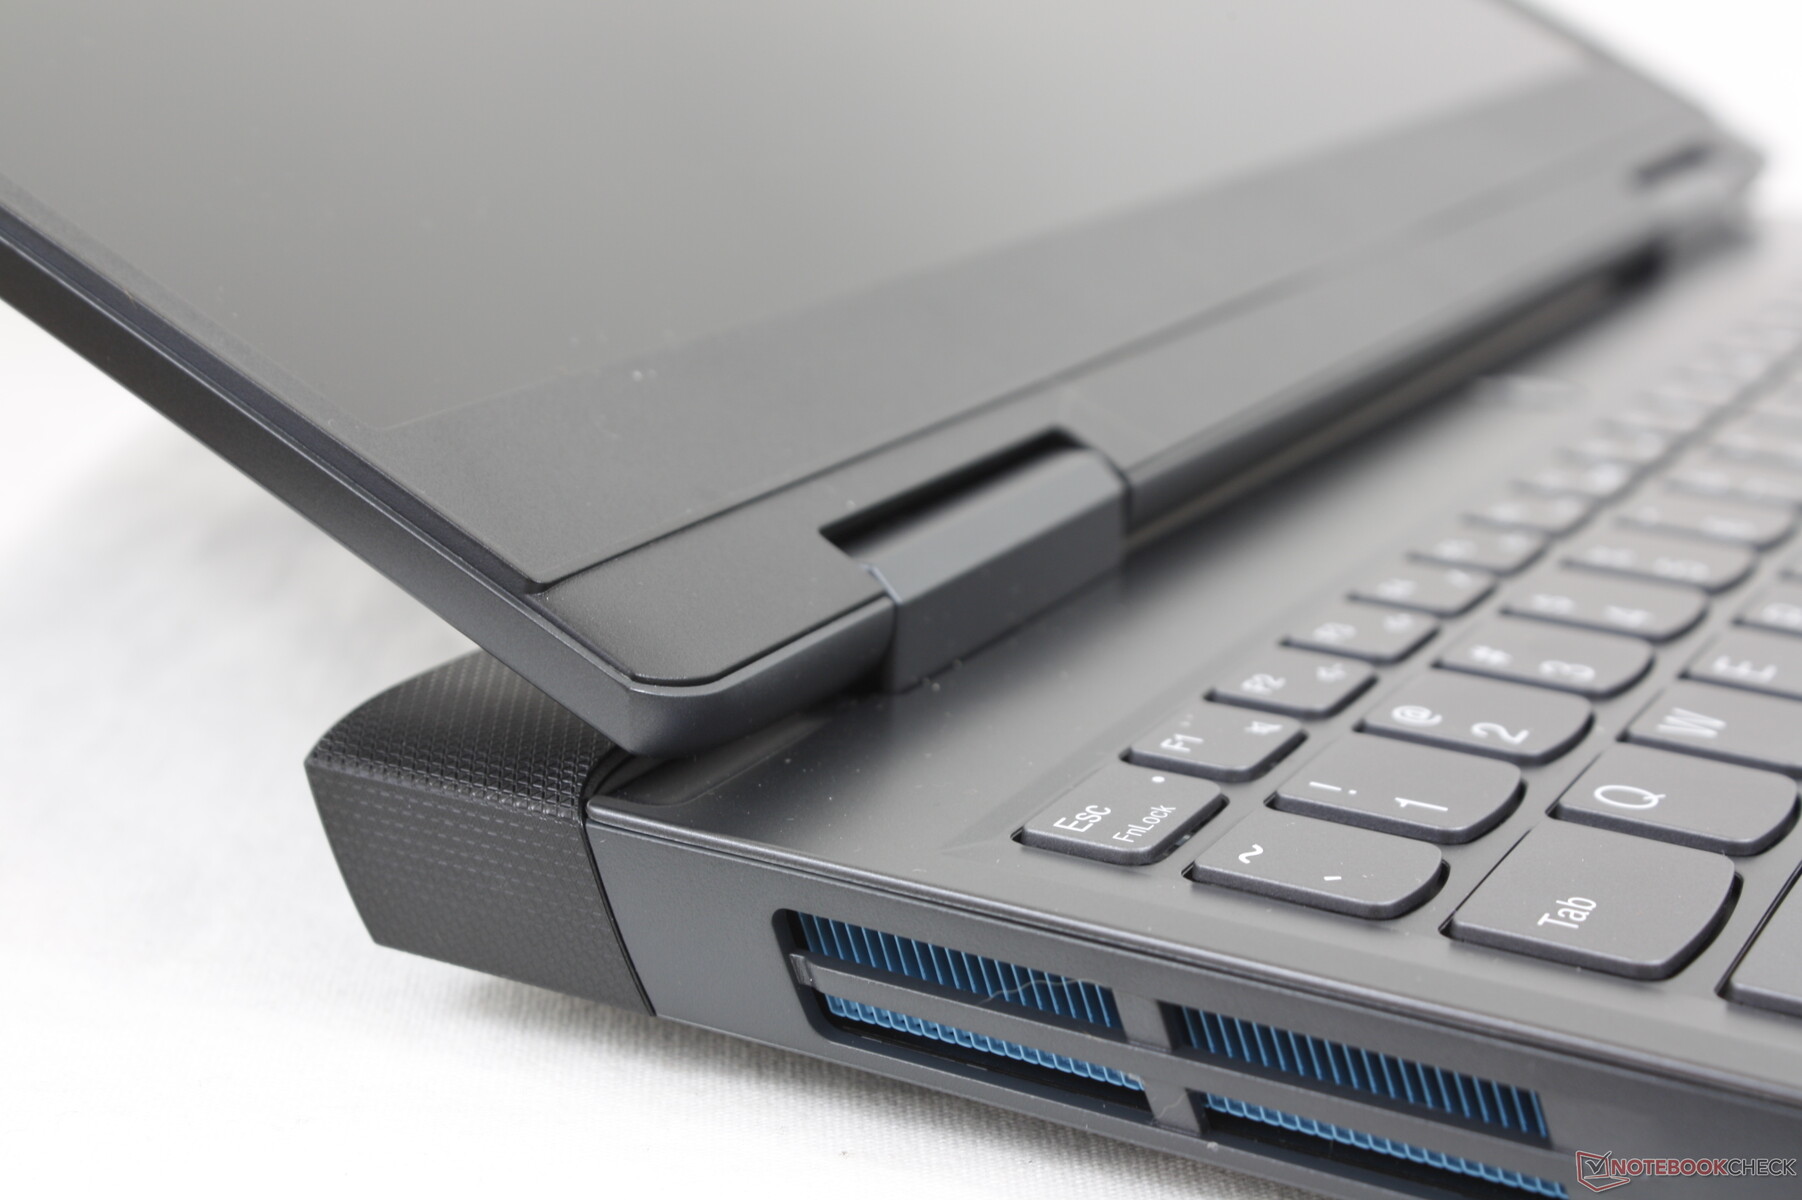
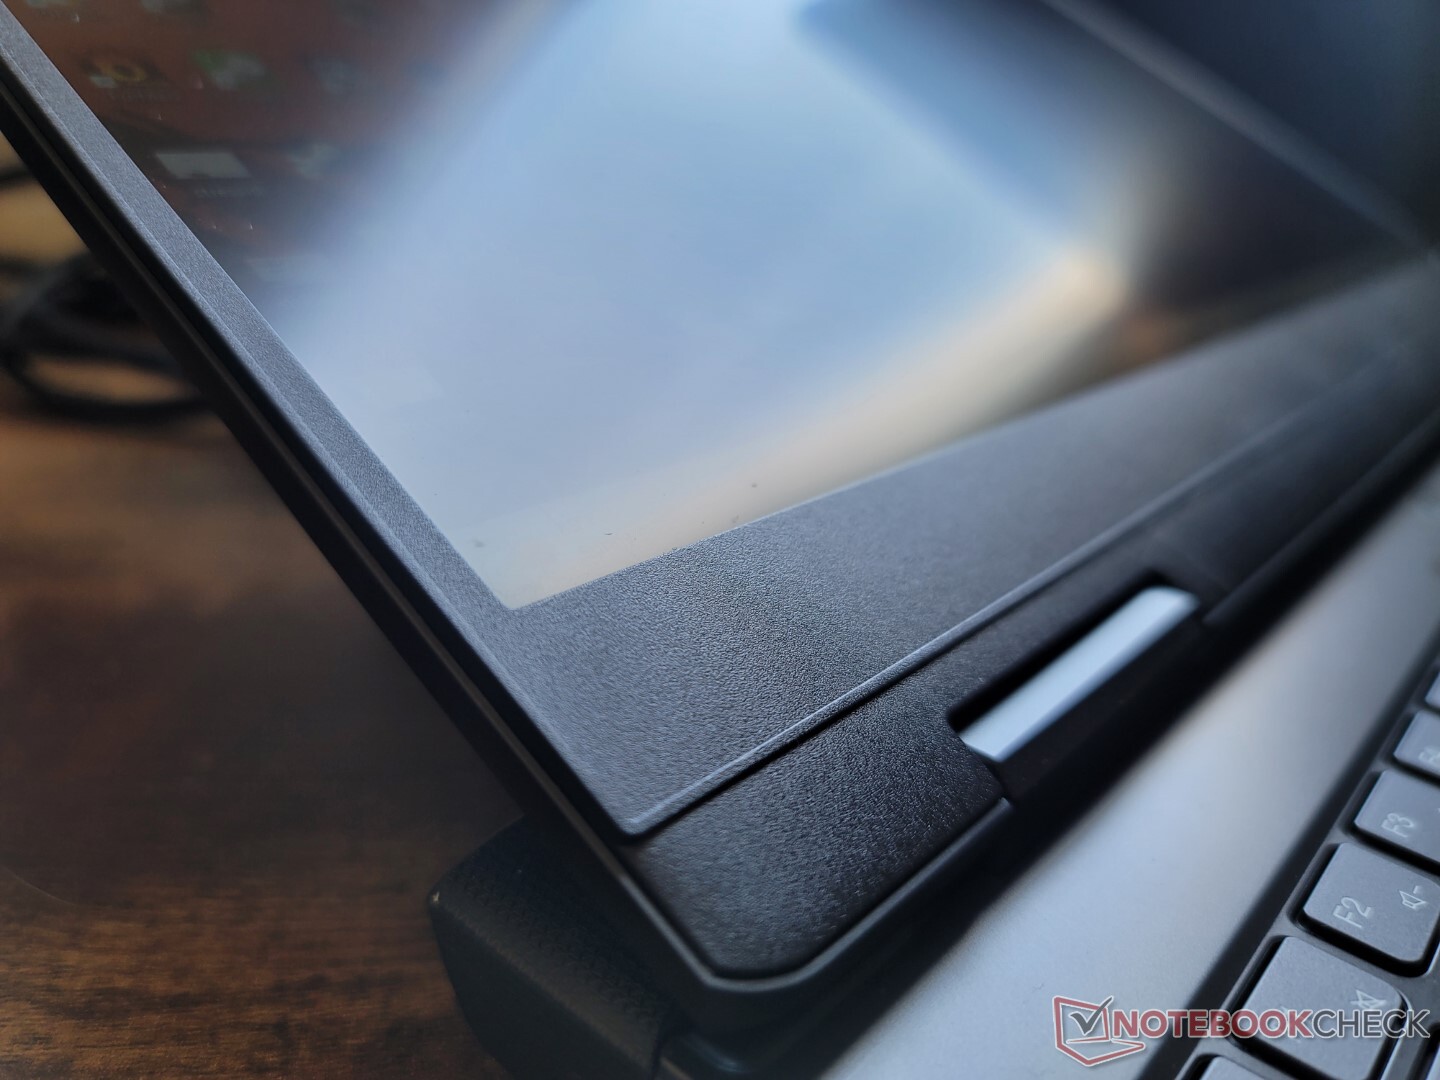
Hölje - Nytt utseende inspirerad av Legion
Det omgjorda chassit kan bäst beskrivas som en billigare version av den nya Legion 5; medan den senare består mestadels av metalllegering är den nya IdeaPad Gaming 3 15 mestadels av polykarbonat och plast. Den mest märkbara visuella förändringen från 2020 IdeaPad-design gäller den nya bakre designen som är tänkt att förbättra kylningen, men till priset av ett större fotavtryck och högre vikt.
Chassiets styvhet är ganska bra runt basen eftersom vridningar och fördjupningar är minimala i förhållande till andra billiga bärbara gamingdatorer som MSI GF63 eller eller eller HP Pavilion Gaming 15. Gångjärnen är dock en annan historia eftersom skärmen tenderar att vingla mer än vad vi skulle vilja när vi justerar vinklar. Knarrande blir hörbart när skärmen öppnas helt och hållet, vilket kan vara ett potentiellt problem flera år framåt i tiden.
Jämfört med IdeaPad Gaming 3 från 2020 är vår 2022-modell större och tyngre med cirka 200 g. Den är också tunnare med några millimeter, men den något tunnare profilen gör inte mycket för att mildra det märkbart större chassit. Storleken och viktökningen kan tillskrivas den nya avlånga baksidan som inspirerats av Legion -serien.
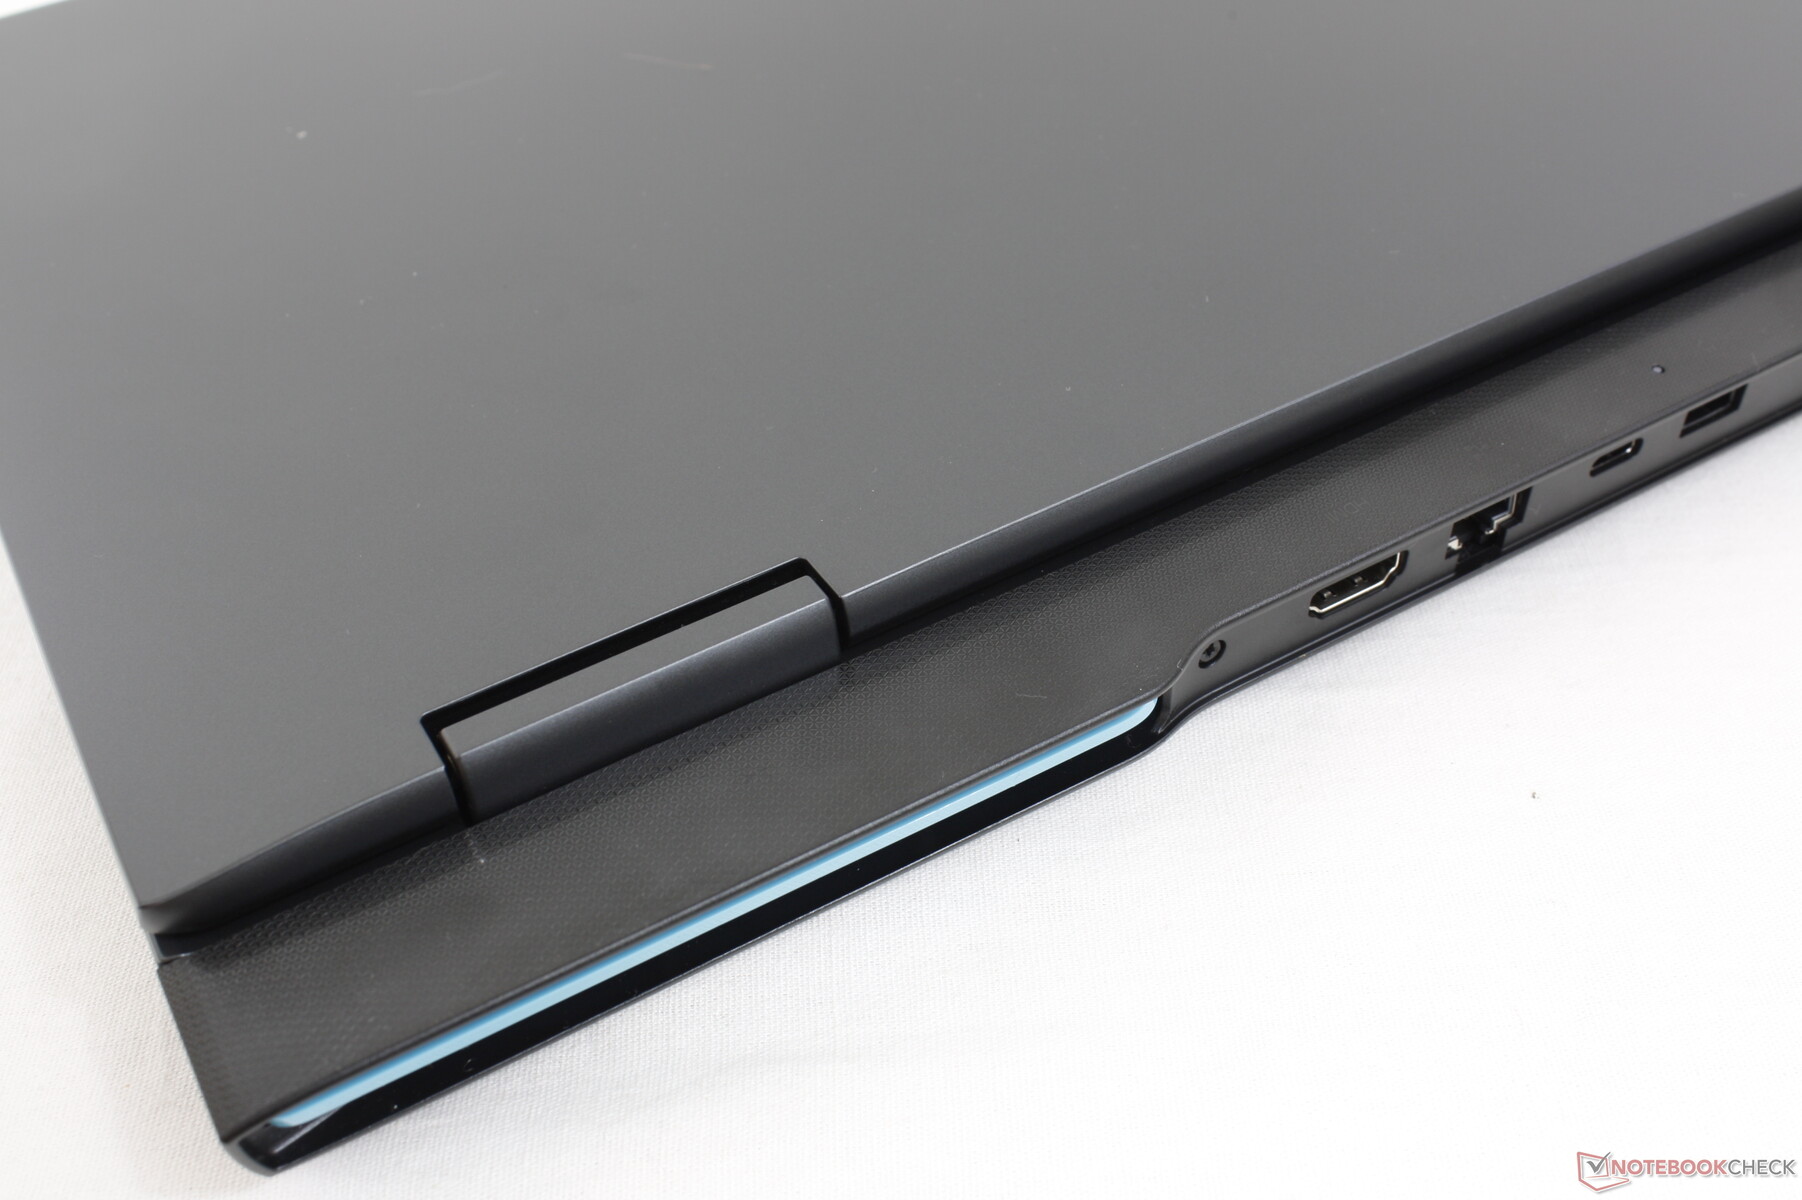
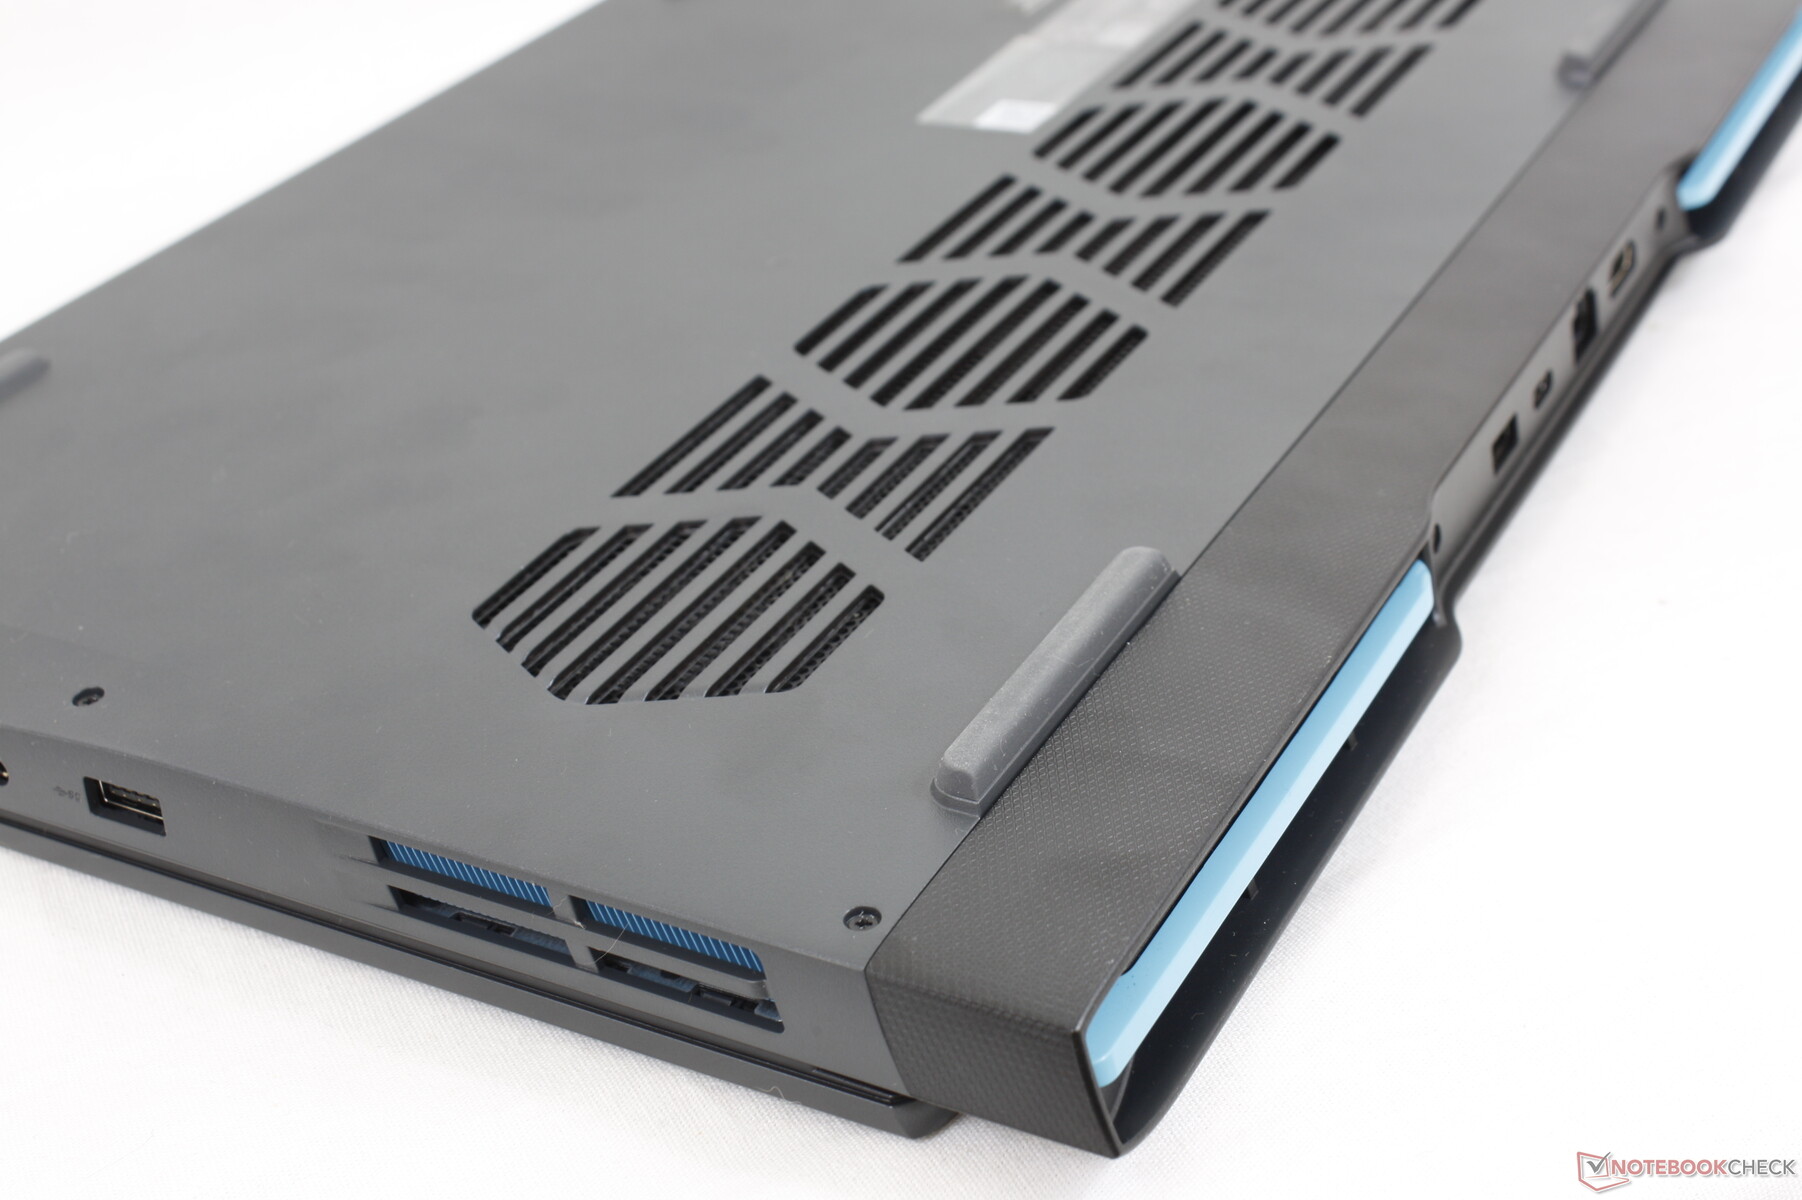
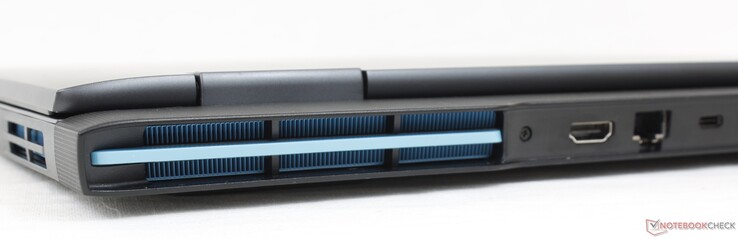
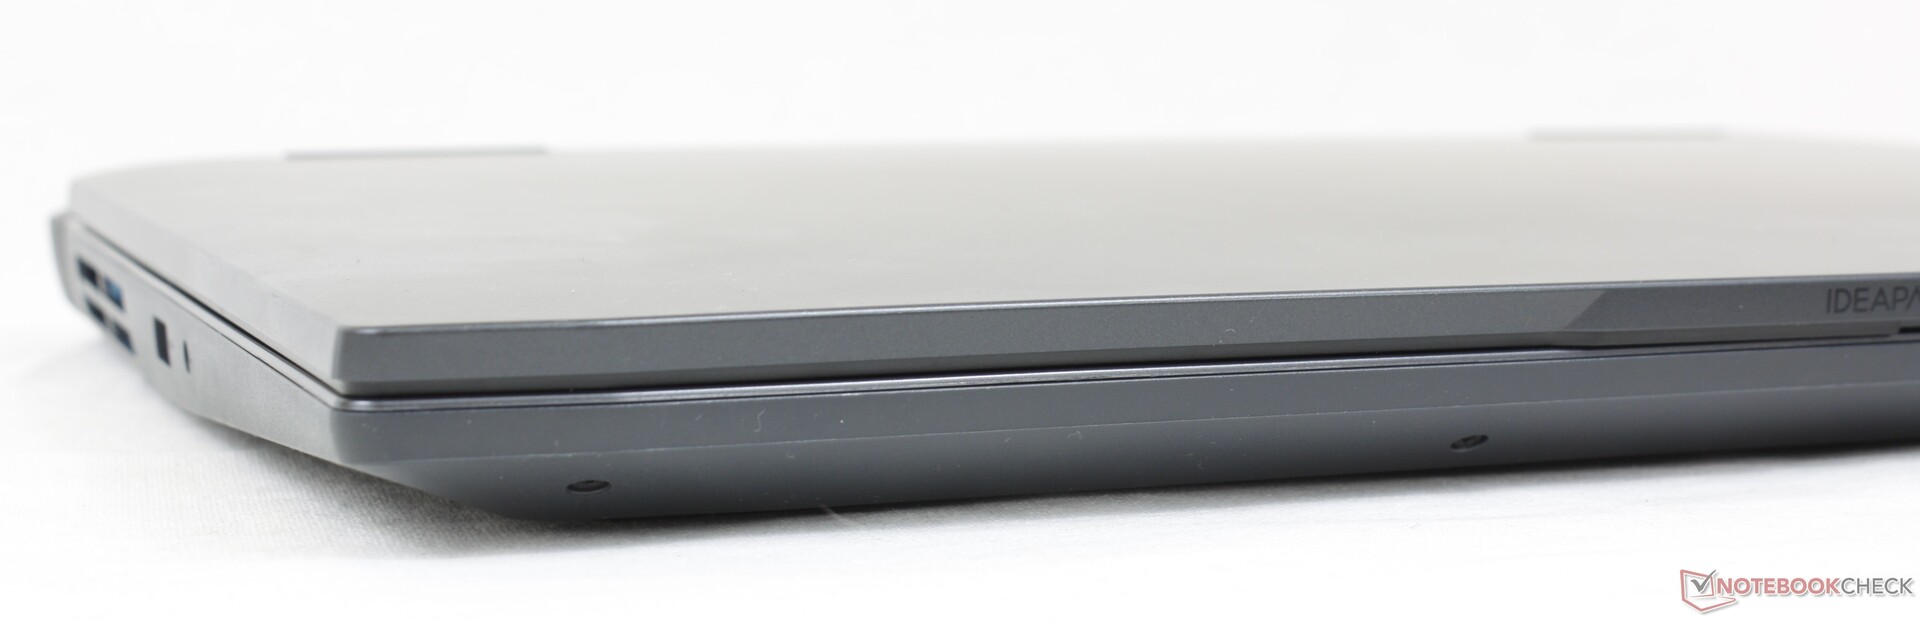
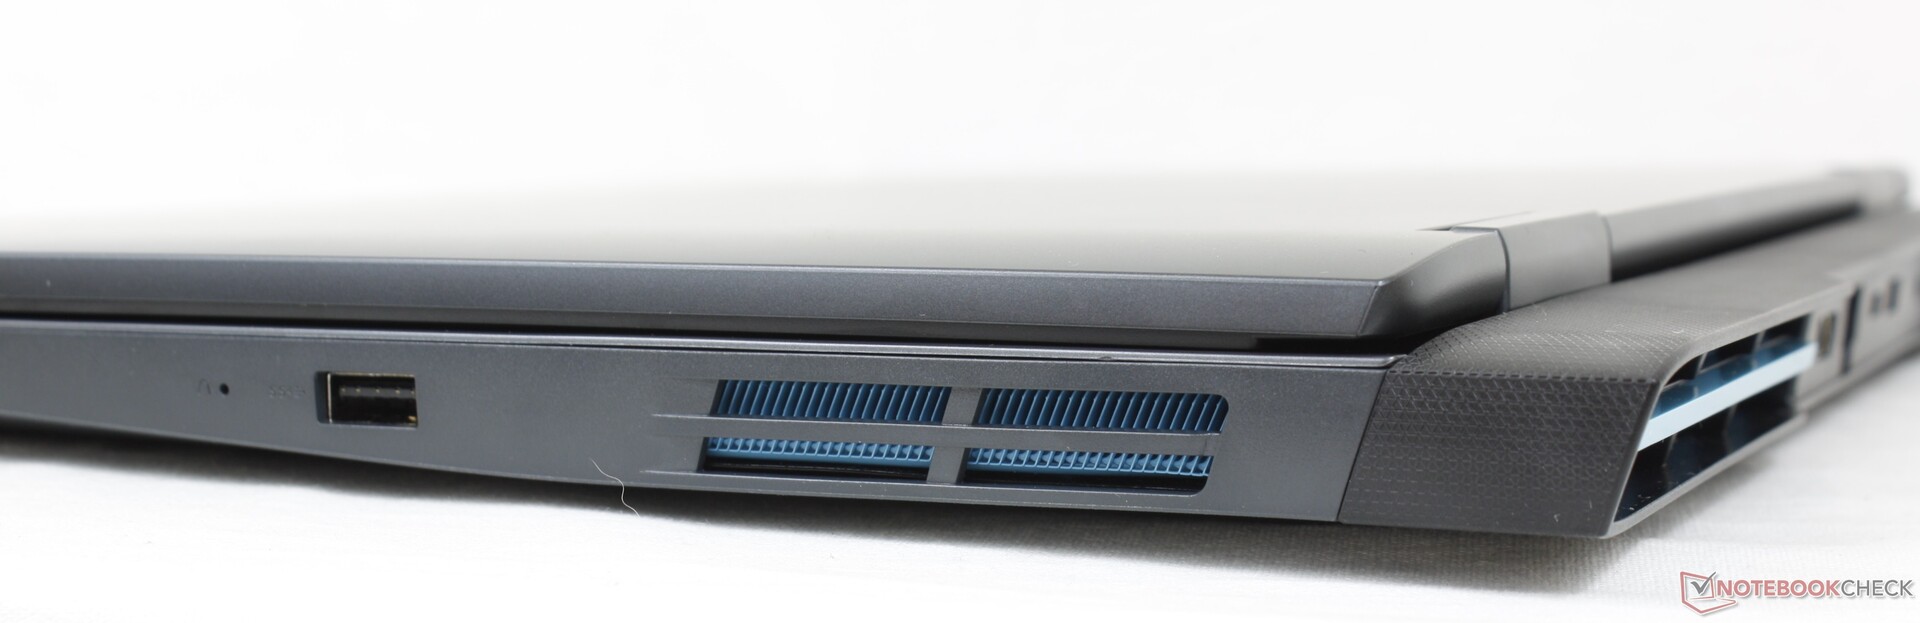
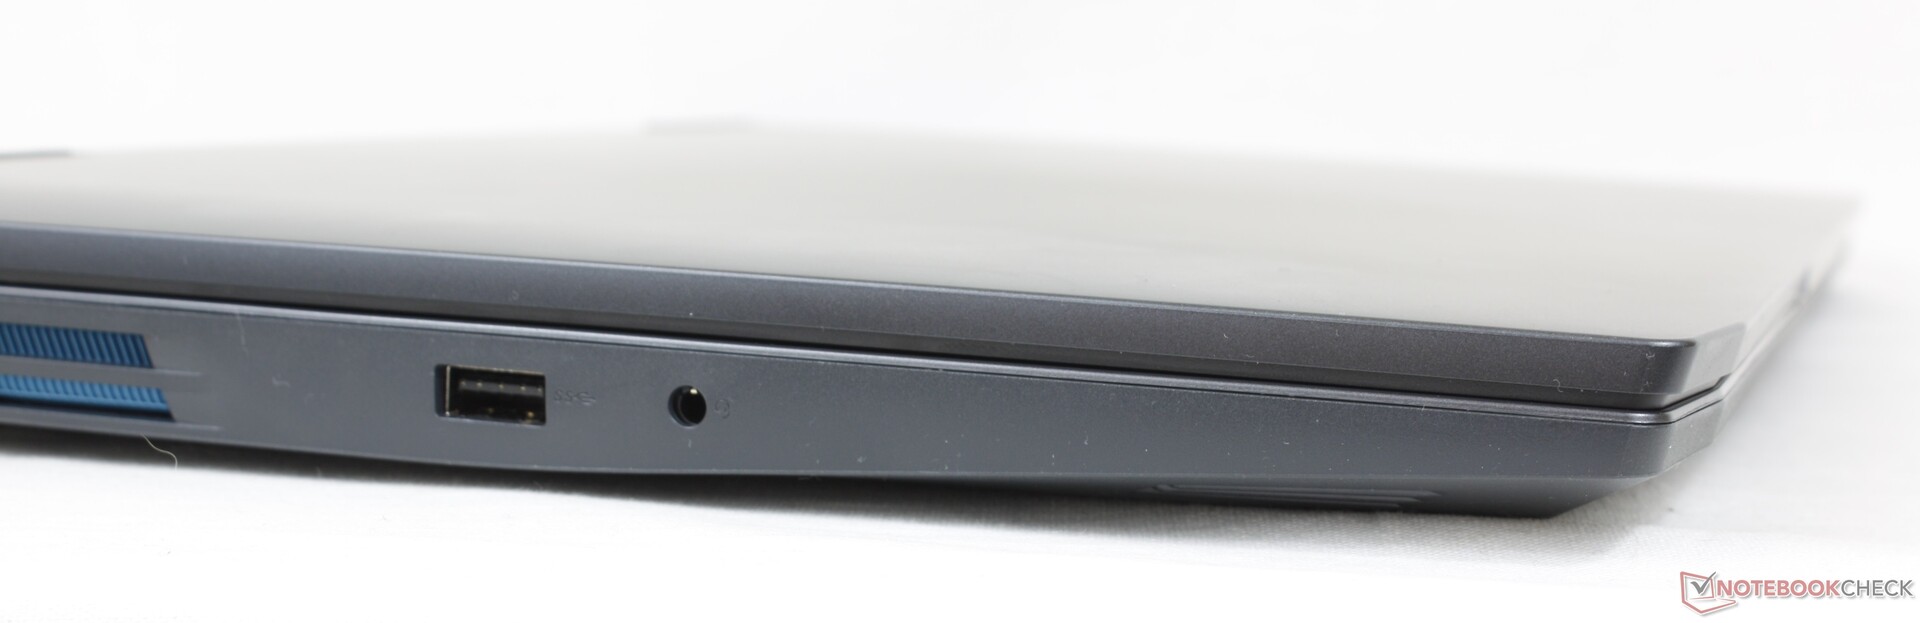
Anslutningar - Inget stöd för Thunderbolt
Portalternativen är anständiga och jämförbara med andra bärbara speldatorer med låg kostnad. Placeringen av portarna är dock en blandad kompott eftersom de flesta portarna ligger på baksidan av enheten där de kan vara svåra att nå. Tänk på att Thunderbolt inte stöds till skillnad från många bärbara speldatorer med Intel-drift.

Kommunikation
Enheten levereras med en Realtek RTL8852BE för Wi-Fi 6 och Bluetooth 5.1 i stället för en Intel AX-modul, sannolikt för att spara på kostnaderna. Överföringshastigheterna är betydligt långsammare, men de är ändå stabila och snabba nog för de flesta ändamål, inklusive 4K-videoströmning eller nedladdning.
| Networking | |
| iperf3 transmit AX12 | |
| Lenovo Legion 5 15ACH6A-82NW0010GE | |
| Lenovo IdeaPad Gaming 3i 15IMH05 | |
| iperf3 receive AX12 | |
| Lenovo Legion 5 15ACH6A-82NW0010GE | |
| Lenovo IdeaPad Gaming 3i 15IMH05 | |
| iperf3 receive AXE11000 | |
| Gigabyte A5 K1 | |
| Dell G15 5510 | |
| Asus TUF Dash F15 FX517ZR | |
| Lenovo IdeaPad Gaming 3 15ARH7 | |
| iperf3 transmit AXE11000 | |
| Gigabyte A5 K1 | |
| Asus TUF Dash F15 FX517ZR | |
| Lenovo IdeaPad Gaming 3 15ARH7 | |
Webbkamera
Den integrerade webbkameran har endast 1 MP, vilket ger en slamig bild. Även om det finns en slutare för att skydda privatlivet, finns det ingen IR för Hello-stöd.


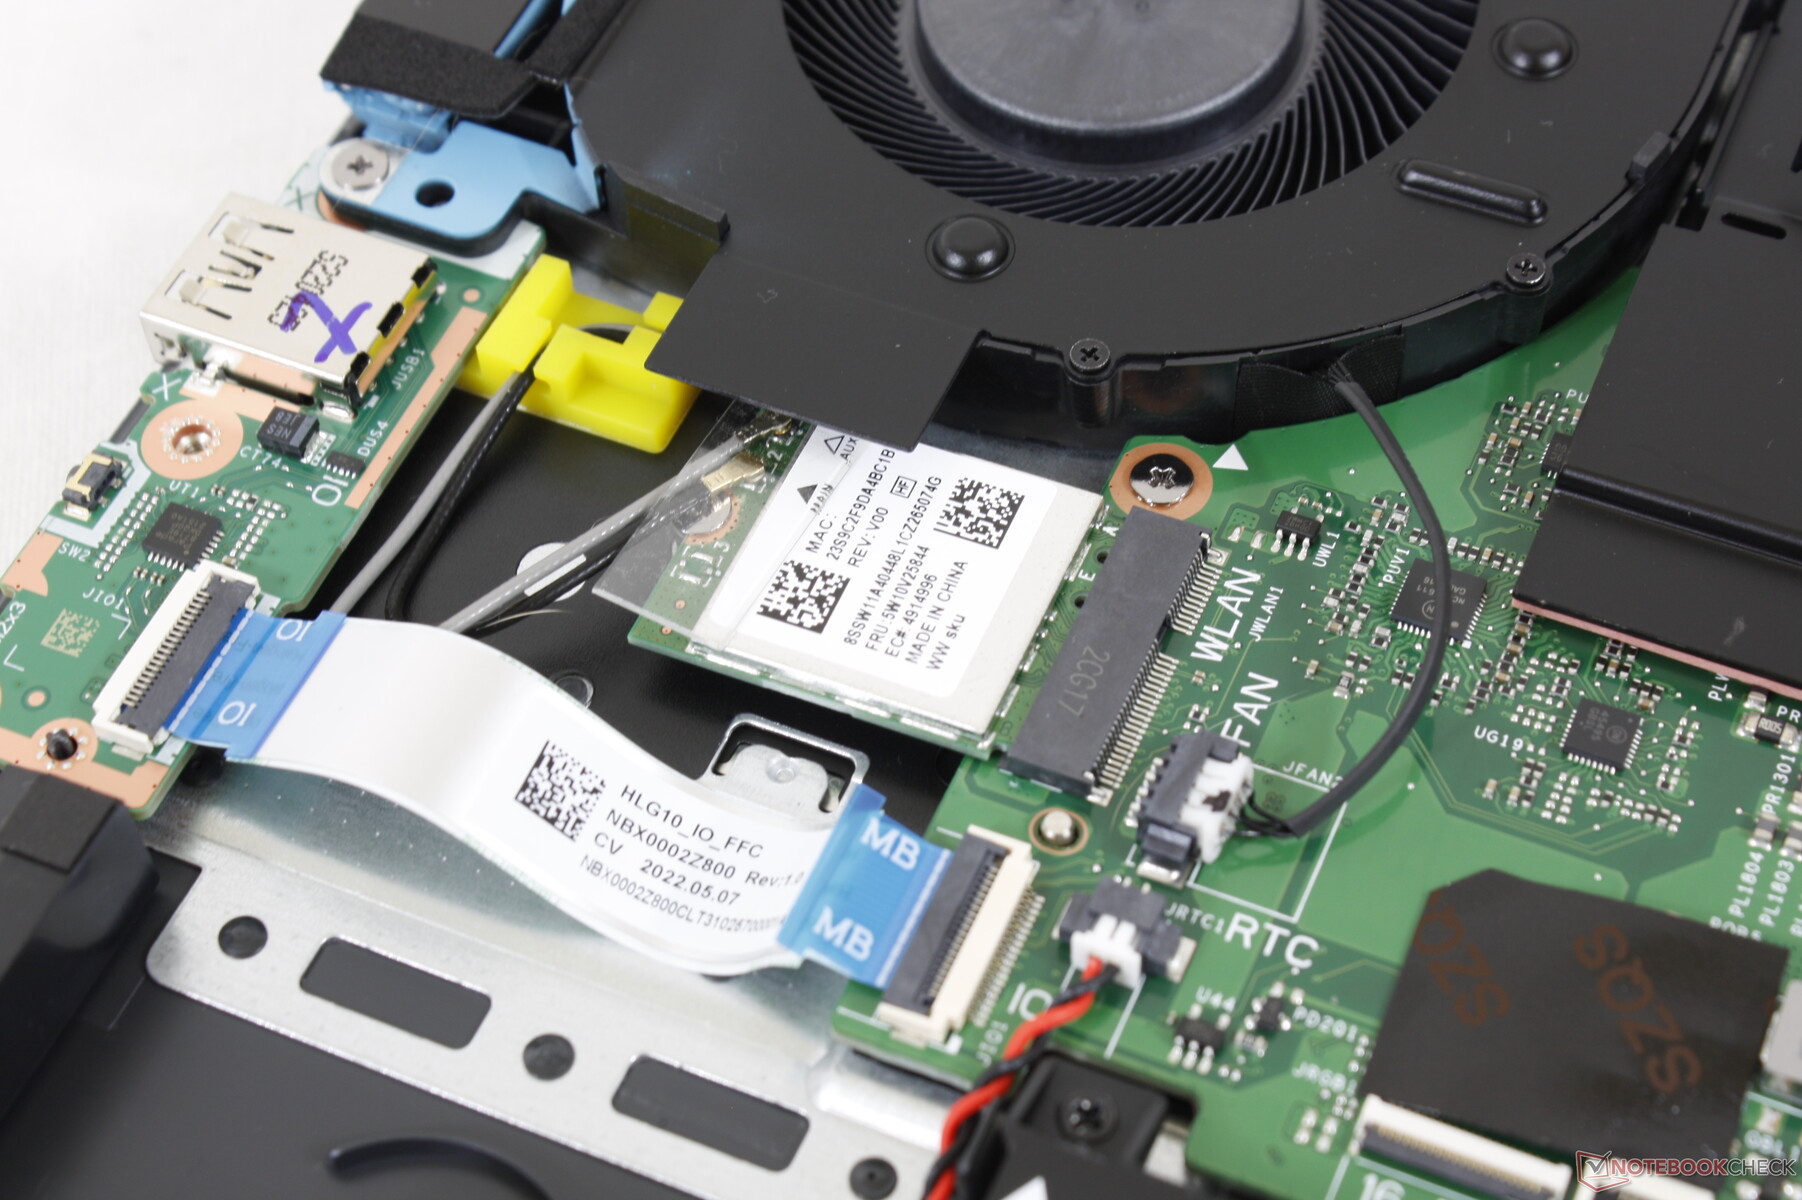
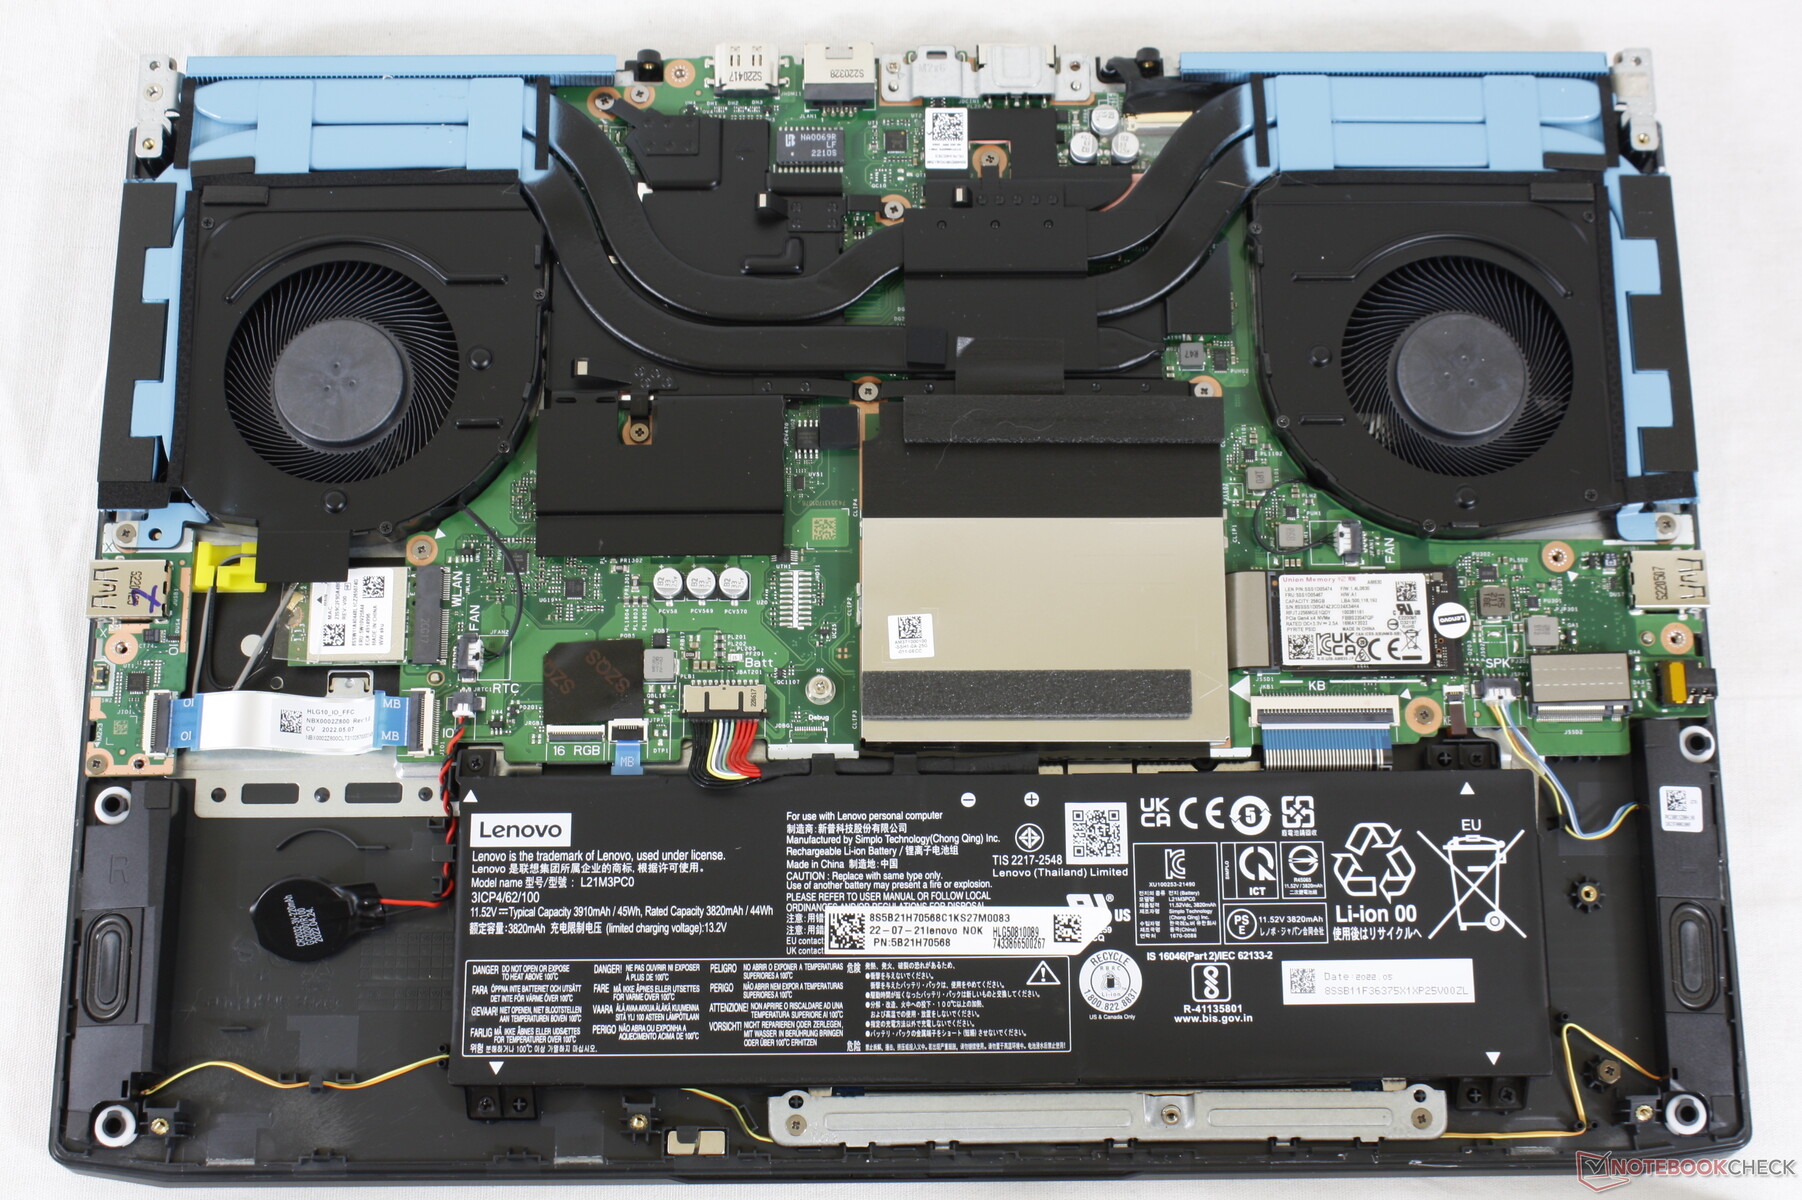
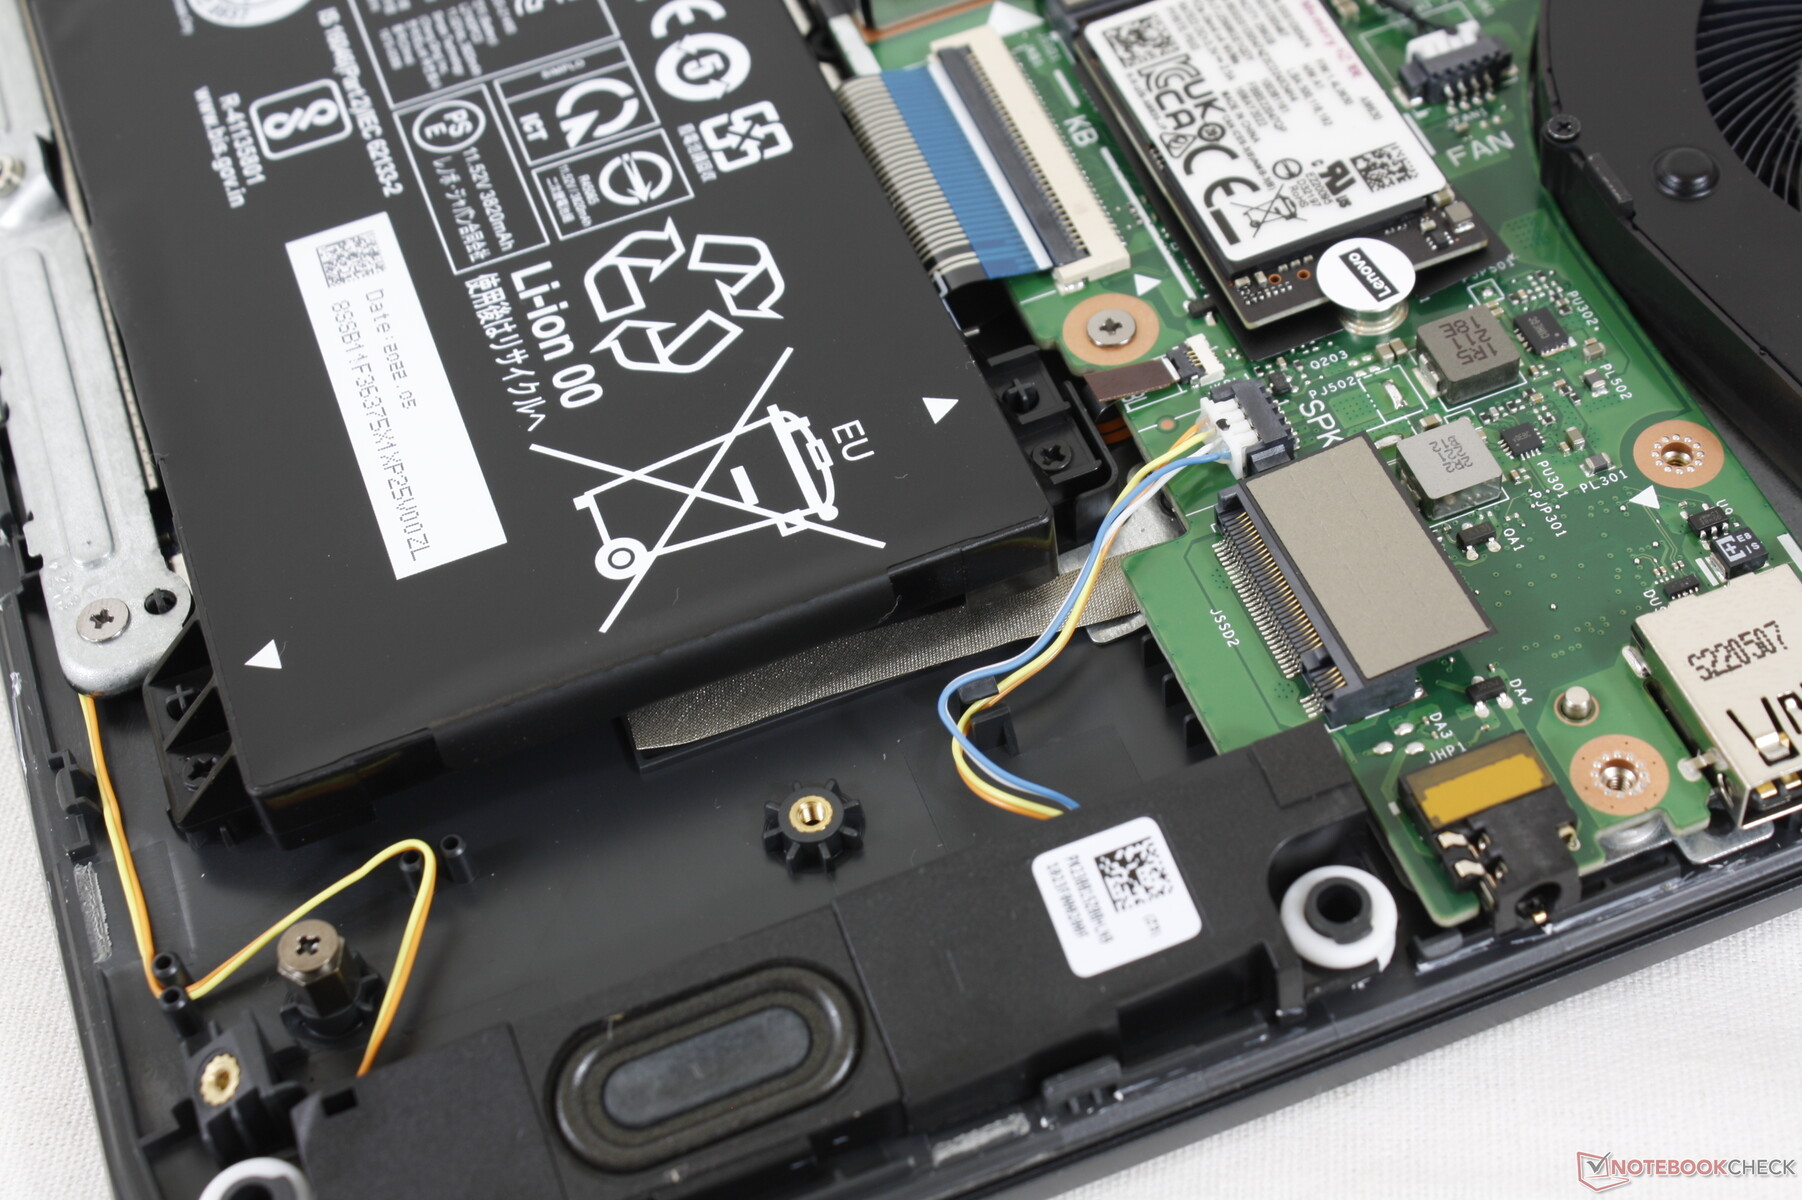
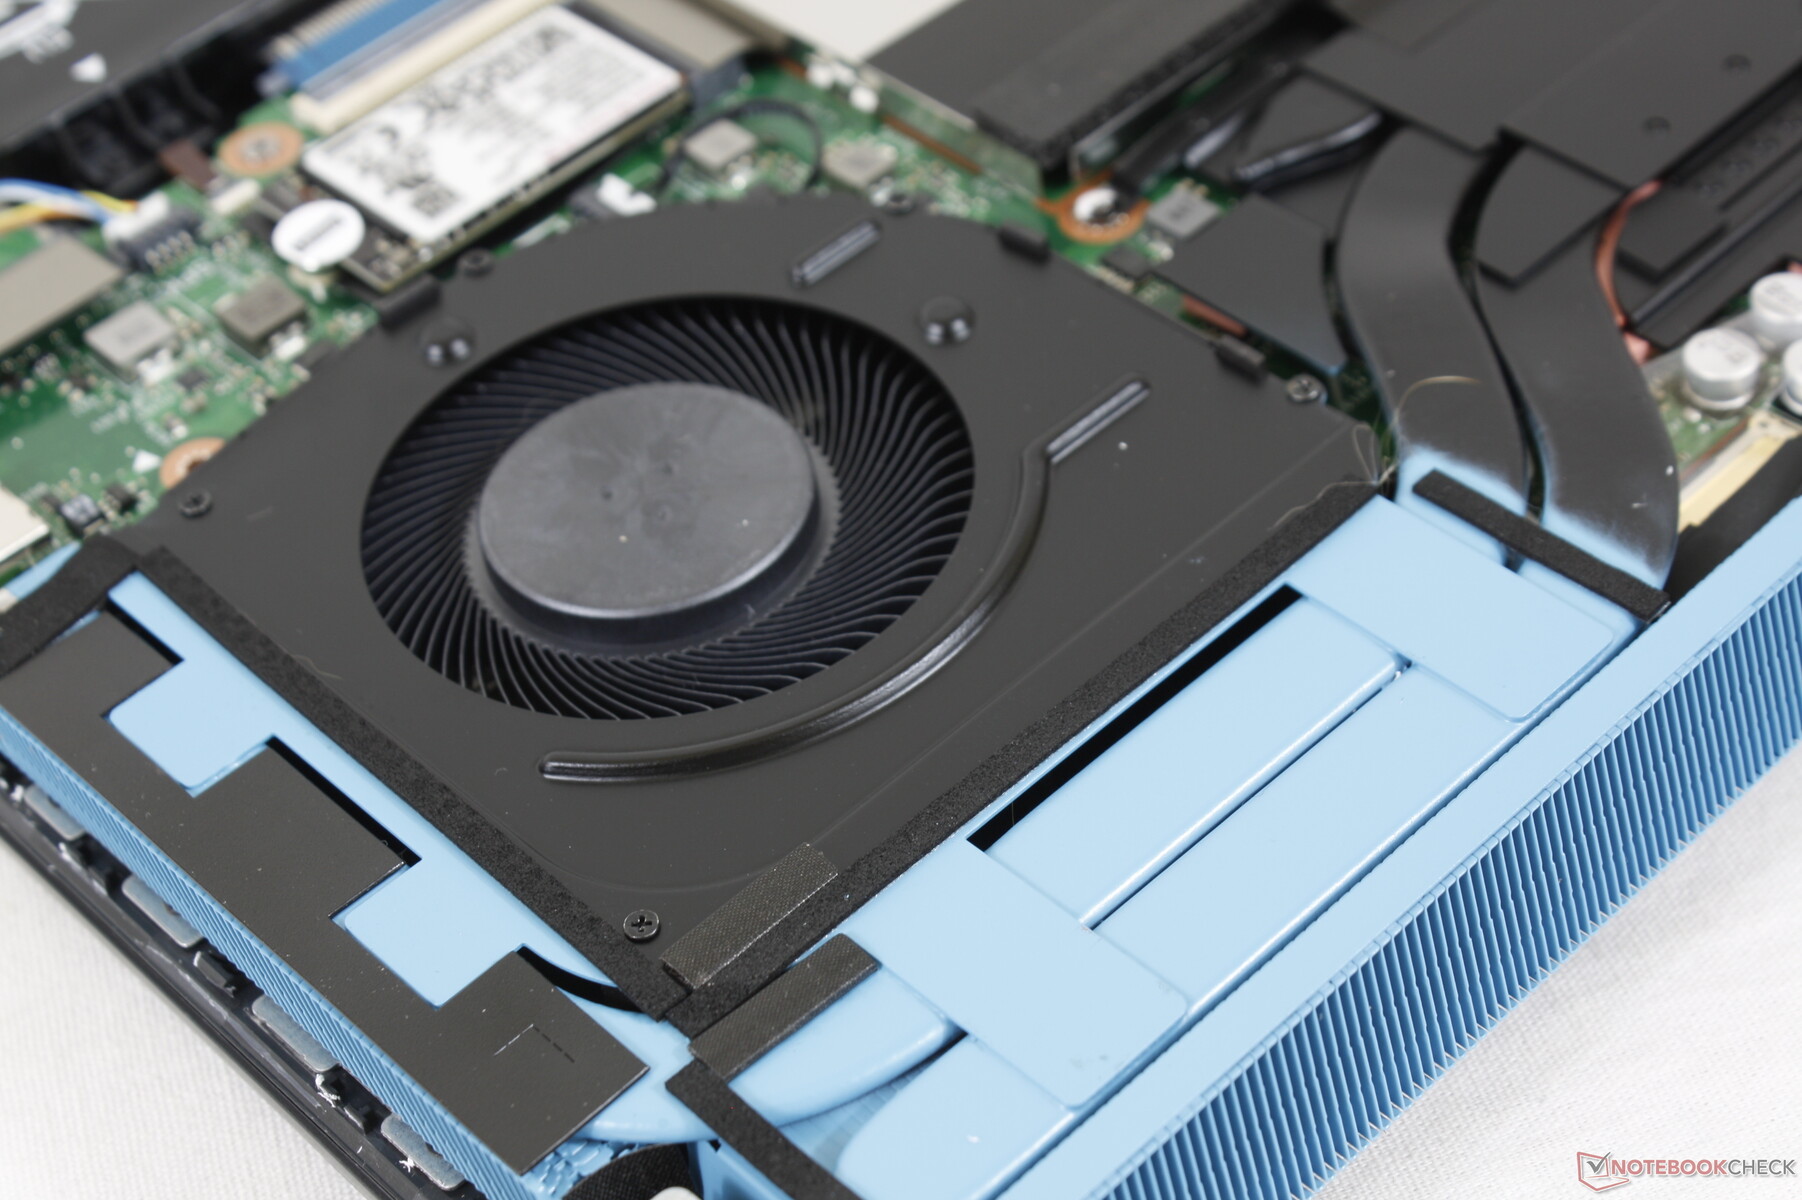
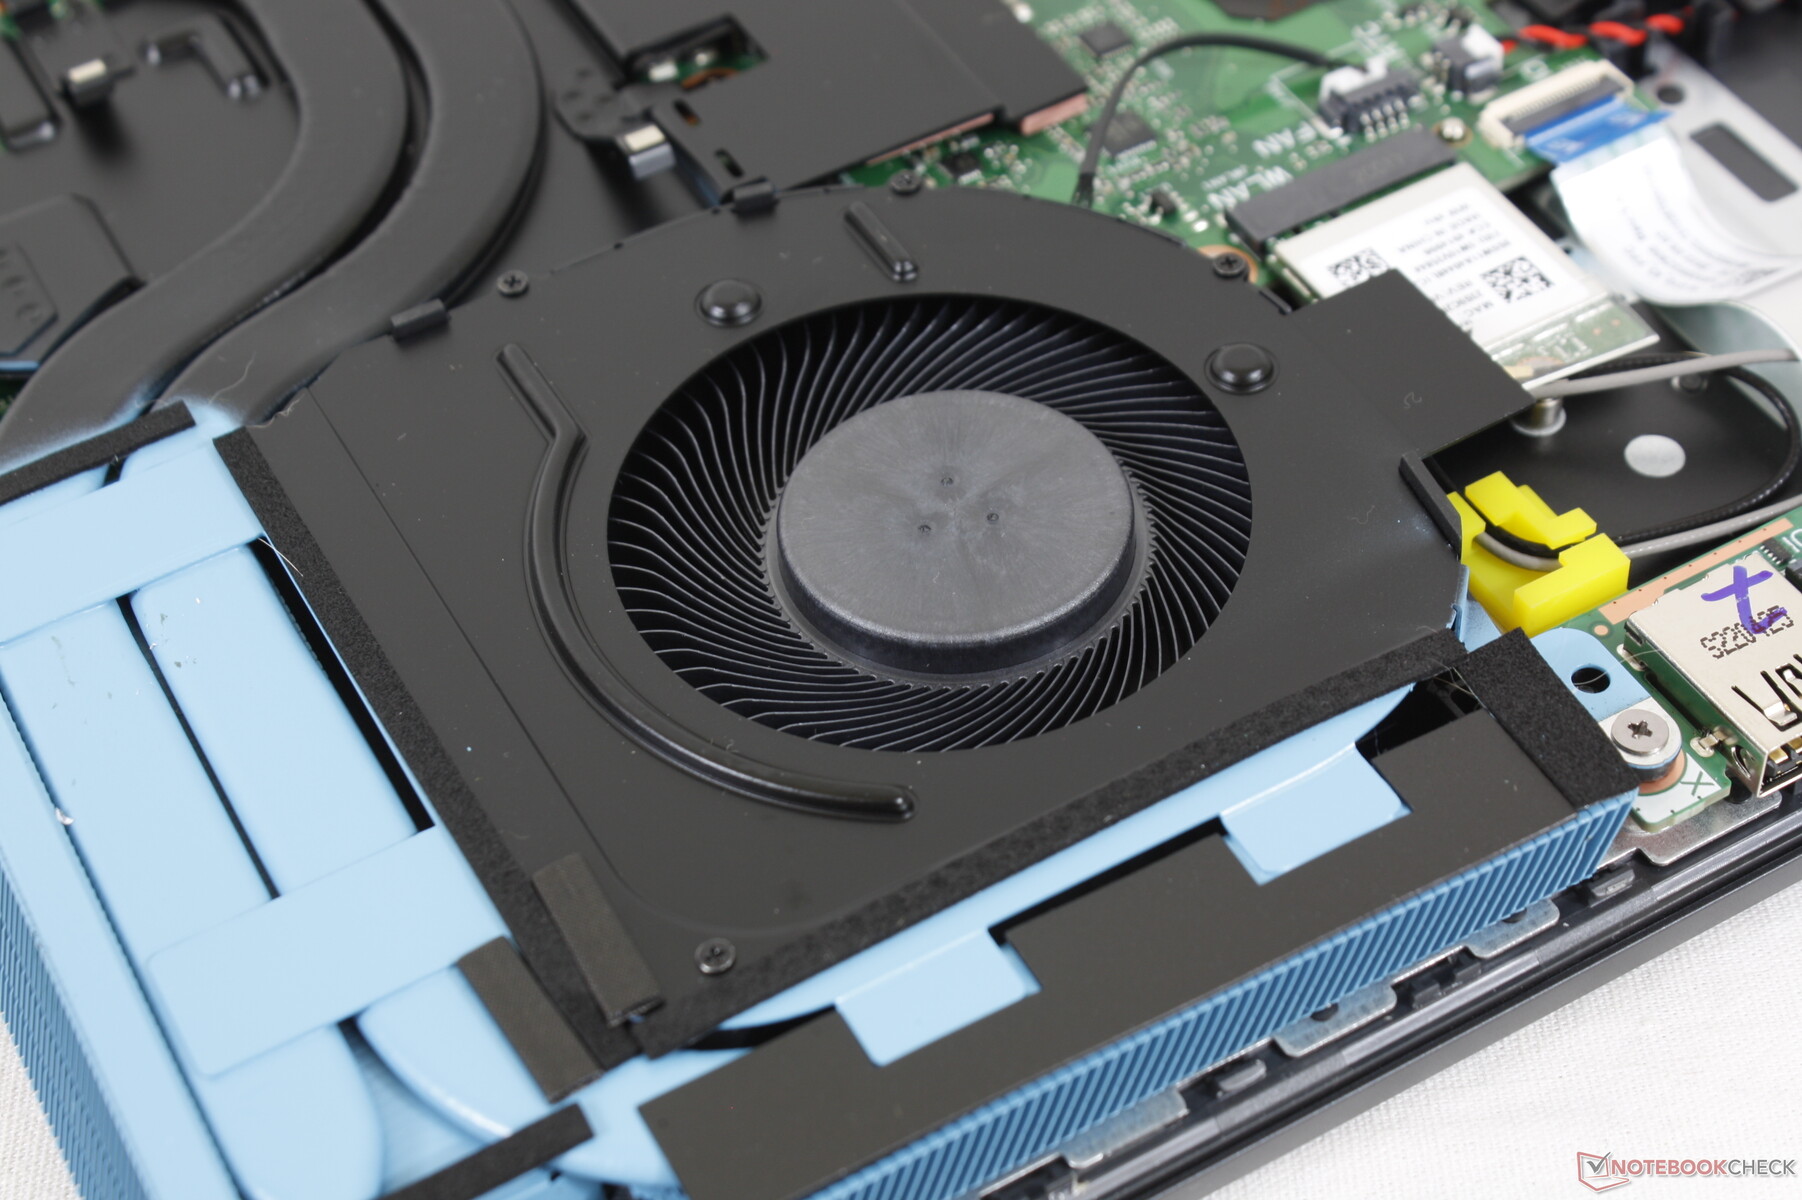
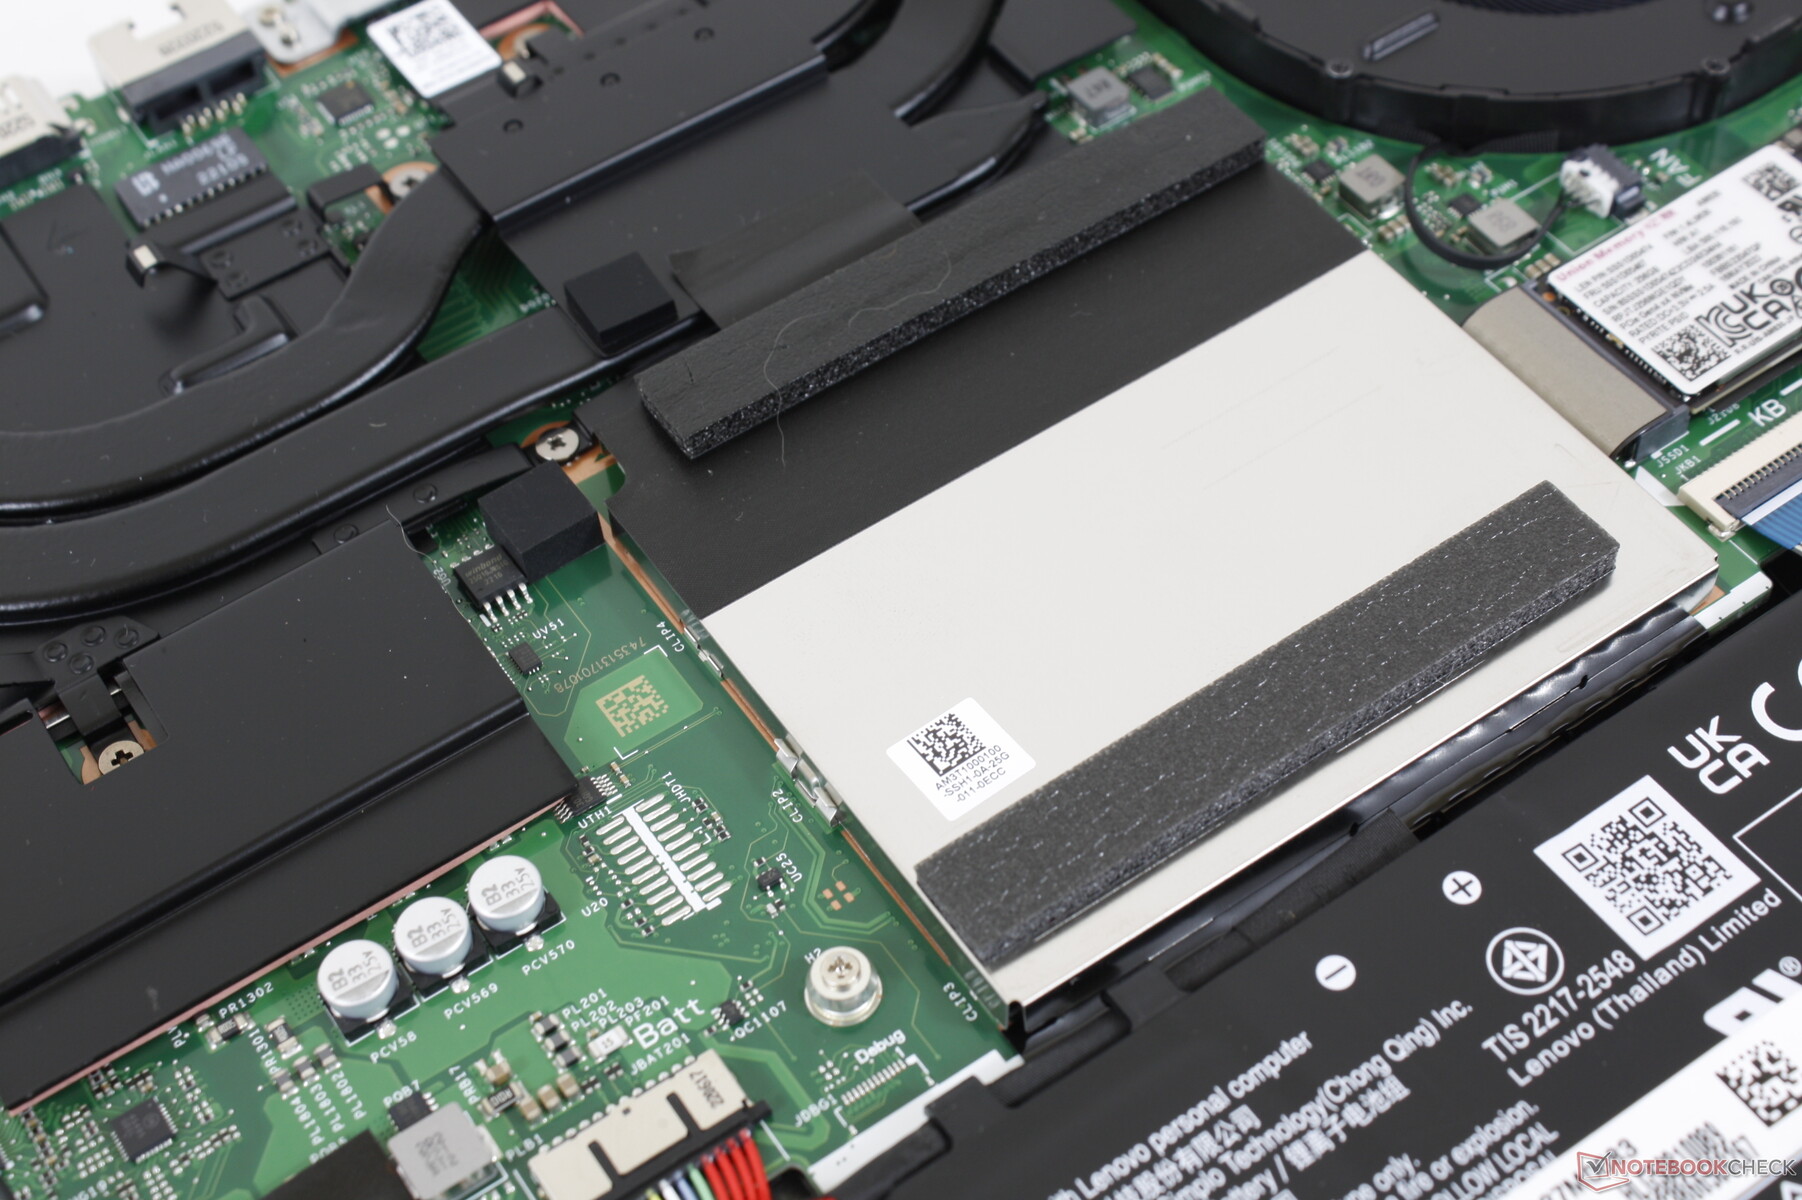
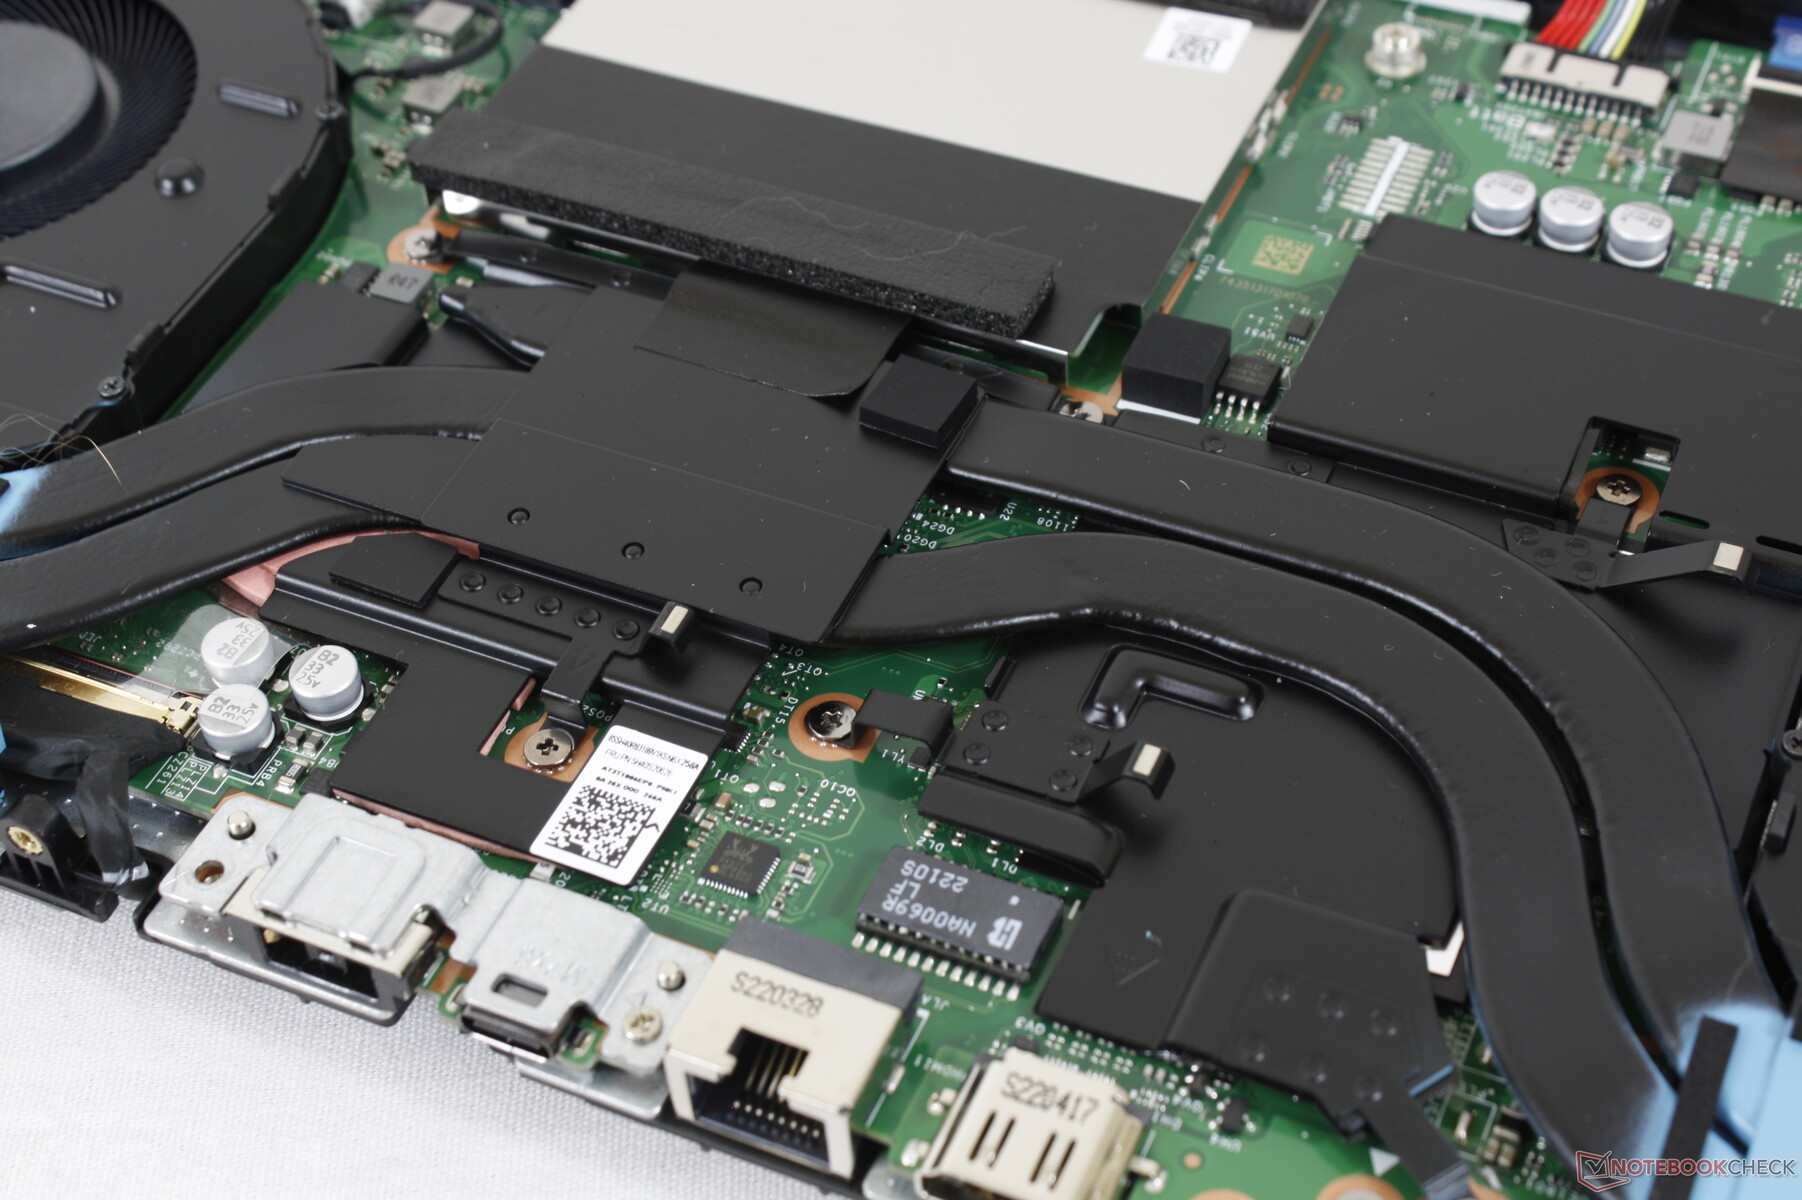
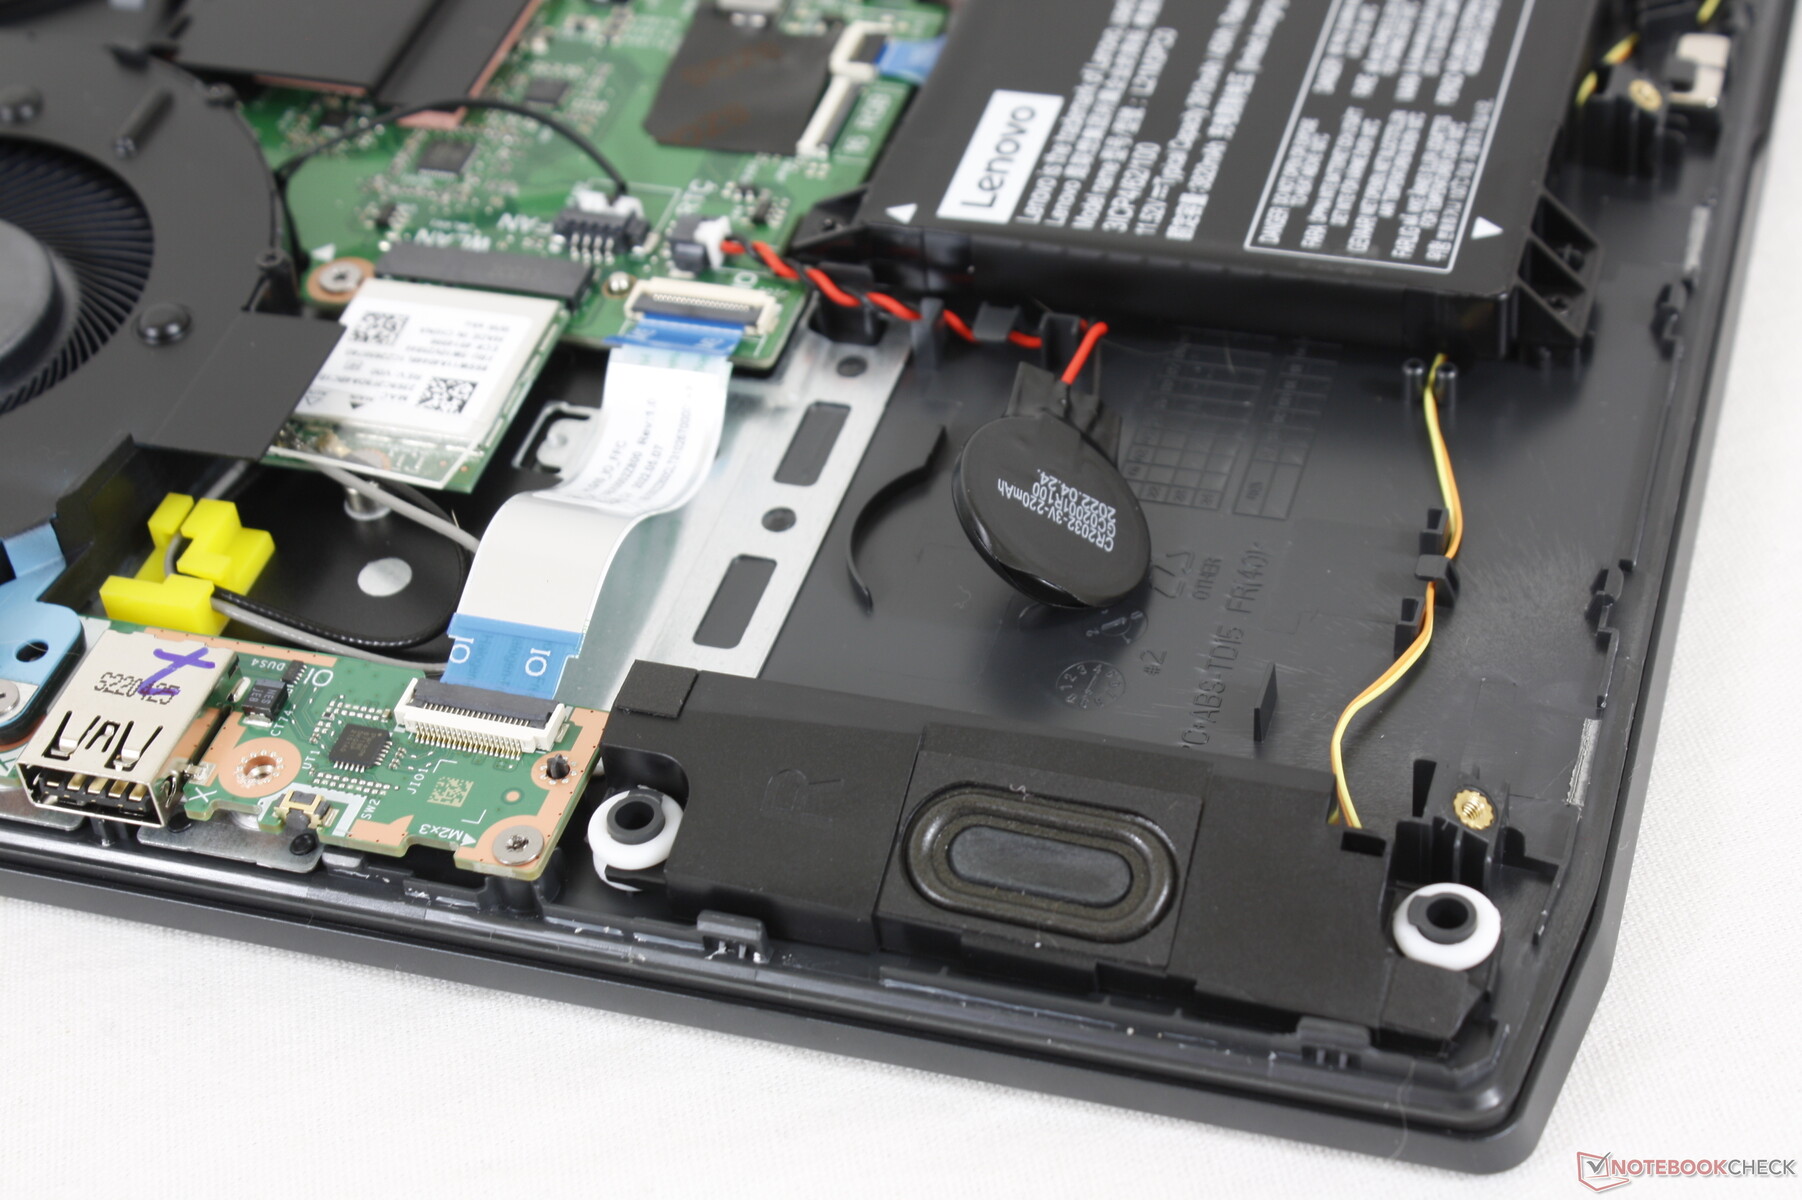
Underhåll - För svårt att öppna
Bottenpanelen är mycket svår att ta bort. Den sitter fast med 12 Philips-skruvar, men endast 8 är lätt åtkomliga. För att komma åt de övriga 4 måste det bakre skalet lossas först, vilket säkras av ytterligare 2 skruvar nära bakre portarna. Att ta bort detta bakre skal från kroppen är ett extra steg som inte finns på de flesta andra bärbara speldatorer. Det är tydligt att Lenovo inte designade IdeaPad Gaming 3 15 för att den ska vara lätt att uppgradera för slutanvändaren, vilket är synd eftersom det faktiskt finns många uppgraderingsvägar, inklusive 2x SODIMM-platser och 2x M.2-lagringsfack.
Tillbehör och garanti
Det finns inga extra tillbehör i lådan utöver nätadaptern och pappersarbete. Den vanliga ettåriga begränsade garantin gäller om den köps i USA.
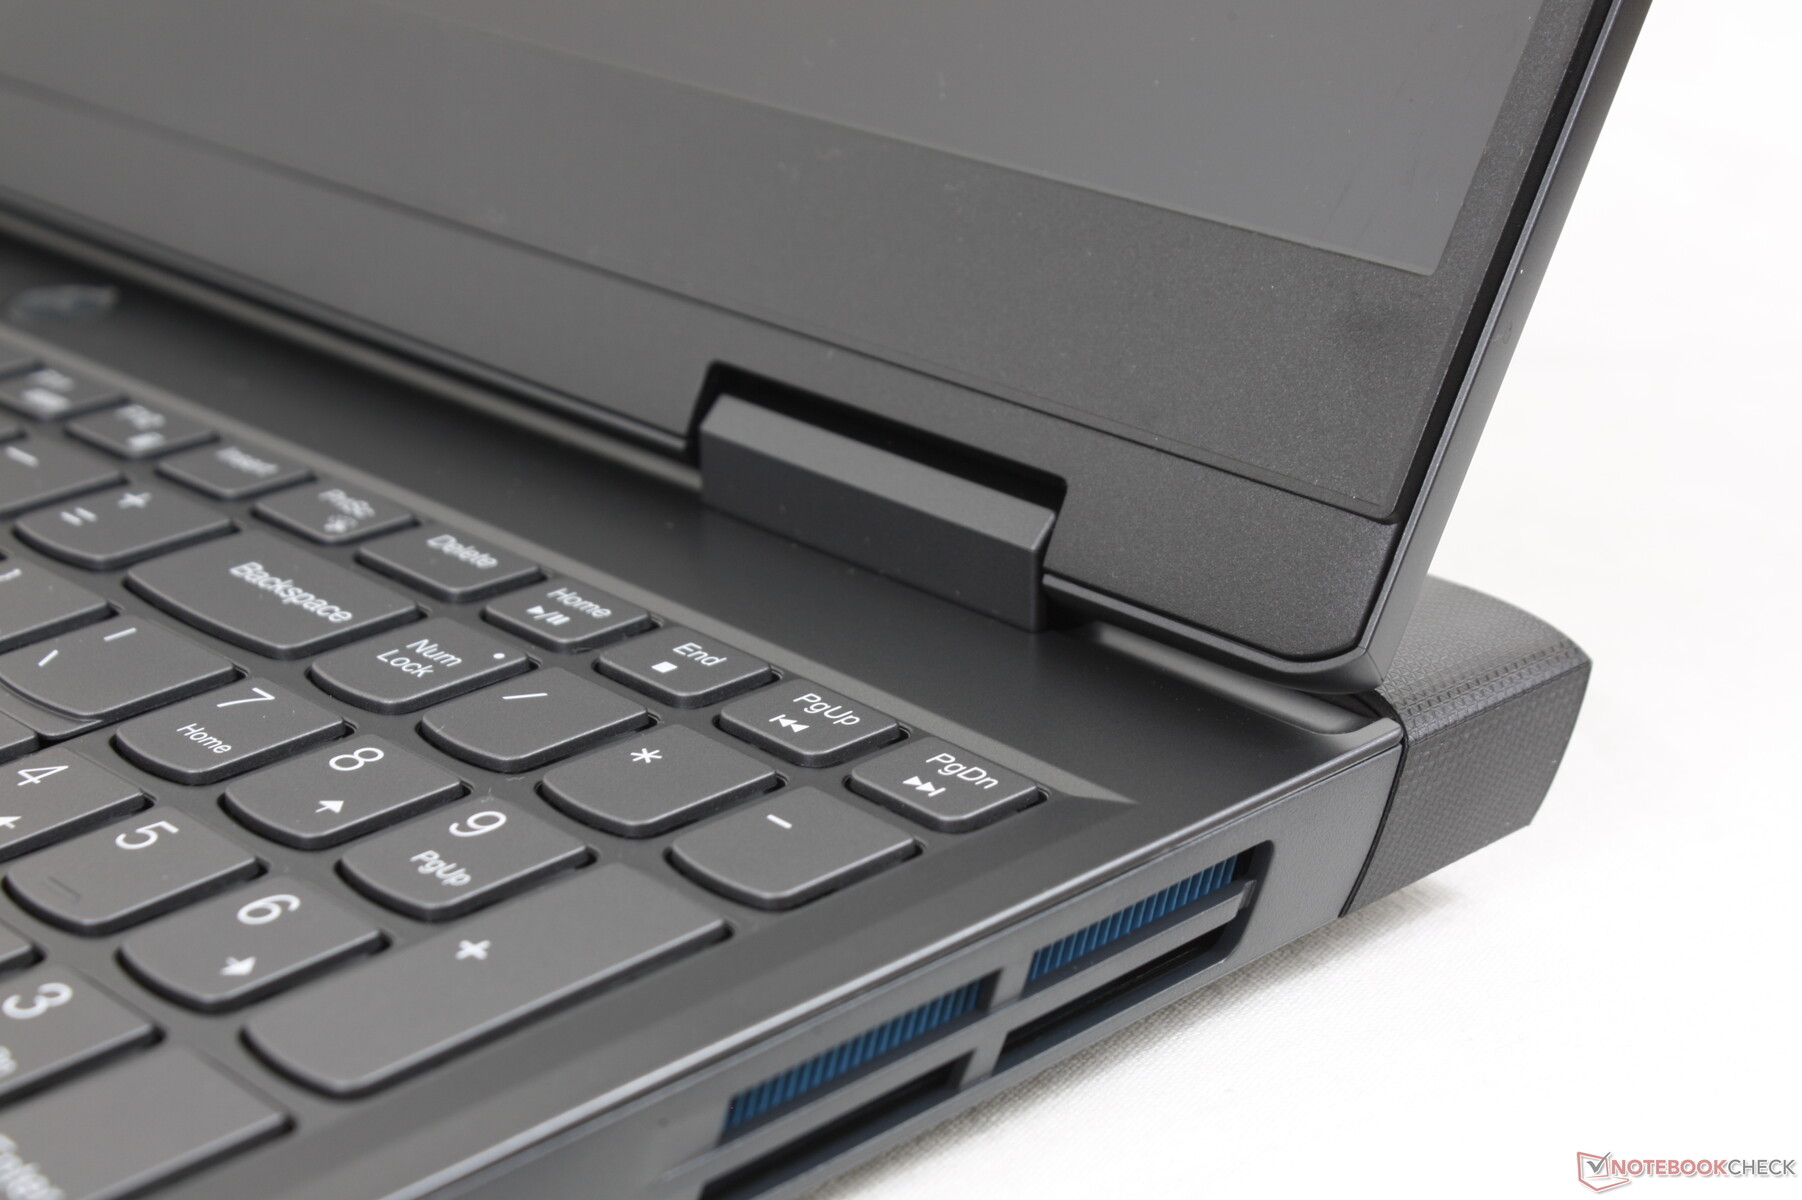
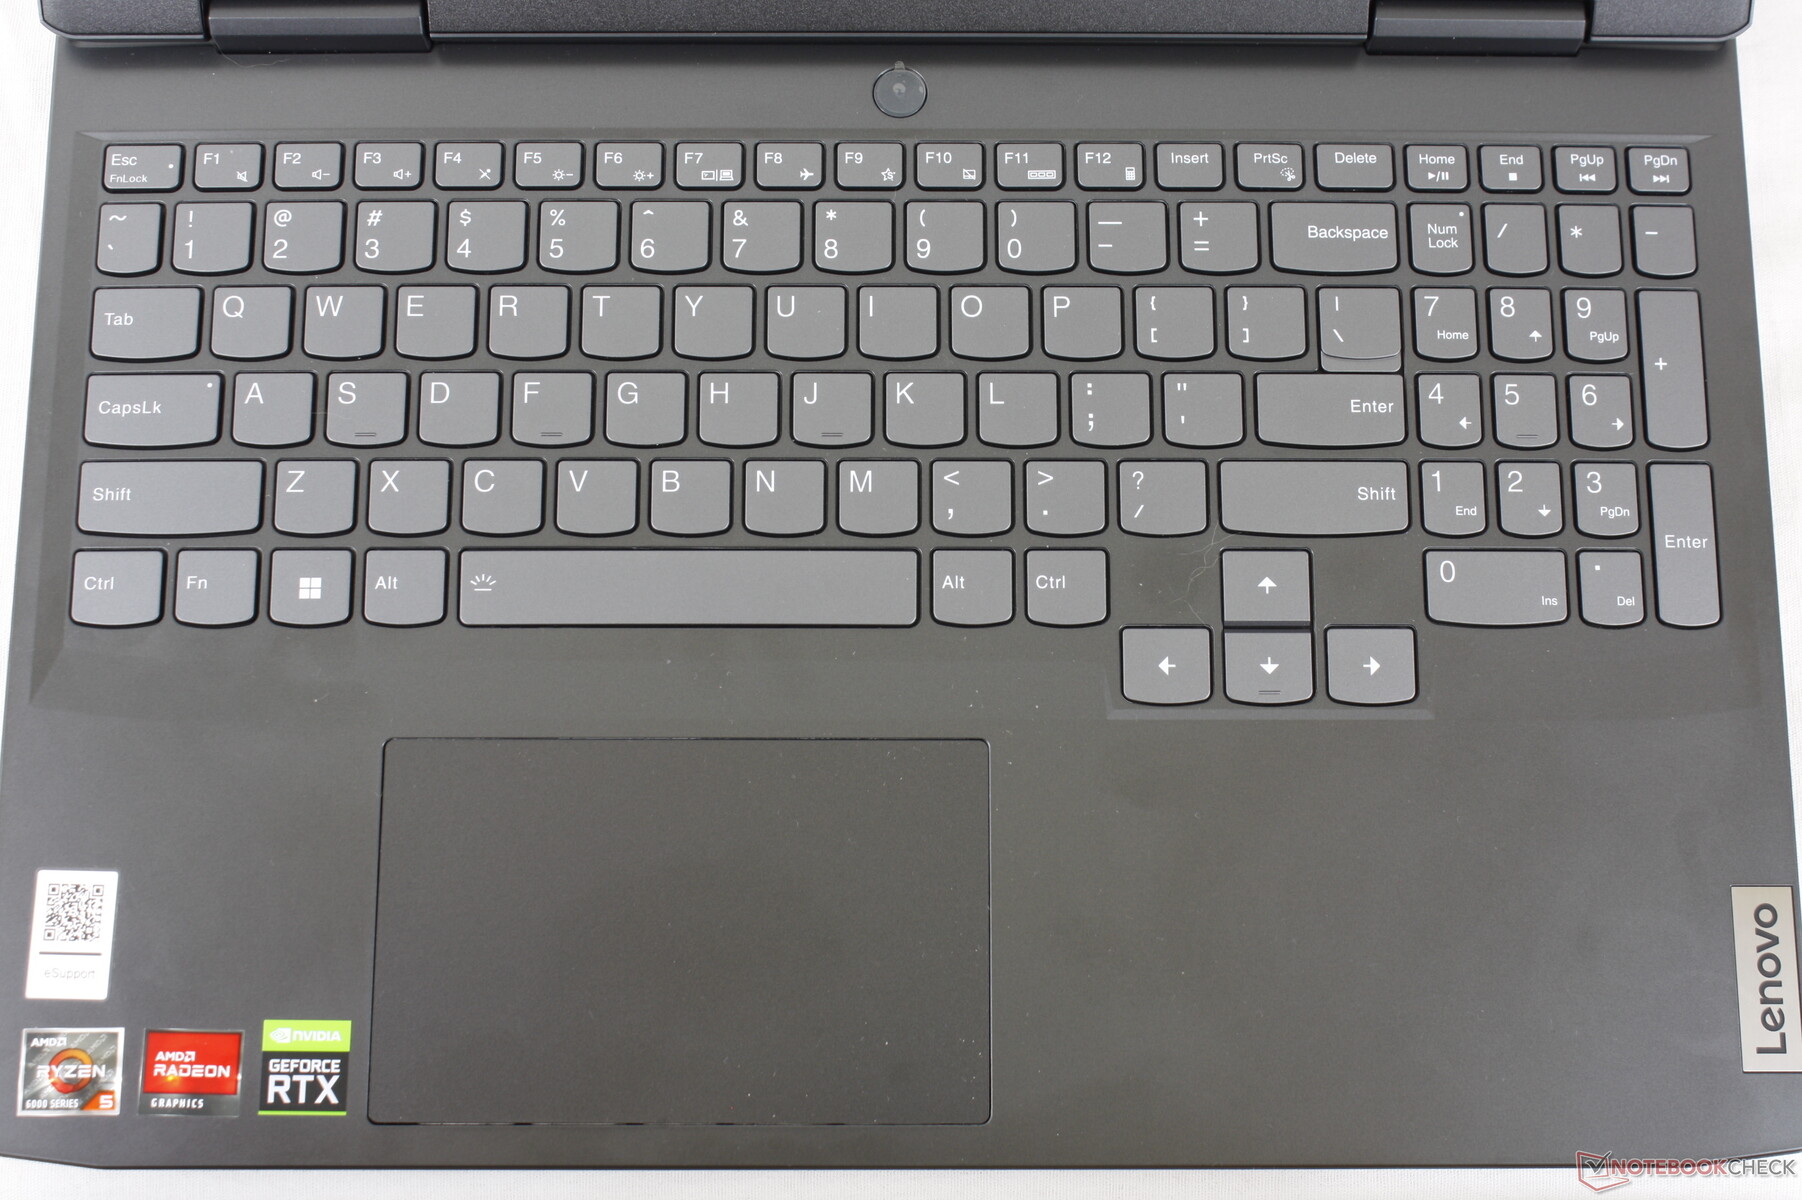
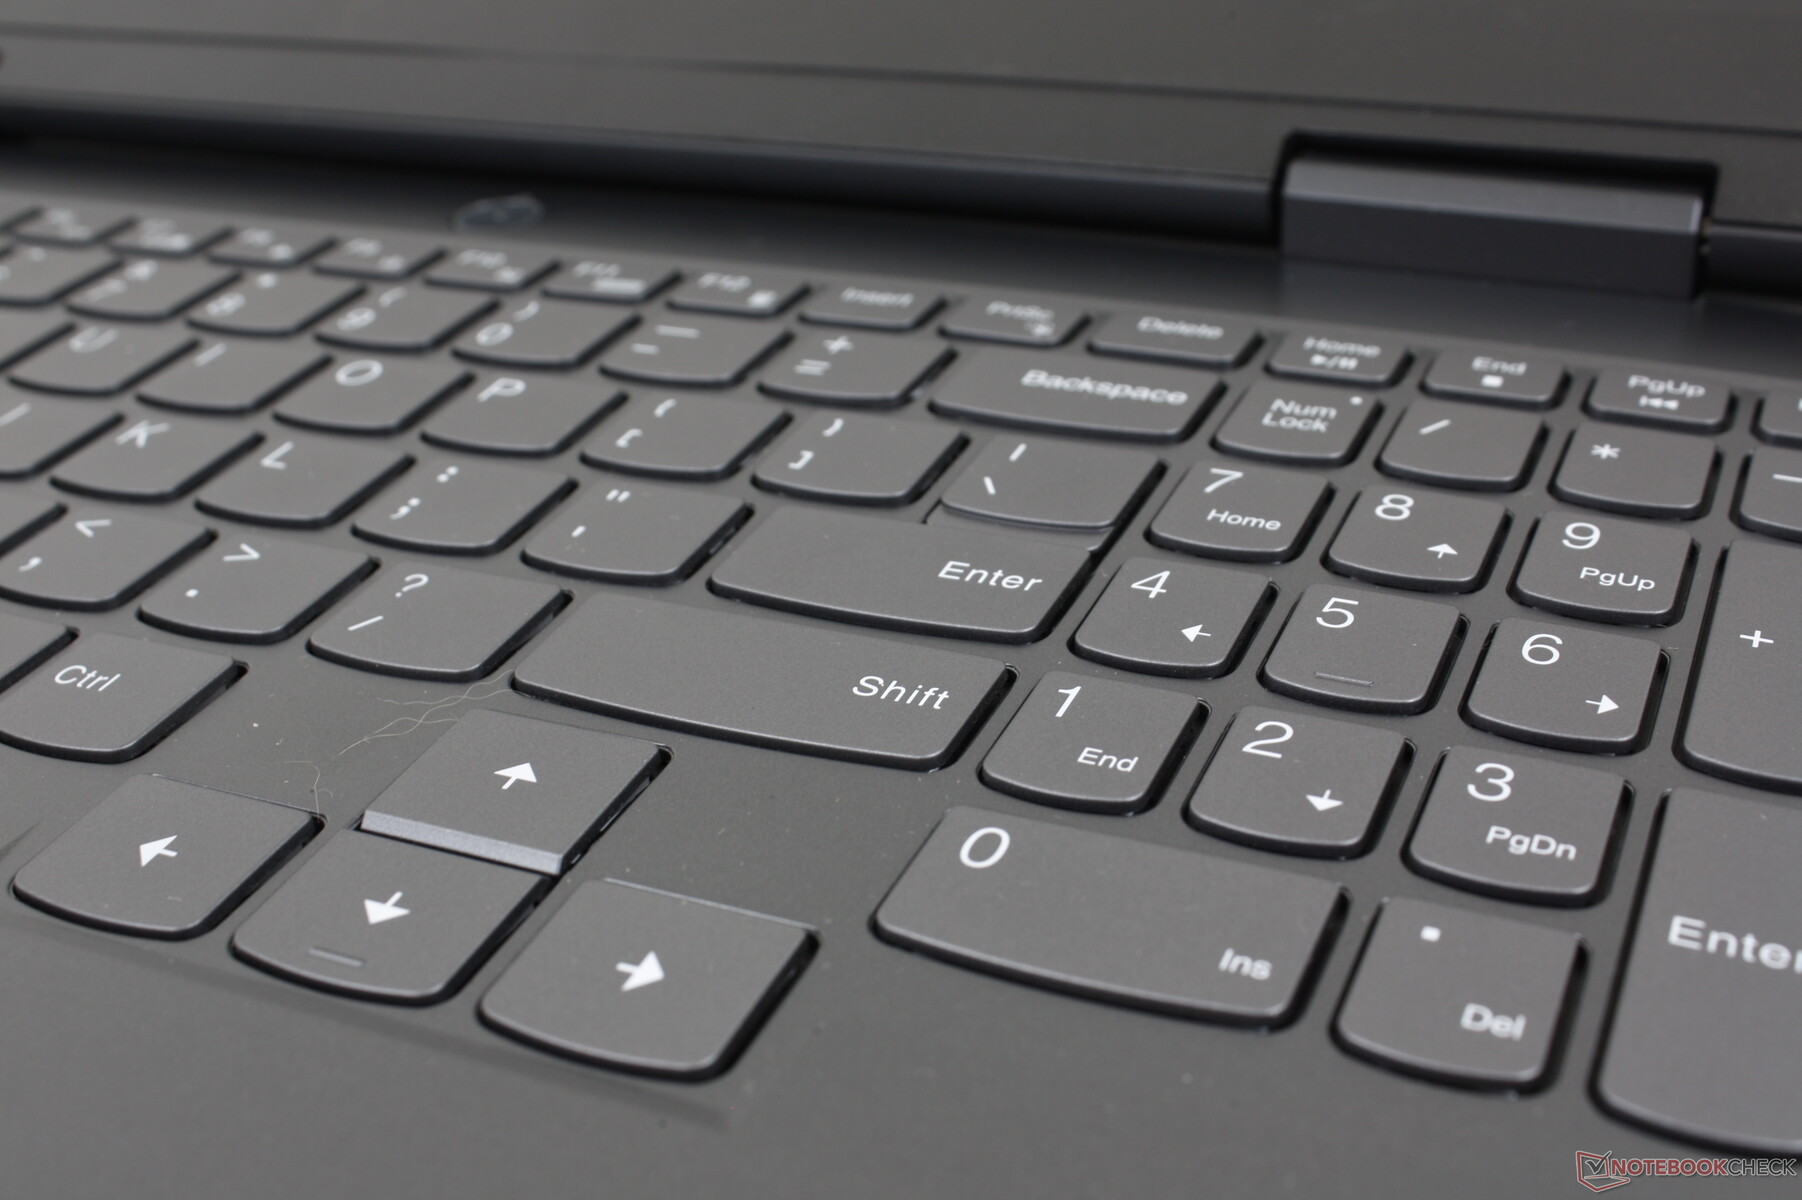
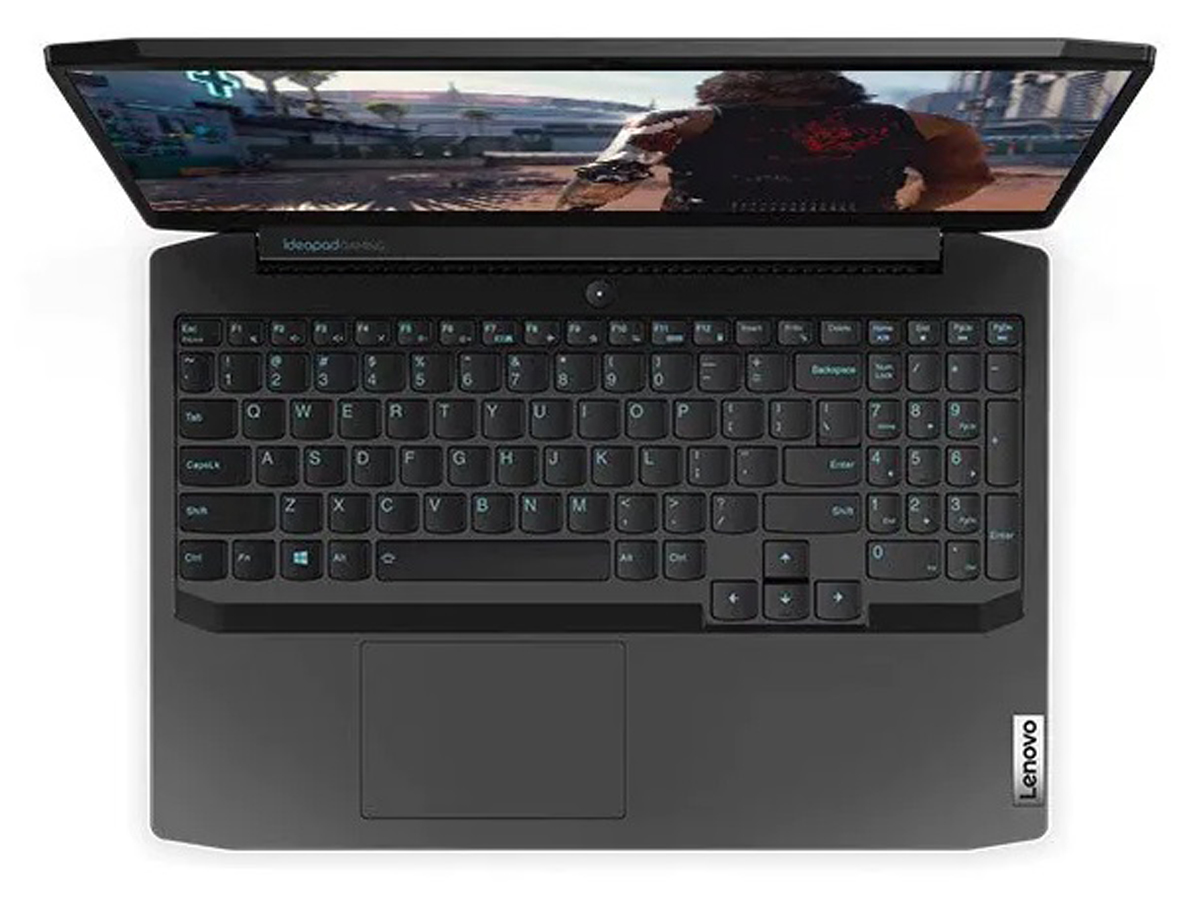
Inmatningsenheter - Classic IdeaPad
Tangentbord
Bokstäverna och symbolerna på varje tangent är nu vita medan de var ljusblå på IdeaPad Gaming 3i från 2020. I övrigt är allt från tangenternas storlek och känsla oförändrat för i princip samma skrivupplevelse mellan de två modellerna trots alla chassiändringar. Tangentåterkopplingen är på den lätta och grunda sidan för att likna många budget- till mellanklass Ultrabooks som t.ex Asus VivoBook eller standard IdeaPad.
En vit bakgrundsbelysning i två nivåer är standard för att belysa trycket på varje tangent, inklusive de mindre sekundära symbolerna.
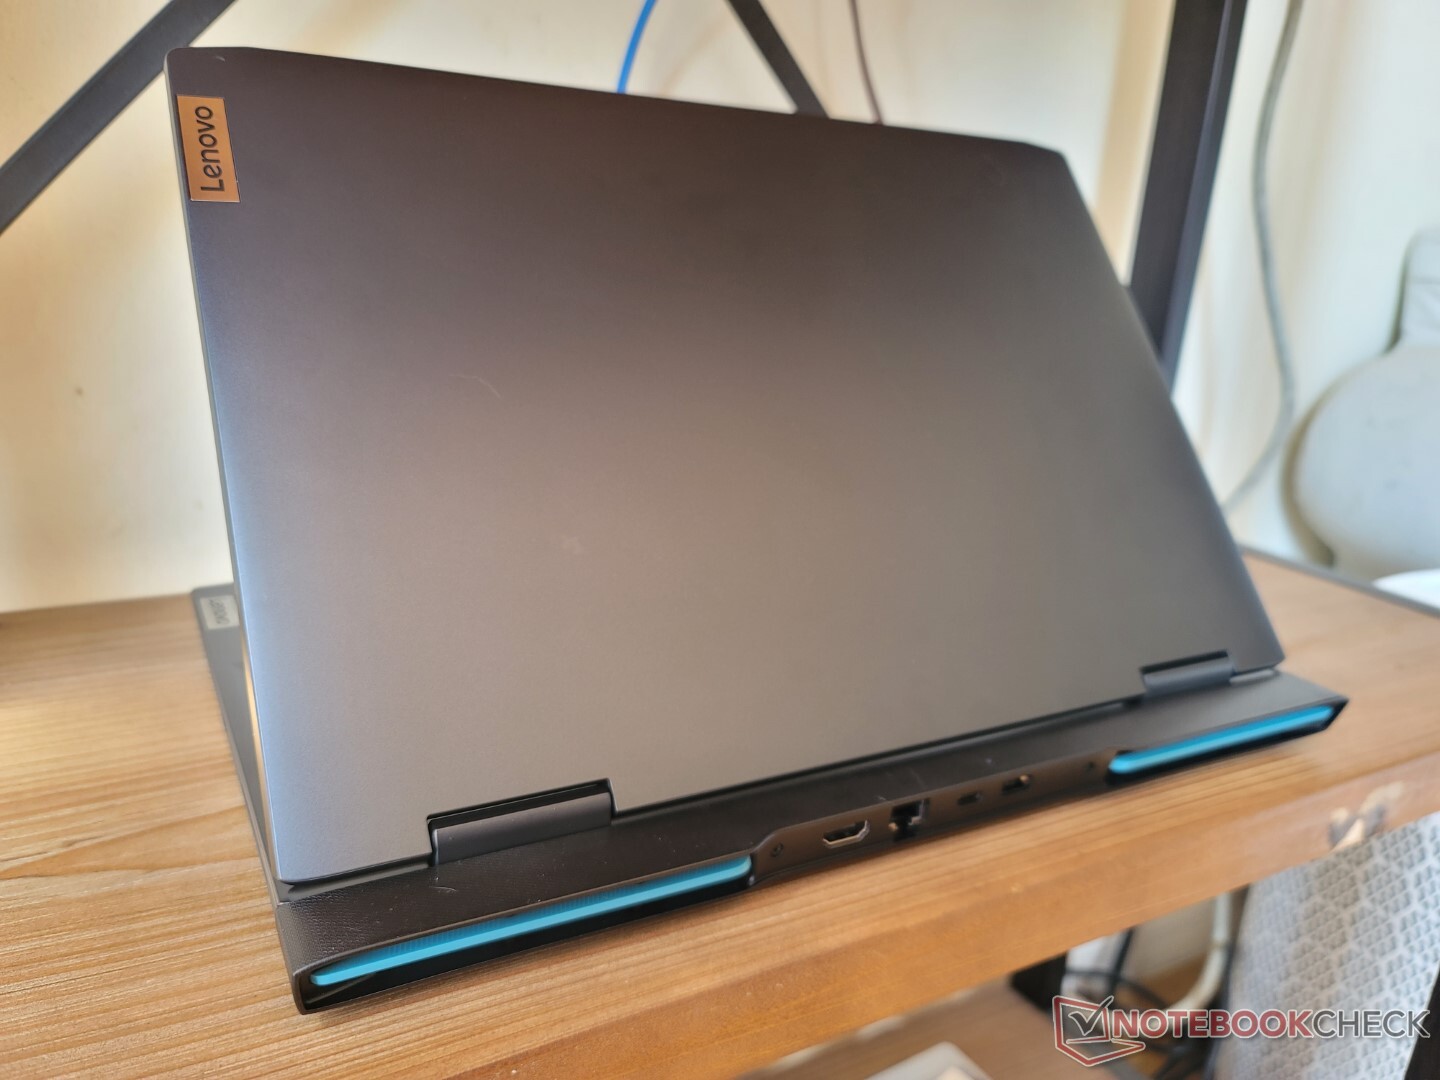
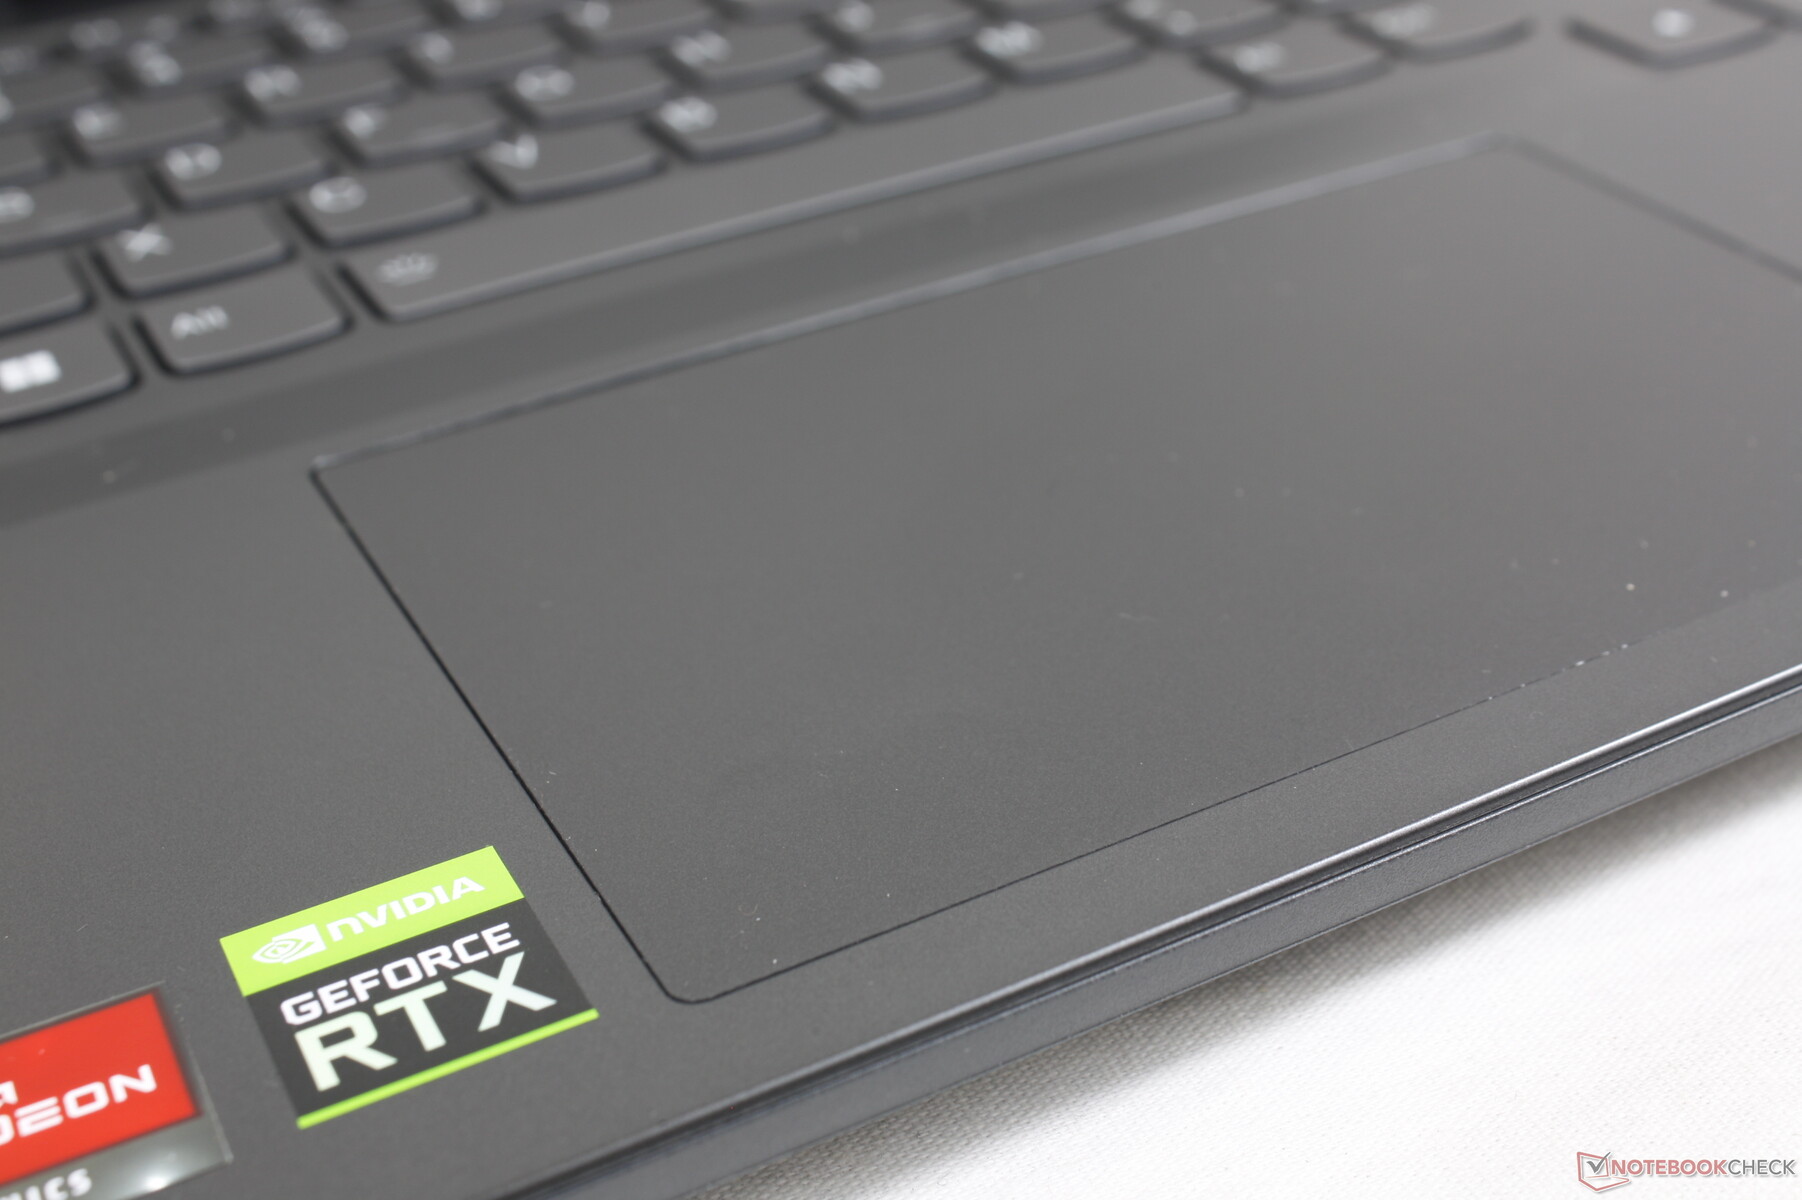
Pekplatta
Klickplattan är större än klickplattan på en MSI Bravo 15 (12,5 x 7,5 cm jämfört med 10,5 x 6,5 cm). Tyvärr är både dragkraft och återkoppling klibbigare respektive svampigare än på de flesta andra bärbara datorer för en sämre användarupplevelse. Fingret fastnar ofta när man glider i medelhastighet och klickandet är inte tillfredsställande på grund av den kladdiga återkopplingen.

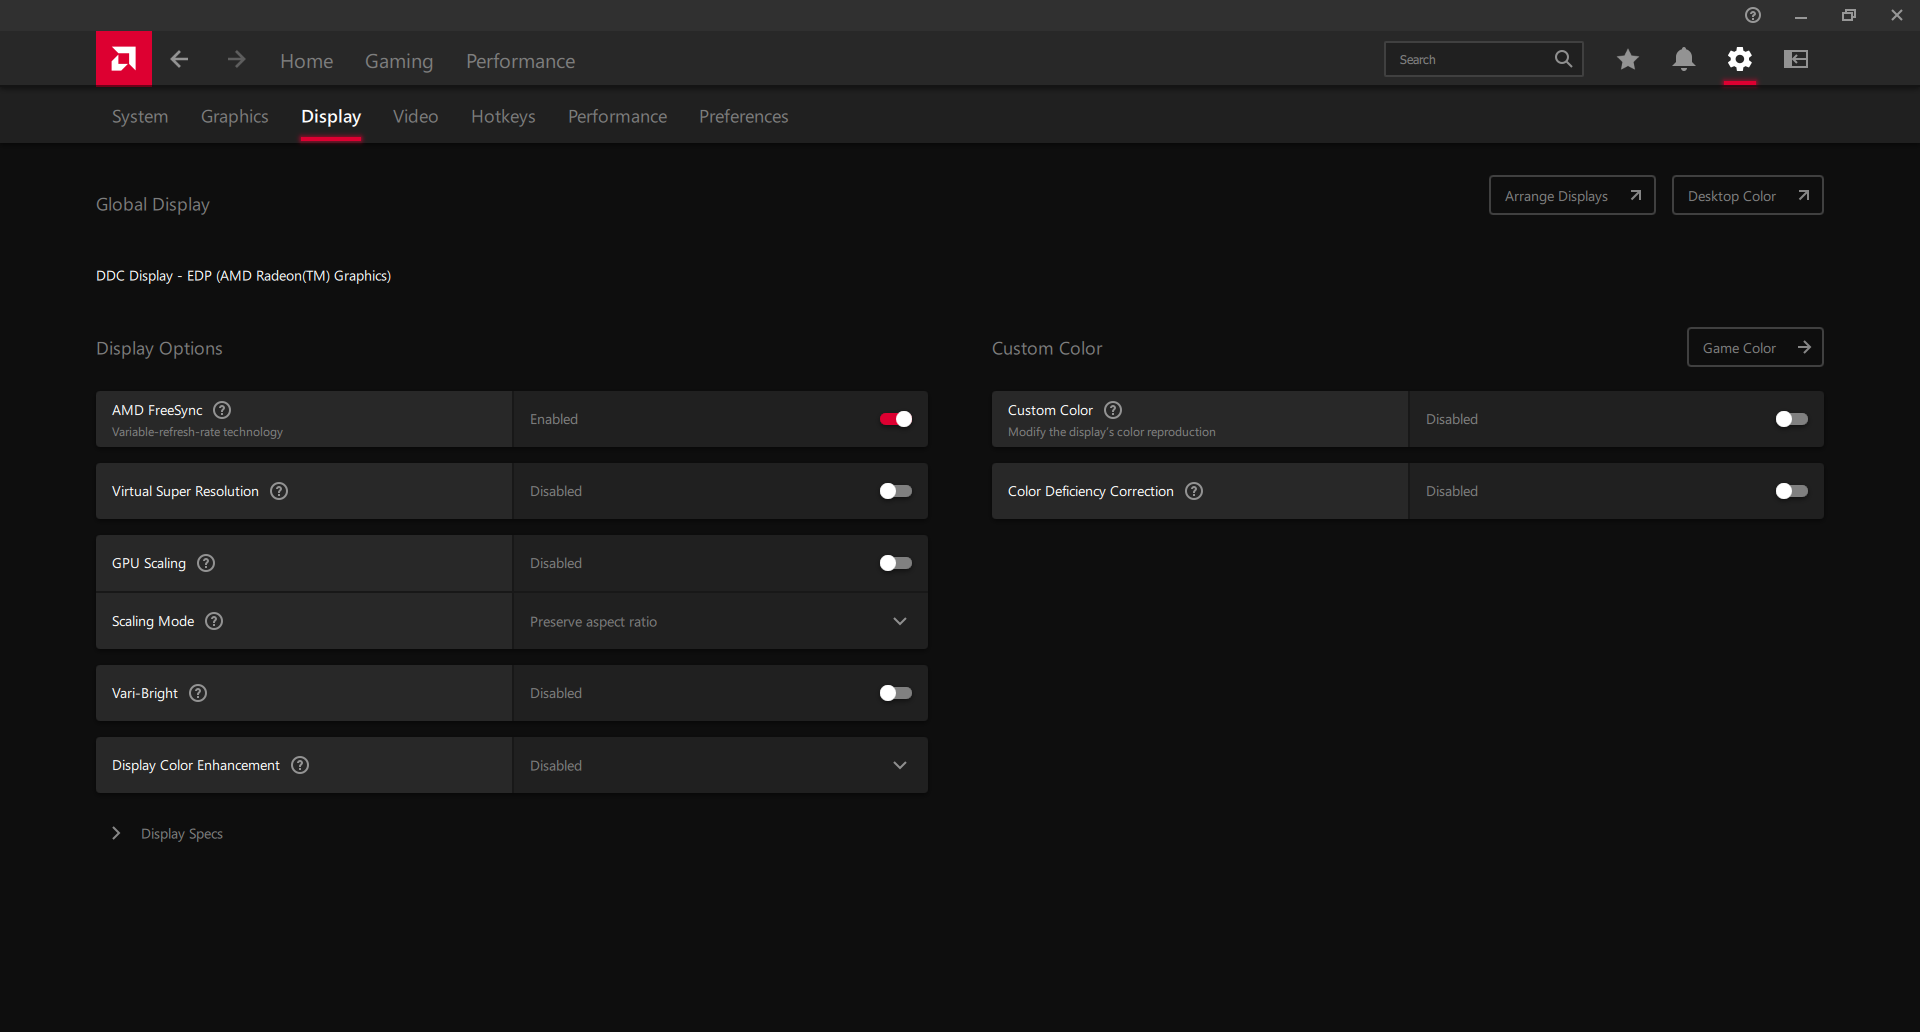
Skärm - FreeSync och 120 Hz är standard
Positiva egenskaper hos skärmen är stöd för inbyggd uppdateringsfrekvens på 120 Hz och FreeSync. Svarstiderna för svartvitt och grått är också hyfsade med cirka 9-10 ms vardera. För speländamål får skärmen jobbet gjort när det gäller att minimera ghosting och screen tearing.
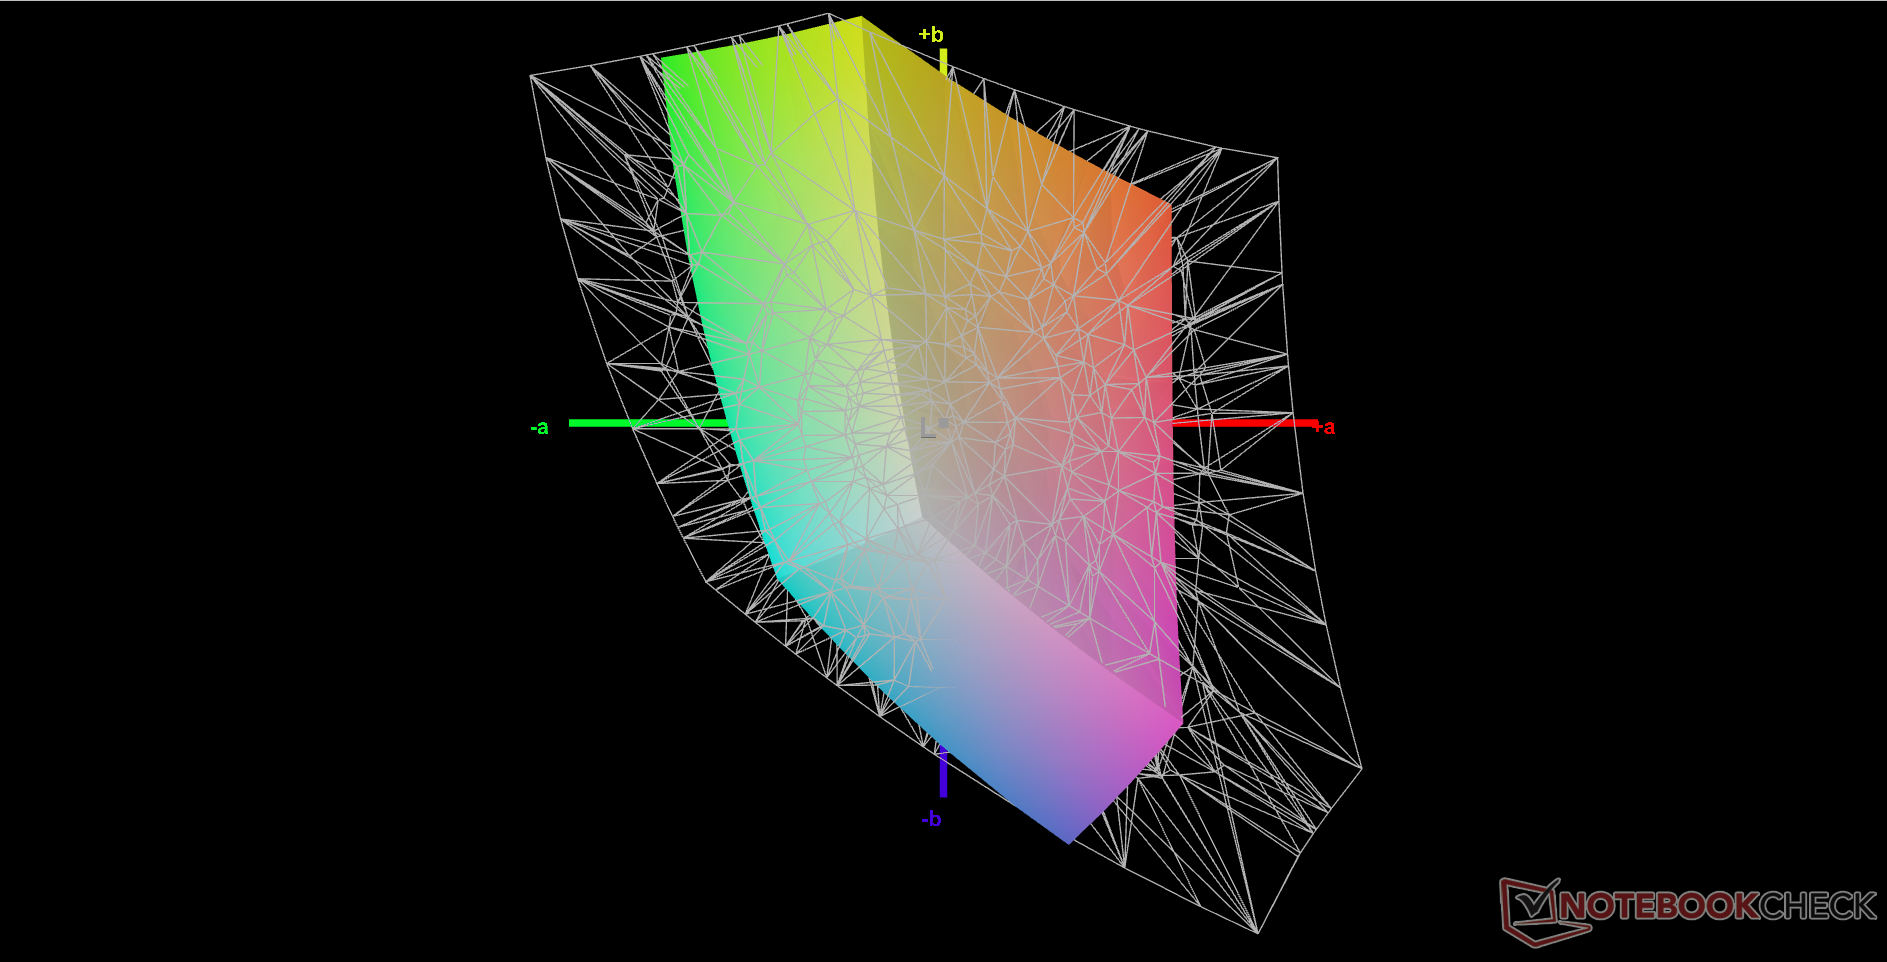
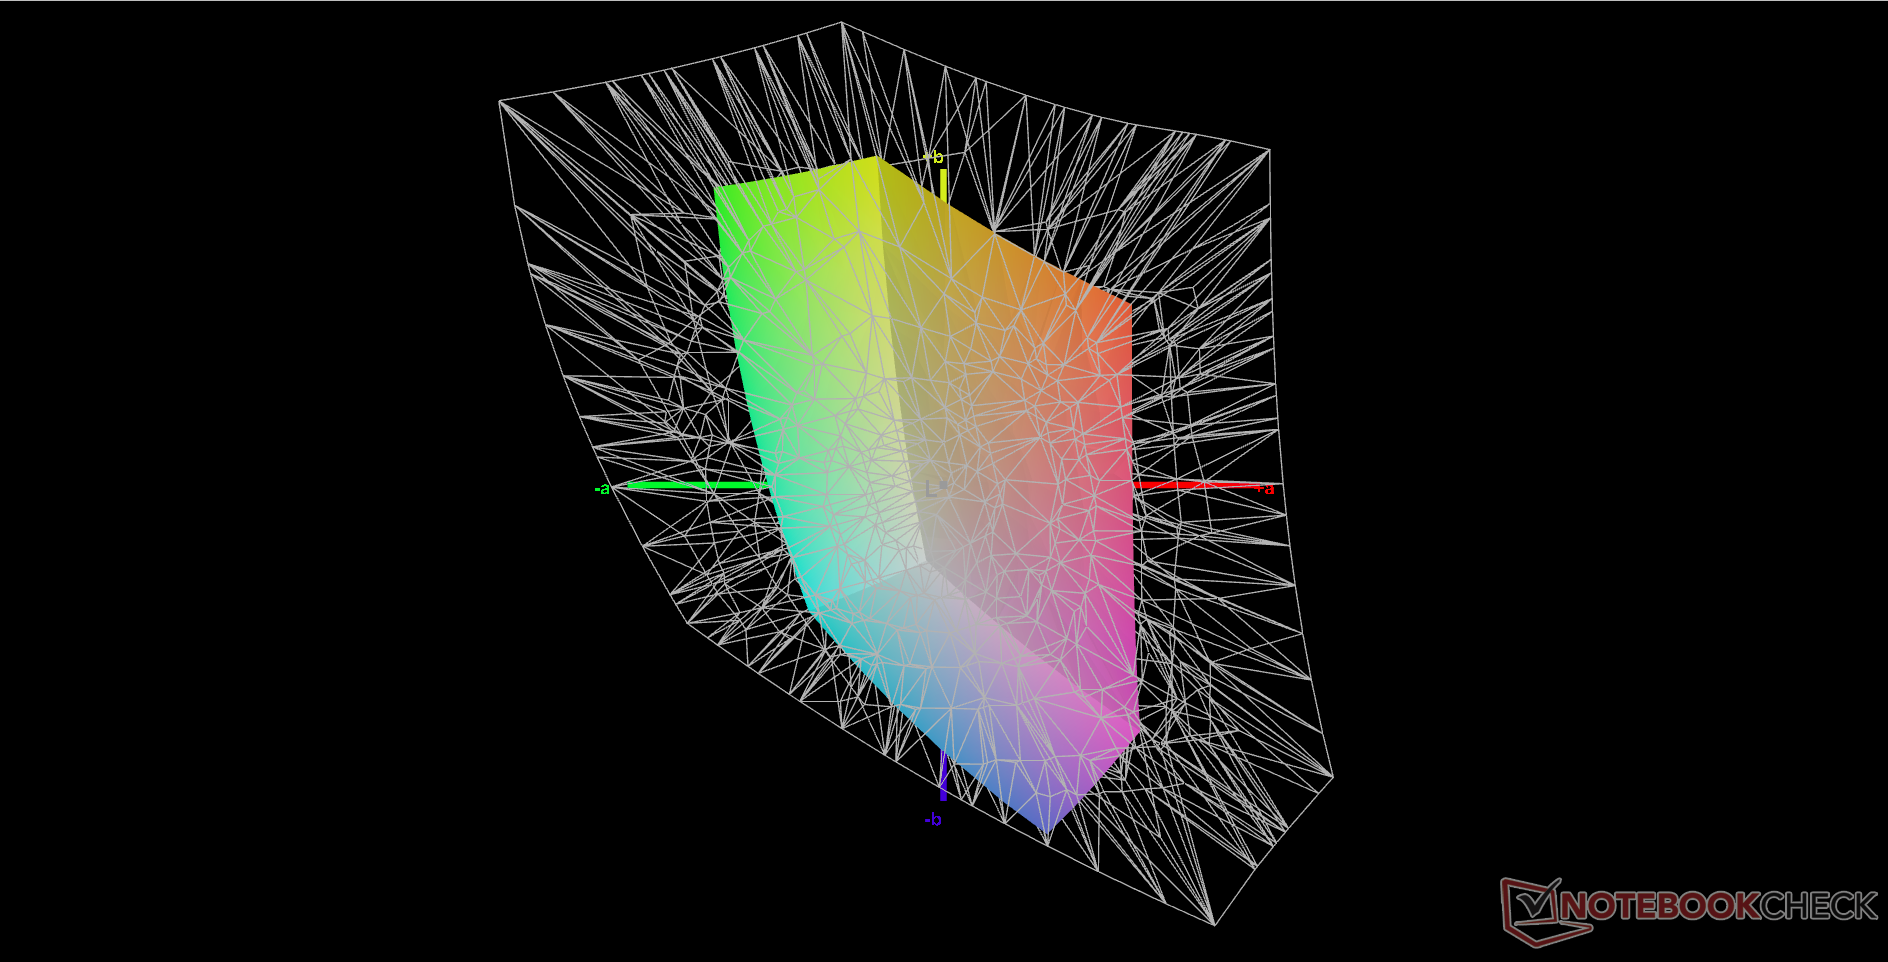
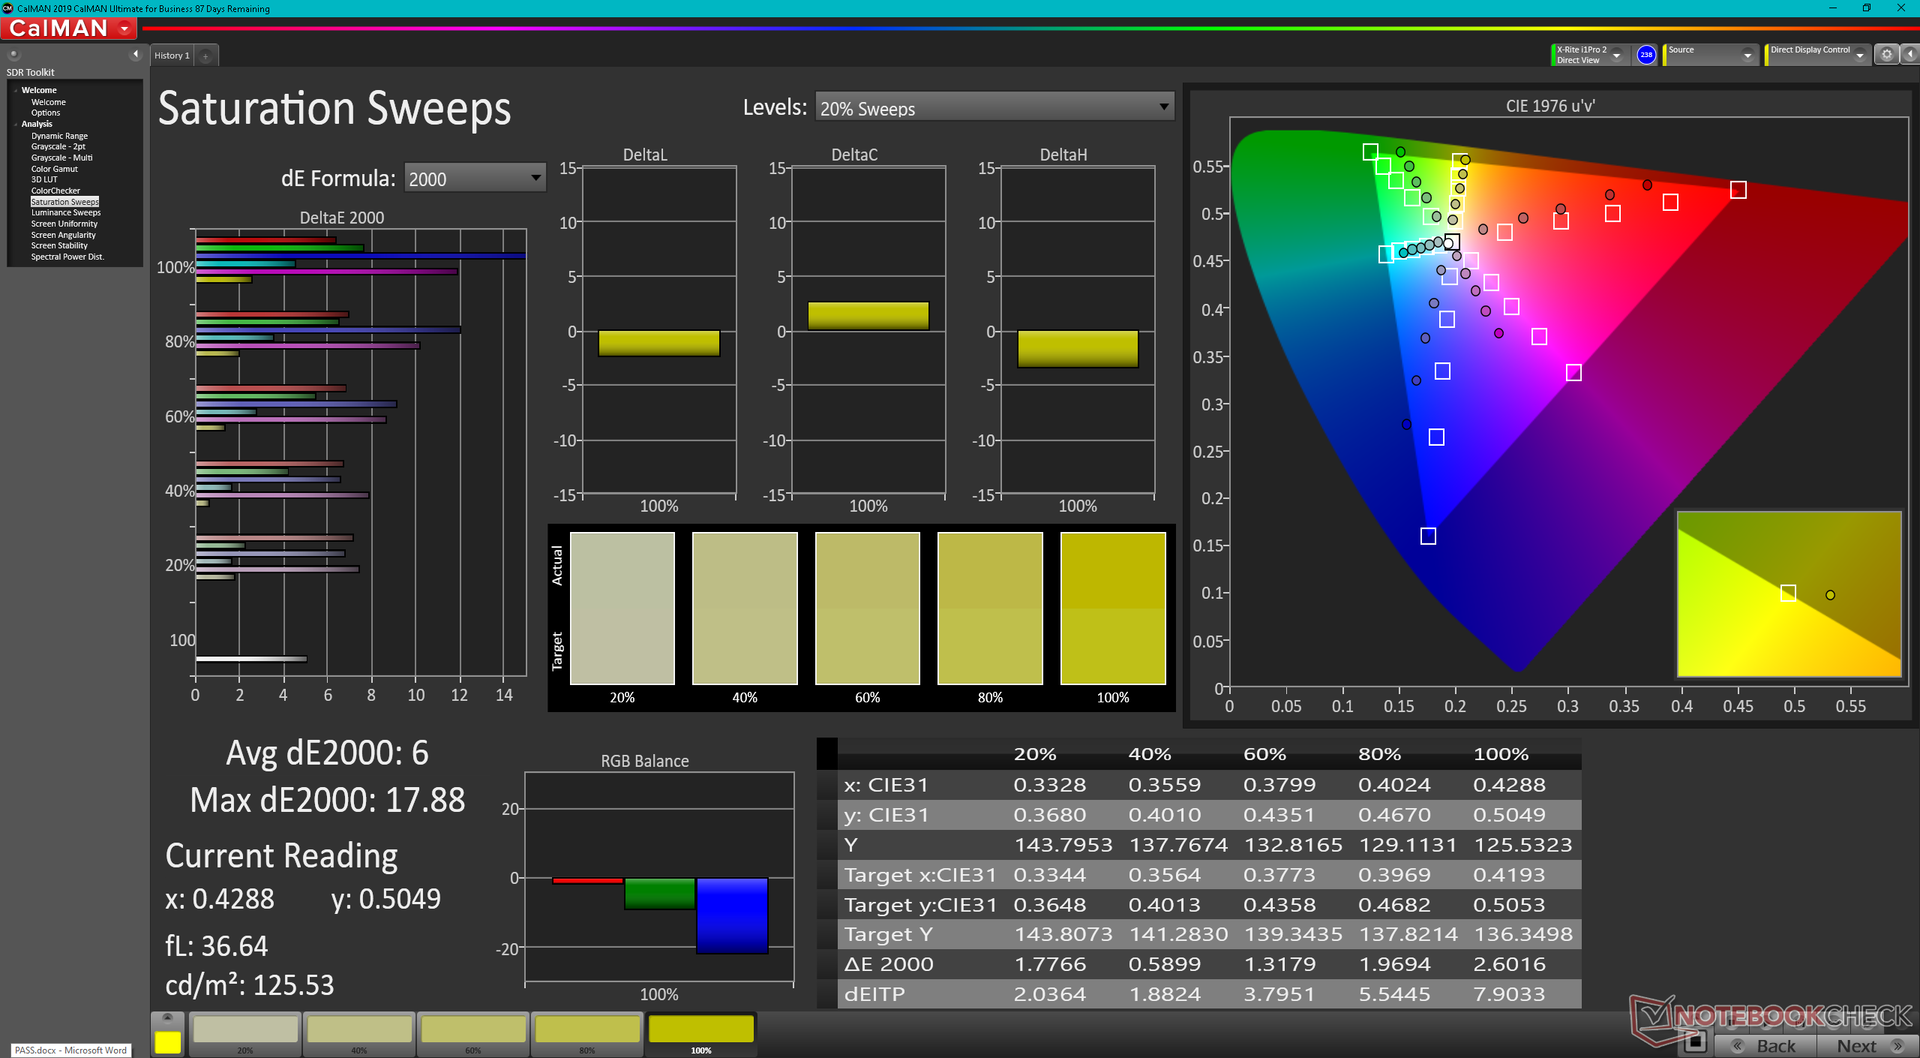
Den sämsta aspekten med skärmen är dess begränsade färgprofil på bara 58 procent av sRGB för att vara ett tecken på en budgetpanel olämplig för de flesta redaktörer. Lenovo vill att användarna istället uppgraderar till sin serie bärbara datorer Legion för bättre färger och en ljusare bakgrundsbelysning eftersom det inte finns några andra skärmalternativ att välja mellan på just den här IdeaPad-modellen.
Observera att även om panelen här delar samma LEN156FHD ID som på ThinkBook 15 G4 eller IdeaPad 5 15ALC05är de ändå mycket olika i vissa avseenden. Till exempel har skärmarna på den tidigare nämnda ThinkBook eller IdeaPad 5 inte stöd för 120 Hz eller FreeSync.


| |||||||||||||||||||||||||
Distribution av ljusstyrkan: 86 %
Mitt på batteriet: 287.8 cd/m²
Kontrast: 959:1 (Svärta: 0.3 cd/m²)
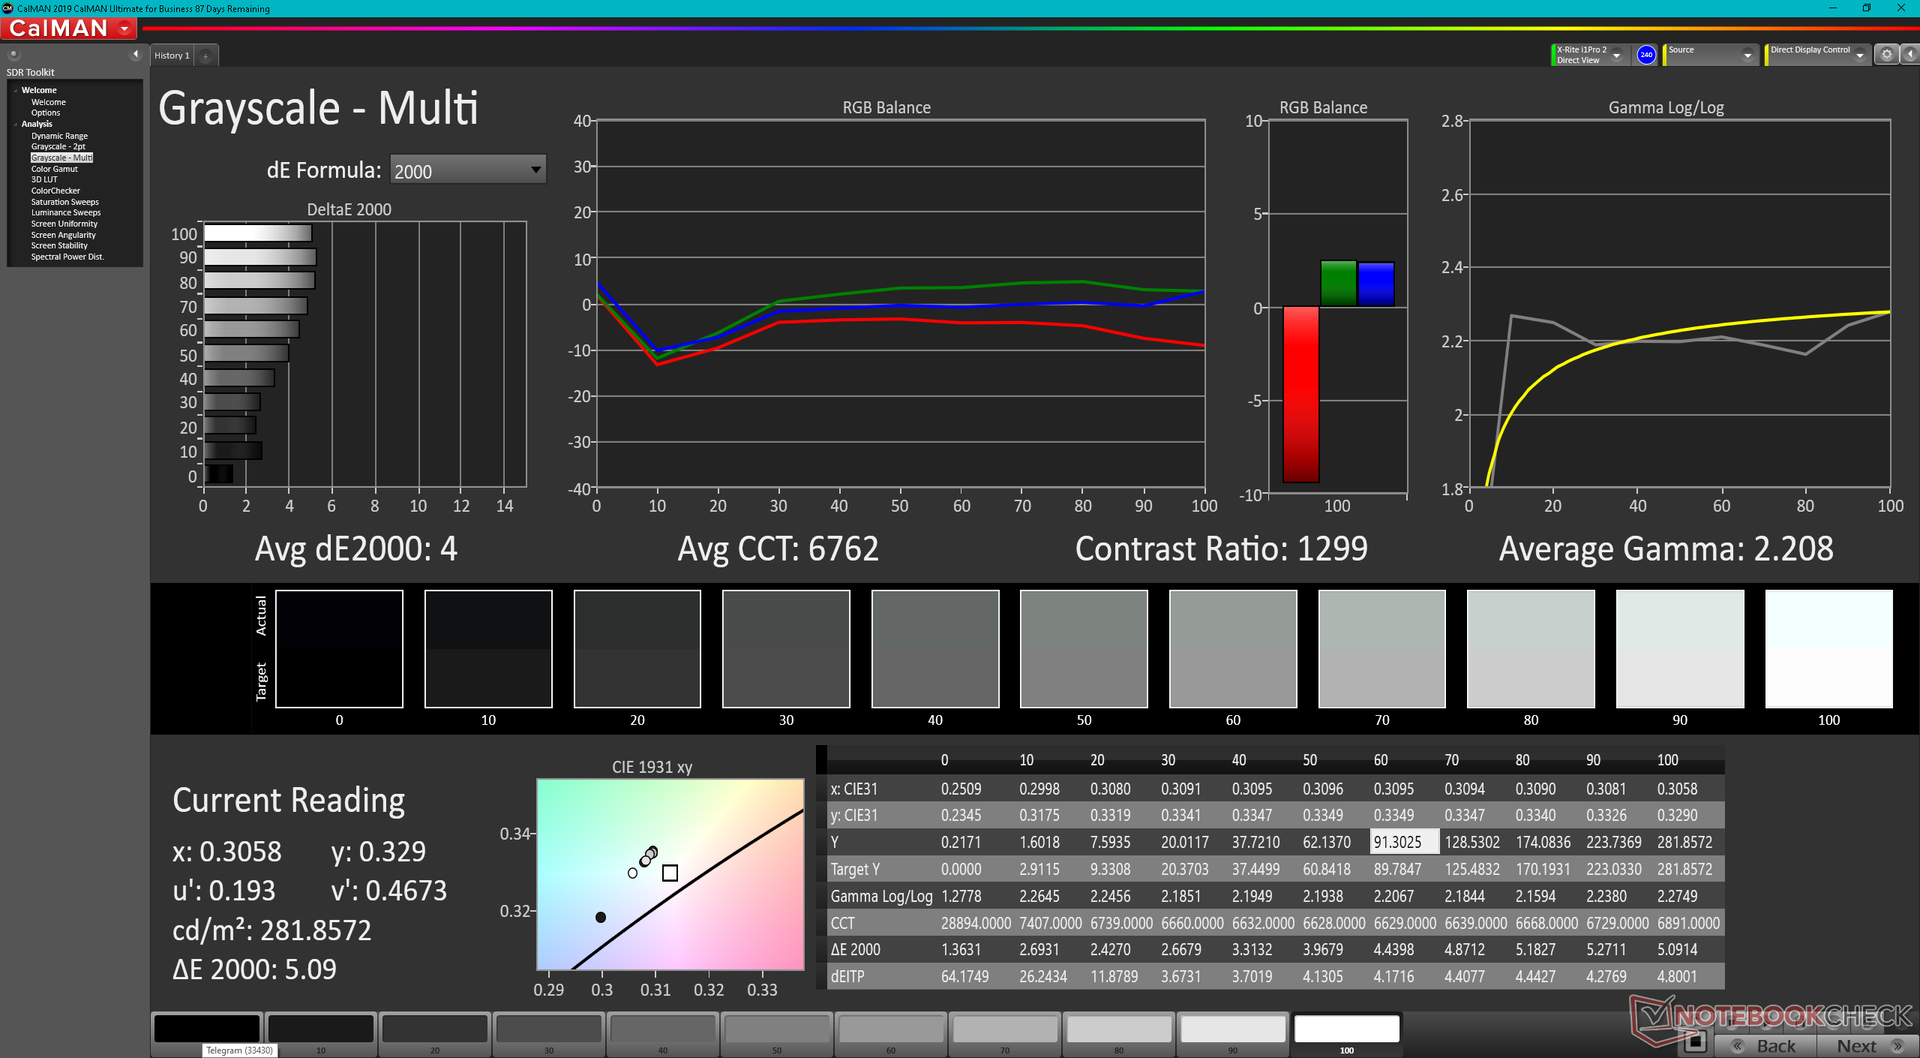
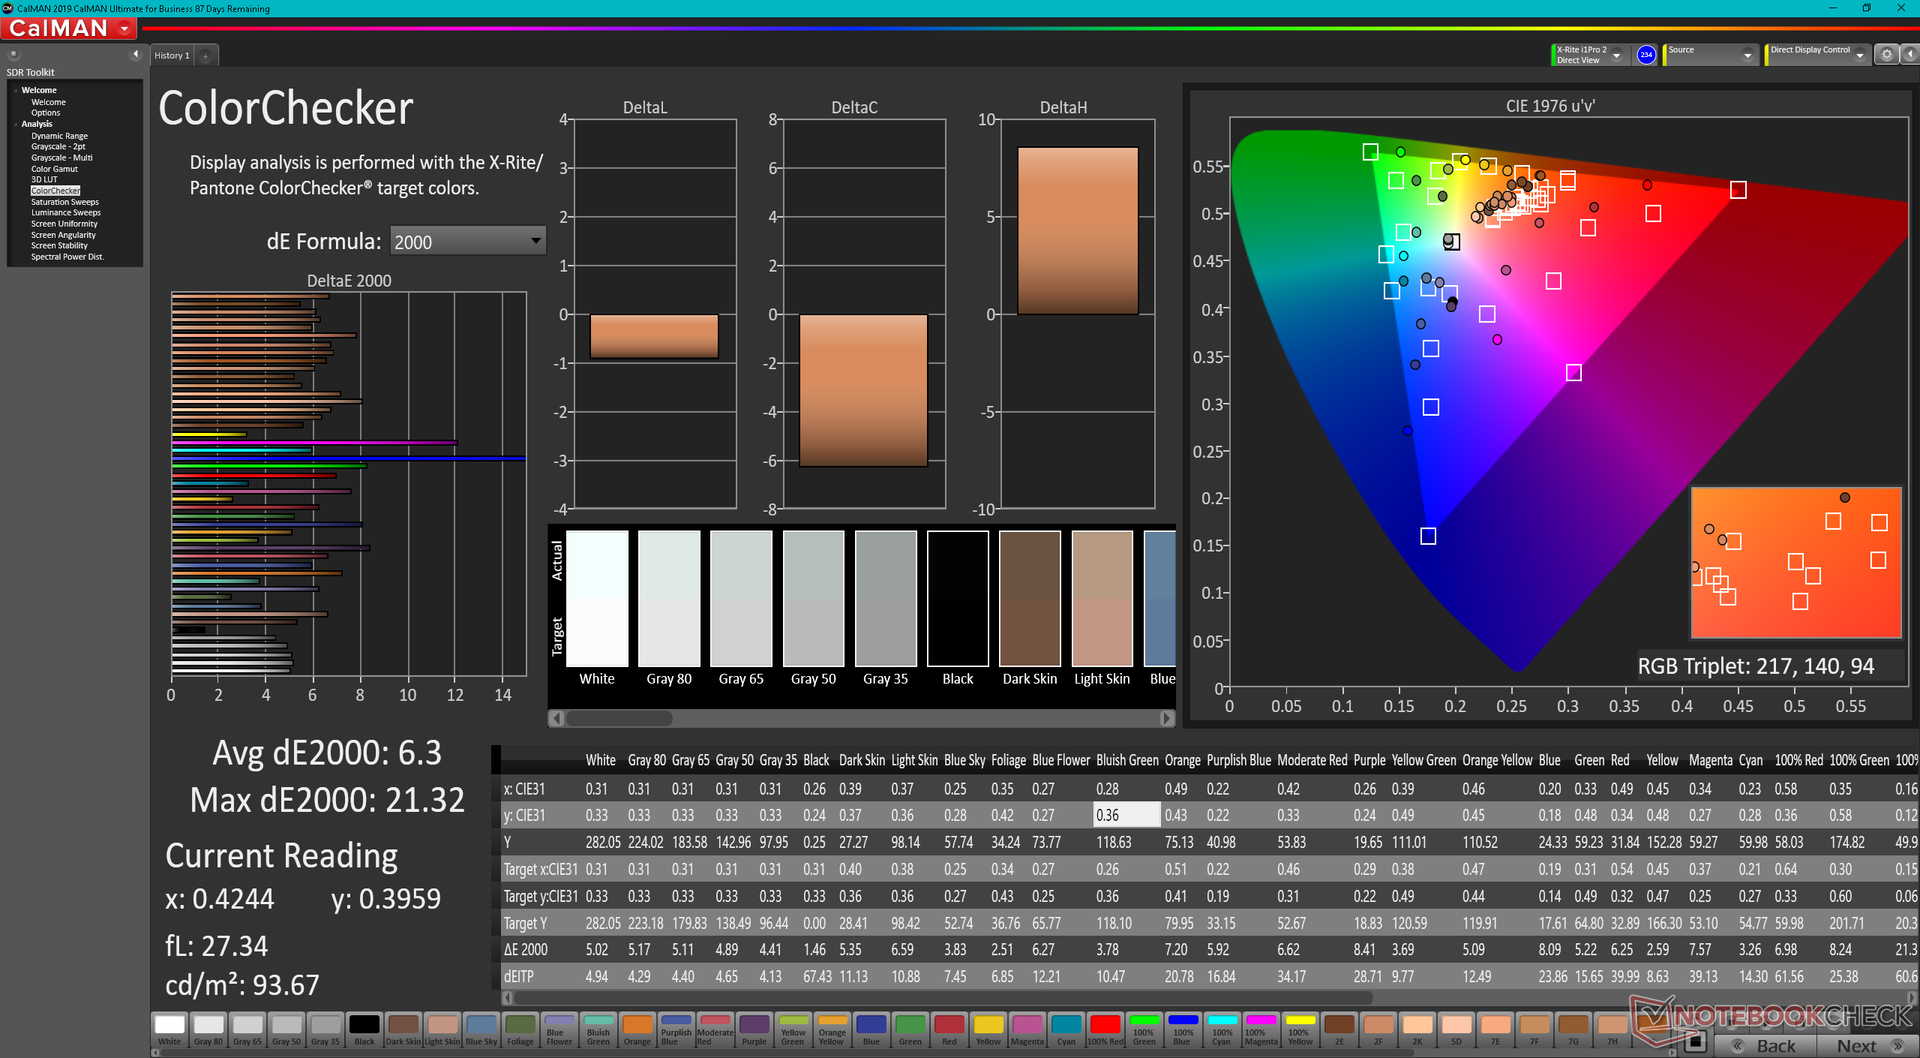
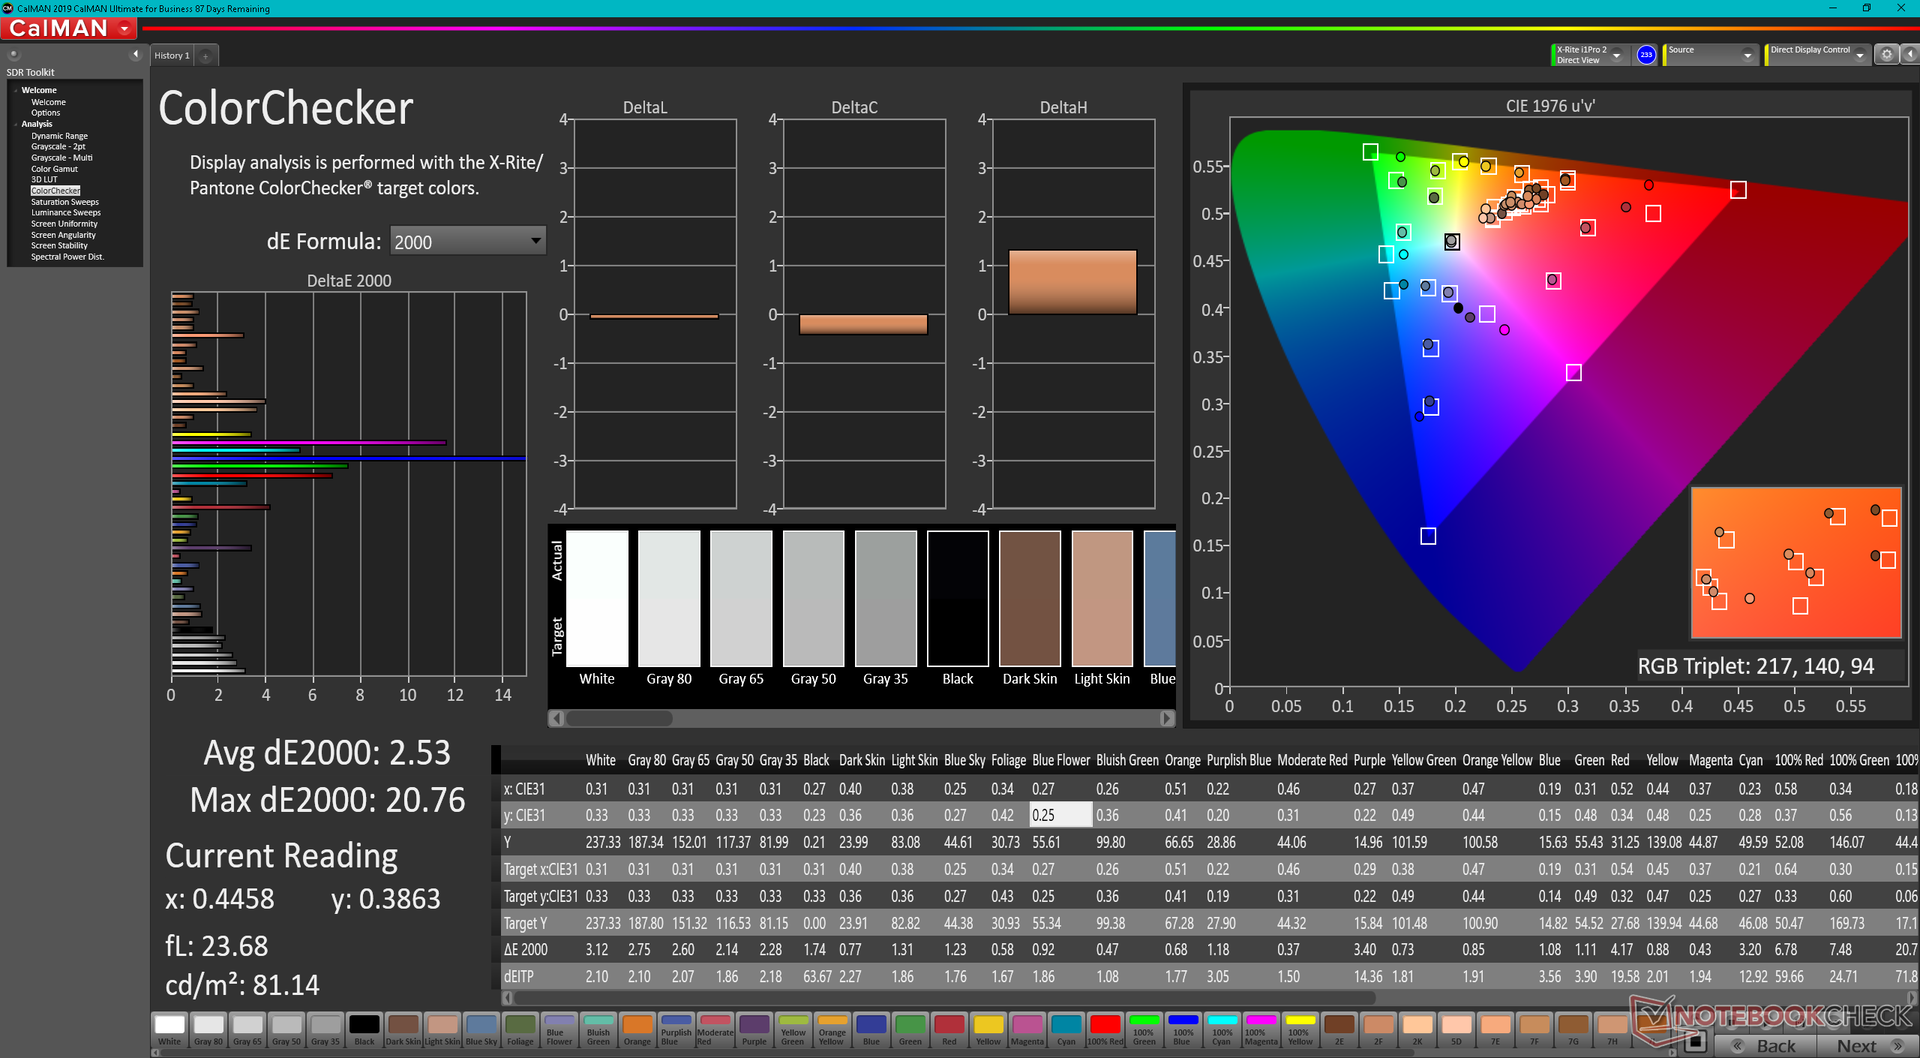
ΔE ColorChecker Calman: 6.3 | ∀{0.5-29.43 Ø4.72}
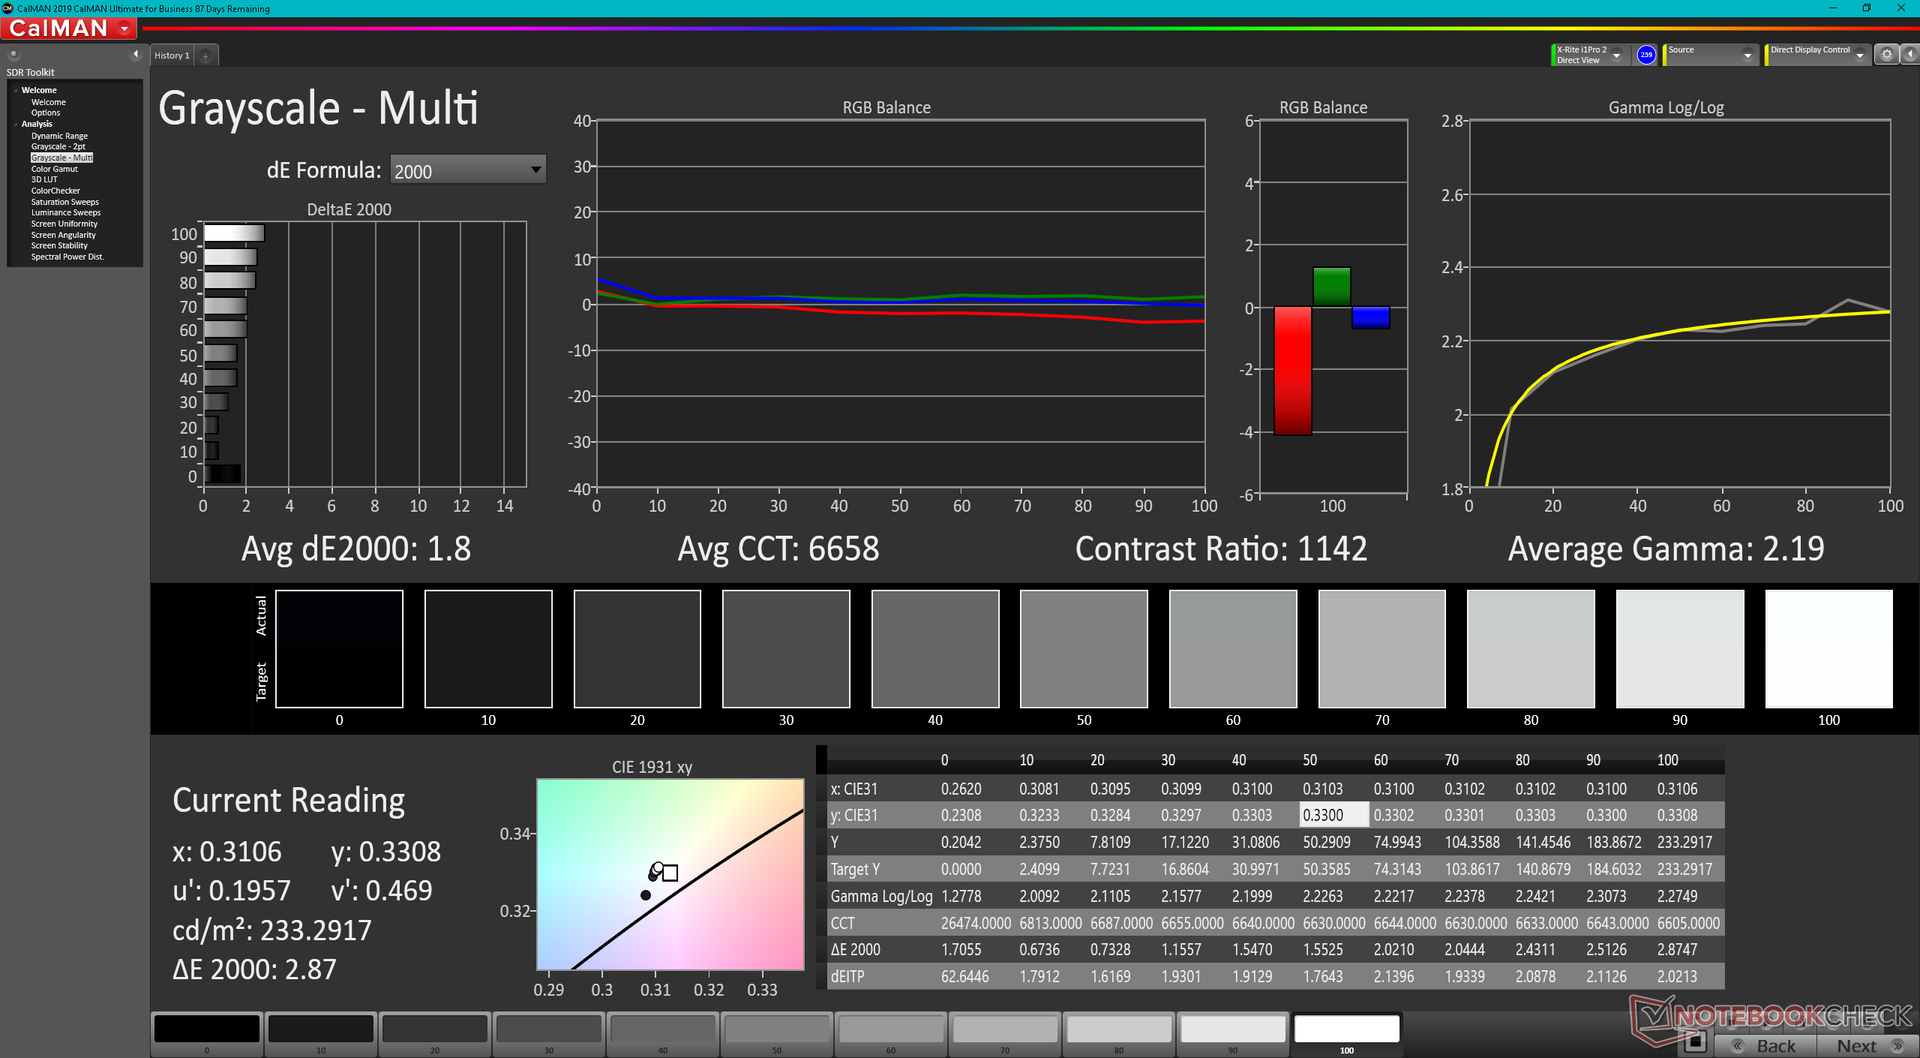
calibrated: 2.53
ΔE Greyscale Calman: 4 | ∀{0.09-98 Ø4.97}
40.7% AdobeRGB 1998 (Argyll 3D)
58% sRGB (Argyll 3D)
39.4% Display P3 (Argyll 3D)
Gamma: 2.21
CCT: 6762 K
| Lenovo IdeaPad Gaming 3 15ARH7 LEN156FHD, IPS, 1920x1080, 15.6" | Lenovo IdeaPad Gaming 3i 15IMH05 BOE CQ NV156FHM-NX1, IPS, 1920x1080, 15.6" | Lenovo Legion 5 15ACH6A-82NW0010GE LGD06A5, IPS, 1920x1080, 15.6" | Gigabyte A5 K1 BOEhydis NV156FHM-N4K (BOE08B3), IPS, 1920x1080, 15.6" | Asus TUF Dash F15 FX517ZR BOE CQ NE156QHM-NY1, IPS, 2560x1440, 15.6" | Dell G15 5510 YMHWH_156HRA (CMN1522), IPS, 1920x1080, 15.6" | |
|---|---|---|---|---|---|---|
| Display | -3% | 76% | 61% | 111% | 6% | |
| Display P3 Coverage (%) | 39.4 | 38.04 -3% | 71.1 80% | 64.4 63% | 98.4 150% | 41.6 6% |
| sRGB Coverage (%) | 58 | 56.6 -2% | 99.1 71% | 92.5 59% | 99.9 72% | 62.2 7% |
| AdobeRGB 1998 Coverage (%) | 40.7 | 39.3 -3% | 72.3 78% | 66.1 62% | 85.9 111% | 43 6% |
| Response Times | -6% | 48% | 39% | 61% | -37% | |
| Response Time Grey 50% / Grey 80% * (ms) | 20.8 ? | 25 ? -20% | 15 ? 28% | 14.5 ? 30% | 5.6 ? 73% | 33.3 ? -60% |
| Response Time Black / White * (ms) | 18.4 ? | 17 ? 8% | 6 ? 67% | 9.5 ? 48% | 9.4 ? 49% | 20.7 ? -13% |
| PWM Frequency (Hz) | ||||||
| Screen | -16% | 24% | 19% | 31% | 12% | |
| Brightness middle (cd/m²) | 287.8 | 305 6% | 371 29% | 295 3% | 286 -1% | 288 0% |
| Brightness (cd/m²) | 268 | 294 10% | 328 22% | 281 5% | 266 -1% | 264 -1% |
| Brightness Distribution (%) | 86 | 70 -19% | 85 -1% | 83 -3% | 87 1% | 88 2% |
| Black Level * (cd/m²) | 0.3 | 0.405 -35% | 0.32 -7% | 0.29 3% | 0.25 17% | 0.24 20% |
| Contrast (:1) | 959 | 753 -21% | 1159 21% | 1017 6% | 1144 19% | 1200 25% |
| Colorchecker dE 2000 * | 6.3 | 6.01 5% | 3.25 48% | 4.36 31% | 2.14 66% | 3.67 42% |
| Colorchecker dE 2000 max. * | 21.32 | 21.9 -3% | 6.33 70% | 6.92 68% | 5.22 76% | 18.12 15% |
| Colorchecker dE 2000 calibrated * | 2.53 | 5.12 -102% | 1.11 56% | 1.2 53% | 0.67 74% | 3.22 -27% |
| Greyscale dE 2000 * | 4 | 3.23 19% | 4.94 -24% | 3.9 2% | 2.8 30% | 2.6 35% |
| Gamma | 2.21 100% | 2.43 91% | 2.45 90% | 2.106 104% | 2.23 99% | 2.187 101% |
| CCT | 6762 96% | 6818 95% | 6064 107% | 7300 89% | 7092 92% | 6971 93% |
| Color Space (Percent of AdobeRGB 1998) (%) | 36 | |||||
| Color Space (Percent of sRGB) (%) | 56 | |||||
| Totalt genomsnitt (program/inställningar) | -8% /
-11% | 49% /
38% | 40% /
31% | 68% /
53% | -6% /
4% |
* ... mindre är bättre
Skärmen är inte kalibrerad på fabriken, vilket man kan förvänta sig för en bärbar dator för spel till budgetpris. Ändå är de genomsnittliga värdena för gråskala och färgdeltaE utanför förpackningen faktiskt inte så hemska med 4 respektive 6,3. Om vi kalibrerar skärmen själva skulle vi förbättra dessa värden till 1,8 respektive 2,53, men mättade färger förblir mycket felaktiga på grund av den smala gamut som nämndes ovan.

Visa svarstider
| ↔ Svarstid svart till vitt | ||
|---|---|---|
| 18.4 ms ... stiga ↗ och falla ↘ kombinerat | ↗ 10 ms stiga | 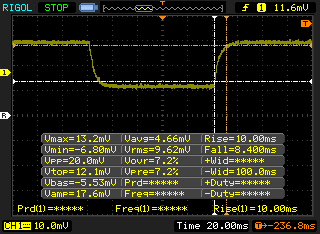 |
| ↘ 8.4 ms hösten | ||
| Skärmen visar bra svarsfrekvens i våra tester, men kan vara för långsam för konkurrenskraftiga spelare. I jämförelse sträcker sig alla testade enheter från 0.1 (minst) till 240 (maximalt) ms. » 41 % av alla enheter är bättre. Det betyder att den uppmätta svarstiden liknar genomsnittet av alla testade enheter (19.8 ms). | ||
| ↔ Svarstid 50 % grått till 80 % grått | ||
| 20.8 ms ... stiga ↗ och falla ↘ kombinerat | ↗ 11.2 ms stiga | 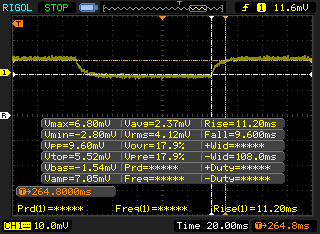 |
| ↘ 9.6 ms hösten | ||
| Skärmen visar bra svarsfrekvens i våra tester, men kan vara för långsam för konkurrenskraftiga spelare. I jämförelse sträcker sig alla testade enheter från 0.165 (minst) till 636 (maximalt) ms. » 33 % av alla enheter är bättre. Det betyder att den uppmätta svarstiden är bättre än genomsnittet av alla testade enheter (31 ms). | ||
Skärmflimmer / PWM (Puls-Width Modulation)
| Skärmflimmer / PWM upptäcktes inte | 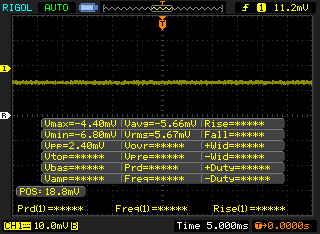 | ||
Som jämförelse: 52 % av alla testade enheter använder inte PWM för att dämpa skärmen. Om PWM upptäcktes mättes ett medelvärde av 7769 (minst: 5 - maximum: 343500) Hz. | |||
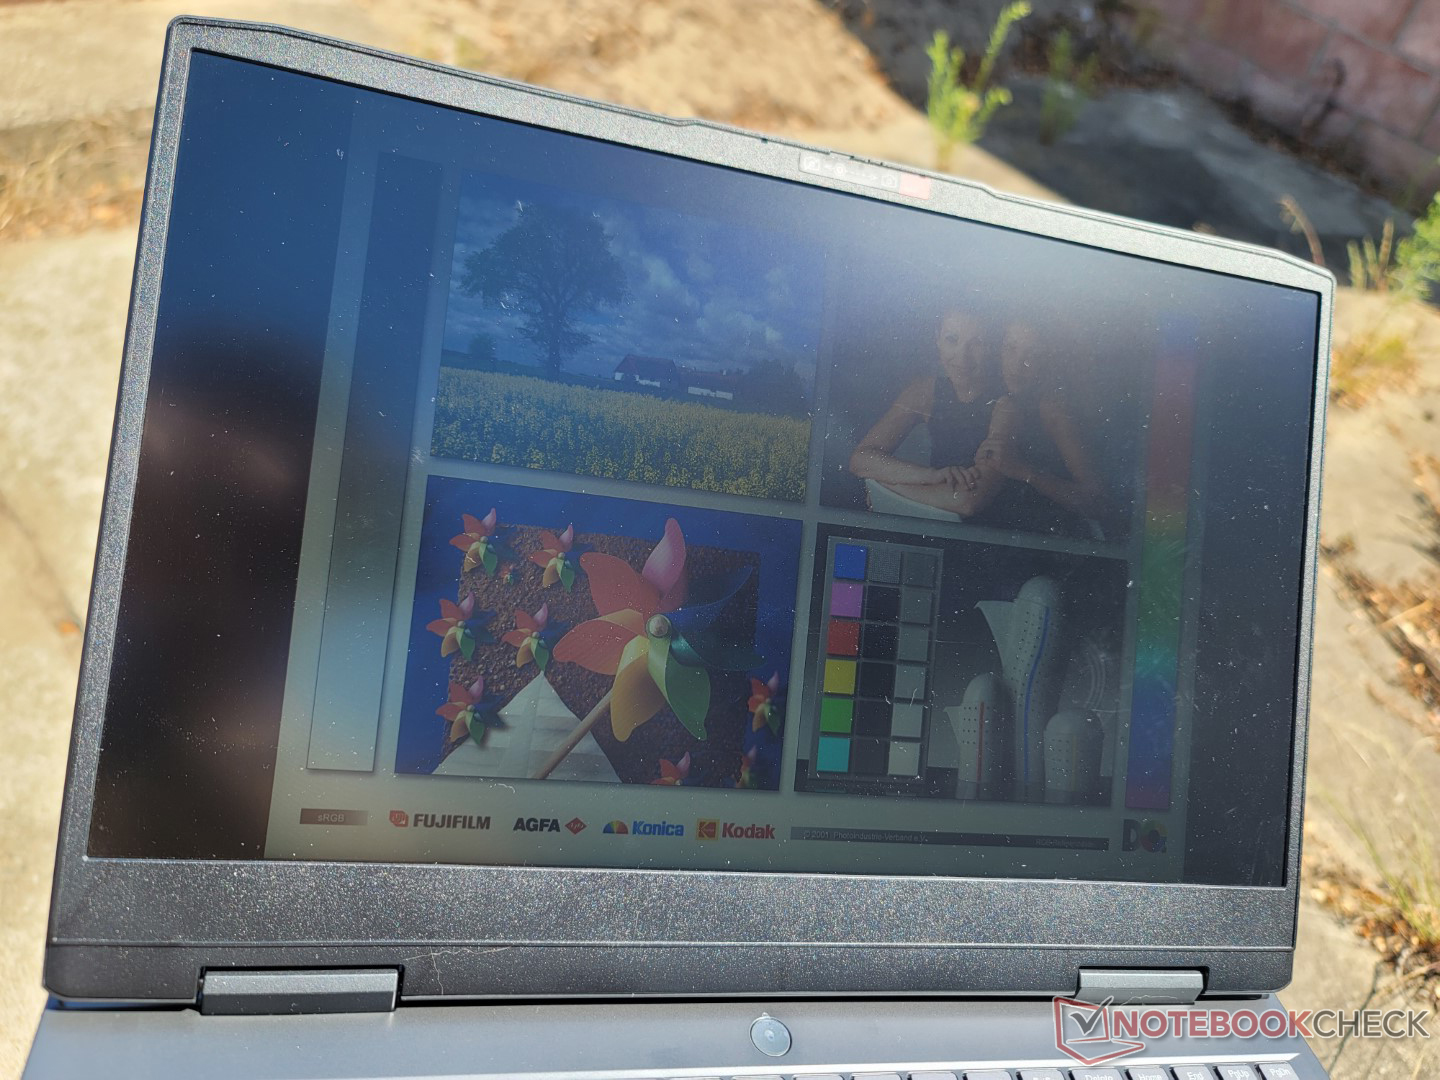
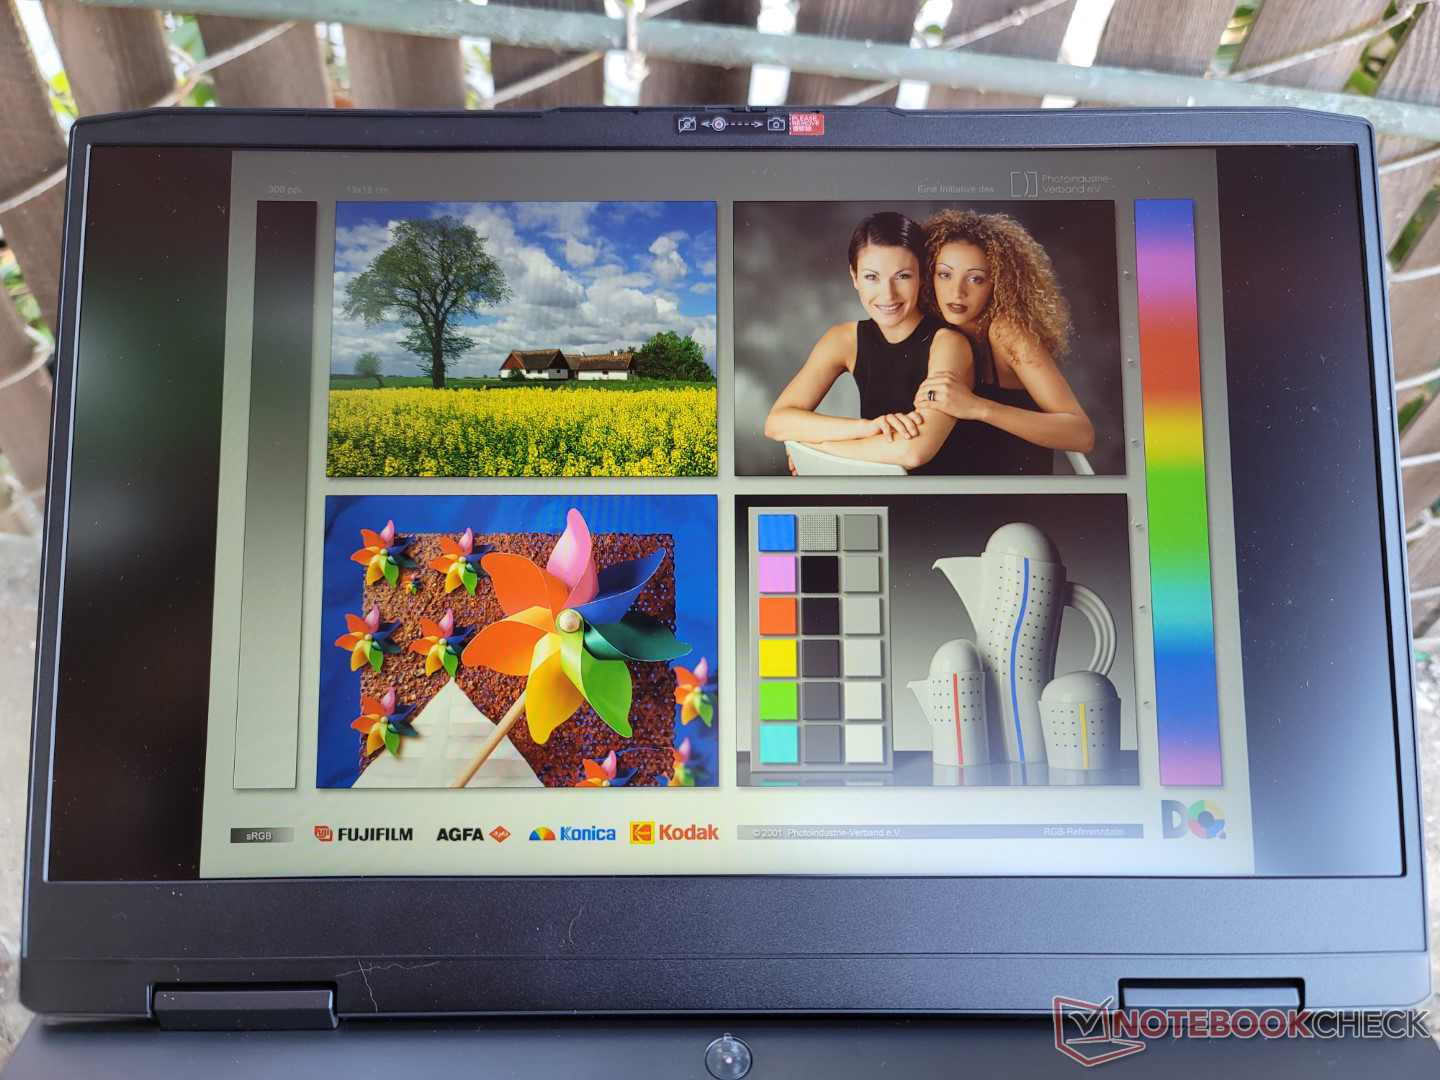
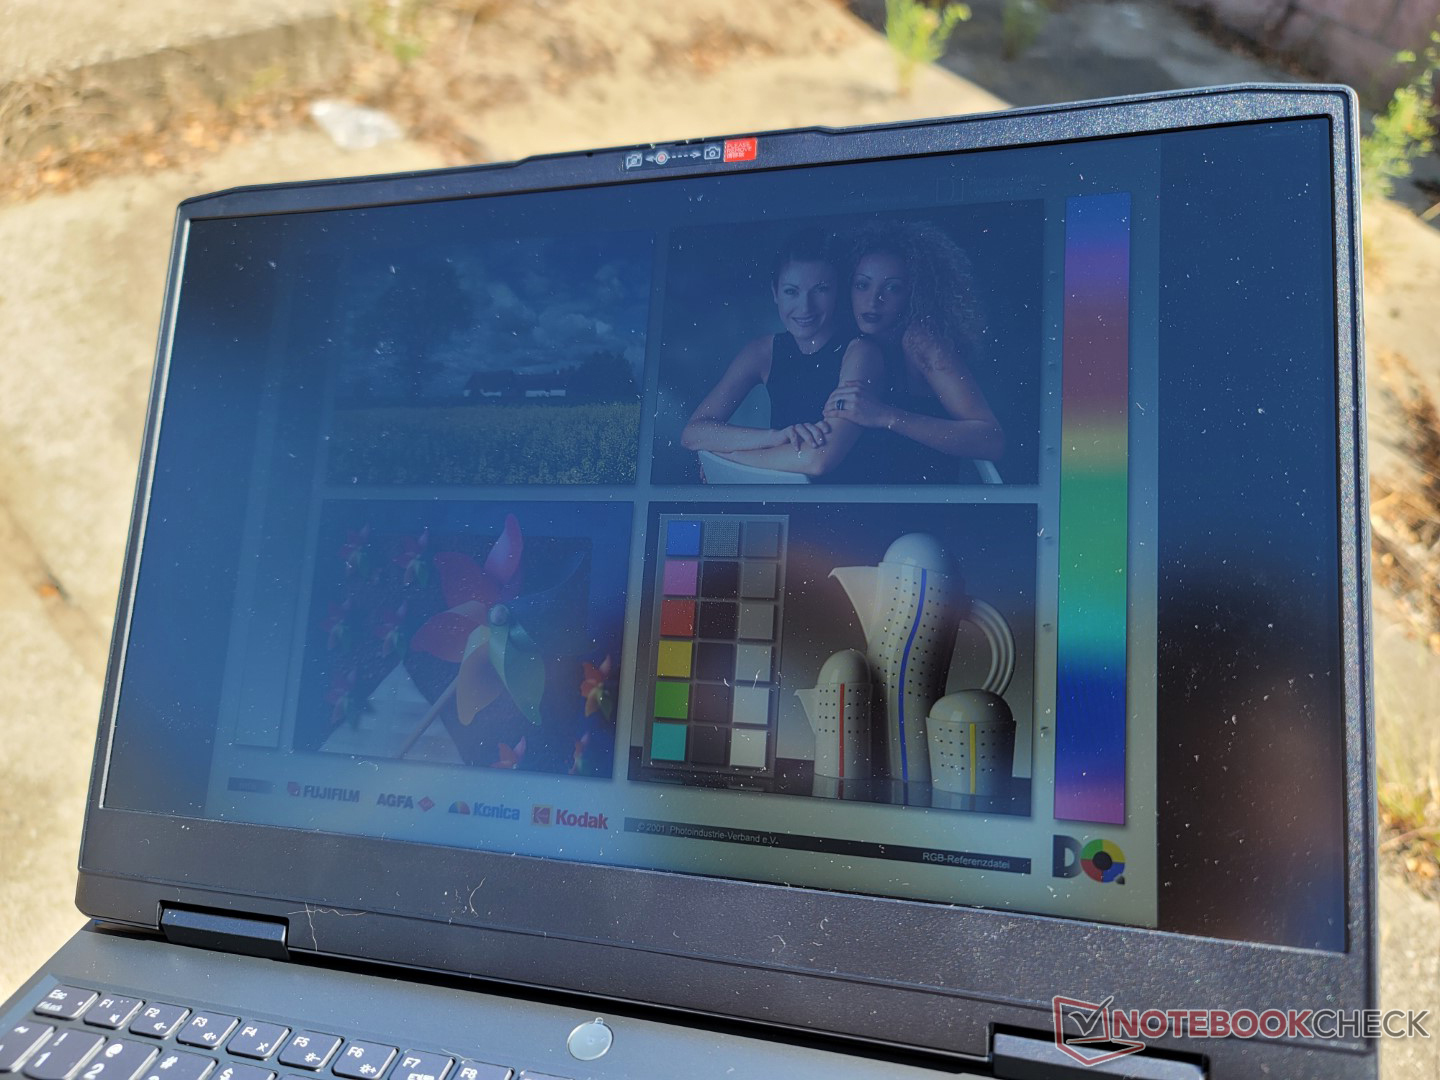
Synligheten utomhus är varken bättre eller sämre än för de flesta andra bärbara datorer för spel till budgetpris eller till och med för avancerade datorer för spel, eftersom dessa typer av system inte är utformade för att användas utomhus ofta. Du vill arbeta i skugga när det är möjligt, annars blir skärmen urtvättad.
Prestanda
Provningsförhållanden
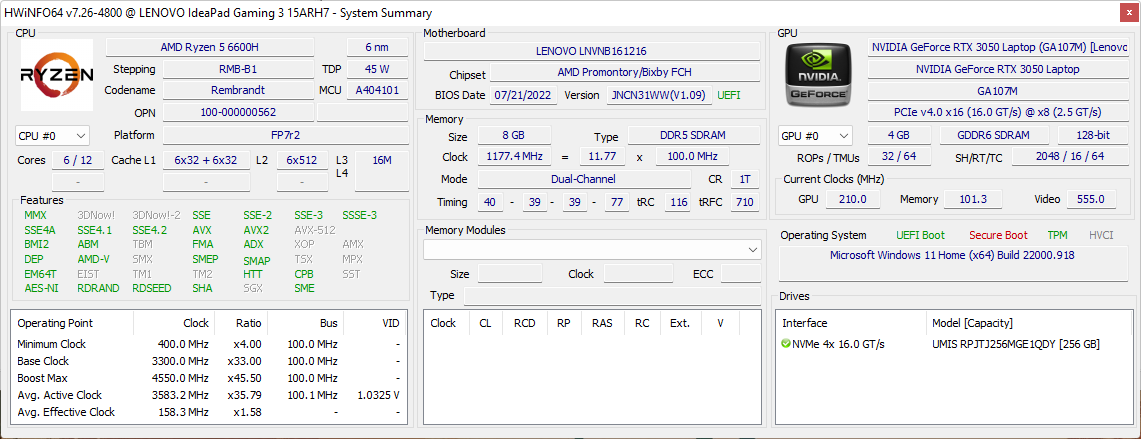
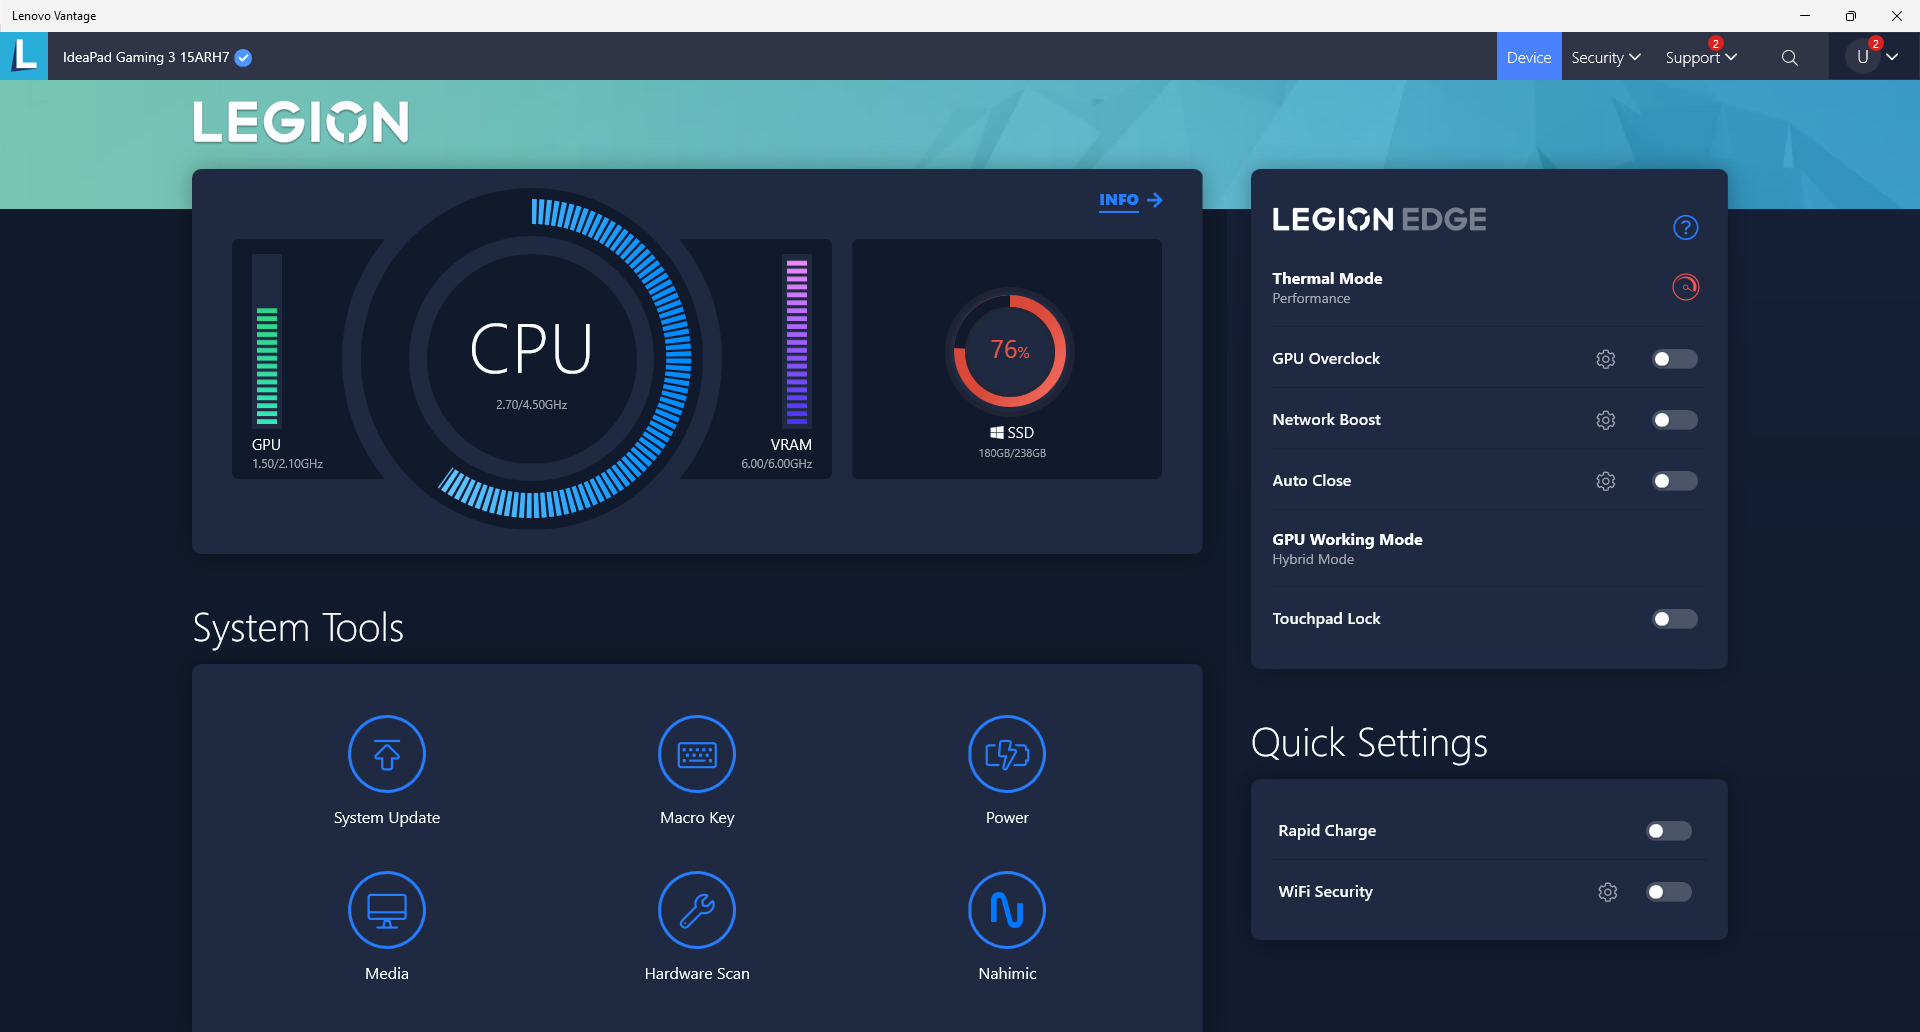
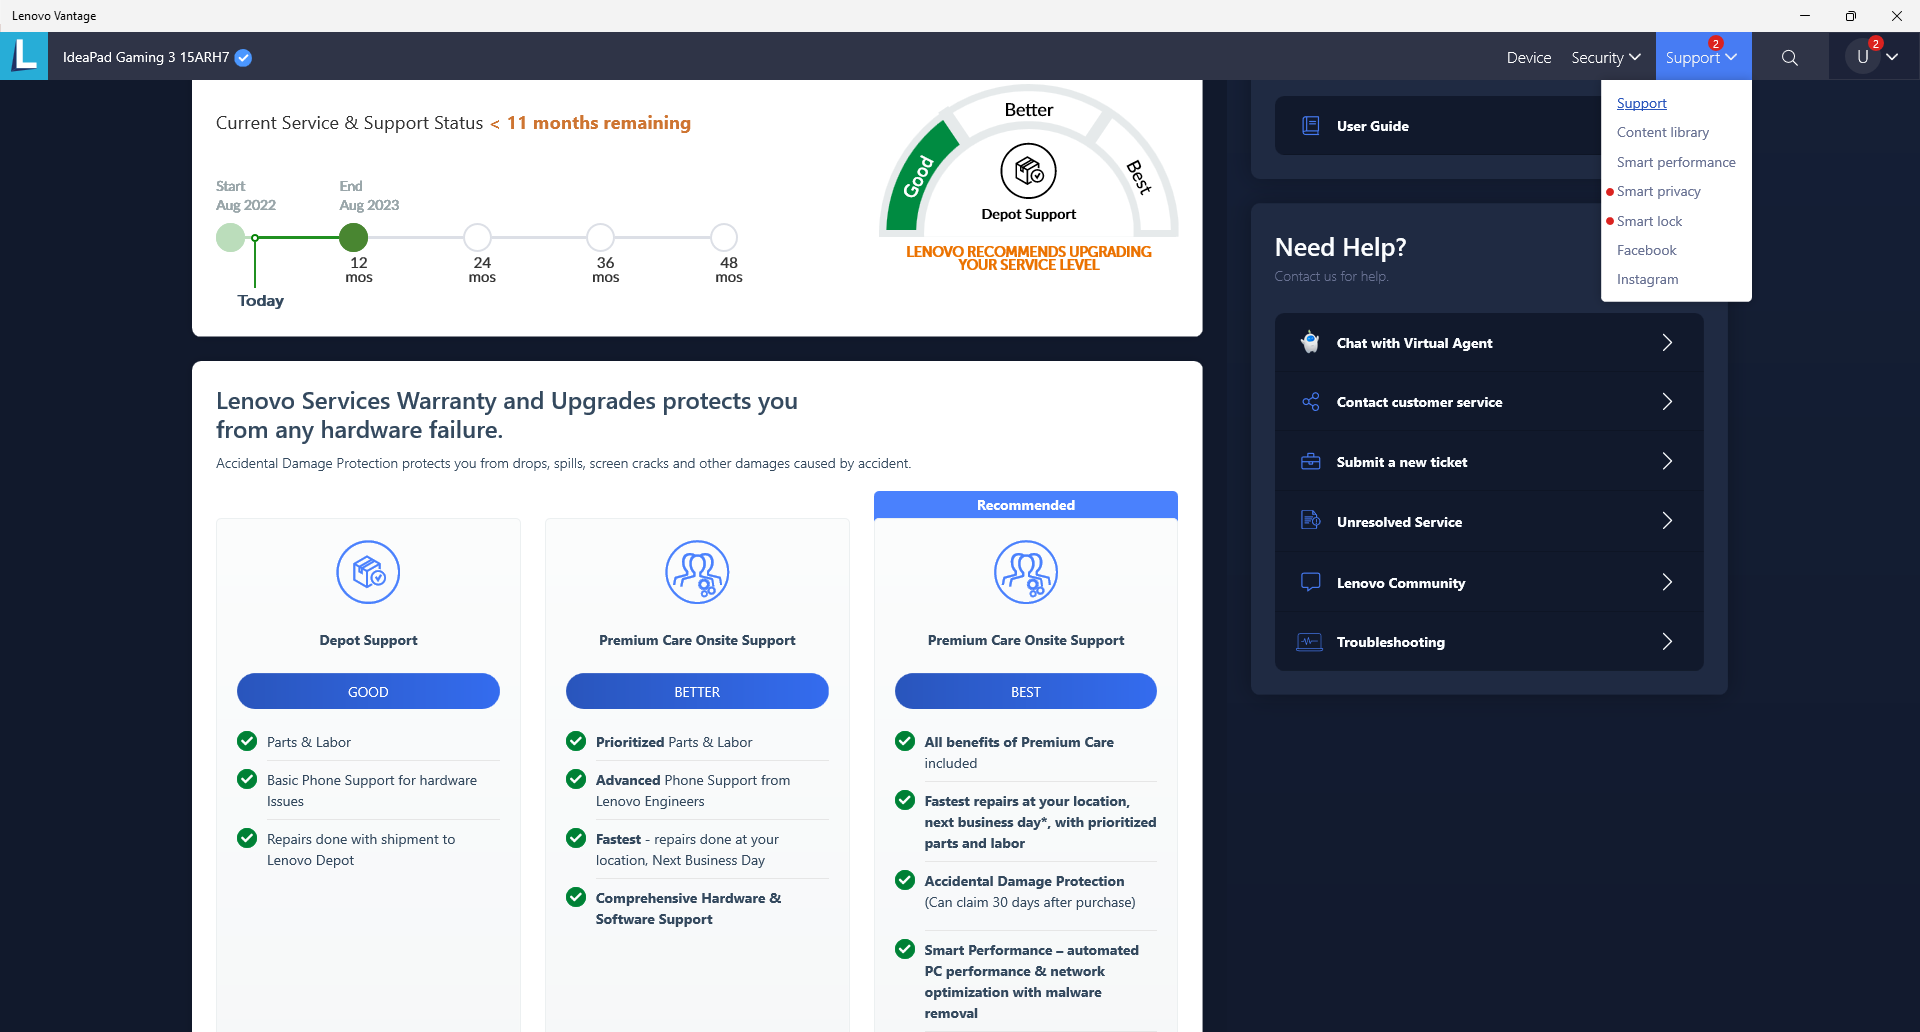
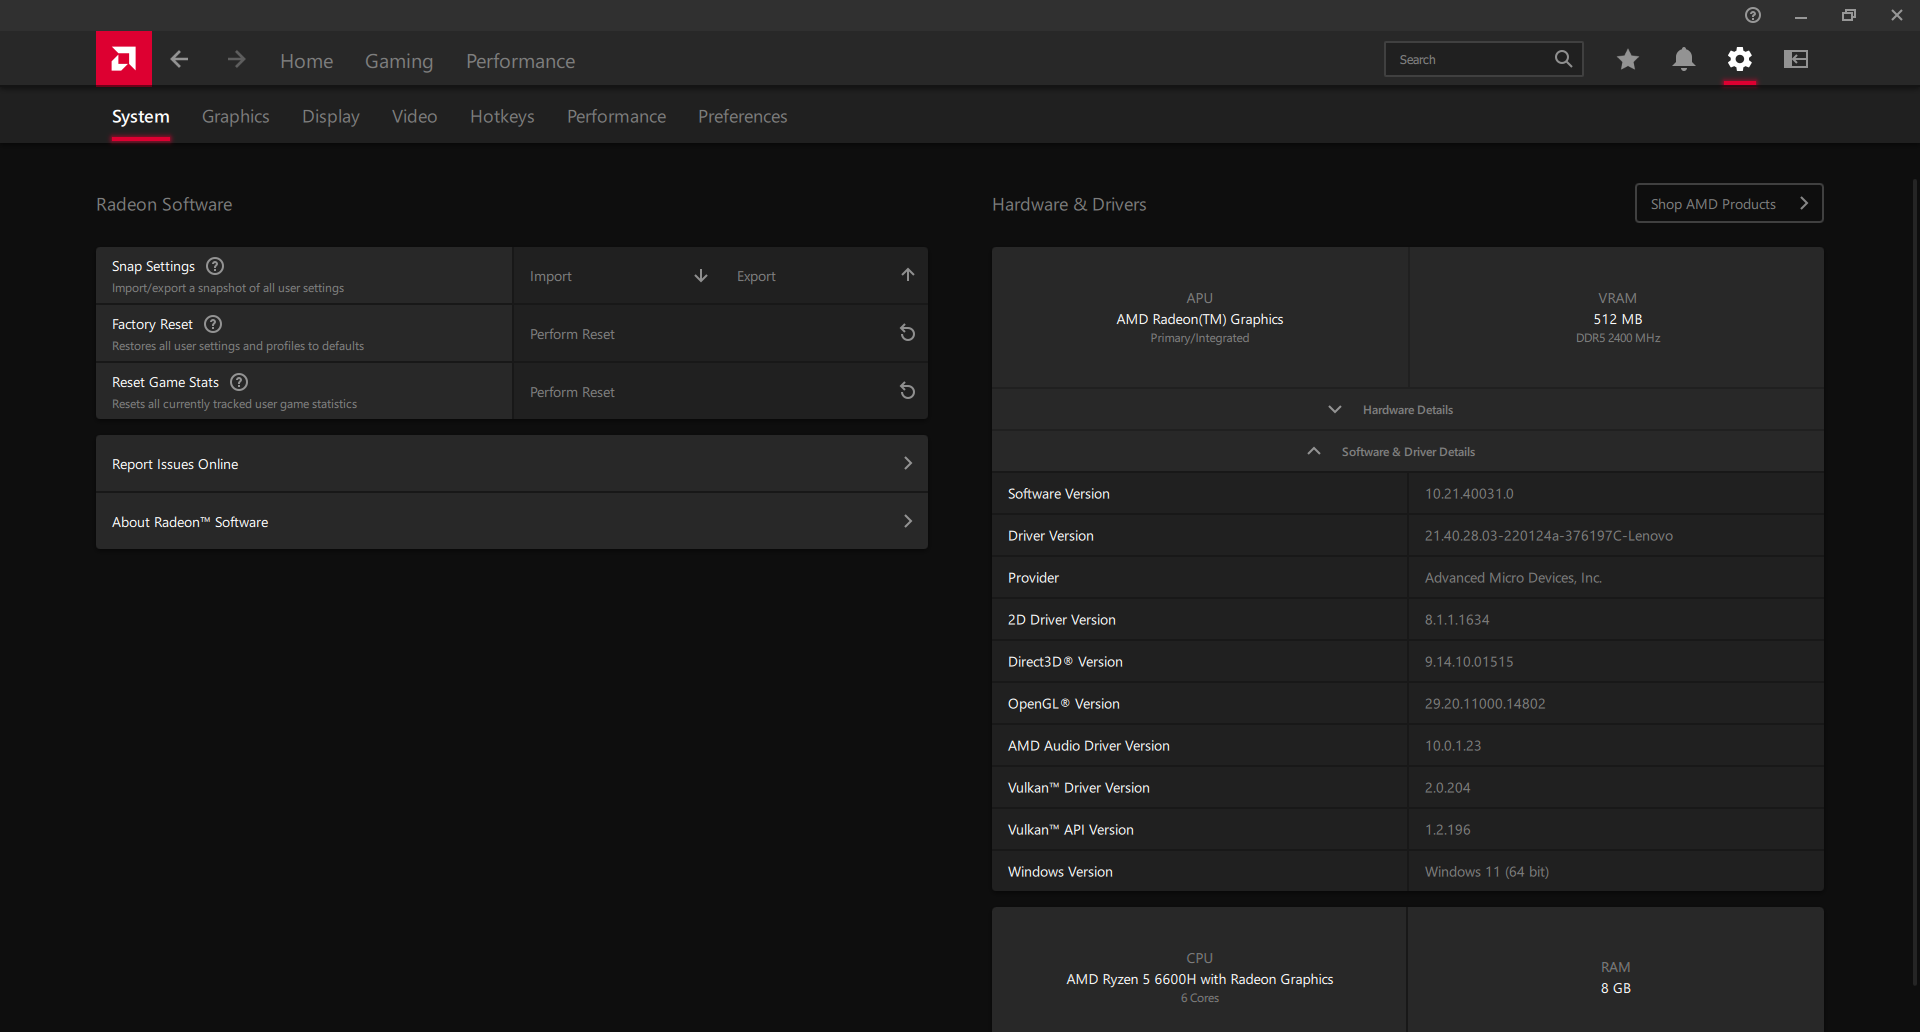
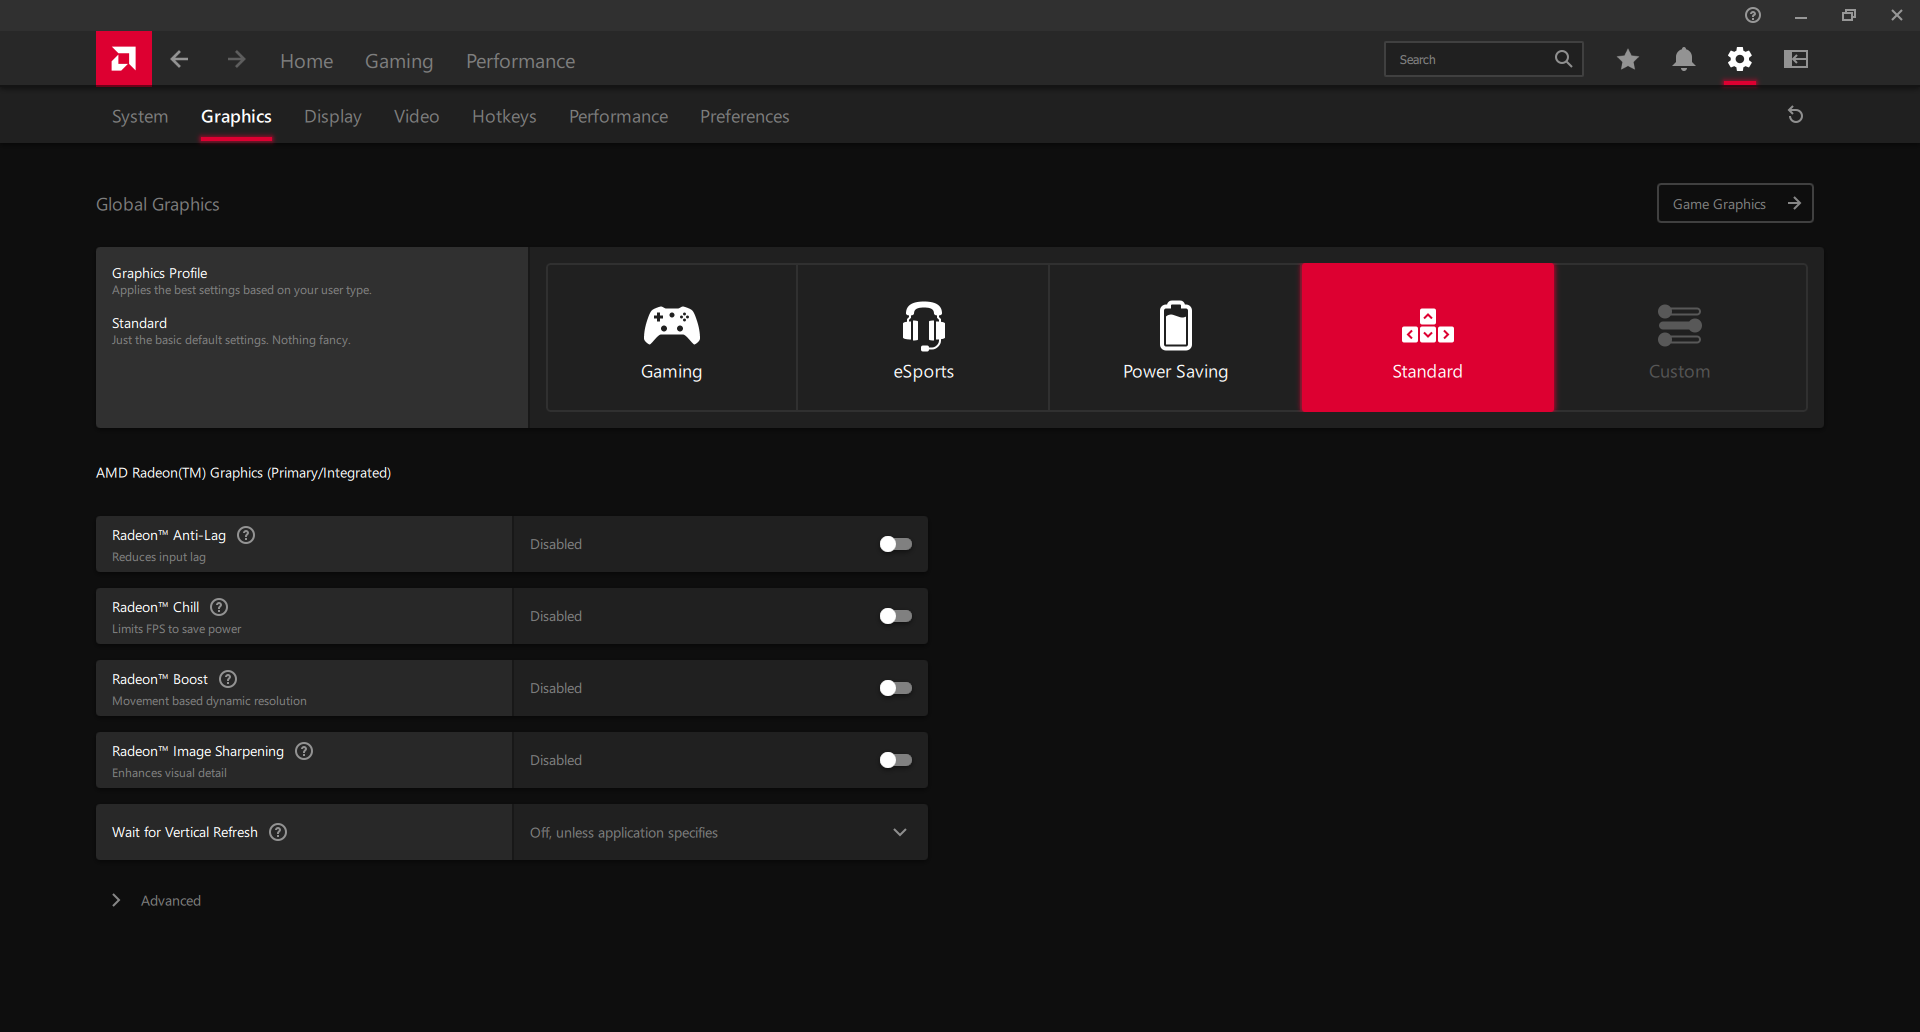
Vår enhet var inställd på prestandaläge i både Windows och den förinstallerade Lenovo Vantage-programvaran innan vi körde benchmarks nedan. Vi såg också till att Nvidias grafikprocessor var aktiv via Nvidias kontrollpanel och att de globala grafikinställningarna i Radeon-programvaran var inställda på Standard. Det rekommenderas att användarna bekantar sig med både Vantage och Radeon-programvaran eftersom de fungerar som kontrollhubbar för Lenovo-uppdateringar respektive de flesta bildskärmsinställningar.
Det finns ingen MUX-switch, vilket är att vänta på en budgetspelmaskin.

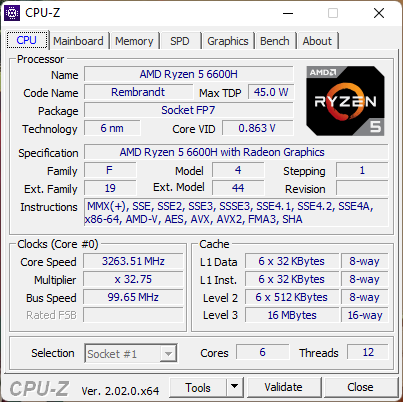
Processor - Presterar som Ryzen 5 5600H
Zen 3 Ryzen 5 5600H var redan en märkbar förbättring jämfört med Zen 2 Ryzen 5 4600H. Att gå från Zen 3 Ryzen 5 5600H till Zen3+ Ryzen 5 6600H förväntas därför i bästa fall ge små CPU-fördelar. Fördelarna är faktiskt så små att resultaten från benchmarks är nästan lika mellan dem. Gigabyte A5 K1 med 5600H, till exempel, ligger inom bara några få procentenheter från 6600H i vår Lenovo. Den senaste generationen Ryzen 7 5800H eller Core i7-11800H är därför fortfarande snabbare processorer utan tvekan.
Se vår särskilda sida om Ryzen 5 6600H för en översikt över processorn.
Cinebench R15 Multi Loop
Cinebench R23: Multi Core | Single Core
Cinebench R15: CPU Multi 64Bit | CPU Single 64Bit
Blender: v2.79 BMW27 CPU
7-Zip 18.03: 7z b 4 | 7z b 4 -mmt1
Geekbench 5.5: Multi-Core | Single-Core
HWBOT x265 Benchmark v2.2: 4k Preset
LibreOffice : 20 Documents To PDF
R Benchmark 2.5: Overall mean
Cinebench R23: Multi Core | Single Core
Cinebench R15: CPU Multi 64Bit | CPU Single 64Bit
Blender: v2.79 BMW27 CPU
7-Zip 18.03: 7z b 4 | 7z b 4 -mmt1
Geekbench 5.5: Multi-Core | Single-Core
HWBOT x265 Benchmark v2.2: 4k Preset
LibreOffice : 20 Documents To PDF
R Benchmark 2.5: Overall mean
* ... mindre är bättre
AIDA64: FP32 Ray-Trace | FPU Julia | CPU SHA3 | CPU Queen | FPU SinJulia | FPU Mandel | CPU AES | CPU ZLib | FP64 Ray-Trace | CPU PhotoWorxx
| Performance rating | |
| Asus TUF Dash F15 FX517ZR | |
| Genomsnitt AMD Ryzen 5 6600H | |
| Lenovo IdeaPad Gaming 3 15ARH7 | |
| Lenovo Legion 5 15ACH6A-82NW0010GE | |
| Gigabyte A5 K1 | |
| Dell G15 5510 | |
| Lenovo IdeaPad Gaming 3i 15IMH05 | |
| AIDA64 / FP32 Ray-Trace | |
| Asus TUF Dash F15 FX517ZR | |
| Lenovo Legion 5 15ACH6A-82NW0010GE | |
| Gigabyte A5 K1 | |
| Lenovo IdeaPad Gaming 3 15ARH7 | |
| Genomsnitt AMD Ryzen 5 6600H (10645 - 12871, n=4) | |
| Dell G15 5510 | |
| Lenovo IdeaPad Gaming 3i 15IMH05 | |
| AIDA64 / FPU Julia | |
| Lenovo Legion 5 15ACH6A-82NW0010GE | |
| Gigabyte A5 K1 | |
| Lenovo IdeaPad Gaming 3 15ARH7 | |
| Genomsnitt AMD Ryzen 5 6600H (66739 - 78277, n=4) | |
| Asus TUF Dash F15 FX517ZR | |
| Dell G15 5510 | |
| Lenovo IdeaPad Gaming 3i 15IMH05 | |
| AIDA64 / CPU SHA3 | |
| Asus TUF Dash F15 FX517ZR | |
| Lenovo Legion 5 15ACH6A-82NW0010GE | |
| Lenovo IdeaPad Gaming 3 15ARH7 | |
| Genomsnitt AMD Ryzen 5 6600H (2231 - 2689, n=4) | |
| Gigabyte A5 K1 | |
| Dell G15 5510 | |
| Lenovo IdeaPad Gaming 3i 15IMH05 | |
| AIDA64 / CPU Queen | |
| Asus TUF Dash F15 FX517ZR | |
| Genomsnitt AMD Ryzen 5 6600H (77711 - 82119, n=4) | |
| Lenovo IdeaPad Gaming 3 15ARH7 | |
| Gigabyte A5 K1 | |
| Lenovo Legion 5 15ACH6A-82NW0010GE | |
| Dell G15 5510 | |
| Lenovo IdeaPad Gaming 3i 15IMH05 | |
| AIDA64 / FPU SinJulia | |
| Genomsnitt AMD Ryzen 5 6600H (9184 - 9739, n=4) | |
| Lenovo IdeaPad Gaming 3 15ARH7 | |
| Gigabyte A5 K1 | |
| Lenovo Legion 5 15ACH6A-82NW0010GE | |
| Asus TUF Dash F15 FX517ZR | |
| Dell G15 5510 | |
| Lenovo IdeaPad Gaming 3i 15IMH05 | |
| AIDA64 / FPU Mandel | |
| Lenovo Legion 5 15ACH6A-82NW0010GE | |
| Gigabyte A5 K1 | |
| Lenovo IdeaPad Gaming 3 15ARH7 | |
| Genomsnitt AMD Ryzen 5 6600H (36591 - 43222, n=4) | |
| Asus TUF Dash F15 FX517ZR | |
| Dell G15 5510 | |
| Lenovo IdeaPad Gaming 3i 15IMH05 | |
| AIDA64 / CPU AES | |
| Lenovo IdeaPad Gaming 3 15ARH7 | |
| Lenovo Legion 5 15ACH6A-82NW0010GE | |
| Genomsnitt AMD Ryzen 5 6600H (43461 - 104138, n=4) | |
| Asus TUF Dash F15 FX517ZR | |
| Gigabyte A5 K1 | |
| Dell G15 5510 | |
| Lenovo IdeaPad Gaming 3i 15IMH05 | |
| AIDA64 / CPU ZLib | |
| Asus TUF Dash F15 FX517ZR | |
| Lenovo IdeaPad Gaming 3 15ARH7 | |
| Lenovo Legion 5 15ACH6A-82NW0010GE | |
| Gigabyte A5 K1 | |
| Genomsnitt AMD Ryzen 5 6600H (523 - 660, n=4) | |
| Dell G15 5510 | |
| Lenovo IdeaPad Gaming 3i 15IMH05 | |
| AIDA64 / FP64 Ray-Trace | |
| Asus TUF Dash F15 FX517ZR | |
| Lenovo Legion 5 15ACH6A-82NW0010GE | |
| Gigabyte A5 K1 | |
| Lenovo IdeaPad Gaming 3 15ARH7 | |
| Genomsnitt AMD Ryzen 5 6600H (5659 - 6911, n=4) | |
| Dell G15 5510 | |
| Lenovo IdeaPad Gaming 3i 15IMH05 | |
| AIDA64 / CPU PhotoWorxx | |
| Asus TUF Dash F15 FX517ZR | |
| Genomsnitt AMD Ryzen 5 6600H (16218 - 29621, n=4) | |
| Gigabyte A5 K1 | |
| Lenovo IdeaPad Gaming 3i 15IMH05 | |
| Lenovo IdeaPad Gaming 3 15ARH7 | |
| Dell G15 5510 | |
| Lenovo Legion 5 15ACH6A-82NW0010GE | |
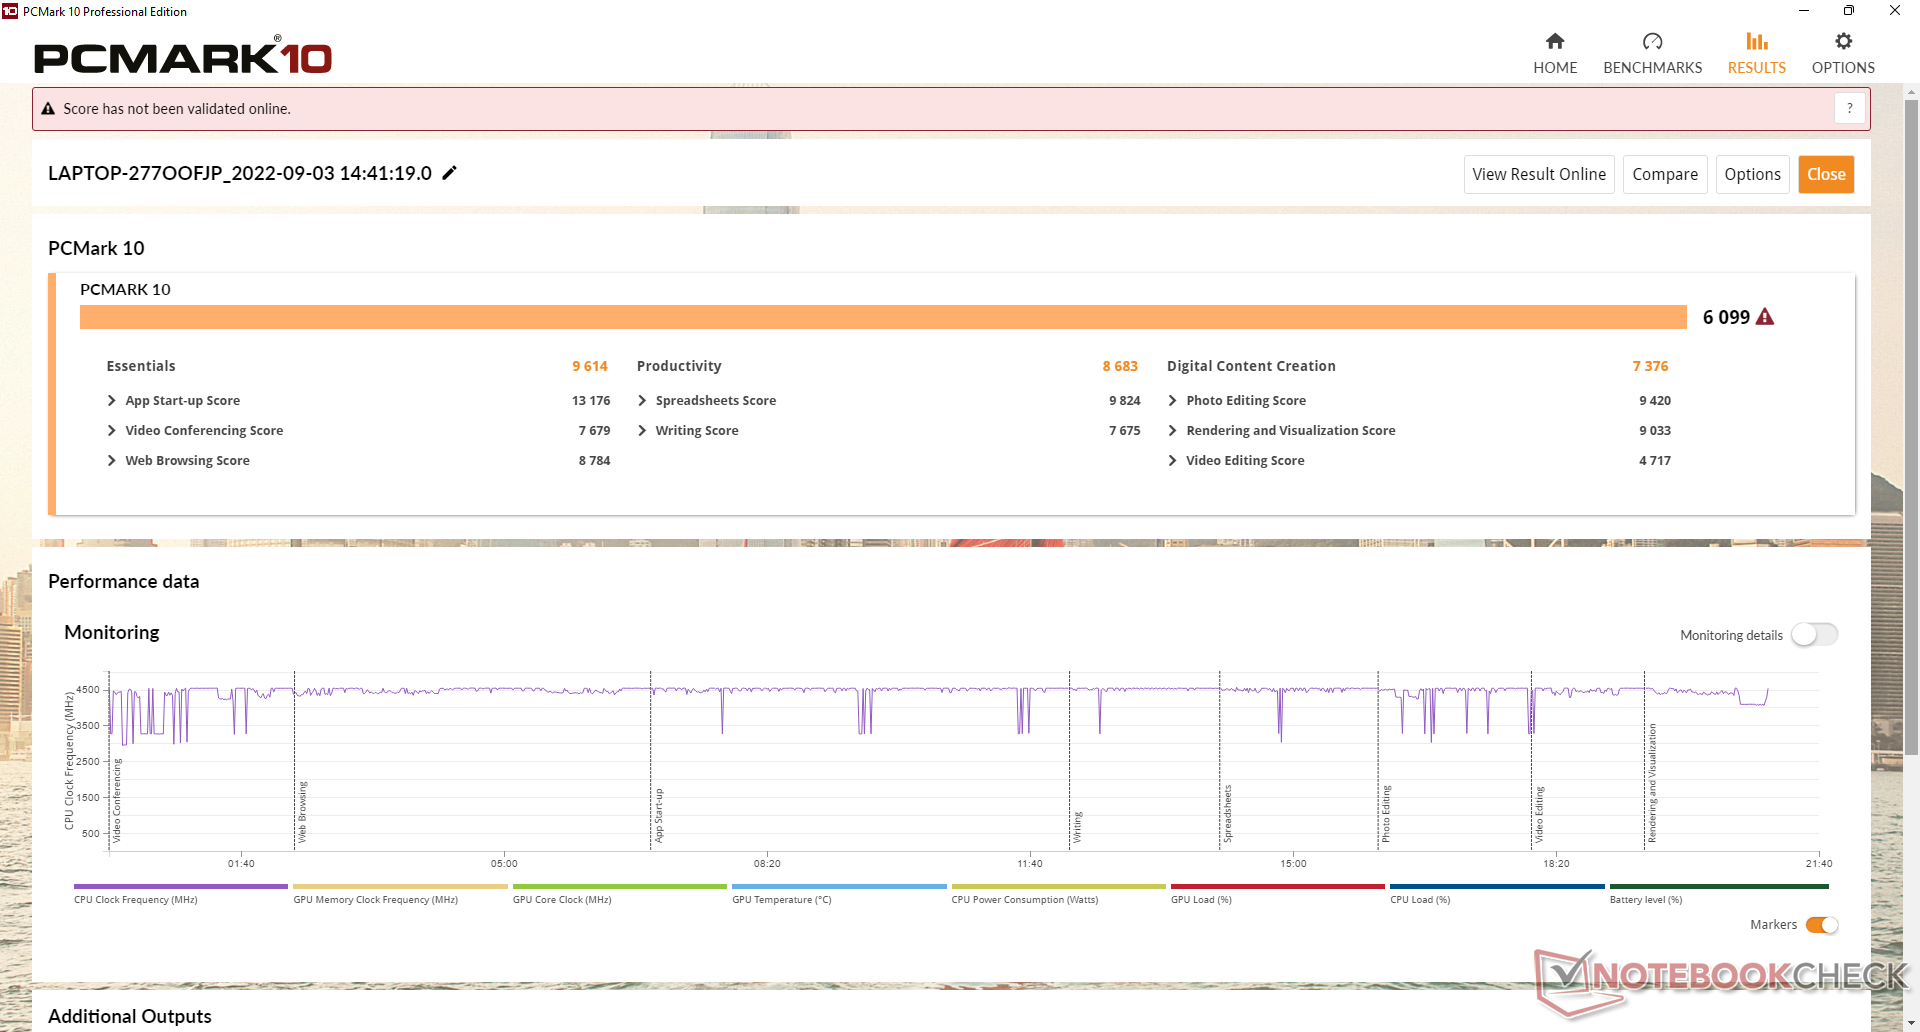
Systemets prestanda
PCMark-resultaten ligger konsekvent över den äldre IdeaPad Gaming 3i 15IMH05, men fortfarande under den äldre IdeaPad Gaming 3i 15IMH05 Legion 5 15ACH6A med den kraftfullare Radeon RX 6600M GPU:n. Särskilt delresultatet för skapande av digitalt innehåll är märkbart bättre än på IdeaPad Gaming 3i 15IMH05 på grund av generationsskiftet i grafikprestanda.
CrossMark: Overall | Productivity | Creativity | Responsiveness
| PCMark 10 / Score | |
| Lenovo Legion 5 15ACH6A-82NW0010GE | |
| Asus TUF Dash F15 FX517ZR | |
| Gigabyte A5 K1 | |
| Lenovo IdeaPad Gaming 3 15ARH7 | |
| Genomsnitt AMD Ryzen 5 6600H, NVIDIA GeForce RTX 3050 4GB Laptop GPU (n=1) | |
| Dell G15 5510 | |
| Lenovo IdeaPad Gaming 3i 15IMH05 | |
| PCMark 10 / Essentials | |
| Lenovo Legion 5 15ACH6A-82NW0010GE | |
| Gigabyte A5 K1 | |
| Asus TUF Dash F15 FX517ZR | |
| Lenovo IdeaPad Gaming 3 15ARH7 | |
| Genomsnitt AMD Ryzen 5 6600H, NVIDIA GeForce RTX 3050 4GB Laptop GPU (n=1) | |
| Lenovo IdeaPad Gaming 3i 15IMH05 | |
| Dell G15 5510 | |
| PCMark 10 / Productivity | |
| Asus TUF Dash F15 FX517ZR | |
| Lenovo Legion 5 15ACH6A-82NW0010GE | |
| Gigabyte A5 K1 | |
| Lenovo IdeaPad Gaming 3 15ARH7 | |
| Genomsnitt AMD Ryzen 5 6600H, NVIDIA GeForce RTX 3050 4GB Laptop GPU (n=1) | |
| Lenovo IdeaPad Gaming 3i 15IMH05 | |
| Dell G15 5510 | |
| PCMark 10 / Digital Content Creation | |
| Lenovo Legion 5 15ACH6A-82NW0010GE | |
| Asus TUF Dash F15 FX517ZR | |
| Gigabyte A5 K1 | |
| Lenovo IdeaPad Gaming 3 15ARH7 | |
| Genomsnitt AMD Ryzen 5 6600H, NVIDIA GeForce RTX 3050 4GB Laptop GPU (n=1) | |
| Dell G15 5510 | |
| Lenovo IdeaPad Gaming 3i 15IMH05 | |
| CrossMark / Overall | |
| Asus TUF Dash F15 FX517ZR | |
| Lenovo IdeaPad Gaming 3 15ARH7 | |
| Genomsnitt AMD Ryzen 5 6600H, NVIDIA GeForce RTX 3050 4GB Laptop GPU (n=1) | |
| CrossMark / Productivity | |
| Asus TUF Dash F15 FX517ZR | |
| Lenovo IdeaPad Gaming 3 15ARH7 | |
| Genomsnitt AMD Ryzen 5 6600H, NVIDIA GeForce RTX 3050 4GB Laptop GPU (n=1) | |
| CrossMark / Creativity | |
| Asus TUF Dash F15 FX517ZR | |
| Lenovo IdeaPad Gaming 3 15ARH7 | |
| Genomsnitt AMD Ryzen 5 6600H, NVIDIA GeForce RTX 3050 4GB Laptop GPU (n=1) | |
| CrossMark / Responsiveness | |
| Asus TUF Dash F15 FX517ZR | |
| Lenovo IdeaPad Gaming 3 15ARH7 | |
| Genomsnitt AMD Ryzen 5 6600H, NVIDIA GeForce RTX 3050 4GB Laptop GPU (n=1) | |
| PCMark 10 Score | 6099 poäng | |
Hjälp | ||
| AIDA64 / Memory Copy | |
| Asus TUF Dash F15 FX517ZR | |
| Genomsnitt AMD Ryzen 5 6600H (28335 - 50886, n=4) | |
| Gigabyte A5 K1 | |
| Lenovo Legion 5 15ACH6A-82NW0010GE | |
| Dell G15 5510 | |
| Lenovo IdeaPad Gaming 3i 15IMH05 | |
| Lenovo IdeaPad Gaming 3 15ARH7 | |
| AIDA64 / Memory Read | |
| Asus TUF Dash F15 FX517ZR | |
| Gigabyte A5 K1 | |
| Genomsnitt AMD Ryzen 5 6600H (34300 - 51684, n=4) | |
| Lenovo Legion 5 15ACH6A-82NW0010GE | |
| Lenovo IdeaPad Gaming 3i 15IMH05 | |
| Dell G15 5510 | |
| Lenovo IdeaPad Gaming 3 15ARH7 | |
| AIDA64 / Memory Write | |
| Asus TUF Dash F15 FX517ZR | |
| Genomsnitt AMD Ryzen 5 6600H (31788 - 55160, n=4) | |
| Gigabyte A5 K1 | |
| Dell G15 5510 | |
| Lenovo IdeaPad Gaming 3i 15IMH05 | |
| Lenovo IdeaPad Gaming 3 15ARH7 | |
| Lenovo Legion 5 15ACH6A-82NW0010GE | |
| AIDA64 / Memory Latency | |
| Asus TUF Dash F15 FX517ZR | |
| Genomsnitt AMD Ryzen 5 6600H (81.7 - 112.7, n=4) | |
| Lenovo Legion 5 15ACH6A-82NW0010GE | |
| Lenovo IdeaPad Gaming 3 15ARH7 | |
| Dell G15 5510 | |
| Gigabyte A5 K1 | |
| Lenovo IdeaPad Gaming 3i 15IMH05 | |
* ... mindre är bättre
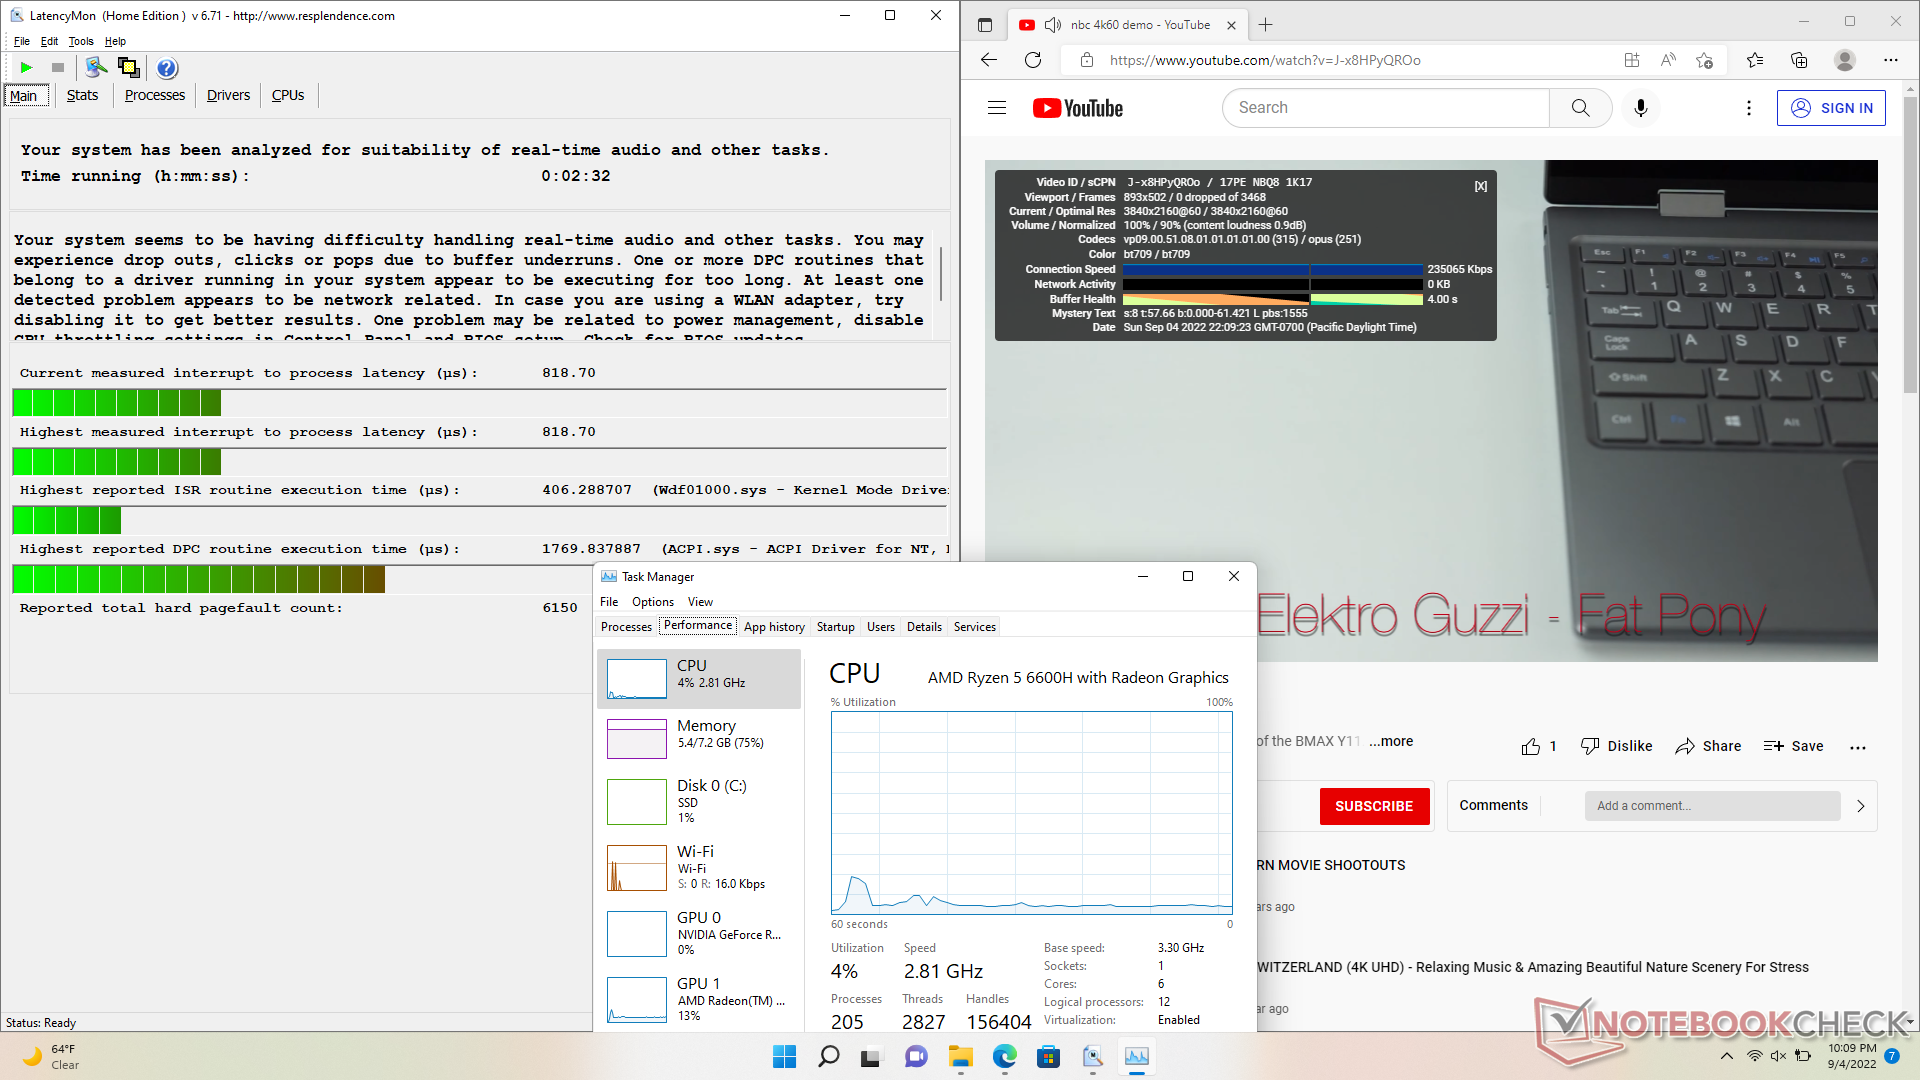
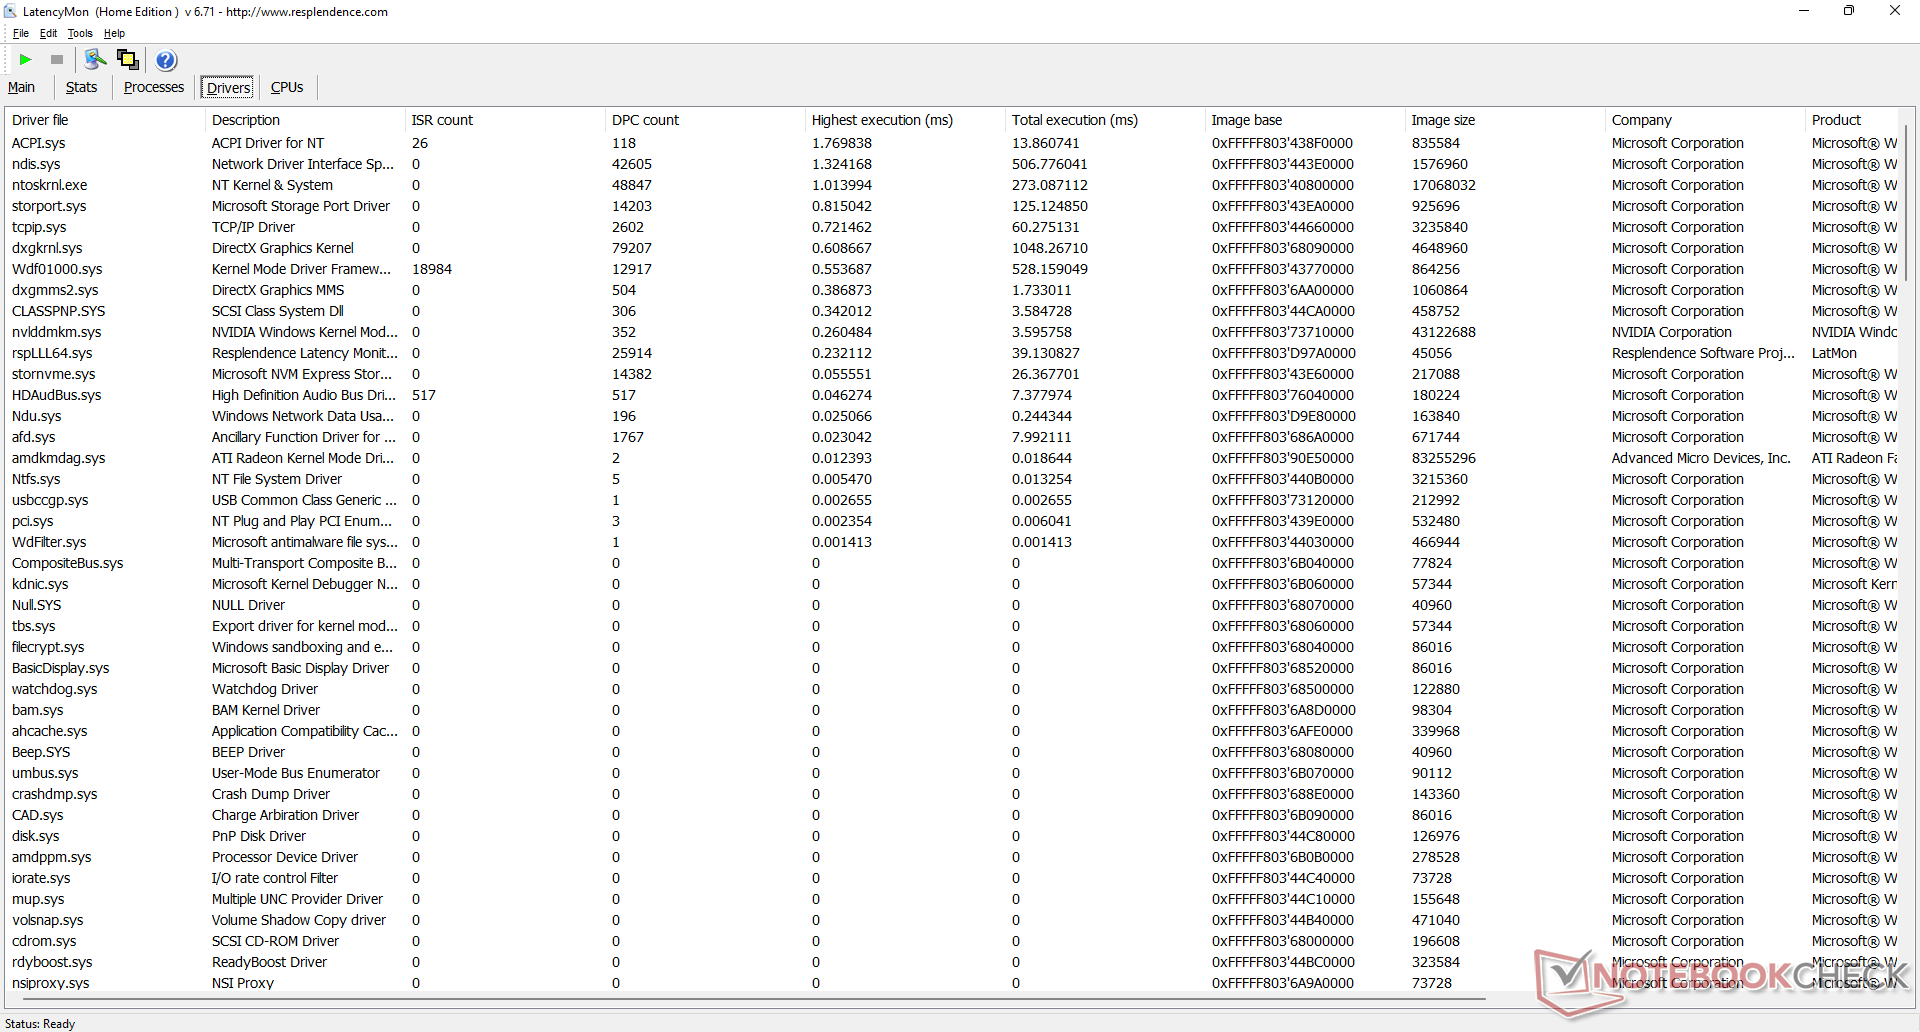
DPC-latenstid
LatencyMon avslöjar mindre DPC-problem när du öppnar flera webbläsarflikar på vår hemsida. uppspelning av 4K-video vid 60 FPS är annars perfekt med 0 tappade bildrutor och vid ett lägre iGPU-utnyttjande jämfört med Intel Core U-serien Iris Xe (13 procent jämfört med ~40 procent).
| DPC Latencies / LatencyMon - interrupt to process latency (max), Web, Youtube, Prime95 | |
| Dell G15 5510 | |
| Gigabyte A5 K1 | |
| Lenovo Legion 5 15ACH6A-82NW0010GE | |
| Lenovo IdeaPad Gaming 3 15ARH7 | |
| Lenovo IdeaPad Gaming 3i 15IMH05 | |
| Asus TUF Dash F15 FX517ZR | |
* ... mindre är bättre
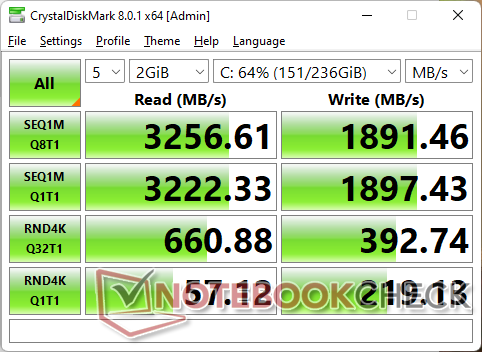
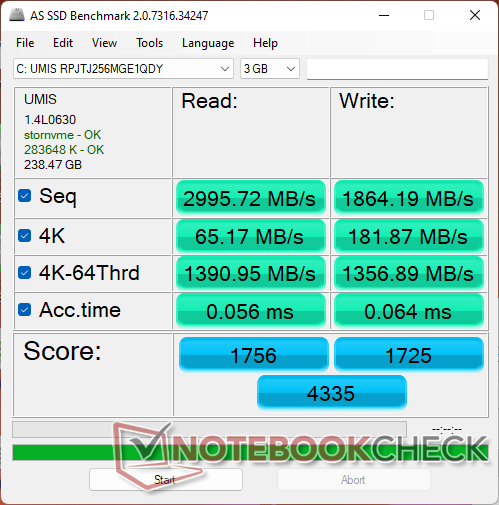
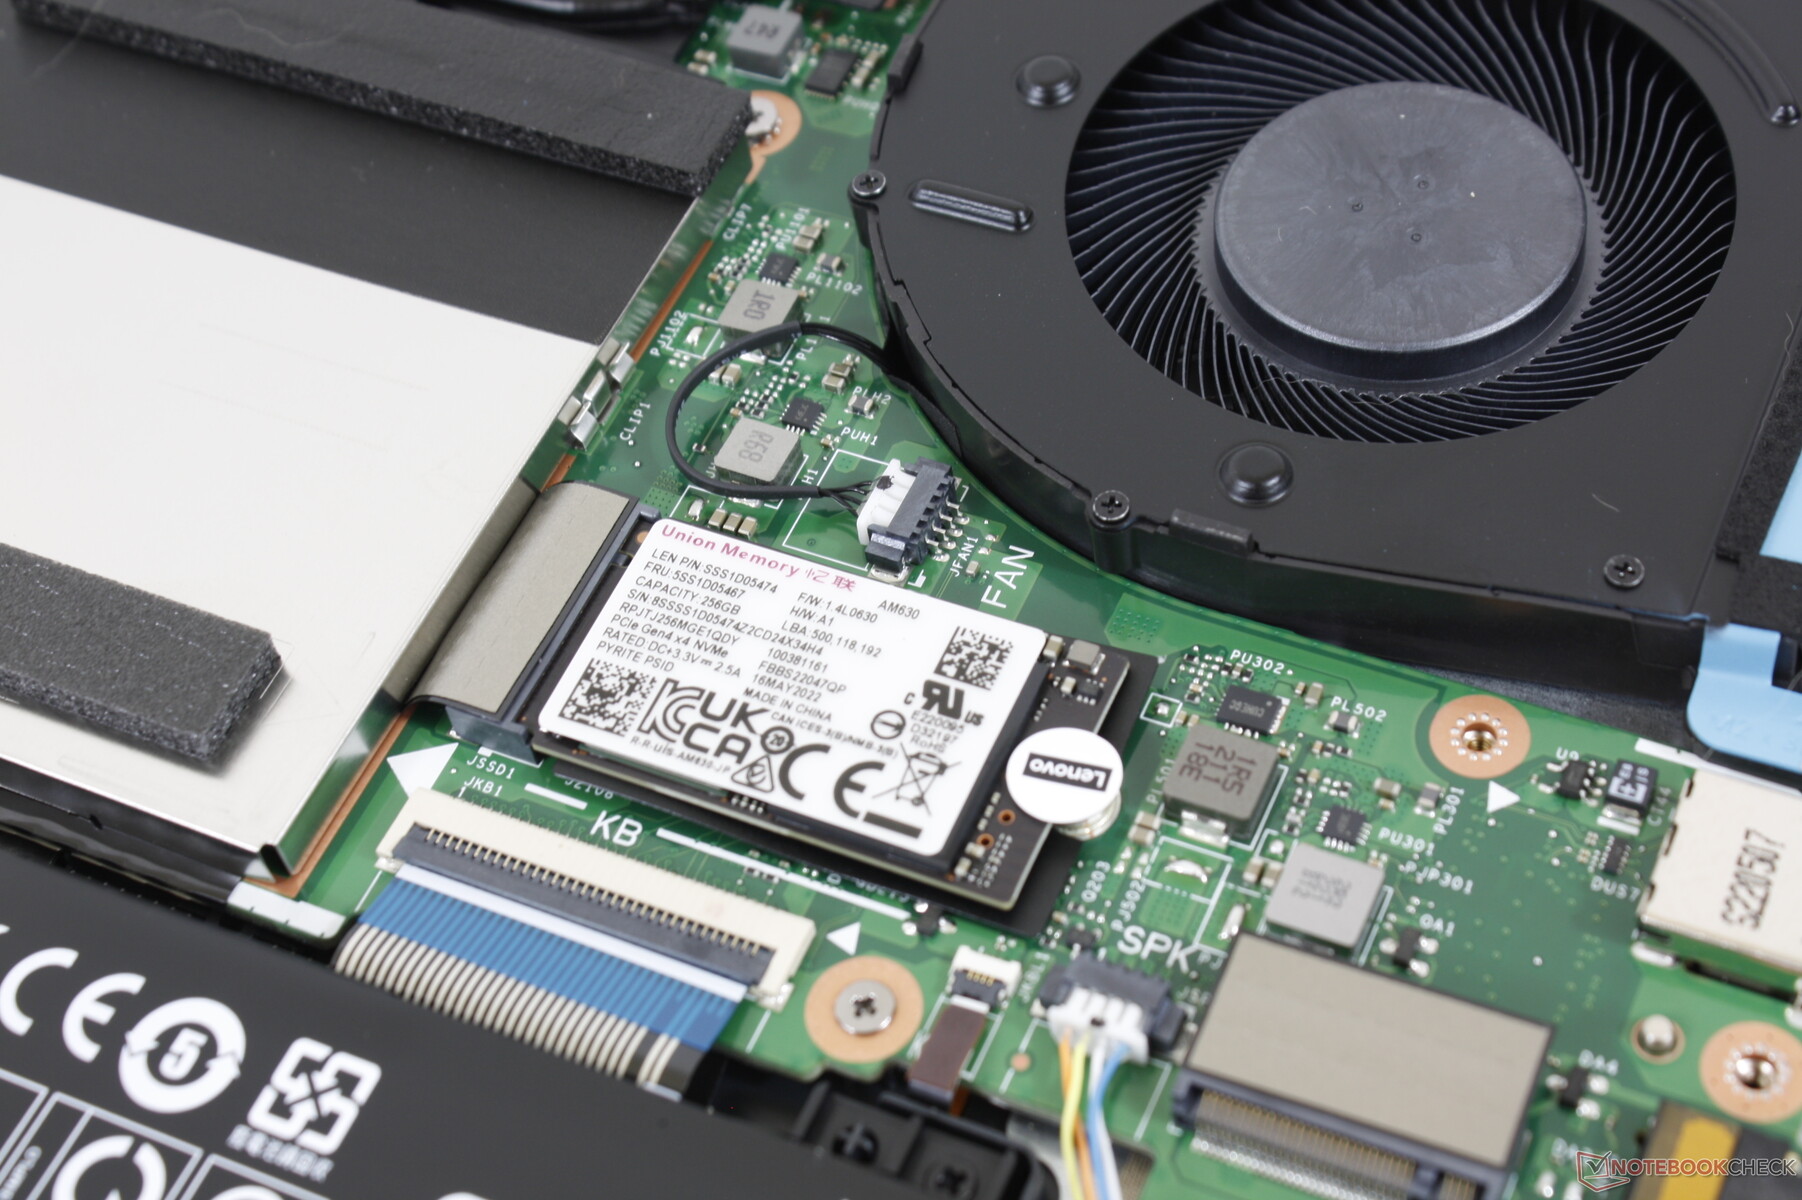
Lagringsenheter - Upp till två PCIe4 x4 SSD-enheter
Även om systemet kan stödja upp till två M.2 PCIe4 x4 NVMe SSD-diskar samtidigt, kan 256 GB PCIe4 x4 Lenovo AM630 SSD i vår testenhet är långsam i förhållande till andra PCIe4 x4 SSD-diskar. Samsung PM9A1 kan till exempel nå hastigheter på upp till 7000 MB/s jämfört med endast ~3000 MB/s på vår IdeaPad. Dessutom skulle enheten i vår enhet strypa ner till 2000 MB/s när den körde DiskSpd i en slinga, vilket framgår av grafen nedan, vilket innebär att den inte kan upprätthålla sina maximala överföringshastigheter under långa perioder. För en bärbar dator för spel till budgetpris är detta dock inte ett särskilt kritiskt klagomål.

| Drive Performance rating - Percent | |
| Lenovo IdeaPad Gaming 3 15ARH7 | |
| Asus TUF Dash F15 FX517ZR | |
| Gigabyte A5 K1 | |
| Dell G15 5510 | |
| Lenovo Legion 5 15ACH6A-82NW0010GE | |
| Lenovo IdeaPad Gaming 3i 15IMH05 | |
* ... mindre är bättre
Disk Throttling: DiskSpd Read Loop, Queue Depth 8
GPU-prestanda
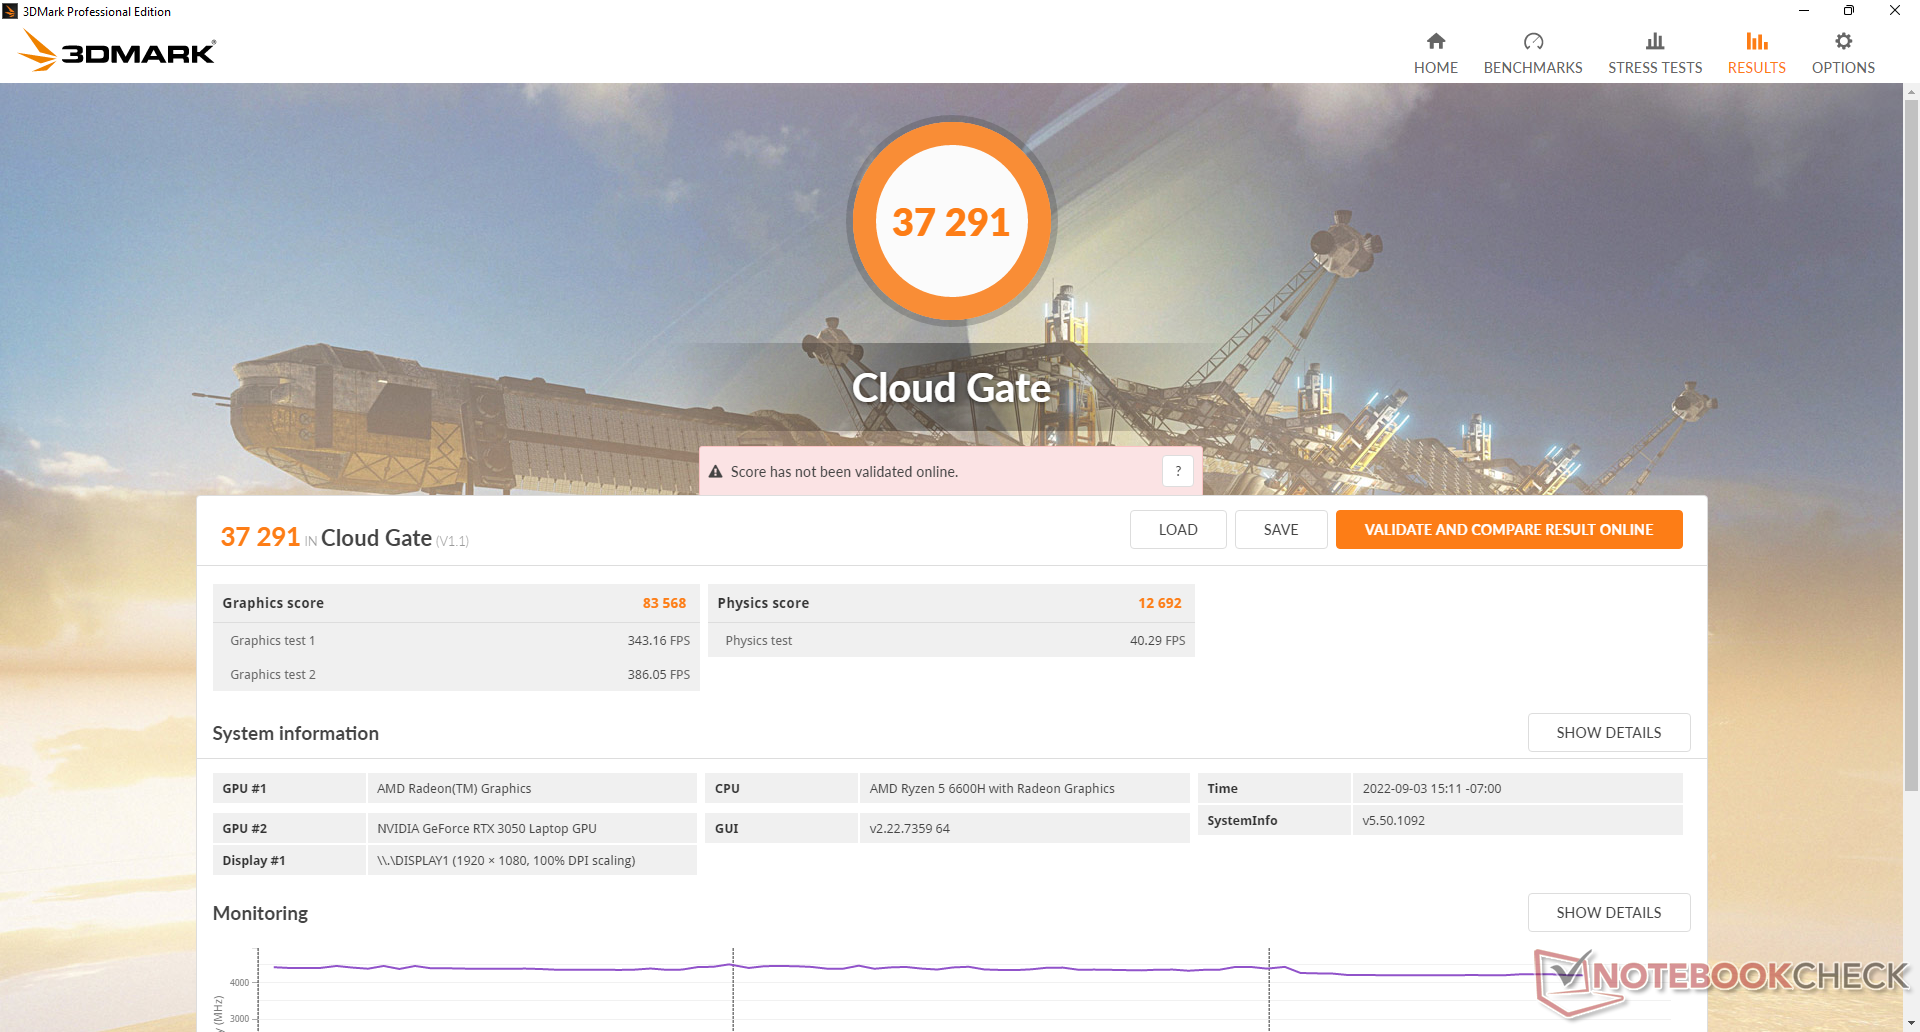
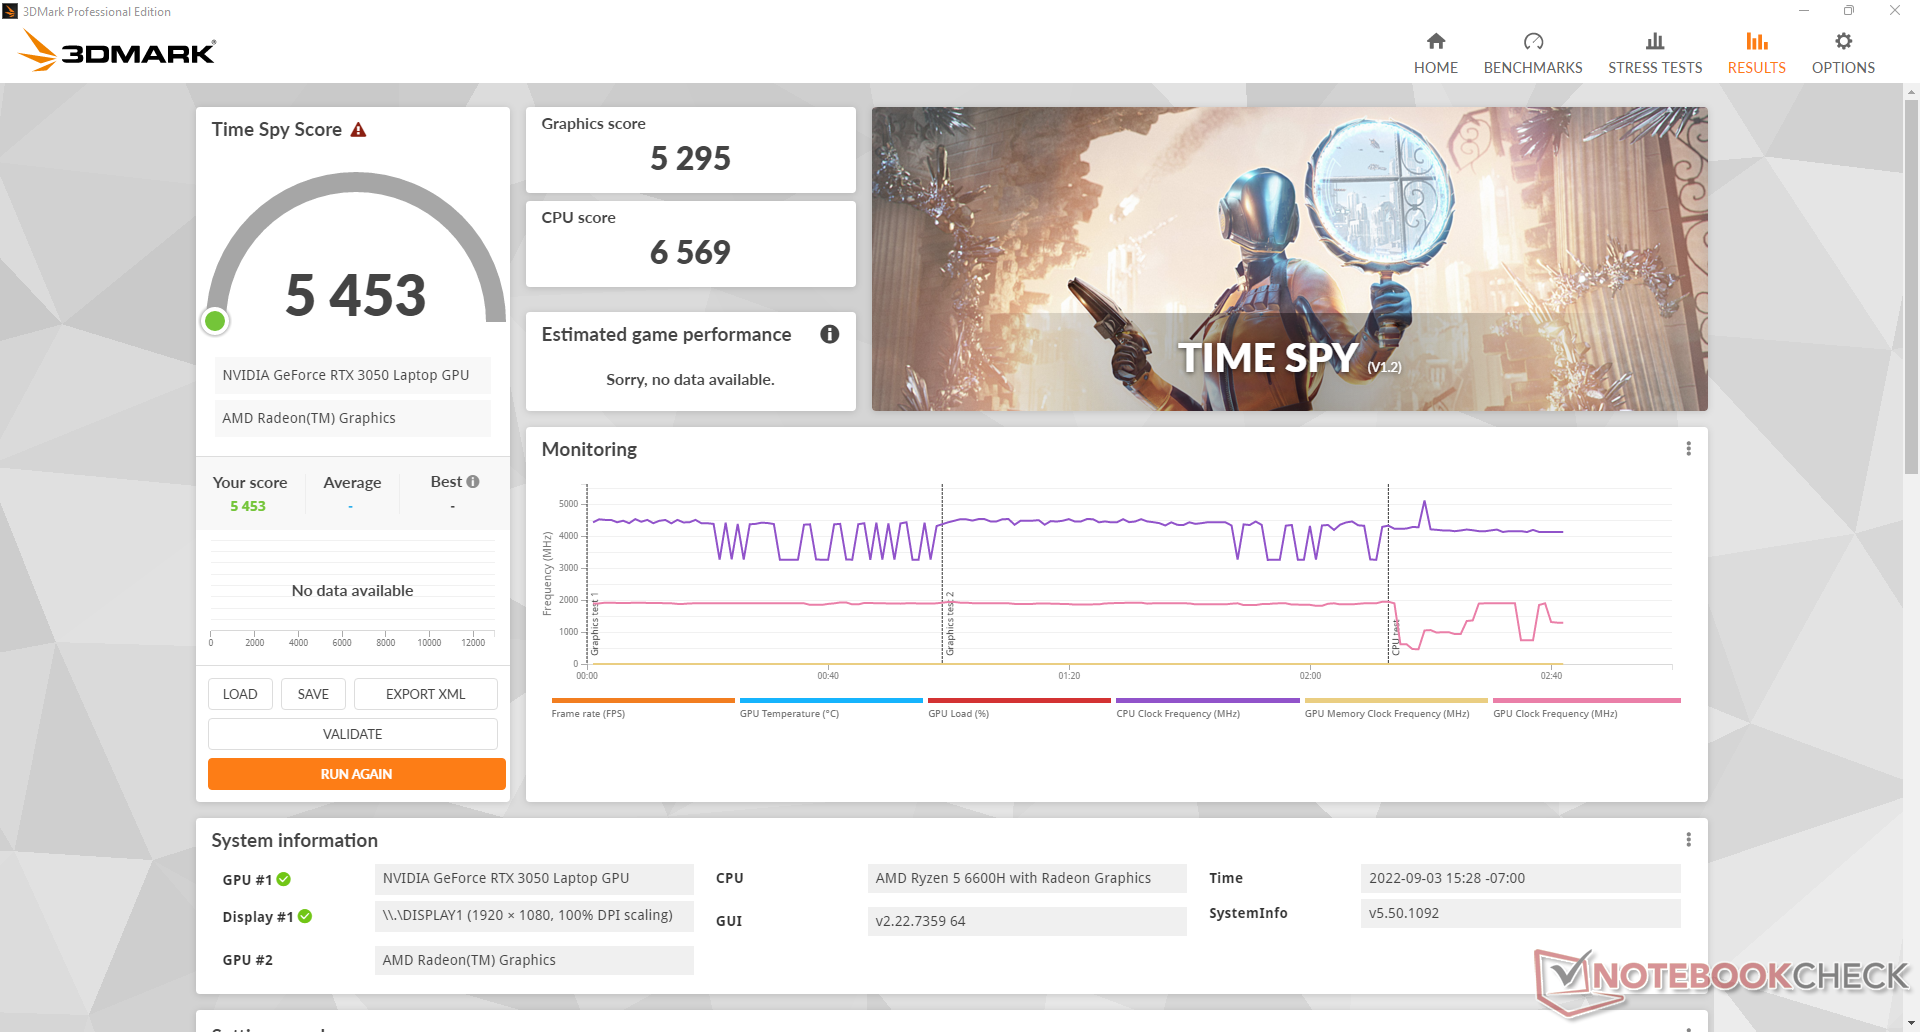
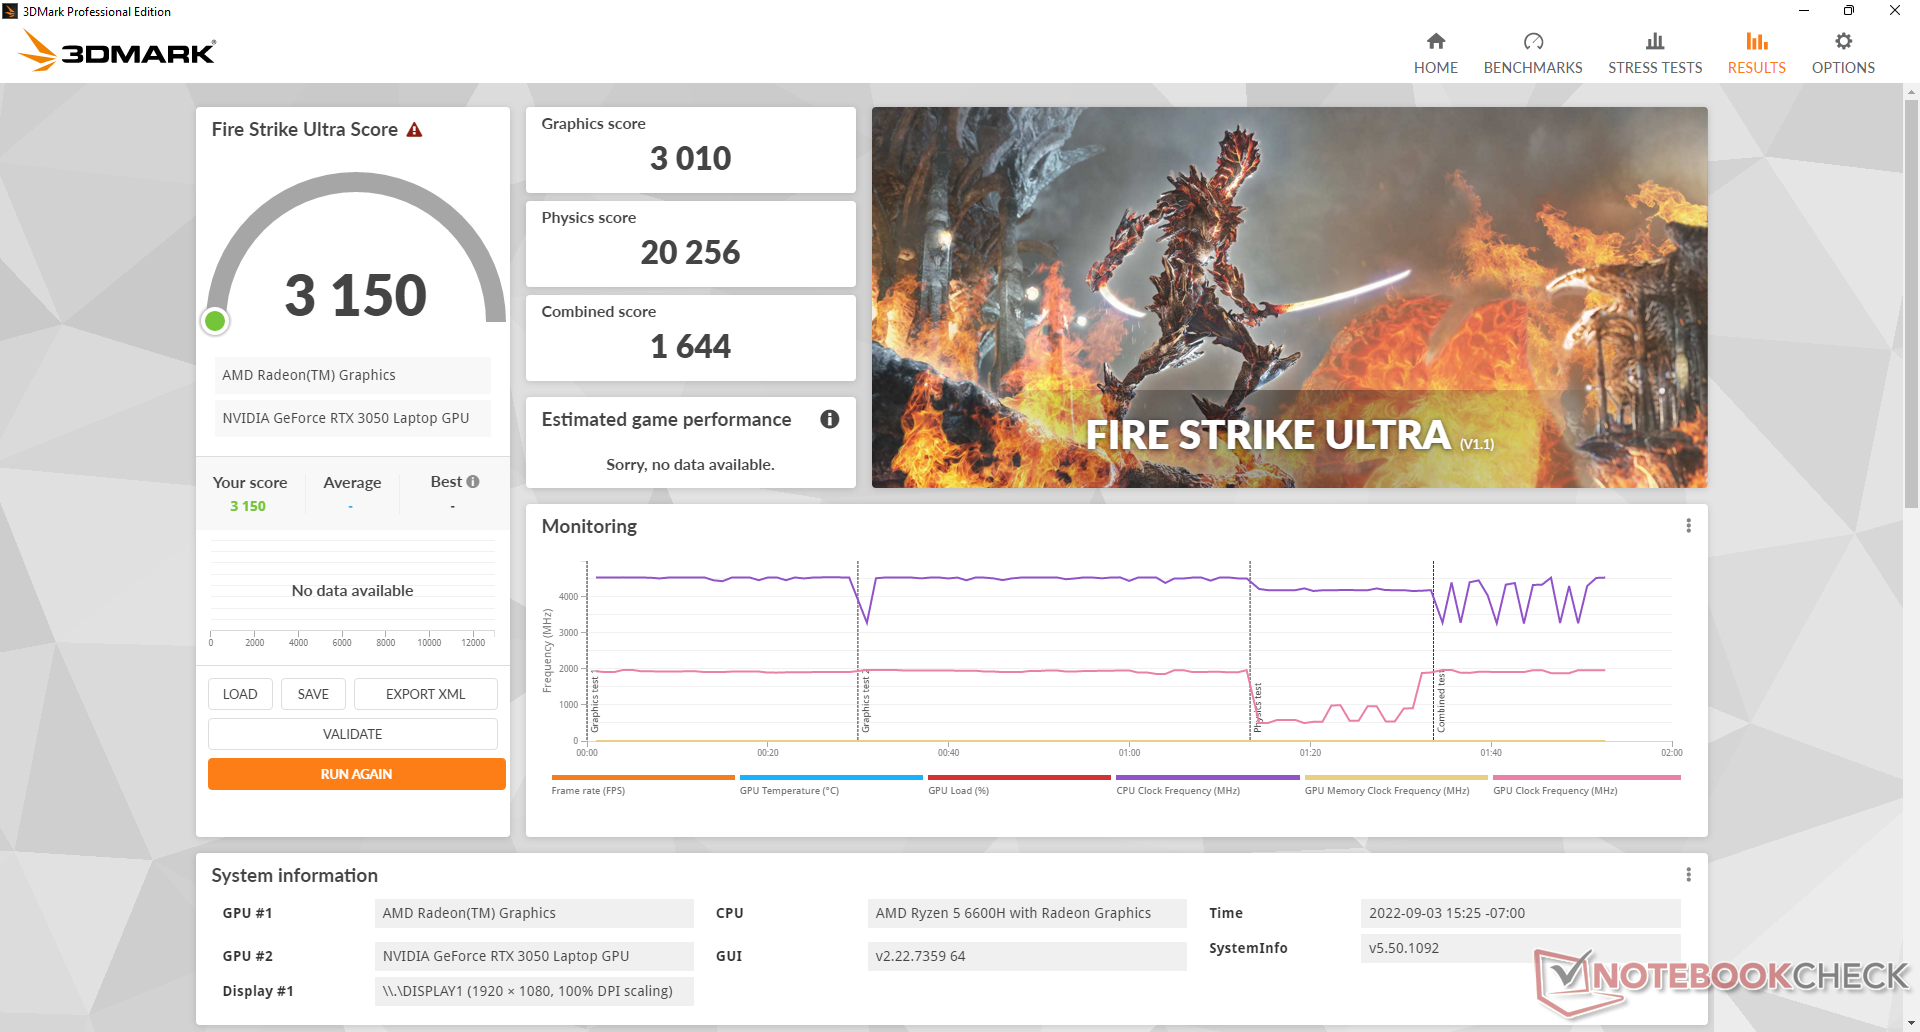
Grafikprestanda är cirka 15 procent snabbare än den genomsnittliga bärbara datorn i vår databas som är utrustad med samma GeForce RTX 3050 GPU. Uppgradering till RTX 3050 Ti kommer sannolikt bara att öka prestandan med ytterligare 10 procent baserat på vår erfarenhet av andra bärbara datorer med RTX 3050 Ti. Användare som letar efter ett RTX 3060-alternativ måste överväga den dyrare Legion -serien istället.
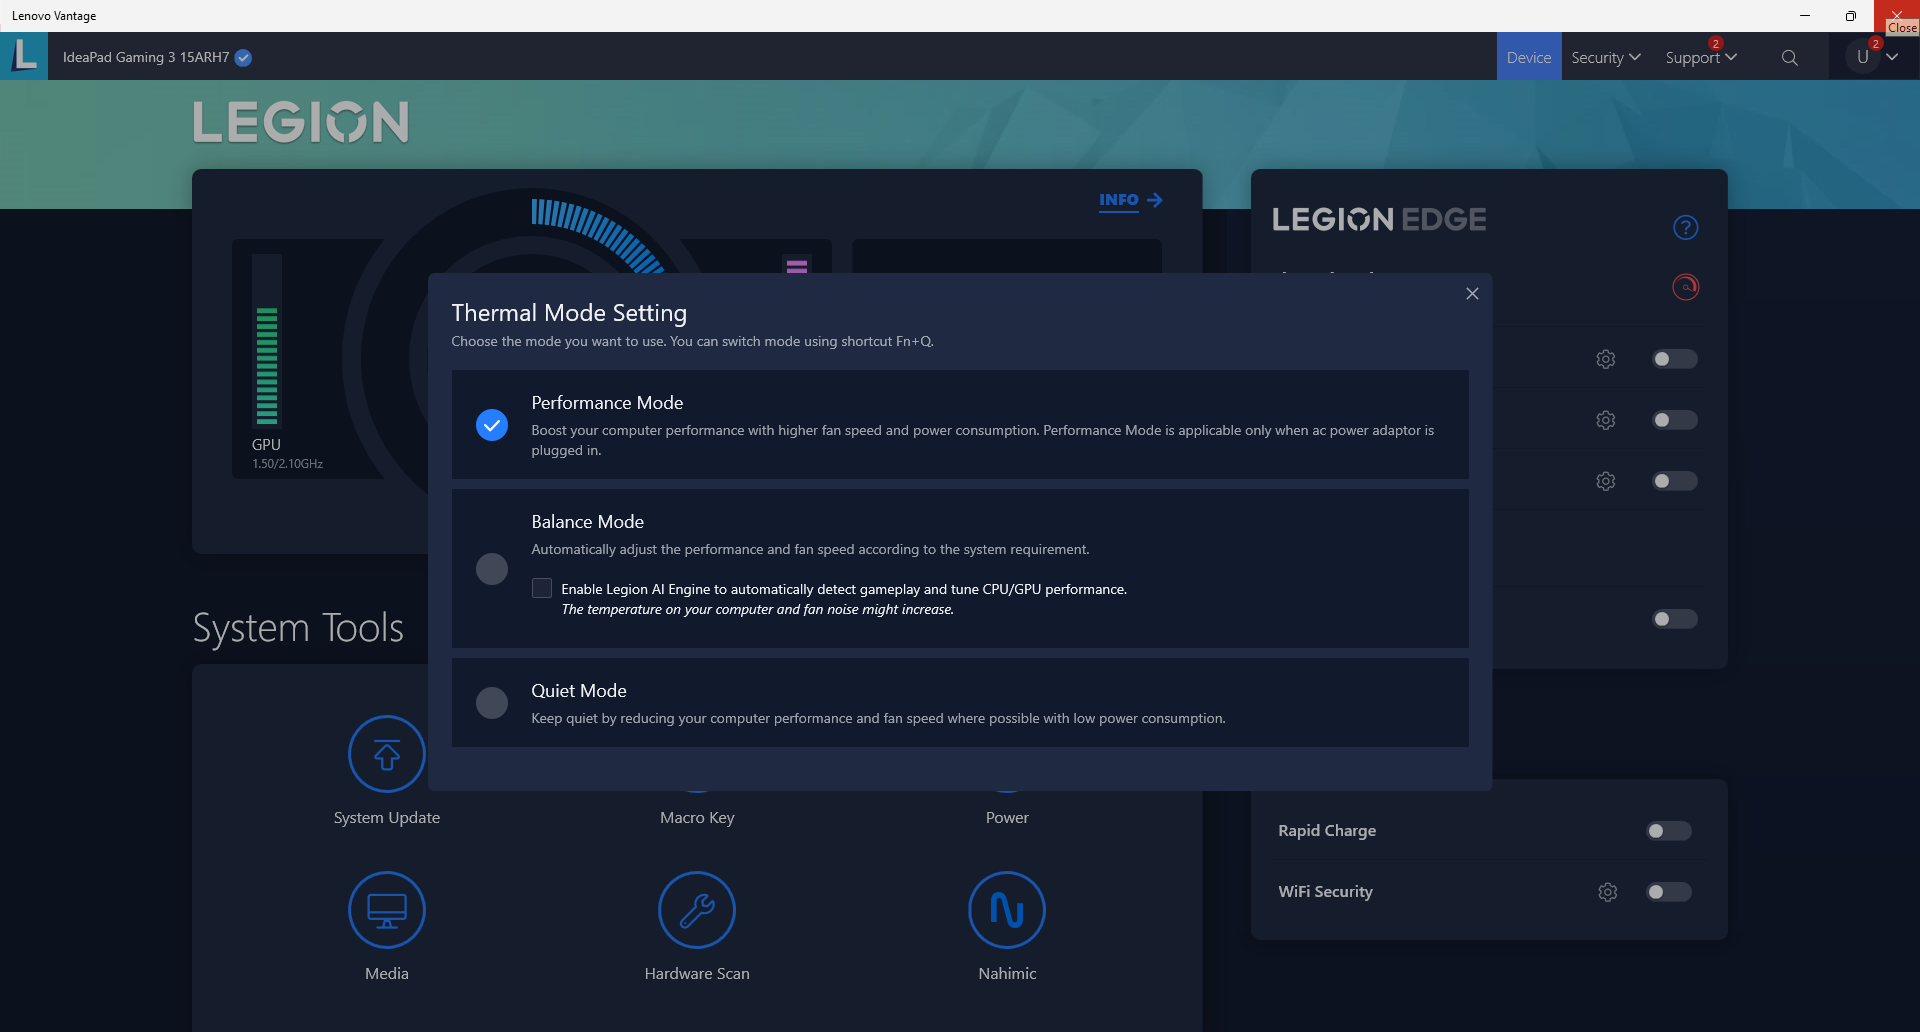
Prestandan minskar om den körs på strömprofilen Balanced. Ett Fire Strike -test på Balanced-läget skulle minska grafikprestandan med 8 procent (14157 mot 12978 poäng) medan CPU-prestandan förblir ungefär densamma.
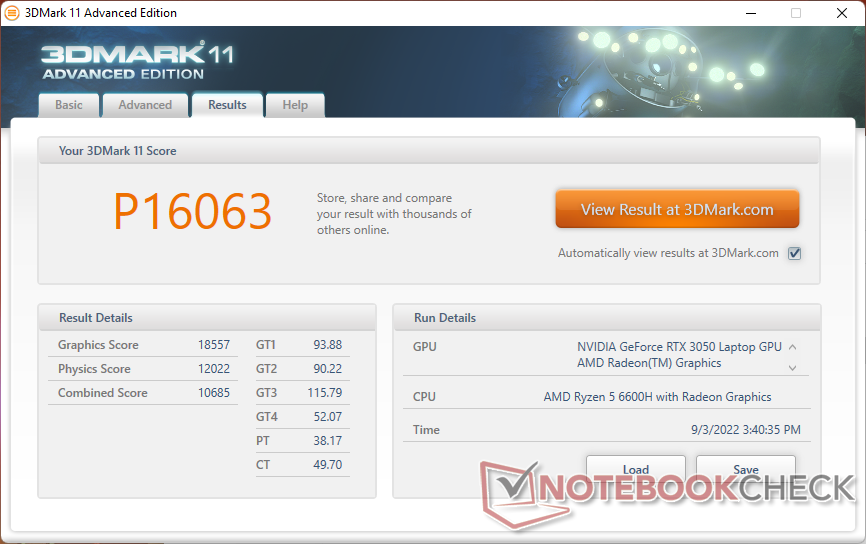

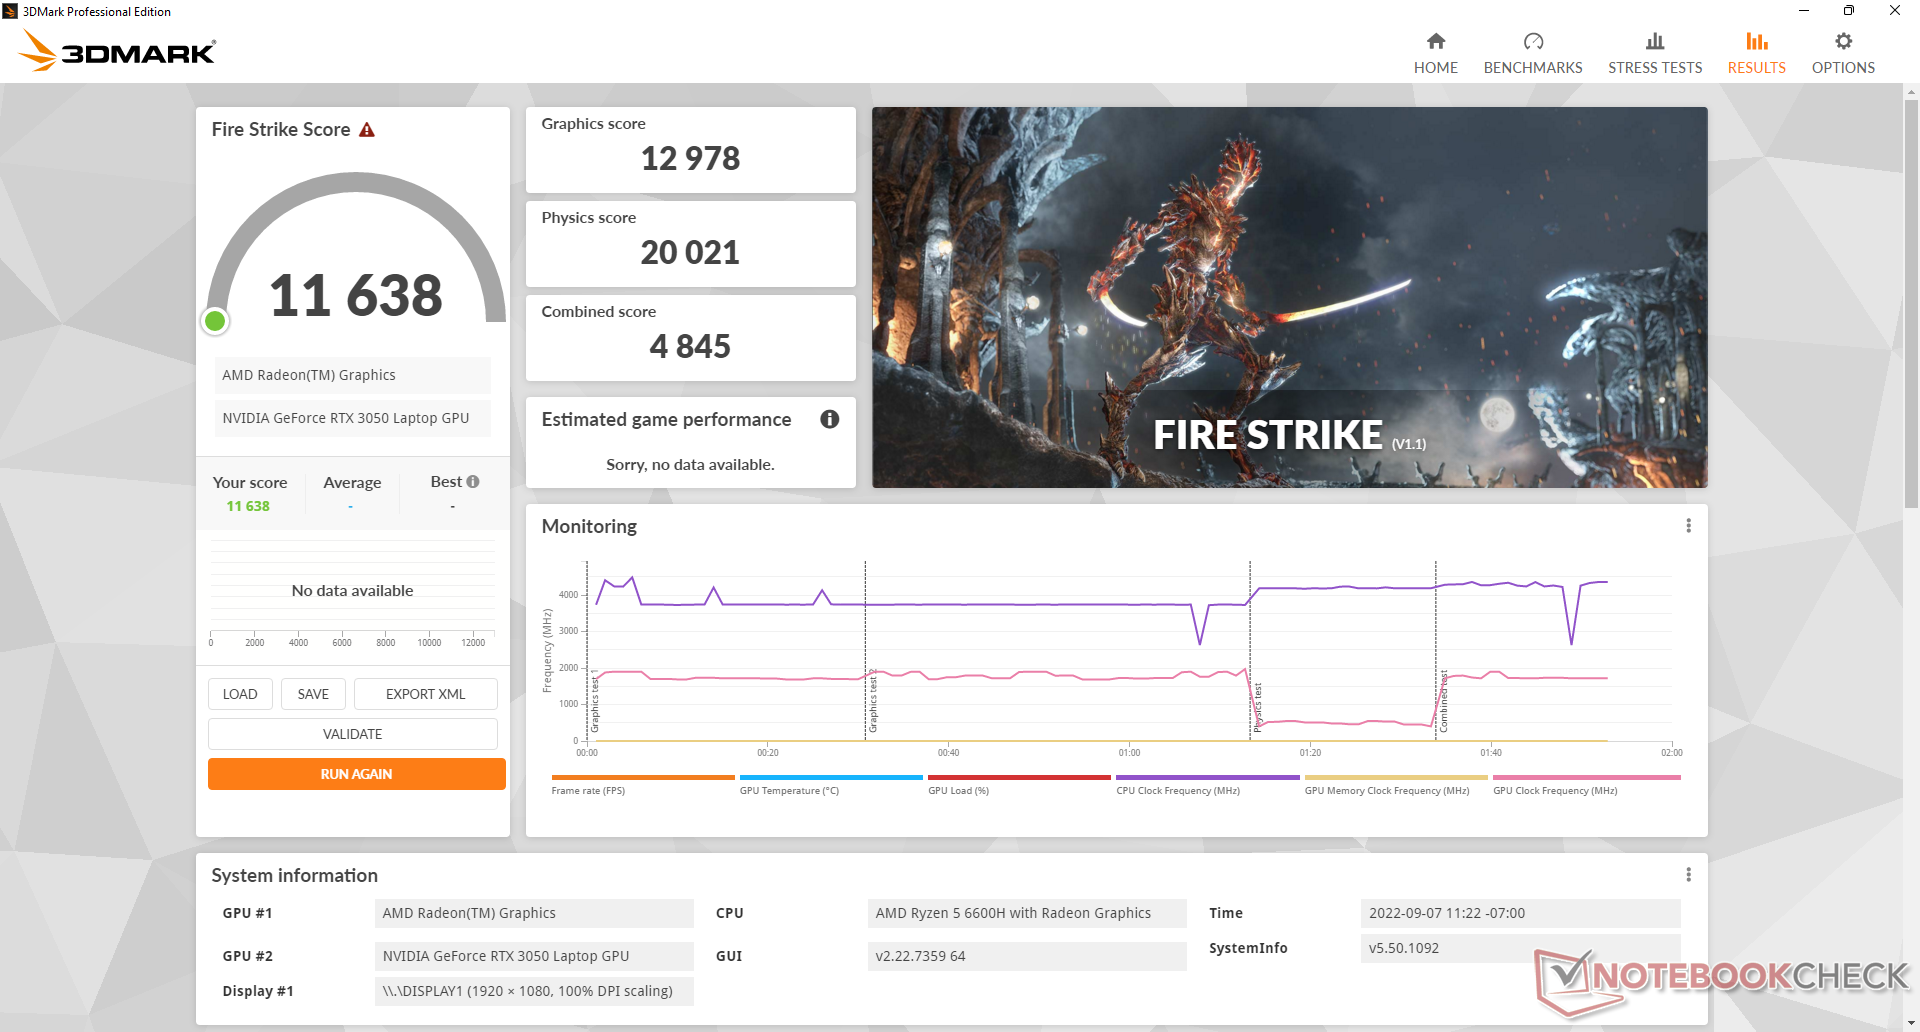
| 3DMark 11 Performance | 16063 poäng | |
| 3DMark Cloud Gate Standard Score | 37291 poäng | |
| 3DMark Fire Strike Score | 12525 poäng | |
| 3DMark Time Spy Score | 5453 poäng | |
Hjälp | ||
Witcher 3 FPS Chart
| låg | med. | hög | ultra | |
|---|---|---|---|---|
| GTA V (2015) | 144 | 133.3 | 103.5 | 60.3 |
| The Witcher 3 (2015) | 213.9 | 167.7 | 105.1 | 55.8 |
| Dota 2 Reborn (2015) | 117.2 | 106.4 | 100.6 | 95.2 |
| Final Fantasy XV Benchmark (2018) | 116.4 | 73.6 | 53.5 | |
| X-Plane 11.11 (2018) | 84.4 | 77.1 | 63.6 | |
| Strange Brigade (2018) | 248 | 134.7 | 109.1 | 95.1 |
| Cyberpunk 2077 1.6 (2022) | 72.9 | 62.4 | 45.5 | 36.5 |
Utsläpp - Nästan 50 dB(A) när du spelar
Systembrus
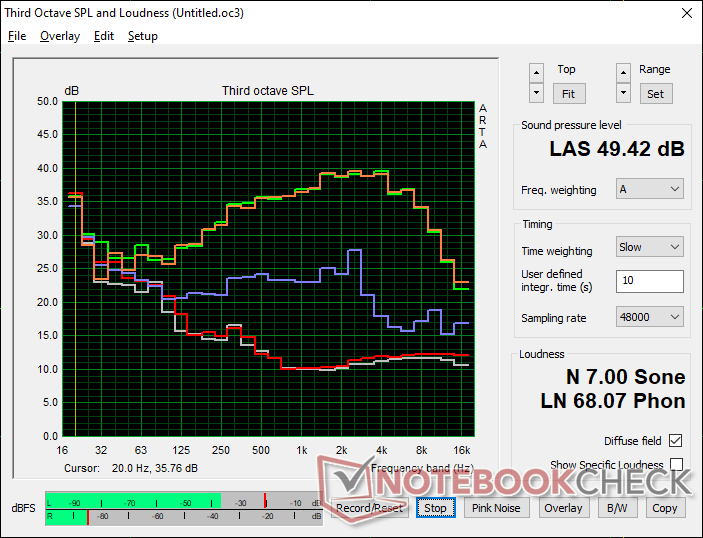
Fläktljudet vid tomgång kan vara så lågt som 23,8 eller så högt som 27,3 dB(A) om inställningen för effektprofilen Performance används. Prestanda-läget rekommenderas därför inte om du bara surfar eller streamar på webben. Räkna med en ljudnivå på omkring 31,4 dB(A) eller lägre vid de flesta dagliga belastningar.
Fläktarna kan vara så högljudda som 49,3 dB(A) när du spelar i Performance-läget, vilket är jämförbart med de flesta andra bärbara datorer för spel, inklusive Lenovos egen Legion 5 15. Fläktljudet sjunker betydligt till 43,9 dB(A) om man istället spelar på strömprofilen Balanced, men detta sker till en liten kostnad för grafikprestandan som nämnts ovan. Vissa spelare kan dock tycka att den sänkta prestandan är väl värd det för en totalt sett tystare maskin.
Ljudnivå
| Låg belastning |
| 23.8 / 23.8 / 27.2 dB(A) |
| Hög belastning |
| 34.8 / 49.4 dB(A) |
 | ||
30 dB tyst 40 dB(A) hörbar 50 dB(A) högt ljud |
||
min: | ||
| Lenovo IdeaPad Gaming 3 15ARH7 GeForce RTX 3050 4GB Laptop GPU, R5 6600H, Lenovo UMIS AM630 RPJTJ256MGE1QDY | Lenovo IdeaPad Gaming 3i 15IMH05 GeForce GTX 1650 Mobile, i5-10300H, SK hynix BC511 HFM512GDHTNI-87A0B | Lenovo Legion 5 15ACH6A-82NW0010GE Radeon RX 6600M, R5 5600H, Micron 2210 MTFDHBA512QFD | Gigabyte A5 K1 GeForce RTX 3060 Laptop GPU, R5 5600H, ESR512GTLG-E6GBTNB4 | Asus TUF Dash F15 FX517ZR GeForce RTX 3070 Laptop GPU, i7-12650H, Samsung PM991a MZVLQ1T0HBLB | Dell G15 5510 GeForce RTX 3050 4GB Laptop GPU, i5-10500H, SK Hynix BC711 HFM512GD3HX015N | |
|---|---|---|---|---|---|---|
| Noise | -20% | -16% | -22% | -15% | -10% | |
| av / miljö * (dB) | 23.3 | 30.7 -32% | 25 -7% | 26 -12% | 26 -12% | 26 -12% |
| Idle Minimum * (dB) | 23.8 | 30.7 -29% | 25 -5% | 26 -9% | 26 -9% | 26 -9% |
| Idle Average * (dB) | 23.8 | 30.7 -29% | 25 -5% | 29 -22% | 32 -34% | 27 -13% |
| Idle Maximum * (dB) | 27.2 | 30.7 -13% | 34.5 -27% | 32 -18% | 33 -21% | 33 -21% |
| Load Average * (dB) | 34.8 | 49.7 -43% | 51.1 -47% | 57 -64% | 48 -38% | 45 -29% |
| Witcher 3 ultra * (dB) | 49.3 | 47 5% | 56 -14% | 47 5% | 45 9% | |
| Load Maximum * (dB) | 49.4 | 50.3 -2% | 51.3 -4% | 58 -17% | 49 1% | 47 5% |
* ... mindre är bättre
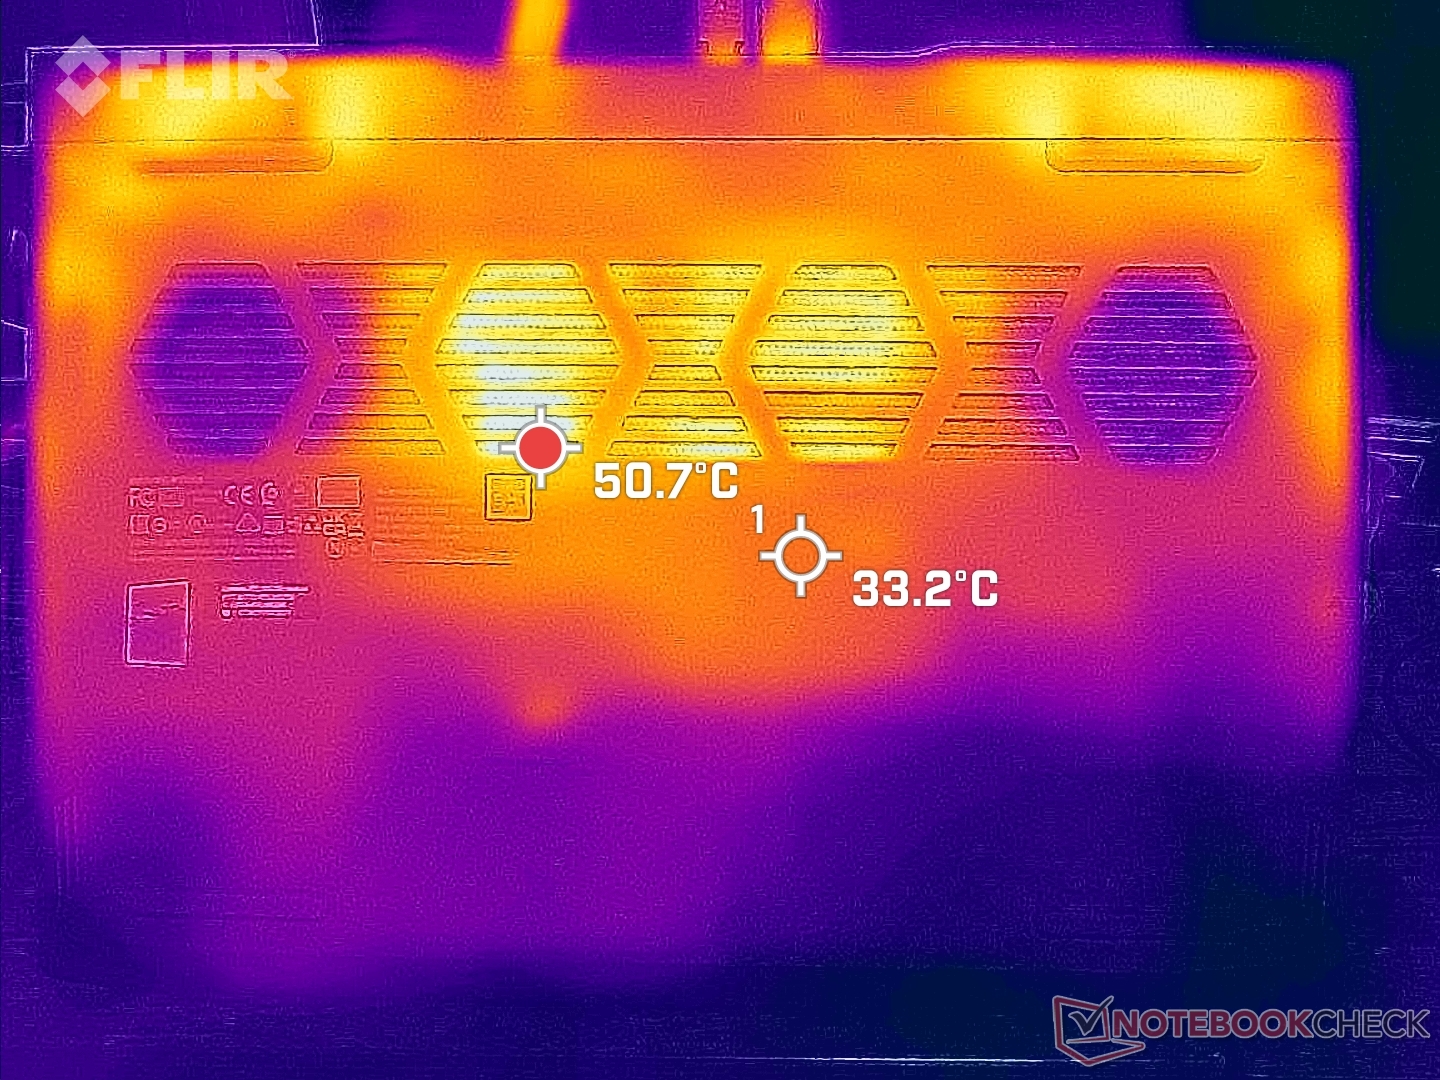
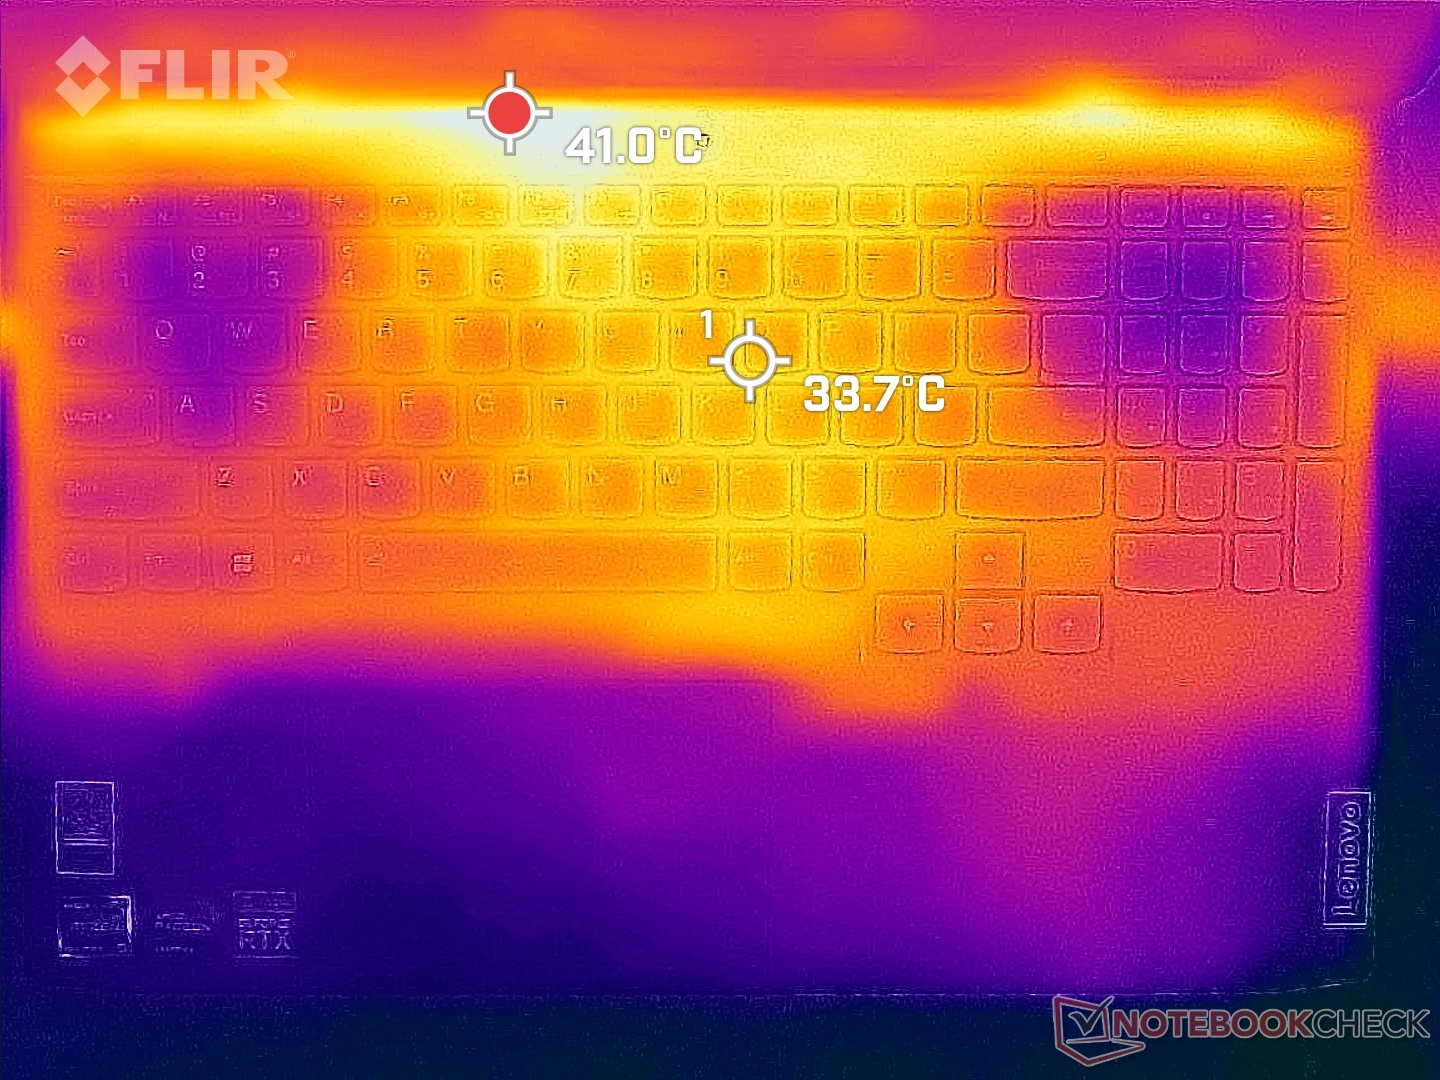
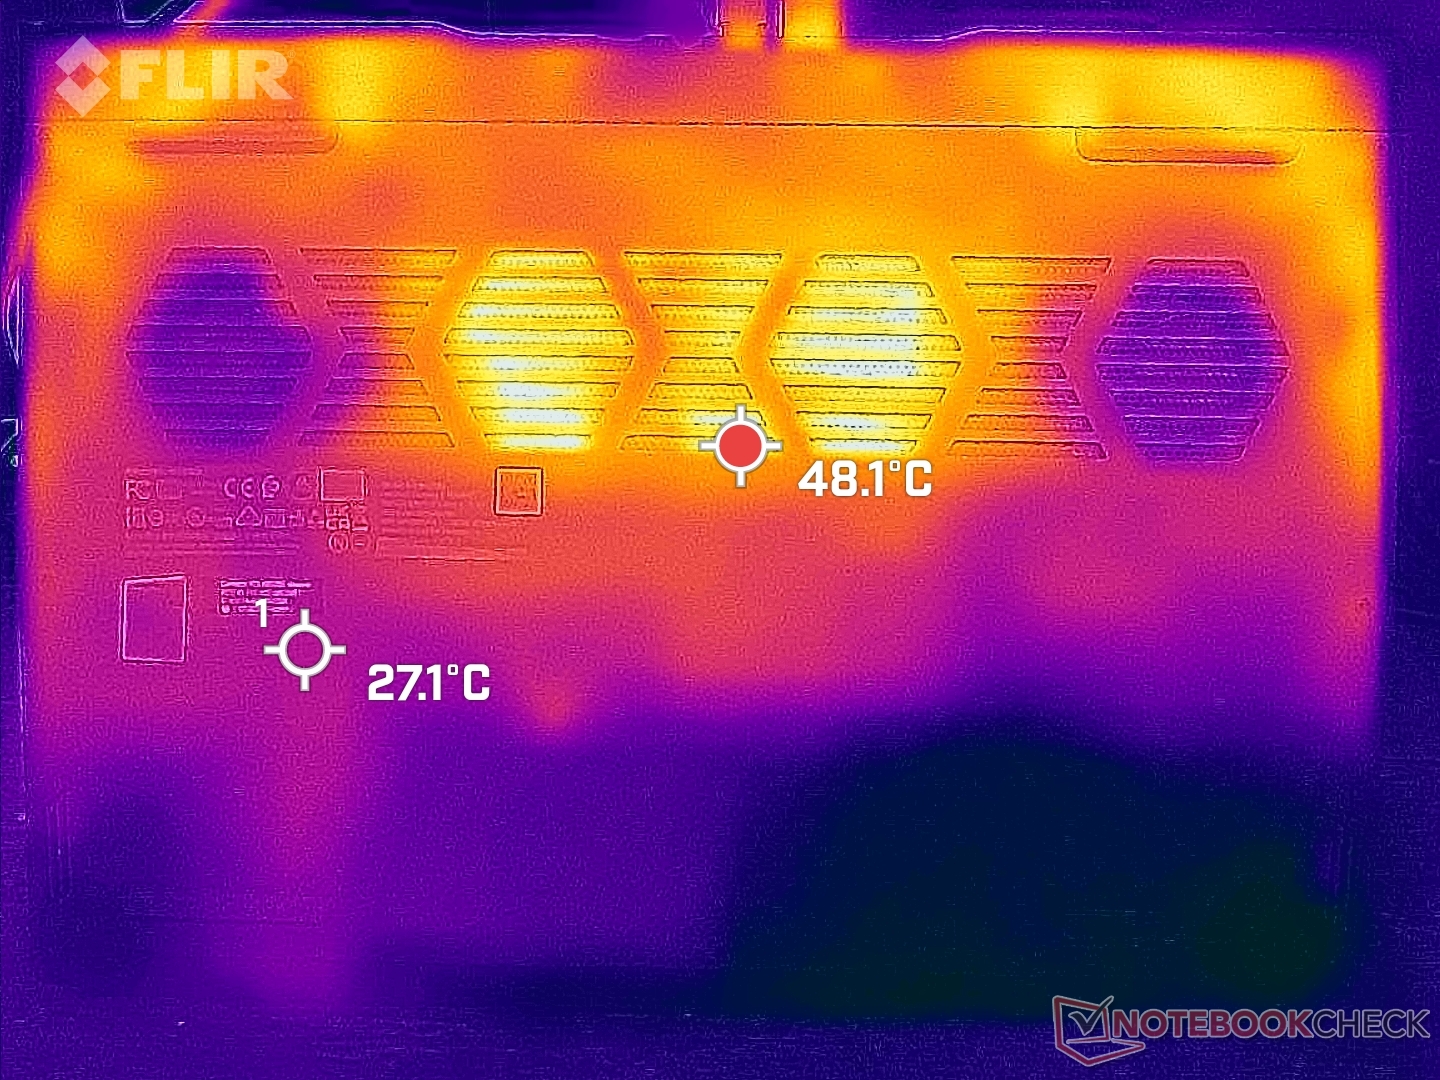
Temperatur
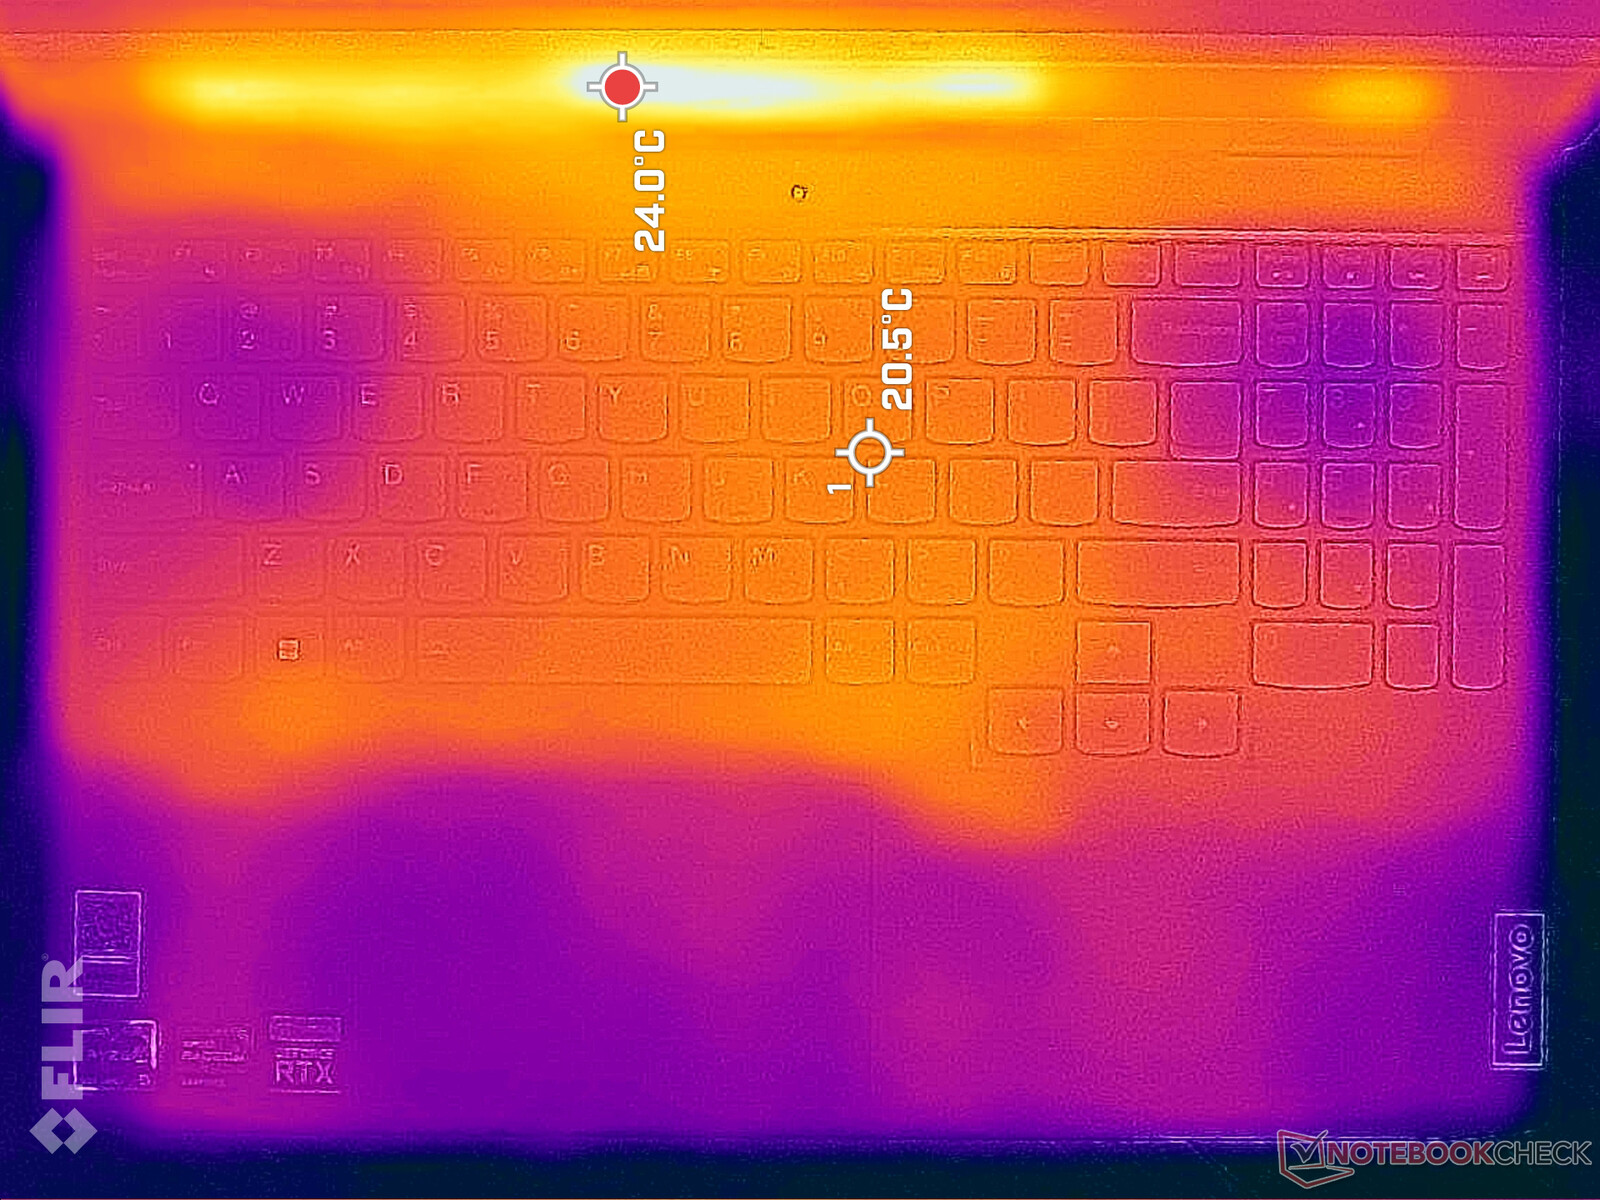
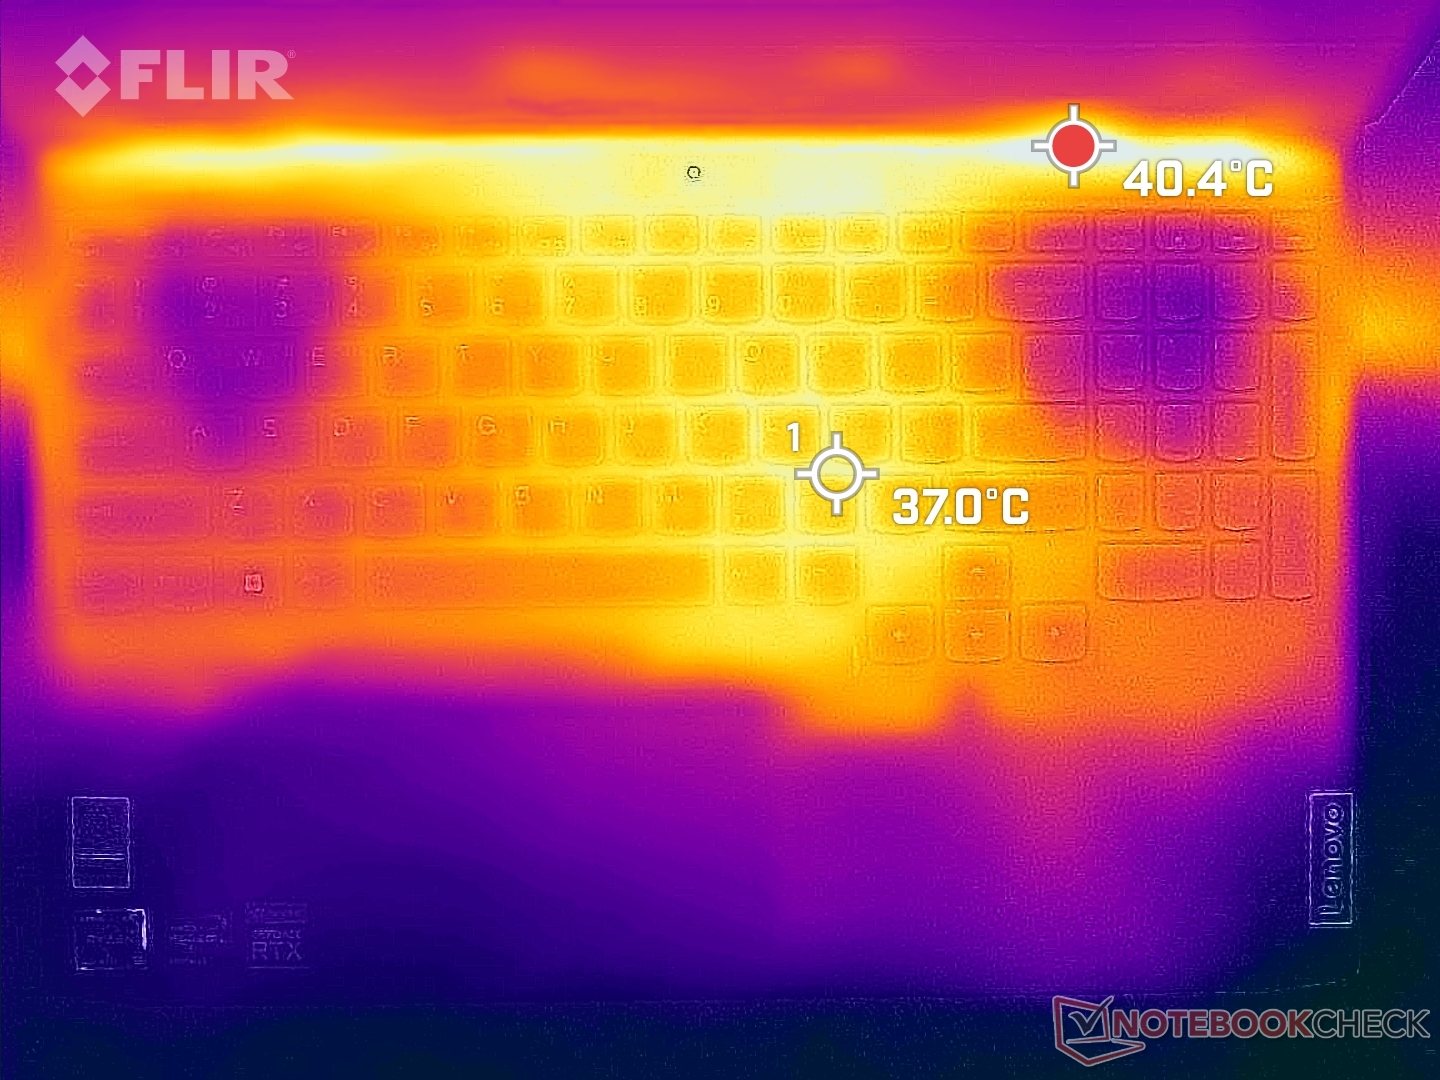
Yttemperaturerna är varmast nära tangentbordets mitt medan WASD- och numpad-tangenterna är mycket svalare eftersom frisk luft dras genom dessa tangenter, vilket framgår av temperaturkartorna nedan. Detta är bättre än på de äldre IdeaPad Gaming 3i 15IMH05 ellerDell G15 5510 som har varmare WASD-tangenter i jämförelse. Tangentbordets hotspot kan nå 43 C när man spelar vilket fortfarande är jämförbart med hotspots på de tidigare nämnda IdeaPad och Dell G15.
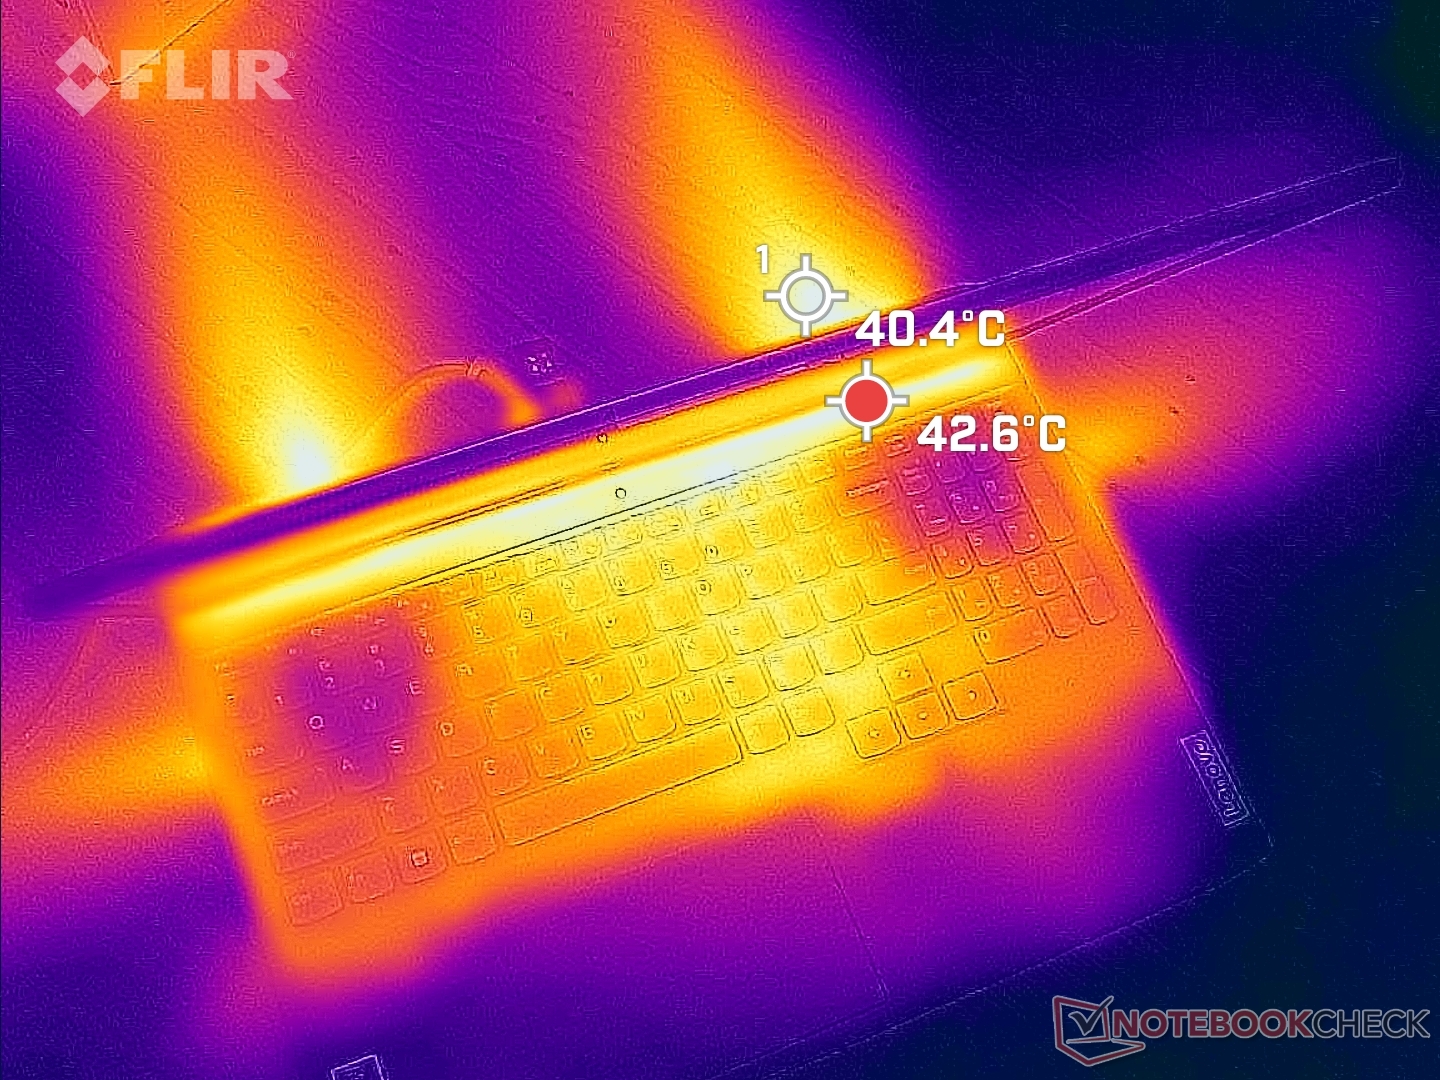
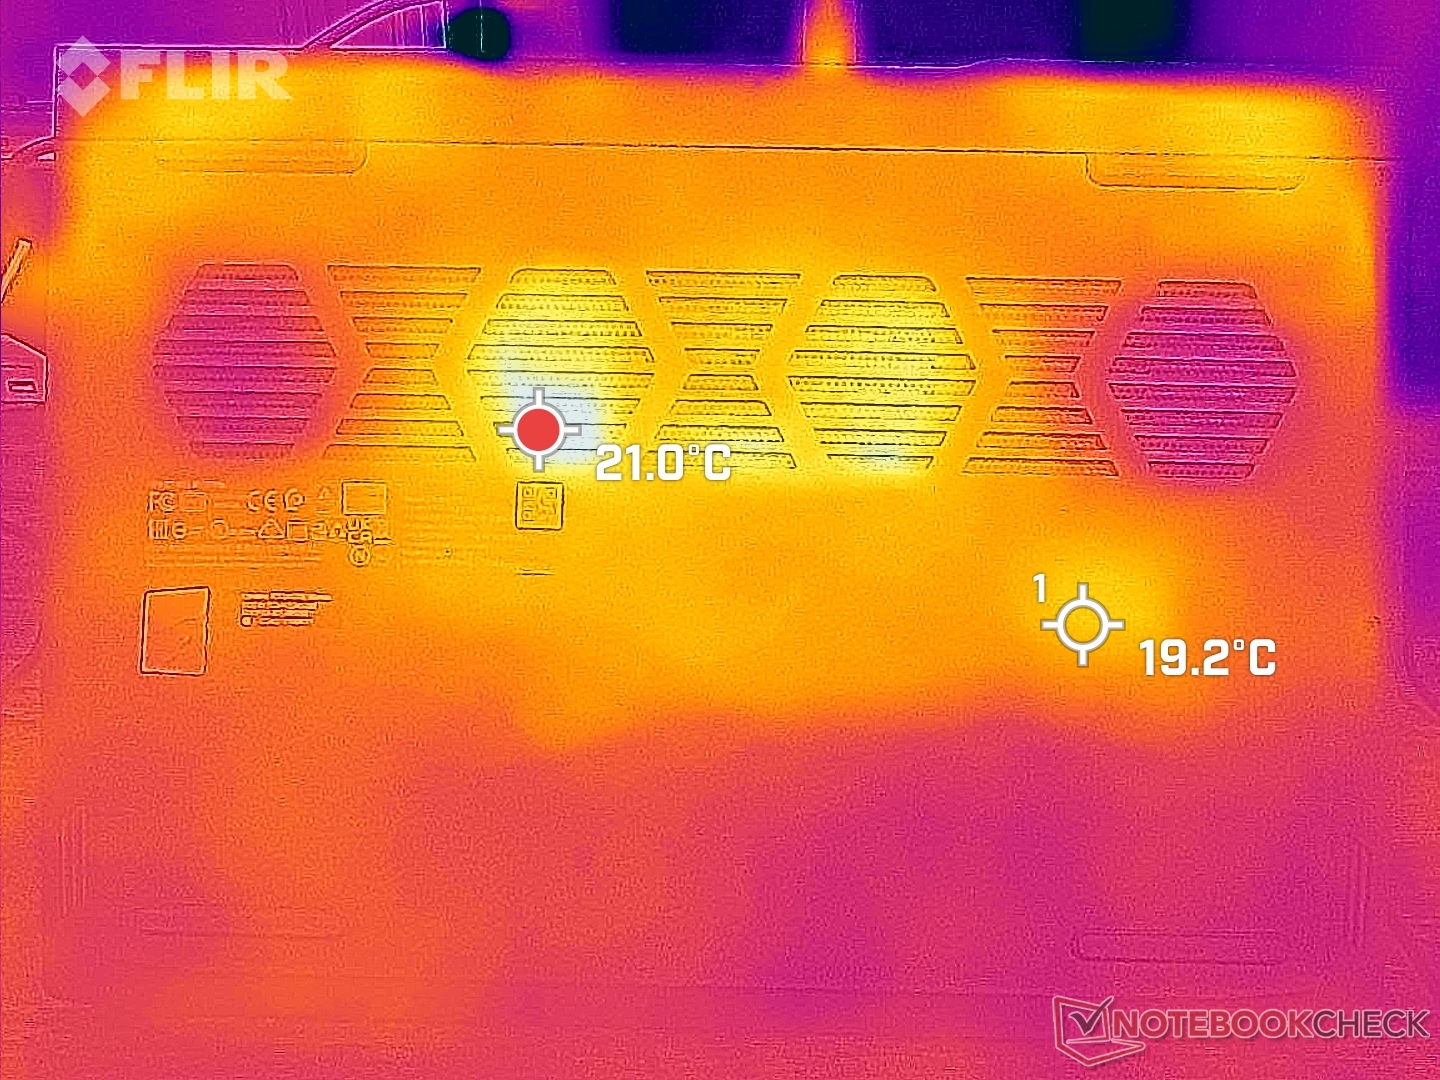
(-) Den maximala temperaturen på ovansidan är 47.6 °C / 118 F, jämfört med genomsnittet av 40.4 °C / 105 F , allt från 21.2 till 68.8 °C för klassen Gaming.
(-) Botten värms upp till maximalt 46.6 °C / 116 F, jämfört med genomsnittet av 43.2 °C / 110 F
(+) Vid tomgångsbruk är medeltemperaturen för ovansidan 25.7 °C / 78 F, jämfört med enhetsgenomsnittet på 33.9 °C / ### class_avg_f### F.
(±) När du spelar The Witcher 3 är medeltemperaturen för ovansidan 36.4 °C / 98 F, jämfört med enhetsgenomsnittet på 33.9 °C / ## #class_avg_f### F.
(+) Handledsstöden och pekplattan når maximal hudtemperatur (34.2 °C / 93.6 F) och är därför inte varma.
(-) Medeltemperaturen för handledsstödsområdet på liknande enheter var 28.8 °C / 83.8 F (-5.4 °C / -9.8 F).
| Lenovo IdeaPad Gaming 3 15ARH7 AMD Ryzen 5 6600H, NVIDIA GeForce RTX 3050 4GB Laptop GPU | Lenovo IdeaPad Gaming 3i 15IMH05 Intel Core i5-10300H, NVIDIA GeForce GTX 1650 Mobile | Lenovo Legion 5 15ACH6A-82NW0010GE AMD Ryzen 5 5600H, AMD Radeon RX 6600M | Gigabyte A5 K1 AMD Ryzen 5 5600H, NVIDIA GeForce RTX 3060 Laptop GPU | Asus TUF Dash F15 FX517ZR Intel Core i7-12650H, NVIDIA GeForce RTX 3070 Laptop GPU | Dell G15 5510 Intel Core i5-10500H, NVIDIA GeForce RTX 3050 4GB Laptop GPU | |
|---|---|---|---|---|---|---|
| Heat | 0% | -5% | -11% | -19% | -2% | |
| Maximum Upper Side * (°C) | 47.6 | 43 10% | 39.9 16% | 50 -5% | 52 -9% | 52 -9% |
| Maximum Bottom * (°C) | 46.6 | 50.6 -9% | 43.8 6% | 51 -9% | 52 -12% | 49 -5% |
| Idle Upper Side * (°C) | 27.2 | 27.2 -0% | 34.1 -25% | 30 -10% | 33 -21% | 26 4% |
| Idle Bottom * (°C) | 27.2 | 27.5 -1% | 31.7 -17% | 33 -21% | 36 -32% | 26 4% |
* ... mindre är bättre
Stresstest
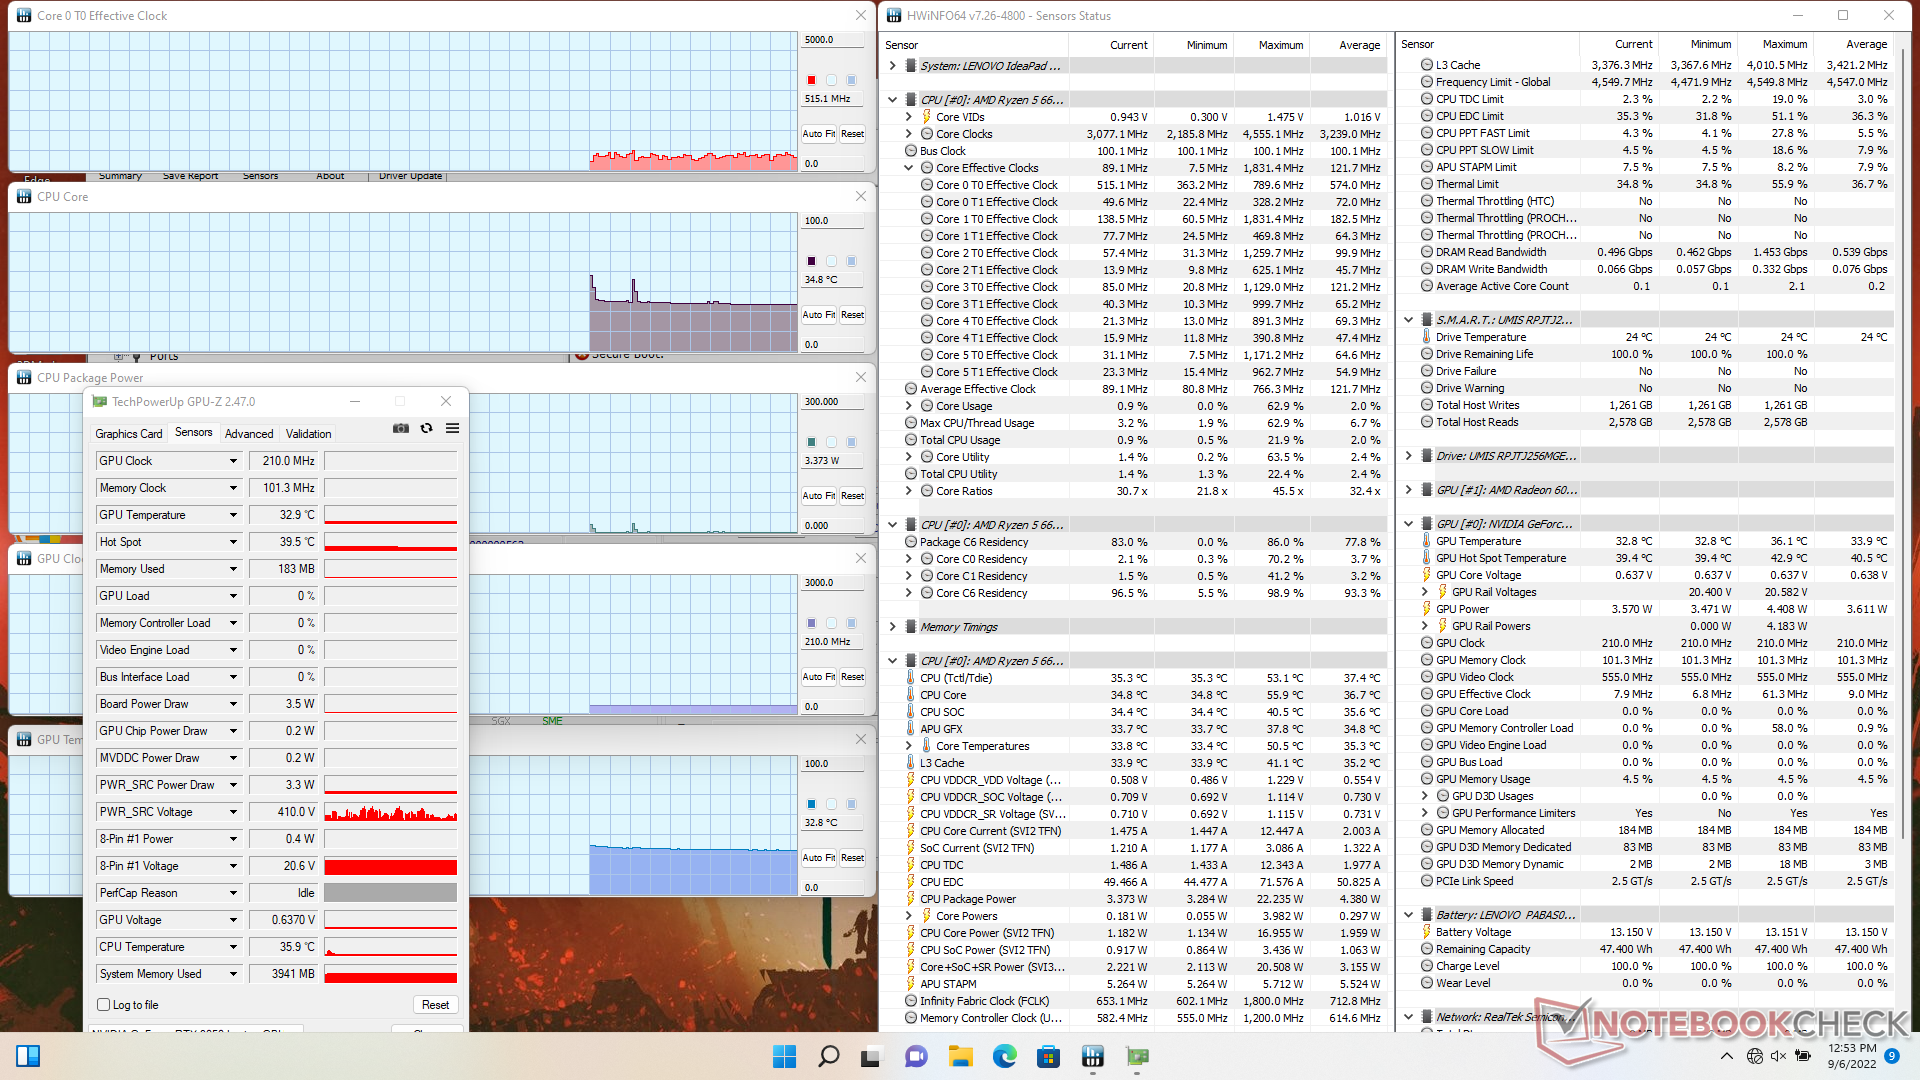
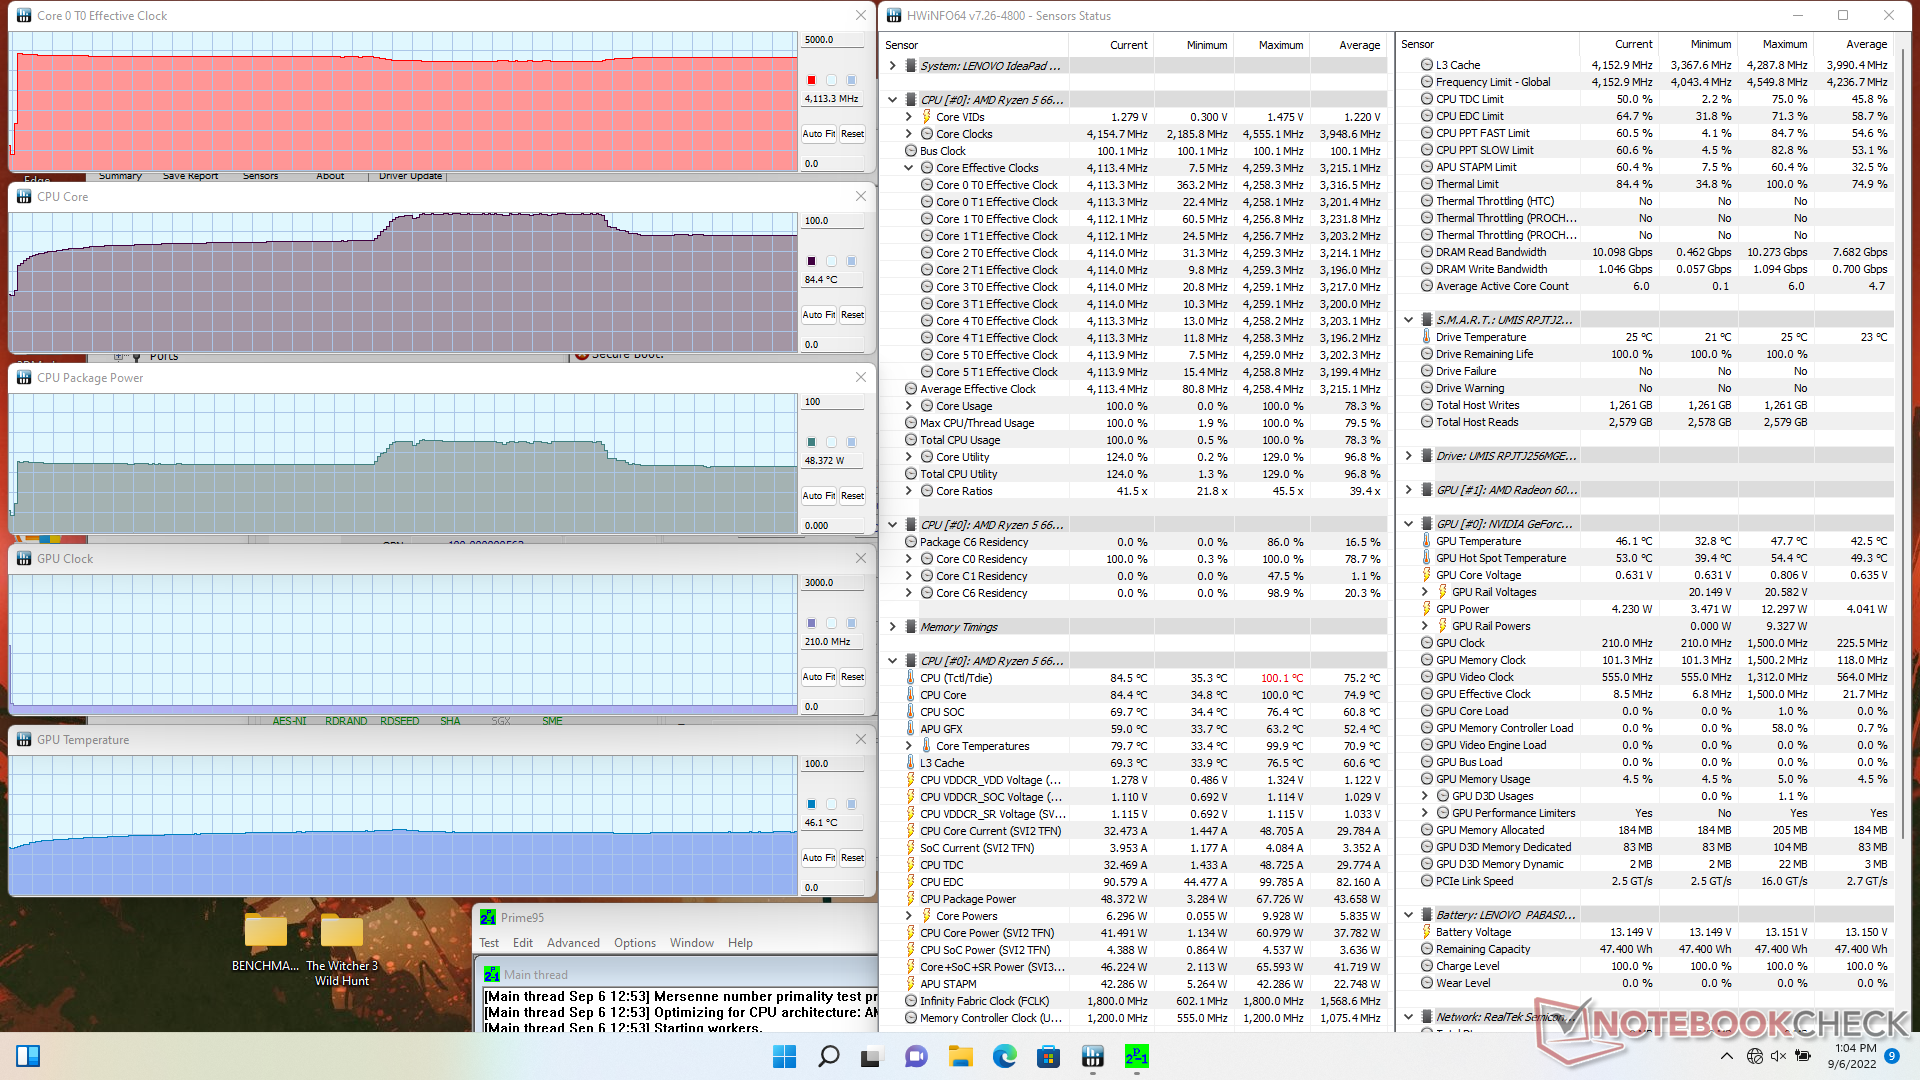
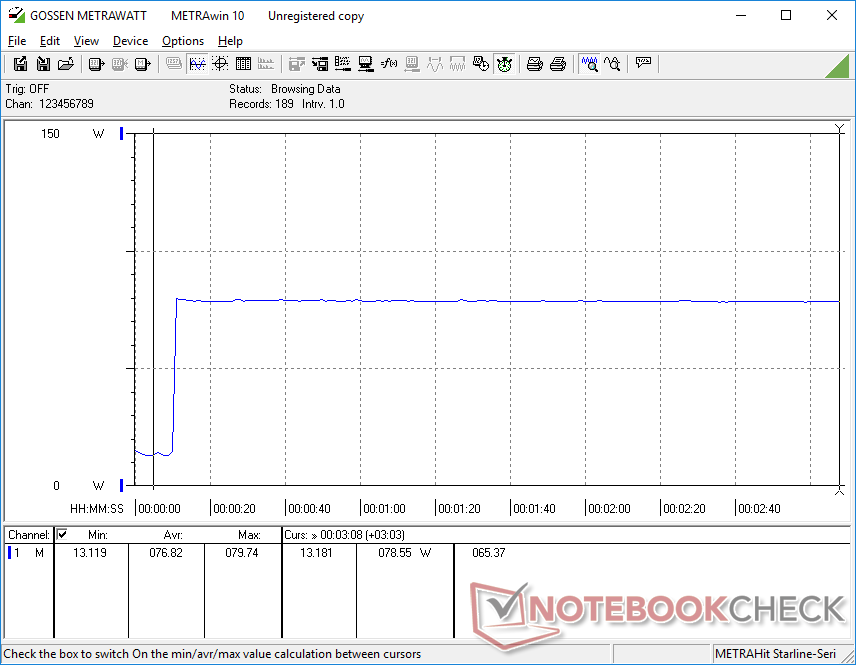
När Prime95 kördes för att stressa processorn, steg klockfrekvensen och temperaturen till 4,3 GHz respektive 70 C, med en strömförbrukning på 51 W. Intressant nog steg kärntemperaturen och strömförbrukningen på kortet efter några minuter till 67 W respektive 100 C, för att sedan sjunka tillbaka till 48 W och 84 C, vilket framgår av skärmdumpen nedan. Processorn drabbas inte av någon strypning även när den utsätts för 100 procent användning under långa perioder, vilket stämmer överens med våra CineBench R15 xT-resultat från ovan.
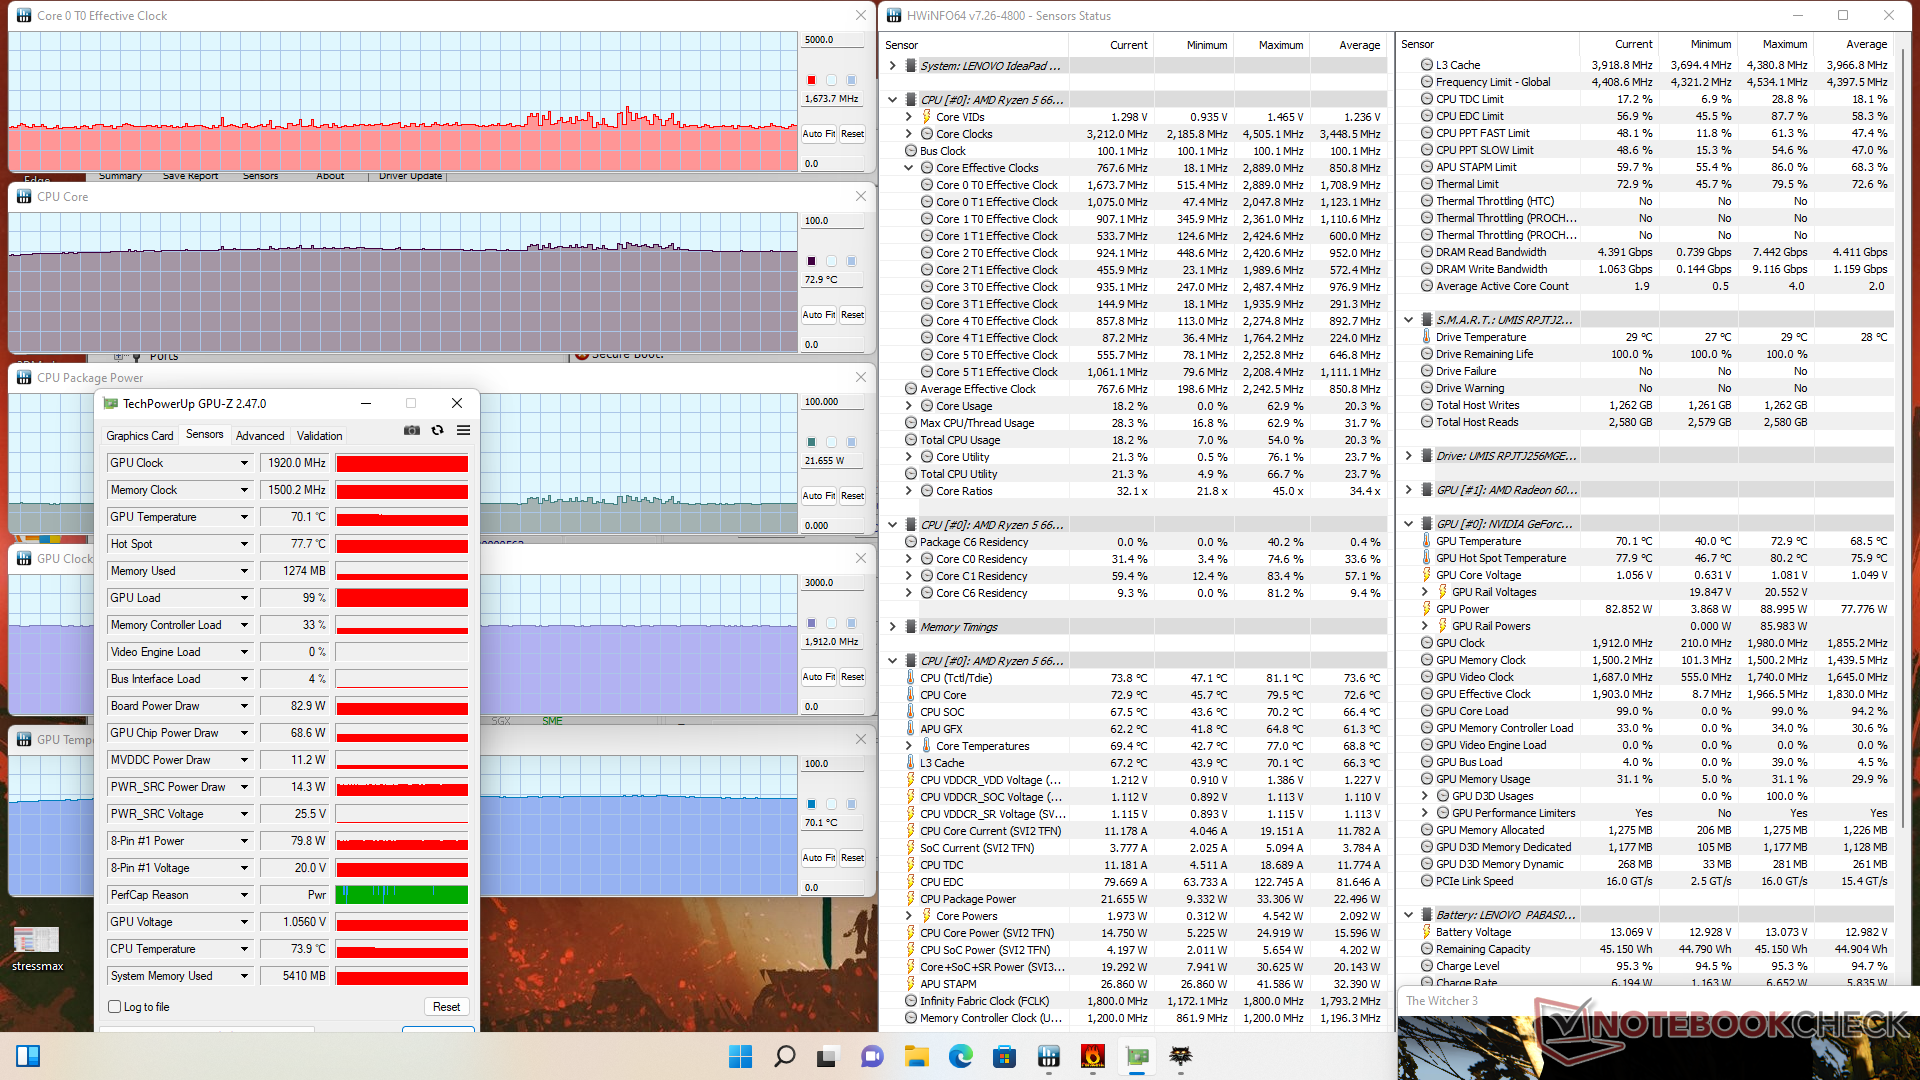
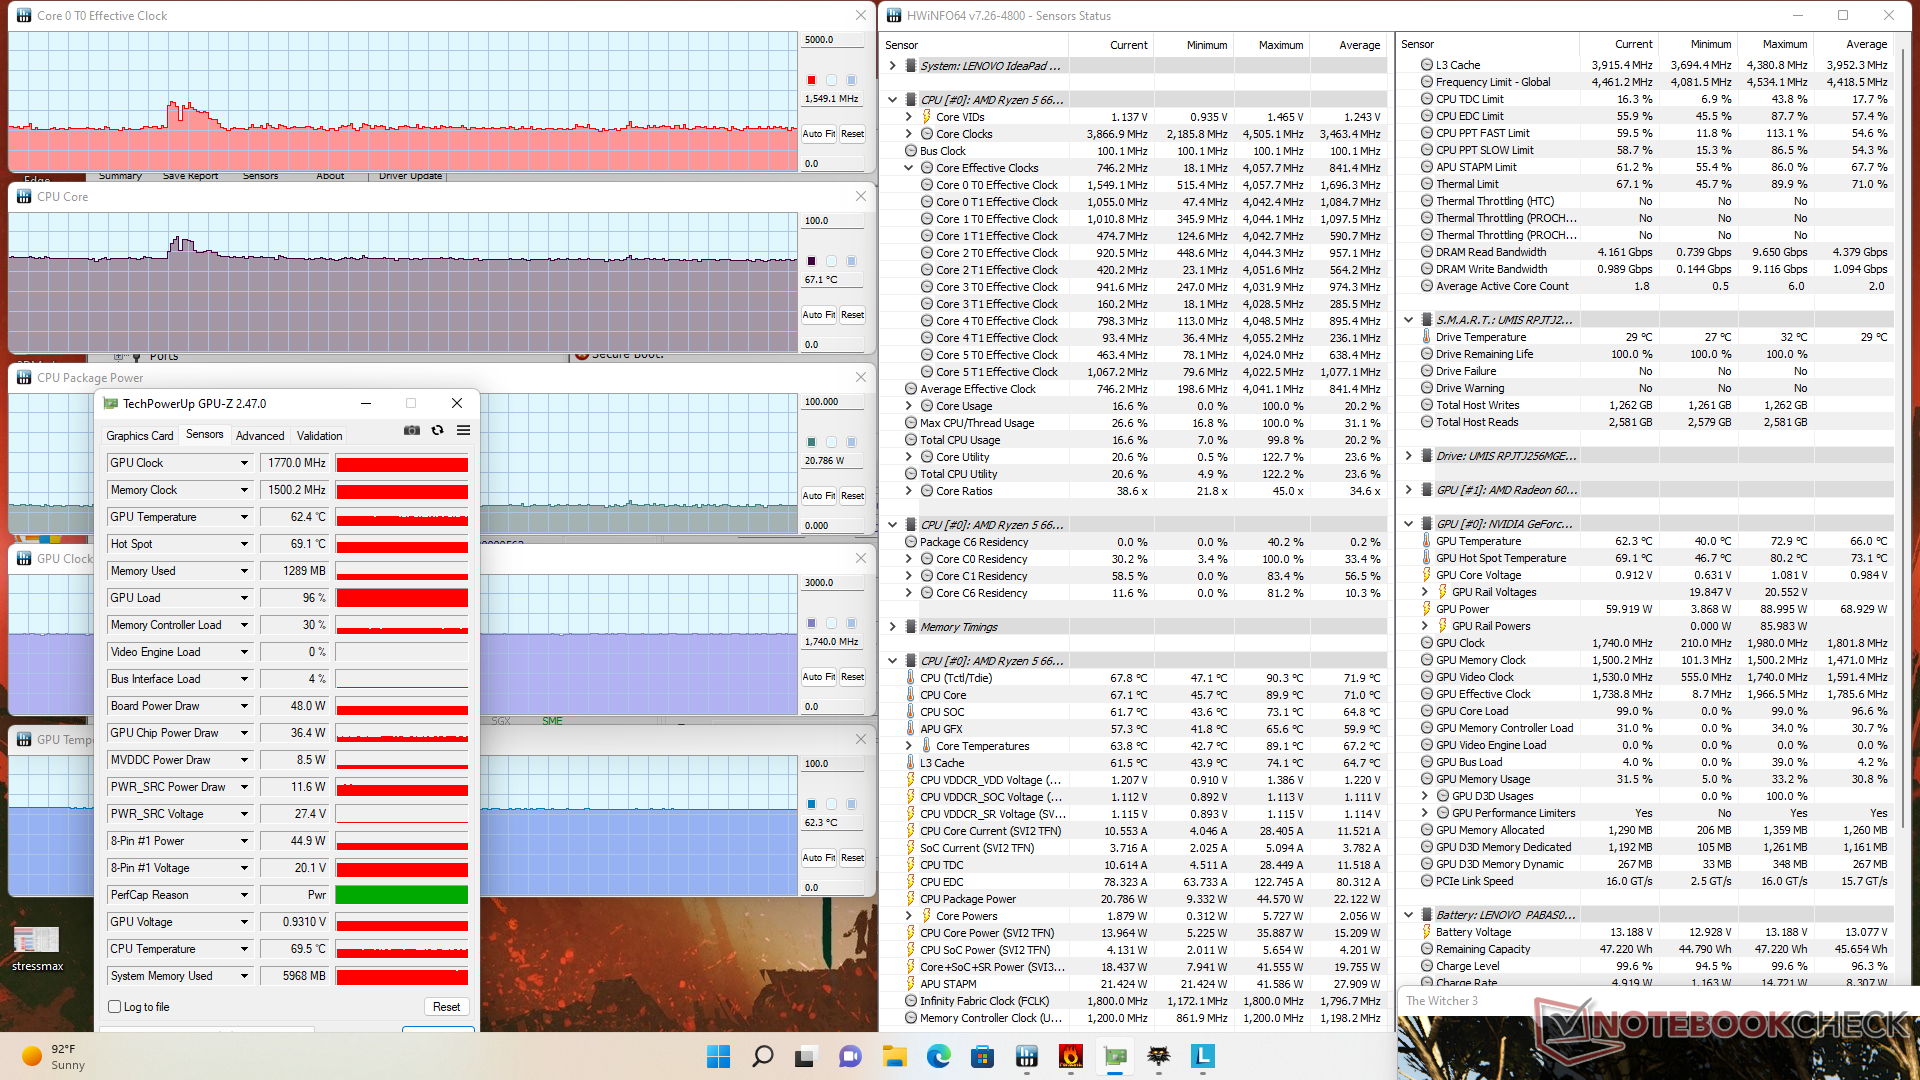
GPU-klockfrekvens, temperatur och strömförbrukning på kortet vid körning på batterier Witcher 3 i läget Performance skulle stabiliseras på 1920 MHz, 70 C och 83 W, jämfört med 1770 MHz, 62 C och 48 W i läget Balanced. Eftersom fläktljudet minskar i Balanced-läget måste användarna utstå det maximala fläktljudet från den bärbara datorn i Performance-läget om de vill utnyttja GPU:n till fullo.
Att köra på batterier begränsar GPU-kraften mer än CPU-kraften. Ett Fire Strike -test på batterier skulle ge fysik- och grafikpoäng 19770 respektive 9119 poäng, jämfört med 20214 och 14157 poäng när den är på strömförsörjning.
| CPU-klocka (GHz) | GPU-klocka (MHz) | Genomsnittlig CPU-temperatur (°C) | Genomsnittlig GPU-temperatur (°C) | |
| Systemets tomgång | -- | -- | 35 | 33 |
| Prime95 Stress | 4.0 - 4.1 | -- | 85 | 46 |
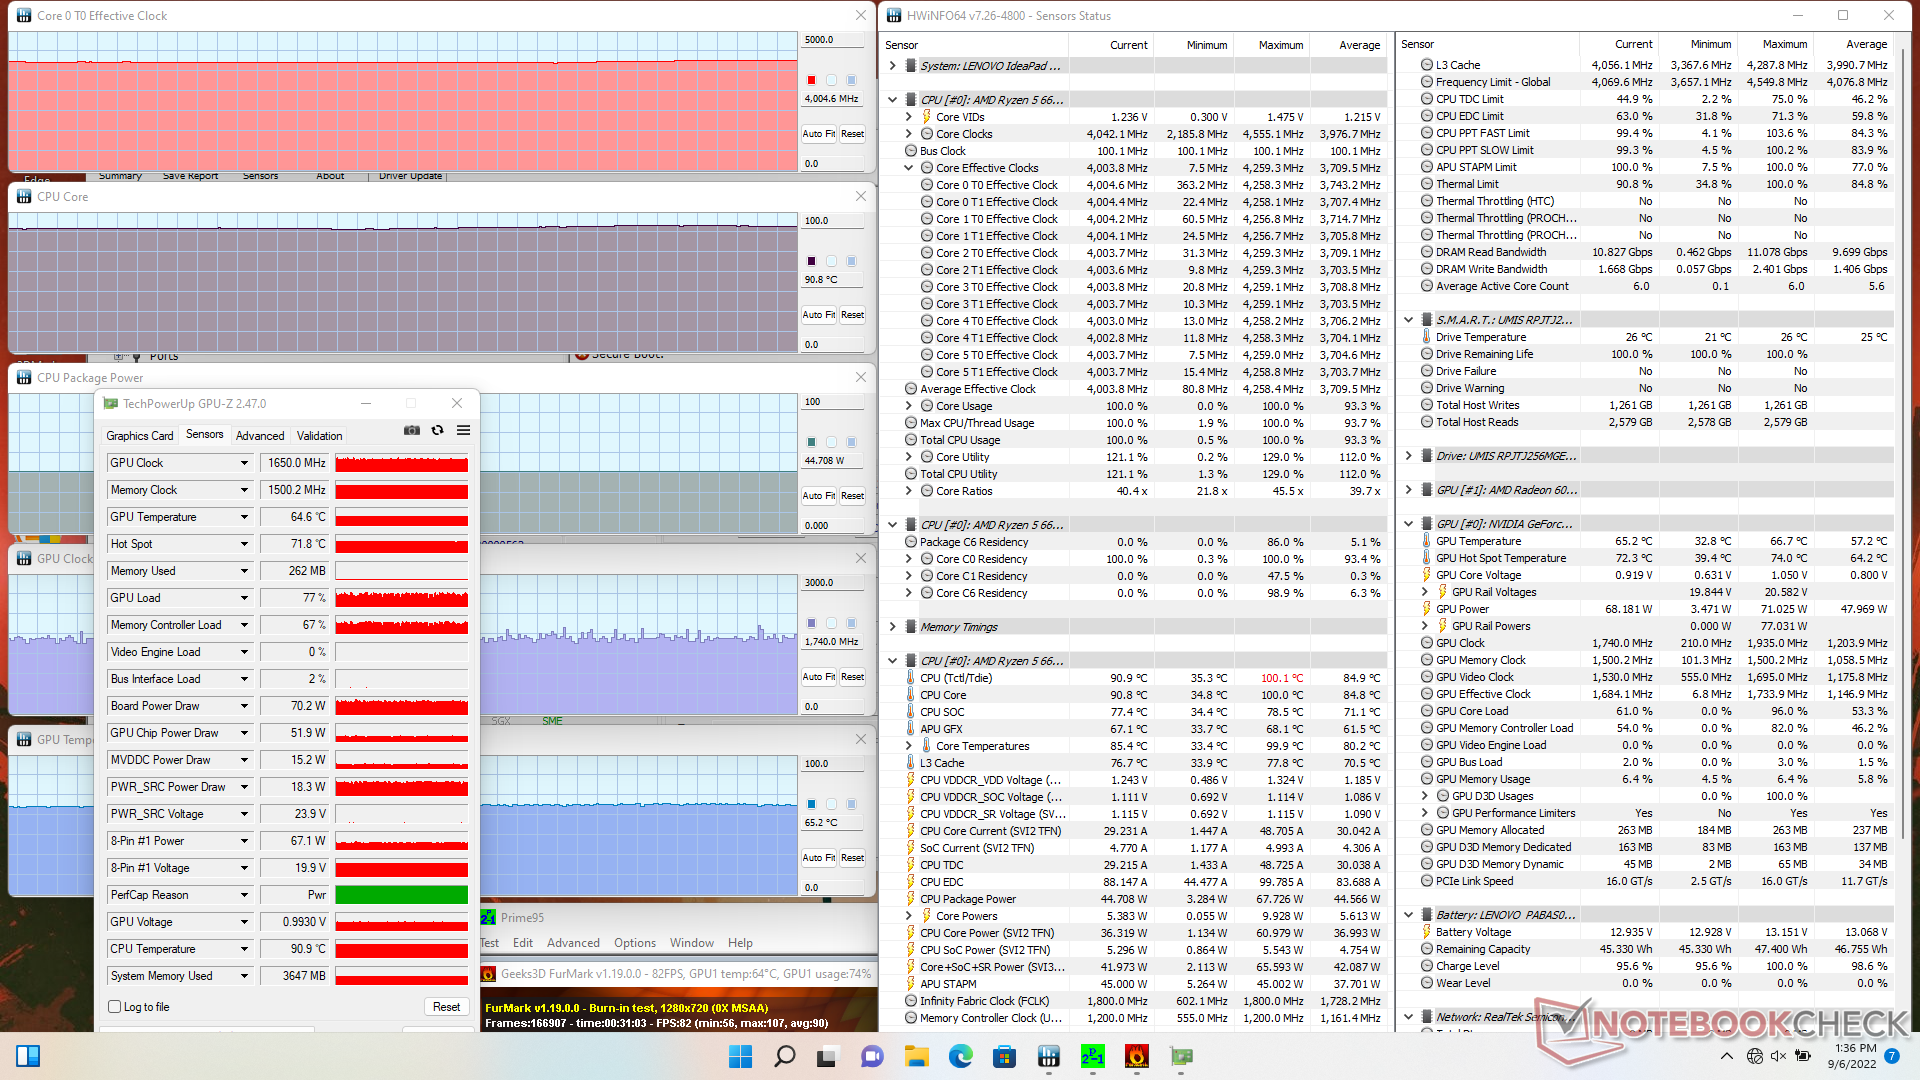
| Prime95 + FurMark Stress | 4.0 | 1650 | 91 | 65 |
| Witcher 3 Stress (prestationsläge) | 1,7 | 1920 | 73 | 70 |
| Witcher 3 Stress (balanserat läge) | 1,6 | 1770 | 67 | 62 |
Högtalare
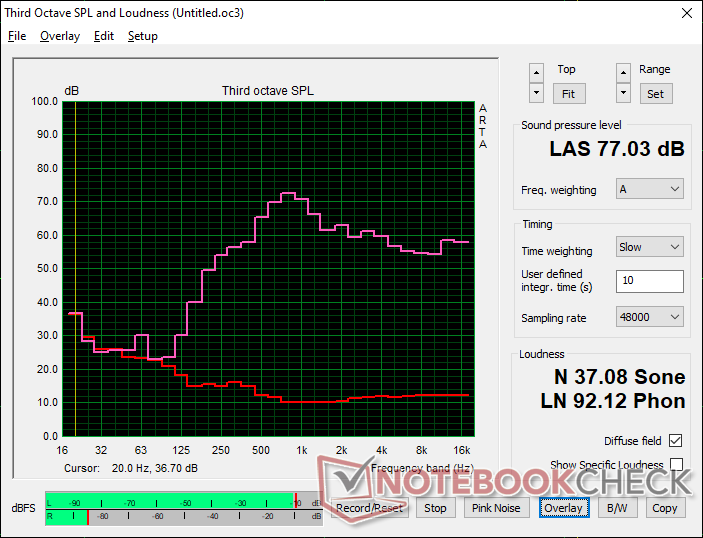
Lenovo IdeaPad Gaming 3 15ARH7 ljudanalys
(±) | högtalarljudstyrkan är genomsnittlig men bra (77 dB)
Bas 100 - 315 Hz
(-) | nästan ingen bas - i genomsnitt 15.6% lägre än medianen
(±) | linjäriteten för basen är genomsnittlig (12.2% delta till föregående frekvens)
Mellan 400 - 2000 Hz
(±) | högre mellan - i genomsnitt 8% högre än median
(±) | linjäriteten för mids är genomsnittlig (7.7% delta till föregående frekvens)
Högsta 2 - 16 kHz
(+) | balanserade toppar - endast 2.5% från medianen
(+) | toppar är linjära (3.8% delta till föregående frekvens)
Totalt 100 - 16 000 Hz
(±) | linjäriteten för det totala ljudet är genomsnittlig (18.8% skillnad mot median)
Jämfört med samma klass
» 62% av alla testade enheter i den här klassen var bättre, 8% liknande, 30% sämre
» Den bästa hade ett delta på 6%, genomsnittet var 18%, sämst var 132%
Jämfört med alla testade enheter
» 43% av alla testade enheter var bättre, 8% liknande, 49% sämre
» Den bästa hade ett delta på 4%, genomsnittet var 24%, sämst var 134%
Apple MacBook Pro 16 2021 M1 Pro ljudanalys
(+) | högtalare kan spela relativt högt (84.7 dB)
Bas 100 - 315 Hz
(+) | bra bas - bara 3.8% från medianen
(+) | basen är linjär (5.2% delta till föregående frekvens)
Mellan 400 - 2000 Hz
(+) | balanserad mellan - endast 1.3% från medianen
(+) | mids är linjära (2.1% delta till föregående frekvens)
Högsta 2 - 16 kHz
(+) | balanserade toppar - endast 1.9% från medianen
(+) | toppar är linjära (2.7% delta till föregående frekvens)
Totalt 100 - 16 000 Hz
(+) | det totala ljudet är linjärt (4.6% skillnad mot median)
Jämfört med samma klass
» 0% av alla testade enheter i den här klassen var bättre, 0% liknande, 100% sämre
» Den bästa hade ett delta på 5%, genomsnittet var 17%, sämst var 45%
Jämfört med alla testade enheter
» 0% av alla testade enheter var bättre, 0% liknande, 100% sämre
» Den bästa hade ett delta på 4%, genomsnittet var 24%, sämst var 134%
Energihantering - liknande den senaste generationen
Effektförbrukning
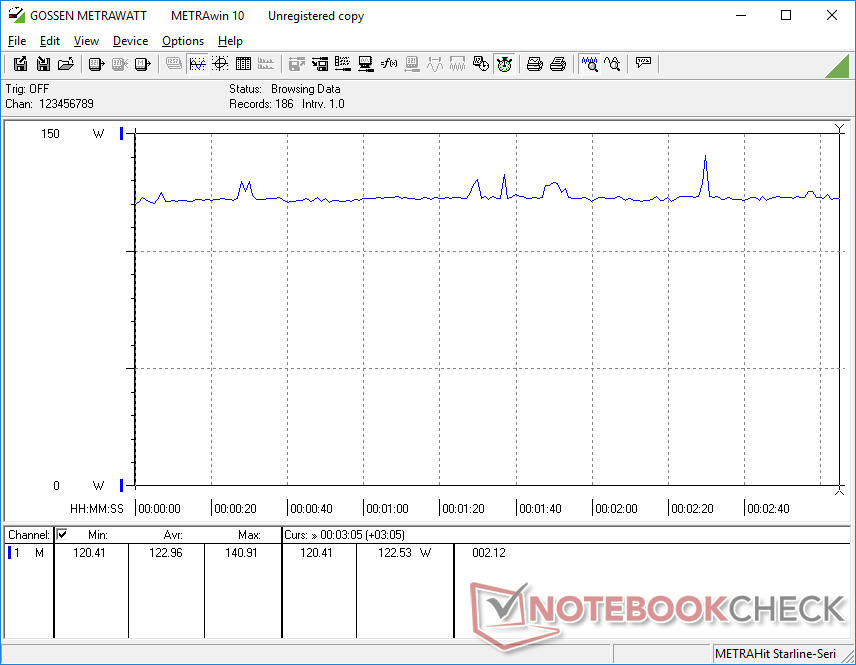
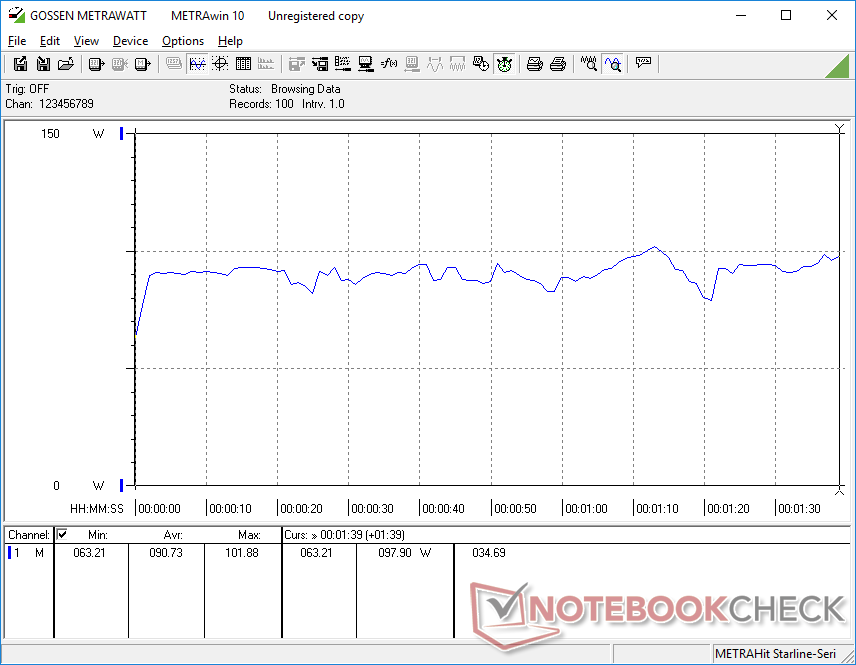
Förbrukningen varierar mellan 90 W och 123 W när du spelar, jämfört med 103 W och 140 W för Dell G5 5510 som har samma grafikprocessor men en 10:e generationens Core i5-10500H-processor. Förbrukningen är generellt sett lägre på vår Lenovo när den kör Prime95 också trots att den har en 40-procentig prestandaökning jämfört med Core i5 för överlägsen prestanda per watt. Den är dock inte effektivare än Ryzen 5 5600H vilket gör att 6600H känns ännu mer som en omprofilering.
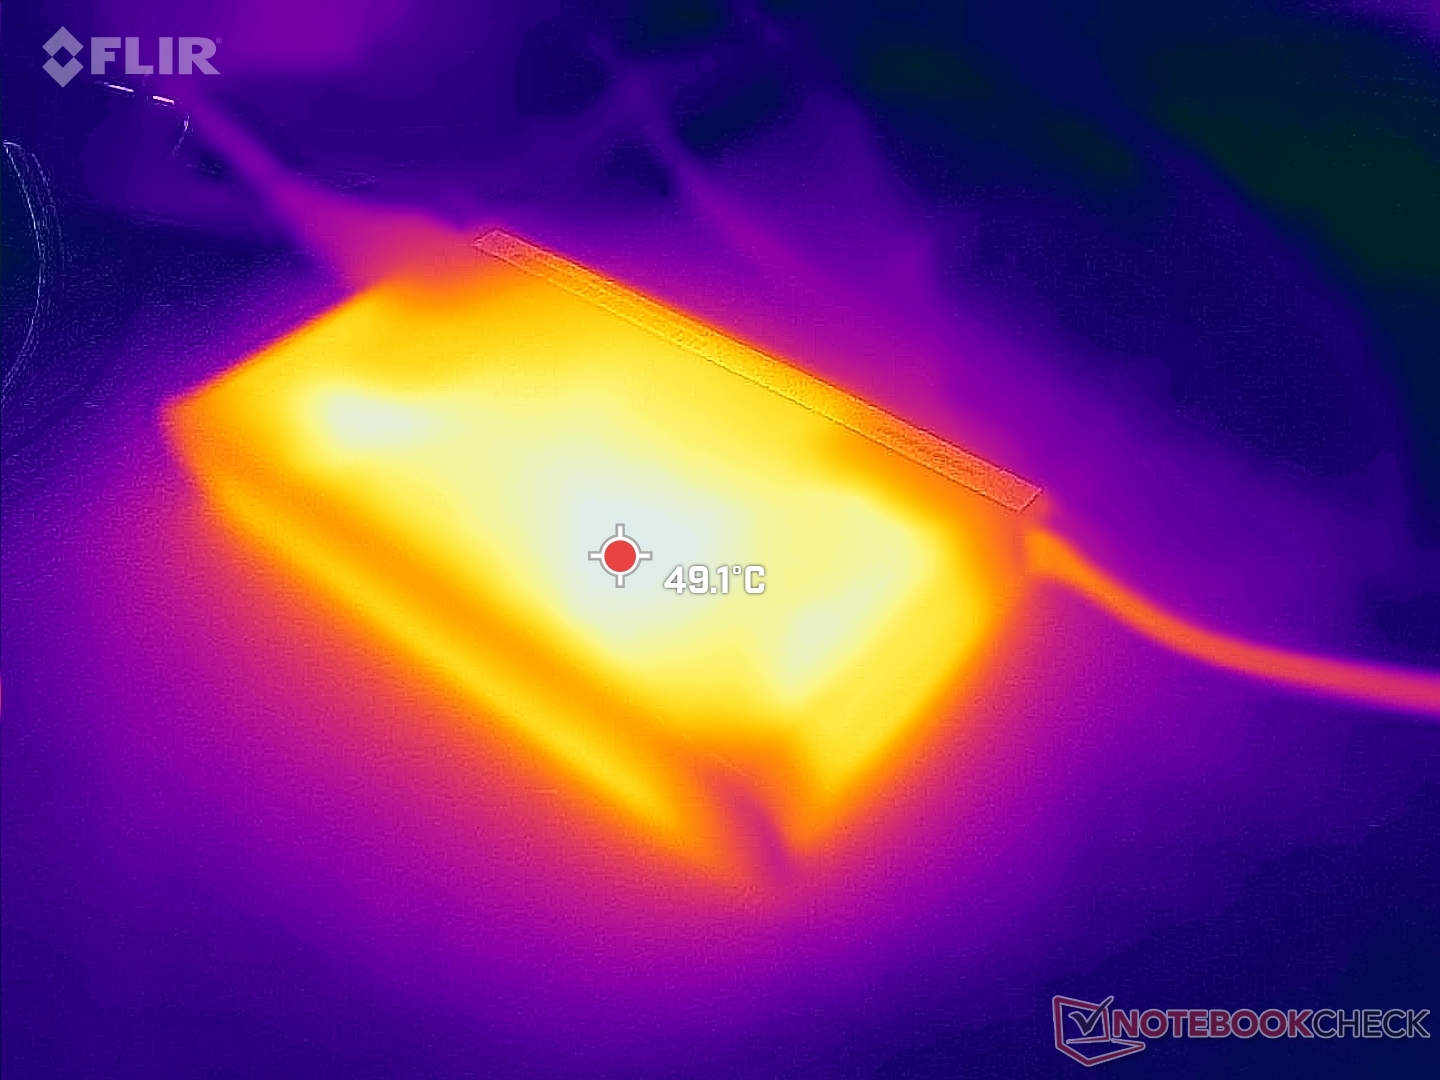
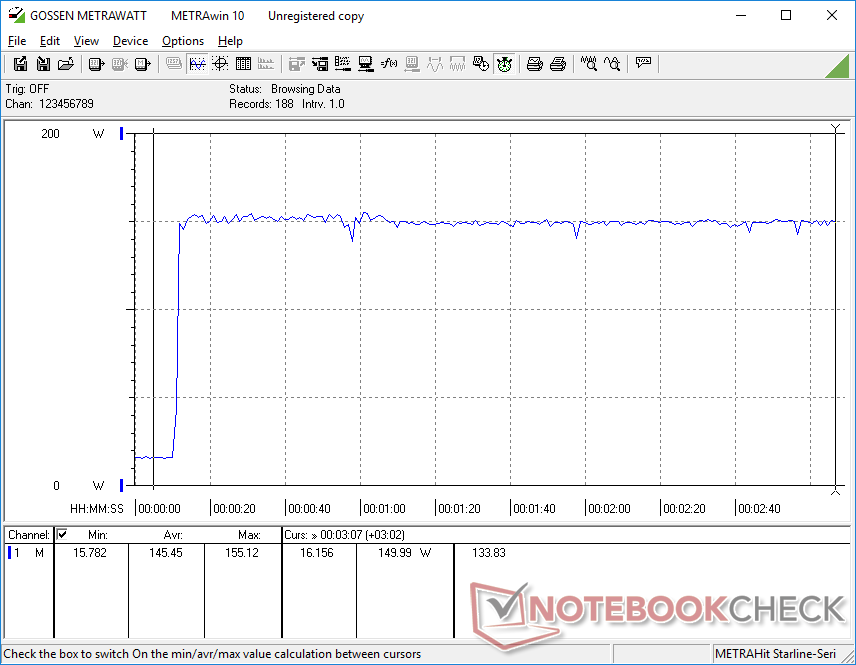
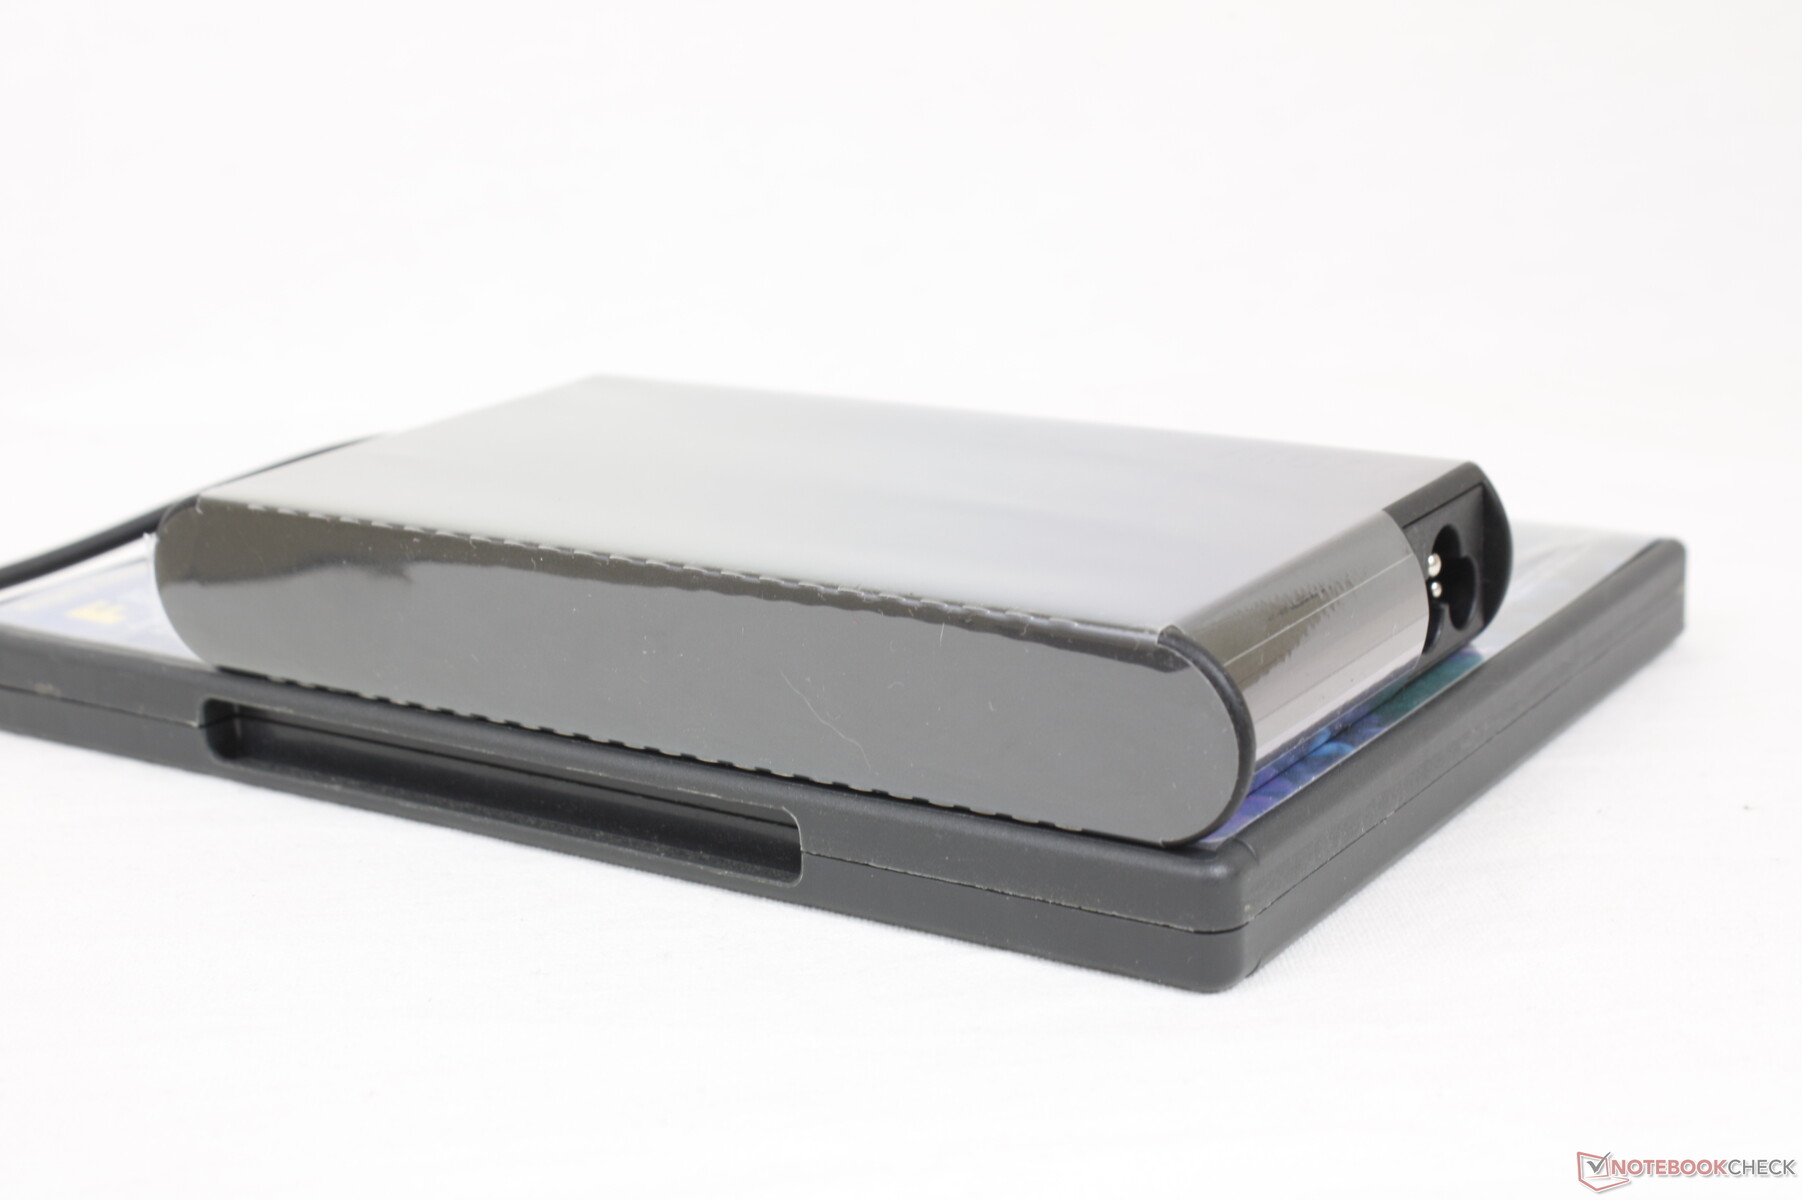
Vi kan mäta en maximal förbrukning på 156 W från den små-medelstora (~14,8 x 7,8 x 2,2 cm) 170 W AC-adaptern när vi kör Prime95 och FurMark samtidigt. Batteriladdningsnivån sjönk faktiskt från 100 procent till 95 procent under loppet av en halvtimme innan den återgick till 100 procent när vi avslutade stresstestet.
| Av/Standby | |
| Låg belastning | |
| Hög belastning |
|
Förklaring:
min: | |
| Lenovo IdeaPad Gaming 3 15ARH7 R5 6600H, GeForce RTX 3050 4GB Laptop GPU, Lenovo UMIS AM630 RPJTJ256MGE1QDY, IPS, 1920x1080, 15.6" | Lenovo IdeaPad Gaming 3i 15IMH05 i5-10300H, GeForce GTX 1650 Mobile, SK hynix BC511 HFM512GDHTNI-87A0B, IPS, 1920x1080, 15.6" | Lenovo Legion 5 15ACH6A-82NW0010GE R5 5600H, Radeon RX 6600M, Micron 2210 MTFDHBA512QFD, IPS, 1920x1080, 15.6" | Gigabyte A5 K1 R5 5600H, GeForce RTX 3060 Laptop GPU, ESR512GTLG-E6GBTNB4, IPS, 1920x1080, 15.6" | Asus TUF Dash F15 FX517ZR i7-12650H, GeForce RTX 3070 Laptop GPU, Samsung PM991a MZVLQ1T0HBLB, IPS, 2560x1440, 15.6" | Dell G15 5510 i5-10500H, GeForce RTX 3050 4GB Laptop GPU, SK Hynix BC711 HFM512GD3HX015N, IPS, 1920x1080, 15.6" | |
|---|---|---|---|---|---|---|
| Power Consumption | 8% | -39% | -34% | -30% | 5% | |
| Idle Minimum * (Watt) | 7.7 | 5.1 34% | 10 -30% | 10 -30% | 10 -30% | 3 61% |
| Idle Average * (Watt) | 9.1 | 8.2 10% | 13.2 -45% | 12 -32% | 14 -54% | 8 12% |
| Idle Maximum * (Watt) | 15.6 | 10.6 32% | 15.6 -0% | 17 -9% | 20 -28% | 13 17% |
| Load Average * (Watt) | 90.7 | 128 -41% | 178 -96% | 113 -25% | 122 -35% | 103 -14% |
| Witcher 3 ultra * (Watt) | 122.9 | 109 11% | 181 -47% | 181.4 -48% | 138.6 -13% | 139.5 -14% |
| Load Maximum * (Watt) | 155.2 | 150 3% | 180 -16% | 245 -58% | 189 -22% | 204 -31% |
* ... mindre är bättre
Power Consumption Witcher 3 / Stresstest
Power Consumption external Monitor
Batteritid
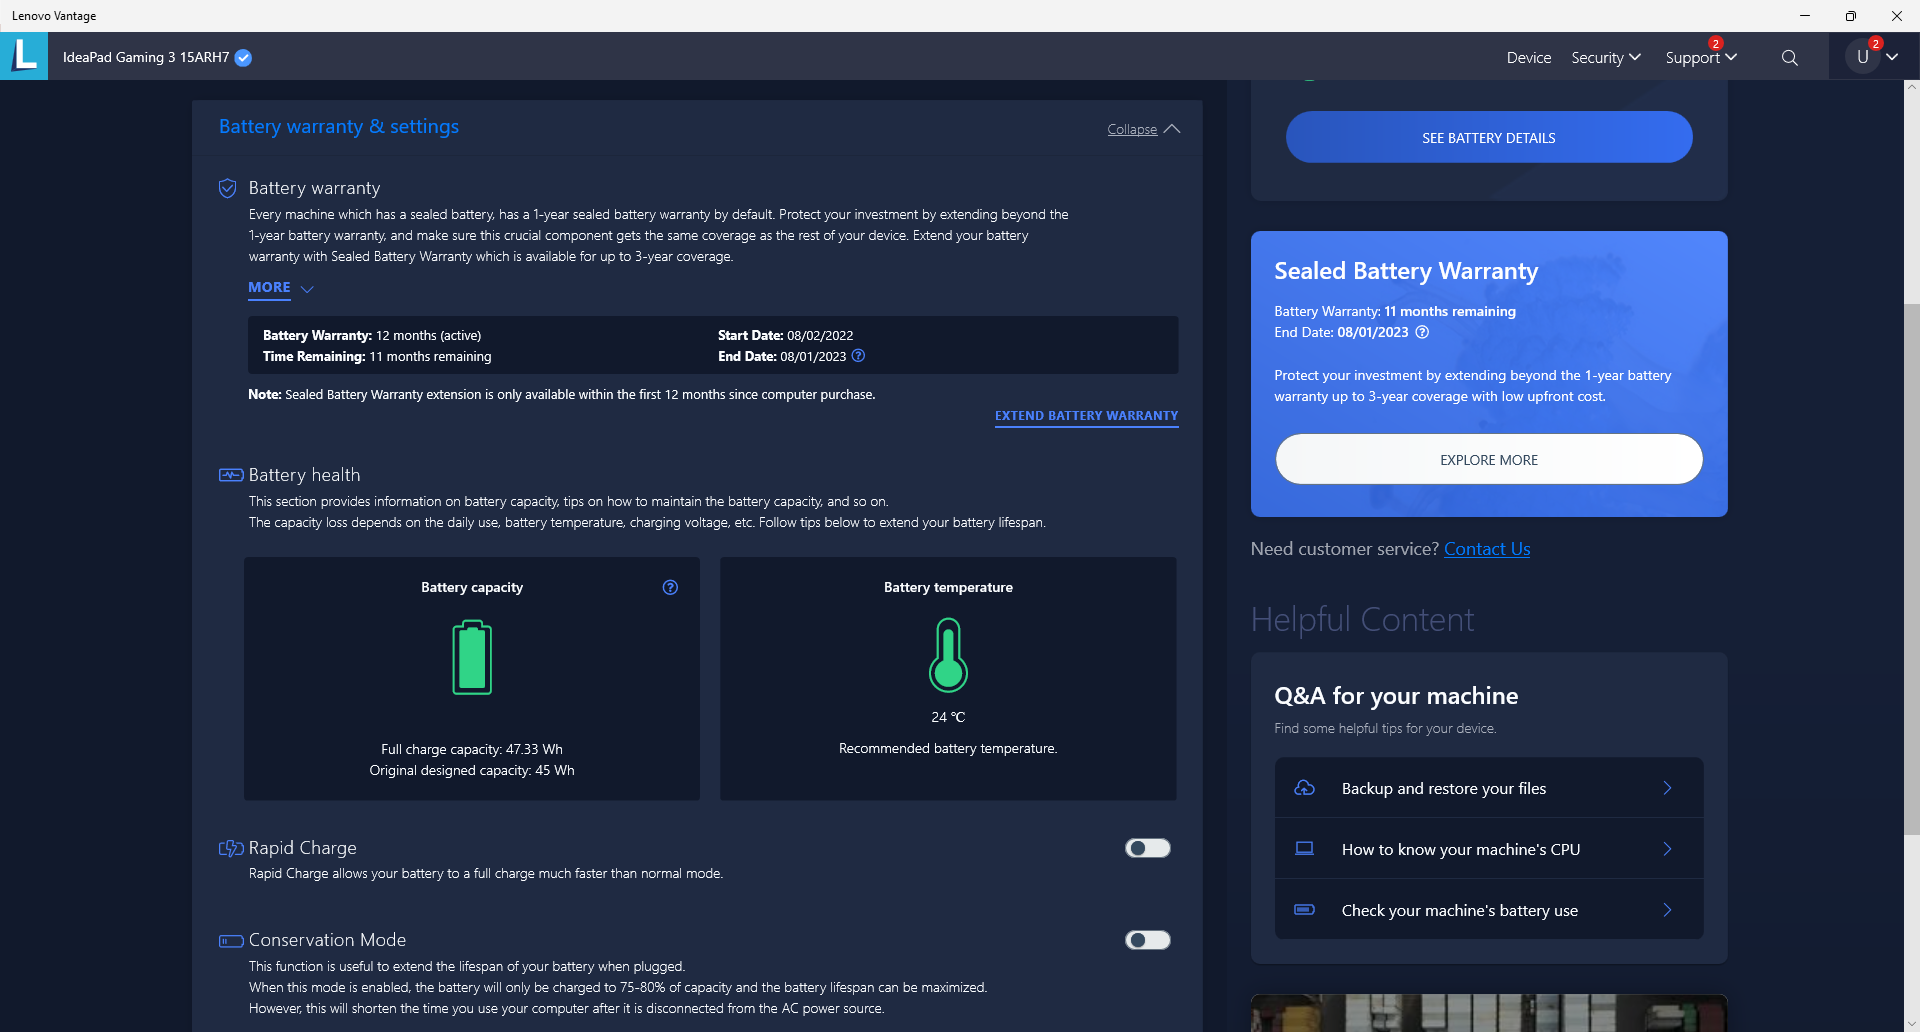
Batterikapaciteten är liten med bara 45 Wh vilket är ett typiskt intervall för bärbara speldatorer med budgetpris. Webbsurfning i den verkliga världen på den balanserade energiprofilen med den integrerade GPU:n aktiv skulle räcka i ungefär 6,5 timmar innan den behöver laddas upp, ungefär som vi observerade påIdeaPad Gaming 3i.
Det tar cirka 1,5 till 2 timmar att ladda från tom till fulladdad med den medföljande egenutvecklade nätadaptern. Vi kan bekräfta att de flesta USB-C-laddare också kan ladda systemet.
Vi bör nämna att batteritiden i energisparläge (eller Lenovo Quiet-läge) med iGPU aktiv och skärmens ljusstyrka inställd på minimum är ovanligt kort, endast 2 timmar och 22 minuter. Vi upprepade det här testet för att vara säkra och resultaten skulle inte förändras. Det är möjligt att systemet lider av ett fel i energiförbrukningen när det gäller vissa inställningar och batteritillstånd.
| Lenovo IdeaPad Gaming 3 15ARH7 R5 6600H, GeForce RTX 3050 4GB Laptop GPU, 45 Wh | Lenovo IdeaPad Gaming 3i 15IMH05 i5-10300H, GeForce GTX 1650 Mobile, 45 Wh | Lenovo Legion 5 15ACH6A-82NW0010GE R5 5600H, Radeon RX 6600M, 80 Wh | Gigabyte A5 K1 R5 5600H, GeForce RTX 3060 Laptop GPU, 48.96 Wh | Asus TUF Dash F15 FX517ZR i7-12650H, GeForce RTX 3070 Laptop GPU, 76 Wh | Dell G15 5510 i5-10500H, GeForce RTX 3050 4GB Laptop GPU, 56 Wh | |
|---|---|---|---|---|---|---|
| Batteridrifttid | 171% | 199% | 6% | 171% | 125% | |
| Reader / Idle (h) | 2.4 | 12.4 417% | 12.8 433% | 10.8 350% | 11.3 371% | |
| WiFi v1.3 (h) | 6.5 | 6.3 -3% | 9.2 42% | 6.9 6% | 7 8% | 6 -8% |
| Load (h) | 0.9 | 1.8 100% | 2 122% | 2.3 156% | 1 11% | |
| H.264 (h) | 7.3 | 5.8 |
För
Emot
Omdöme - Den nya Ryzen 5 6600U-processorn erbjuder inte mycket för bärbara speldatorer
Den största skillnaden mellan Ryzen 5 5600H och Ryzen 5 6600H är att den förstnämnda levereras med integrerad Radeon RX Vega-grafik medan den sistnämnda levereras med integrerad Radeon 660M för betydligt snabbare iGPU-prestanda. I övrigt är de två processorerna nästan identiska när det gäller CPU-prestanda. Problemet med detta på bärbara speldatorer är att nästan alla bärbara spelmodeller redan levereras med snabbare diskret grafik som gör den integrerade lösningen nästan värdelös i de allra flesta fall. För att maximera spelprestandan vill du alltså hoppa över Radeon 660M eller 680M och istället sikta på en snabbare grafikprocessor som t.ex RTX 3060 även om det innebär att du får nöja dig med en Ryzen 5 5600H eller en Ryzen 5 5600H från förra generationen Ryzen 7 5800H AMD CPU.
Ryzen 5 6600H är därför bäst på bärbara datorer och minidatorer utan något dedikerat GPU-alternativ. Det är först då som prestandan och effektiviteten hos den integrerade Radeon 660M verkligen kan glänsa.
När det gäller själva den bärbara datorn från Lenovo förtjänar den verkligen beröm för sina stora piltangenter, sitt låga utgångspris och sin standard 120 Hz 1080p IPS-skärm med både FreeSync och hyfsade svarstider. Färgerna är dåliga, men det är en vanlig nackdel på billiga bärbara datorer för spel som denna. Vår mest avgörande kritik handlar istället om den bärbara datorns svåra servicevänlighet och tunga vikt. Budgetalternativ som t.ex MSI GF63, Acer Nitro 5, HP Pavilion Gaming 15, eller Asus TUF Dash serien är alla lättare och lättare att uppgradera. Att försöka lägga till mer RAM-minne eller lagringsutrymme i IdeaPad Gaming 3 är irriterande mer besvärligt i jämförelse.
Pris och tillgänglighet
Lenovo IdeaPad Gaming 3 15ARH7 är nu allmänt tillgänglig hos stora återförsäljare online som Walmart, Best Buyoch Amazon för 969 USD. Observera att dessa SKU:er alla levereras med den något snabbare GeForce RTX 3050 Ti GPU:n istället för RTX 3050. Vår konfiguration med RTX 3050 är inte alls lika vanlig för tillfället.
Lenovo IdeaPad Gaming 3 15ARH7
- 09/09/2022 v7 (old)
Allen Ngo
Price comparison

