Test: HP Pavilion Gaming 15 - Billig spellaptop med bra batteritid (Sammanfattning)
Gradering | Datum | Modell | Vikt | Höjd | Storlek | Upplösning | Pris |
|---|---|---|---|---|---|---|---|
| 81.2 % v7 (old) | 08/2020 | HP Pavilion Gaming 15-ec1206ng R5 4600H, GeForce GTX 1650 Mobile | 2.1 kg | 23.5 mm | 15.60" | 1920x1080 | |
| 81.2 % v7 (old) | Nexoc GH5 515IG i5-10300H, GeForce GTX 1650 Mobile | 2.1 kg | 24.9 mm | 15.60" | 1920x1080 | ||
| 78.4 % v7 (old) | 08/2020 | Lenovo IdeaPad Gaming 3i 15IMH05 i5-10300H, GeForce GTX 1650 Mobile | 2.2 kg | 24.9 mm | 15.60" | 1920x1080 | |
| 80.4 % v6 (old) | 07/2019 | Asus TUF FX505DT-EB73 R7 3750H, GeForce GTX 1650 Mobile | 2.2 kg | 26.8 mm | 15.60" | 1920x1080 | |
| 79.6 % v7 (old) | 11/2019 | Dell G5 15 5590-PCNJJ i5-9300H, GeForce GTX 1650 Mobile | 2.7 kg | 23.7 mm | 15.60" | 1920x1080 | |
| 79.8 % v7 (old) | 07/2020 | Acer Nitro 5 AN515-44-R5FT R5 4600H, GeForce GTX 1650 Ti Mobile | 2.2 kg | 24 mm | 15.60" | 1920x1080 | |
| 79.5 % v7 (old) | MSI Bravo 15 A4DCR R7 4800H, Radeon RX 5300M | 2 kg | 22 mm | 15.60" | 1920x1080 |
| SD Card Reader | |
| average JPG Copy Test (av. of 3 runs) | |
| Genomsnitt av klass Gaming (20.9 - 210, n=55, senaste 2 åren) | |
| Nexoc GH5 515IG (Toshiba Exceria Pro SDXC 64 GB UHS-II) | |
| HP Pavilion Gaming 15-ec1206ng (Toshiba Exceria Pro SDXC 64 GB UHS-II) | |
| HP Pavilion Gaming 15-ec0002ng (Toshiba Exceria Pro SDXC 64 GB UHS-II) | |
| Dell G5 15 5590-PCNJJ (Toshiba Exceria Pro SDXC 64 GB UHS-II) | |
| maximum AS SSD Seq Read Test (1GB) | |
| Genomsnitt av klass Gaming (25.5 - 261, n=52, senaste 2 åren) | |
| Nexoc GH5 515IG (Toshiba Exceria Pro SDXC 64 GB UHS-II) | |
| HP Pavilion Gaming 15-ec0002ng (Toshiba Exceria Pro SDXC 64 GB UHS-II) | |
| HP Pavilion Gaming 15-ec1206ng (Toshiba Exceria Pro SDXC 64 GB UHS-II) | |
| Dell G5 15 5590-PCNJJ (Toshiba Exceria Pro SDXC 64 GB UHS-II) | |
| Networking | |
| iperf3 transmit AX12 | |
| Nexoc GH5 515IG | |
| Acer Nitro 5 AN515-44-R5FT | |
| MSI Bravo 15 A4DCR | |
| Dell G5 15 5590-PCNJJ | |
| HP Pavilion Gaming 15-ec0002ng | |
| HP Pavilion Gaming 15-ec1206ng | |
| Lenovo IdeaPad Gaming 3i 15IMH05 | |
| Asus TUF FX505DT-EB73 | |
| iperf3 receive AX12 | |
| Nexoc GH5 515IG | |
| Acer Nitro 5 AN515-44-R5FT | |
| MSI Bravo 15 A4DCR | |
| Dell G5 15 5590-PCNJJ | |
| HP Pavilion Gaming 15-ec1206ng | |
| Lenovo IdeaPad Gaming 3i 15IMH05 | |
| HP Pavilion Gaming 15-ec0002ng | |
| Asus TUF FX505DT-EB73 | |


| |||||||||||||||||||||||||
Distribution av ljusstyrkan: 83 %
Mitt på batteriet: 277 cd/m²
Kontrast: 1731:1 (Svärta: 0.16 cd/m²)
ΔE ColorChecker Calman: 3.6 | ∀{0.5-29.43 Ø4.73}
calibrated: 2.88
ΔE Greyscale Calman: 1.75 | ∀{0.09-98 Ø4.97}
62% sRGB (Argyll 1.6.3 3D)
39% AdobeRGB 1998 (Argyll 1.6.3 3D)
42.76% AdobeRGB 1998 (Argyll 3D)
62% sRGB (Argyll 3D)
41.36% Display P3 (Argyll 3D)
Gamma: 2.23
CCT: 6695 K
| HP Pavilion Gaming 15-ec1206ng Chi Mei CMN150D, IPS, 1920x1080, 15.6" | HP Pavilion Gaming 15-ec0002ng Chi Mei N156HGA-EA3, TN LED, 1920x1080, 15.6" | Nexoc GH5 515IG LG Philips LP156WFC-SPD1, IPS, 1920x1080, 15.6" | Lenovo IdeaPad Gaming 3i 15IMH05 BOE CQ NV156FHM-NX1, IPS, 1920x1080, 15.6" | Asus TUF FX505DT-EB73 Panda LM156LF-GL, IPS, 1920x1080, 15.6" | Dell G5 15 5590-PCNJJ AU Optronics B156HAN (AUO23ED), IPS, 1920x1080, 15.6" | Acer Nitro 5 AN515-44-R5FT Panda LM156LF-2F01 (NCP004D), IPS, 1920x1080, 15.6" | MSI Bravo 15 A4DCR AU Optronics B156HAN08.0 (AUO80ED), IPS-Level, 1920x1080, 15.6" | |
|---|---|---|---|---|---|---|---|---|
| Display | 0% | -8% | -8% | -4% | 96% | 0% | 46% | |
| Display P3 Coverage (%) | 41.36 | 41.22 0% | 37.91 -8% | 38.04 -8% | 39.56 -4% | 83.1 101% | 41.16 0% | 62 50% |
| sRGB Coverage (%) | 62 | 61.8 0% | 57 -8% | 56.6 -9% | 59.5 -4% | 99.9 61% | 61.8 0% | 86.8 40% |
| AdobeRGB 1998 Coverage (%) | 42.76 | 42.62 0% | 39.19 -8% | 39.3 -8% | 40.91 -4% | 96.8 126% | 42.56 0% | 62.7 47% |
| Response Times | 1% | -9% | 25% | -7% | -39% | -28% | 53% | |
| Response Time Grey 50% / Grey 80% * (ms) | 33.6 ? | 44 ? -31% | 34.8 ? -4% | 25 ? 26% | 30.4 ? 10% | 48 ? -43% | 40.8 ? -21% | 16 ? 52% |
| Response Time Black / White * (ms) | 22.4 ? | 15 ? 33% | 25.2 ? -13% | 17 ? 24% | 27.6 ? -23% | 30 ? -34% | 30 ? -34% | 10.4 ? 54% |
| PWM Frequency (Hz) | 24750 ? | 250 ? | ||||||
| Screen | -98% | -18% | -55% | -52% | -41% | -26% | -16% | |
| Brightness middle (cd/m²) | 277 | 233 -16% | 261 -6% | 305 10% | 286.2 3% | 234 -16% | 287 4% | 311 12% |
| Brightness (cd/m²) | 248 | 211 -15% | 254 2% | 294 19% | 267 8% | 216 -13% | 271 9% | 313 26% |
| Brightness Distribution (%) | 83 | 82 -1% | 93 12% | 70 -16% | 84 1% | 87 5% | 88 6% | 88 6% |
| Black Level * (cd/m²) | 0.16 | 0.405 -153% | 0.23 -44% | 0.405 -153% | 0.33 -106% | 0.22 -38% | 0.25 -56% | 0.43 -169% |
| Contrast (:1) | 1731 | 575 -67% | 1135 -34% | 753 -56% | 867 -50% | 1064 -39% | 1148 -34% | 723 -58% |
| Colorchecker dE 2000 * | 3.6 | 8.22 -128% | 4.71 -31% | 6.01 -67% | 5.45 -51% | 6.52 -81% | 4.77 -33% | 4.5 -25% |
| Colorchecker dE 2000 max. * | 8.53 | 18.6 -118% | 7.6 11% | 21.9 -157% | 18.08 -112% | 10.58 -24% | 17.15 -101% | 7.97 7% |
| Colorchecker dE 2000 calibrated * | 2.88 | 3.67 -27% | 5.12 -78% | 4.47 -55% | 3.56 -24% | 3.73 -30% | 2.65 8% | |
| Greyscale dE 2000 * | 1.75 | 10.13 -479% | 2.76 -58% | 3.23 -85% | 5.3 -203% | 5.33 -205% | 2.7 -54% | 3.3 -89% |
| Gamma | 2.23 99% | 2.27 97% | 2.42 91% | 2.43 91% | 2.1 105% | 2.86 77% | 2.115 104% | 2.129 103% |
| CCT | 6695 97% | 11323 57% | 7090 92% | 6818 95% | 7679 85% | 5983 109% | 7187 90% | 7227 90% |
| Color Space (Percent of AdobeRGB 1998) (%) | 39 | 39 0% | 36 -8% | 36 -8% | 37.6 -4% | 36 -8% | 43 10% | 63 62% |
| Color Space (Percent of sRGB) (%) | 62 | 62 0% | 56 -10% | 56 -10% | 59.1 -5% | 57 -8% | 61 -2% | 86 39% |
| Totalt genomsnitt (program/inställningar) | -32% /
-65% | -12% /
-15% | -13% /
-36% | -21% /
-37% | 5% /
-15% | -18% /
-21% | 28% /
4% |
* ... mindre är bättre
Visa svarstider
| ↔ Svarstid svart till vitt | ||
|---|---|---|
| 22.4 ms ... stiga ↗ och falla ↘ kombinerat | ↗ 12.8 ms stiga | 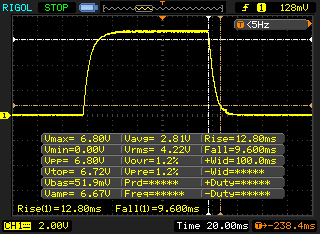 |
| ↘ 9.6 ms hösten | ||
| Skärmen visar bra svarsfrekvens i våra tester, men kan vara för långsam för konkurrenskraftiga spelare. I jämförelse sträcker sig alla testade enheter från 0.1 (minst) till 240 (maximalt) ms. » 50 % av alla enheter är bättre. Detta innebär att den uppmätta svarstiden är sämre än genomsnittet av alla testade enheter (19.9 ms). | ||
| ↔ Svarstid 50 % grått till 80 % grått | ||
| 33.6 ms ... stiga ↗ och falla ↘ kombinerat | ↗ 17.2 ms stiga | 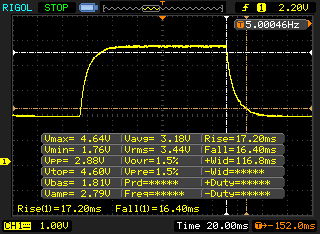 |
| ↘ 16.4 ms hösten | ||
| Skärmen visar långsamma svarsfrekvenser i våra tester och kommer att vara otillfredsställande för spelare. I jämförelse sträcker sig alla testade enheter från 0.165 (minst) till 636 (maximalt) ms. » 46 % av alla enheter är bättre. Det betyder att den uppmätta svarstiden liknar genomsnittet av alla testade enheter (31.1 ms). | ||
Skärmflimmer / PWM (Puls-Width Modulation)
| Skärmflimmer / PWM upptäckt | 24750 Hz | ≤ 42 % ljusstyrka inställning | 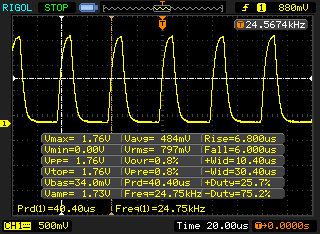 |
Displayens bakgrundsbelysning flimrar vid 24750 Hz (i värsta fall, t.ex. med PWM) Flimrande upptäckt vid en ljusstyrkeinställning på 42 % och lägre. Det ska inte finnas något flimmer eller PWM över denna ljusstyrkeinställning. Frekvensen för 24750 Hz är ganska hög, så de flesta användare som är känsliga för PWM bör inte märka något flimmer. Som jämförelse: 52 % av alla testade enheter använder inte PWM för att dämpa skärmen. Om PWM upptäcktes mättes ett medelvärde av 7798 (minst: 5 - maximum: 343500) Hz. | |||
| Cinebench R15 | |
| CPU Single 64Bit | |
| Lenovo IdeaPad Gaming 3i 15IMH05 | |
| MSI Bravo 15 A4DCR | |
| Nexoc GH5 515IG | |
| Acer Nitro 5 AN515-44-R5FT | |
| HP Pavilion Gaming 15-ec1206ng | |
| Dell G5 15 5590-PCNJJ | |
| Asus TUF FX505DT-EB73 | |
| HP Pavilion Gaming 15-ec0002ng | |
| CPU Multi 64Bit | |
| MSI Bravo 15 A4DCR | |
| HP Pavilion Gaming 15-ec1206ng | |
| Acer Nitro 5 AN515-44-R5FT | |
| Lenovo IdeaPad Gaming 3i 15IMH05 | |
| Nexoc GH5 515IG | |
| Dell G5 15 5590-PCNJJ | |
| Asus TUF FX505DT-EB73 | |
| HP Pavilion Gaming 15-ec0002ng | |
| Blender - v2.79 BMW27 CPU | |
| Nexoc GH5 515IG | |
| Lenovo IdeaPad Gaming 3i 15IMH05 | |
| Acer Nitro 5 AN515-44-R5FT | |
| HP Pavilion Gaming 15-ec1206ng | |
| MSI Bravo 15 A4DCR | |
| 7-Zip 18.03 | |
| 7z b 4 -mmt1 | |
| Nexoc GH5 515IG | |
| Lenovo IdeaPad Gaming 3i 15IMH05 | |
| MSI Bravo 15 A4DCR | |
| Acer Nitro 5 AN515-44-R5FT | |
| HP Pavilion Gaming 15-ec1206ng | |
| 7z b 4 | |
| MSI Bravo 15 A4DCR | |
| HP Pavilion Gaming 15-ec1206ng | |
| Acer Nitro 5 AN515-44-R5FT | |
| Lenovo IdeaPad Gaming 3i 15IMH05 | |
| Nexoc GH5 515IG | |
| Cinebench R20 | |
| CPU (Single Core) | |
| MSI Bravo 15 A4DCR | |
| Nexoc GH5 515IG | |
| Lenovo IdeaPad Gaming 3i 15IMH05 | |
| HP Pavilion Gaming 15-ec1206ng | |
| Acer Nitro 5 AN515-44-R5FT | |
| Dell G5 15 5590-PCNJJ | |
| Asus TUF FX505DT-EB73 | |
| HP Pavilion Gaming 15-ec0002ng | |
| CPU (Multi Core) | |
| MSI Bravo 15 A4DCR | |
| HP Pavilion Gaming 15-ec1206ng | |
| Acer Nitro 5 AN515-44-R5FT | |
| Lenovo IdeaPad Gaming 3i 15IMH05 | |
| Nexoc GH5 515IG | |
| Dell G5 15 5590-PCNJJ | |
| Asus TUF FX505DT-EB73 | |
| HP Pavilion Gaming 15-ec0002ng | |
| Geekbench 5.5 | |
| Single-Core | |
| Nexoc GH5 515IG | |
| Lenovo IdeaPad Gaming 3i 15IMH05 | |
| MSI Bravo 15 A4DCR | |
| HP Pavilion Gaming 15-ec1206ng | |
| Acer Nitro 5 AN515-44-R5FT | |
| HP Pavilion Gaming 15-ec0002ng | |
| Multi-Core | |
| MSI Bravo 15 A4DCR | |
| HP Pavilion Gaming 15-ec1206ng | |
| Acer Nitro 5 AN515-44-R5FT | |
| Nexoc GH5 515IG | |
| Lenovo IdeaPad Gaming 3i 15IMH05 | |
| HP Pavilion Gaming 15-ec0002ng | |
| HWBOT x265 Benchmark v2.2 - 4k Preset | |
| MSI Bravo 15 A4DCR | |
| HP Pavilion Gaming 15-ec1206ng | |
| Acer Nitro 5 AN515-44-R5FT | |
| Lenovo IdeaPad Gaming 3i 15IMH05 | |
| Nexoc GH5 515IG | |
| LibreOffice - 20 Documents To PDF | |
| MSI Bravo 15 A4DCR | |
| HP Pavilion Gaming 15-ec1206ng | |
| Acer Nitro 5 AN515-44-R5FT | |
| Nexoc GH5 515IG | |
| Lenovo IdeaPad Gaming 3i 15IMH05 | |
| R Benchmark 2.5 - Overall mean | |
| Lenovo IdeaPad Gaming 3i 15IMH05 | |
| Acer Nitro 5 AN515-44-R5FT | |
| Nexoc GH5 515IG | |
| HP Pavilion Gaming 15-ec1206ng | |
| MSI Bravo 15 A4DCR | |
* ... mindre är bättre
| PCMark 8 Home Score Accelerated v2 | 4332 poäng | |
| PCMark 8 Creative Score Accelerated v2 | 5215 poäng | |
| PCMark 8 Work Score Accelerated v2 | 5164 poäng | |
| PCMark 10 Score | 5221 poäng | |
Hjälp | ||
| PCMark 10 - Score | |
| MSI Bravo 15 A4DCR | |
| HP Pavilion Gaming 15-ec1206ng | |
| Nexoc GH5 515IG | |
| Acer Nitro 5 AN515-44-R5FT | |
| Asus TUF FX505DT-EB73 | |
| Dell G5 15 5590-PCNJJ | |
| Lenovo IdeaPad Gaming 3i 15IMH05 | |
| HP Pavilion Gaming 15-ec0002ng | |
| PCMark 8 | |
| Home Score Accelerated v2 | |
| HP Pavilion Gaming 15-ec1206ng | |
| Nexoc GH5 515IG | |
| Asus TUF FX505DT-EB73 | |
| Lenovo IdeaPad Gaming 3i 15IMH05 | |
| HP Pavilion Gaming 15-ec0002ng | |
| Work Score Accelerated v2 | |
| Lenovo IdeaPad Gaming 3i 15IMH05 | |
| Nexoc GH5 515IG | |
| HP Pavilion Gaming 15-ec1206ng | |
| HP Pavilion Gaming 15-ec0002ng | |
| Asus TUF FX505DT-EB73 | |
| DPC Latencies / LatencyMon - interrupt to process latency (max), Web, Youtube, Prime95 | |
| MSI Bravo 15 A4DCR | |
| Acer Nitro 5 AN515-44-R5FT | |
| Lenovo IdeaPad Gaming 3i 15IMH05 | |
| HP Pavilion Gaming 15-ec1206ng | |
| Nexoc GH5 515IG | |
* ... mindre är bättre

| HP Pavilion Gaming 15-ec1206ng Toshiba KBG40ZNV512G | Nexoc GH5 515IG Samsung SSD 860 Evo 512GB | Lenovo IdeaPad Gaming 3i 15IMH05 SK hynix BC511 HFM512GDHTNI-87A0B | Asus TUF FX505DT-EB73 Intel SSD 660p SSDPEKNW512G8 | Dell G5 15 5590-PCNJJ KBG30ZMS128G | Acer Nitro 5 AN515-44-R5FT SK Hynix BC511 HFM512GDJTNI | MSI Bravo 15 A4DCR Samsung PM981a MZVLB1T0HBLR | HP Pavilion Gaming 15-ec0002ng Intel SSD 660p SSDPEKNW512G8 | |
|---|---|---|---|---|---|---|---|---|
| CrystalDiskMark 5.2 / 6 | -42% | -8% | -12% | -59% | -11% | 41% | -11% | |
| Write 4K (MB/s) | 111.5 | 89.6 -20% | 130 17% | 137.5 23% | 65.3 -41% | 94.7 -15% | 118.3 6% | 136.9 23% |
| Read 4K (MB/s) | 38.17 | 40.88 7% | 44.44 16% | 57 49% | 29.71 -22% | 38.91 2% | 43.73 15% | 57 49% |
| Write Seq (MB/s) | 1515 | 518 -66% | 1059 -30% | 984 -35% | 128.8 -91% | 1056 -30% | 2854 88% | 968 -36% |
| Read Seq (MB/s) | 1576 | 539 -66% | 1105 -30% | 1564 -1% | 859 -45% | 1183 -25% | 2302 46% | 1631 3% |
| Write 4K Q32T1 (MB/s) | 365.4 | 304 -17% | 490.3 34% | 237.4 -35% | 95.8 -74% | 445.3 22% | 418.5 15% | 237 -35% |
| Read 4K Q32T1 (MB/s) | 504 | 329 -35% | 309.2 -39% | 340.7 -32% | 197.6 -61% | 477.7 -5% | 517 3% | 337.1 -33% |
| Write Seq Q32T1 (MB/s) | 1493 | 529 -65% | 1053 -29% | 959 -36% | 132.5 -91% | 1063 -29% | 3008 101% | 963 -35% |
| Read Seq Q32T1 (MB/s) | 2340 | 561 -76% | 2261 -3% | 1732 -26% | 1208 -48% | 2154 -8% | 3568 52% | 1863 -20% |
| AS SSD | -32% | -2% | -1% | -62% | -2% | 70% | -36% | |
| Seq Read (MB/s) | 2048 | 524 -74% | 1348 -34% | 1019 -50% | 1022 -50% | 1504 -27% | 2730 33% | 1623 -21% |
| Seq Write (MB/s) | 1039 | 495 -52% | 1000 -4% | 889 -14% | 117 -89% | 1064 2% | 2513 142% | 891 -14% |
| 4K Read (MB/s) | 52.8 | 38.93 -26% | 48.04 -9% | 48.22 -9% | 30.03 -43% | 51.5 -2% | 61.4 16% | 48.06 -9% |
| 4K Write (MB/s) | 146 | 87.3 -40% | 103.3 -29% | 115.5 -21% | 65.1 -55% | 123.2 -16% | 156.1 7% | 102.1 -30% |
| 4K-64 Read (MB/s) | 1285 | 380 -70% | 755 -41% | 321.5 -75% | 181.4 -86% | 703 -45% | 1780 39% | 325.6 -75% |
| 4K-64 Write (MB/s) | 758 | 335.7 -56% | 749 -1% | 787 4% | 87.1 -89% | 730 -4% | 1920 153% | 94.1 -88% |
| Access Time Read * (ms) | 0.155 | 0.073 53% | 0.061 61% | 0.065 58% | 0.152 2% | 0.064 59% | 0.063 59% | 0.171 -10% |
| Access Time Write * (ms) | 0.202 | 0.039 81% | 0.036 82% | 0.047 77% | 0.25 -24% | 0.031 85% | 0.025 88% | 0.048 76% |
| Score Read (Points) | 1543 | 471 -69% | 938 -39% | 472 -69% | 314 -80% | 905 -41% | 2114 37% | 536 -65% |
| Score Write (Points) | 1008 | 472 -53% | 952 -6% | 992 -2% | 164 -84% | 960 -5% | 2327 131% | 285 -72% |
| Score Total (Points) | 3298 | 1198 -64% | 2365 -28% | 1717 -48% | 604 -82% | 2321 -30% | 5518 67% | 1077 -67% |
| Copy ISO MB/s (MB/s) | 691 | 500 -28% | 749 8% | 942 36% | 566 -18% | |||
| Copy Program MB/s (MB/s) | 345.8 | 283.8 -18% | 342.5 -1% | 444.5 29% | 223.8 -35% | |||
| Copy Game MB/s (MB/s) | 517 | 319.6 -38% | 571 10% | 867 68% | 104.3 -80% | |||
| Totalt genomsnitt (program/inställningar) | -37% /
-36% | -5% /
-4% | -7% /
-5% | -61% /
-61% | -7% /
-6% | 56% /
58% | -24% /
-27% |
* ... mindre är bättre
Kontinuerlig inläsning: DiskSpd Read Loop, Queue Depth 8
| 3DMark 11 Performance | 12463 poäng | |
| 3DMark Cloud Gate Standard Score | 30251 poäng | |
| 3DMark Fire Strike Score | 8985 poäng | |
| 3DMark Time Spy Score | 3765 poäng | |
Hjälp | ||
| 3DMark 11 - 1280x720 Performance GPU | |
| MSI Bravo 15 A4DCR | |
| Acer Nitro 5 AN515-44-R5FT | |
| Asus TUF FX505DT-EB73 | |
| Dell G5 15 5590-PCNJJ | |
| HP Pavilion Gaming 15-ec1206ng | |
| Lenovo IdeaPad Gaming 3i 15IMH05 | |
| Nexoc GH5 515IG | |
| HP Pavilion Gaming 15-ec0002ng | |
| 3DMark | |
| 1280x720 Cloud Gate Standard Graphics | |
| Lenovo IdeaPad Gaming 3i 15IMH05 | |
| Nexoc GH5 515IG | |
| Dell G5 15 5590-PCNJJ | |
| MSI Bravo 15 A4DCR | |
| HP Pavilion Gaming 15-ec1206ng | |
| Acer Nitro 5 AN515-44-R5FT | |
| Asus TUF FX505DT-EB73 | |
| HP Pavilion Gaming 15-ec0002ng | |
| 1920x1080 Fire Strike Graphics | |
| MSI Bravo 15 A4DCR | |
| Acer Nitro 5 AN515-44-R5FT | |
| HP Pavilion Gaming 15-ec1206ng | |
| Lenovo IdeaPad Gaming 3i 15IMH05 | |
| Asus TUF FX505DT-EB73 | |
| Nexoc GH5 515IG | |
| Dell G5 15 5590-PCNJJ | |
| HP Pavilion Gaming 15-ec0002ng | |
| 2560x1440 Time Spy Graphics | |
| Acer Nitro 5 AN515-44-R5FT | |
| Asus TUF FX505DT-EB73 | |
| MSI Bravo 15 A4DCR | |
| HP Pavilion Gaming 15-ec1206ng | |
| Dell G5 15 5590-PCNJJ | |
| Lenovo IdeaPad Gaming 3i 15IMH05 | |
| Nexoc GH5 515IG | |
| HP Pavilion Gaming 15-ec0002ng | |
| The Witcher 3 - 1920x1080 High Graphics & Postprocessing (Nvidia HairWorks Off) | |
| HP Pavilion Gaming 15-ec1206ng | |
| Acer Nitro 5 AN515-44-R5FT | |
| Nexoc GH5 515IG | |
| Lenovo IdeaPad Gaming 3i 15IMH05 | |
| Asus TUF FX505DT-EB73 | |
| MSI Bravo 15 A4DCR | |
| Dell G5 15 5590-PCNJJ | |
| HP Pavilion Gaming 15-ec0002ng | |
| BioShock Infinite - 1920x1080 Ultra Preset, DX11 (DDOF) | |
| Lenovo IdeaPad Gaming 3i 15IMH05 | |
| Nexoc GH5 515IG | |
| HP Pavilion Gaming 15-ec1206ng | |
| Dell G5 15 5590-PCNJJ | |
| Asus TUF FX505DT-EB73 | |
| HP Pavilion Gaming 15-ec0002ng | |
| Shadow of the Tomb Raider - 1920x1080 Highest Preset AA:T | |
| Acer Nitro 5 AN515-44-R5FT | |
| Lenovo IdeaPad Gaming 3i 15IMH05 | |
| HP Pavilion Gaming 15-ec1206ng | |
| Nexoc GH5 515IG | |
| Dell G5 15 5590-PCNJJ | |
| Asus TUF FX505DT-EB73 | |
| MSI Bravo 15 A4DCR | |
| HP Pavilion Gaming 15-ec0002ng | |
| Call of Duty Modern Warfare 2019 - 1920x1080 Maximum Settings AA:T2X Filmic SM | |
| Acer Nitro 5 AN515-44-R5FT | |
| MSI Bravo 15 A4DCR | |
| Lenovo IdeaPad Gaming 3i 15IMH05 | |
| HP Pavilion Gaming 15-ec1206ng | |
| Nexoc GH5 515IG | |
| HP Pavilion Gaming 15-ec0002ng | |
| Doom Eternal - 1920x1080 High Preset | |
| Lenovo IdeaPad Gaming 3i 15IMH05 | |
| HP Pavilion Gaming 15-ec1206ng | |
| Nexoc GH5 515IG | |
| MSI Bravo 15 A4DCR | |
| F1 2020 - 1920x1080 Ultra High Preset AA:T AF:16x | |
| HP Pavilion Gaming 15-ec1206ng | |
| Nexoc GH5 515IG | |
| Death Stranding - 1920x1080 Very High Preset | |
| HP Pavilion Gaming 15-ec1206ng | |
| Nexoc GH5 515IG | |
| Horizon Zero Dawn - 1920x1080 Favor Quality | |
| Nexoc GH5 515IG | |
| HP Pavilion Gaming 15-ec1206ng | |
| låg | med. | hög | ultra | |
|---|---|---|---|---|
| BioShock Infinite (2013) | 251.9 | 213.5 | 195.4 | 92.6 |
| The Witcher 3 (2015) | 189.4 | 118.5 | 68.9 | 39.8 |
| Shadow of the Tomb Raider (2018) | 95 | 62 | 52 | 45 |
| Total War: Three Kingdoms (2019) | 162.9 | 65.5 | 39.9 | 26.6 |
| Call of Duty Modern Warfare 2019 (2019) | 98.3 | 58.1 | 51.4 | 44.6 |
| Doom Eternal (2020) | 118.9 | 78.6 | 62.9 | |
| Gears Tactics (2020) | 161.6 | 100.4 | 66.4 | 43.6 |
| F1 2020 (2020) | 185 | 104 | 83 | 58 |
| Death Stranding (2020) | 105.6 | 64.2 | 60.4 | 57.8 |
| Horizon Zero Dawn (2020) | 84 | 52 | 44 | 34 |
Ljudnivå
| Låg belastning |
| 25 / 26 / 33 dB(A) |
| Hög belastning |
| 41 / 47 dB(A) |
 | ||
30 dB tyst 40 dB(A) hörbar 50 dB(A) högt ljud |
||
min: | ||
| HP Pavilion Gaming 15-ec1206ng R5 4600H, GeForce GTX 1650 Mobile | Nexoc GH5 515IG i5-10300H, GeForce GTX 1650 Mobile | Lenovo IdeaPad Gaming 3i 15IMH05 i5-10300H, GeForce GTX 1650 Mobile | Asus TUF FX505DT-EB73 R7 3750H, GeForce GTX 1650 Mobile | Dell G5 15 5590-PCNJJ i5-9300H, GeForce GTX 1650 Mobile | Acer Nitro 5 AN515-44-R5FT R5 4600H, GeForce GTX 1650 Ti Mobile | MSI Bravo 15 A4DCR R7 4800H, Radeon RX 5300M | HP Pavilion Gaming 15-ec0002ng R5 3550H, GeForce GTX 1050 Mobile | |
|---|---|---|---|---|---|---|---|---|
| Noise | -12% | -15% | -8% | -18% | -15% | -20% | -7% | |
| av / miljö * (dB) | 25 | 25 -0% | 30.7 -23% | 28.2 -13% | 30 -20% | 30 -20% | 30 -20% | 30.3 -21% |
| Idle Minimum * (dB) | 25 | 25 -0% | 30.7 -23% | 28.2 -13% | 31 -24% | 30 -20% | 31 -24% | 30.3 -21% |
| Idle Average * (dB) | 26 | 31 -19% | 30.7 -18% | 28.2 -8% | 32 -23% | 32 -23% | 32 -23% | 30.3 -17% |
| Idle Maximum * (dB) | 33 | 33 -0% | 30.7 7% | 31.4 5% | 35 -6% | 34 -3% | 40 -21% | 31 6% |
| Load Average * (dB) | 41 | 53 -29% | 49.7 -21% | 39.8 3% | 49 -20% | 46 -12% | 48 -17% | 39.3 4% |
| Witcher 3 ultra * (dB) | 39 | 48 -23% | 47 -21% | 47 -21% | 47 -21% | 47 -21% | 48 -23% | 42.9 -10% |
| Load Maximum * (dB) | 47 | 53 -13% | 50.3 -7% | 50.2 -7% | 53 -13% | 49 -4% | 54 -15% | 43.3 8% |
* ... mindre är bättre
(-) Den maximala temperaturen på ovansidan är 49 °C / 120 F, jämfört med genomsnittet av 40.4 °C / 105 F , allt från 21.2 till 68.8 °C för klassen Gaming.
(-) Botten värms upp till maximalt 49 °C / 120 F, jämfört med genomsnittet av 43.2 °C / 110 F
(+) Vid tomgångsbruk är medeltemperaturen för ovansidan 27.7 °C / 82 F, jämfört med enhetsgenomsnittet på 33.9 °C / ### class_avg_f### F.
(-) När du spelar The Witcher 3 är medeltemperaturen för ovansidan 40.7 °C / 105 F, jämfört med enhetsgenomsnittet på 33.9 °C / ## #class_avg_f### F.
(-) Handledsstöden och pekplattan kan bli väldigt varma vid beröring med maximalt 40 °C / 104 F.
(-) Medeltemperaturen för handledsstödsområdet på liknande enheter var 28.8 °C / 83.8 F (-11.2 °C / -20.2 F).
| HP Pavilion Gaming 15-ec1206ng R5 4600H, GeForce GTX 1650 Mobile | Nexoc GH5 515IG i5-10300H, GeForce GTX 1650 Mobile | Lenovo IdeaPad Gaming 3i 15IMH05 i5-10300H, GeForce GTX 1650 Mobile | Asus TUF FX505DT-EB73 R7 3750H, GeForce GTX 1650 Mobile | Dell G5 15 5590-PCNJJ i5-9300H, GeForce GTX 1650 Mobile | Acer Nitro 5 AN515-44-R5FT R5 4600H, GeForce GTX 1650 Ti Mobile | MSI Bravo 15 A4DCR R7 4800H, Radeon RX 5300M | HP Pavilion Gaming 15-ec0002ng R5 3550H, GeForce GTX 1050 Mobile | |
|---|---|---|---|---|---|---|---|---|
| Heat | 2% | 4% | -2% | 2% | 0% | -5% | 13% | |
| Maximum Upper Side * (°C) | 49 | 48 2% | 43 12% | 41.2 16% | 49 -0% | 49 -0% | 51 -4% | 41 16% |
| Maximum Bottom * (°C) | 49 | 47 4% | 50.6 -3% | 40 18% | 55 -12% | 50 -2% | 50 -2% | 39.1 20% |
| Idle Upper Side * (°C) | 29 | 28 3% | 27.2 6% | 34.6 -19% | 25 14% | 28 3% | 30 -3% | 26 10% |
| Idle Bottom * (°C) | 28 | 28 -0% | 27.5 2% | 34.4 -23% | 26 7% | 28 -0% | 31 -11% | 26.5 5% |
* ... mindre är bättre
HP Pavilion Gaming 15-ec1206ng ljudanalys
(±) | högtalarljudstyrkan är genomsnittlig men bra (79 dB)
Bas 100 - 315 Hz
(-) | nästan ingen bas - i genomsnitt 17.3% lägre än medianen
(±) | linjäriteten för basen är genomsnittlig (12.1% delta till föregående frekvens)
Mellan 400 - 2000 Hz
(+) | balanserad mellan - endast 4.1% från medianen
(+) | mids är linjära (4% delta till föregående frekvens)
Högsta 2 - 16 kHz
(+) | balanserade toppar - endast 3.9% från medianen
(+) | toppar är linjära (5.7% delta till föregående frekvens)
Totalt 100 - 16 000 Hz
(±) | linjäriteten för det totala ljudet är genomsnittlig (17.9% skillnad mot median)
Jämfört med samma klass
» 54% av alla testade enheter i den här klassen var bättre, 9% liknande, 37% sämre
» Den bästa hade ett delta på 6%, genomsnittet var 18%, sämst var 132%
Jämfört med alla testade enheter
» 37% av alla testade enheter var bättre, 8% liknande, 55% sämre
» Den bästa hade ett delta på 4%, genomsnittet var 24%, sämst var 134%
| Av/Standby | |
| Låg belastning | |
| Hög belastning |
|
Förklaring:
min: | |
| HP Pavilion Gaming 15-ec1206ng R5 4600H, GeForce GTX 1650 Mobile | Nexoc GH5 515IG i5-10300H, GeForce GTX 1650 Mobile | Lenovo IdeaPad Gaming 3i 15IMH05 i5-10300H, GeForce GTX 1650 Mobile | Asus TUF FX505DT-EB73 R7 3750H, GeForce GTX 1650 Mobile | Dell G5 15 5590-PCNJJ i5-9300H, GeForce GTX 1650 Mobile | Acer Nitro 5 AN515-44-R5FT R5 4600H, GeForce GTX 1650 Ti Mobile | MSI Bravo 15 A4DCR R7 4800H, Radeon RX 5300M | HP Pavilion Gaming 15-ec0002ng R5 3550H, GeForce GTX 1050 Mobile | |
|---|---|---|---|---|---|---|---|---|
| Power Consumption | -22% | -51% | -55% | -26% | -30% | -125% | 3% | |
| Idle Minimum * (Watt) | 2 | 3 -50% | 5.1 -155% | 7 -250% | 4 -100% | 5 -150% | 11 -450% | 1.9 5% |
| Idle Average * (Watt) | 6 | 7 -17% | 8.2 -37% | 9.9 -65% | 7 -17% | 8 -33% | 14 -133% | 7.2 -20% |
| Idle Maximum * (Watt) | 11 | 16 -45% | 10.6 4% | 12 -9% | 12 -9% | 13 -18% | 25 -127% | 9.6 13% |
| Load Average * (Watt) | 77 | 85 -10% | 128 -66% | 68.4 11% | 95 -23% | 69 10% | 72 6% | 74 4% |
| Witcher 3 ultra * (Watt) | 76 | 86 -13% | 109 -43% | 94.9 -25% | 86 -13% | 78 -3% | 100 -32% | 75 1% |
| Load Maximum * (Watt) | 142 | 134 6% | 150 -6% | 130.9 8% | 135 5% | 124 13% | 163 -15% | 124 13% |
* ... mindre är bättre
| HP Pavilion Gaming 15-ec1206ng R5 4600H, GeForce GTX 1650 Mobile, 52.5 Wh | Nexoc GH5 515IG i5-10300H, GeForce GTX 1650 Mobile, 48.96 Wh | Lenovo IdeaPad Gaming 3i 15IMH05 i5-10300H, GeForce GTX 1650 Mobile, 45 Wh | Asus TUF FX505DT-EB73 R7 3750H, GeForce GTX 1650 Mobile, 48 Wh | Dell G5 15 5590-PCNJJ i5-9300H, GeForce GTX 1650 Mobile, 60 Wh | Acer Nitro 5 AN515-44-R5FT R5 4600H, GeForce GTX 1650 Ti Mobile, 57.48 Wh | MSI Bravo 15 A4DCR R7 4800H, Radeon RX 5300M, 51 Wh | HP Pavilion Gaming 15-ec0002ng R5 3550H, GeForce GTX 1050 Mobile, 52.5 Wh | |
|---|---|---|---|---|---|---|---|---|
| Batteridrifttid | -18% | -5% | -19% | 28% | 2% | -42% | -8% | |
| Reader / Idle (h) | 19.4 | 14.9 -23% | 12.4 -36% | 7.8 -60% | 14.5 -25% | 13.8 -29% | 7 -64% | |
| H.264 (h) | 10.9 | 6.5 -40% | 7.3 -33% | |||||
| WiFi v1.3 (h) | 9.1 | 6.4 -30% | 6.3 -31% | 4.8 -47% | 8 -12% | 8.7 -4% | 4.5 -51% | 8.4 -8% |
| Load (h) | 1 | 1.2 20% | 1.8 80% | 1.5 50% | 2.2 120% | 1.4 40% | 0.9 -10% |
För
Emot
Läs den fullständiga versionen av den här recensionen på engelska här.
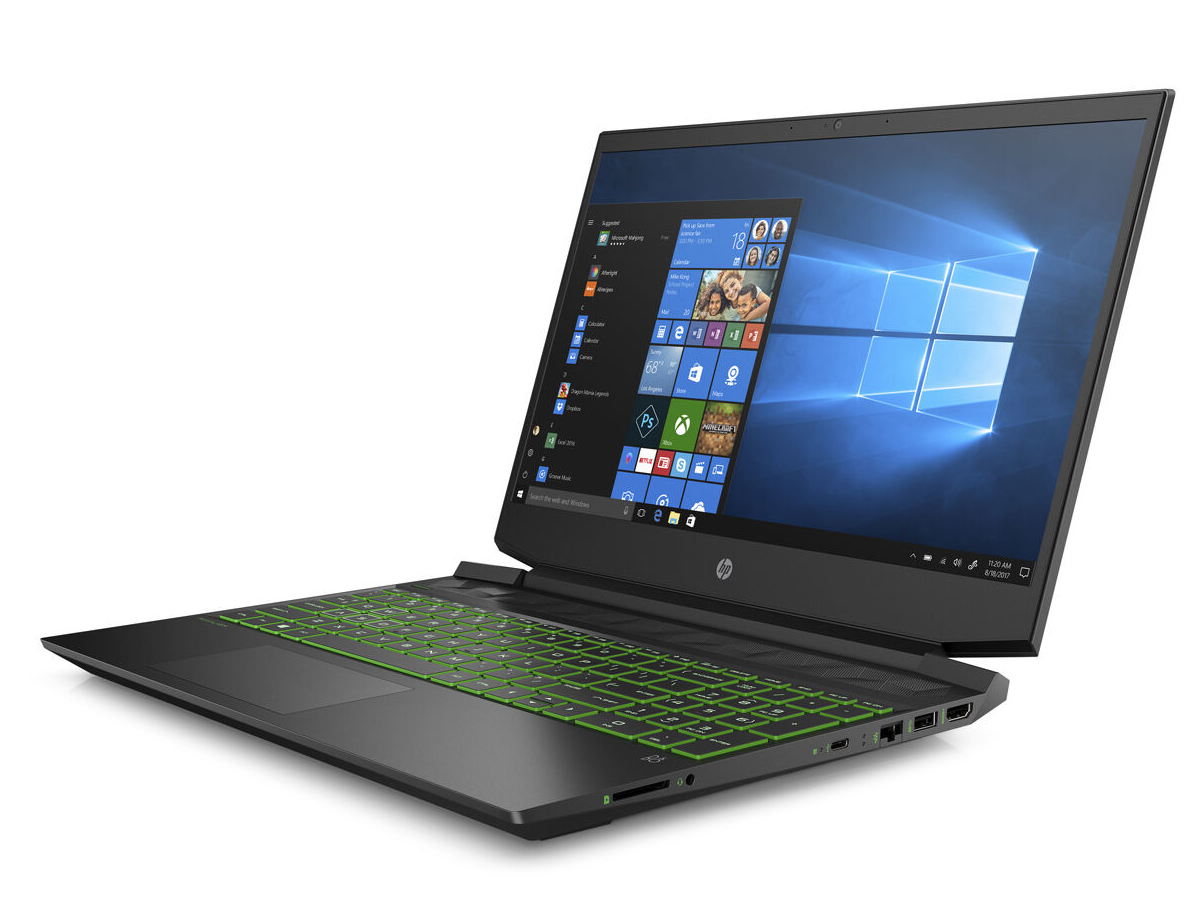
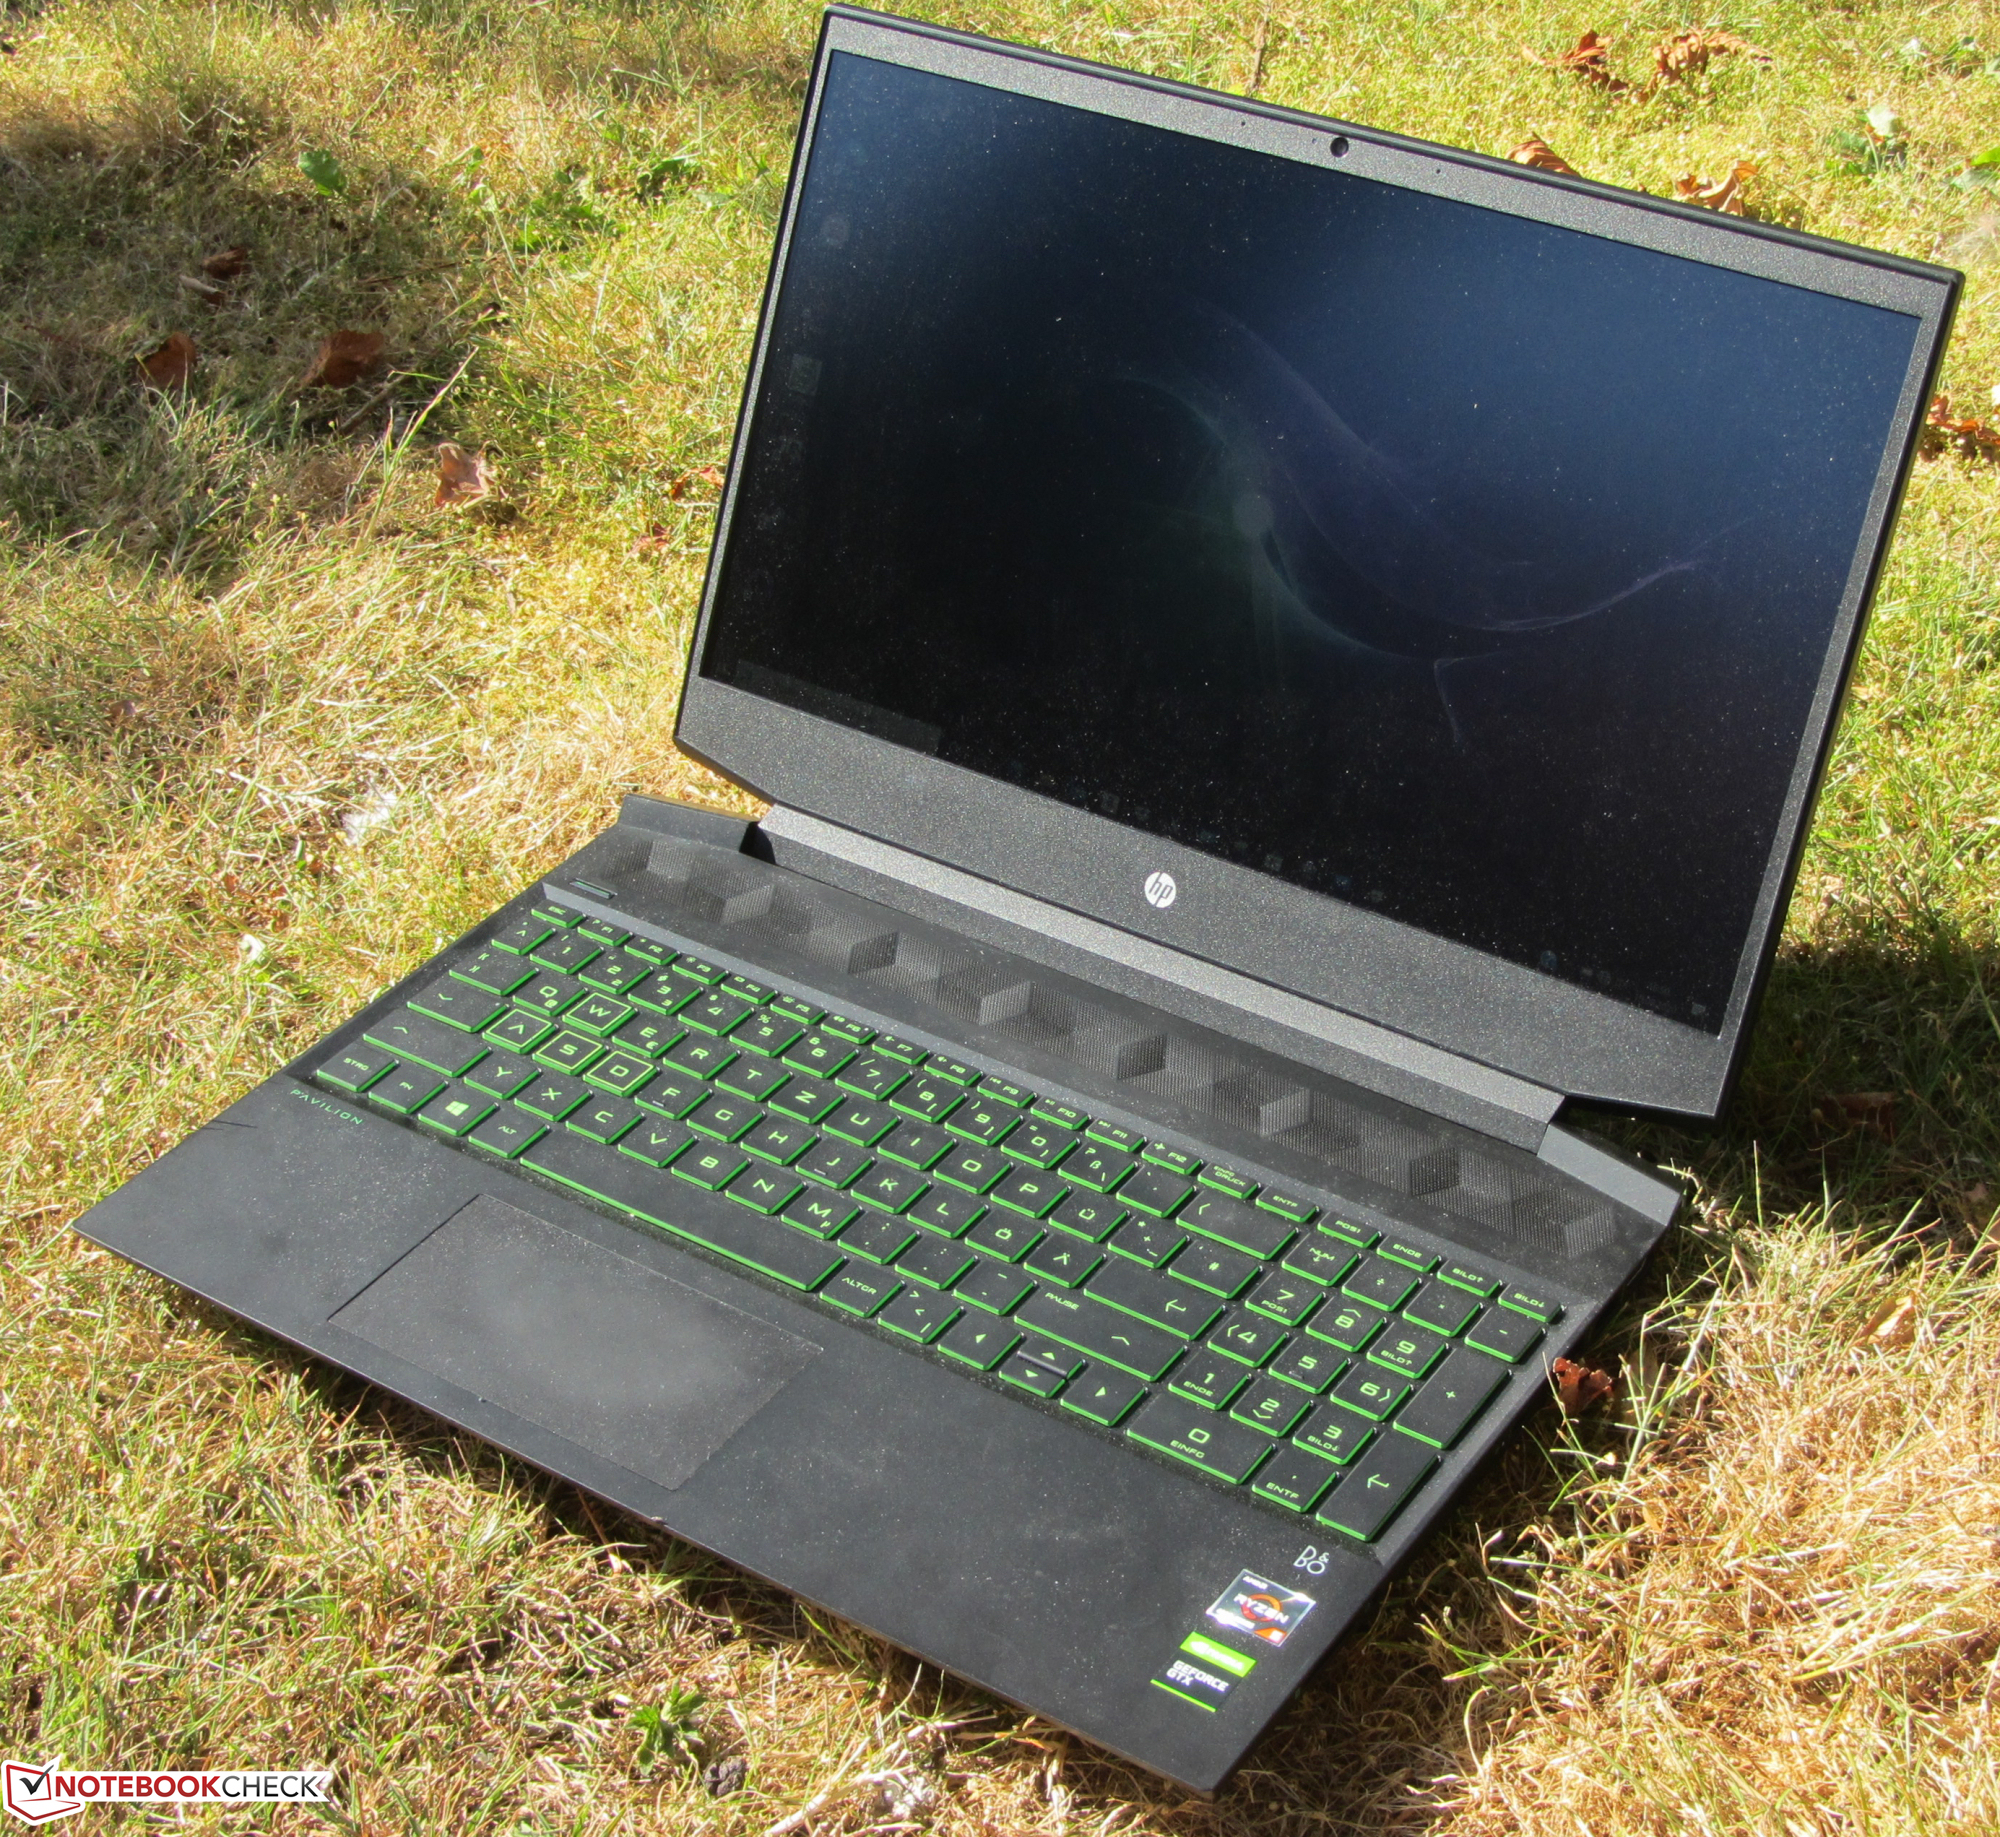
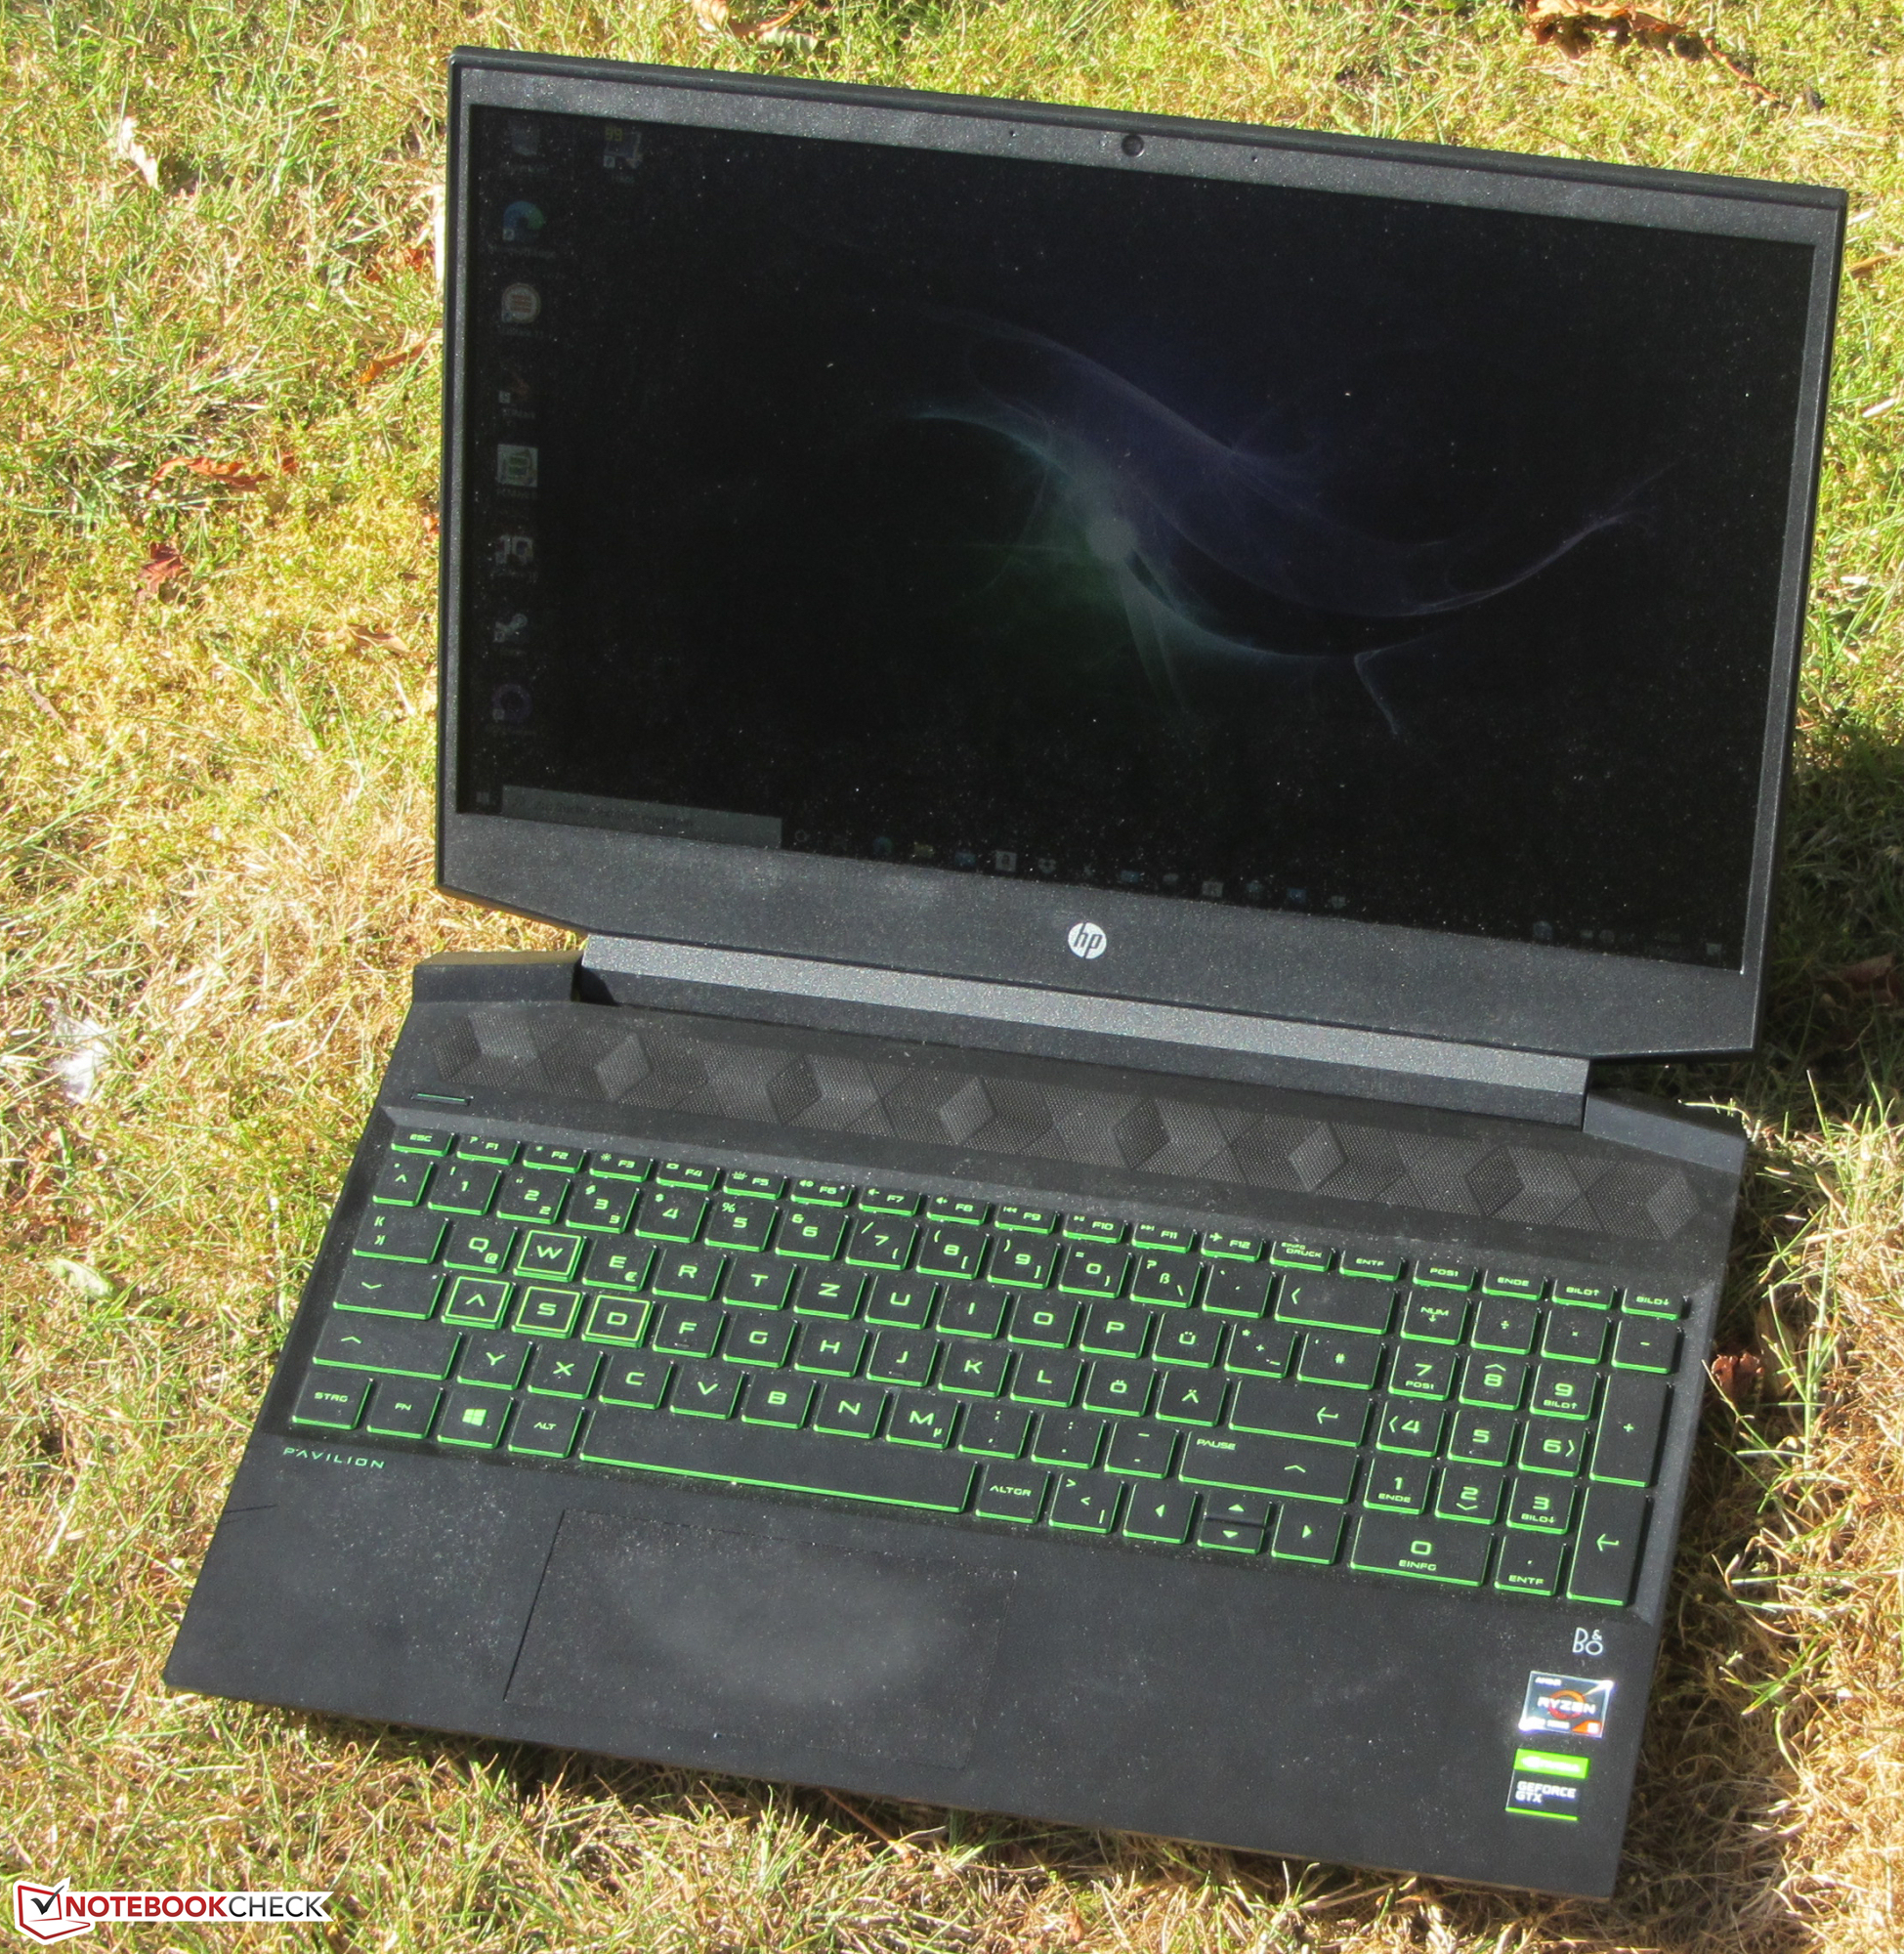
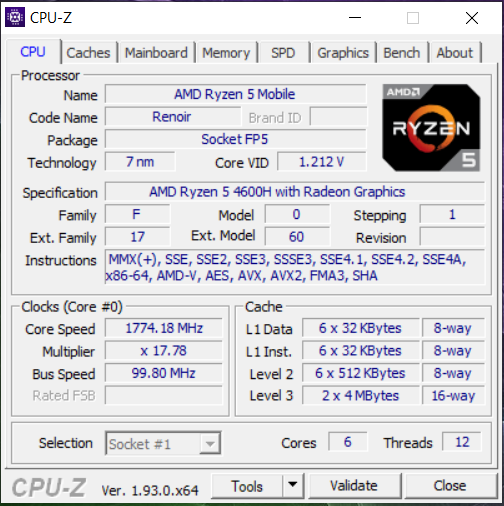
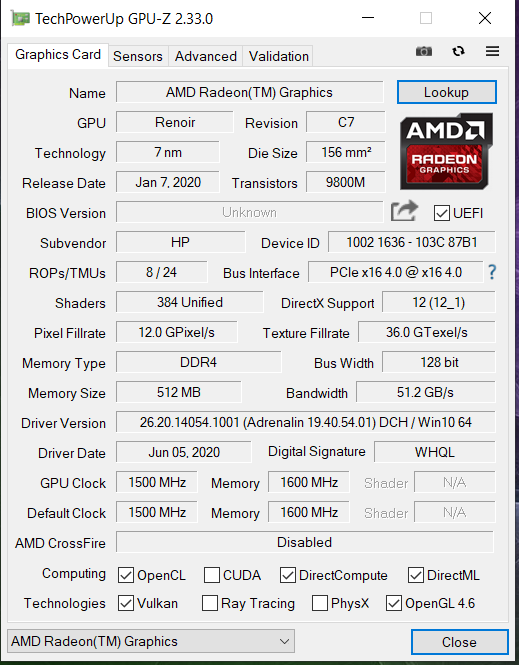
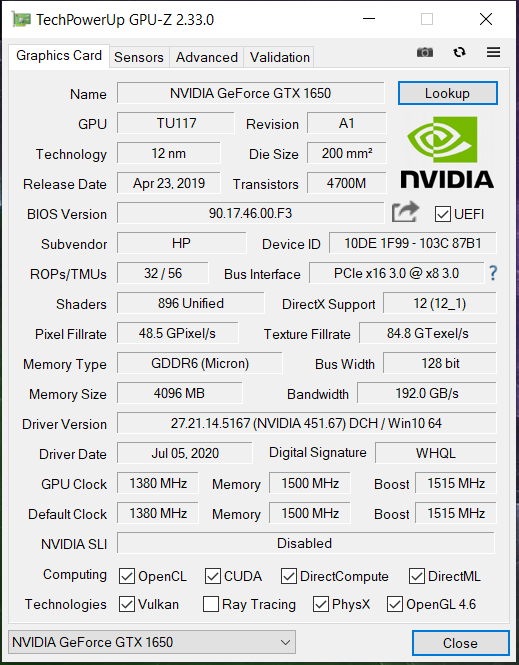
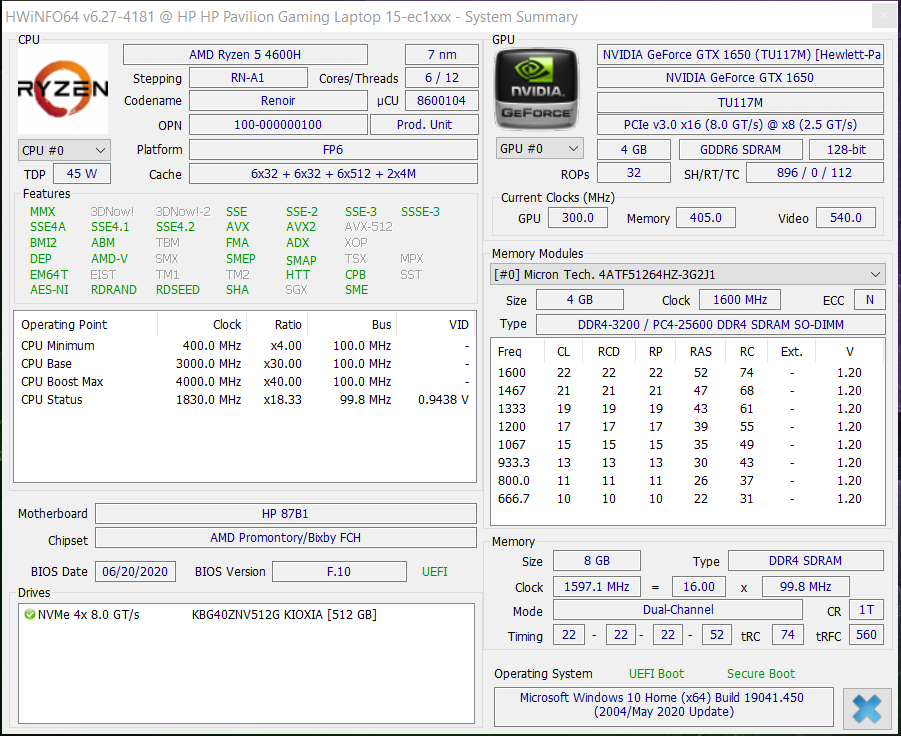
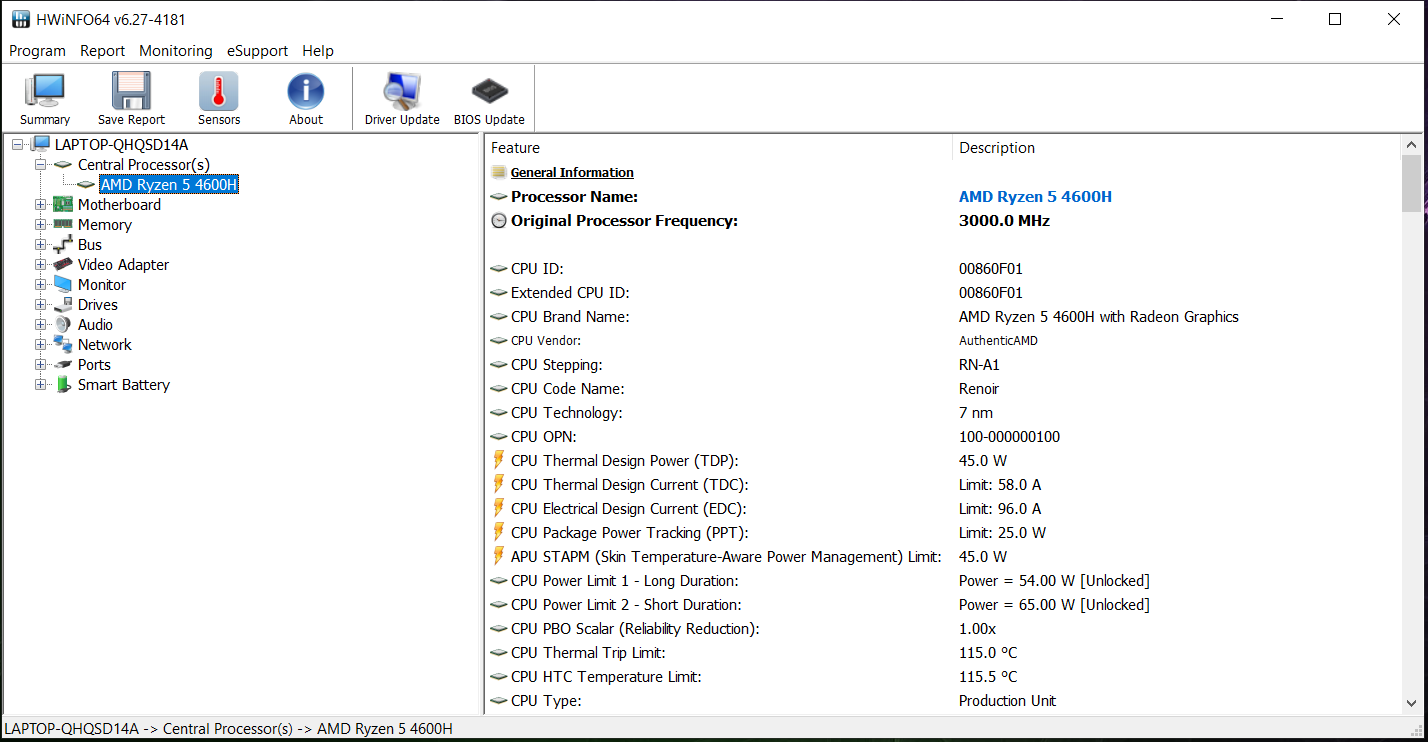
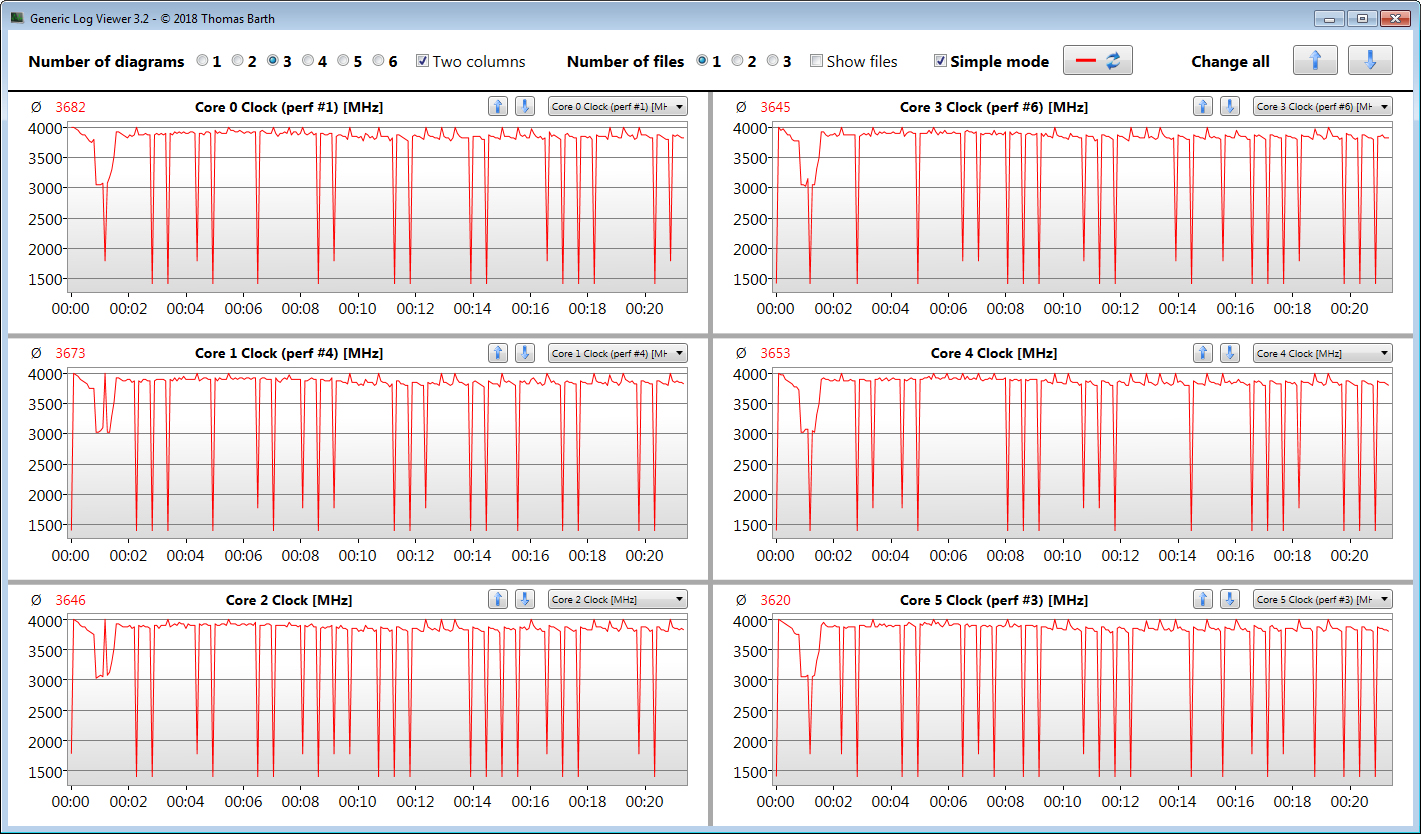
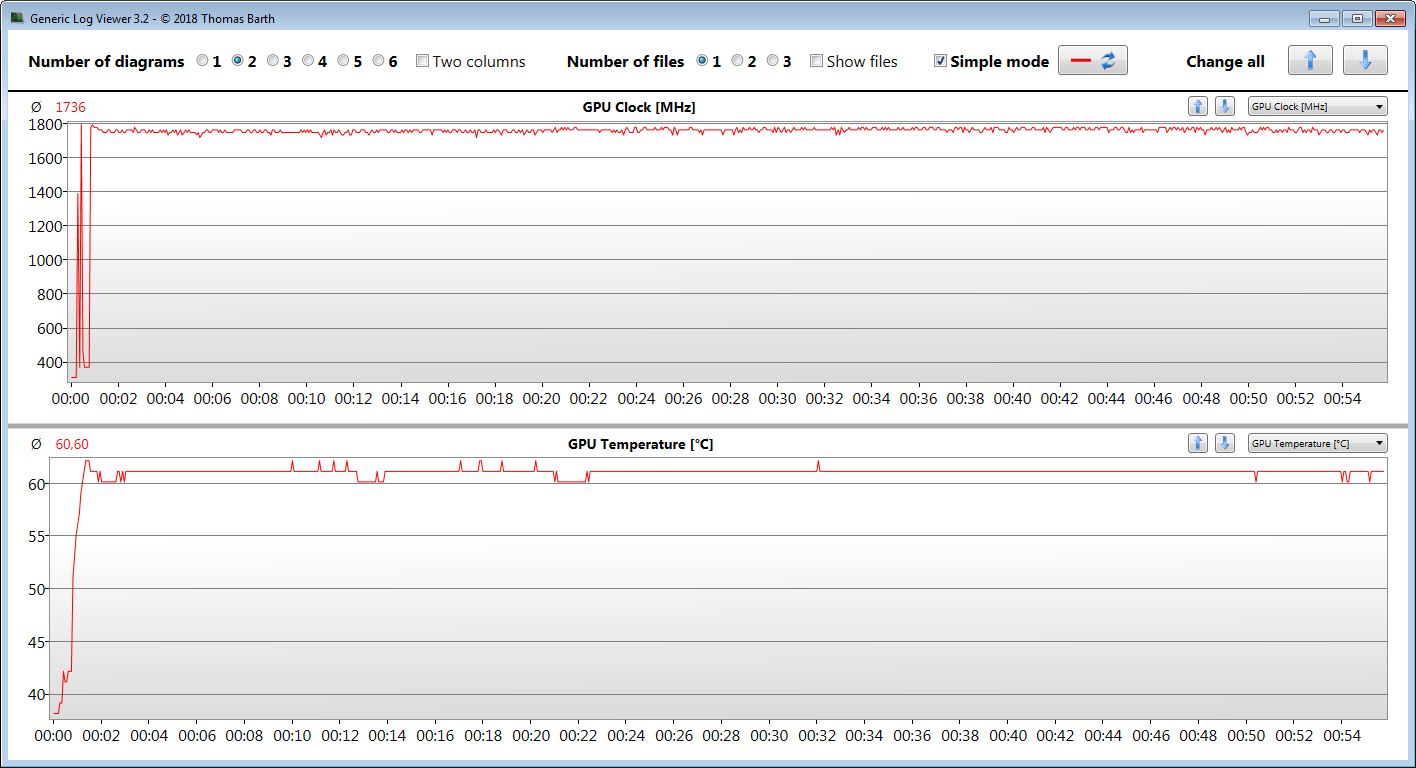
Med ett pris på strax under 8.000 kronor hamnar Pavilion 15-ec1206ng i budgetlaptop-kategorin. Den gör vad den ska göra: Visar alla moderna spel smidigt på sin skärm. Men man får inte förvänta sig de högsta upplösningarna eller inställningarna från en hårdvarukombination bestående av en Ryzen 5 4600H APU och en GeForce GTX 1650 GPU.
Med Pavilion Gaming 15-ec1206ng levererar HP en välavrundad spellaptop med ett tilltalande pris.
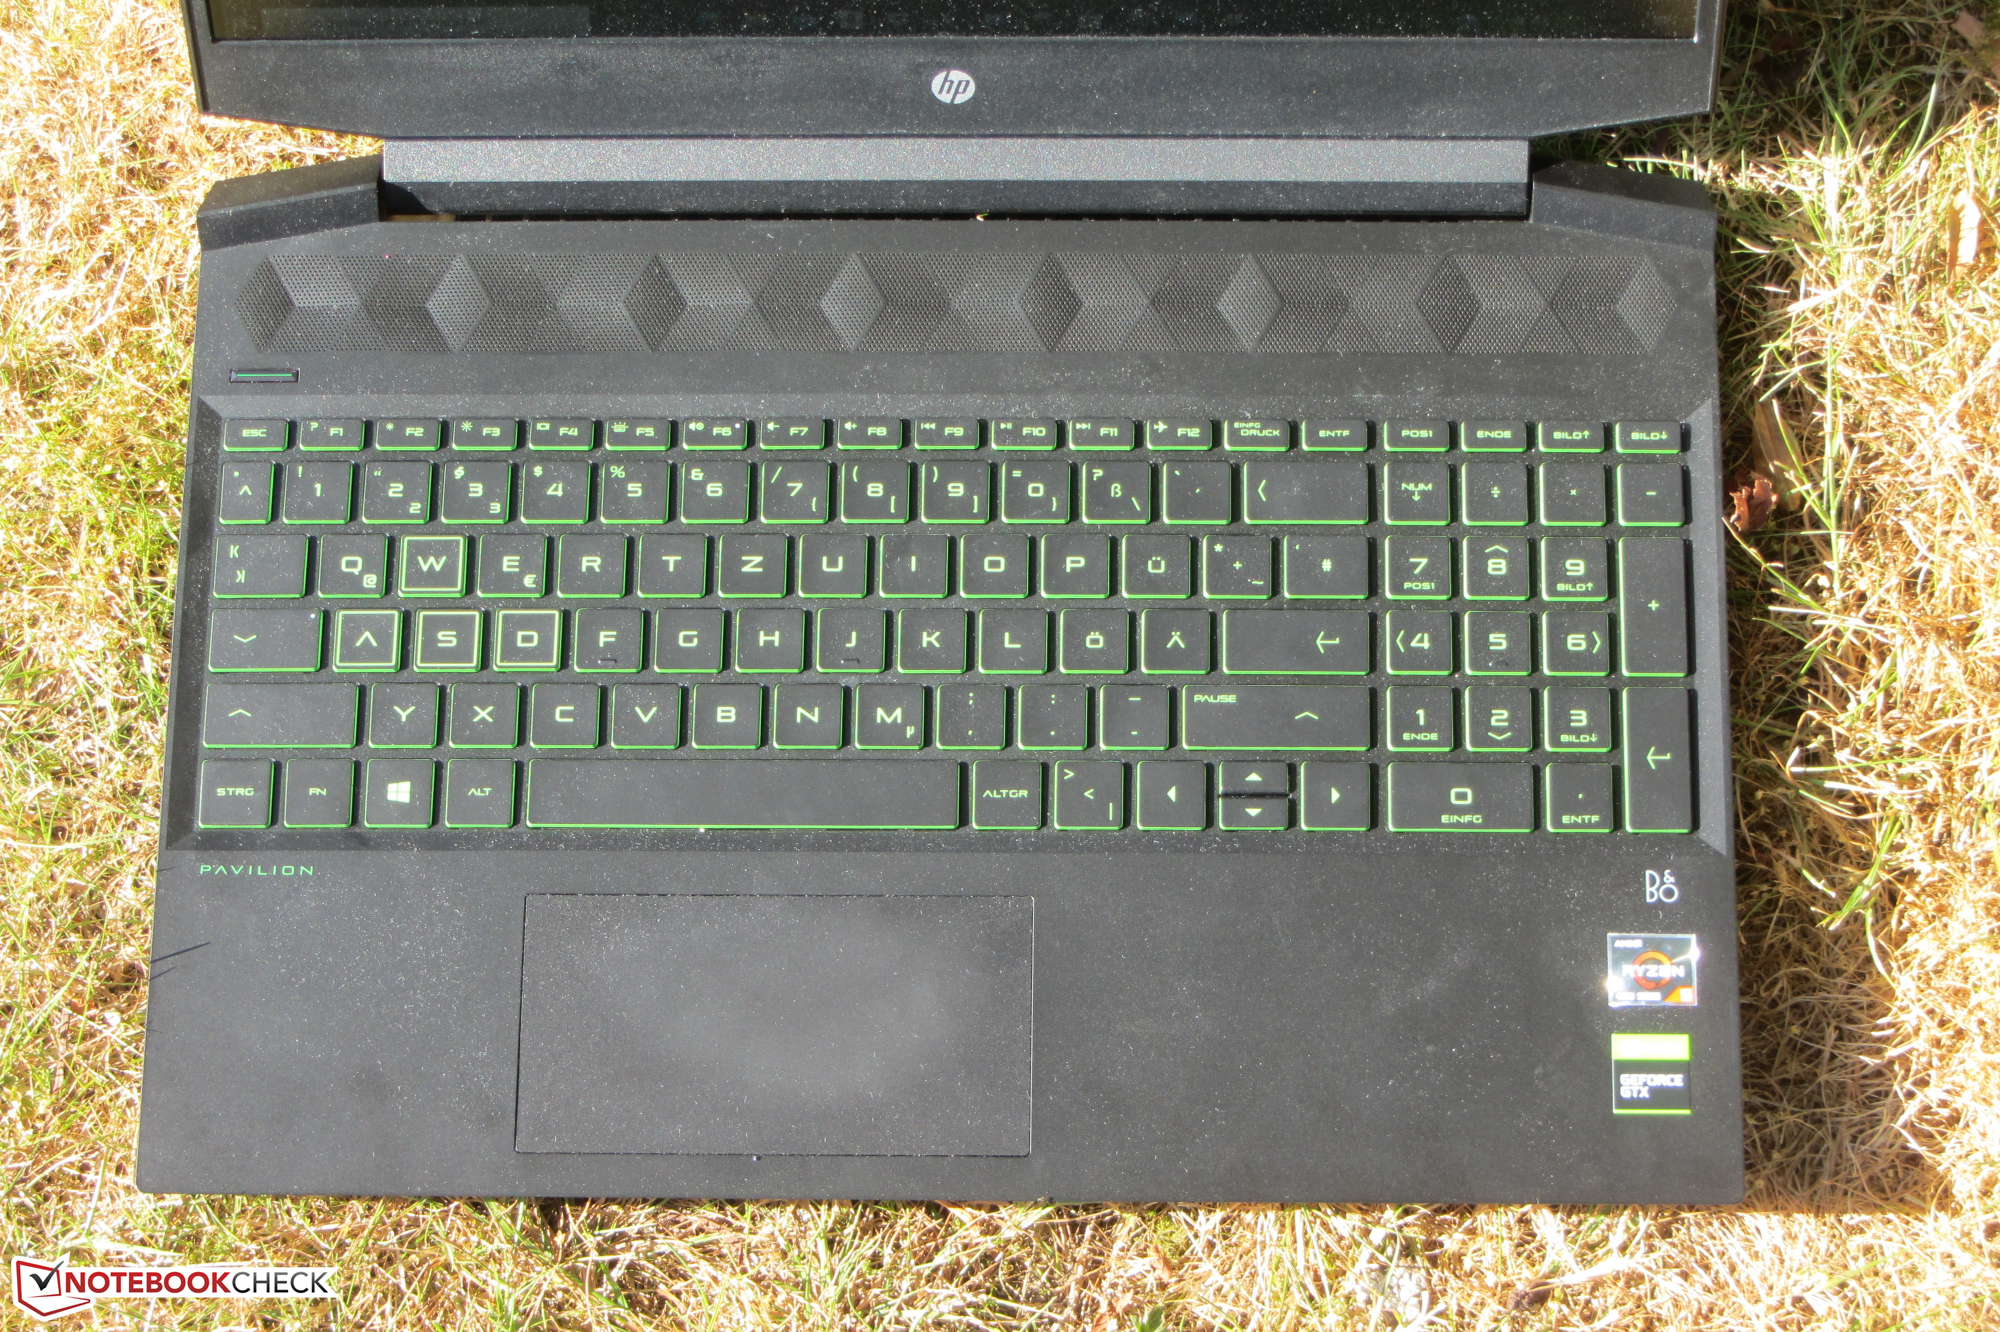
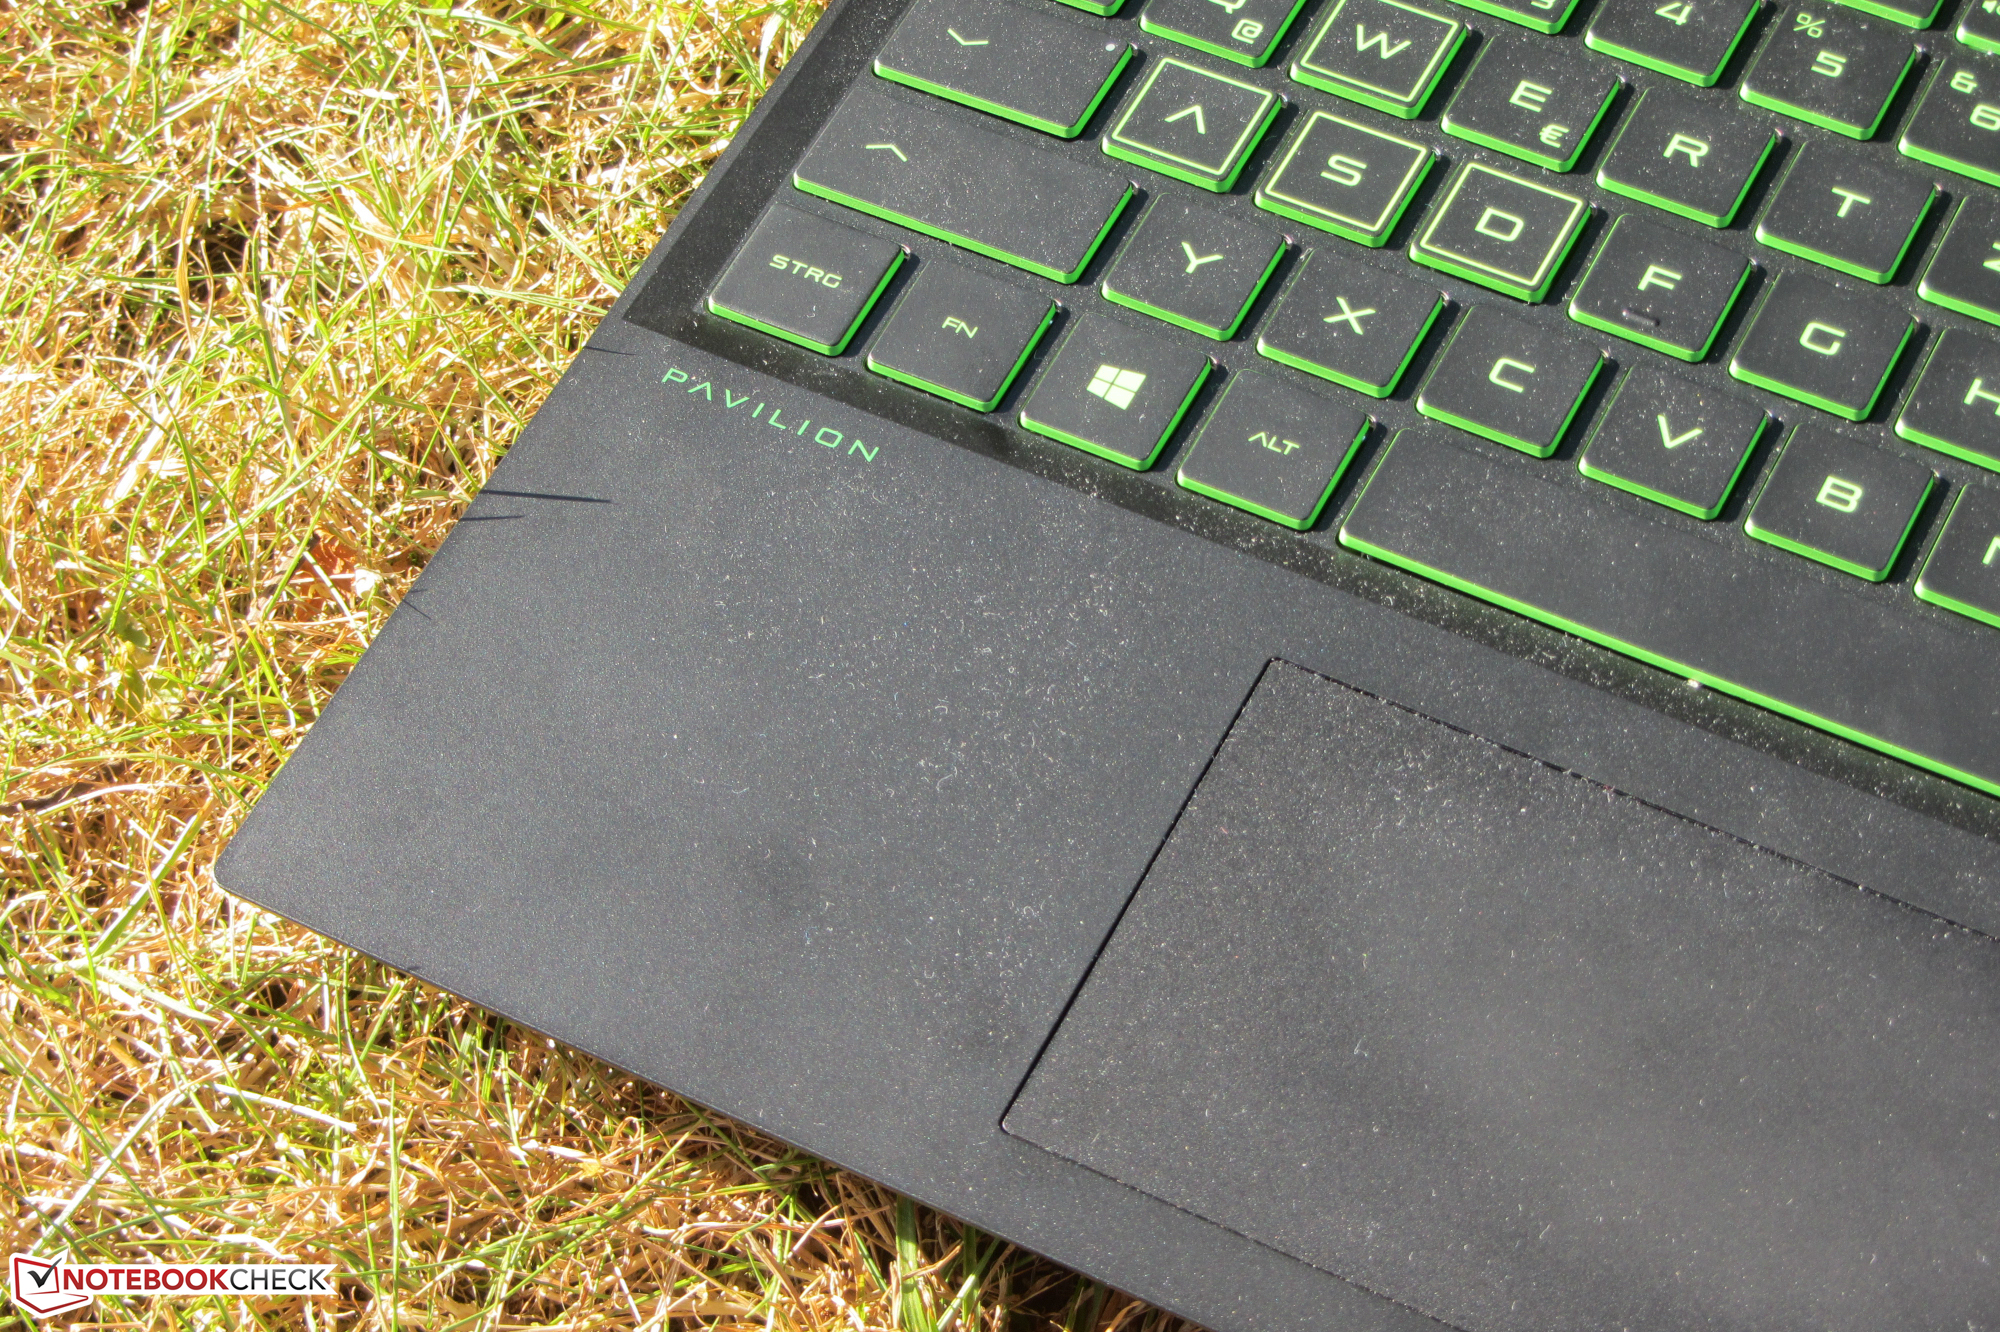
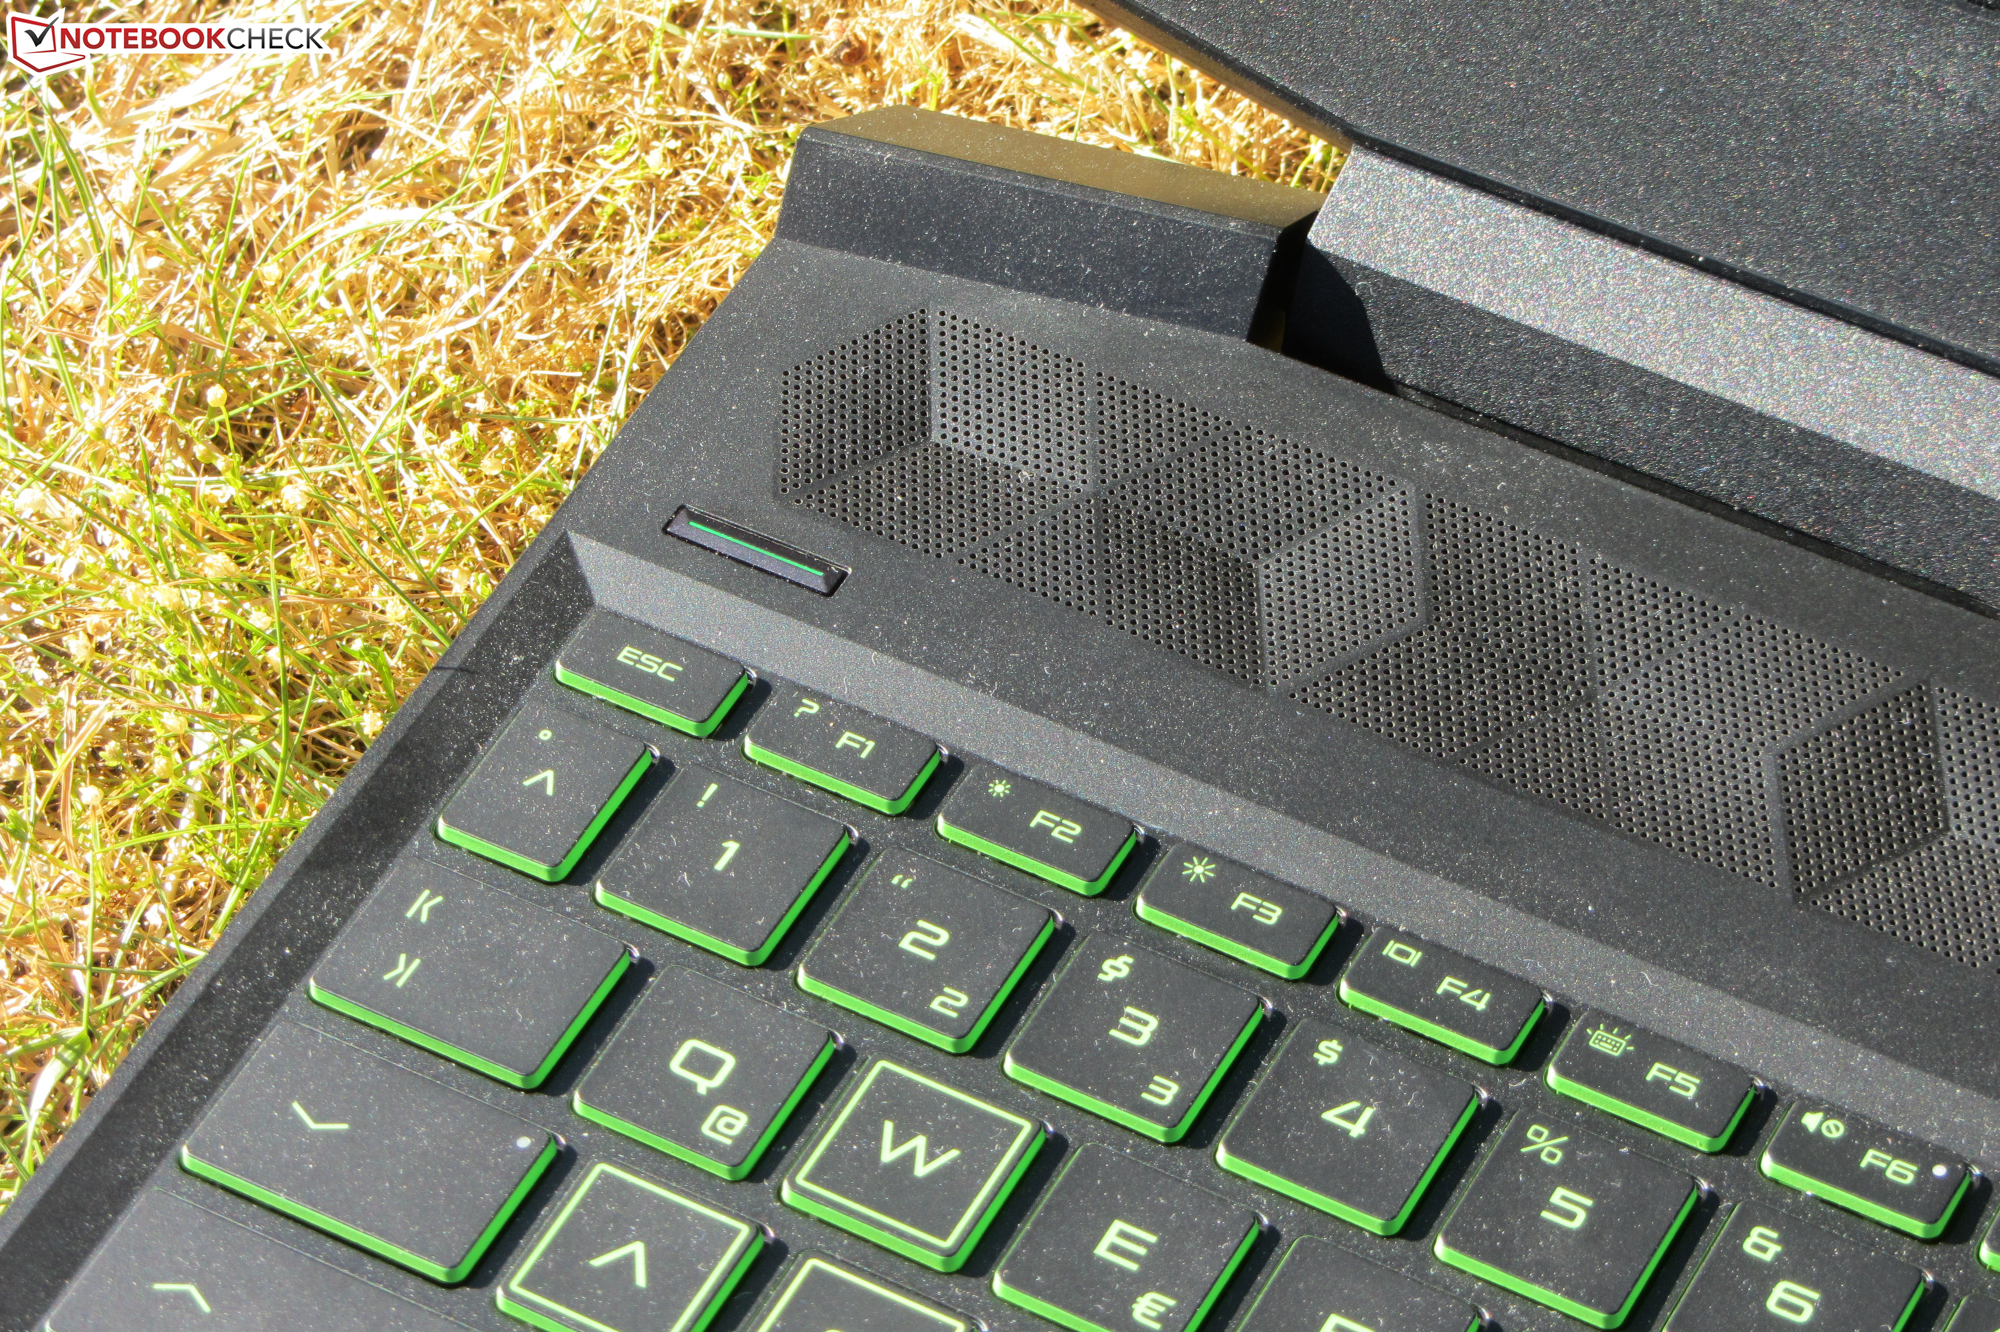
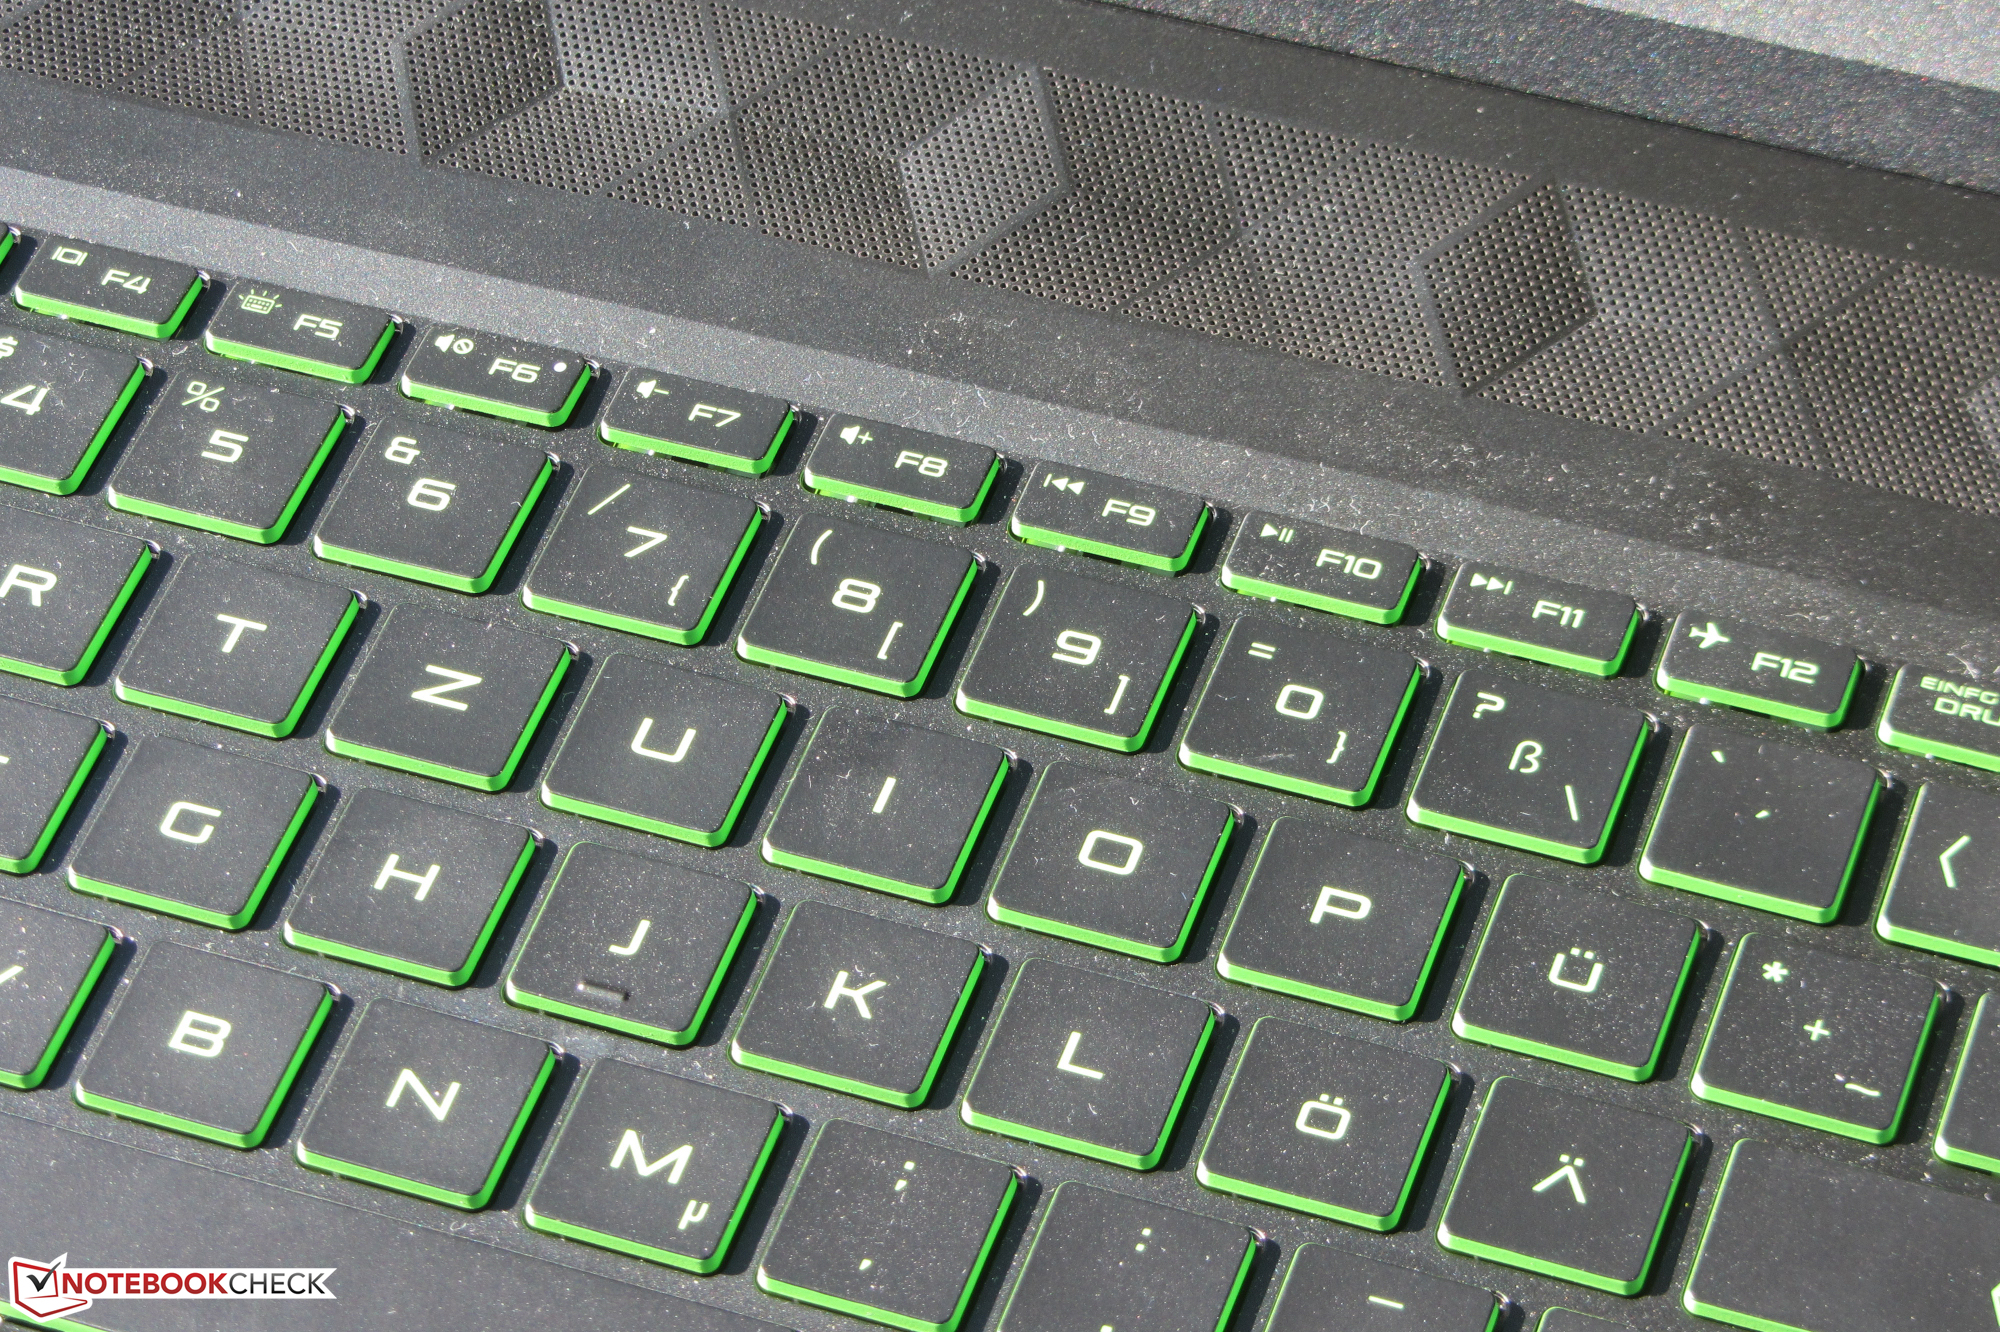
Trots mycket datorkraft behöver du inte ge upp lång batteritid. HP:s laptop når en batteritid på 9 till 11 timmar i ett praktiskt scenario - något inte ens alla kontorsmodeller klarar av. I kombination med ett skapligt tangentbord (med bakgrundsbelysning) passar den dessutom helt okej som en mobil skriv- och webbsurfarenhet.
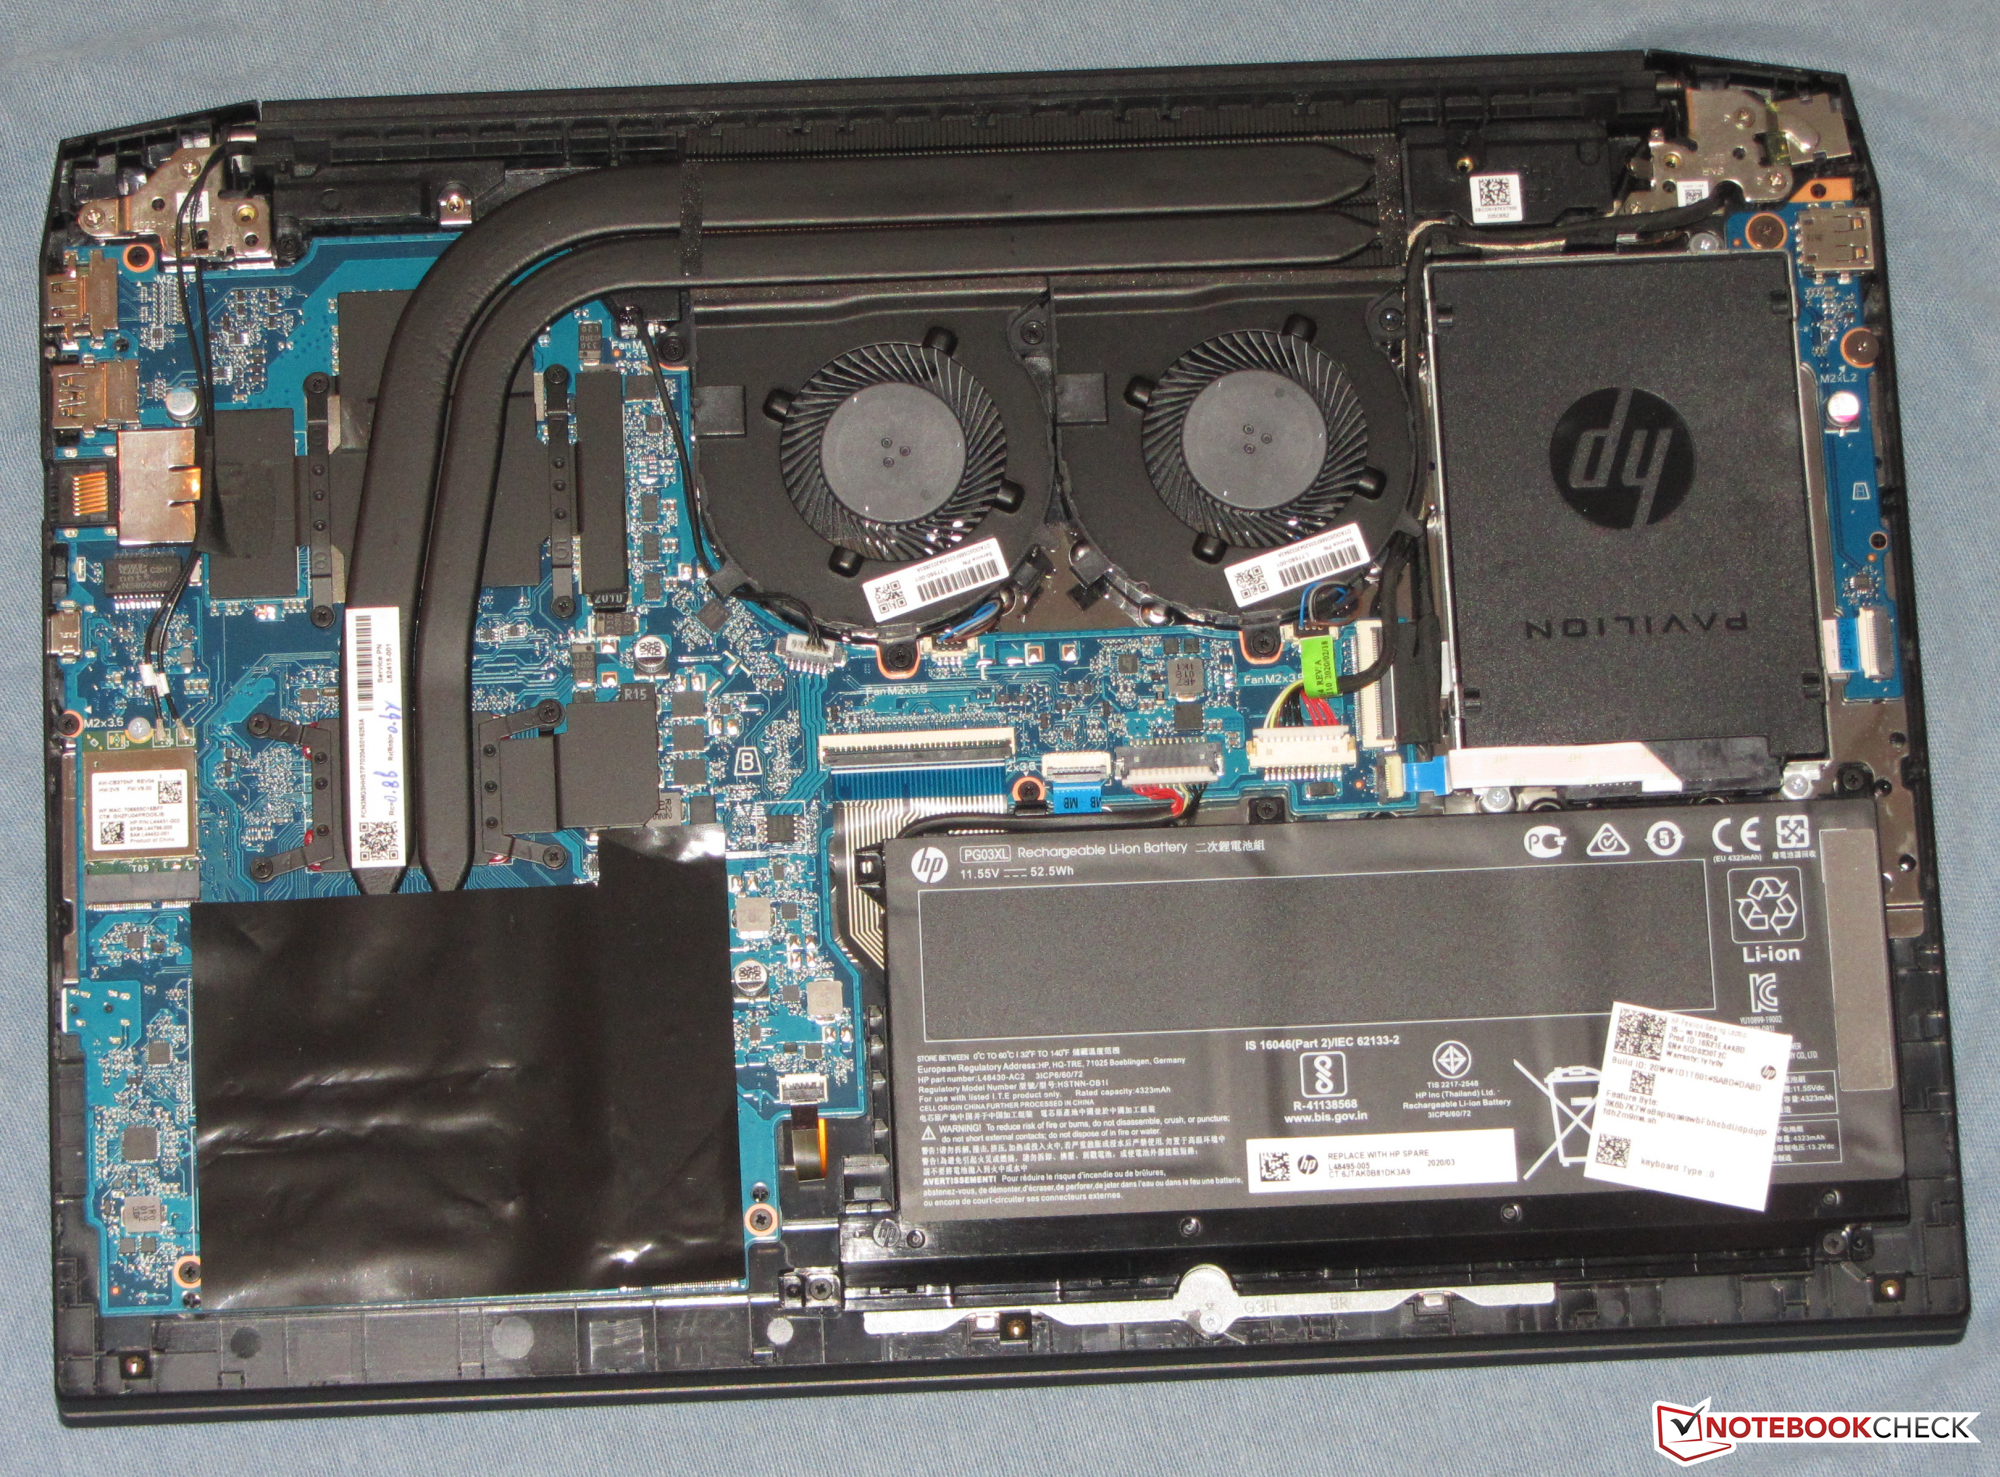
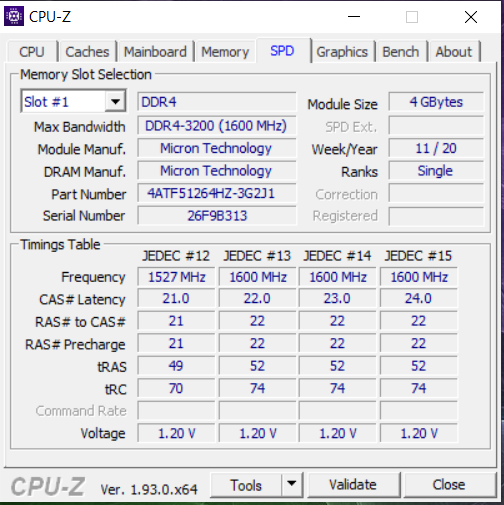
En NVMe SSD-enhet på 512 GB (M.2 2280) säkrar ett snabbt system. Skulle lagringen ta slut går enheten att byta ut eller så går det att installera en lagringsenhet på 2.5 tum i datorn. En SATA-plats och en monteringsram finns tillgängliga. Däremot får man öppna höljet för en sådan installation eftersom den saknar servicelucka.
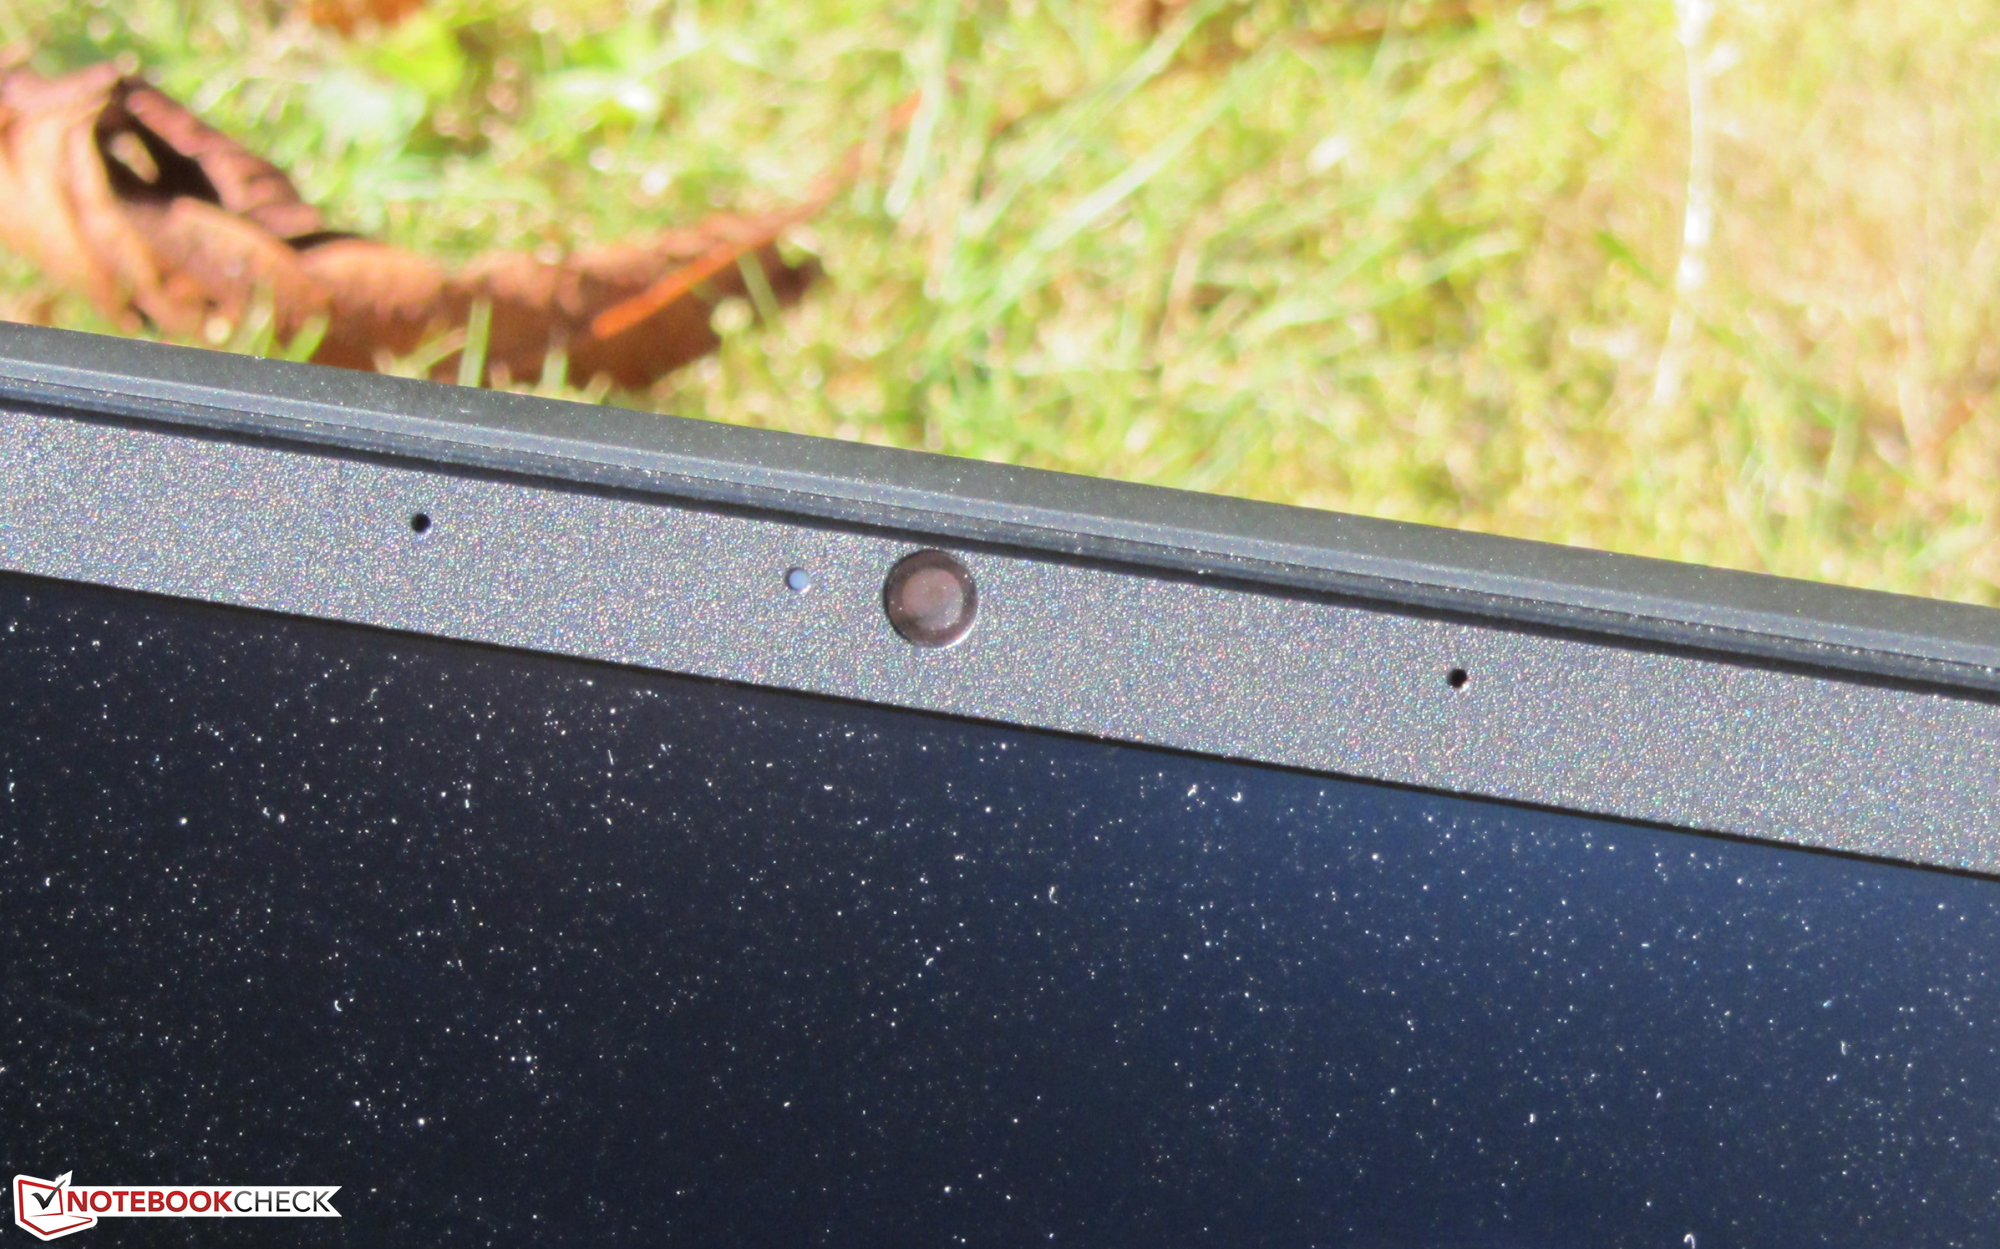
IPS-skärmen har Full HD-upplösning och stabila betraktningsvinklar, en matt yta, hög kontrast och riktigt hygglig färgåtergivning. Men den maximala ljusstyrkan är för låg. Den kunde också varit bättre när det kommer till färgomfånget.
HP Pavilion Gaming 15-ec1206ng
- 08/25/2020 v7 (old)
Sascha Mölck
Price comparison
