Test: HP Pavilion Gaming 15 - Billig spellaptop med mycket kraft under huven (Sammanfattning)
Gradering | Datum | Modell | Vikt | Höjd | Storlek | Upplösning | Pris |
|---|---|---|---|---|---|---|---|
| 81.1 % v7 (old) | 10/2020 | HP Pavilion Gaming 15-ec1177ng R7 4800H, GeForce GTX 1660 Ti Max-Q | 2 kg | 23.5 mm | 15.60" | 1920x1080 | |
| 81.6 % v7 (old) | 05/2023 | Dell G3 15 3500-G4DG2 i7-10750H, GeForce RTX 2060 Mobile | 2.3 kg | 22 mm | 15.60" | 1920x1080 | |
| 79.8 % v7 (old) | 07/2020 | Acer Nitro 5 AN515-44-R5FT R5 4600H, GeForce GTX 1650 Ti Mobile | 2.2 kg | 24 mm | 15.60" | 1920x1080 | |
| 82.7 % v7 (old) | Asus TUF Gaming A15 FA506IV-HN172 R7 4800H, GeForce RTX 2060 Mobile | 2.2 kg | 24.9 mm | 15.60" | 1920x1080 | ||
| 78.4 % v7 (old) | 08/2020 | Lenovo IdeaPad Gaming 3i 15IMH05 i5-10300H, GeForce GTX 1650 Mobile | 2.2 kg | 24.9 mm | 15.60" | 1920x1080 |
Portar
| SD Card Reader | |
| average JPG Copy Test (av. of 3 runs) | |
| Genomsnitt av klass Gaming (20.9 - 210, n=54, senaste 2 åren) | |
| HP Pavilion Gaming 15-ec1206ng (Toshiba Exceria Pro SDXC 64 GB UHS-II) | |
| HP Pavilion Gaming 15-ec1177ng (Toshiba Exceria Pro SDXC 64 GB UHS-II) | |
| HP Pavilion Gaming 15-ec0017ng (Toshiba Exceria Pro SDXC 64 GB UHS-II) | |
| HP Pavilion Gaming 15-ec0002ng (Toshiba Exceria Pro SDXC 64 GB UHS-II) | |
| Dell G3 15 3500-G4DG2 (Toshiba Exceria Pro SDXC 64 GB UHS-II) | |
| maximum AS SSD Seq Read Test (1GB) | |
| Genomsnitt av klass Gaming (25.5 - 261, n=51, senaste 2 åren) | |
| HP Pavilion Gaming 15-ec0017ng (Toshiba Exceria Pro SDXC 64 GB UHS-II) | |
| HP Pavilion Gaming 15-ec0002ng (Toshiba Exceria Pro SDXC 64 GB UHS-II) | |
| HP Pavilion Gaming 15-ec1177ng (Toshiba Exceria Pro SDXC 64 GB UHS-II) | |
| HP Pavilion Gaming 15-ec1206ng (Toshiba Exceria Pro SDXC 64 GB UHS-II) | |
| Dell G3 15 3500-G4DG2 (Toshiba Exceria Pro SDXC 64 GB UHS-II) | |
| Networking | |
| iperf3 transmit AX12 | |
| Asus ROG Strix G15 G512LI | |
| Acer Nitro 5 AN515-44-R5FT | |
| Dell G3 15 3500-G4DG2 | |
| Asus TUF Gaming A15 FA506IV-HN172 | |
| HP Pavilion Gaming 15-ec1177ng | |
| HP Pavilion Gaming 15-ec0017ng | |
| HP Pavilion Gaming 15-ec0002ng | |
| HP Pavilion Gaming 15-ec1206ng | |
| Lenovo IdeaPad Gaming 3i 15IMH05 | |
| Genomsnitt Realtek 8822CE Wireless LAN 802.11ac PCI-E NIC (87 - 690, n=29) | |
| iperf3 receive AX12 | |
| Dell G3 15 3500-G4DG2 | |
| Acer Nitro 5 AN515-44-R5FT | |
| Asus ROG Strix G15 G512LI | |
| HP Pavilion Gaming 15-ec1206ng | |
| Lenovo IdeaPad Gaming 3i 15IMH05 | |
| HP Pavilion Gaming 15-ec1177ng | |
| HP Pavilion Gaming 15-ec0002ng | |
| Asus TUF Gaming A15 FA506IV-HN172 | |
| Genomsnitt Realtek 8822CE Wireless LAN 802.11ac PCI-E NIC (486 - 685, n=29) | |
| HP Pavilion Gaming 15-ec0017ng | |


| |||||||||||||||||||||||||
Distribution av ljusstyrkan: 84 %
Mitt på batteriet: 365 cd/m²
Kontrast: 1962:1 (Svärta: 0.185 cd/m²)
ΔE ColorChecker Calman: 2.69 | ∀{0.5-29.43 Ø4.72}
calibrated: 1.7
ΔE Greyscale Calman: 2.77 | ∀{0.09-98 Ø4.97}
92.8% sRGB (Argyll 1.6.3 3D)
60.3% AdobeRGB 1998 (Argyll 1.6.3 3D)
65.9% AdobeRGB 1998 (Argyll 3D)
93.1% sRGB (Argyll 3D)
64.9% Display P3 (Argyll 3D)
Gamma: 2.56
CCT: 6385 K
| HP Pavilion Gaming 15-ec1177ng LG Philips LP156WFG-SPK1, IPS, 1920x1080, 15.6" | Dell G3 15 3500-G4DG2 AU Optronics AUO80ED, IPS, 1920x1080, 15.6" | Acer Nitro 5 AN515-44-R5FT Panda LM156LF-2F01 (NCP004D), IPS, 1920x1080, 15.6" | Asus TUF Gaming A15 FA506IV-HN172 LM156LF-2F01, IPS, 1920x1080, 15.6" | Lenovo IdeaPad Gaming 3i 15IMH05 BOE CQ NV156FHM-NX1, IPS, 1920x1080, 15.6" | Asus ROG Strix G15 G512LI Panda LM156LF-2F01, IPS, 1920x1080, 15.6" | HP Pavilion Gaming 15-ec1206ng Chi Mei CMN150D, IPS, 1920x1080, 15.6" | HP Pavilion Gaming 15-ec0002ng Chi Mei N156HGA-EA3, TN LED, 1920x1080, 15.6" | HP Pavilion Gaming 15-ec0017ng AU Optronics B156HAK02.0, IPS, 1920x1080, 15.6" | |
|---|---|---|---|---|---|---|---|---|---|
| Display | 1% | -35% | -39% | -40% | -38% | -35% | -35% | -3% | |
| Display P3 Coverage (%) | 64.9 | 64.6 0% | 41.16 -37% | 38.92 -40% | 38.04 -41% | 39.73 -39% | 41.36 -36% | 41.22 -36% | 62.8 -3% |
| sRGB Coverage (%) | 93.1 | 93.9 1% | 61.8 -34% | 58.5 -37% | 56.6 -39% | 59.8 -36% | 62 -33% | 61.8 -34% | 89.2 -4% |
| AdobeRGB 1998 Coverage (%) | 65.9 | 66.4 1% | 42.56 -35% | 40.22 -39% | 39.3 -40% | 41.06 -38% | 42.76 -35% | 42.62 -35% | 63.8 -3% |
| Response Times | 20% | -164% | -116% | -56% | -131% | -107% | -106% | -157% | |
| Response Time Grey 50% / Grey 80% * (ms) | 16 ? | 14 ? 12% | 40.8 ? -155% | 34 ? -113% | 25 ? -56% | 33.6 ? -110% | 33.6 ? -110% | 44 ? -175% | 40 ? -150% |
| Response Time Black / White * (ms) | 11 ? | 8 ? 27% | 30 ? -173% | 24 ? -118% | 17 ? -55% | 27.6 ? -151% | 22.4 ? -104% | 15 ? -36% | 29 ? -164% |
| PWM Frequency (Hz) | 24750 ? | 250 ? | |||||||
| Screen | -28% | -55% | -66% | -89% | -79% | -23% | -107% | -33% | |
| Brightness middle (cd/m²) | 363 | 301 -17% | 287 -21% | 280 -23% | 305 -16% | 271.2 -25% | 277 -24% | 233 -36% | 302 -17% |
| Brightness (cd/m²) | 327 | 298 -9% | 271 -17% | 254 -22% | 294 -10% | 252 -23% | 248 -24% | 211 -35% | 291 -11% |
| Brightness Distribution (%) | 84 | 81 -4% | 88 5% | 88 5% | 70 -17% | 79 -6% | 83 -1% | 82 -2% | 84 0% |
| Black Level * (cd/m²) | 0.185 | 0.23 -24% | 0.25 -35% | 0.15 19% | 0.405 -119% | 0.53 -186% | 0.16 14% | 0.405 -119% | 0.25 -35% |
| Contrast (:1) | 1962 | 1309 -33% | 1148 -41% | 1867 -5% | 753 -62% | 512 -74% | 1731 -12% | 575 -71% | 1208 -38% |
| Colorchecker dE 2000 * | 2.69 | 4.68 -74% | 4.77 -77% | 5.89 -119% | 6.01 -123% | 5.04 -87% | 3.6 -34% | 8.22 -206% | 4.84 -80% |
| Colorchecker dE 2000 max. * | 5.06 | 17.15 -239% | 19 -275% | 21.9 -333% | 16.07 -218% | 8.53 -69% | 18.6 -268% | 8.18 -62% | |
| Colorchecker dE 2000 calibrated * | 1.7 | 1.87 -10% | 3.73 -119% | 4.79 -182% | 5.12 -201% | 4.26 -151% | 2.88 -69% | 2.63 -55% | |
| Greyscale dE 2000 * | 2.77 | 5.79 -109% | 2.7 3% | 4.08 -47% | 3.23 -17% | 3.4 -23% | 1.75 37% | 10.13 -266% | 4.31 -56% |
| Gamma | 2.56 86% | 2.46 89% | 2.115 104% | 2.33 94% | 2.43 91% | 2.09 105% | 2.23 99% | 2.27 97% | 2.56 86% |
| CCT | 6385 102% | 7706 84% | 7187 90% | 7303 89% | 6818 95% | 7079 92% | 6695 97% | 11323 57% | 7318 89% |
| Color Space (Percent of AdobeRGB 1998) (%) | 60.3 | 61 1% | 43 -29% | 37 -39% | 36 -40% | 37.8 -37% | 39 -35% | 39 -35% | 58 -4% |
| Color Space (Percent of sRGB) (%) | 92.8 | 94 1% | 61 -34% | 58 -37% | 56 -40% | 59.5 -36% | 62 -33% | 62 -33% | 89 -4% |
| Totalt genomsnitt (program/inställningar) | -2% /
-16% | -85% /
-65% | -74% /
-67% | -62% /
-76% | -83% /
-78% | -55% /
-36% | -83% /
-92% | -64% /
-43% |
* ... mindre är bättre
Visa svarstider
| ↔ Svarstid svart till vitt | ||
|---|---|---|
| 11 ms ... stiga ↗ och falla ↘ kombinerat | ↗ 7 ms stiga | 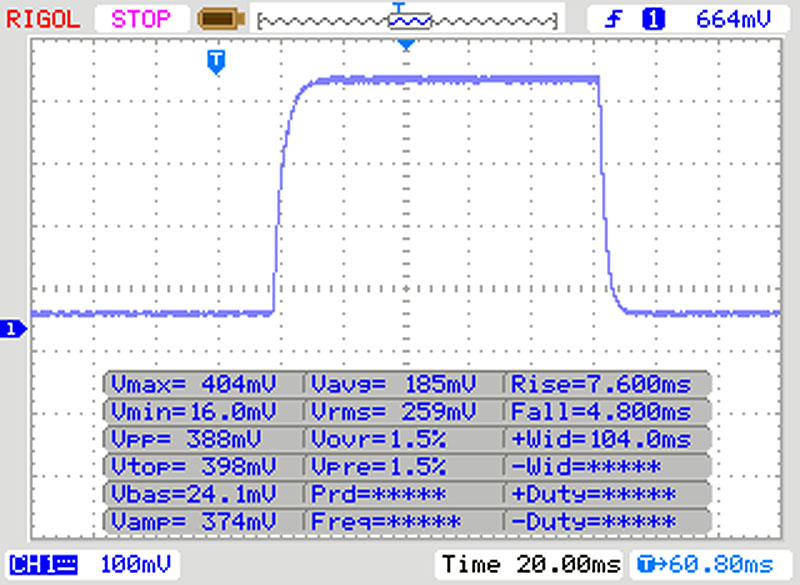 |
| ↘ 4 ms hösten | ||
| Skärmen visar bra svarsfrekvens i våra tester, men kan vara för långsam för konkurrenskraftiga spelare. I jämförelse sträcker sig alla testade enheter från 0.1 (minst) till 240 (maximalt) ms. » 29 % av alla enheter är bättre. Det betyder att den uppmätta svarstiden är bättre än genomsnittet av alla testade enheter (19.9 ms). | ||
| ↔ Svarstid 50 % grått till 80 % grått | ||
| 16 ms ... stiga ↗ och falla ↘ kombinerat | ↗ 9 ms stiga |  |
| ↘ 7 ms hösten | ||
| Skärmen visar bra svarsfrekvens i våra tester, men kan vara för långsam för konkurrenskraftiga spelare. I jämförelse sträcker sig alla testade enheter från 0.165 (minst) till 636 (maximalt) ms. » 30 % av alla enheter är bättre. Det betyder att den uppmätta svarstiden är bättre än genomsnittet av alla testade enheter (31.1 ms). | ||
Skärmflimmer / PWM (Puls-Width Modulation)
| Skärmflimmer / PWM upptäcktes inte |  | ||
Som jämförelse: 52 % av alla testade enheter använder inte PWM för att dämpa skärmen. Om PWM upptäcktes mättes ett medelvärde av 7784 (minst: 5 - maximum: 343500) Hz. | |||
| Cinebench R15 | |
| CPU Single 64Bit | |
| Genomsnitt av klass Gaming (188.8 - 343, n=109, senaste 2 åren) | |
| Dell G3 15 3500-G4DG2 | |
| Asus ROG Strix G15 G512LI | |
| Lenovo IdeaPad Gaming 3i 15IMH05 | |
| Genomsnitt AMD Ryzen 7 4800H (186 - 191, n=15) | |
| HP Pavilion Gaming 15-ec1177ng | |
| Asus TUF Gaming A15 FA506IV-HN172 | |
| Acer Nitro 5 AN515-44-R5FT | |
| HP Pavilion Gaming 15-ec1206ng | |
| HP Pavilion Gaming 15-ec0002ng | |
| HP Pavilion Gaming 15-ec0017ng | |
| CPU Multi 64Bit | |
| Genomsnitt av klass Gaming (1578 - 6271, n=109, senaste 2 åren) | |
| HP Pavilion Gaming 15-ec1177ng | |
| Genomsnitt AMD Ryzen 7 4800H (1652 - 1995, n=21) | |
| Asus TUF Gaming A15 FA506IV-HN172 | |
| HP Pavilion Gaming 15-ec1206ng | |
| Acer Nitro 5 AN515-44-R5FT | |
| Asus ROG Strix G15 G512LI | |
| Dell G3 15 3500-G4DG2 | |
| Lenovo IdeaPad Gaming 3i 15IMH05 | |
| HP Pavilion Gaming 15-ec0017ng | |
| HP Pavilion Gaming 15-ec0002ng | |
| Cinebench R20 | |
| CPU (Single Core) | |
| Genomsnitt av klass Gaming (442 - 895, n=109, senaste 2 åren) | |
| HP Pavilion Gaming 15-ec1177ng | |
| Asus TUF Gaming A15 FA506IV-HN172 | |
| Genomsnitt AMD Ryzen 7 4800H (462 - 491, n=17) | |
| Dell G3 15 3500-G4DG2 | |
| Lenovo IdeaPad Gaming 3i 15IMH05 | |
| Asus ROG Strix G15 G512LI | |
| HP Pavilion Gaming 15-ec1206ng | |
| Acer Nitro 5 AN515-44-R5FT | |
| HP Pavilion Gaming 15-ec0002ng | |
| CPU (Multi Core) | |
| Genomsnitt av klass Gaming (4029 - 16108, n=109, senaste 2 åren) | |
| HP Pavilion Gaming 15-ec1177ng | |
| Genomsnitt AMD Ryzen 7 4800H (3692 - 4663, n=18) | |
| Asus TUF Gaming A15 FA506IV-HN172 | |
| HP Pavilion Gaming 15-ec1206ng | |
| Acer Nitro 5 AN515-44-R5FT | |
| Asus ROG Strix G15 G512LI | |
| Dell G3 15 3500-G4DG2 | |
| Lenovo IdeaPad Gaming 3i 15IMH05 | |
| HP Pavilion Gaming 15-ec0002ng | |
| Geekbench 5.5 | |
| Single-Core | |
| Genomsnitt av klass Gaming (986 - 2474, n=108, senaste 2 åren) | |
| Dell G3 15 3500-G4DG2 | |
| Lenovo IdeaPad Gaming 3i 15IMH05 | |
| HP Pavilion Gaming 15-ec1177ng | |
| Genomsnitt AMD Ryzen 7 4800H (1154 - 1207, n=17) | |
| Asus TUF Gaming A15 FA506IV-HN172 | |
| Asus ROG Strix G15 G512LI | |
| HP Pavilion Gaming 15-ec1206ng | |
| Acer Nitro 5 AN515-44-R5FT | |
| HP Pavilion Gaming 15-ec0002ng | |
| Multi-Core | |
| Genomsnitt av klass Gaming (6460 - 27010, n=108, senaste 2 åren) | |
| HP Pavilion Gaming 15-ec1177ng | |
| Genomsnitt AMD Ryzen 7 4800H (5920 - 8672, n=17) | |
| Asus ROG Strix G15 G512LI | |
| Dell G3 15 3500-G4DG2 | |
| Asus TUF Gaming A15 FA506IV-HN172 | |
| HP Pavilion Gaming 15-ec1206ng | |
| Acer Nitro 5 AN515-44-R5FT | |
| Lenovo IdeaPad Gaming 3i 15IMH05 | |
| HP Pavilion Gaming 15-ec0002ng | |
| HWBOT x265 Benchmark v2.2 - 4k Preset | |
| Genomsnitt av klass Gaming (11.5 - 44.3, n=108, senaste 2 åren) | |
| HP Pavilion Gaming 15-ec1177ng | |
| Genomsnitt AMD Ryzen 7 4800H (10.8 - 14.1, n=16) | |
| Asus TUF Gaming A15 FA506IV-HN172 | |
| HP Pavilion Gaming 15-ec1206ng | |
| Asus ROG Strix G15 G512LI | |
| Acer Nitro 5 AN515-44-R5FT | |
| Dell G3 15 3500-G4DG2 | |
| Lenovo IdeaPad Gaming 3i 15IMH05 | |
| LibreOffice - 20 Documents To PDF | |
| HP Pavilion Gaming 15-ec1206ng | |
| HP Pavilion Gaming 15-ec1177ng | |
| Acer Nitro 5 AN515-44-R5FT | |
| Genomsnitt AMD Ryzen 7 4800H (28.6 - 95.8, n=14) | |
| Dell G3 15 3500-G4DG2 | |
| Lenovo IdeaPad Gaming 3i 15IMH05 | |
| Asus ROG Strix G15 G512LI | |
| Genomsnitt av klass Gaming (19 - 88.8, n=108, senaste 2 åren) | |
| Asus TUF Gaming A15 FA506IV-HN172 | |
| R Benchmark 2.5 - Overall mean | |
| Dell G3 15 3500-G4DG2 | |
| Lenovo IdeaPad Gaming 3i 15IMH05 | |
| Acer Nitro 5 AN515-44-R5FT | |
| Asus ROG Strix G15 G512LI | |
| HP Pavilion Gaming 15-ec1206ng | |
| Asus TUF Gaming A15 FA506IV-HN172 | |
| Genomsnitt AMD Ryzen 7 4800H (0.562 - 0.603, n=15) | |
| HP Pavilion Gaming 15-ec1177ng | |
| Genomsnitt av klass Gaming (0.3439 - 0.759, n=109, senaste 2 åren) | |
* ... mindre är bättre
| PCMark 8 Home Score Accelerated v2 | 4805 poäng | |
| PCMark 8 Creative Score Accelerated v2 | 5920 poäng | |
| PCMark 8 Work Score Accelerated v2 | 5580 poäng | |
| PCMark 10 Score | 5602 poäng | |
Hjälp | ||
| PCMark 8 - Home Score Accelerated v2 | |
| Genomsnitt av klass Gaming (n=1senaste 2 åren) | |
| HP Pavilion Gaming 15-ec1177ng | |
| Genomsnitt AMD Ryzen 7 4800H, NVIDIA GeForce GTX 1660 Ti Max-Q (n=1) | |
| Asus TUF Gaming A15 FA506IV-HN172 | |
| Asus ROG Strix G15 G512LI | |
| HP Pavilion Gaming 15-ec1206ng | |
| HP Pavilion Gaming 15-ec0017ng | |
| Lenovo IdeaPad Gaming 3i 15IMH05 | |
| HP Pavilion Gaming 15-ec0002ng | |
| DPC Latencies / LatencyMon - interrupt to process latency (max), Web, Youtube, Prime95 | |
| Dell G3 15 3500-G4DG2 | |
| Asus ROG Strix G15 G512LI | |
| Acer Nitro 5 AN515-44-R5FT | |
| Asus TUF Gaming A15 FA506IV-HN172 | |
| HP Pavilion Gaming 15-ec1177ng | |
| Lenovo IdeaPad Gaming 3i 15IMH05 | |
| HP Pavilion Gaming 15-ec1206ng | |
* ... mindre är bättre

| HP Pavilion Gaming 15-ec1177ng Intel SSD 660p SSDPEKNW512G8 | Dell G3 15 3500-G4DG2 SK Hynix BC511 HFM512GDJTNI | Acer Nitro 5 AN515-44-R5FT SK Hynix BC511 HFM512GDJTNI | Asus TUF Gaming A15 FA506IV-HN172 Kingston OM8PCP3512F-AB | Lenovo IdeaPad Gaming 3i 15IMH05 SK hynix BC511 HFM512GDHTNI-87A0B | Asus ROG Strix G15 G512LI Intel SSD 660p SSDPEKNW512G8 | HP Pavilion Gaming 15-ec1206ng Toshiba KBG40ZNV512G | HP Pavilion Gaming 15-ec0002ng Intel SSD 660p SSDPEKNW512G8 | HP Pavilion Gaming 15-ec0017ng WDC PC SN720 SDAPNTW-256G | Genomsnitt Intel SSD 660p SSDPEKNW512G8 | Genomsnitt av klass Gaming | |
|---|---|---|---|---|---|---|---|---|---|---|---|
| CrystalDiskMark 5.2 / 6 | -4% | 0% | 15% | 1% | -4% | 16% | -3% | 23% | -1% | 174% | |
| Write 4K (MB/s) | 110 | 99.6 -9% | 94.7 -14% | 219.8 100% | 130 18% | 125.4 14% | 111.5 1% | 136.9 24% | 148 35% | 136 ? 24% | 201 ? 83% |
| Read 4K (MB/s) | 52.8 | 38.8 -27% | 38.91 -26% | 50.2 -5% | 44.44 -16% | 52.7 0% | 38.17 -28% | 57 8% | 43.73 -17% | 55.2 ? 5% | 78.2 ? 48% |
| Write Seq (MB/s) | 983 | 1117 14% | 1056 7% | 979 0% | 1059 8% | 943 -4% | 1515 54% | 968 -2% | 1617 64% | 926 ? -6% | 3713 ? 278% |
| Read Seq (MB/s) | 1608 | 1030 -36% | 1183 -26% | 1990 24% | 1105 -31% | 1383 -14% | 1576 -2% | 1631 1% | 1753 9% | 1523 ? -5% | 3617 ? 125% |
| Write 4K Q32T1 (MB/s) | 461.3 | 445.2 -3% | 445.3 -3% | 516 12% | 490.3 6% | 437.9 -5% | 365.4 -21% | 237 -49% | 246.3 -47% | 380 ? -18% | 614 ? 33% |
| Read 4K Q32T1 (MB/s) | 345.4 | 331.8 -4% | 477.7 38% | 298.3 -14% | 309.2 -10% | 334.9 -3% | 504 46% | 337.1 -2% | 368 7% | 334 ? -3% | 716 ? 107% |
| Write Seq Q32T1 (MB/s) | 982 | 1102 12% | 1063 8% | 982 0% | 1053 7% | 960 -2% | 1493 52% | 963 -2% | 1618 65% | 987 ? 1% | 5211 ? 431% |
| Read Seq Q32T1 (MB/s) | 1820 | 2227 22% | 2154 18% | 1907 5% | 2261 24% | 1530 -16% | 2340 29% | 1863 2% | 3027 66% | 1744 ? -4% | 6985 ? 284% |
| Write 4K Q8T8 (MB/s) | 981 | 810 ? | 1306 ? | ||||||||
| Read 4K Q8T8 (MB/s) | 300.9 | 344 ? | 1633 ? | ||||||||
| AS SSD | 10% | 22% | 7% | 13% | -17% | 7% | -40% | 12% | -7% | 200% | |
| Seq Read (MB/s) | 1553 | 1305 -16% | 1504 -3% | 1682 8% | 1348 -13% | 1157 -25% | 2048 32% | 1623 5% | 2607 68% | 1423 ? -8% | 5507 ? 255% |
| Seq Write (MB/s) | 868 | 767 -12% | 1064 23% | 904 4% | 1000 15% | 675 -22% | 1039 20% | 891 3% | 1518 75% | 828 ? -5% | 3923 ? 352% |
| 4K Read (MB/s) | 56.6 | 41.84 -26% | 51.5 -9% | 60.2 6% | 48.04 -15% | 49.99 -12% | 52.8 -7% | 48.06 -15% | 39.16 -31% | 51.3 ? -9% | 70.2 ? 24% |
| 4K Write (MB/s) | 153.6 | 90.1 -41% | 123.2 -20% | 164.8 7% | 103.3 -33% | 114 -26% | 146 -5% | 102.1 -34% | 104.9 -32% | 128.9 ? -16% | 215 ? 40% |
| 4K-64 Read (MB/s) | 325.3 | 773 138% | 703 116% | 472.5 45% | 755 132% | 322.2 -1% | 1285 295% | 325.6 0% | 513 58% | 326 ? 0% | 1630 ? 401% |
| 4K-64 Write (MB/s) | 762 | 711 -7% | 730 -4% | 845 11% | 749 -2% | 759 0% | 758 -1% | 94.1 -88% | 416.7 -45% | 721 ? -5% | 2885 ? 279% |
| Access Time Read * (ms) | 0.07 | 0.09 -29% | 0.064 9% | 0.087 -24% | 0.061 13% | 0.07 -0% | 0.155 -121% | 0.171 -144% | 0.076 -9% | 0.09003 ? -29% | 0.06446 ? 8% |
| Access Time Write * (ms) | 0.046 | 0.04 13% | 0.031 33% | 0.02 57% | 0.036 22% | 0.137 -198% | 0.202 -339% | 0.048 -4% | 0.037 20% | 0.07378 ? -60% | 0.03895 ? 15% |
| Score Read (Points) | 537 | 945 76% | 905 69% | 701 31% | 938 75% | 488 -9% | 1543 187% | 536 0% | 813 51% | 519 ? -3% | 2251 ? 319% |
| Score Write (Points) | 1002 | 878 -12% | 960 -4% | 1101 10% | 952 -5% | 940 -6% | 1008 1% | 285 -72% | 673 -33% | 932 ? -7% | 3491 ? 248% |
| Score Total (Points) | 1802 | 2290 27% | 2321 29% | 2143 19% | 2365 31% | 1673 -7% | 3298 83% | 1077 -40% | 1858 3% | 1708 ? -5% | 6824 ? 279% |
| Copy ISO MB/s (MB/s) | 1301 | 675 -48% | 749 -42% | 939 -28% | 691 -47% | 566 -56% | 1639 26% | 1109 ? -15% | 3082 ? 137% | ||
| Copy Program MB/s (MB/s) | 313.7 | 248.4 -21% | 342.5 9% | 489.9 56% | 345.8 10% | 223.8 -29% | 284.2 -9% | 468 ? 49% | 960 ? 206% | ||
| Copy Game MB/s (MB/s) | 621 | 535 -14% | 571 -8% | 895 44% | 517 -17% | 104.3 -83% | 767 24% | 760 ? 22% | 2048 ? 230% | ||
| Totalt genomsnitt (program/inställningar) | 3% /
4% | 11% /
13% | 11% /
10% | 7% /
8% | -11% /
-12% | 12% /
10% | -22% /
-26% | 18% /
16% | -4% /
-4% | 187% /
190% |
* ... mindre är bättre
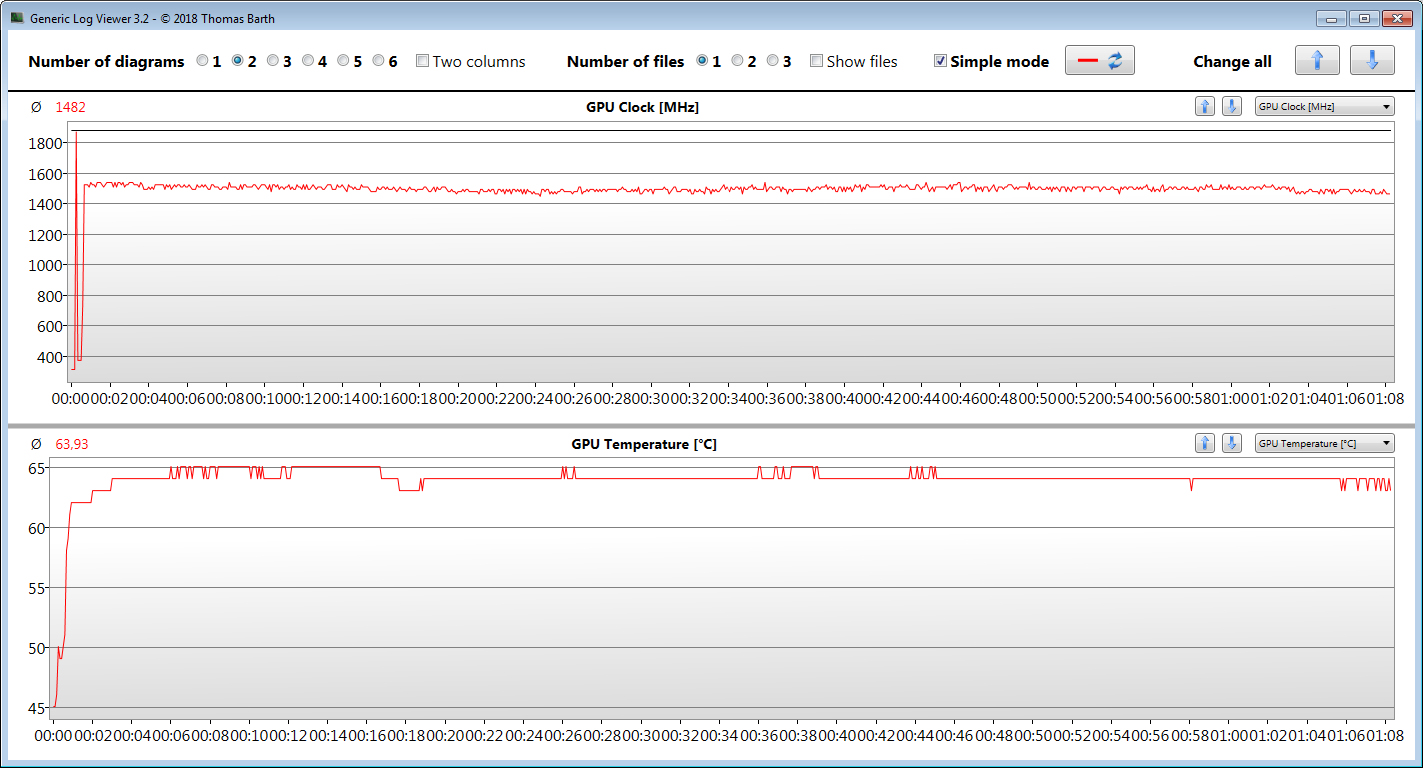
Continuous load read: DiskSpd Read Loop, Queue Depth 8
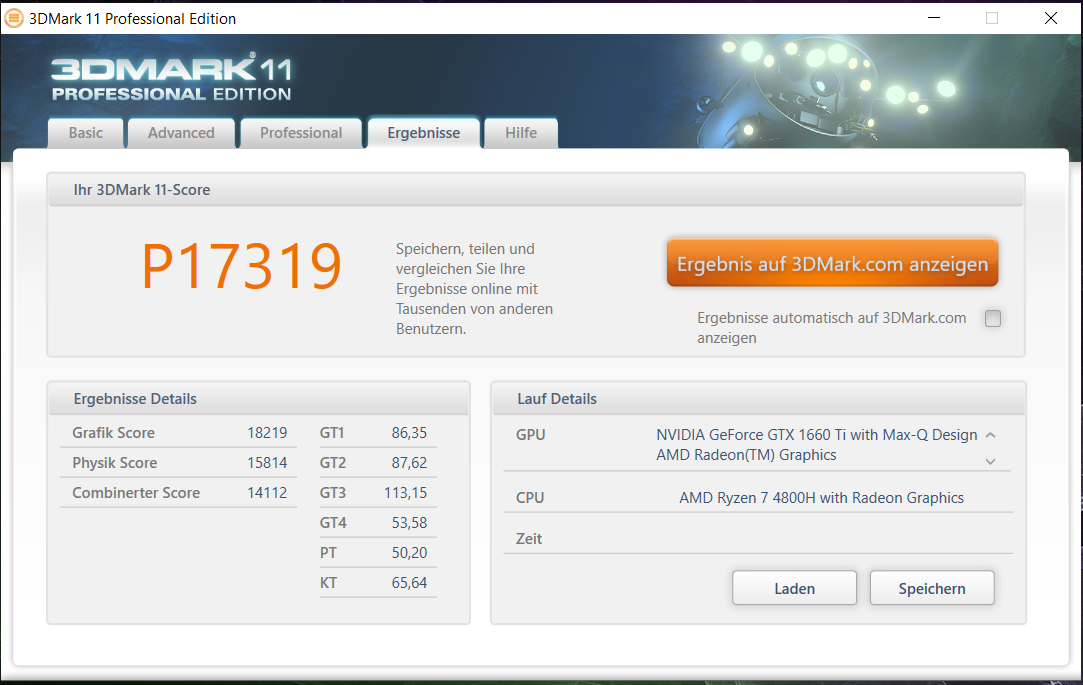
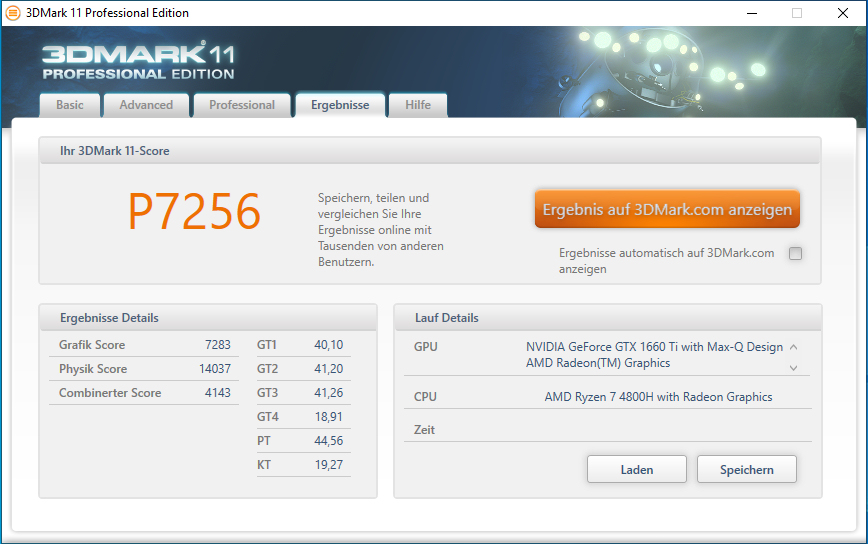
| 3DMark 11 Performance | 17319 poäng | |
| 3DMark Cloud Gate Standard Score | 39942 poäng | |
| 3DMark Fire Strike Score | 12487 poäng | |
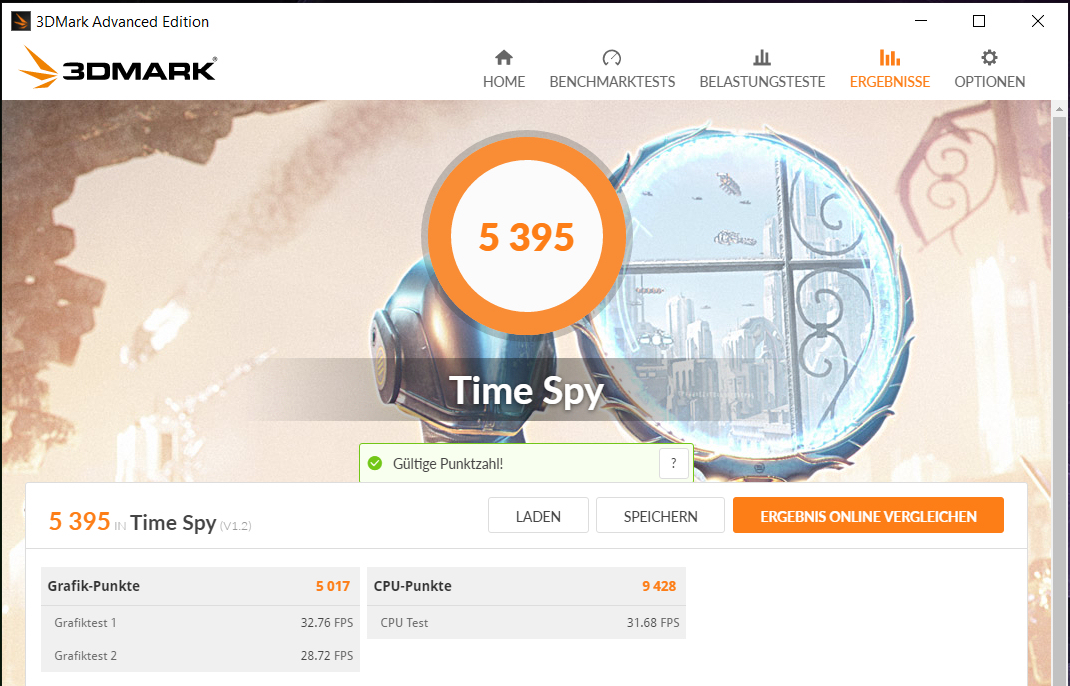
| 3DMark Time Spy Score | 6395 poäng | |
Hjälp | ||
| 3DMark 11 - 1280x720 Performance GPU | |
| Genomsnitt av klass Gaming (21841 - 80022, n=106, senaste 2 åren) | |
| Asus TUF Gaming A15 FA506IV-HN172 | |
| Dell G3 15 3500-G4DG2 | |
| HP Pavilion Gaming 15-ec0017ng | |
| HP Pavilion Gaming 15-ec1177ng | |
| Genomsnitt NVIDIA GeForce GTX 1660 Ti Max-Q (17010 - 18653, n=8) | |
| Asus ROG Strix G15 G512LI | |
| Acer Nitro 5 AN515-44-R5FT | |
| HP Pavilion Gaming 15-ec1206ng | |
| Lenovo IdeaPad Gaming 3i 15IMH05 | |
| HP Pavilion Gaming 15-ec0002ng | |
| The Witcher 3 - 1920x1080 Ultra Graphics & Postprocessing (HBAO+) | |
| Genomsnitt av klass Gaming (95 - 240, n=8, senaste 2 åren) | |
| Asus TUF Gaming A15 FA506IV-HN172 | |
| HP Pavilion Gaming 15-ec1177ng | |
| HP Pavilion Gaming 15-ec0017ng | |
| Dell G3 15 3500-G4DG2 | |
| Genomsnitt NVIDIA GeForce GTX 1660 Ti Max-Q (44.8 - 53.2, n=7) | |
| Asus ROG Strix G15 G512LI | |
| HP Pavilion Gaming 15-ec1206ng | |
| Acer Nitro 5 AN515-44-R5FT | |
| Lenovo IdeaPad Gaming 3i 15IMH05 | |
| HP Pavilion Gaming 15-ec0002ng | |
| BioShock Infinite - 1920x1080 Ultra Preset, DX11 (DDOF) | |
| HP Pavilion Gaming 15-ec1177ng | |
| Asus TUF Gaming A15 FA506IV-HN172 | |
| Genomsnitt NVIDIA GeForce GTX 1660 Ti Max-Q (102.3 - 130, n=5) | |
| HP Pavilion Gaming 15-ec0017ng | |
| Lenovo IdeaPad Gaming 3i 15IMH05 | |
| HP Pavilion Gaming 15-ec1206ng | |
| HP Pavilion Gaming 15-ec0002ng | |
| Red Dead Redemption 2 - 1920x1080 High Settings | |
| HP Pavilion Gaming 15-ec1177ng | |
| Genomsnitt NVIDIA GeForce GTX 1660 Ti Max-Q (n=1) | |
| Acer Nitro 5 AN515-44-R5FT | |
| Lenovo IdeaPad Gaming 3i 15IMH05 | |
| HP Pavilion Gaming 15-ec0002ng | |
| Escape from Tarkov - 1920x1080 Ultra Preset | |
| HP Pavilion Gaming 15-ec1177ng | |
| Genomsnitt NVIDIA GeForce GTX 1660 Ti Max-Q (n=1) | |
| Lenovo IdeaPad Gaming 3i 15IMH05 | |
| Star Wars Jedi Fallen Order - 1920x1080 Epic Preset | |
| HP Pavilion Gaming 15-ec1177ng | |
| Genomsnitt NVIDIA GeForce GTX 1660 Ti Max-Q (n=1) | |
| Lenovo IdeaPad Gaming 3i 15IMH05 | |
| HP Pavilion Gaming 15-ec0002ng | |
| Call of Duty Modern Warfare 2019 - 1920x1080 Maximum Settings AA:T2X Filmic SM | |
| HP Pavilion Gaming 15-ec1177ng | |
| Genomsnitt NVIDIA GeForce GTX 1660 Ti Max-Q (n=1) | |
| Acer Nitro 5 AN515-44-R5FT | |
| Lenovo IdeaPad Gaming 3i 15IMH05 | |
| HP Pavilion Gaming 15-ec1206ng | |
| HP Pavilion Gaming 15-ec0002ng | |
| Doom Eternal - 1920x1080 Ultra Preset | |
| Dell G3 15 3500-G4DG2 | |
| HP Pavilion Gaming 15-ec1177ng | |
| Genomsnitt NVIDIA GeForce GTX 1660 Ti Max-Q (n=1) | |
| F1 2020 - 1920x1080 Ultra High Preset AA:T AF:16x | |
| HP Pavilion Gaming 15-ec1177ng | |
| Genomsnitt NVIDIA GeForce GTX 1660 Ti Max-Q (n=1) | |
| HP Pavilion Gaming 15-ec1206ng | |
| Death Stranding - 1920x1080 Very High Preset | |
| HP Pavilion Gaming 15-ec1177ng | |
| Genomsnitt NVIDIA GeForce GTX 1660 Ti Max-Q (n=1) | |
| HP Pavilion Gaming 15-ec1206ng | |
| låg | med. | hög | ultra | |
|---|---|---|---|---|
| BioShock Infinite (2013) | 263.2 | 249.5 | 226.9 | 119.2 |
| The Witcher 3 (2015) | 258.3 | 166.4 | 95.3 | 53.2 |
| Battlefield V (2018) | 152 | 102.6 | 92.2 | 85 |
| Apex Legends (2019) | 144 | 133.9 | 99.6 | 99.6 |
| Ghost Recon Breakpoint (2019) | 114 | 72 | 66 | 51 |
| Call of Duty Modern Warfare 2019 (2019) | 135.2 | 88 | 72.6 | 62.6 |
| Need for Speed Heat (2019) | 95.8 | 83 | 73.9 | 66.9 |
| Star Wars Jedi Fallen Order (2019) | 91.5 | 78.1 | 72.4 | |
| Red Dead Redemption 2 (2019) | 115.1 | 71.7 | 47.2 | 29.4 |
| Escape from Tarkov (2020) | 121.2 | 98.3 | 90.5 | 87.7 |
| Hunt Showdown (2020) | 176.8 | 81.2 | 63.3 | |
| Doom Eternal (2020) | 168.9 | 101.7 | 95.4 | 93.4 |
| Gears Tactics (2020) | 214.7 | 130.2 | 79.9 | 56.1 |
| F1 2020 (2020) | 219 | 130 | 112 | 79 |
| Death Stranding (2020) | 136.1 | 87.7 | 81.3 | 78.4 |
| Horizon Zero Dawn (2020) | 119 | 78 | 65 | 51 |
| Flight Simulator 2020 (2020) | 55.1 | 49.4 | 37.1 | 25.3 |
Ljudnivå
| Låg belastning |
| 27 / 27 / 27 dB(A) |
| Hög belastning |
| 42.4 / 47 dB(A) |
 | ||
30 dB tyst 40 dB(A) hörbar 50 dB(A) högt ljud |
||
min: | ||
(±) Den maximala temperaturen på ovansidan är 42.9 °C / 109 F, jämfört med genomsnittet av 40.4 °C / 105 F , allt från 21.2 till 68.8 °C för klassen Gaming.
(+) Botten värms upp till maximalt 39.5 °C / 103 F, jämfört med genomsnittet av 43.2 °C / 110 F
(+) Vid tomgångsbruk är medeltemperaturen för ovansidan 25.6 °C / 78 F, jämfört med enhetsgenomsnittet på 33.9 °C / ### class_avg_f### F.
(±) När du spelar The Witcher 3 är medeltemperaturen för ovansidan 32.5 °C / 91 F, jämfört med enhetsgenomsnittet på 33.9 °C / ## #class_avg_f### F.
(±) Handledsstöden och pekplattan kan bli väldigt varma vid beröring med maximalt 36.5 °C / 97.7 F.
(-) Medeltemperaturen för handledsstödsområdet på liknande enheter var 28.8 °C / 83.8 F (-7.7 °C / -13.9 F).
HP Pavilion Gaming 15-ec1177ng ljudanalys
(-) | inte särskilt höga högtalare (60.8 dB)
Bas 100 - 315 Hz
(-) | nästan ingen bas - i genomsnitt 22% lägre än medianen
(±) | linjäriteten för basen är genomsnittlig (11.9% delta till föregående frekvens)
Mellan 400 - 2000 Hz
(+) | balanserad mellan - endast 2.7% från medianen
(±) | linjäriteten för mids är genomsnittlig (10.9% delta till föregående frekvens)
Högsta 2 - 16 kHz
(+) | balanserade toppar - endast 2.3% från medianen
(±) | linjäriteten för toppar är genomsnittlig (7.3% delta till föregående frekvens)
Totalt 100 - 16 000 Hz
(±) | linjäriteten för det totala ljudet är genomsnittlig (23.2% skillnad mot median)
Jämfört med samma klass
» 84% av alla testade enheter i den här klassen var bättre, 4% liknande, 11% sämre
» Den bästa hade ett delta på 6%, genomsnittet var 18%, sämst var 132%
Jämfört med alla testade enheter
» 69% av alla testade enheter var bättre, 5% liknande, 25% sämre
» Den bästa hade ett delta på 4%, genomsnittet var 24%, sämst var 134%
| Av/Standby | |
| Låg belastning | |
| Hög belastning |
|
Förklaring:
min: | |
| Battery Runtime - WiFi Websurfing | |
| HP Pavilion Gaming 15-ec1206ng | |
| Acer Nitro 5 AN515-44-R5FT | |
| HP Pavilion Gaming 15-ec0002ng | |
| HP Pavilion Gaming 15-ec0017ng | |
| Genomsnitt av klass Gaming (1.967 - 14.6, n=102, senaste 2 åren) | |
| Lenovo IdeaPad Gaming 3i 15IMH05 | |
| Asus TUF Gaming A15 FA506IV-HN172 | |
| HP Pavilion Gaming 15-ec1177ng | |
| Dell G3 15 3500-G4DG2 | |
| Asus ROG Strix G15 G512LI | |
För
Emot

Läs den fullständiga versionen av den här recensionen på engelska här.
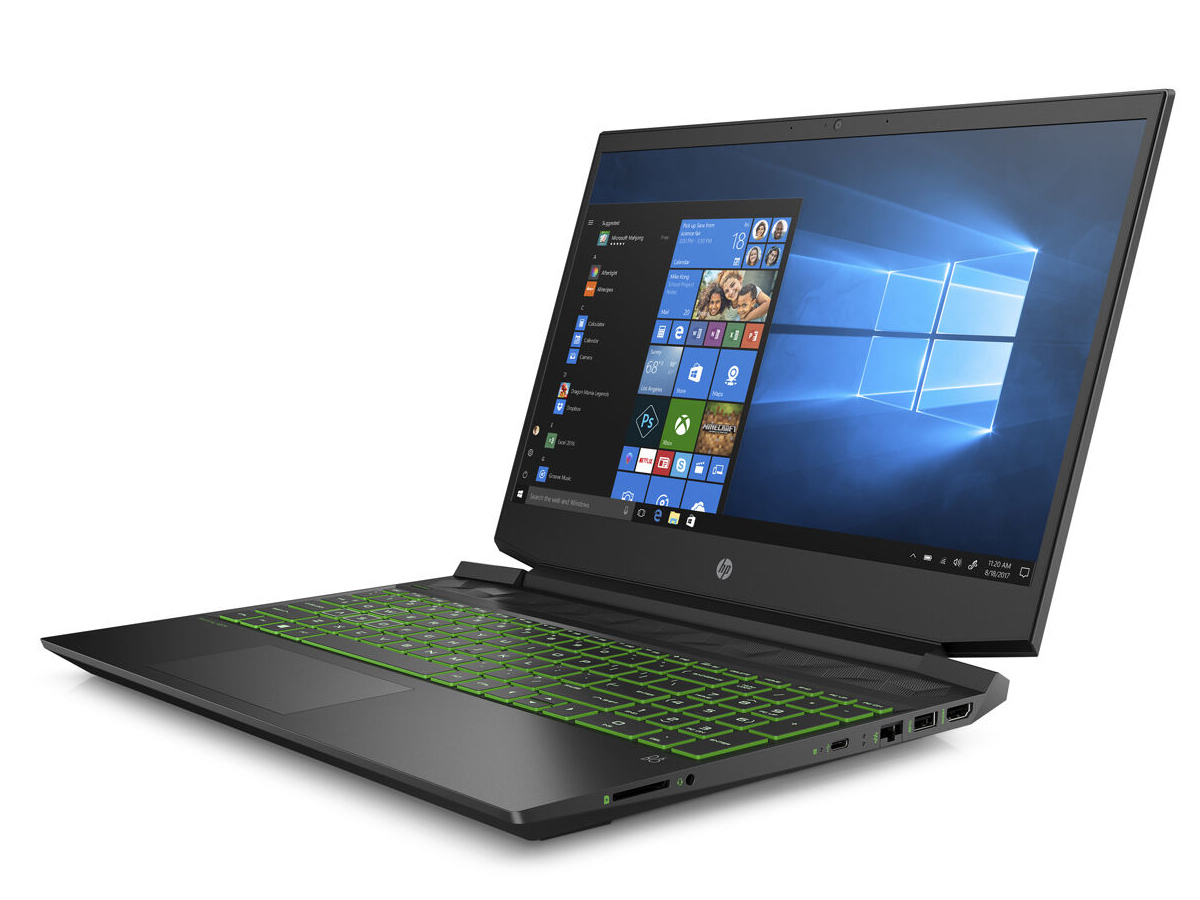
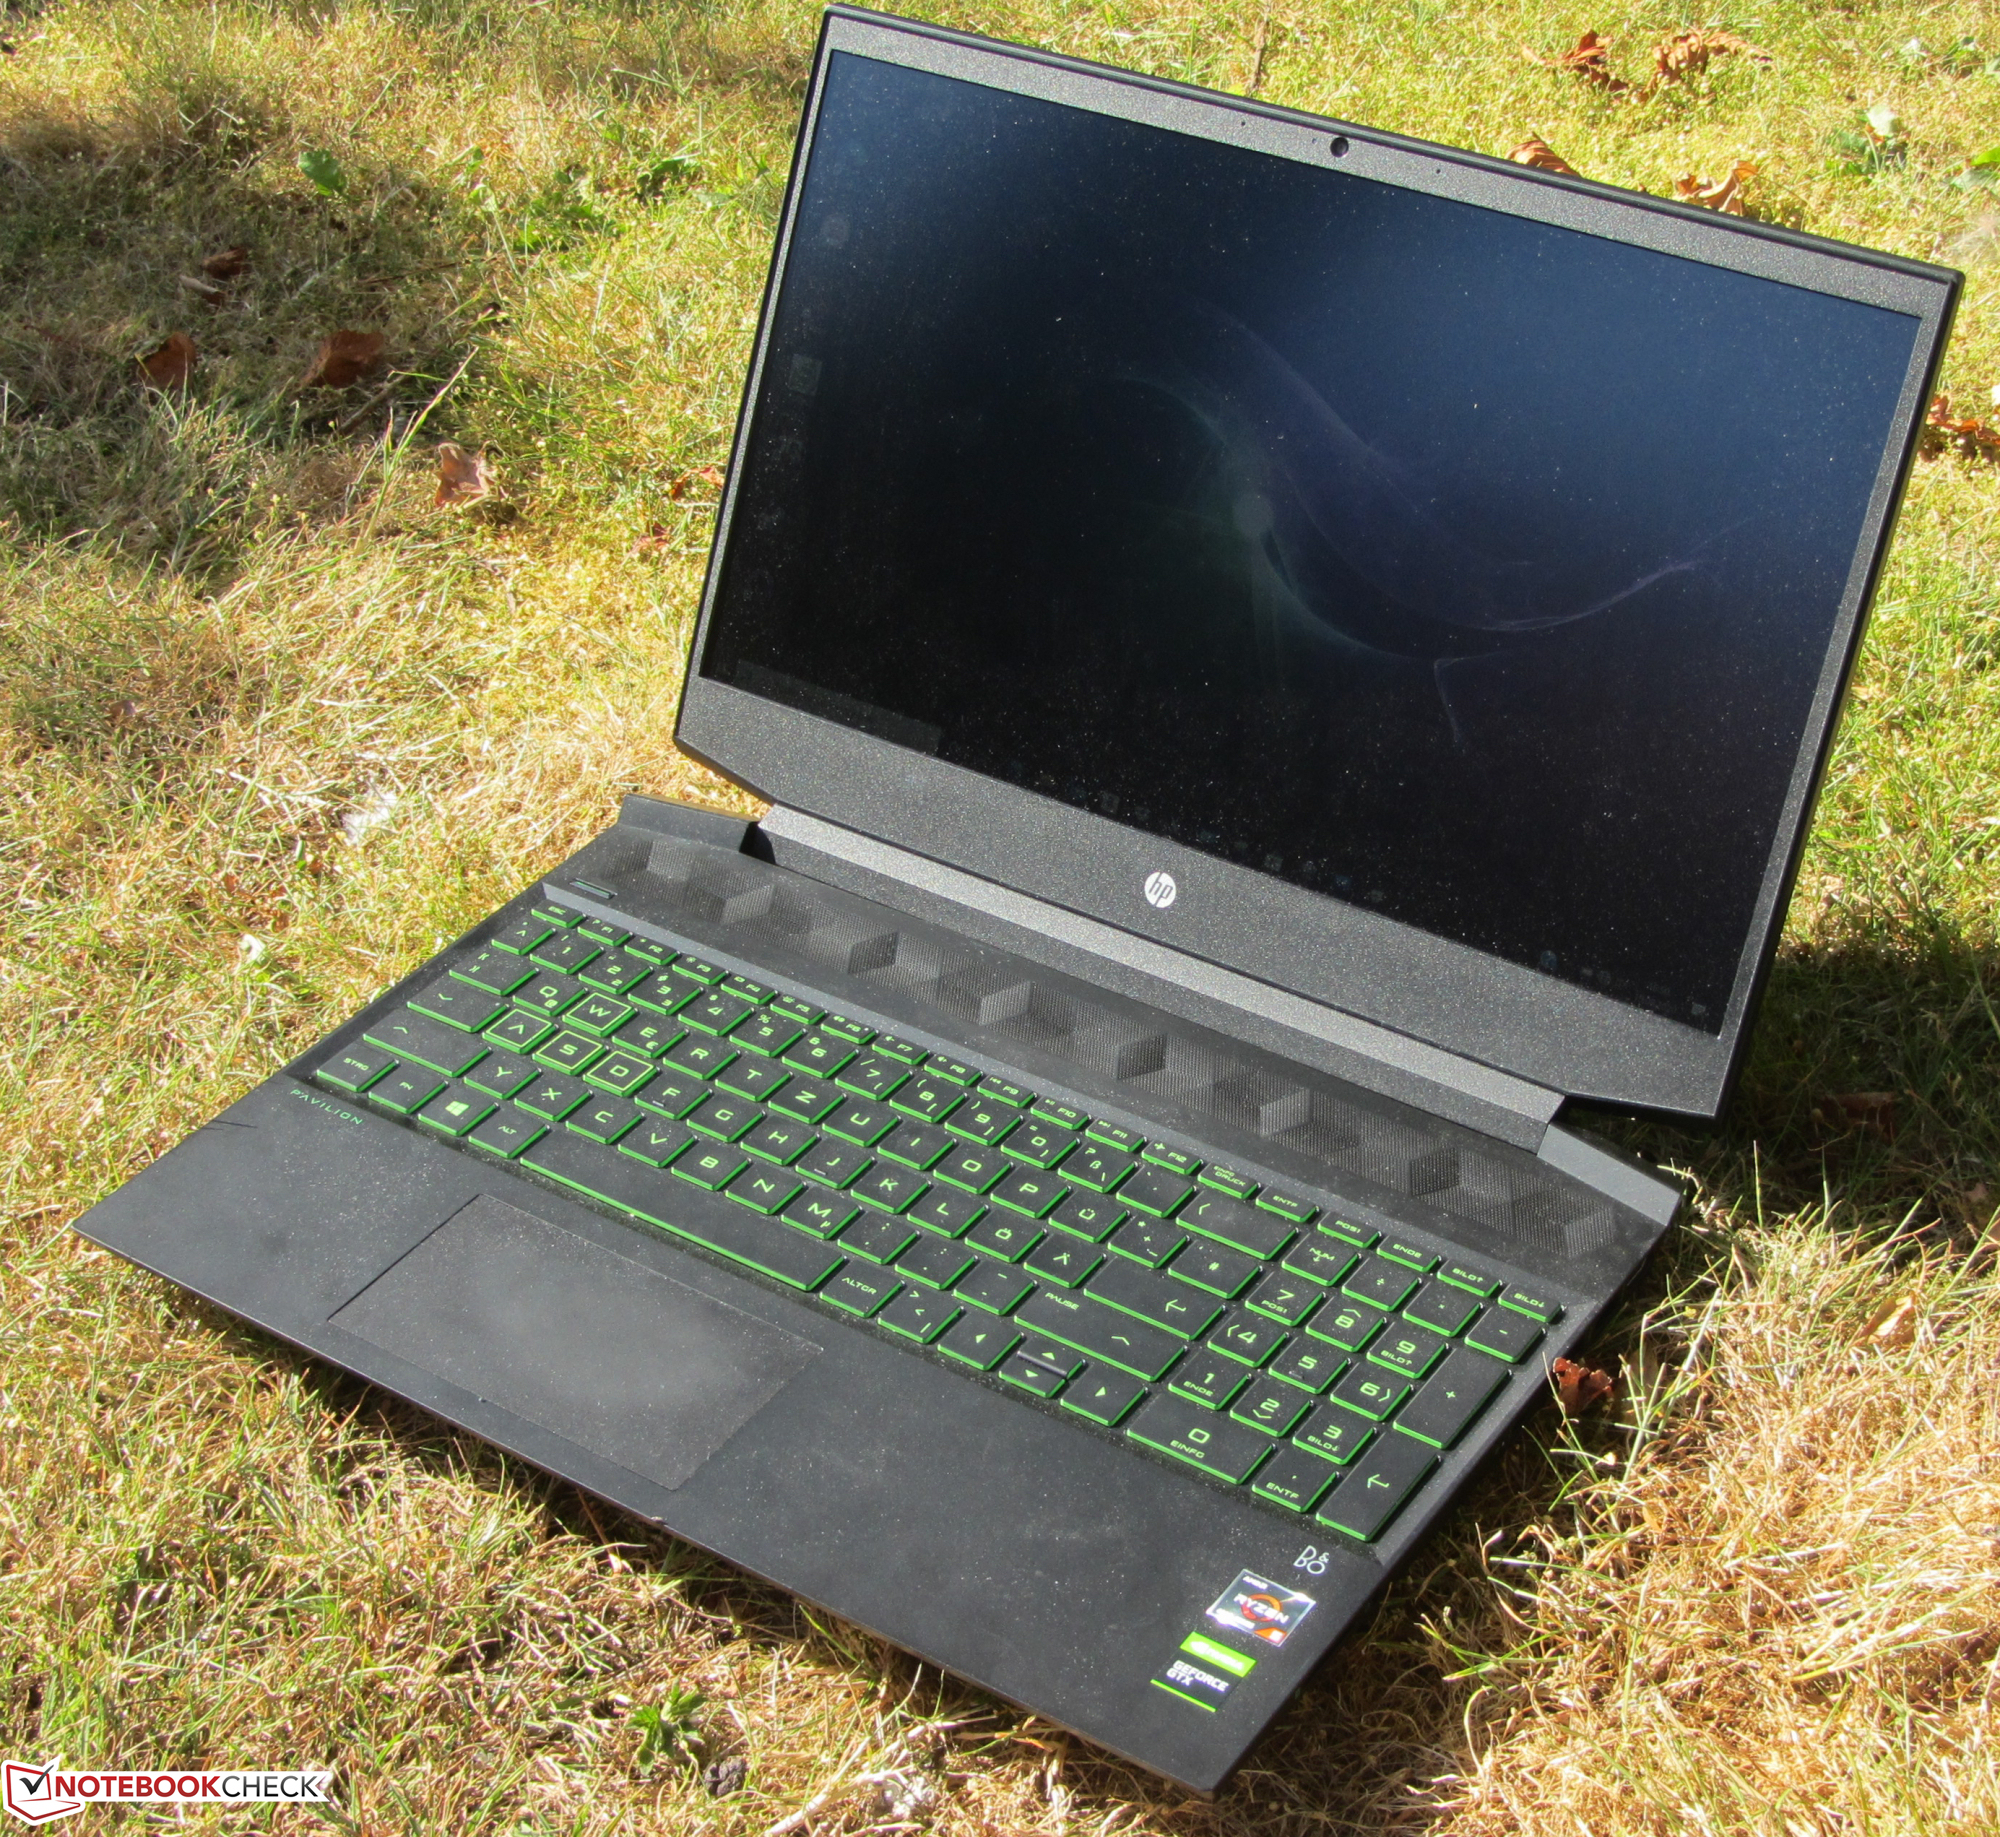
Tack vare en Ryzen 7 4800H APU och en GeForce GTX 1660 Ti Max-Q GPU kan Pavilion Gaming visa alla moderna spel smidigt på sin skärm. Det går oftast att använda Full HD-upplösning och höga eller maximala grafikinställningar.
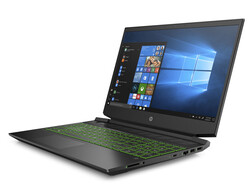
Toppmodellen i Pavilion Gaming 15-serien har massor av prestanda till ett lockande pris.
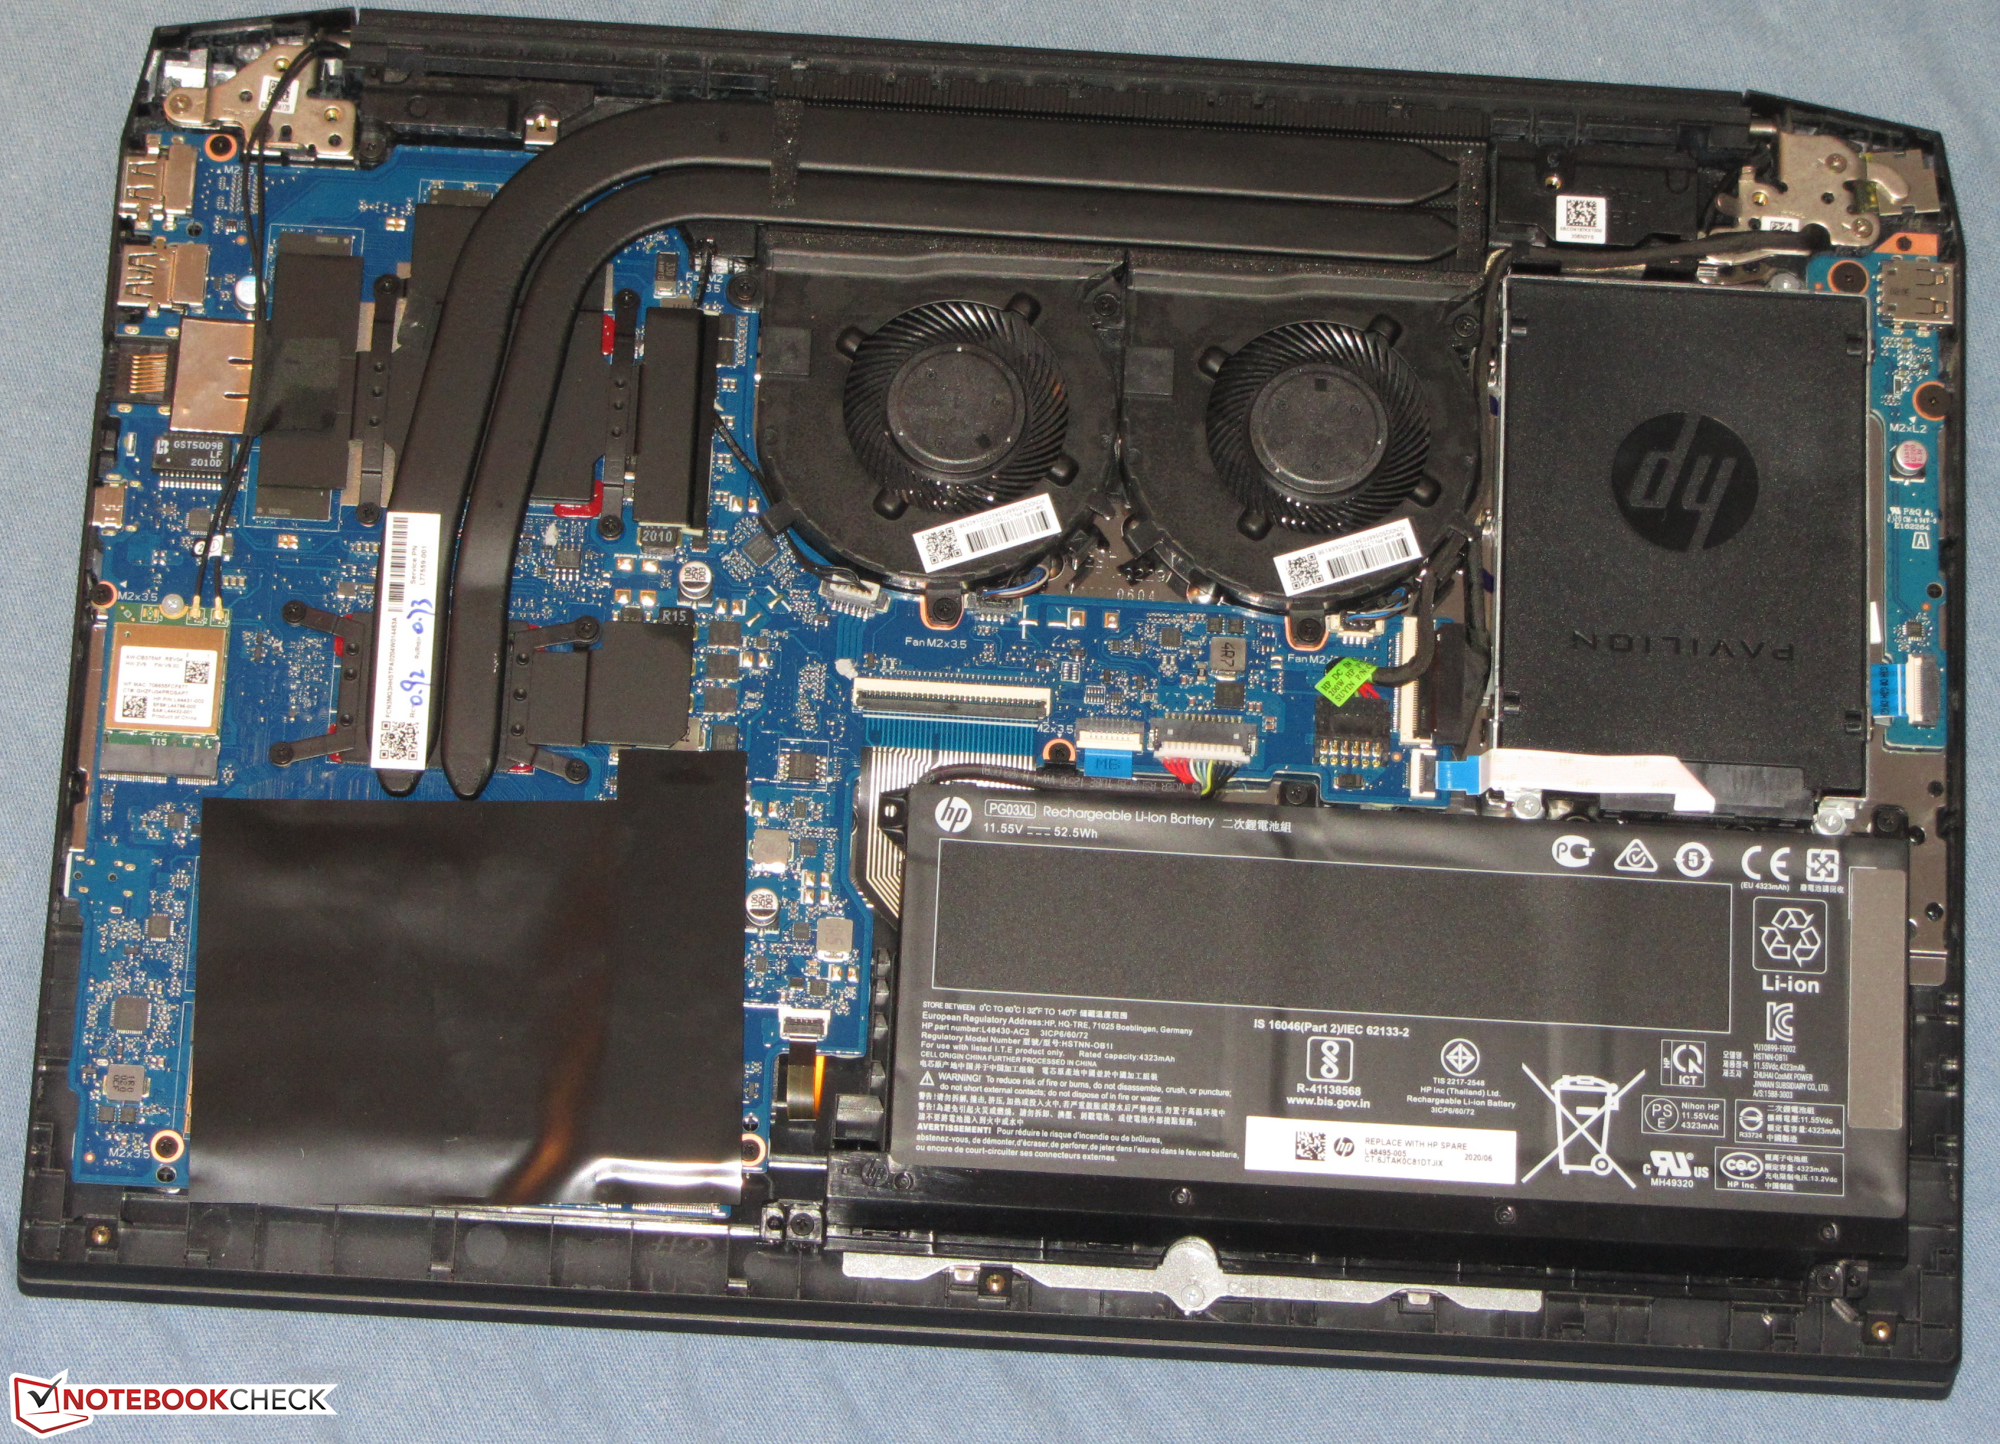
Hårdvaran kommer med 16 GB RAM (2x 8 GB, dubbla kanaler, 32 GB max). Men 512 GB är lite tight för en spellaptop. Det går dock att byta ut den snabba NVMe SSD-enheten. Alternativt kan du installera en lagringsenhet på 2.5 tum. All service och underhåll kräver att man tar bort bottenplattan.
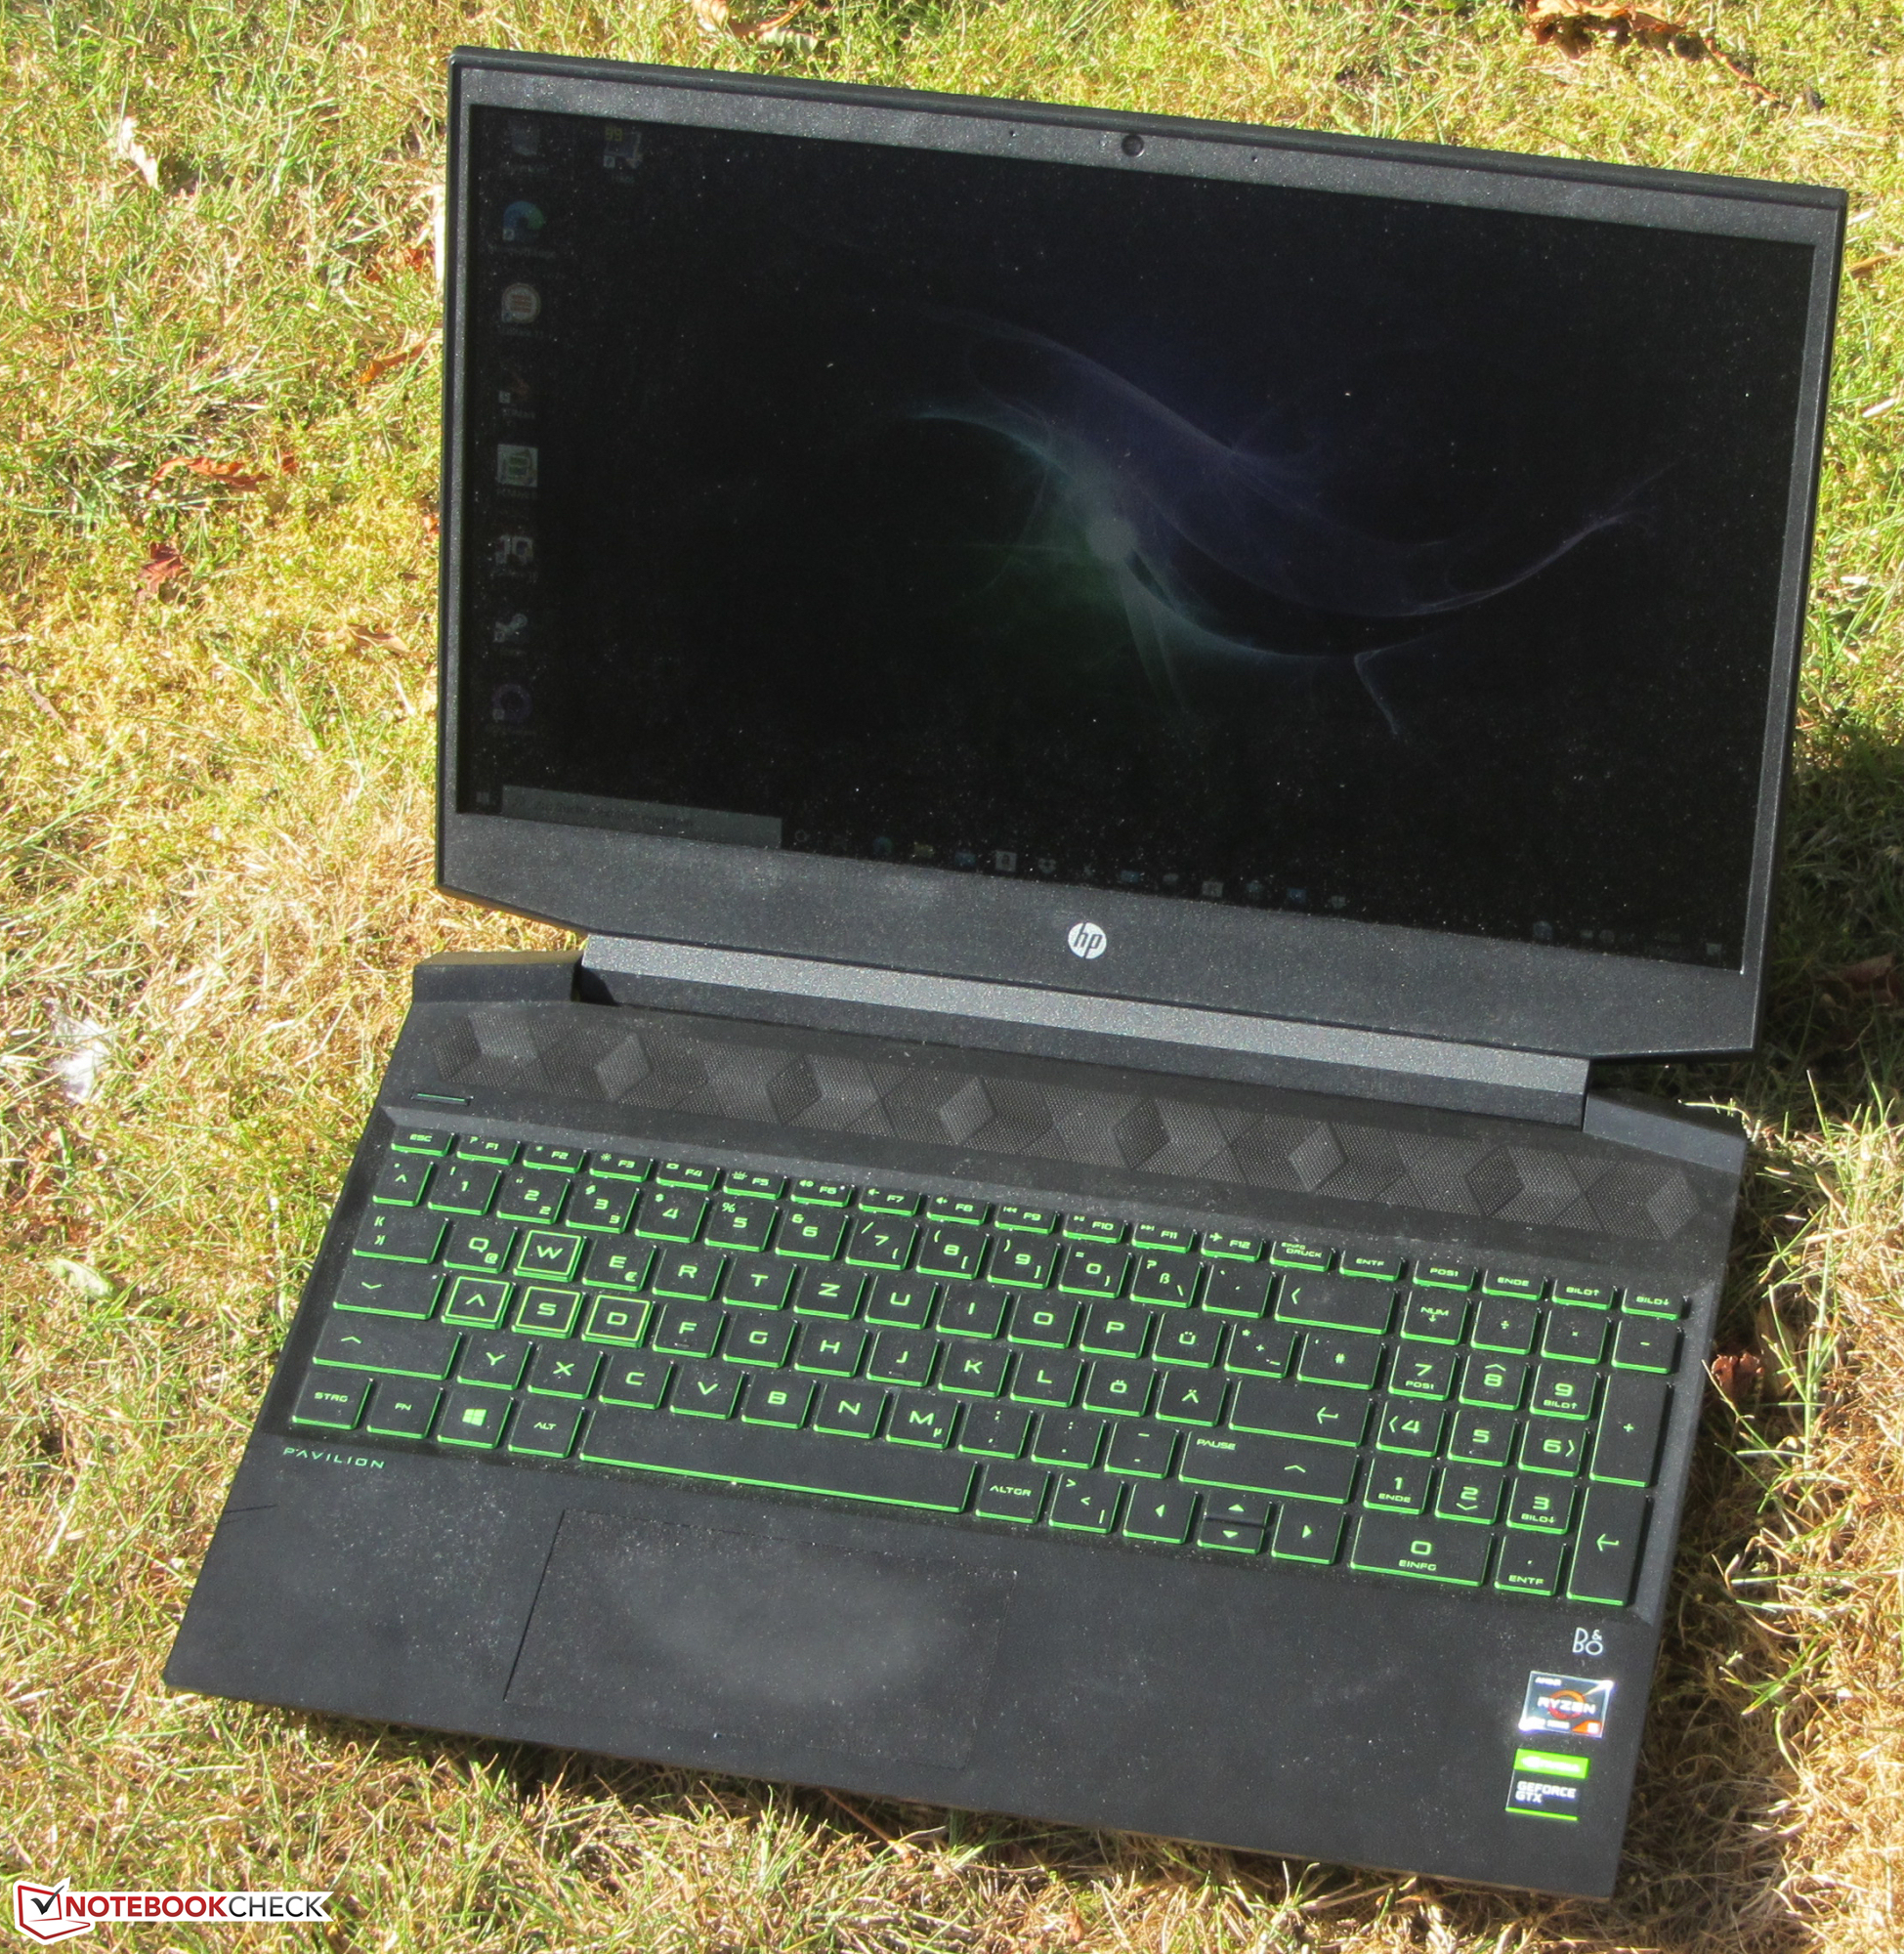
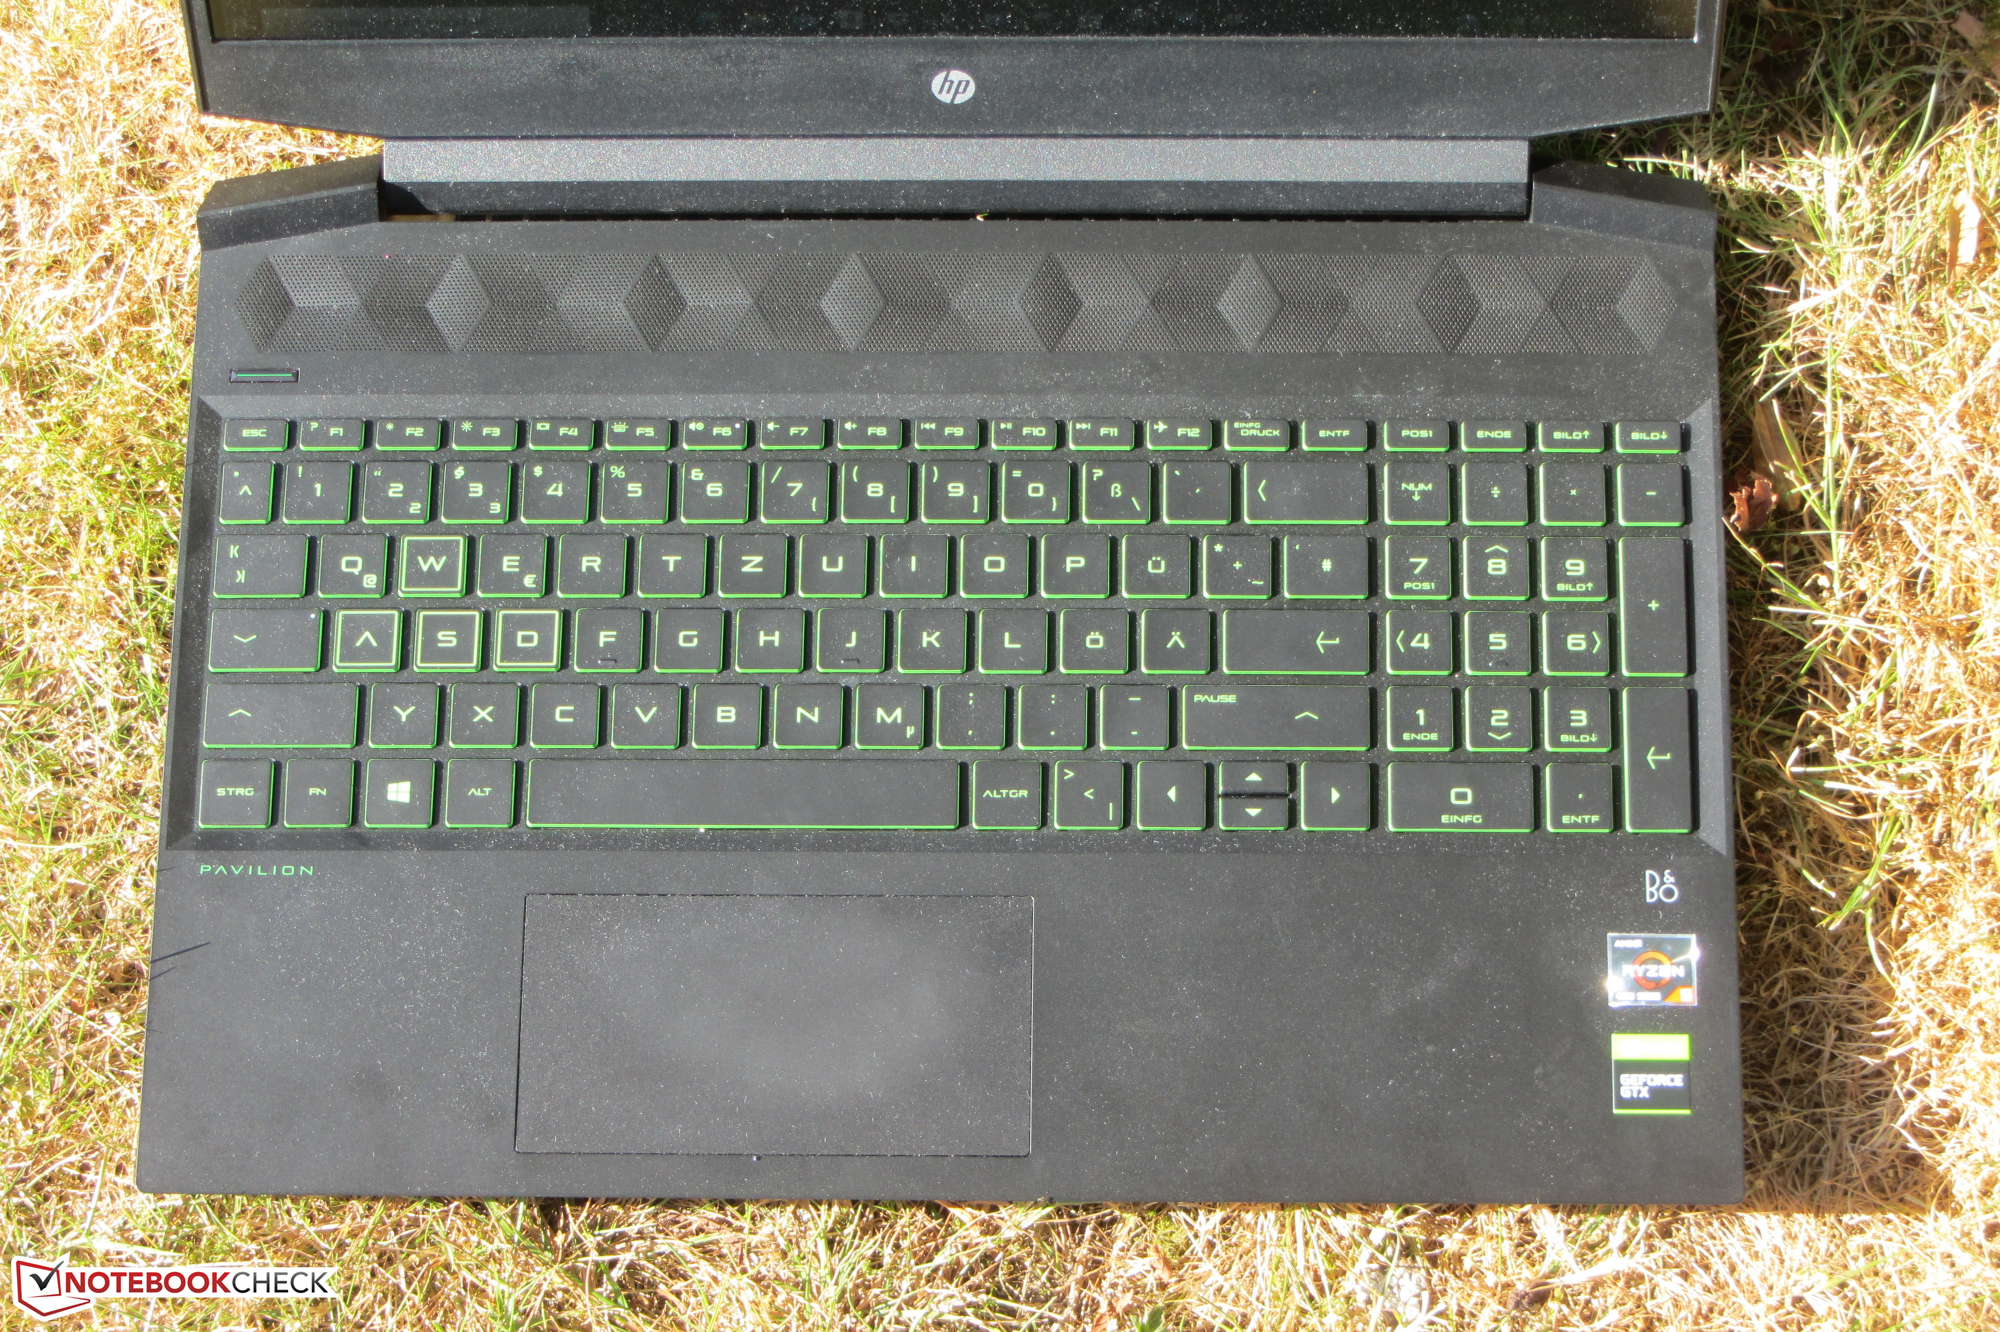
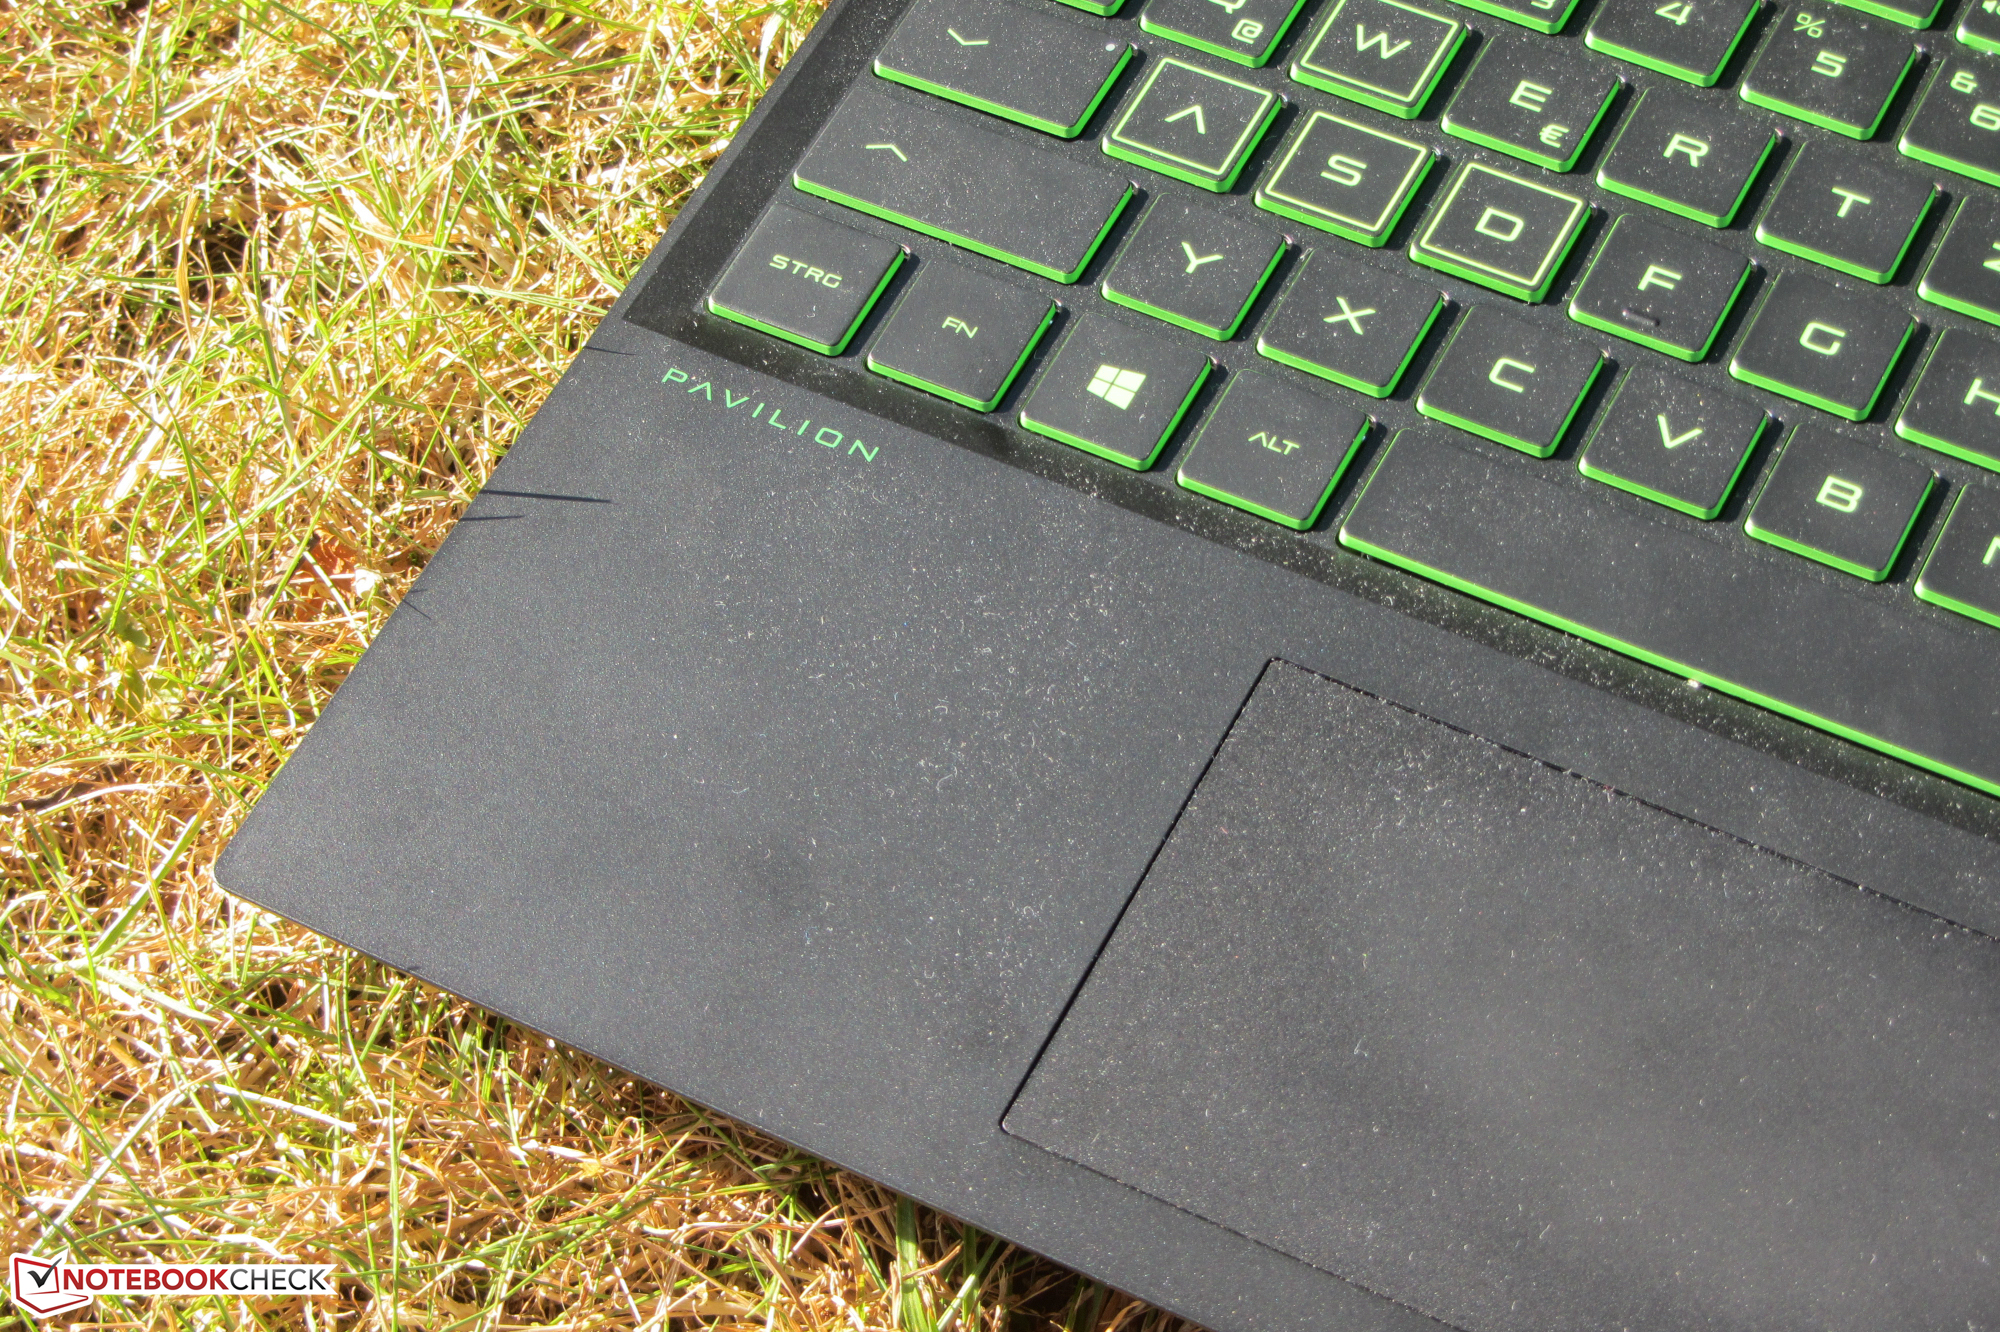
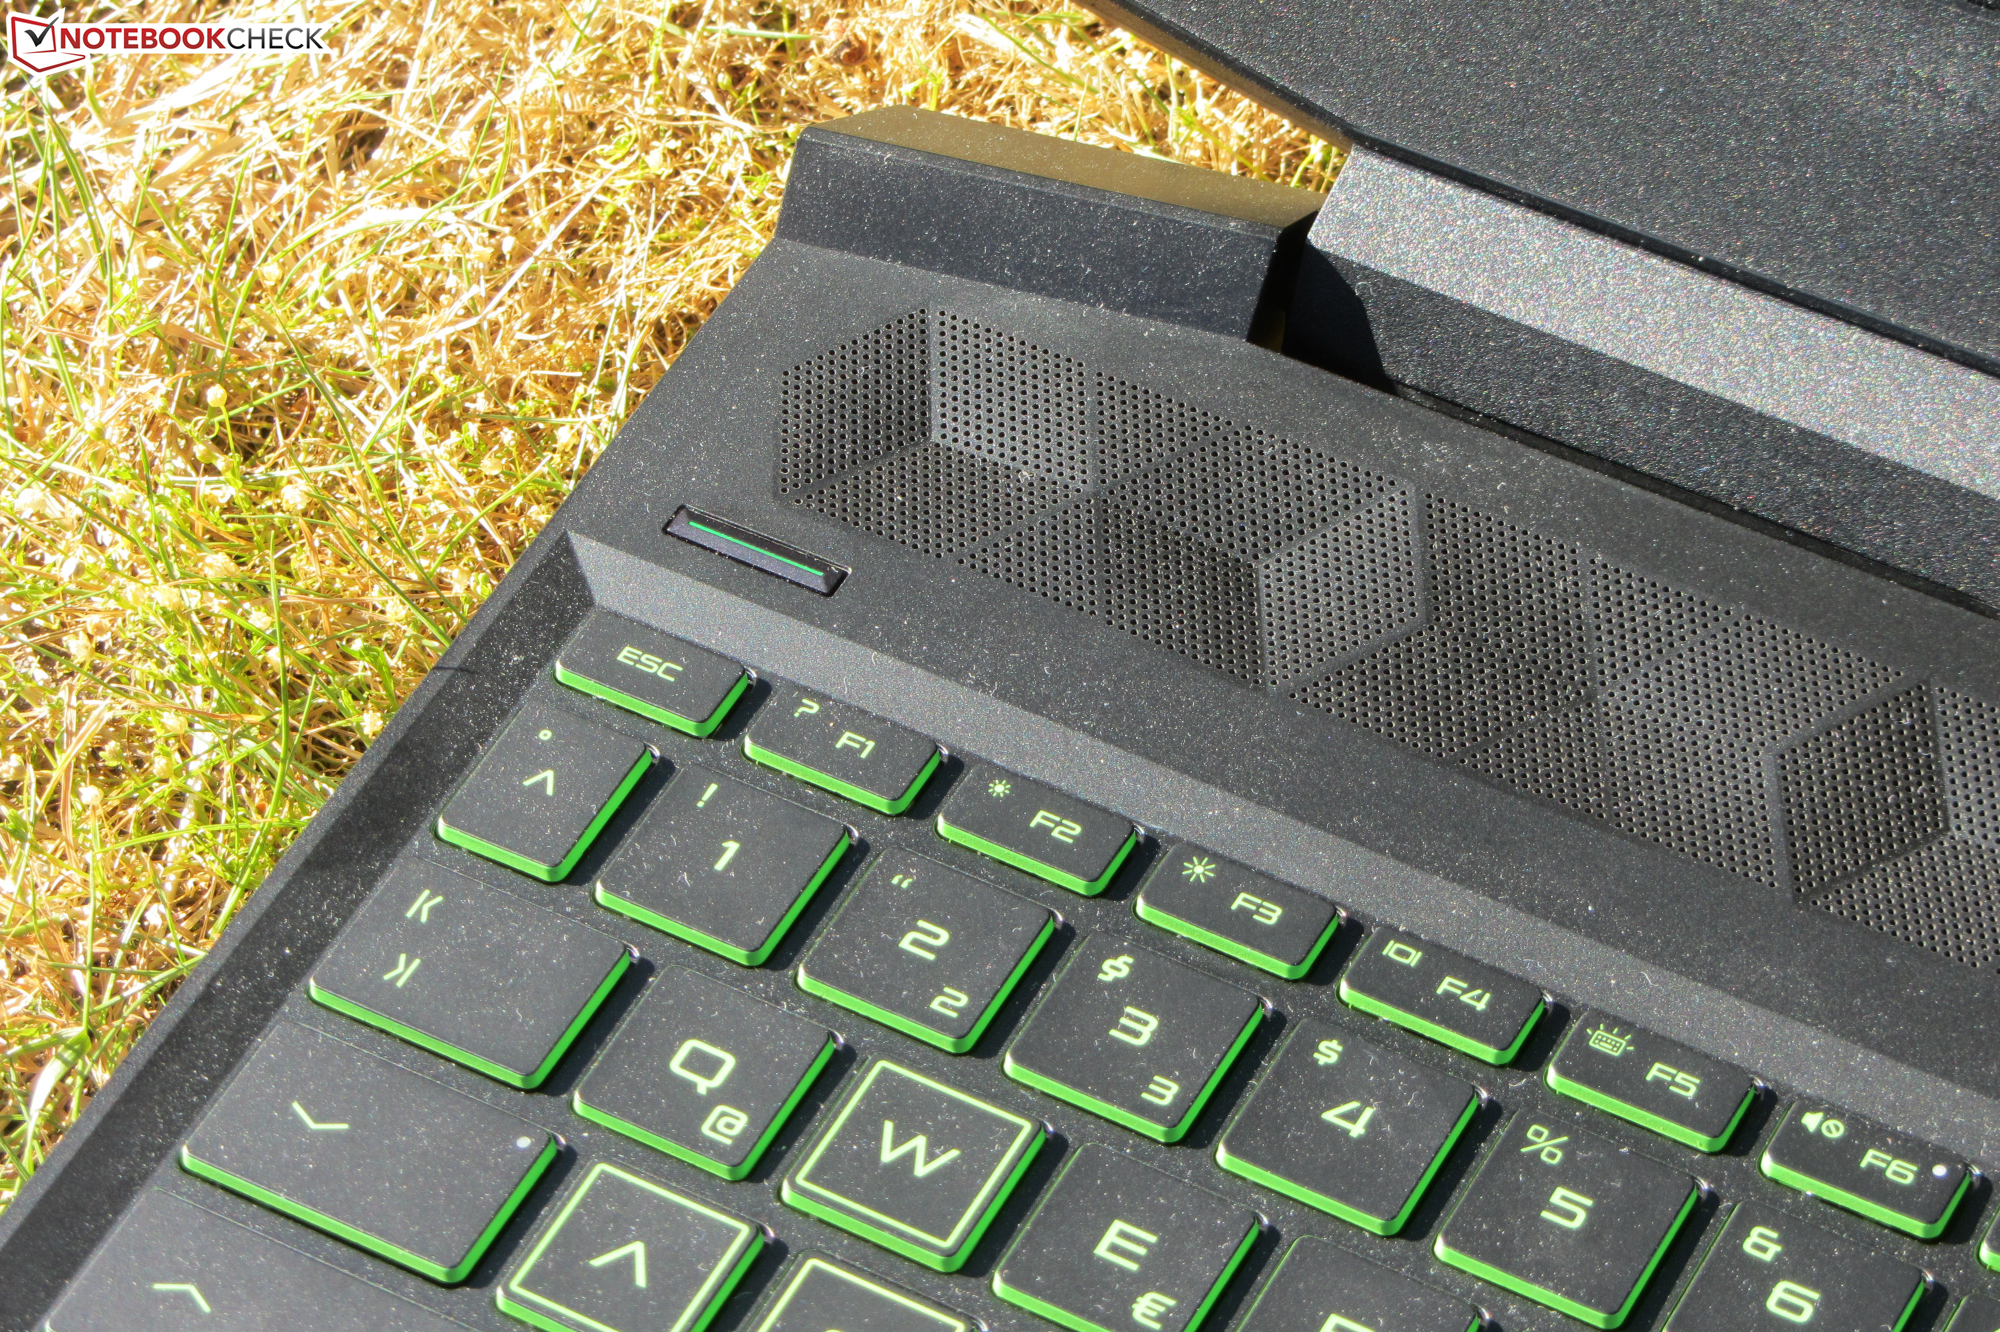
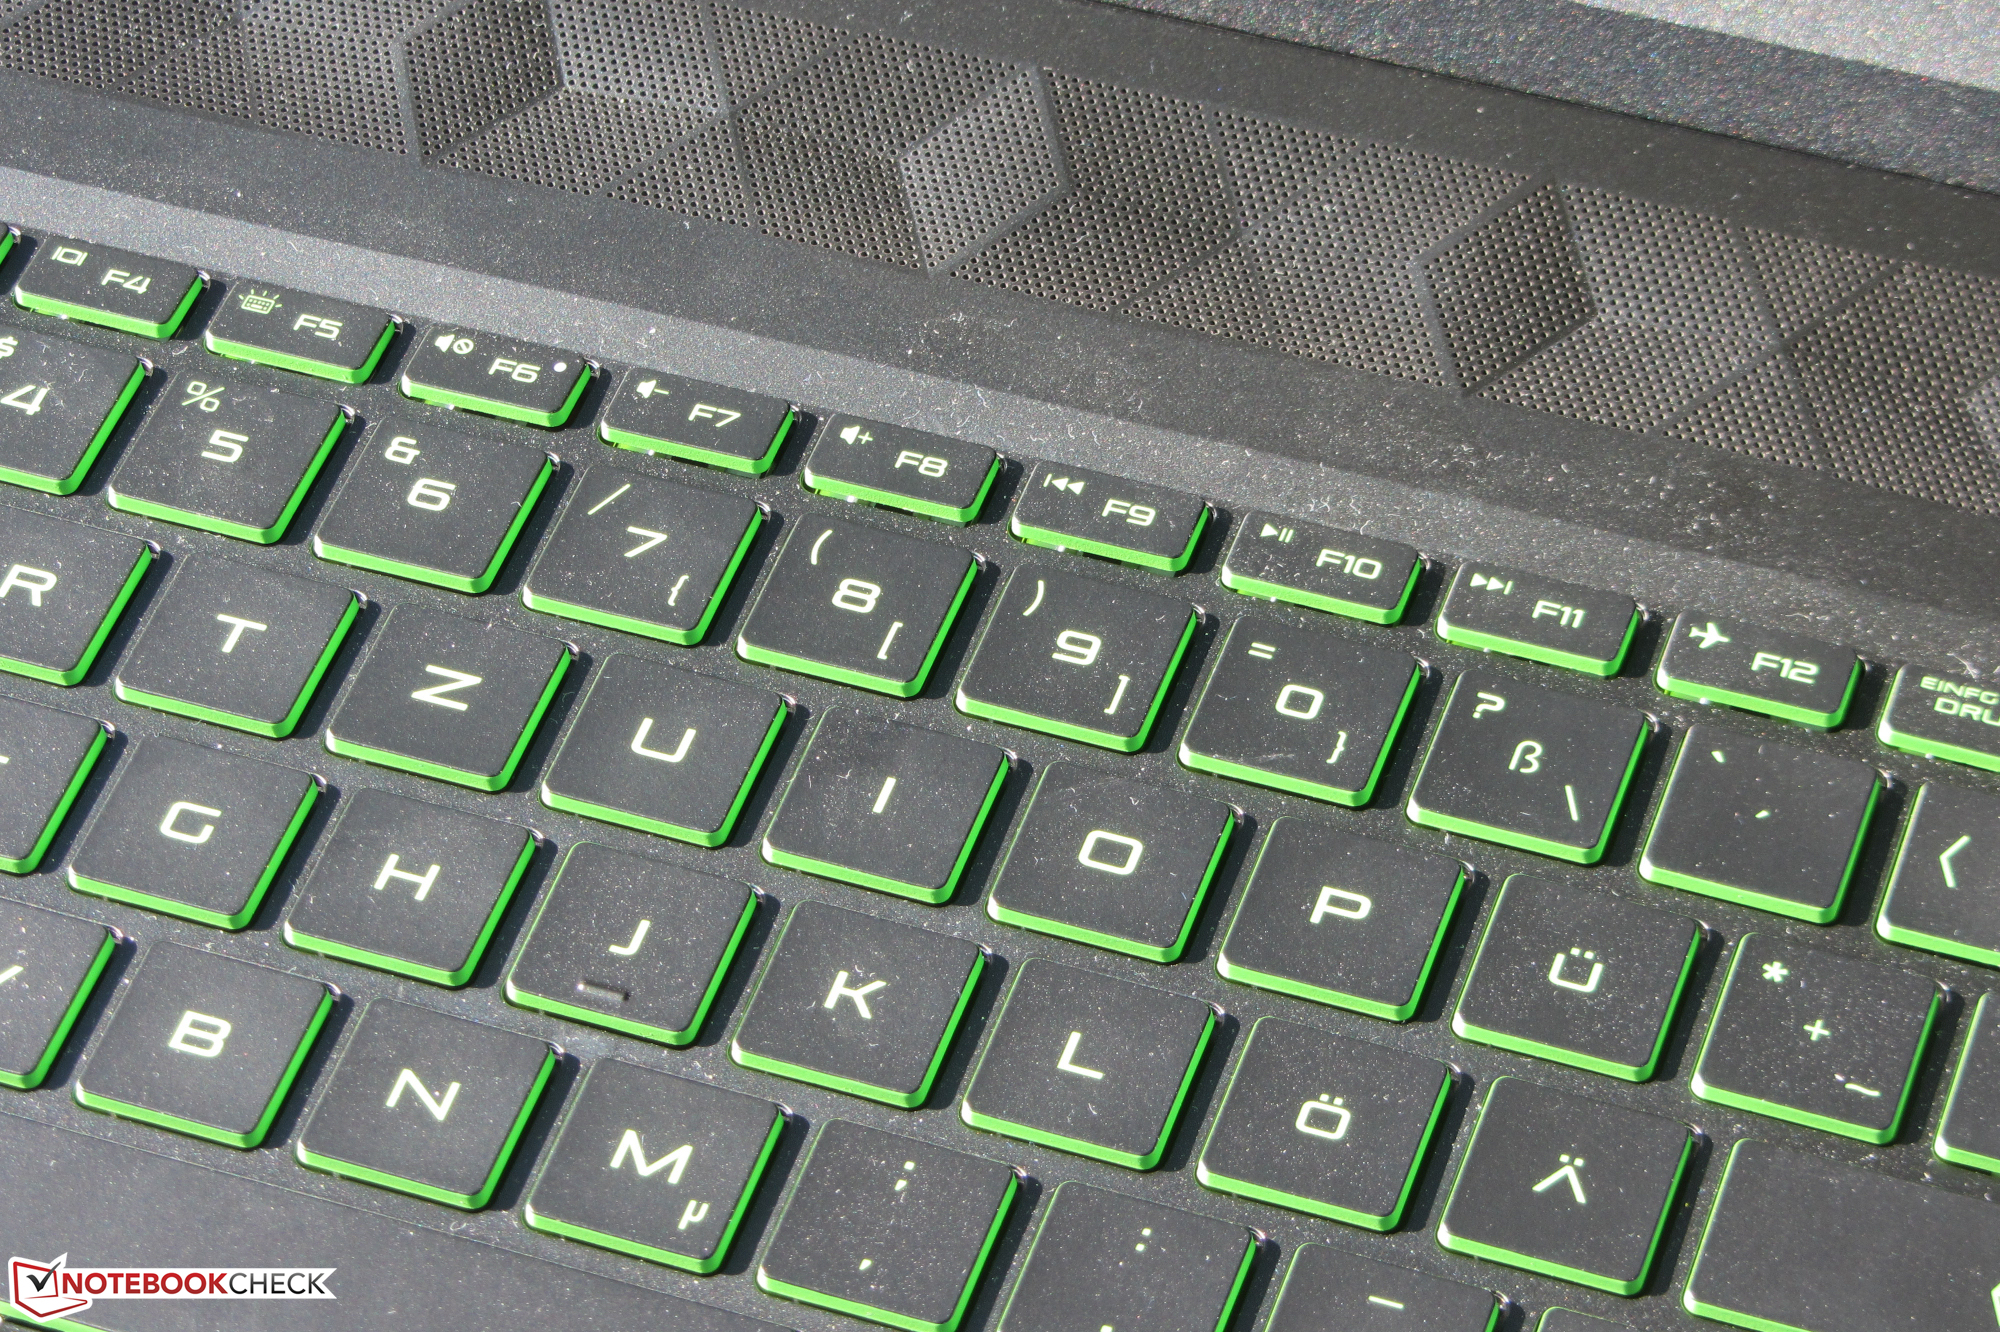
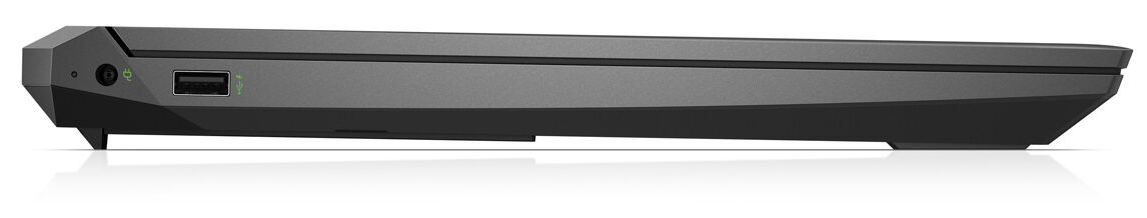
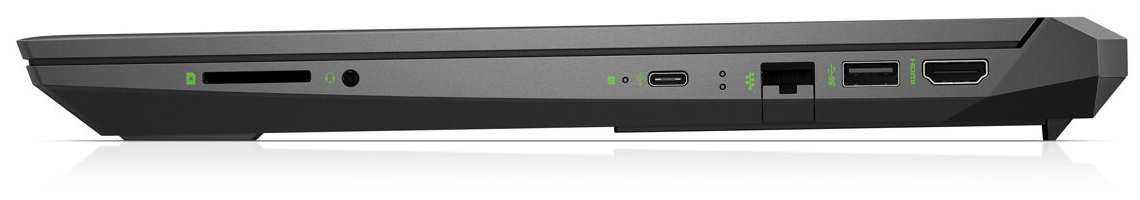
Batteritiden är fullständigt acceptabel, men den når inte riktigt upp till samma värden som de identiskt byggda syskonmodellerna. Chiclet-tangentbordet (grön bakgrundsbelysning, två ljusstyrkenivåer) visade sig lämpligt för daglig användning. Portutbudet kan inte direkt beskrivas som generöst men de flesta vanliga anslutningarna finns tillgängliga.
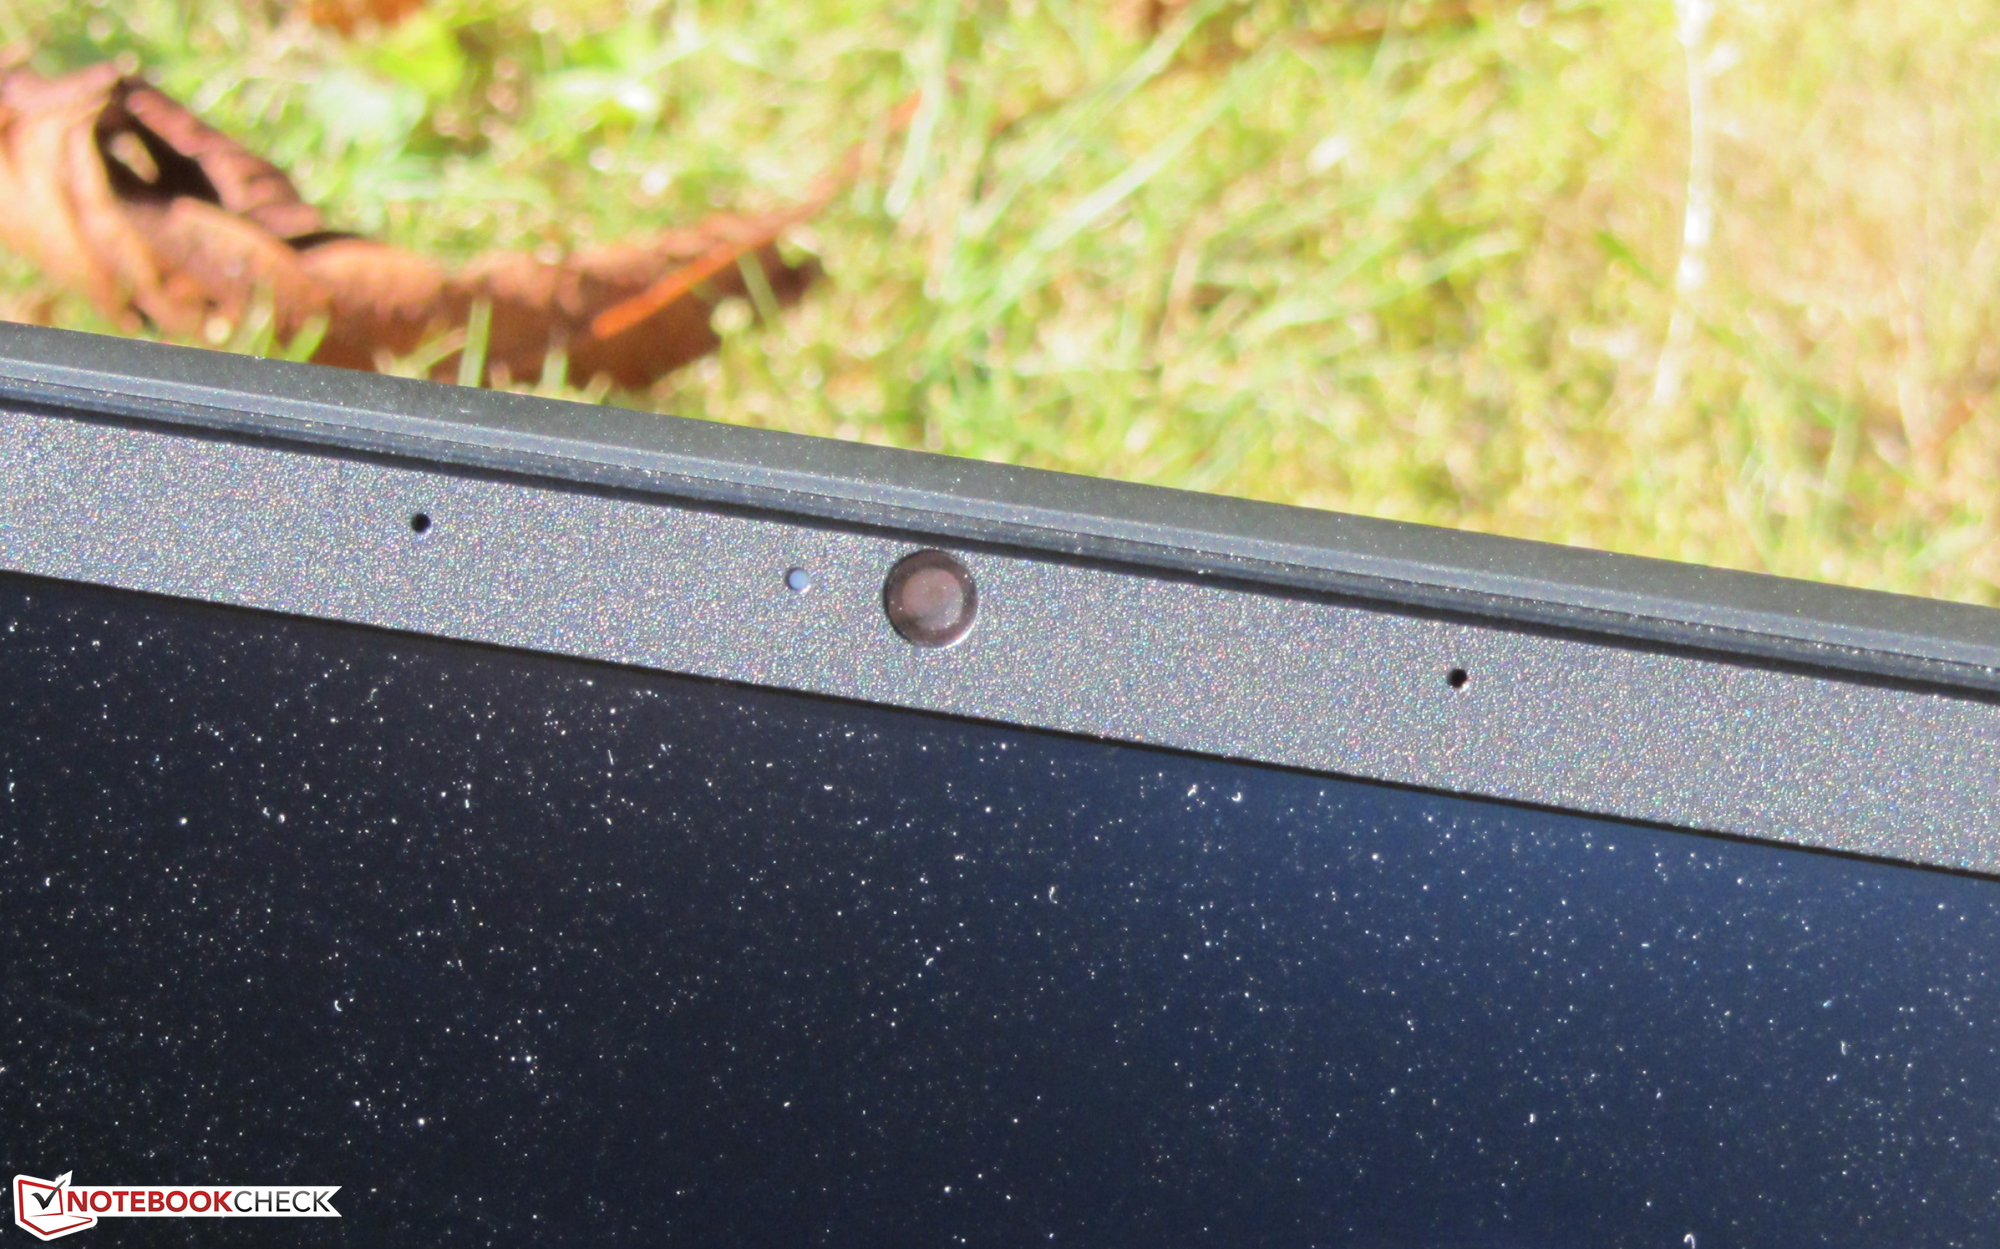
IPS-skärmen (Full HD, 144 Hz) får poäng för en matt yta, stabila betraktningsvinklar, hög kontrast, bra ljusstyrka, snabba responstider och utmärkt färgåtergivning. Färgomfånget gjorde oss också nöjda.
HP Pavilion Gaming 15-ec1177ng
- 09/29/2020 v7 (old)
Sascha Mölck
Price comparison
