Recension av Asus TUF Dash F15 FX517ZC: 1440p, 165 Hz och fullständiga P3-färger för under 10 000 kronor
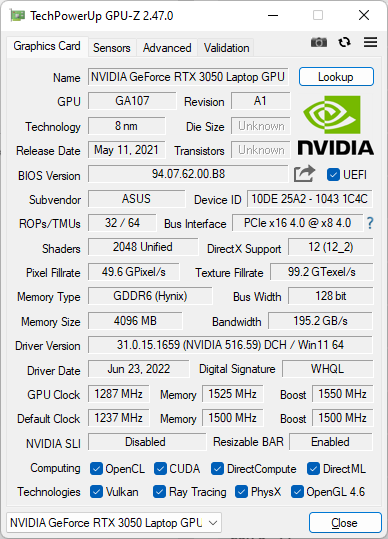
Till skillnad från flaggskeppet Asus ROG-serie är Asus TUF-serie hemvist för bärbara speldatorer i mellanklassen som vanligtvis utelämnar lyxiga funktioner som RGB-lampor eller Asus Keystone till förmån för mer överkomliga priser. Särskilt TUF Dash F15 FX517-serien kan konfigureras med ett budget GeForce RTX 3050-alternativ (FX517ZC) ända upp till RTX 3070 (FX517ZR). Den här recensionen fokuserar på RTX 3050-alternativet.
Vi rekommenderar att du kollar in vår befintliga recension av RTX 3070-konfigurationen eftersom den har samma 1440p 165 Hz-skärm, Core i7-12650H CPU och i stort sett samma fysiska egenskaper som RTX 3050-konfigurationen. Bland konkurrenterna i detta område finns andra prisvärda bärbara datorer för spel som säljs för 1 000 dollar eller mindre, som t.ex Dell G15 5510, MSI Bravo 15, Lenovo IdeaPad Gaming 3 15eller Gigabyte G5.
Fler recensioner av Asus
Potentiella konkurrenter i jämförelse
Gradering | Datum | Modell | Vikt | Höjd | Storlek | Upplösning | Pris |
|---|---|---|---|---|---|---|---|
| 84.9 % v7 (old) | 08/2022 | Asus TUF Dash F15 FX517ZC i7-12650H, GeForce RTX 3050 4GB Laptop GPU | 1.9 kg | 20.7 mm | 15.60" | 2560x1440 | |
| 85.8 % v7 (old) | 07/2022 | Asus TUF Dash F15 FX517ZR i7-12650H, GeForce RTX 3070 Laptop GPU | 2 kg | 20.7 mm | 15.60" | 2560x1440 | |
| 81 % v7 (old) | 06/2022 | Dell G15 5510 i5-10500H, GeForce RTX 3050 4GB Laptop GPU | 2.5 kg | 23 mm | 15.60" | 1920x1080 | |
| 78.2 % v7 (old) | 04/2022 | MSI Bravo 15 B5DD-010US R5 5600H, Radeon RX 5500M | 2.3 kg | 24.95 mm | 15.60" | 1920x1080 | |
| 79.7 % v7 (old) | 03/2022 | Lenovo Ideapad Gaming 3 15IHU-82K1002RGE i5-11300H, GeForce RTX 3050 Ti Laptop GPU | 2 kg | 24.2 mm | 15.60" | 1920x1080 | |
| 81.7 % v7 (old) | 11/2021 | Gigabyte G5 GD i5-11400H, GeForce RTX 3050 4GB Laptop GPU | 2.1 kg | 31.6 mm | 15.60" | 1920x1080 |
Hölje
Anslutningsmöjligheter
Det är viktigt att notera att även om det finns två USB-C-portar är det bara den som ligger närmast framkanten som stöder USB-C-laddning. Båda har annars möjlighet till DisplayPort-over-USB.
Kommunikation
Modellen levereras utan Wi-Fi 6E-stöd för att spara på kostnaderna. Prestandan är dock tillräcklig och stabil nog för målgruppen budgetspelare.
| Networking | |
| iperf3 transmit AX12 | |
| Gigabyte G5 GD | |
| Lenovo Ideapad Gaming 3 15IHU-82K1002RGE | |
| MSI Bravo 15 B5DD-010US | |
| iperf3 receive AX12 | |
| Lenovo Ideapad Gaming 3 15IHU-82K1002RGE | |
| Gigabyte G5 GD | |
| MSI Bravo 15 B5DD-010US | |
| iperf3 receive AXE11000 | |
| Dell G15 5510 | |
| Asus TUF Dash F15 FX517ZR | |
| Asus TUF Dash F15 FX517ZC | |
| iperf3 transmit AXE11000 | |
| Asus TUF Dash F15 FX517ZR | |
| Asus TUF Dash F15 FX517ZC | |
Webbkamera
Den integrerade webbkameran är en standardkamera på 1 MP utan sekretessbrytare eller IR-funktioner.


Underhåll
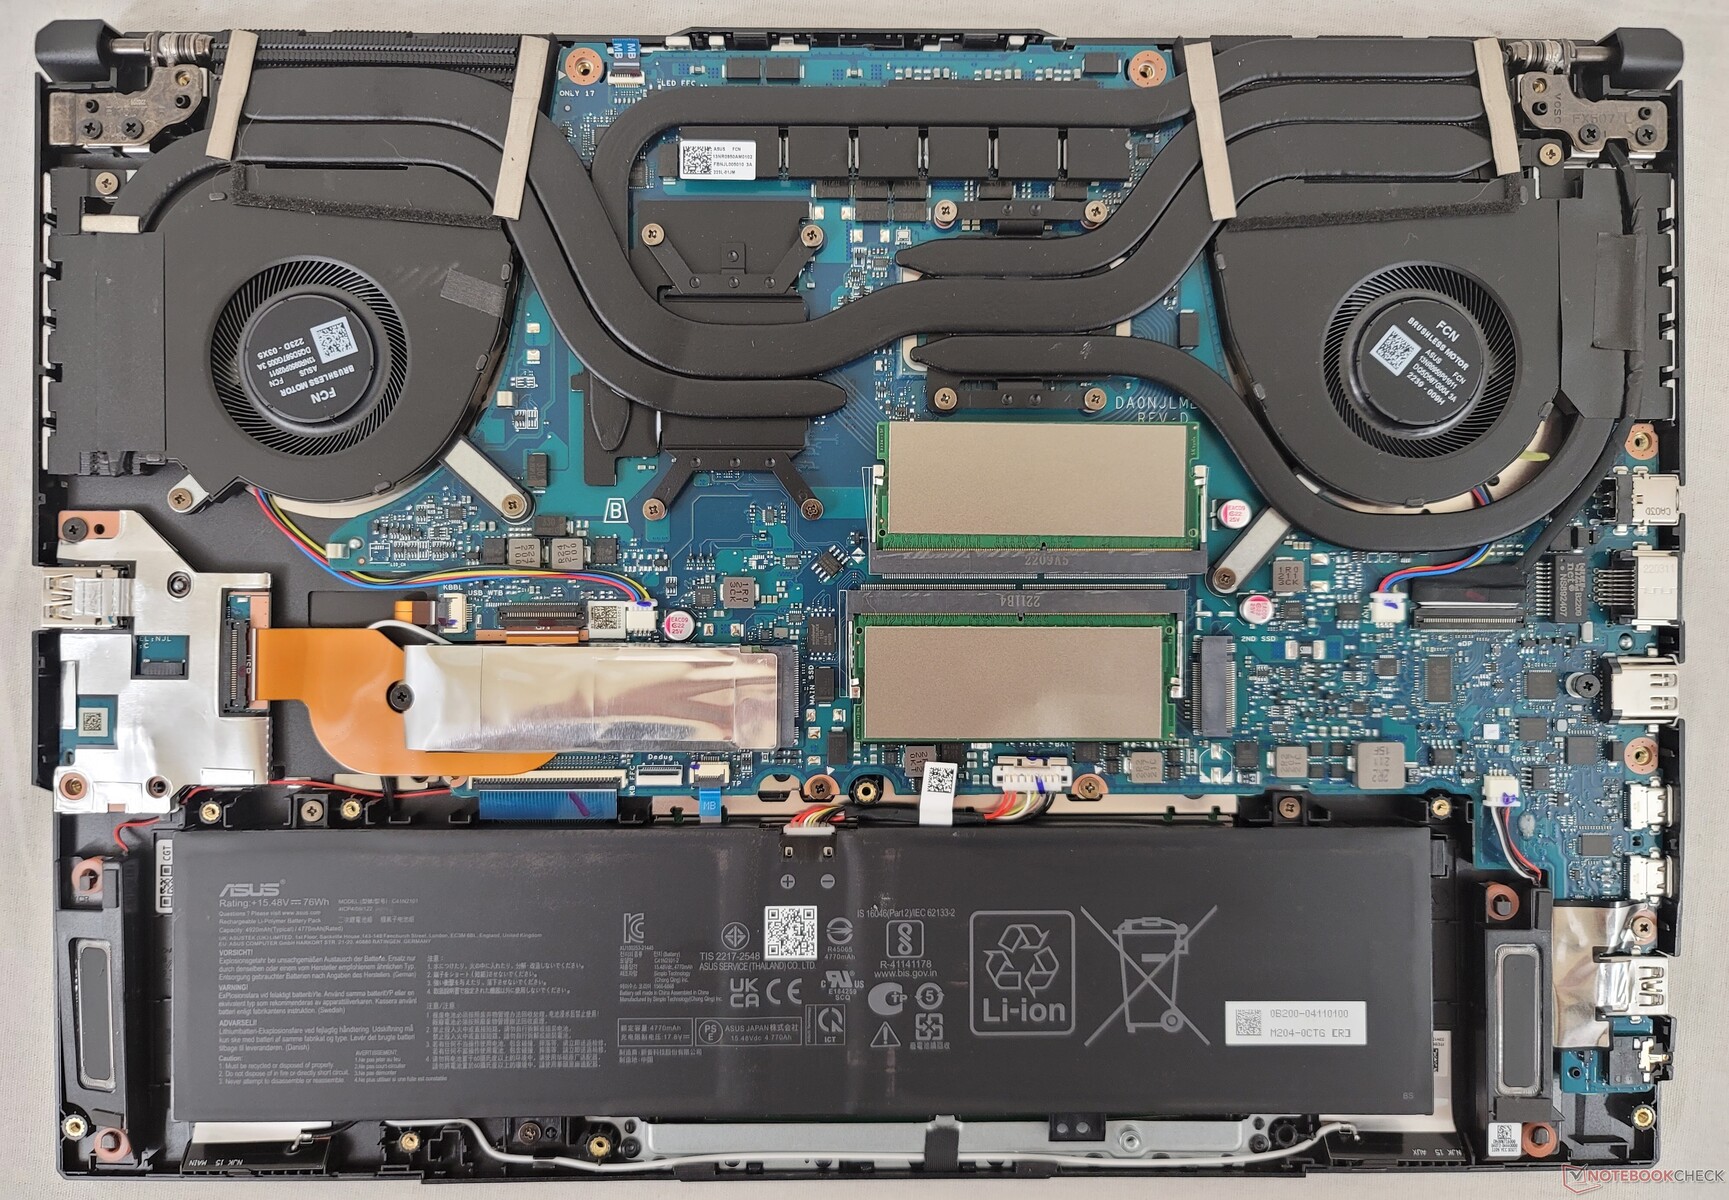
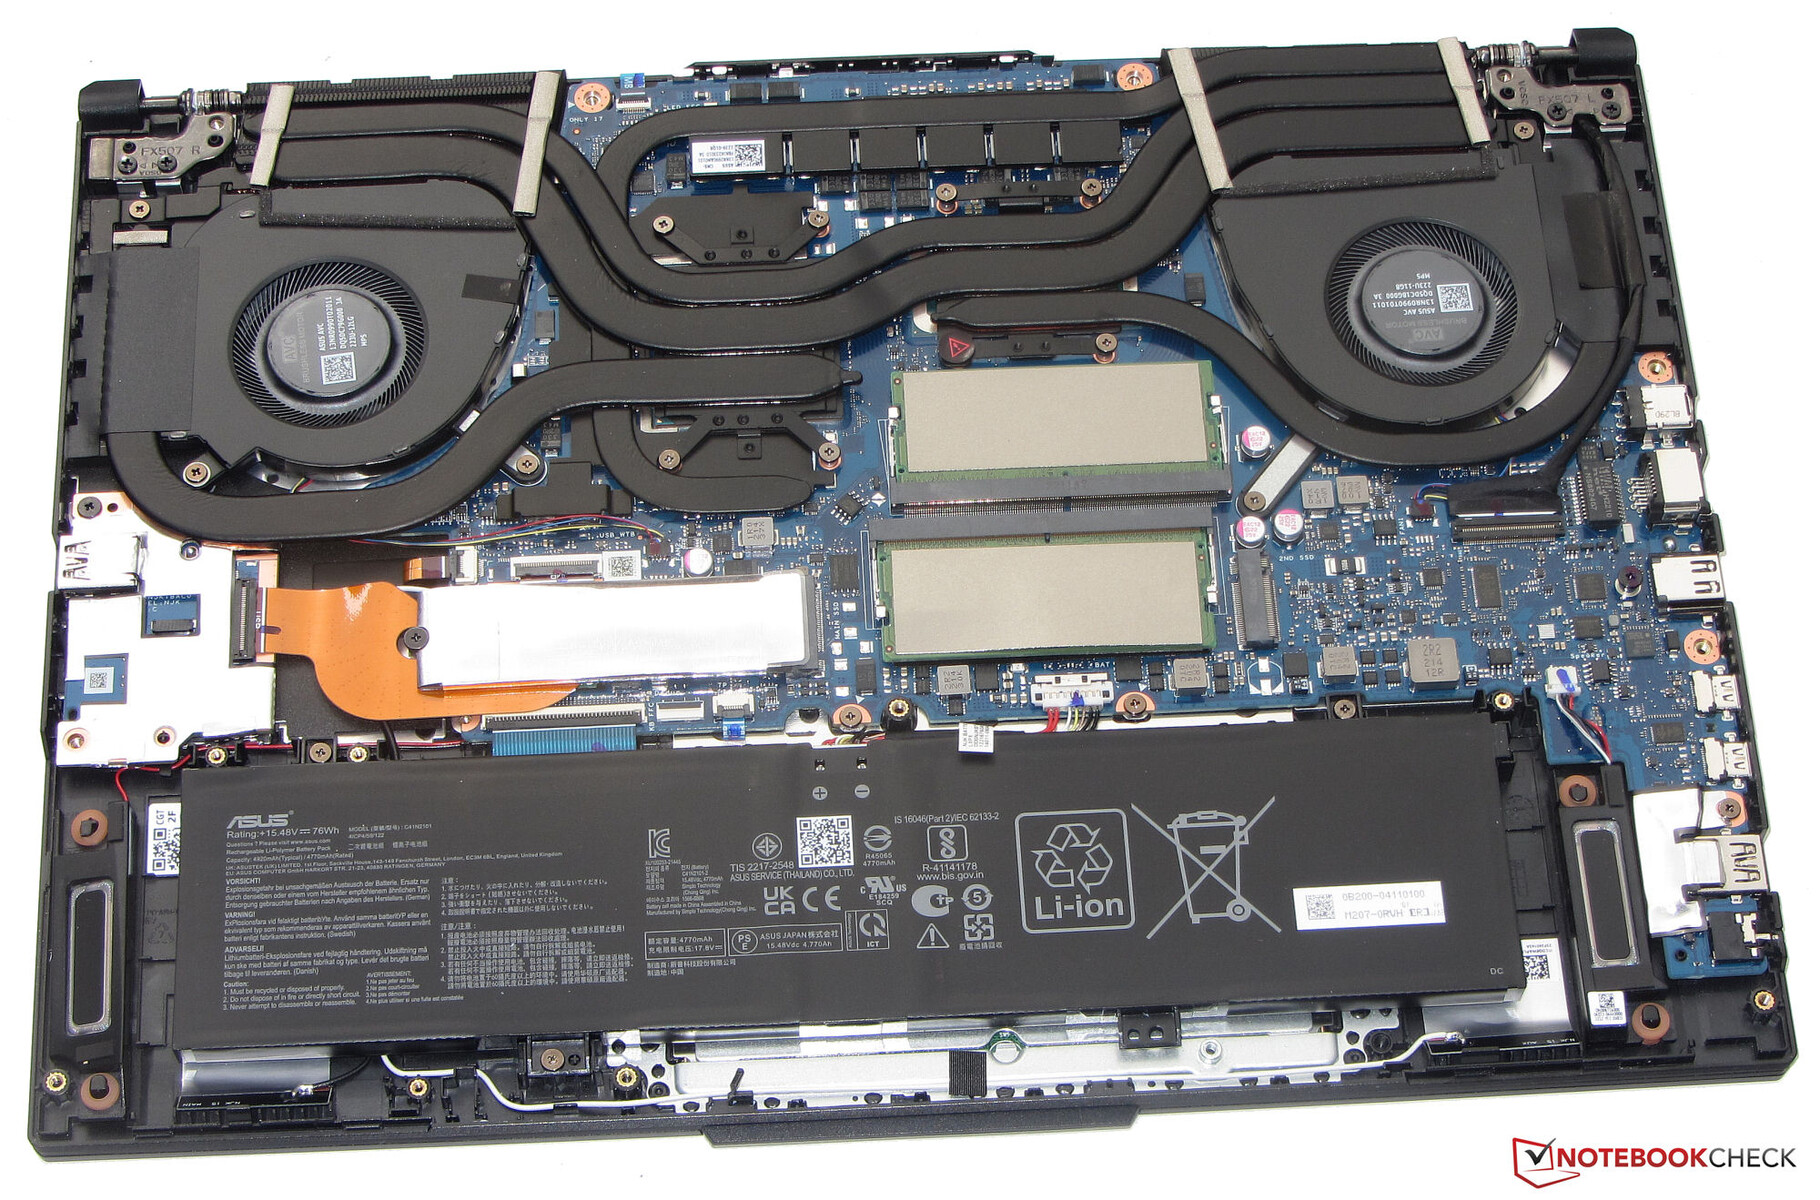
Bottenpanelen kan tas bort mycket enkelt med en Philips-skruvmejsel för att avslöja 2x M.2-lagringsfack, 2x SODIMM-fack och WLAN-modulen under den primära M.2-SSD:n. Jämfört med FX517ZR använder vår FX517ZC färre kopparvärmeledningar över GPU:n som visas nedan för en något lättare vikt.
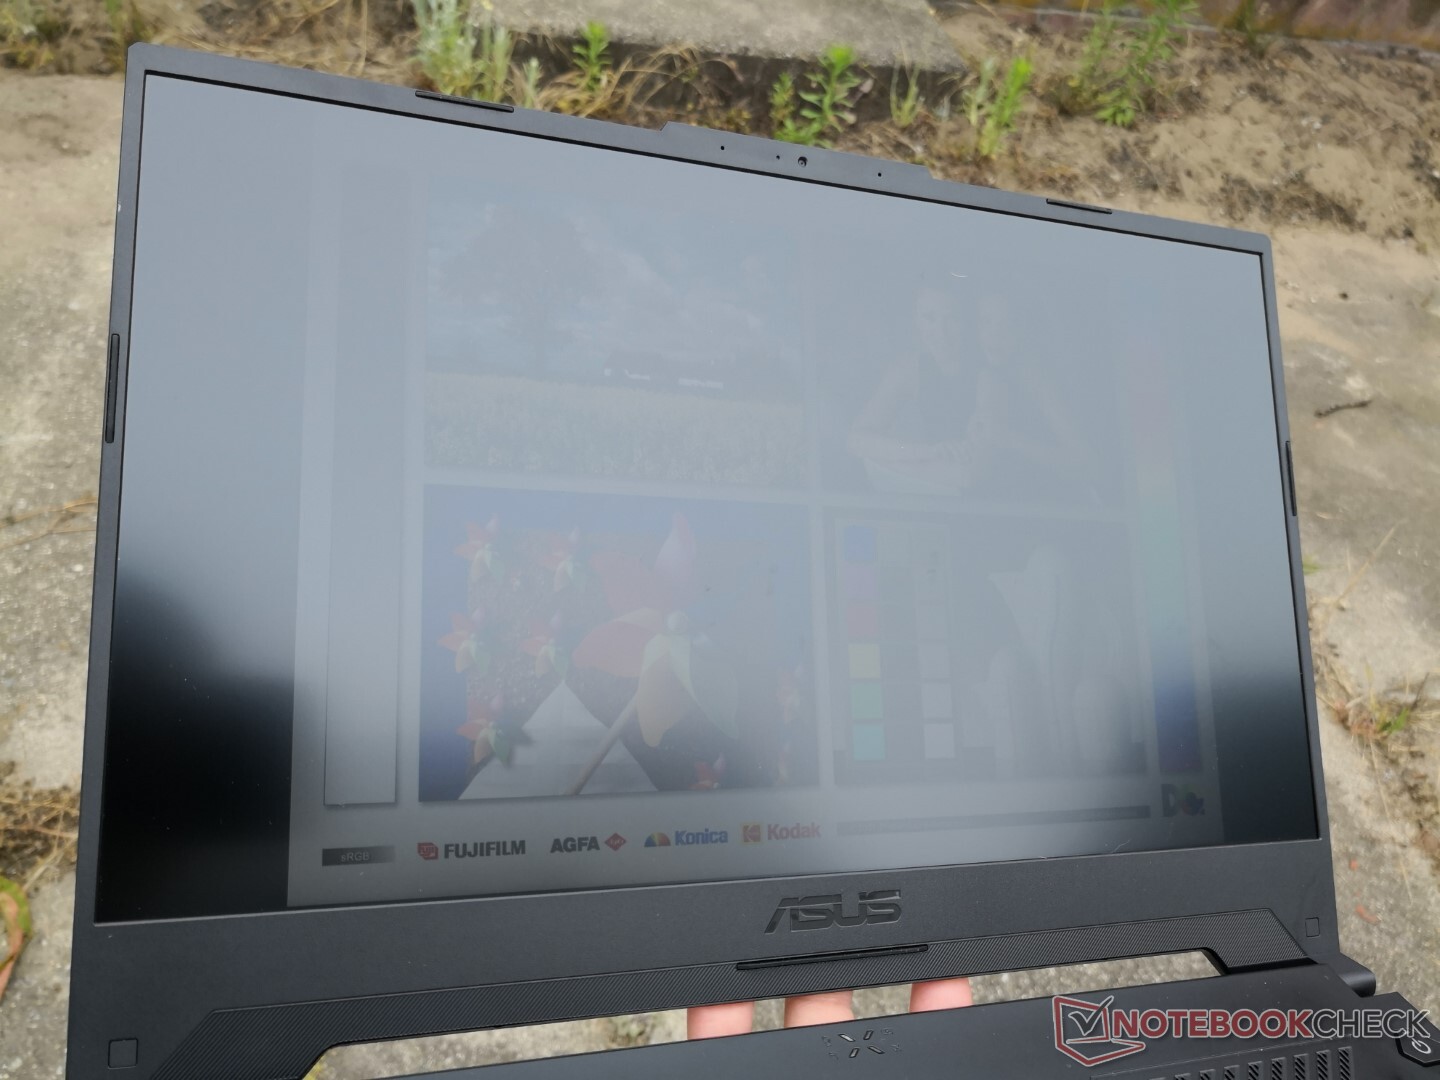
Skärm


| |||||||||||||||||||||||||
Distribution av ljusstyrkan: 88 %
Mitt på batteriet: 354.2 cd/m²
Kontrast: 1107:1 (Svärta: 0.32 cd/m²)
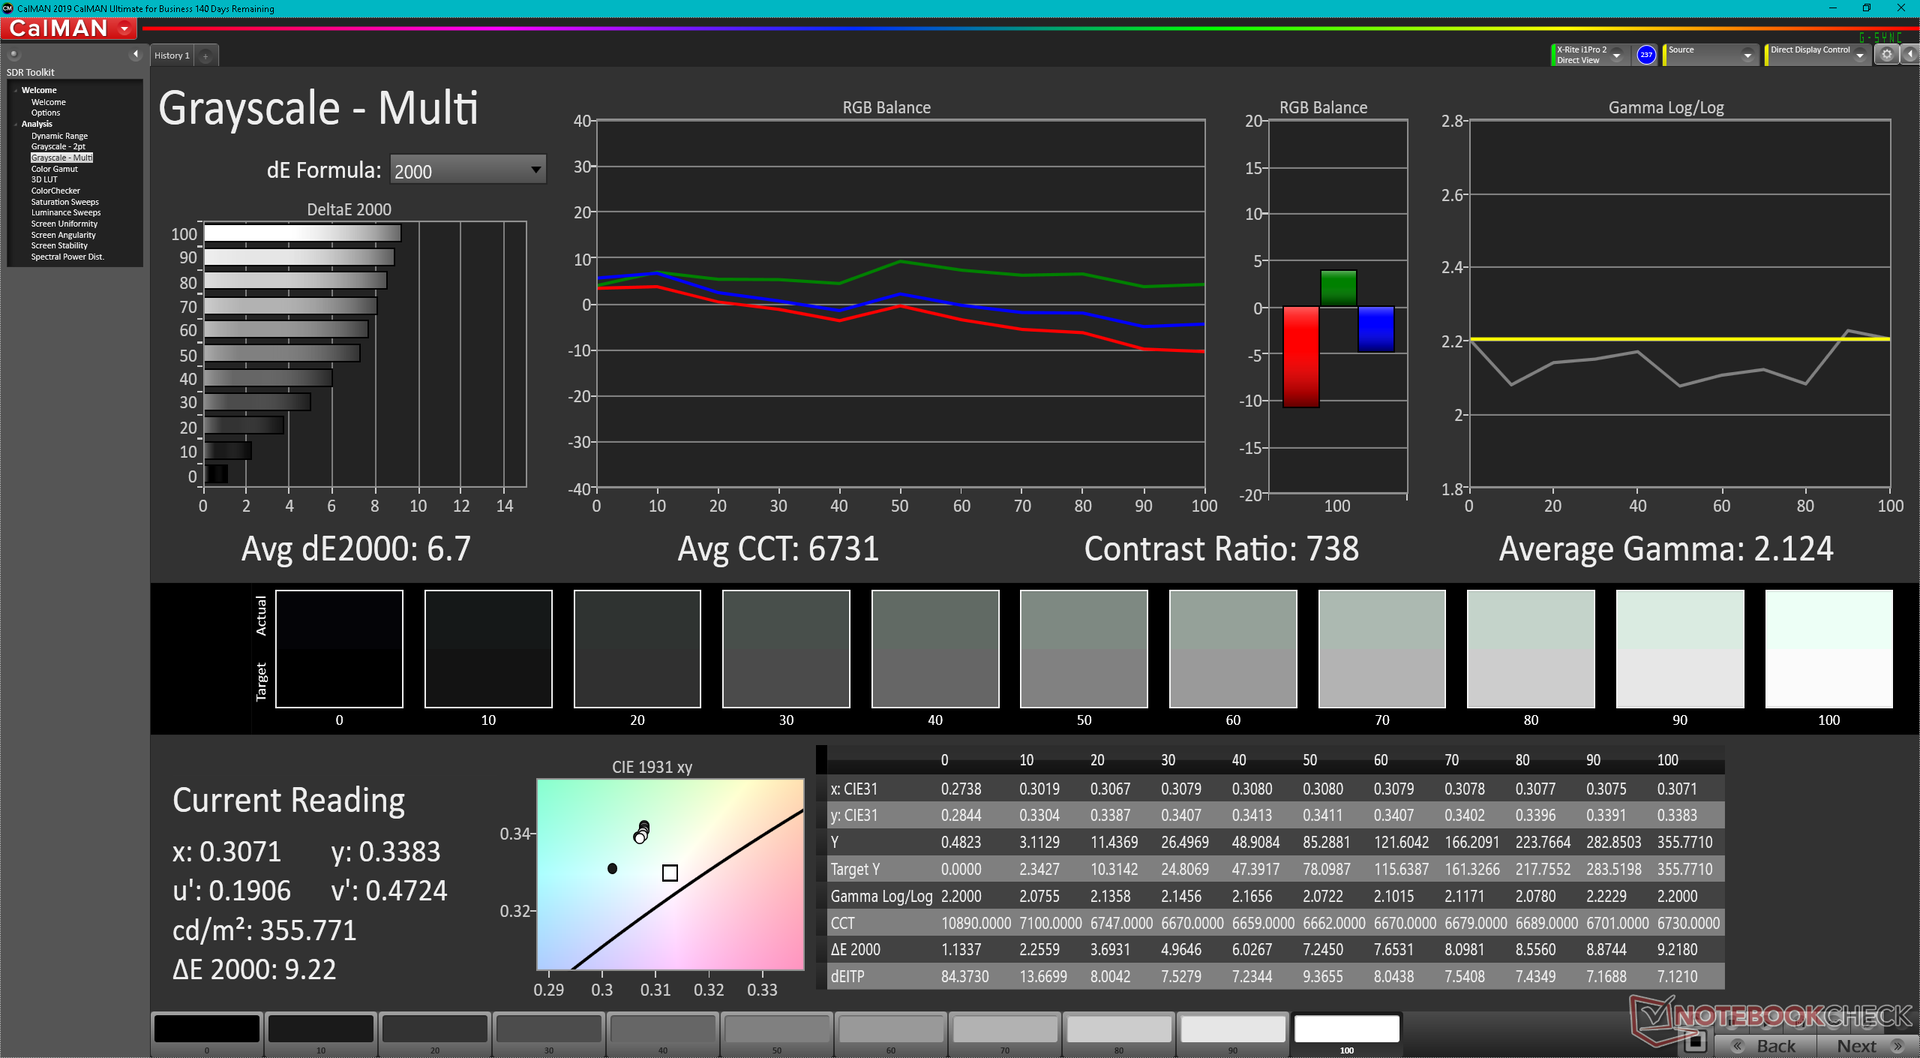
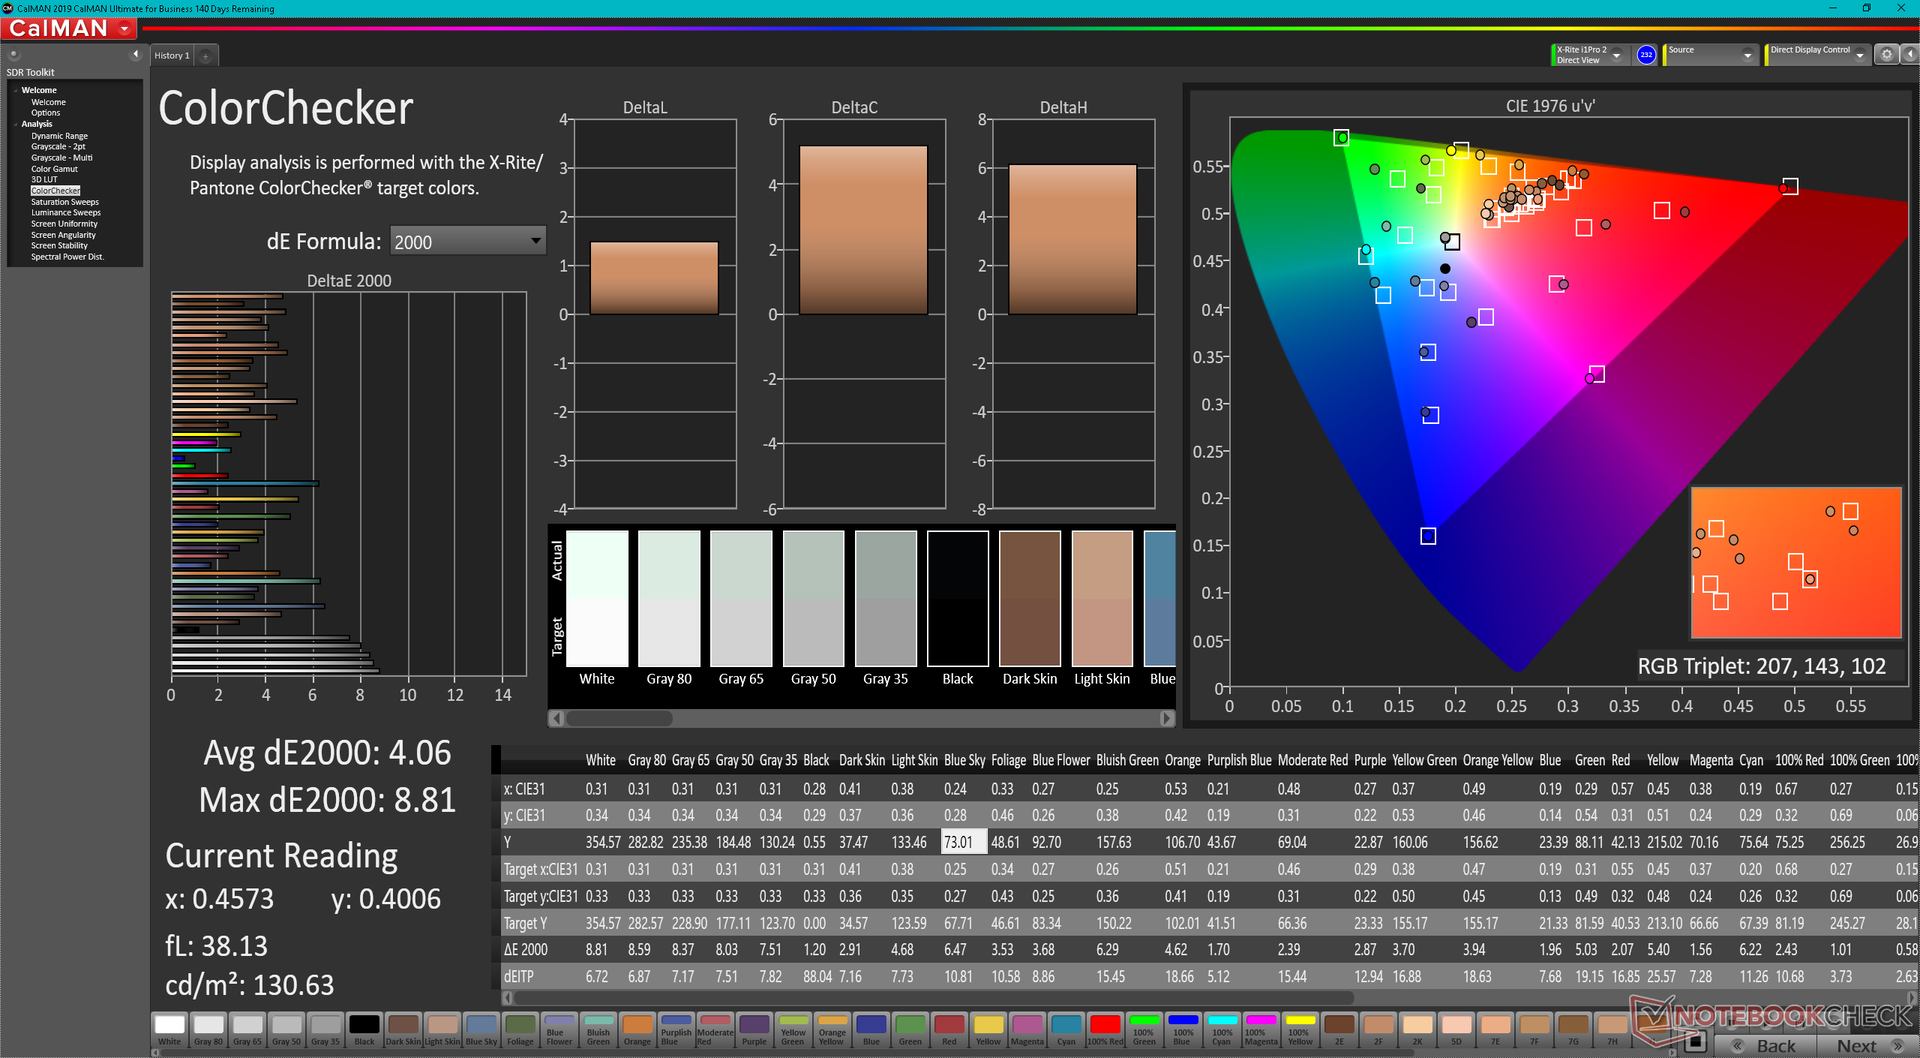
ΔE ColorChecker Calman: 4.06 | ∀{0.5-29.43 Ø4.71}
ΔE Greyscale Calman: 6.7 | ∀{0.09-98 Ø4.96}
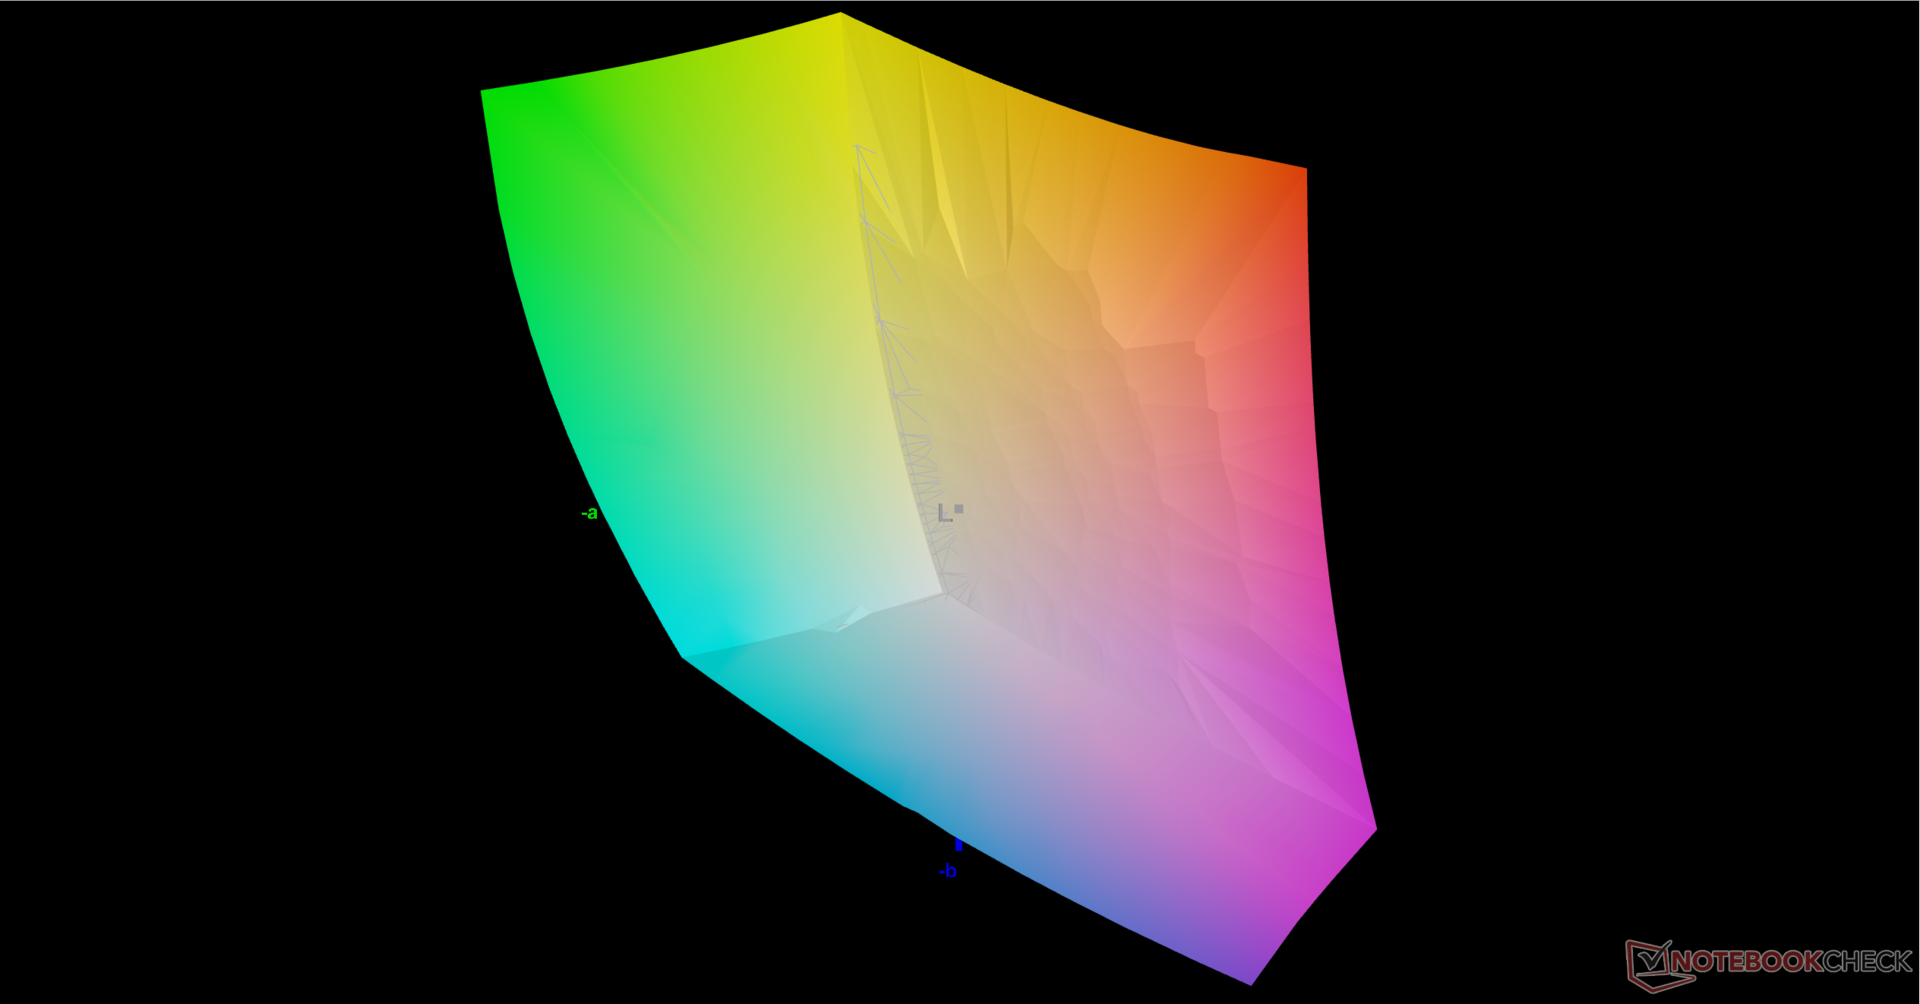
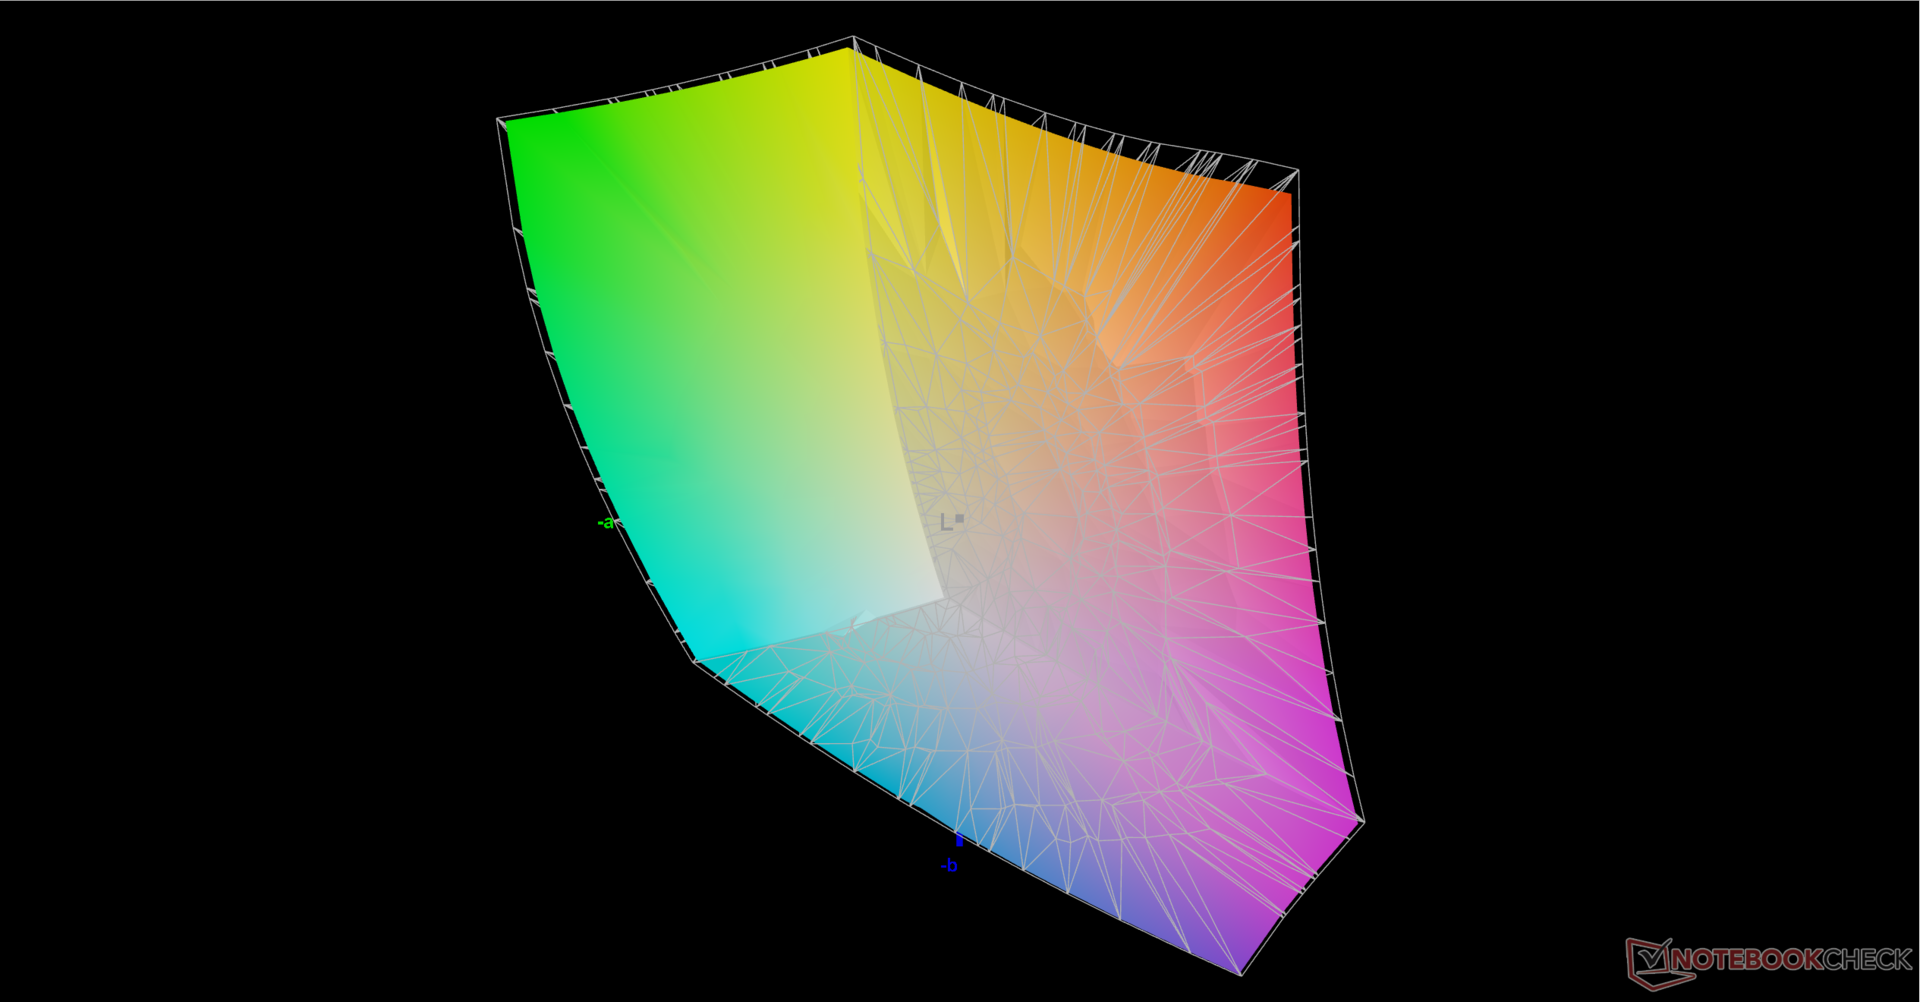
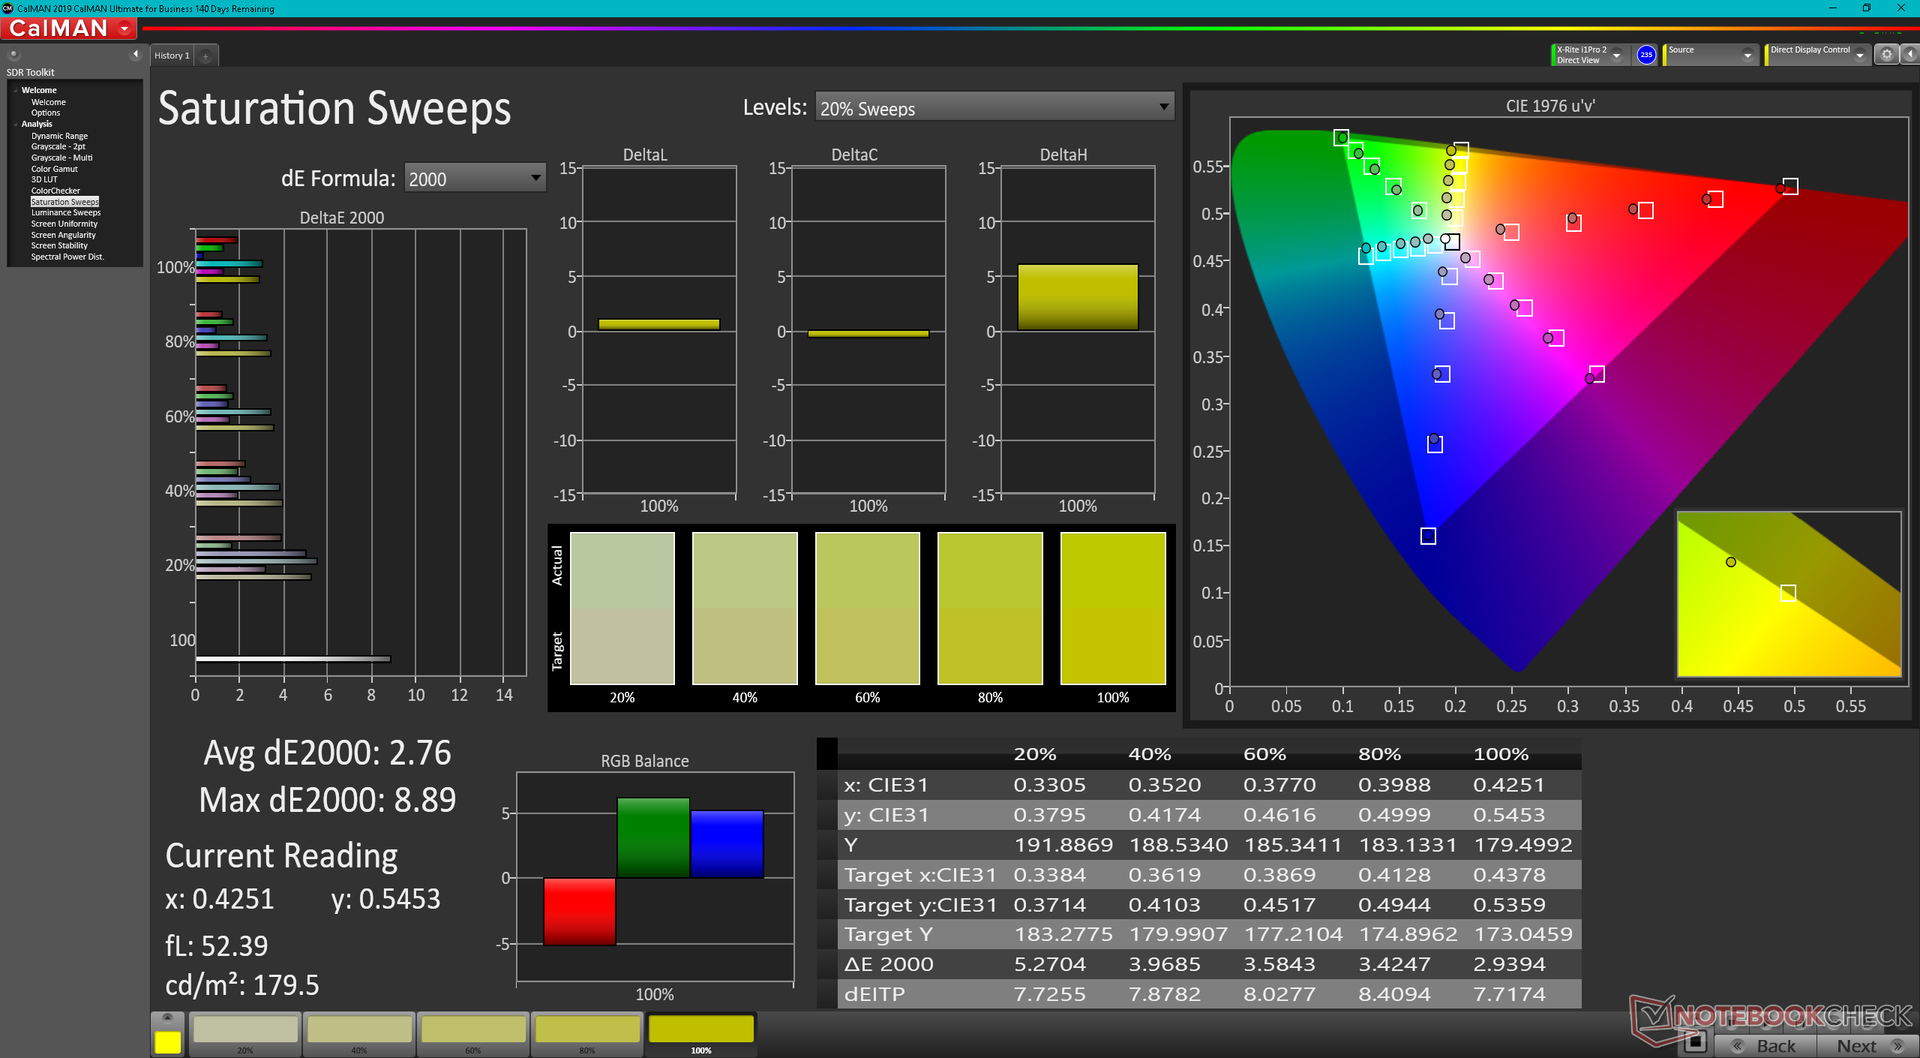
85.1% AdobeRGB 1998 (Argyll 3D)
99.9% sRGB (Argyll 3D)
95.8% Display P3 (Argyll 3D)
Gamma: 2.12
CCT: 6731 K
| Asus TUF Dash F15 FX517ZC BOE CQ NE156QHM-NY1, IPS, 2560x1440, 15.6" | Asus TUF Dash F15 FX517ZR BOE CQ NE156QHM-NY1, IPS, 2560x1440, 15.6" | Dell G15 5510 YMHWH_156HRA (CMN1522), IPS, 1920x1080, 15.6" | MSI Bravo 15 B5DD-010US Chi Mei N156HRA-EA1, IPS, 1920x1080, 15.6" | Lenovo Ideapad Gaming 3 15IHU-82K1002RGE LEN156FHD, IPS, 1920x1080, 15.6" | Gigabyte G5 GD Chi Mei N156HRA-EA1, IPS, 1920x1080, 15.6" | |
|---|---|---|---|---|---|---|
| Display | 1% | -48% | -47% | -50% | -48% | |
| Display P3 Coverage (%) | 95.8 | 98.4 3% | 41.6 -57% | 42.1 -56% | 39.7 -59% | 41.8 -56% |
| sRGB Coverage (%) | 99.9 | 99.9 0% | 62.2 -38% | 62.8 -37% | 59.6 -40% | 62.3 -38% |
| AdobeRGB 1998 Coverage (%) | 85.1 | 85.9 1% | 43 -49% | 43.6 -49% | 41.1 -52% | 43.2 -49% |
| Response Times | 22% | -198% | -162% | -345% | -217% | |
| Response Time Grey 50% / Grey 80% * (ms) | 8.4 ? | 5.6 ? 33% | 33.3 ? -296% | 25.6 ? -205% | 46.4 ? -452% | 34.4 ? -310% |
| Response Time Black / White * (ms) | 10.4 ? | 9.4 ? 10% | 20.7 ? -99% | 22.8 ? -119% | 35.2 ? -238% | 23.2 ? -123% |
| PWM Frequency (Hz) | ||||||
| Screen | 17% | -5% | -25% | -15% | -5% | |
| Brightness middle (cd/m²) | 354.2 | 286 -19% | 288 -19% | 265.1 -25% | 307 -13% | 261 -26% |
| Brightness (cd/m²) | 330 | 266 -19% | 264 -20% | 245 -26% | 292 -12% | 246 -25% |
| Brightness Distribution (%) | 88 | 87 -1% | 88 0% | 87 -1% | 88 0% | 87 -1% |
| Black Level * (cd/m²) | 0.32 | 0.25 22% | 0.24 25% | 0.35 -9% | 0.21 34% | 0.19 41% |
| Contrast (:1) | 1107 | 1144 3% | 1200 8% | 757 -32% | 1462 32% | 1374 24% |
| Colorchecker dE 2000 * | 4.06 | 2.14 47% | 3.67 10% | 4.68 -15% | 5.9 -45% | 3.9 4% |
| Colorchecker dE 2000 max. * | 8.81 | 5.22 41% | 18.12 -106% | 19.96 -127% | 21.6 -145% | 19.26 -119% |
| Greyscale dE 2000 * | 6.7 | 2.8 58% | 2.6 61% | 4.5 33% | 4.9 27% | 2.7 60% |
| Gamma | 2.12 104% | 2.23 99% | 2.187 101% | 2.22 99% | 2.26 97% | 2.248 98% |
| CCT | 6731 97% | 7092 92% | 6971 93% | 6632 98% | 6504 100% | 6828 95% |
| Colorchecker dE 2000 calibrated * | 0.67 | 3.22 | 3.7 | 4.8 | 3.24 | |
| Totalt genomsnitt (program/inställningar) | 13% /
14% | -84% /
-45% | -78% /
-51% | -137% /
-74% | -90% /
-48% |
* ... mindre är bättre
Visa svarstider
| ↔ Svarstid svart till vitt | ||
|---|---|---|
| 10.4 ms ... stiga ↗ och falla ↘ kombinerat | ↗ 6.4 ms stiga | 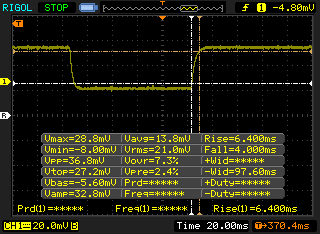 |
| ↘ 4 ms hösten | ||
| Skärmen visar bra svarsfrekvens i våra tester, men kan vara för långsam för konkurrenskraftiga spelare. I jämförelse sträcker sig alla testade enheter från 0.1 (minst) till 240 (maximalt) ms. » 28 % av alla enheter är bättre. Det betyder att den uppmätta svarstiden är bättre än genomsnittet av alla testade enheter (19.8 ms). | ||
| ↔ Svarstid 50 % grått till 80 % grått | ||
| 8.4 ms ... stiga ↗ och falla ↘ kombinerat | ↗ 4.4 ms stiga | 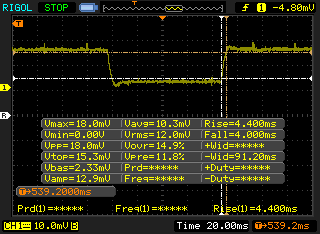 |
| ↘ 4 ms hösten | ||
| Skärmen visar snabba svarsfrekvenser i våra tester och bör passa för spel. I jämförelse sträcker sig alla testade enheter från 0.165 (minst) till 636 (maximalt) ms. » 22 % av alla enheter är bättre. Det betyder att den uppmätta svarstiden är bättre än genomsnittet av alla testade enheter (31 ms). | ||
Skärmflimmer / PWM (Puls-Width Modulation)
| Skärmflimmer / PWM upptäcktes inte | 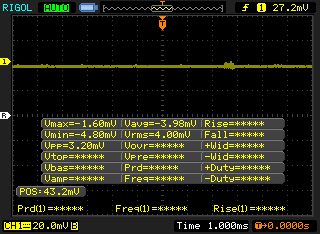 | ||
Som jämförelse: 52 % av alla testade enheter använder inte PWM för att dämpa skärmen. Om PWM upptäcktes mättes ett medelvärde av 7754 (minst: 5 - maximum: 343500) Hz. | |||

Prestanda
Provningsförhållanden
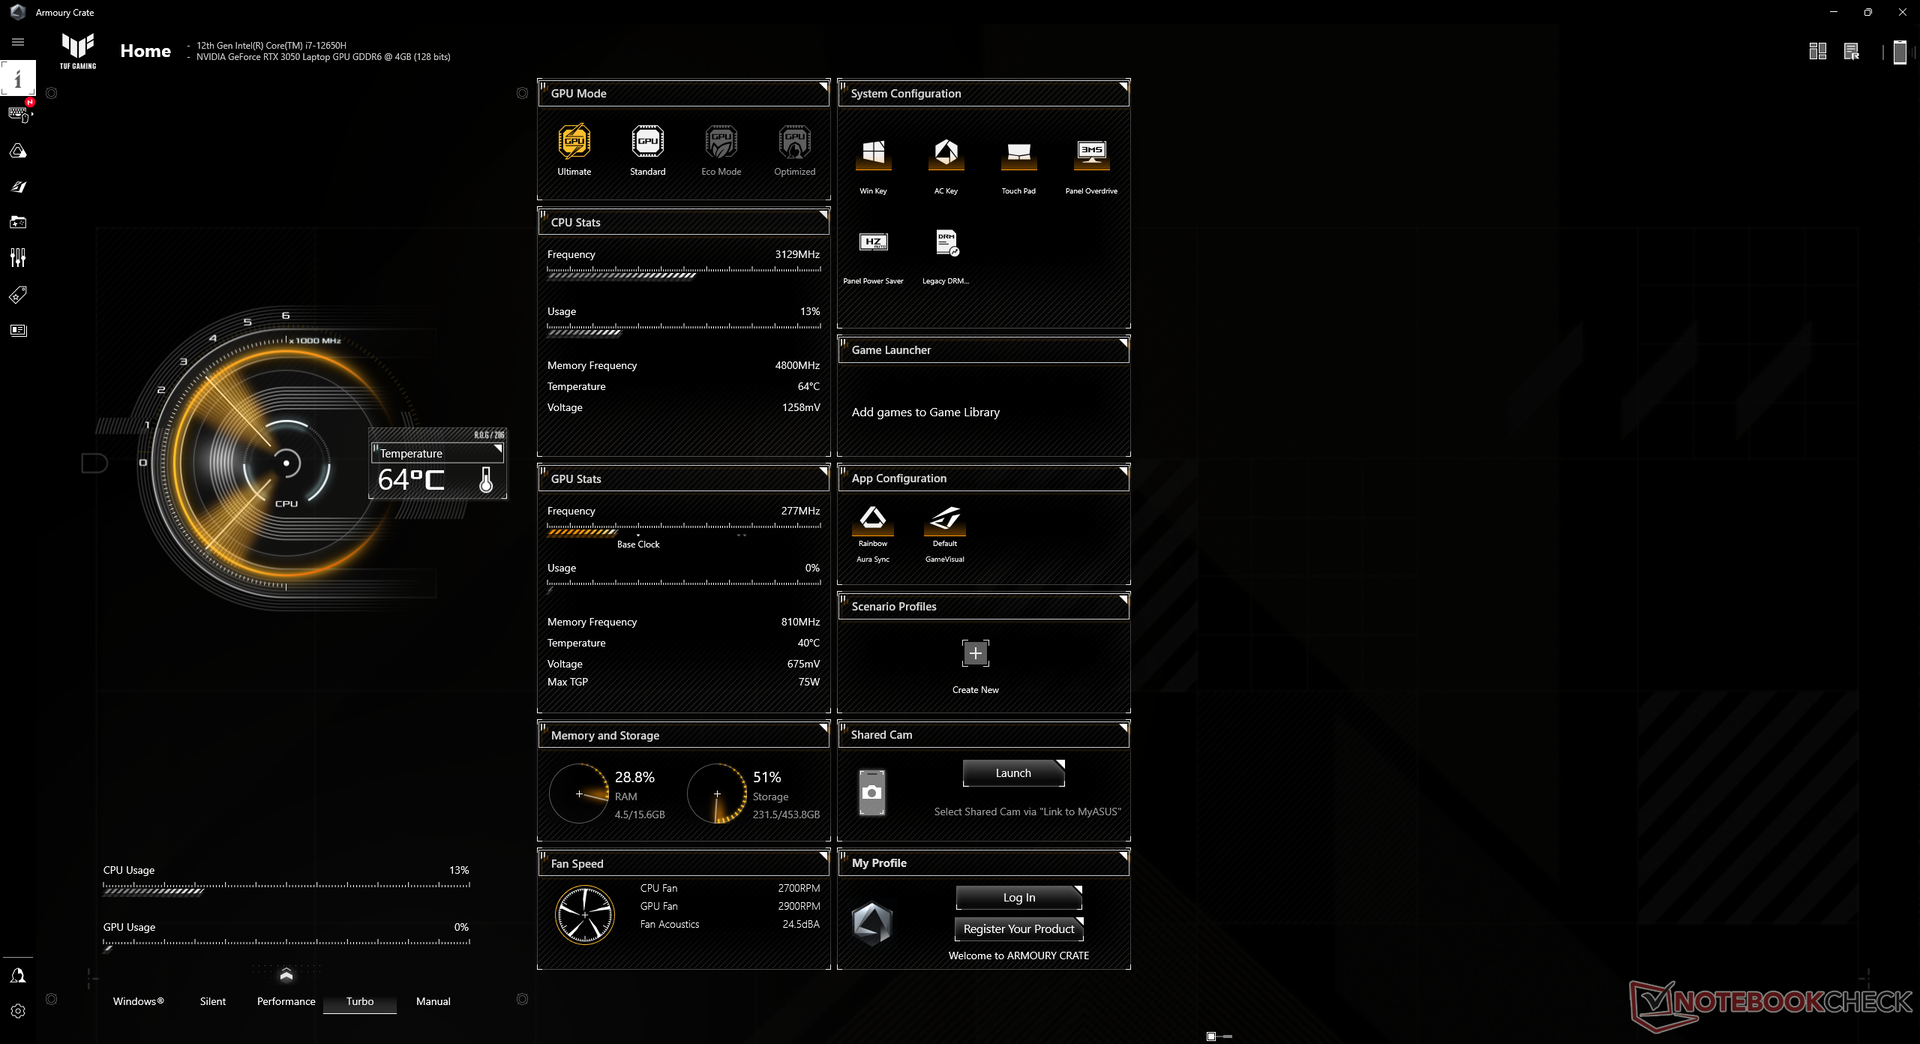
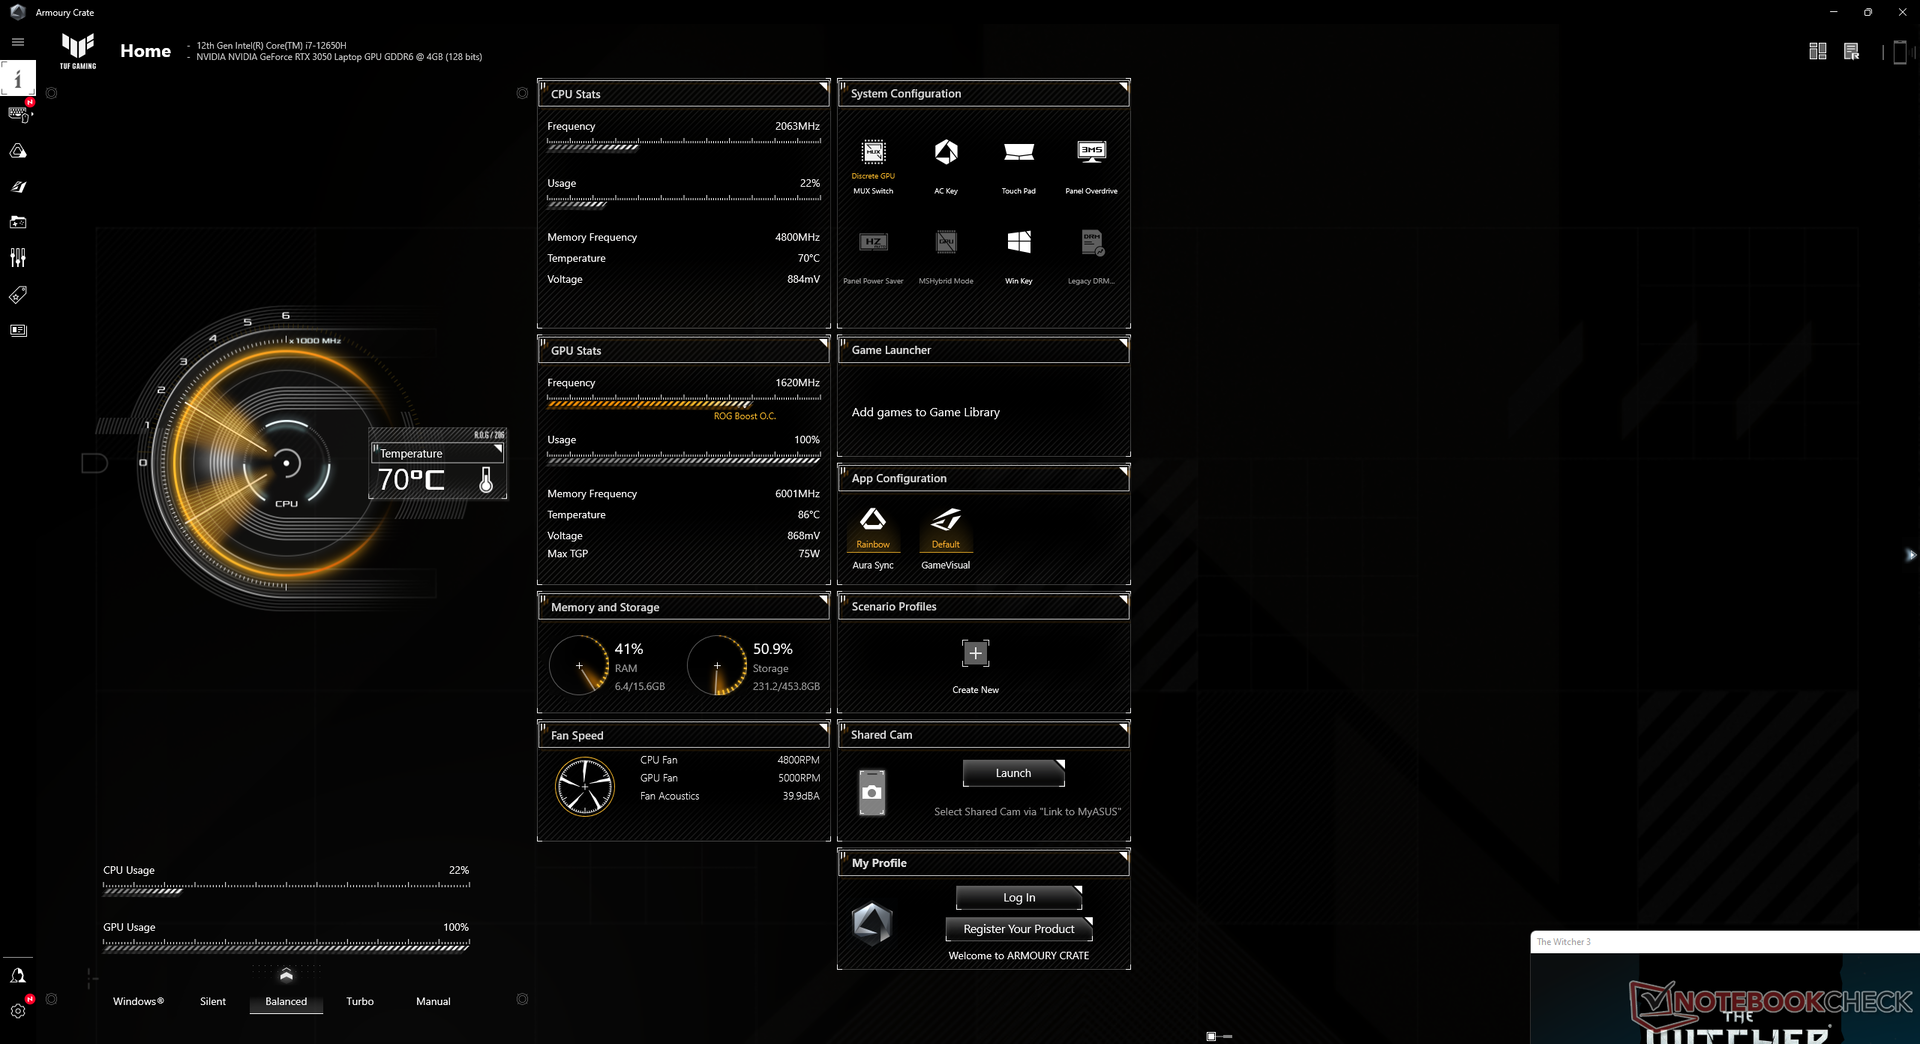
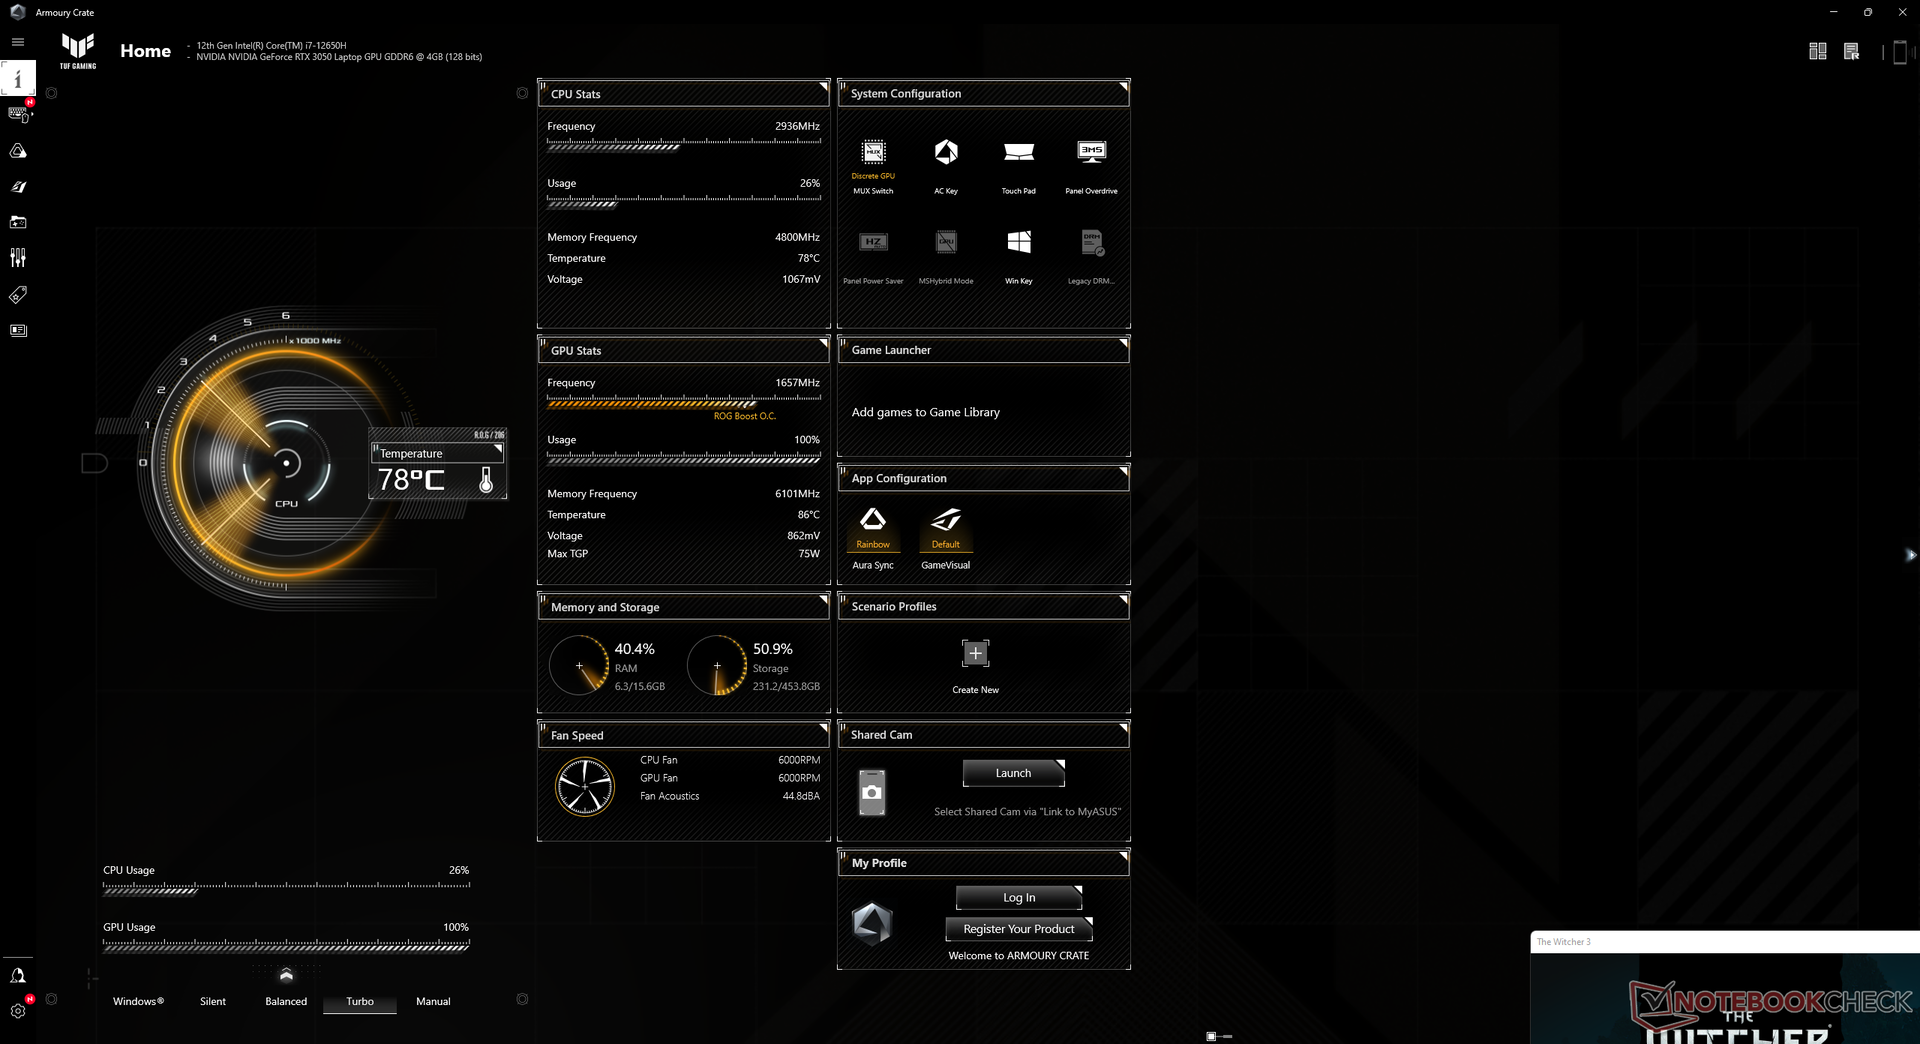
Vi ställde in vår enhet på Turbo- och diskret GPU-läge innan vi körde alla prestandanivåer nedan. Systemet använder MSHybrid/MUX för grafikkoppling som användare kan växla via programvaran Armoury Crate. Det rekommenderas starkt att ägarna blir bekanta med Armoury Crate eftersom den fungerar som systemets kommandocentral. Modellen har till och med en praktisk dedikerad tangent på tangentbordet för att starta appen.

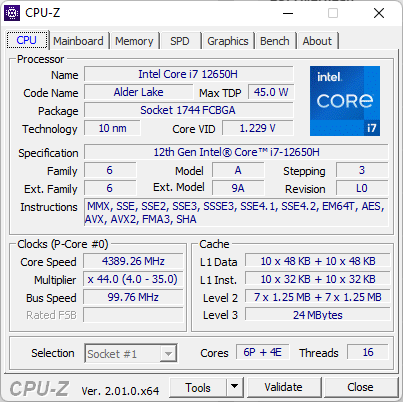
Processor
Den totala CPU-prestandan liknar mest den Core i7-11800H i flertrådiga program, medan den är 15-20 procent snabbare i enkeltrådiga program.
Cinebench R15 Multi Loop
Cinebench R23: Multi Core | Single Core
Cinebench R15: CPU Multi 64Bit | CPU Single 64Bit
Blender: v2.79 BMW27 CPU
7-Zip 18.03: 7z b 4 | 7z b 4 -mmt1
Geekbench 5.5: Multi-Core | Single-Core
HWBOT x265 Benchmark v2.2: 4k Preset
LibreOffice : 20 Documents To PDF
R Benchmark 2.5: Overall mean
| Cinebench R20 / CPU (Multi Core) | |
| MSI GE67 HX 12UGS | |
| MSI Vector GP66 12UGS | |
| Acer Nitro 5 AN515-58-72QR | |
| MSI Raider GE66 12UHS | |
| Gigabyte A5 X1 | |
| MSI GP66 Leopard 11UH-028 | |
| Asus TUF Dash F15 FX517ZC | |
| Dell G15 5515 | |
| Genomsnitt Intel Core i7-12650H (2106 - 6009, n=14) | |
| MSI GS66 Stealth 10UG | |
| MSI Bravo 15 B5DD-010US | |
| Gigabyte G5 GD | |
| Cinebench R20 / CPU (Single Core) | |
| MSI Vector GP66 12UGS | |
| MSI Raider GE66 12UHS | |
| Acer Nitro 5 AN515-58-72QR | |
| Asus TUF Dash F15 FX517ZC | |
| MSI GE67 HX 12UGS | |
| Genomsnitt Intel Core i7-12650H (552 - 696, n=14) | |
| MSI GP66 Leopard 11UH-028 | |
| Gigabyte A5 X1 | |
| Gigabyte G5 GD | |
| Dell G15 5515 | |
| MSI Bravo 15 B5DD-010US | |
| MSI GS66 Stealth 10UG | |
| Cinebench R23 / Multi Core | |
| MSI GE67 HX 12UGS | |
| MSI Vector GP66 12UGS | |
| Acer Nitro 5 AN515-58-72QR | |
| MSI Raider GE66 12UHS | |
| Gigabyte A5 X1 | |
| MSI GP66 Leopard 11UH-028 | |
| Asus TUF Dash F15 FX517ZC | |
| Dell G15 5515 | |
| Genomsnitt Intel Core i7-12650H (5362 - 15537, n=14) | |
| MSI GS66 Stealth 10UG | |
| MSI Bravo 15 B5DD-010US | |
| Gigabyte G5 GD | |
| Cinebench R23 / Single Core | |
| MSI Vector GP66 12UGS | |
| MSI Raider GE66 12UHS | |
| Acer Nitro 5 AN515-58-72QR | |
| MSI GE67 HX 12UGS | |
| Asus TUF Dash F15 FX517ZC | |
| Genomsnitt Intel Core i7-12650H (1428 - 1808, n=14) | |
| MSI GP66 Leopard 11UH-028 | |
| Gigabyte A5 X1 | |
| Gigabyte G5 GD | |
| Dell G15 5515 | |
| MSI Bravo 15 B5DD-010US | |
| MSI GS66 Stealth 10UG | |
| Cinebench R15 / CPU Multi 64Bit | |
| MSI GE67 HX 12UGS | |
| Acer Nitro 5 AN515-58-72QR | |
| MSI Raider GE66 12UHS | |
| MSI Vector GP66 12UGS | |
| Gigabyte A5 X1 | |
| MSI GP66 Leopard 11UH-028 | |
| Dell G15 5515 | |
| Asus TUF Dash F15 FX517ZC | |
| Genomsnitt Intel Core i7-12650H (753 - 2253, n=14) | |
| MSI GS66 Stealth 10UG | |
| Gigabyte G5 GD | |
| MSI Bravo 15 B5DD-010US | |
| Cinebench R15 / CPU Single 64Bit | |
| MSI Vector GP66 12UGS | |
| MSI Raider GE66 12UHS | |
| Acer Nitro 5 AN515-58-72QR | |
| MSI GE67 HX 12UGS | |
| Asus TUF Dash F15 FX517ZC | |
| Genomsnitt Intel Core i7-12650H (206 - 261, n=14) | |
| Gigabyte A5 X1 | |
| Dell G15 5515 | |
| MSI GP66 Leopard 11UH-028 | |
| MSI Bravo 15 B5DD-010US | |
| Gigabyte G5 GD | |
| MSI GS66 Stealth 10UG | |
| Blender / v2.79 BMW27 CPU | |
| Gigabyte G5 GD | |
| MSI Bravo 15 B5DD-010US | |
| Genomsnitt Intel Core i7-12650H (222 - 553, n=15) | |
| MSI GS66 Stealth 10UG | |
| Asus TUF Dash F15 FX517ZC | |
| Dell G15 5515 | |
| MSI GP66 Leopard 11UH-028 | |
| Gigabyte A5 X1 | |
| Acer Nitro 5 AN515-58-72QR | |
| MSI Vector GP66 12UGS | |
| MSI Raider GE66 12UHS | |
| MSI GE67 HX 12UGS | |
| 7-Zip 18.03 / 7z b 4 -mmt1 | |
| MSI Vector GP66 12UGS | |
| MSI Raider GE66 12UHS | |
| Acer Nitro 5 AN515-58-72QR | |
| Gigabyte A5 X1 | |
| Genomsnitt Intel Core i7-12650H (5265 - 6116, n=14) | |
| MSI GE67 HX 12UGS | |
| MSI GP66 Leopard 11UH-028 | |
| Dell G15 5515 | |
| Asus TUF Dash F15 FX517ZC | |
| MSI Bravo 15 B5DD-010US | |
| MSI GS66 Stealth 10UG | |
| Gigabyte G5 GD | |
| Geekbench 5.5 / Multi-Core | |
| MSI GE67 HX 12UGS | |
| MSI Raider GE66 12UHS | |
| MSI Vector GP66 12UGS | |
| Acer Nitro 5 AN515-58-72QR | |
| Genomsnitt Intel Core i7-12650H (6478 - 11284, n=16) | |
| Asus TUF Dash F15 FX517ZC | |
| MSI GP66 Leopard 11UH-028 | |
| Gigabyte A5 X1 | |
| MSI GS66 Stealth 10UG | |
| Dell G15 5515 | |
| Gigabyte G5 GD | |
| MSI Bravo 15 B5DD-010US | |
| Geekbench 5.5 / Single-Core | |
| MSI Vector GP66 12UGS | |
| MSI Raider GE66 12UHS | |
| Acer Nitro 5 AN515-58-72QR | |
| MSI GE67 HX 12UGS | |
| Genomsnitt Intel Core i7-12650H (1590 - 1797, n=16) | |
| Asus TUF Dash F15 FX517ZC | |
| MSI GP66 Leopard 11UH-028 | |
| Gigabyte A5 X1 | |
| Gigabyte G5 GD | |
| Dell G15 5515 | |
| MSI Bravo 15 B5DD-010US | |
| MSI GS66 Stealth 10UG | |
| HWBOT x265 Benchmark v2.2 / 4k Preset | |
| MSI GE67 HX 12UGS | |
| MSI Vector GP66 12UGS | |
| MSI Raider GE66 12UHS | |
| Acer Nitro 5 AN515-58-72QR | |
| Gigabyte A5 X1 | |
| MSI GP66 Leopard 11UH-028 | |
| Dell G15 5515 | |
| Asus TUF Dash F15 FX517ZC | |
| Genomsnitt Intel Core i7-12650H (6.62 - 17.4, n=16) | |
| MSI GS66 Stealth 10UG | |
| MSI Bravo 15 B5DD-010US | |
| Gigabyte G5 GD | |
| LibreOffice / 20 Documents To PDF | |
| Dell G15 5515 | |
| Gigabyte A5 X1 | |
| MSI Bravo 15 B5DD-010US | |
| Asus TUF Dash F15 FX517ZC | |
| MSI GP66 Leopard 11UH-028 | |
| MSI GS66 Stealth 10UG | |
| Genomsnitt Intel Core i7-12650H (35.1 - 58.5, n=14) | |
| Gigabyte G5 GD | |
| MSI GE67 HX 12UGS | |
| Acer Nitro 5 AN515-58-72QR | |
| MSI Vector GP66 12UGS | |
| MSI Raider GE66 12UHS | |
| R Benchmark 2.5 / Overall mean | |
| MSI GS66 Stealth 10UG | |
| Gigabyte G5 GD | |
| MSI GP66 Leopard 11UH-028 | |
| MSI Bravo 15 B5DD-010US | |
| Dell G15 5515 | |
| Gigabyte A5 X1 | |
| Asus TUF Dash F15 FX517ZC | |
| Genomsnitt Intel Core i7-12650H (0.4584 - 0.515, n=14) | |
| MSI GE67 HX 12UGS | |
| Acer Nitro 5 AN515-58-72QR | |
| MSI Raider GE66 12UHS | |
| MSI Vector GP66 12UGS | |
* ... mindre är bättre
AIDA64: FP32 Ray-Trace | FPU Julia | CPU SHA3 | CPU Queen | FPU SinJulia | FPU Mandel | CPU AES | CPU ZLib | FP64 Ray-Trace | CPU PhotoWorxx
| Performance rating | |
| Asus TUF Dash F15 FX517ZR | |
| MSI Bravo 15 B5DD-010US | |
| Genomsnitt Intel Core i7-12650H | |
| Gigabyte G5 GD | |
| Dell G15 5510 | |
| Asus TUF Dash F15 FX517ZC | |
| Lenovo Ideapad Gaming 3 15IHU-82K1002RGE | |
| AIDA64 / FP32 Ray-Trace | |
| Asus TUF Dash F15 FX517ZR | |
| Genomsnitt Intel Core i7-12650H (5422 - 15620, n=14) | |
| MSI Bravo 15 B5DD-010US | |
| Gigabyte G5 GD | |
| Dell G15 5510 | |
| Lenovo Ideapad Gaming 3 15IHU-82K1002RGE | |
| Asus TUF Dash F15 FX517ZC | |
| AIDA64 / FPU Julia | |
| Asus TUF Dash F15 FX517ZR | |
| MSI Bravo 15 B5DD-010US | |
| Genomsnitt Intel Core i7-12650H (26386 - 76434, n=14) | |
| Dell G15 5510 | |
| Gigabyte G5 GD | |
| Lenovo Ideapad Gaming 3 15IHU-82K1002RGE | |
| Asus TUF Dash F15 FX517ZC | |
| AIDA64 / CPU SHA3 | |
| Asus TUF Dash F15 FX517ZR | |
| Gigabyte G5 GD | |
| Genomsnitt Intel Core i7-12650H (1479 - 3244, n=14) | |
| MSI Bravo 15 B5DD-010US | |
| Lenovo Ideapad Gaming 3 15IHU-82K1002RGE | |
| Dell G15 5510 | |
| Asus TUF Dash F15 FX517ZC | |
| AIDA64 / CPU Queen | |
| Asus TUF Dash F15 FX517ZR | |
| Genomsnitt Intel Core i7-12650H (59278 - 89537, n=14) | |
| MSI Bravo 15 B5DD-010US | |
| Asus TUF Dash F15 FX517ZC | |
| Dell G15 5510 | |
| Gigabyte G5 GD | |
| Lenovo Ideapad Gaming 3 15IHU-82K1002RGE | |
| AIDA64 / FPU SinJulia | |
| MSI Bravo 15 B5DD-010US | |
| Asus TUF Dash F15 FX517ZR | |
| Dell G15 5510 | |
| Genomsnitt Intel Core i7-12650H (4690 - 8726, n=14) | |
| Gigabyte G5 GD | |
| Asus TUF Dash F15 FX517ZC | |
| Lenovo Ideapad Gaming 3 15IHU-82K1002RGE | |
| AIDA64 / FPU Mandel | |
| MSI Bravo 15 B5DD-010US | |
| Asus TUF Dash F15 FX517ZR | |
| Genomsnitt Intel Core i7-12650H (15001 - 37738, n=14) | |
| Gigabyte G5 GD | |
| Dell G15 5510 | |
| Lenovo Ideapad Gaming 3 15IHU-82K1002RGE | |
| Asus TUF Dash F15 FX517ZC | |
| AIDA64 / CPU AES | |
| Gigabyte G5 GD | |
| MSI Bravo 15 B5DD-010US | |
| Lenovo Ideapad Gaming 3 15IHU-82K1002RGE | |
| Asus TUF Dash F15 FX517ZR | |
| Genomsnitt Intel Core i7-12650H (32702 - 92530, n=14) | |
| Asus TUF Dash F15 FX517ZC | |
| Dell G15 5510 | |
| AIDA64 / CPU ZLib | |
| Asus TUF Dash F15 FX517ZR | |
| Genomsnitt Intel Core i7-12650H (443 - 891, n=14) | |
| Asus TUF Dash F15 FX517ZC | |
| MSI Bravo 15 B5DD-010US | |
| Gigabyte G5 GD | |
| Dell G15 5510 | |
| Lenovo Ideapad Gaming 3 15IHU-82K1002RGE | |
| AIDA64 / FP64 Ray-Trace | |
| Asus TUF Dash F15 FX517ZR | |
| Genomsnitt Intel Core i7-12650H (3096 - 8448, n=14) | |
| Gigabyte G5 GD | |
| MSI Bravo 15 B5DD-010US | |
| Dell G15 5510 | |
| Lenovo Ideapad Gaming 3 15IHU-82K1002RGE | |
| Asus TUF Dash F15 FX517ZC | |
| AIDA64 / CPU PhotoWorxx | |
| Asus TUF Dash F15 FX517ZR | |
| Genomsnitt Intel Core i7-12650H (22046 - 44164, n=14) | |
| Asus TUF Dash F15 FX517ZC | |
| Gigabyte G5 GD | |
| MSI Bravo 15 B5DD-010US | |
| Dell G15 5510 | |
| Lenovo Ideapad Gaming 3 15IHU-82K1002RGE | |
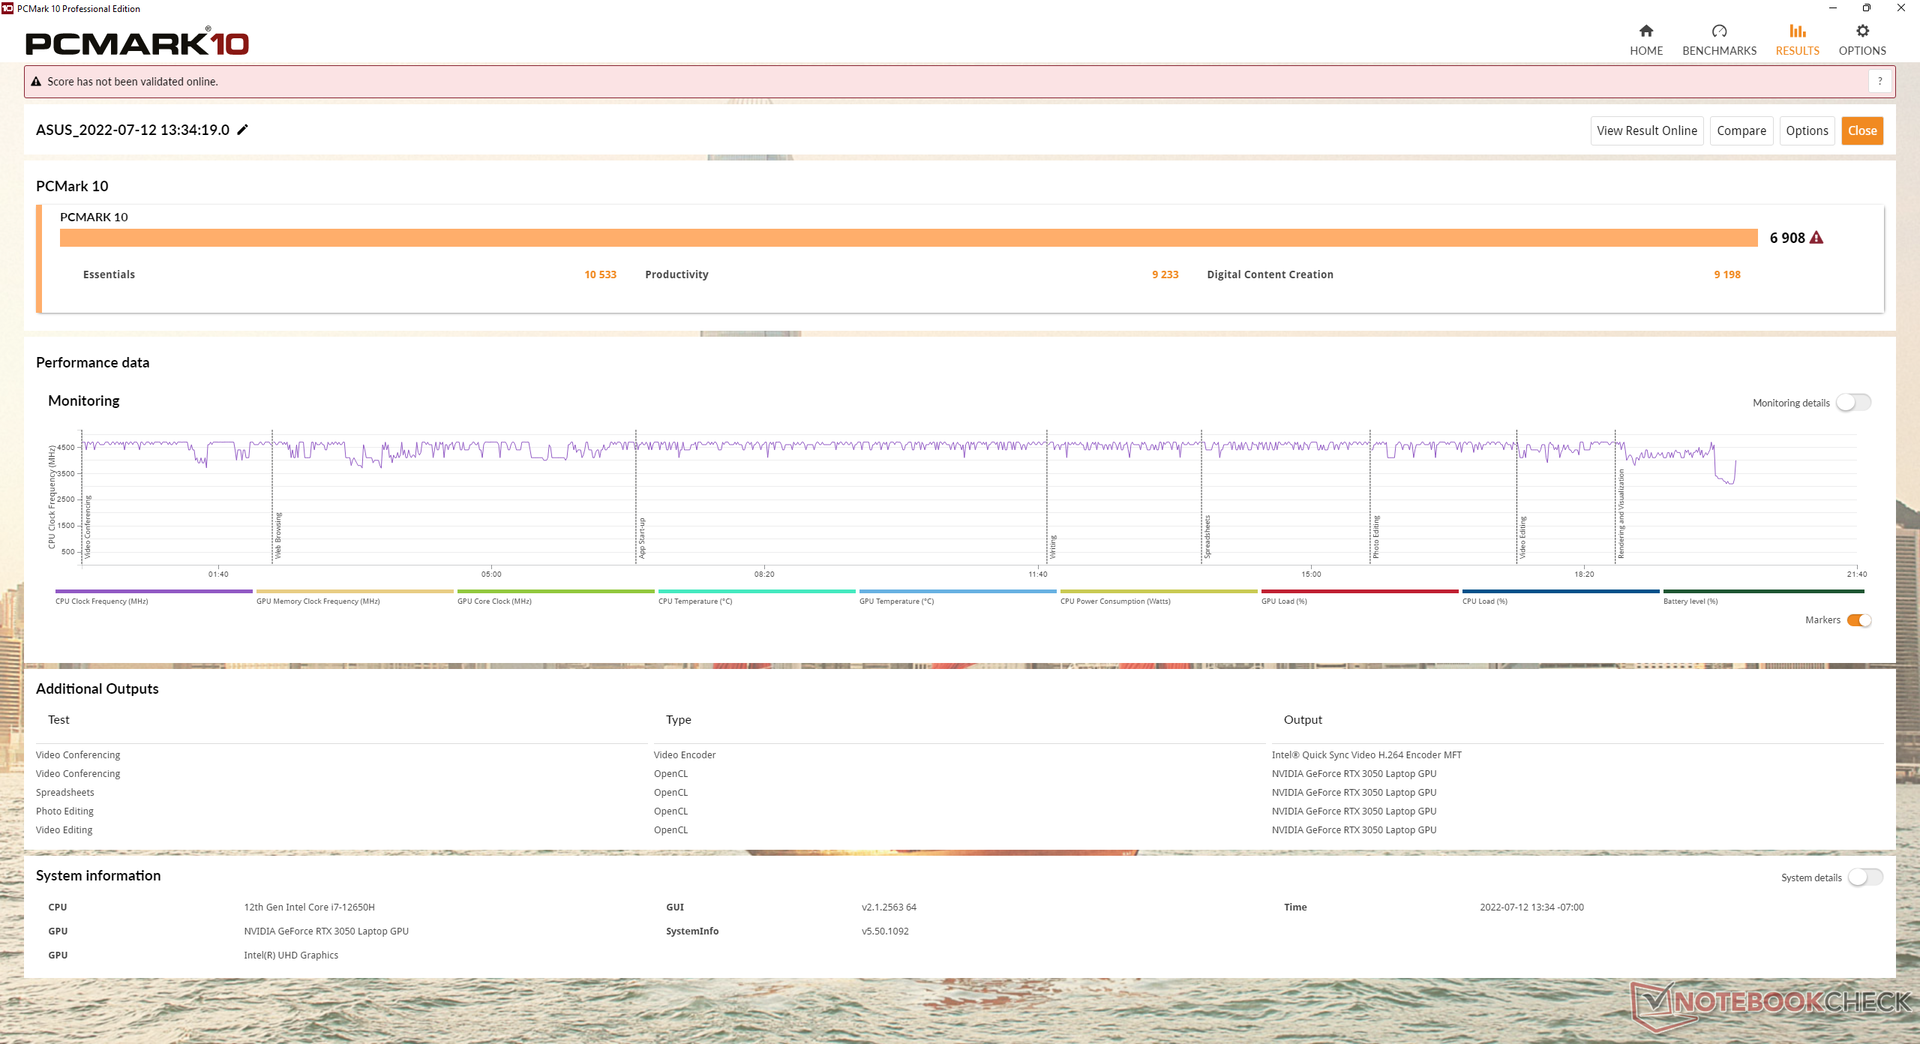
Systemets prestanda
CrossMark: Overall | Productivity | Creativity | Responsiveness
| PCMark 10 / Score | |
| Asus TUF Dash F15 FX517ZC | |
| Genomsnitt Intel Core i7-12650H, NVIDIA GeForce RTX 3050 4GB Laptop GPU (n=1) | |
| Asus TUF Dash F15 FX517ZR | |
| MSI Bravo 15 B5DD-010US | |
| Gigabyte G5 GD | |
| Lenovo Ideapad Gaming 3 15IHU-82K1002RGE | |
| Dell G15 5510 | |
| PCMark 10 / Essentials | |
| Asus TUF Dash F15 FX517ZC | |
| Genomsnitt Intel Core i7-12650H, NVIDIA GeForce RTX 3050 4GB Laptop GPU (n=1) | |
| Asus TUF Dash F15 FX517ZR | |
| MSI Bravo 15 B5DD-010US | |
| Gigabyte G5 GD | |
| Lenovo Ideapad Gaming 3 15IHU-82K1002RGE | |
| Dell G15 5510 | |
| PCMark 10 / Productivity | |
| Asus TUF Dash F15 FX517ZR | |
| Asus TUF Dash F15 FX517ZC | |
| Genomsnitt Intel Core i7-12650H, NVIDIA GeForce RTX 3050 4GB Laptop GPU (n=1) | |
| Lenovo Ideapad Gaming 3 15IHU-82K1002RGE | |
| MSI Bravo 15 B5DD-010US | |
| Gigabyte G5 GD | |
| Dell G15 5510 | |
| PCMark 10 / Digital Content Creation | |
| Asus TUF Dash F15 FX517ZC | |
| Genomsnitt Intel Core i7-12650H, NVIDIA GeForce RTX 3050 4GB Laptop GPU (n=1) | |
| Asus TUF Dash F15 FX517ZR | |
| MSI Bravo 15 B5DD-010US | |
| Gigabyte G5 GD | |
| Dell G15 5510 | |
| Lenovo Ideapad Gaming 3 15IHU-82K1002RGE | |
| CrossMark / Overall | |
| Asus TUF Dash F15 FX517ZR | |
| Asus TUF Dash F15 FX517ZC | |
| Genomsnitt Intel Core i7-12650H, NVIDIA GeForce RTX 3050 4GB Laptop GPU (n=1) | |
| Lenovo Ideapad Gaming 3 15IHU-82K1002RGE | |
| CrossMark / Productivity | |
| Asus TUF Dash F15 FX517ZC | |
| Genomsnitt Intel Core i7-12650H, NVIDIA GeForce RTX 3050 4GB Laptop GPU (n=1) | |
| Asus TUF Dash F15 FX517ZR | |
| Lenovo Ideapad Gaming 3 15IHU-82K1002RGE | |
| CrossMark / Creativity | |
| Asus TUF Dash F15 FX517ZR | |
| Asus TUF Dash F15 FX517ZC | |
| Genomsnitt Intel Core i7-12650H, NVIDIA GeForce RTX 3050 4GB Laptop GPU (n=1) | |
| Lenovo Ideapad Gaming 3 15IHU-82K1002RGE | |
| CrossMark / Responsiveness | |
| Asus TUF Dash F15 FX517ZC | |
| Genomsnitt Intel Core i7-12650H, NVIDIA GeForce RTX 3050 4GB Laptop GPU (n=1) | |
| Asus TUF Dash F15 FX517ZR | |
| Lenovo Ideapad Gaming 3 15IHU-82K1002RGE | |
| PCMark 10 Score | 6908 poäng | |
Hjälp | ||
| AIDA64 / Memory Copy | |
| Asus TUF Dash F15 FX517ZR | |
| Genomsnitt Intel Core i7-12650H (43261 - 69735, n=14) | |
| Asus TUF Dash F15 FX517ZC | |
| Gigabyte G5 GD | |
| MSI Bravo 15 B5DD-010US | |
| Dell G15 5510 | |
| Lenovo Ideapad Gaming 3 15IHU-82K1002RGE | |
| AIDA64 / Memory Read | |
| Asus TUF Dash F15 FX517ZR | |
| Genomsnitt Intel Core i7-12650H (47313 - 67412, n=14) | |
| Asus TUF Dash F15 FX517ZC | |
| Gigabyte G5 GD | |
| MSI Bravo 15 B5DD-010US | |
| Dell G15 5510 | |
| Lenovo Ideapad Gaming 3 15IHU-82K1002RGE | |
| AIDA64 / Memory Write | |
| Asus TUF Dash F15 FX517ZR | |
| Genomsnitt Intel Core i7-12650H (45617 - 59361, n=14) | |
| Asus TUF Dash F15 FX517ZC | |
| Gigabyte G5 GD | |
| Dell G15 5510 | |
| MSI Bravo 15 B5DD-010US | |
| Lenovo Ideapad Gaming 3 15IHU-82K1002RGE | |
| AIDA64 / Memory Latency | |
| Asus TUF Dash F15 FX517ZR | |
| Gigabyte G5 GD | |
| Lenovo Ideapad Gaming 3 15IHU-82K1002RGE | |
| Genomsnitt Intel Core i7-12650H (71.6 - 103.9, n=14) | |
| Dell G15 5510 | |
| MSI Bravo 15 B5DD-010US | |
| Asus TUF Dash F15 FX517ZC | |
* ... mindre är bättre
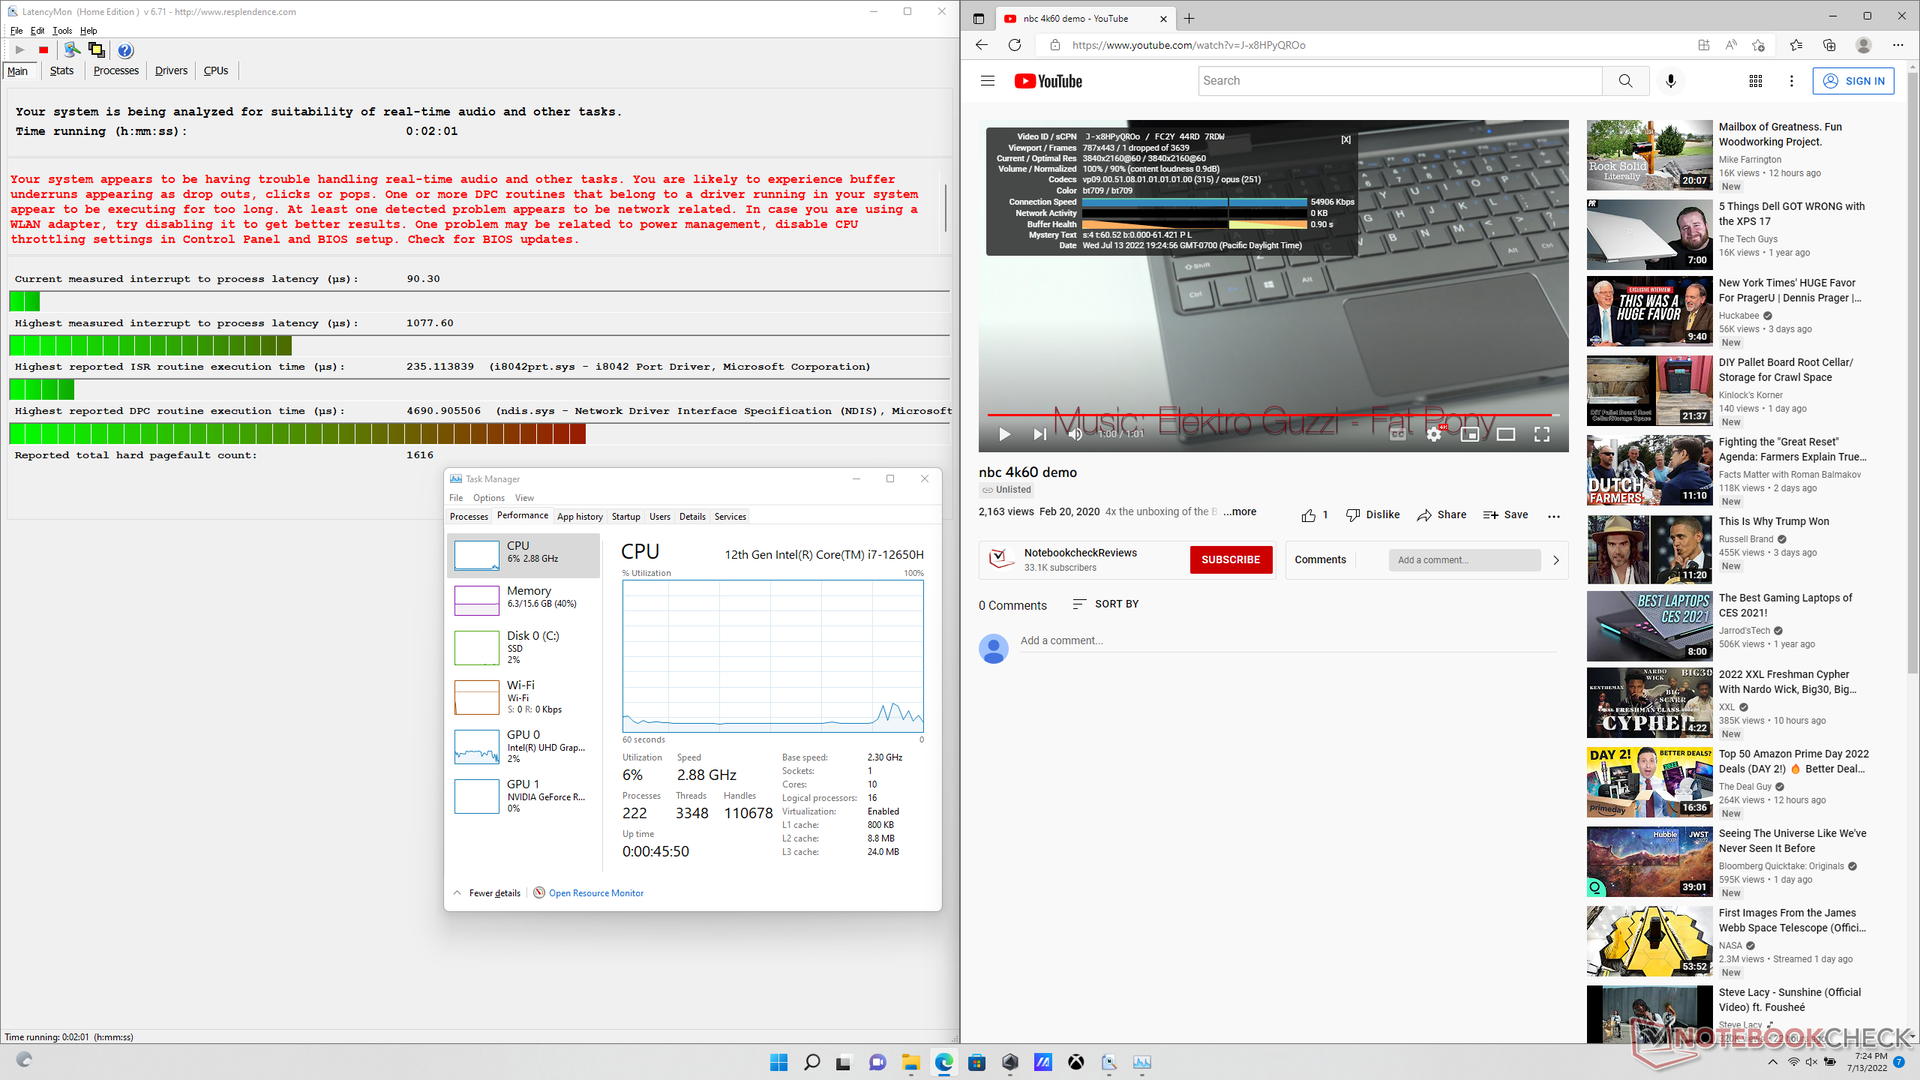
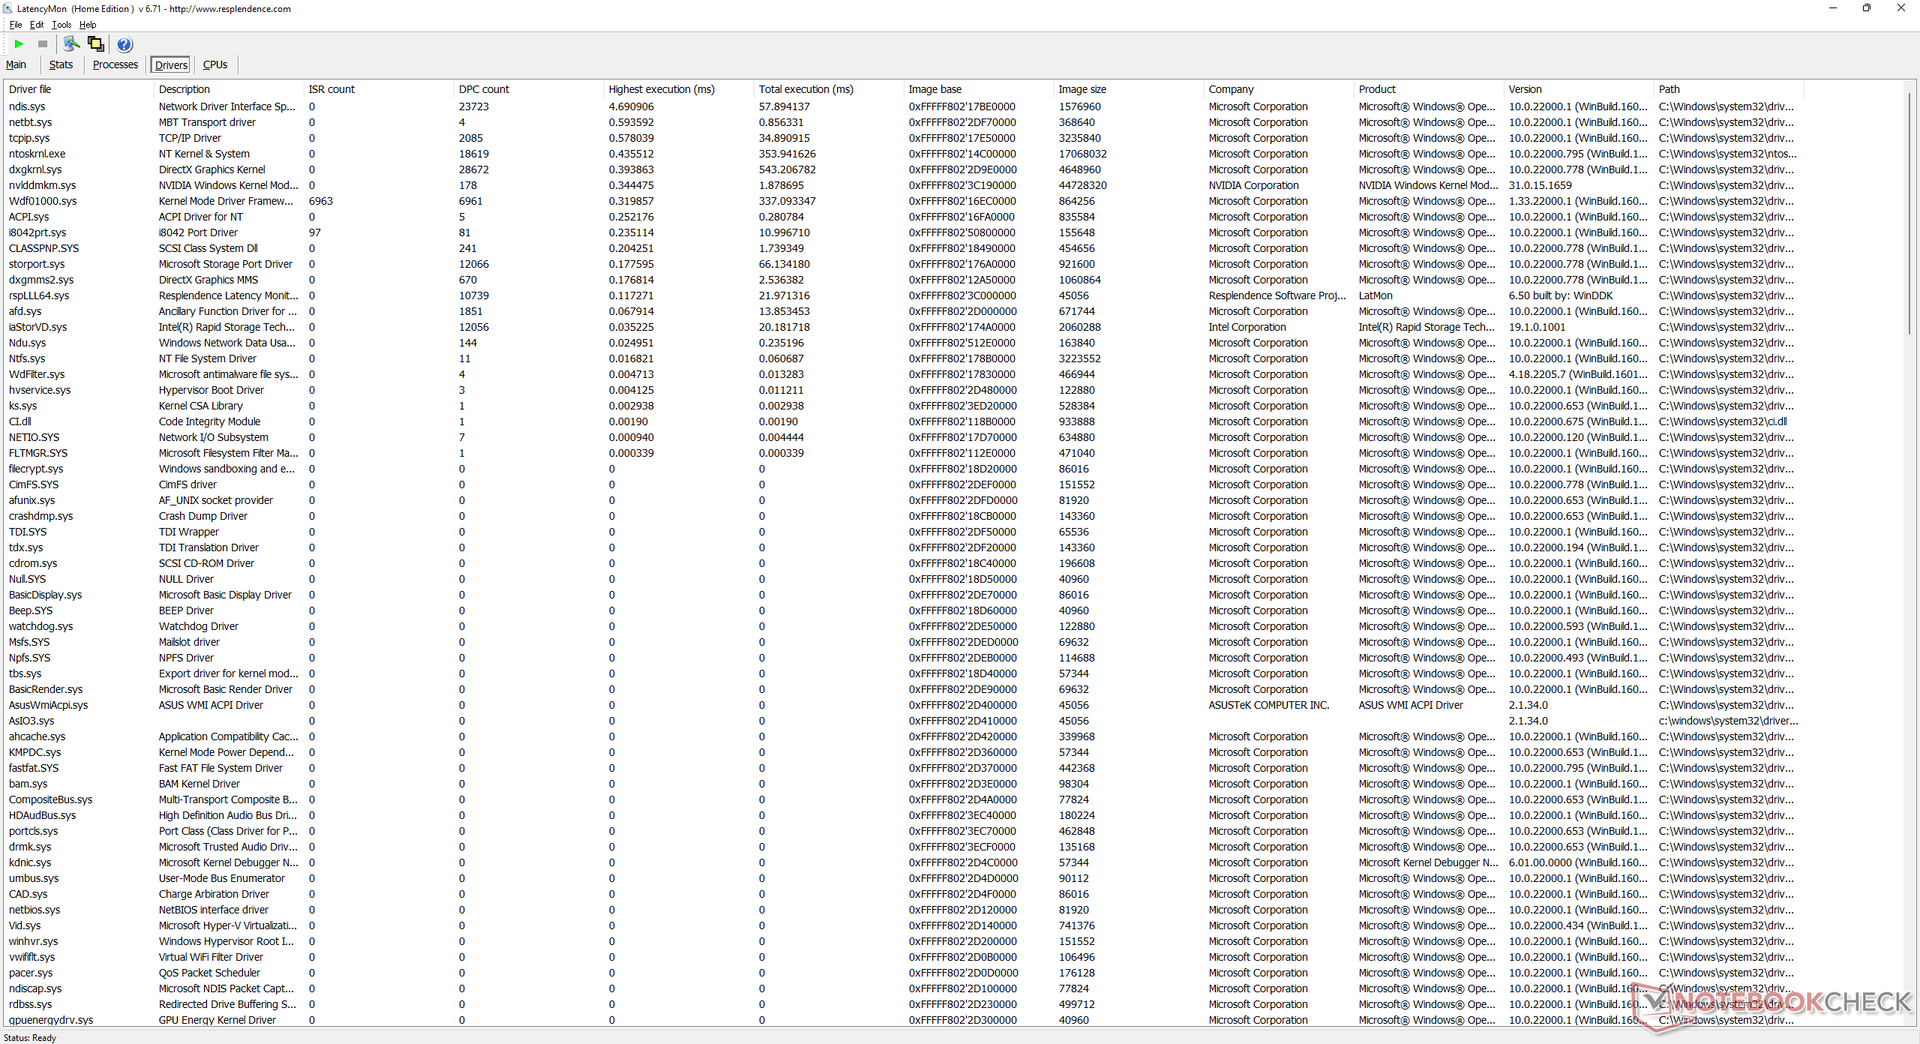
DPC-latenstid
Vi upplevde DPC-problem när vi öppnade flera webbläsarflikar på vår hemsida. uppspelning av 4K-video vid 60 FPS är annars perfekt med bara en enda tappad bild under vår minutlånga video.
| DPC Latencies / LatencyMon - interrupt to process latency (max), Web, Youtube, Prime95 | |
| Dell G15 5510 | |
| MSI Bravo 15 B5DD-010US | |
| Asus TUF Dash F15 FX517ZC | |
| Lenovo Ideapad Gaming 3 15IHU-82K1002RGE | |
| Asus TUF Dash F15 FX517ZR | |
| Gigabyte G5 GD | |
* ... mindre är bättre
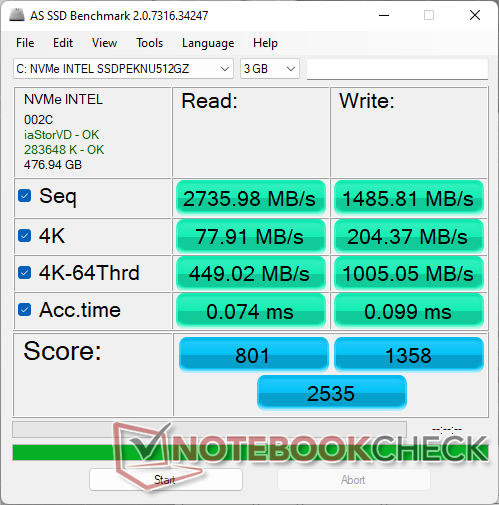
Lagringsenheter - stöder upp till 2x M.2 SSD-enheter
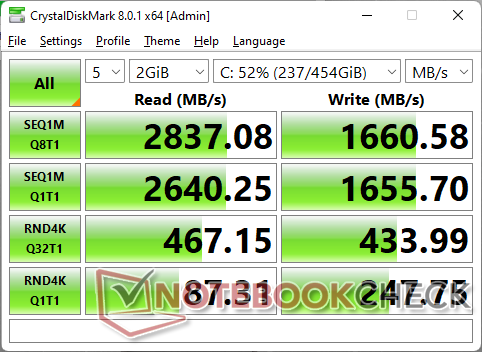
Vår testenhet levereras med en mellanklass Intel 670p SSD för en kontinuerlig sekventiell läshastighet på cirka 2300 MB/s. Systemet kan stödja upp till två interna M.2 2280 SSD-enheter samtidigt.

| Drive Performance rating - Percent | |
| Gigabyte G5 GD | |
| Asus TUF Dash F15 FX517ZR | |
| Dell G15 5510 | |
| Asus TUF Dash F15 FX517ZC | |
| Lenovo Ideapad Gaming 3 15IHU-82K1002RGE | |
| MSI Bravo 15 B5DD-010US | |
* ... mindre är bättre
Disk Throttling: DiskSpd Read Loop, Queue Depth 8
GPU-prestanda
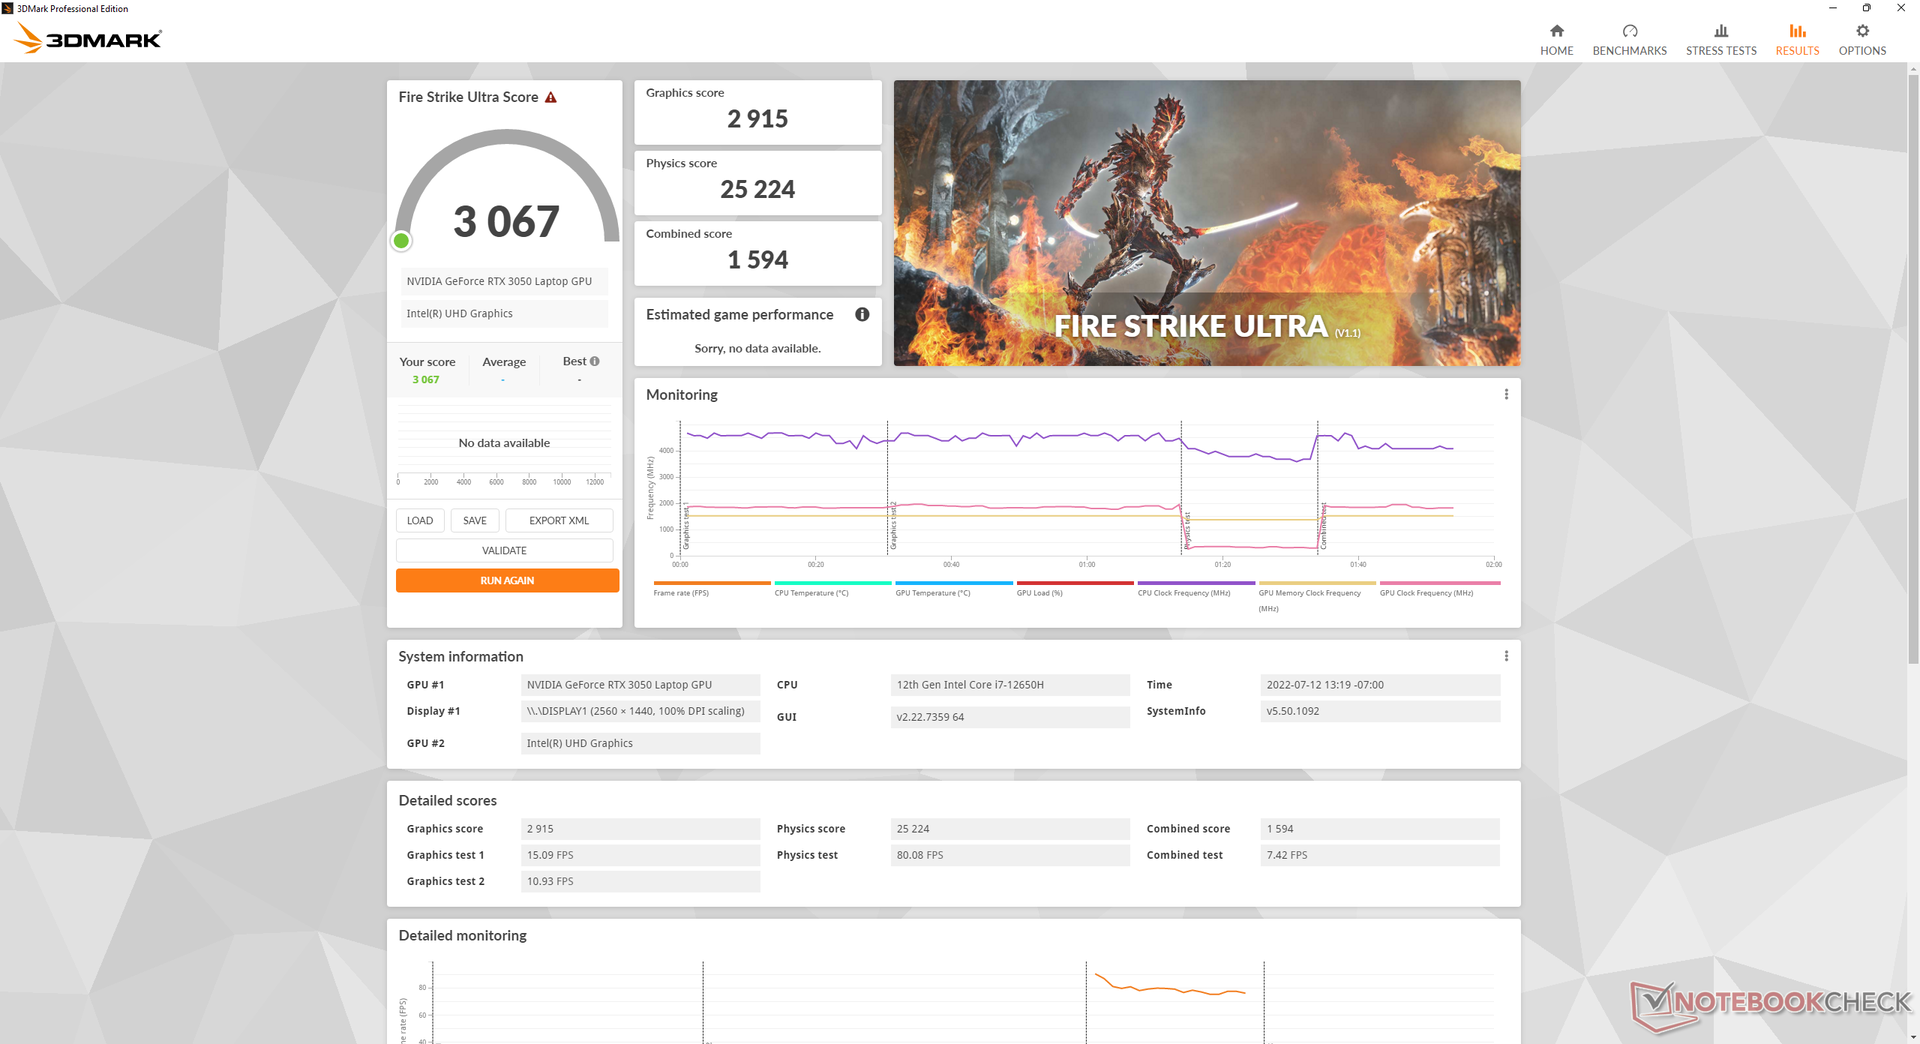
Vår 75 W GeForce RTX 3050 presterar ungefär 40 procent långsammare än 105 W GeForce RTX 3070 i FX517ZR. Skillnaden blir tydligare när du kör GPU-tunga titlar som Cyberpunk 2077 där vår RTX 3050 kan ligga nästan 50 procent efter. Bärbara spelare som fortfarande kör på det äldre RTX 2060 missar inte mycket eftersom Turing GPU:n är snabbare än RTX 3050 med cirka 25 procent.
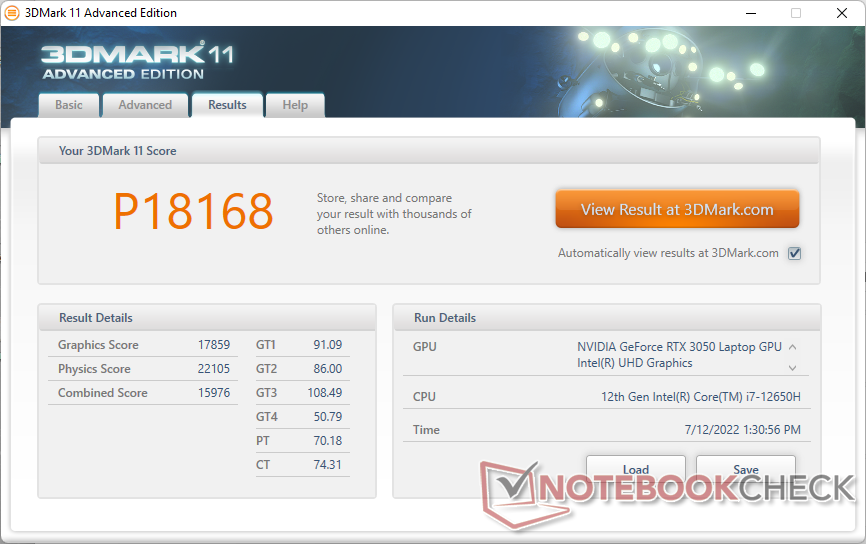
| 3DMark 11 Performance | 18168 poäng | |
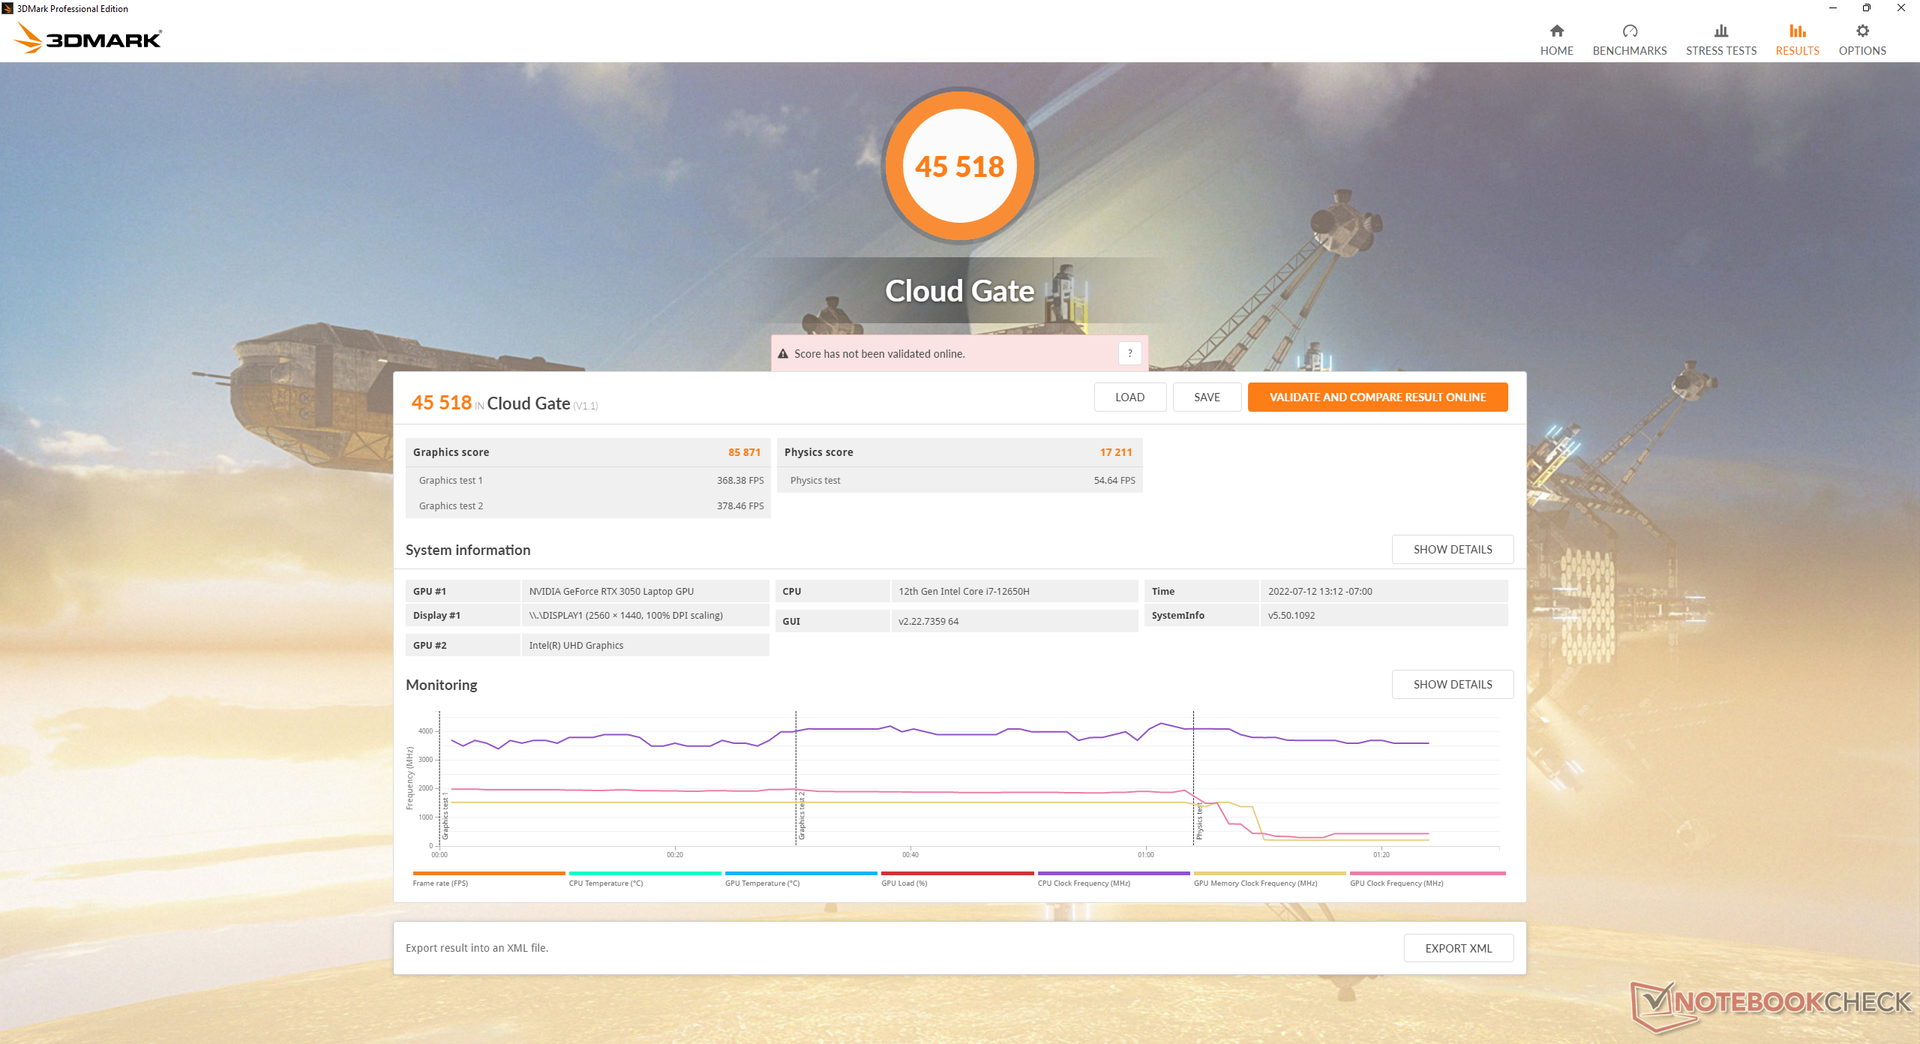
| 3DMark Cloud Gate Standard Score | 45518 poäng | |
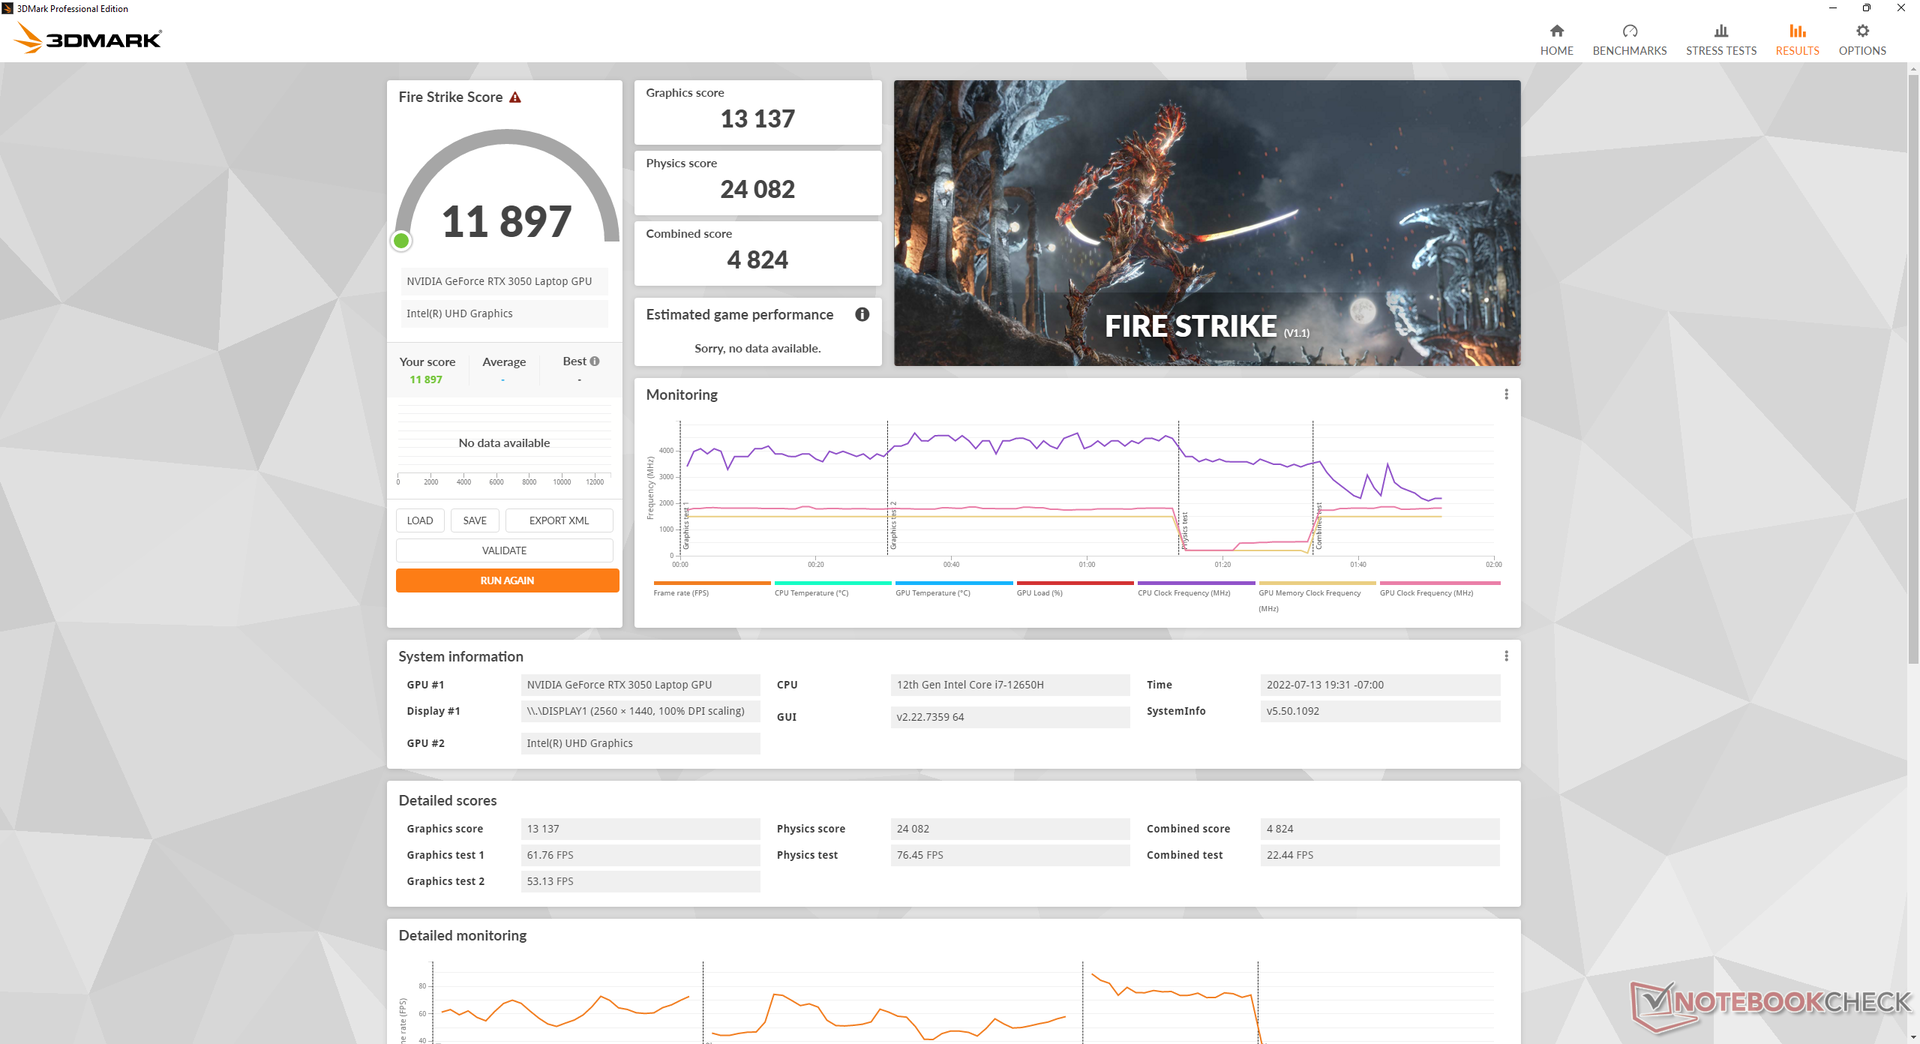
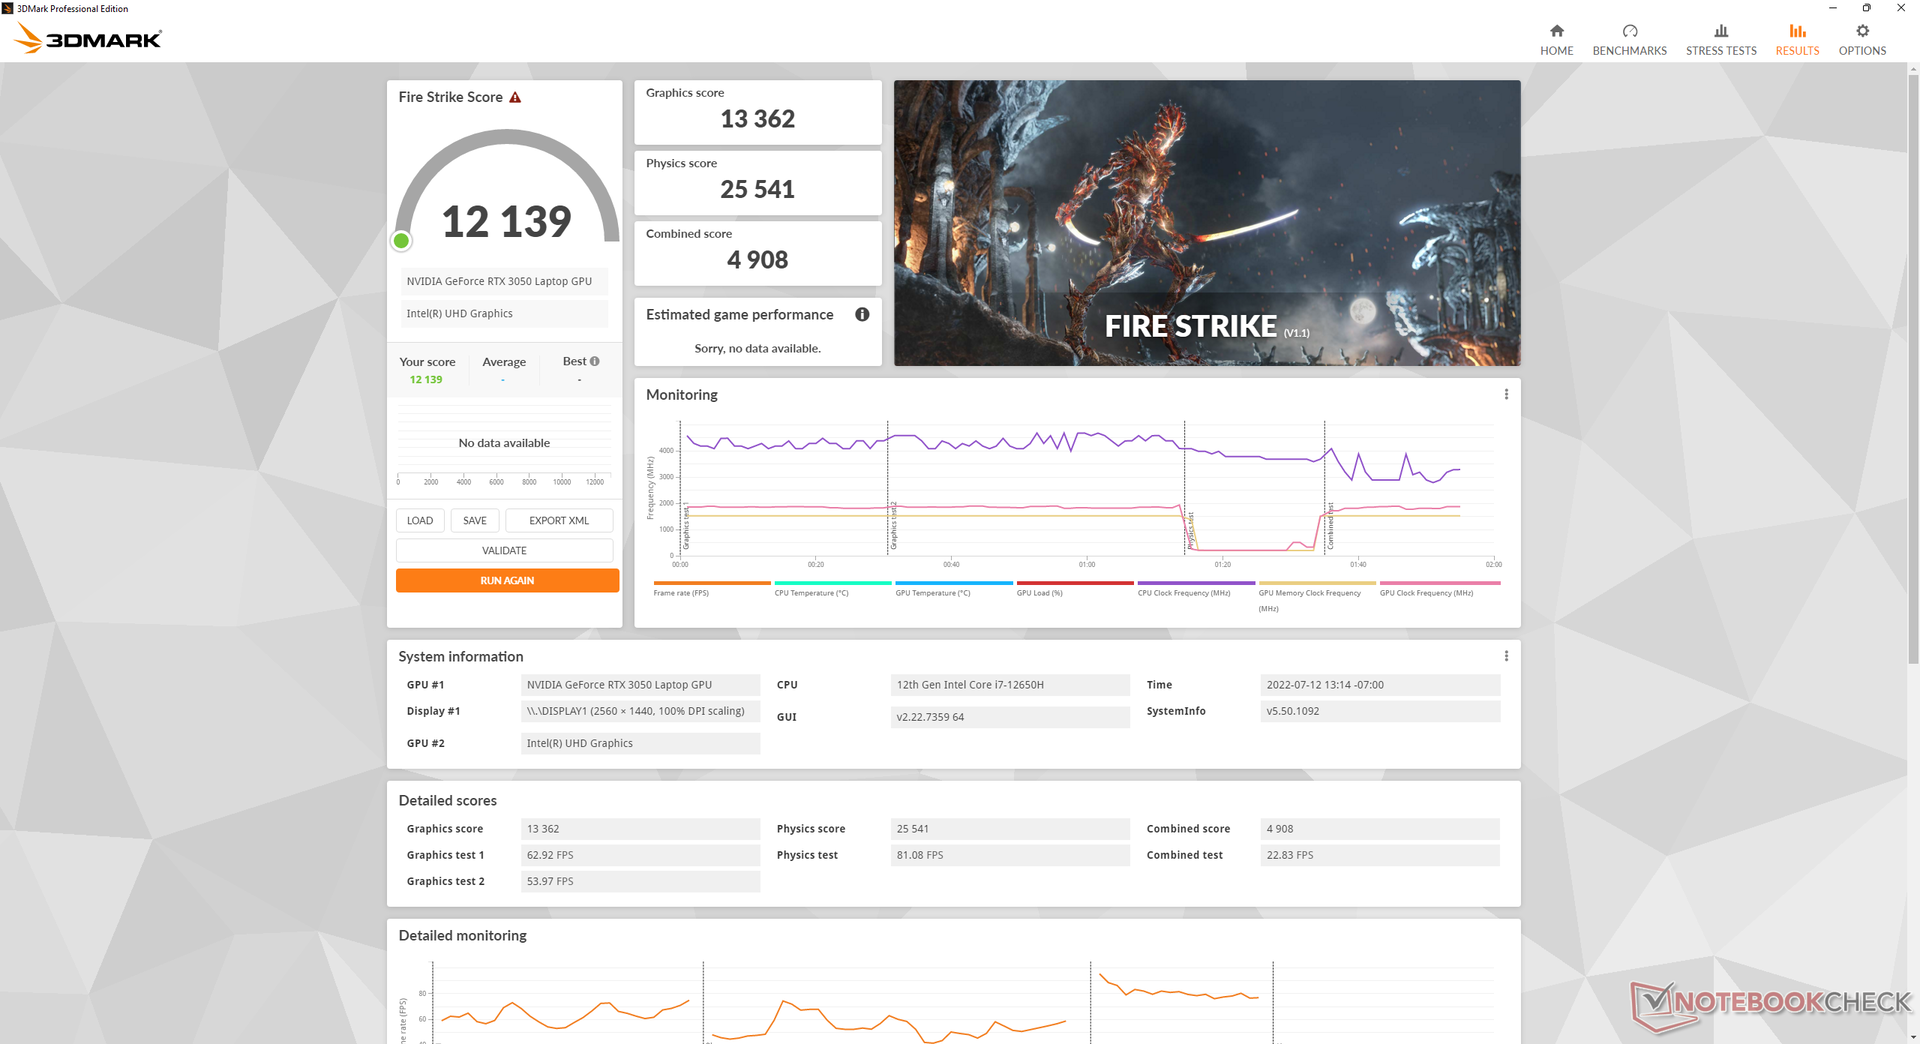
| 3DMark Fire Strike Score | 12139 poäng | |
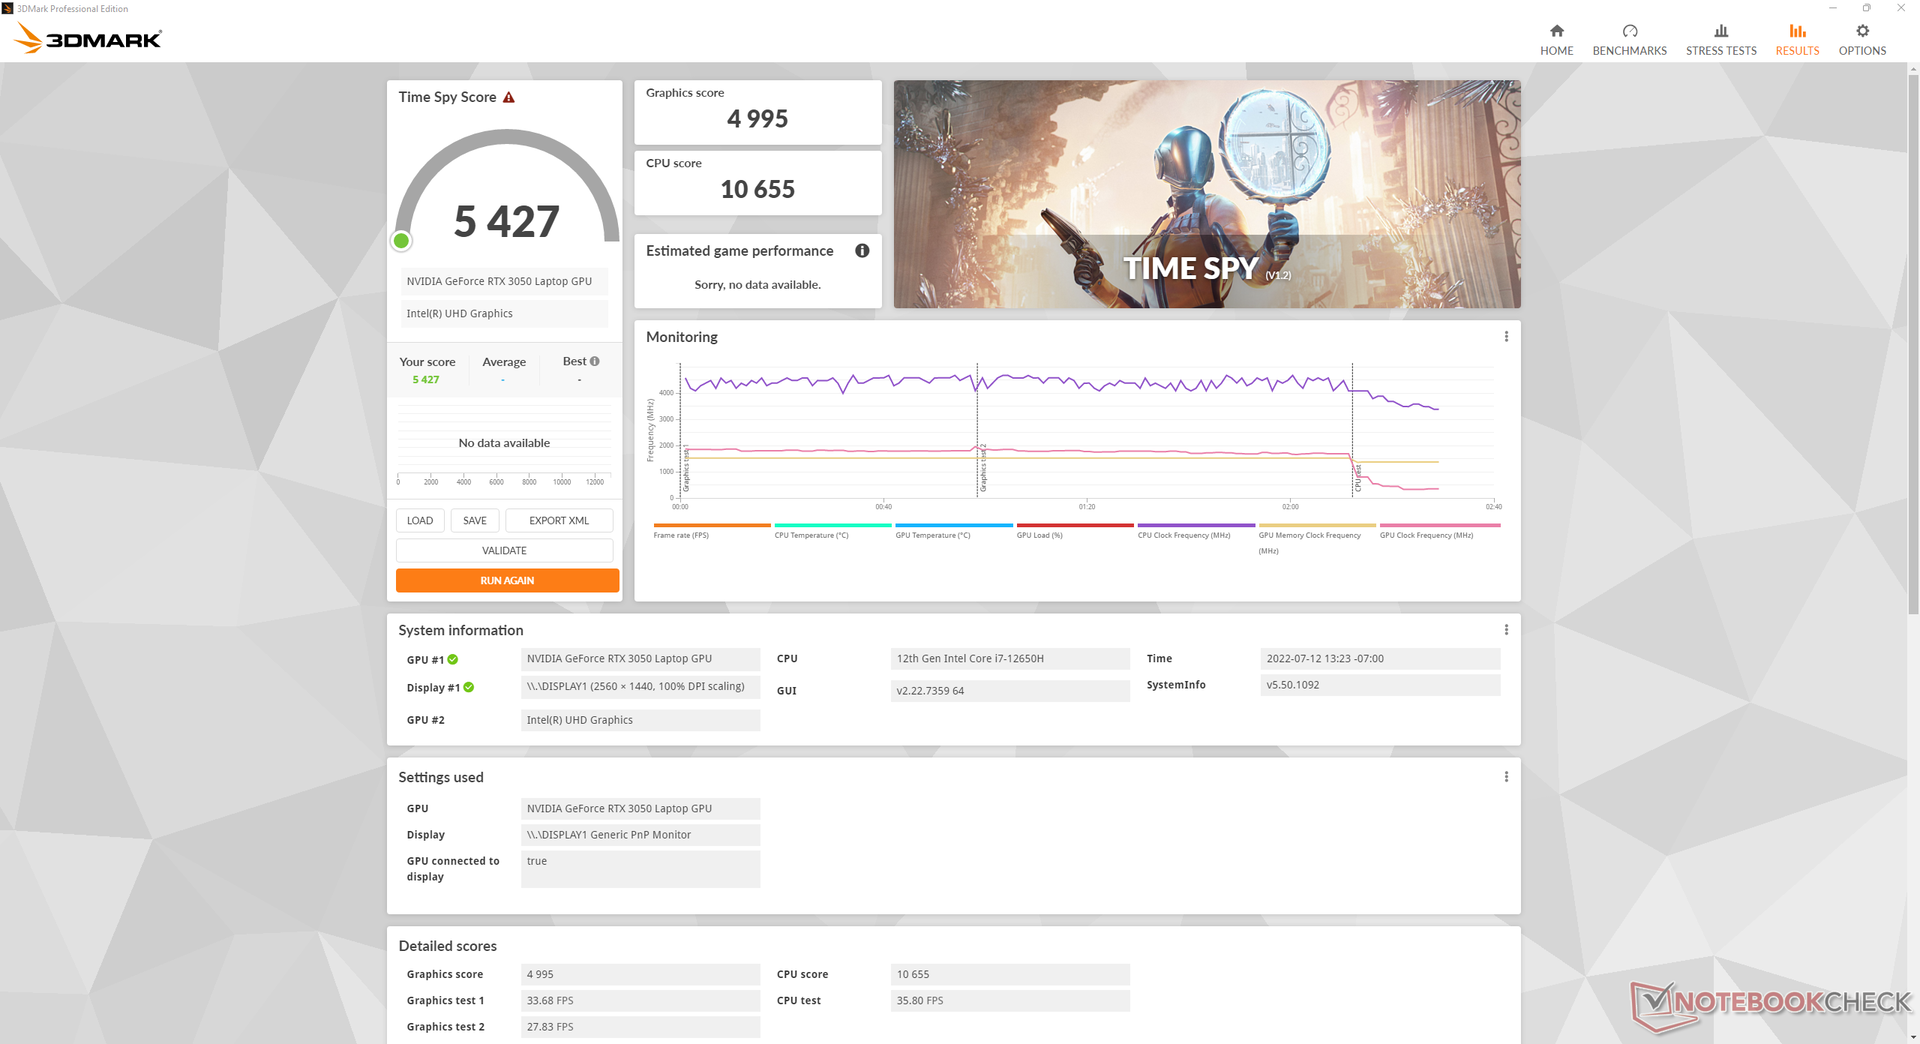
| 3DMark Time Spy Score | 5427 poäng | |
Hjälp | ||
Witcher 3 FPS Chart
| låg | med. | hög | ultra | |
|---|---|---|---|---|
| GTA V (2015) | 184 | 179 | 148.2 | 70.9 |
| The Witcher 3 (2015) | 282.1 | 171.6 | 98.7 | 51.9 |
| Dota 2 Reborn (2015) | 176.5 | 163.2 | 156.3 | 147.7 |
| Final Fantasy XV Benchmark (2018) | 143.4 | 74 | 51 | |
| X-Plane 11.11 (2018) | 148.1 | 129.9 | 103.1 | |
| Strange Brigade (2018) | 320 | 135.8 | 108.1 | 90.8 |
| Cyberpunk 2077 1.6 (2022) | 77.9 | 62.1 | 44 | 36.1 |
Utsläpp
Systembrus - Över 50 dB(A) vid spelning
Fläktljudet beror i hög grad på inställningarna för Armoury Crate power profile: Windows, Silent, Balanced, Turbo och Manual. Vi rekommenderar starkt Silent-läget om du bara surfar på webben eller streamar eftersom de interna fläktarna annars kan vara ganska högljudda. Om man till exempel ställer in läget Balanced skulle fläkten ofta pulsera till 32 dB(A) mot en tyst bakgrund på 24 dB(A) bara från webbsurfning
Fläktljudet stabiliseras på 48,7 dB(A) och 53,4 dB(A) vid spel i balanserat läge respektive turboläge. Vårt avsnitt om stresstest nedan visar att högre TDP och TGP endast är tillgängliga i Turbo-läget, vilket innebär att användarna måste uthärda de högre fläktarna om de vill få ut den bärbara datorns fulla prestanda. 50+ dB(A) är högre än på de flesta andra bärbara speldatorer, inklusive Dell G15 5510 eller Lenovo Ideapad Gaming 3 15, båda med samma RTX 3050 GPU.
Ljudnivå
| Låg belastning |
| 24 / 24 / 32.3 dB(A) |
| Hög belastning |
| 43.7 / 53.6 dB(A) |
 | ||
30 dB tyst 40 dB(A) hörbar 50 dB(A) högt ljud |
||
min: | ||
| Asus TUF Dash F15 FX517ZC GeForce RTX 3050 4GB Laptop GPU, i7-12650H, Intel SSD 670p SSDPEKNU512GZ | Asus TUF Dash F15 FX517ZR GeForce RTX 3070 Laptop GPU, i7-12650H, Samsung PM991a MZVLQ1T0HBLB | Dell G15 5510 GeForce RTX 3050 4GB Laptop GPU, i5-10500H, SK Hynix BC711 HFM512GD3HX015N | MSI Bravo 15 B5DD-010US Radeon RX 5500M, R5 5600H, Kingston OM8PCP3512F-AB | Lenovo Ideapad Gaming 3 15IHU-82K1002RGE GeForce RTX 3050 Ti Laptop GPU, i5-11300H, Micron 2210 MTFDHBA512QFD | Gigabyte G5 GD GeForce RTX 3050 4GB Laptop GPU, i5-11400H, ESR512GTLG-E6GBTNB4 | |
|---|---|---|---|---|---|---|
| Noise | -6% | -1% | -2% | 4% | -9% | |
| av / miljö * (dB) | 23.9 | 26 -9% | 26 -9% | 24.5 -3% | 23.9 -0% | 24 -0% |
| Idle Minimum * (dB) | 24 | 26 -8% | 26 -8% | 24.5 -2% | 23.9 -0% | 29 -21% |
| Idle Average * (dB) | 24 | 32 -33% | 27 -13% | 32.8 -37% | 26.8 -12% | 30 -25% |
| Idle Maximum * (dB) | 32.3 | 33 -2% | 33 -2% | 32.8 -2% | 26.8 17% | 32 1% |
| Load Average * (dB) | 43.7 | 48 -10% | 45 -3% | 34.5 21% | 43.5 -0% | 53 -21% |
| Witcher 3 ultra * (dB) | 53.4 | 47 12% | 45 16% | 42.5 20% | 43.5 19% | 52 3% |
| Load Maximum * (dB) | 53.6 | 49 9% | 47 12% | 58.5 -9% | 53.1 1% | 54 -1% |
* ... mindre är bättre
Temperatur
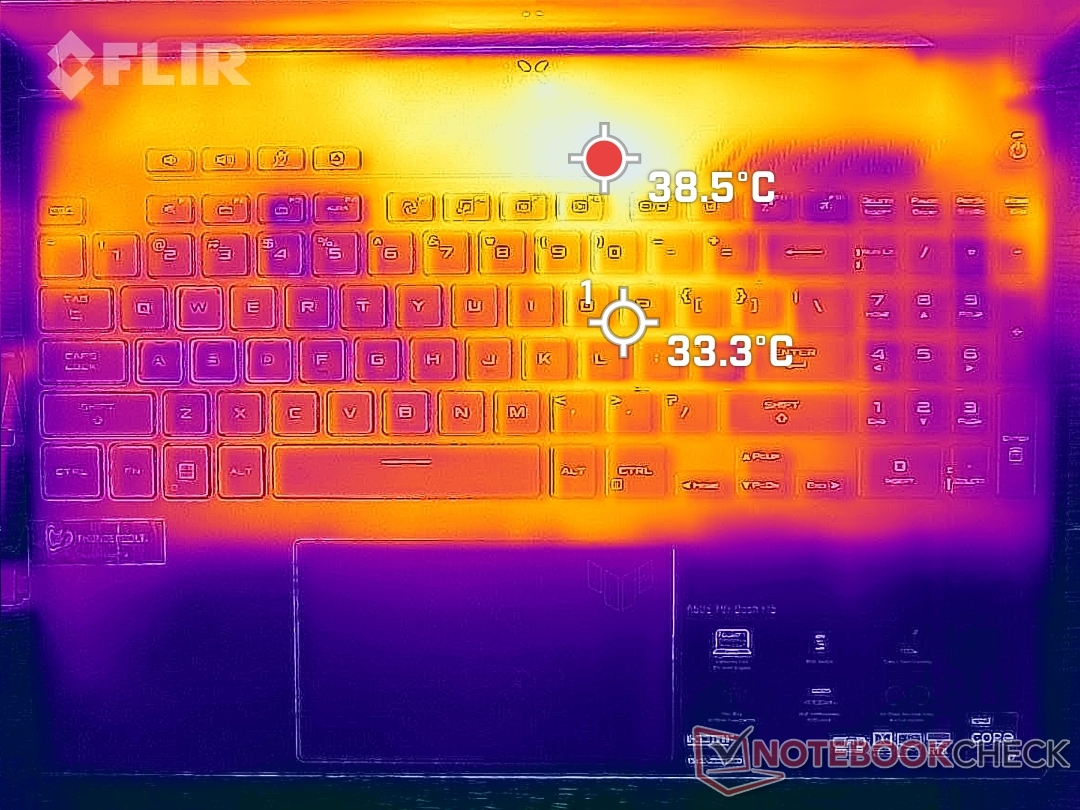
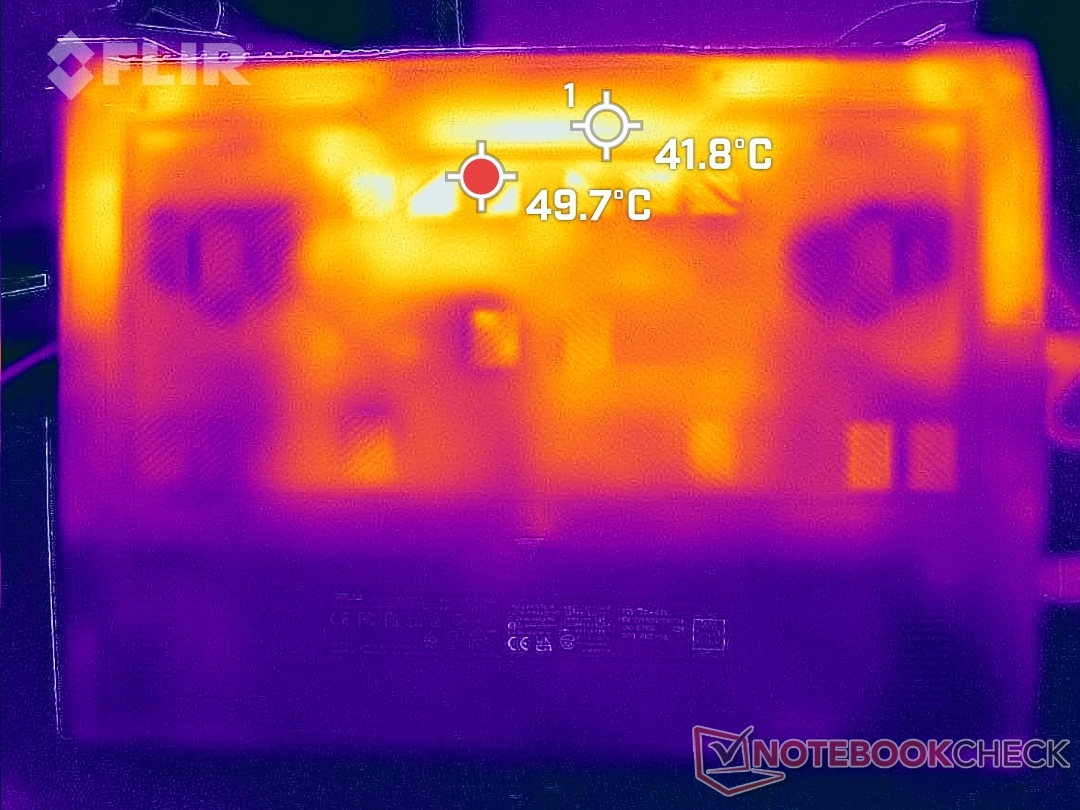
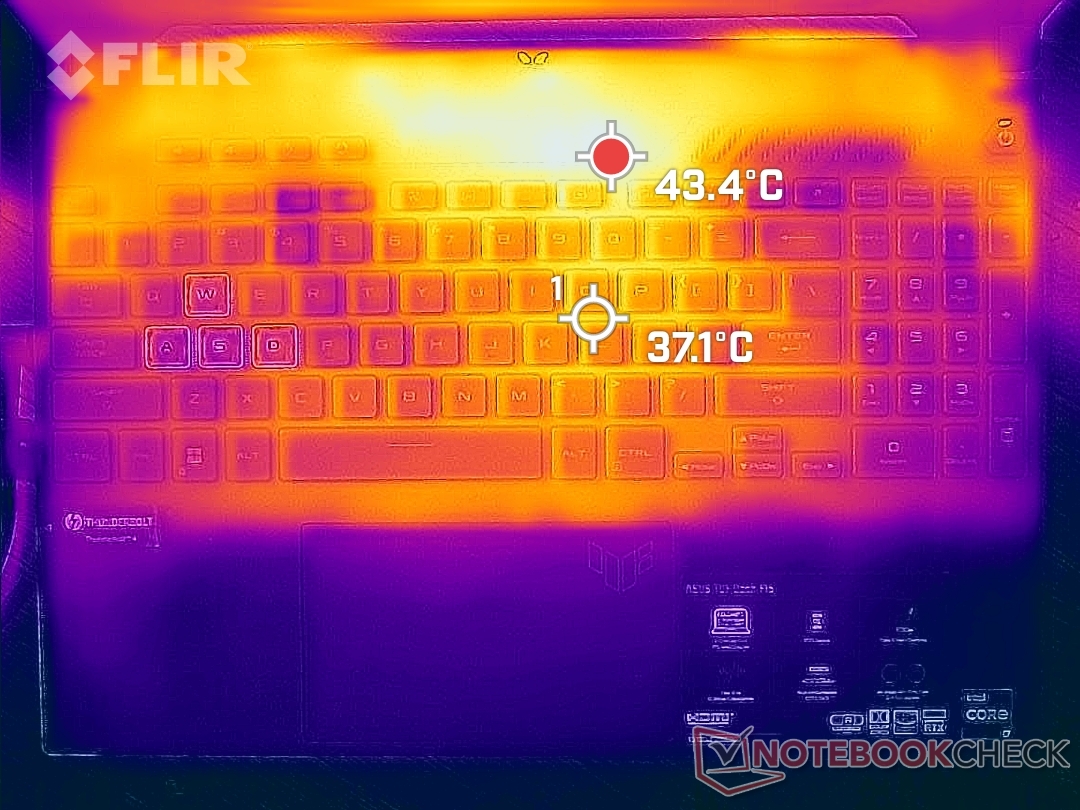
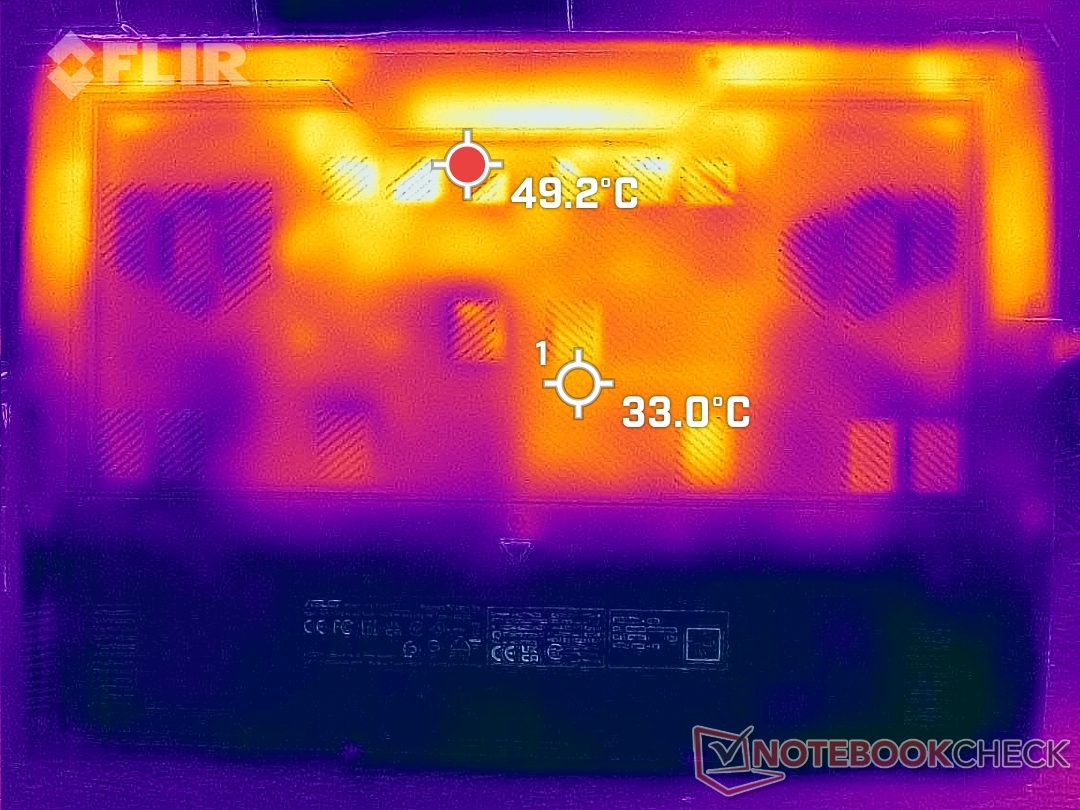
Yttemperaturen kan nå 33 till 37 C på tangentbordscentret när du spelar, vilket är svalare än vad vi observerade på Acer Swift X 16 utrustad med samma RTX 3050 GPU med mer än några grader. Den heta punkten på Asus kan nå 43 C eller högre, men det här området ligger tack och lov ovanför den första raden tangentbordstangenter, vilket framgår av temperaturkartorna nedan, där det är osannolikt att användarna rör vid dem när de spelar.
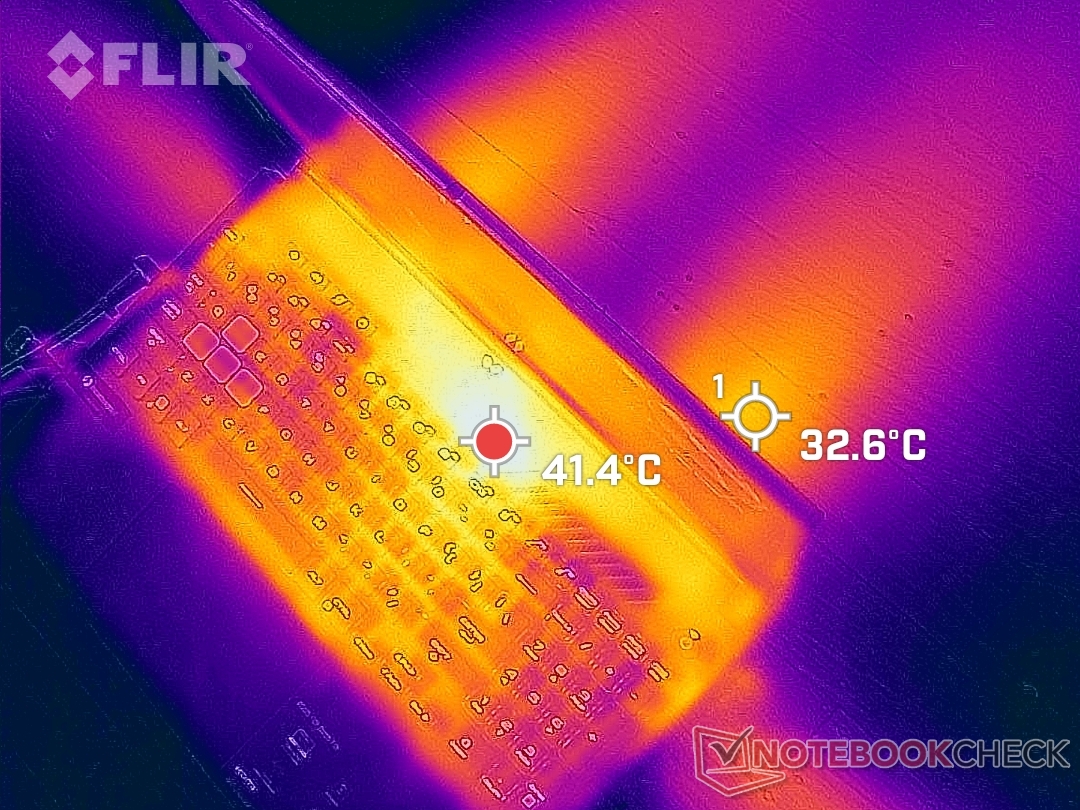
(±) Den maximala temperaturen på ovansidan är 43.4 °C / 110 F, jämfört med genomsnittet av 40.4 °C / 105 F , allt från 21.2 till 68.8 °C för klassen Gaming.
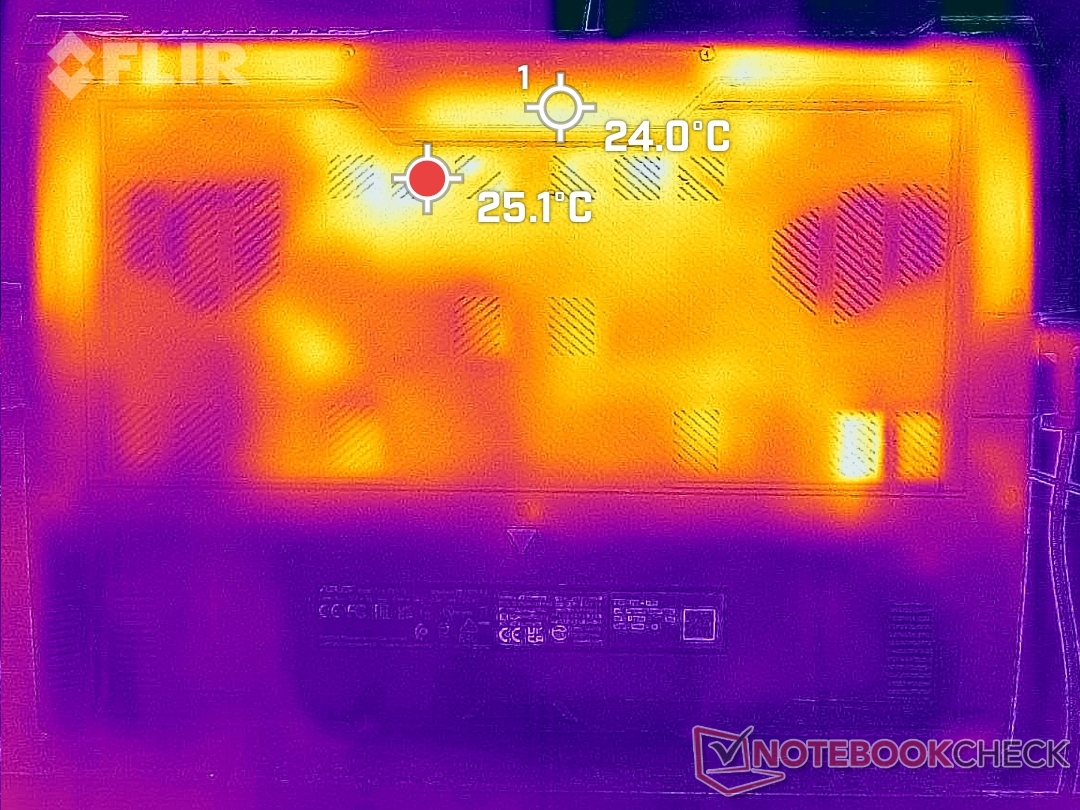
(±) Botten värms upp till maximalt 44.4 °C / 112 F, jämfört med genomsnittet av 43.2 °C / 110 F
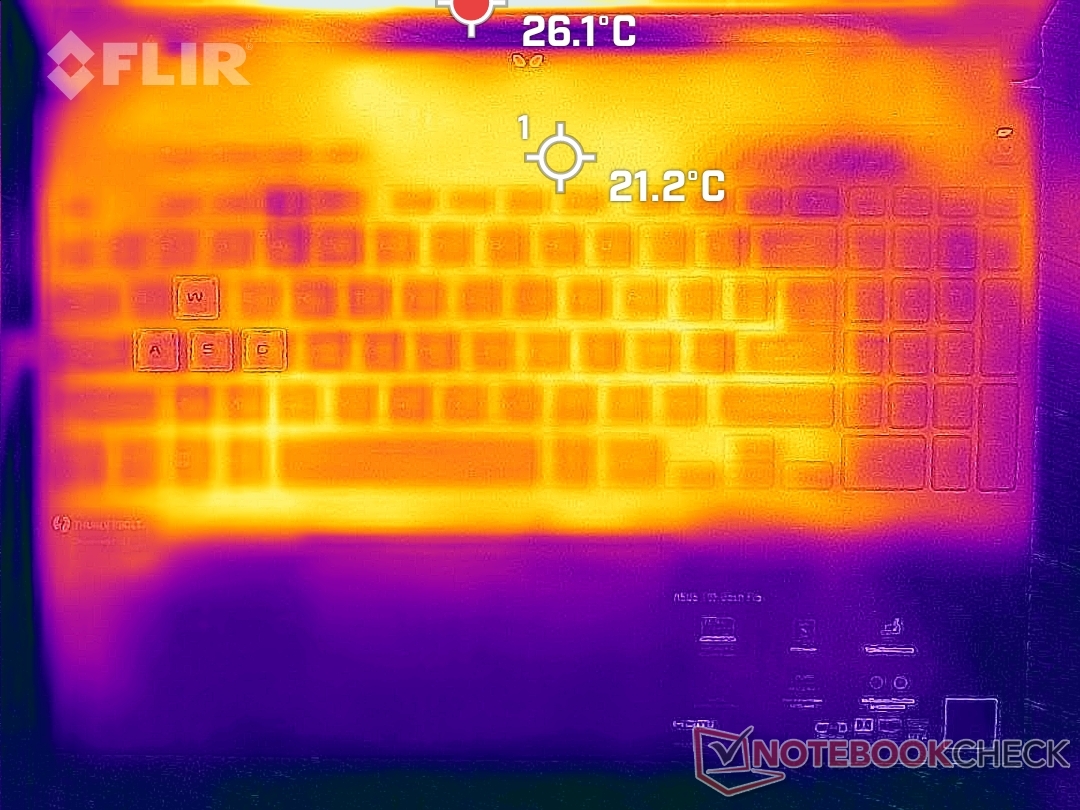
(+) Vid tomgångsbruk är medeltemperaturen för ovansidan 19.2 °C / 67 F, jämfört med enhetsgenomsnittet på 33.9 °C / ### class_avg_f### F.
(+) När du spelar The Witcher 3 är medeltemperaturen för ovansidan 26.3 °C / 79 F, jämfört med enhetsgenomsnittet på 33.9 °C / ## #class_avg_f### F.
(+) Handledsstöden och pekplattan är kallare än hudtemperaturen med maximalt 19.4 °C / 66.9 F och är därför svala att ta på.
(+) Medeltemperaturen för handledsstödsområdet på liknande enheter var 28.8 °C / 83.8 F (+9.4 °C / 16.9 F).
| Asus TUF Dash F15 FX517ZC Intel Core i7-12650H, NVIDIA GeForce RTX 3050 4GB Laptop GPU | Asus TUF Dash F15 FX517ZR Intel Core i7-12650H, NVIDIA GeForce RTX 3070 Laptop GPU | Dell G15 5510 Intel Core i5-10500H, NVIDIA GeForce RTX 3050 4GB Laptop GPU | MSI Bravo 15 B5DD-010US AMD Ryzen 5 5600H, AMD Radeon RX 5500M | Lenovo Ideapad Gaming 3 15IHU-82K1002RGE Intel Core i5-11300H, NVIDIA GeForce RTX 3050 Ti Laptop GPU | Gigabyte G5 GD Intel Core i5-11400H, NVIDIA GeForce RTX 3050 4GB Laptop GPU | |
|---|---|---|---|---|---|---|
| Heat | -36% | -15% | -32% | -10% | -20% | |
| Maximum Upper Side * (°C) | 43.4 | 52 -20% | 52 -20% | 52.2 -20% | 43.2 -0% | 45 -4% |
| Maximum Bottom * (°C) | 44.4 | 52 -17% | 49 -10% | 48.6 -9% | 47.9 -8% | 50 -13% |
| Idle Upper Side * (°C) | 21.2 | 33 -56% | 26 -23% | 38 -79% | 24.9 -17% | 28 -32% |
| Idle Bottom * (°C) | 24 | 36 -50% | 26 -8% | 28.4 -18% | 27 -13% | 31 -29% |
* ... mindre är bättre
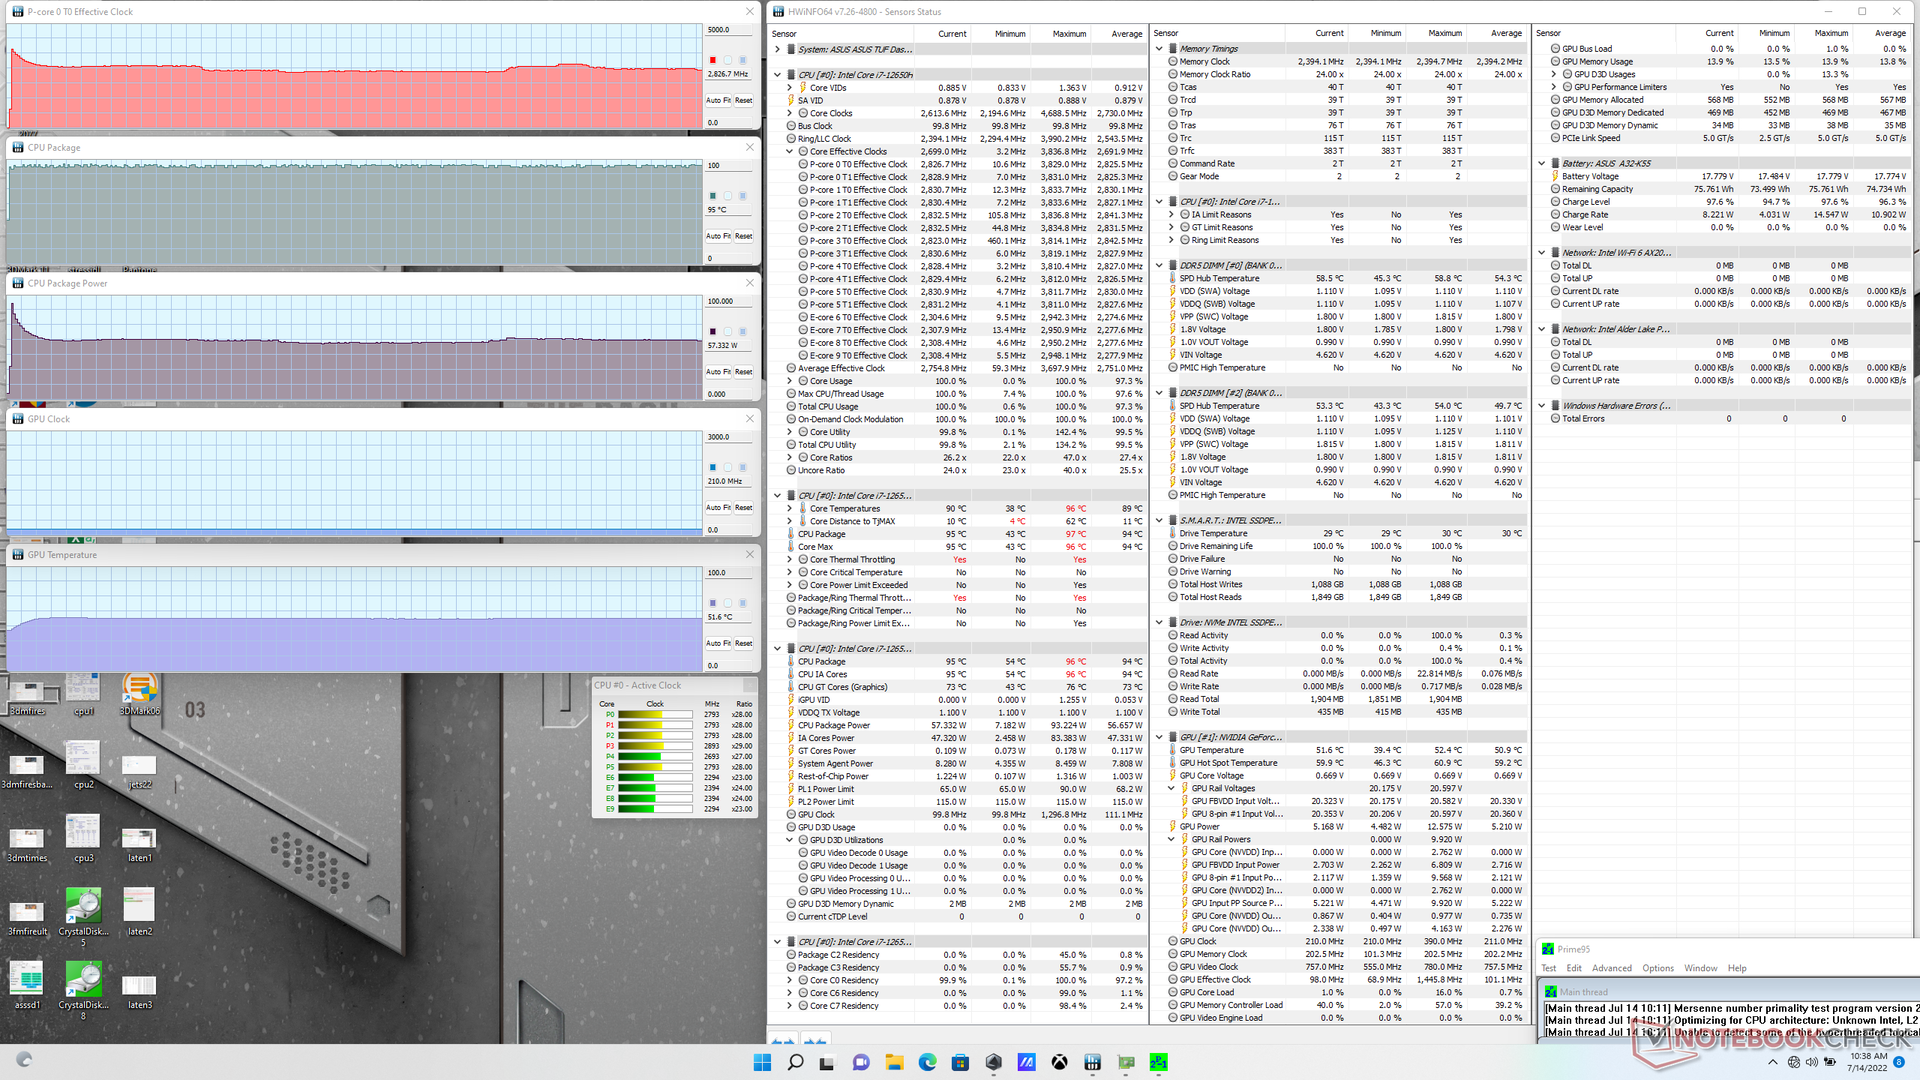
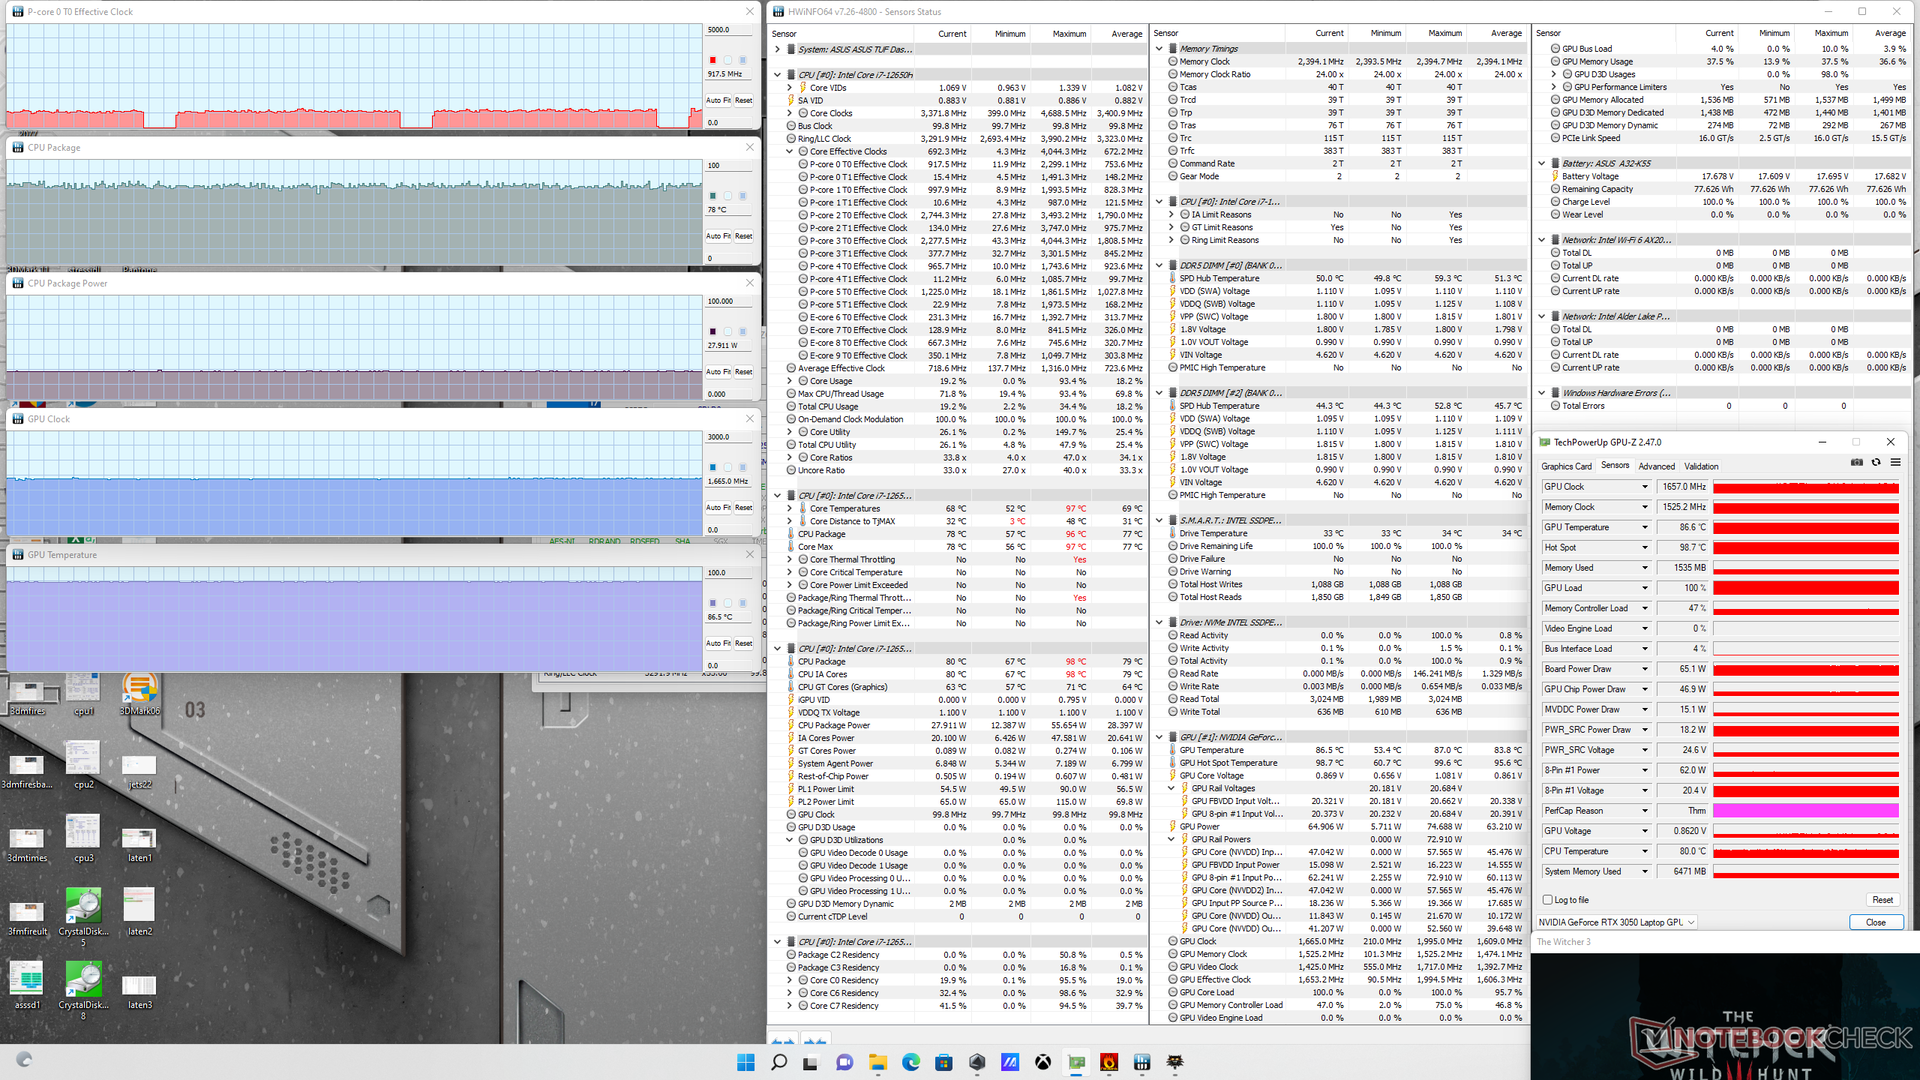
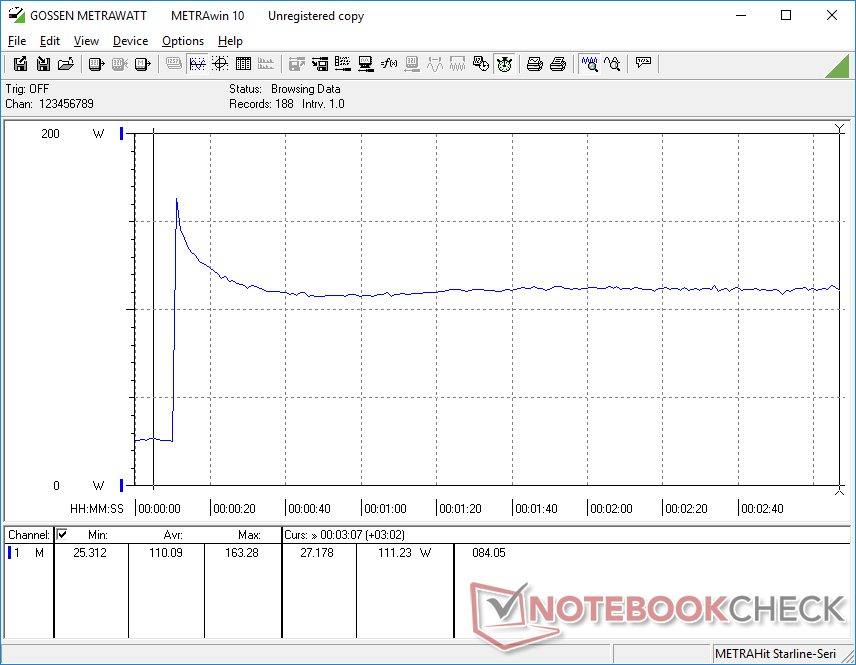
Stresstest
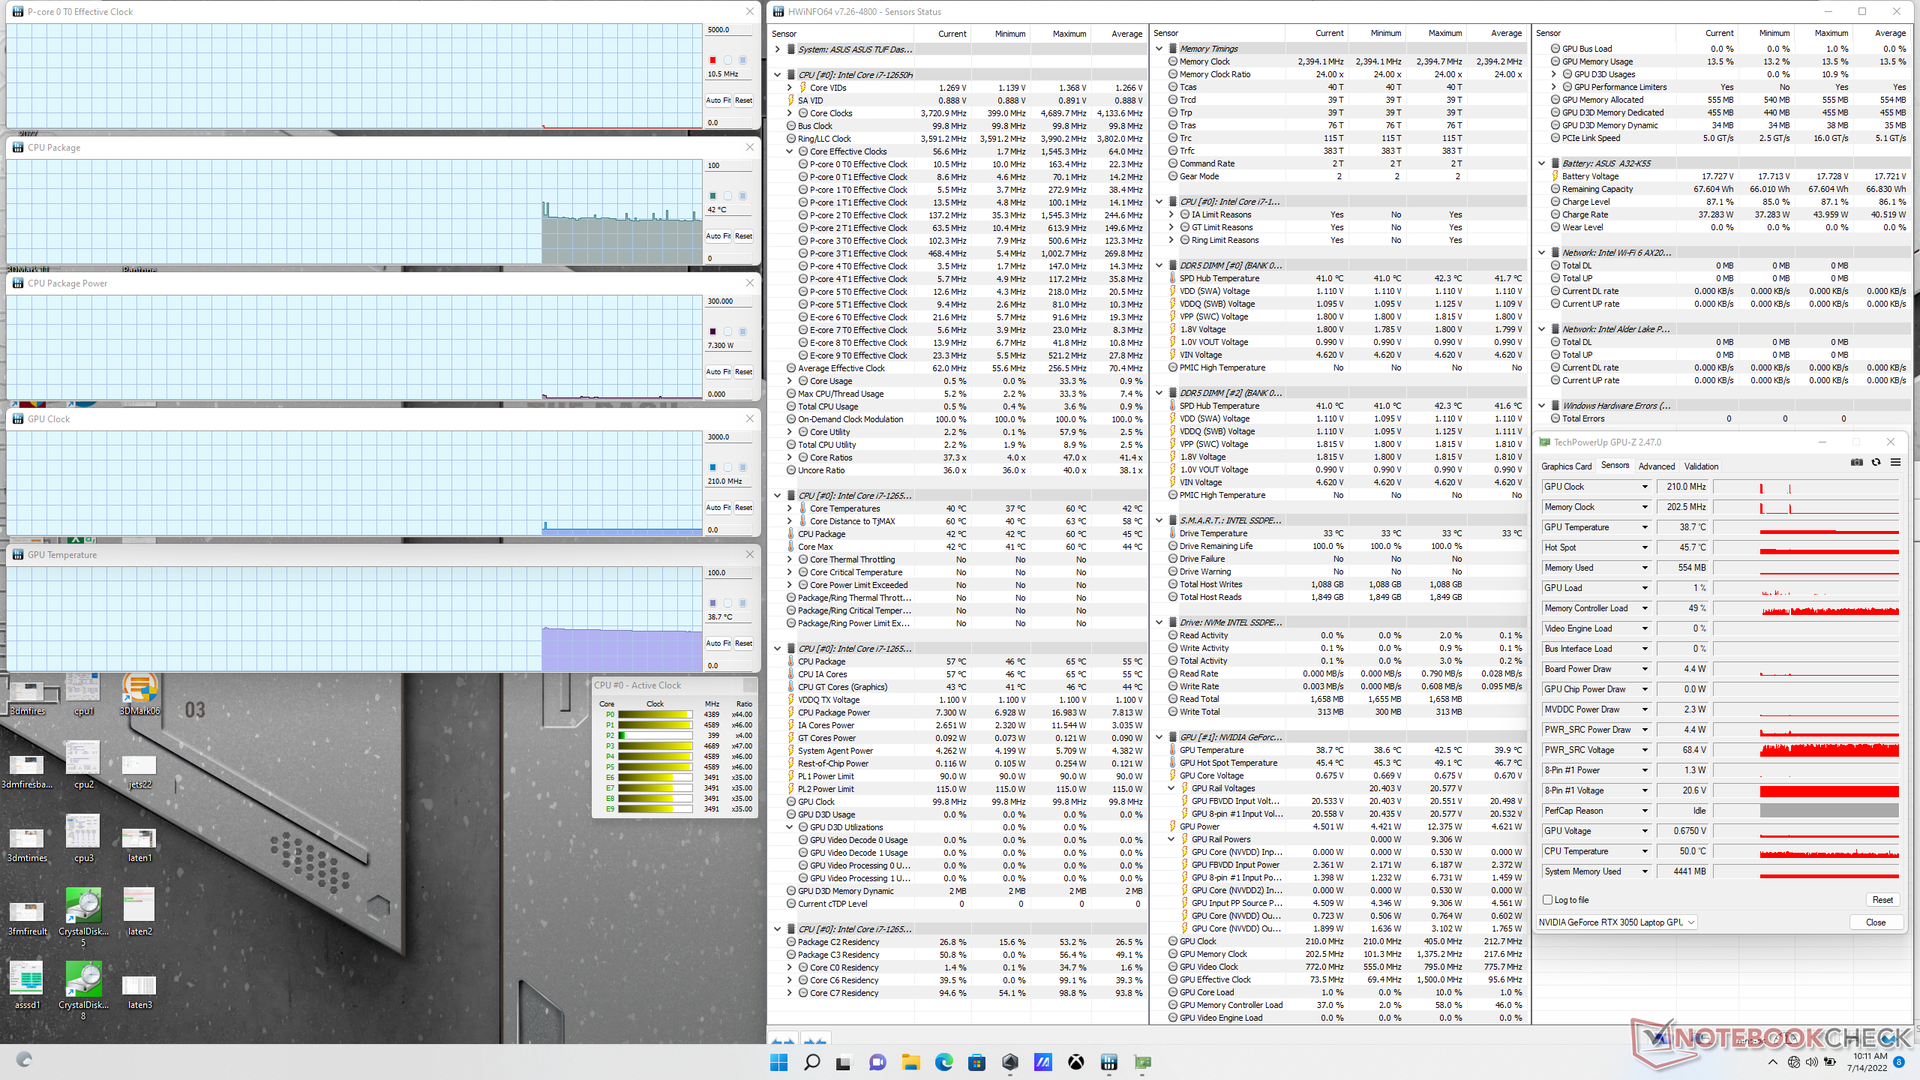
CPU-klockfrekvenserna, kärntemperaturen och paketets strömförbrukning steg till 3,7 GHz, 95 C respektive 93 W när Prime95-stressen inleddes. Klockfrekvenserna började dock omedelbart sjunka innan de slutligen stabiliserades vid 2,9 GHz och en effektuttag på 57 W för att förhindra att kärnans temperatur skulle stiga ytterligare. Det är tydligt att kylningslösningen är en begränsande faktor för högre CPU-prestanda.
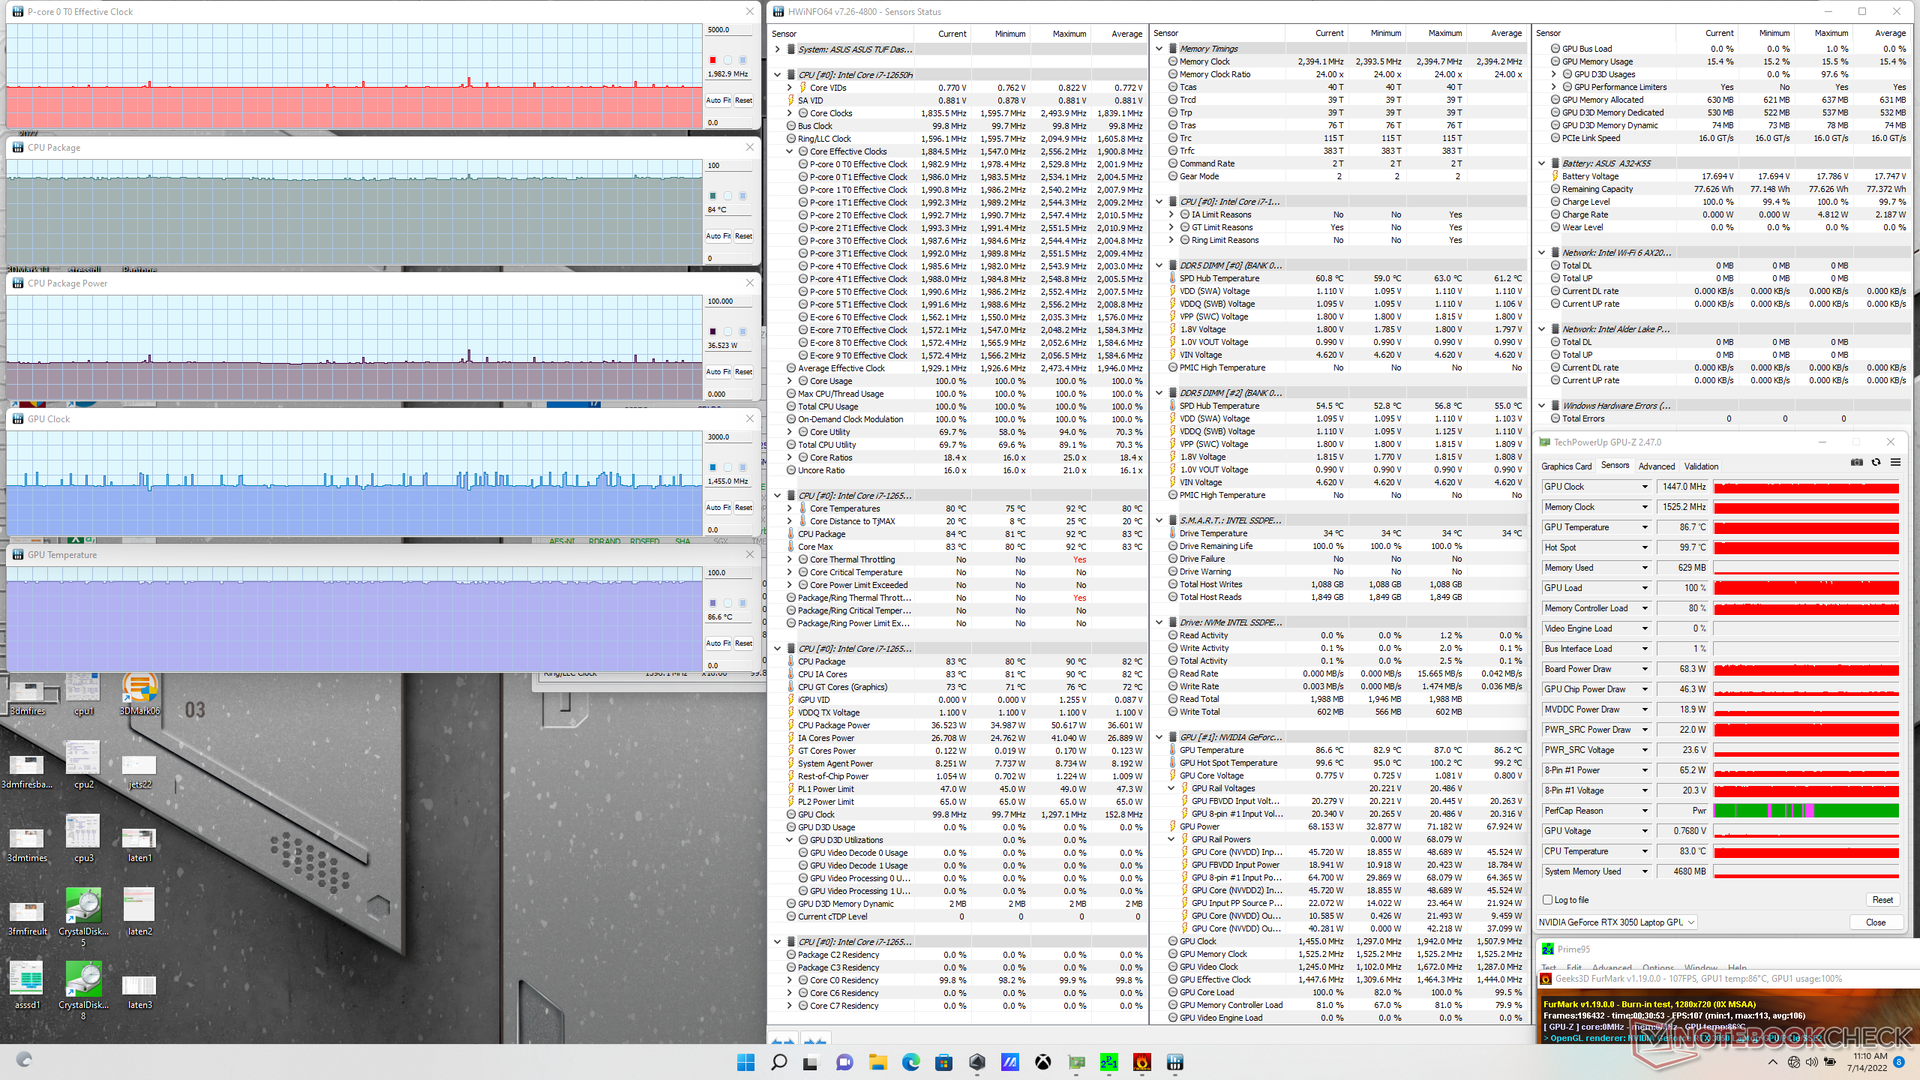
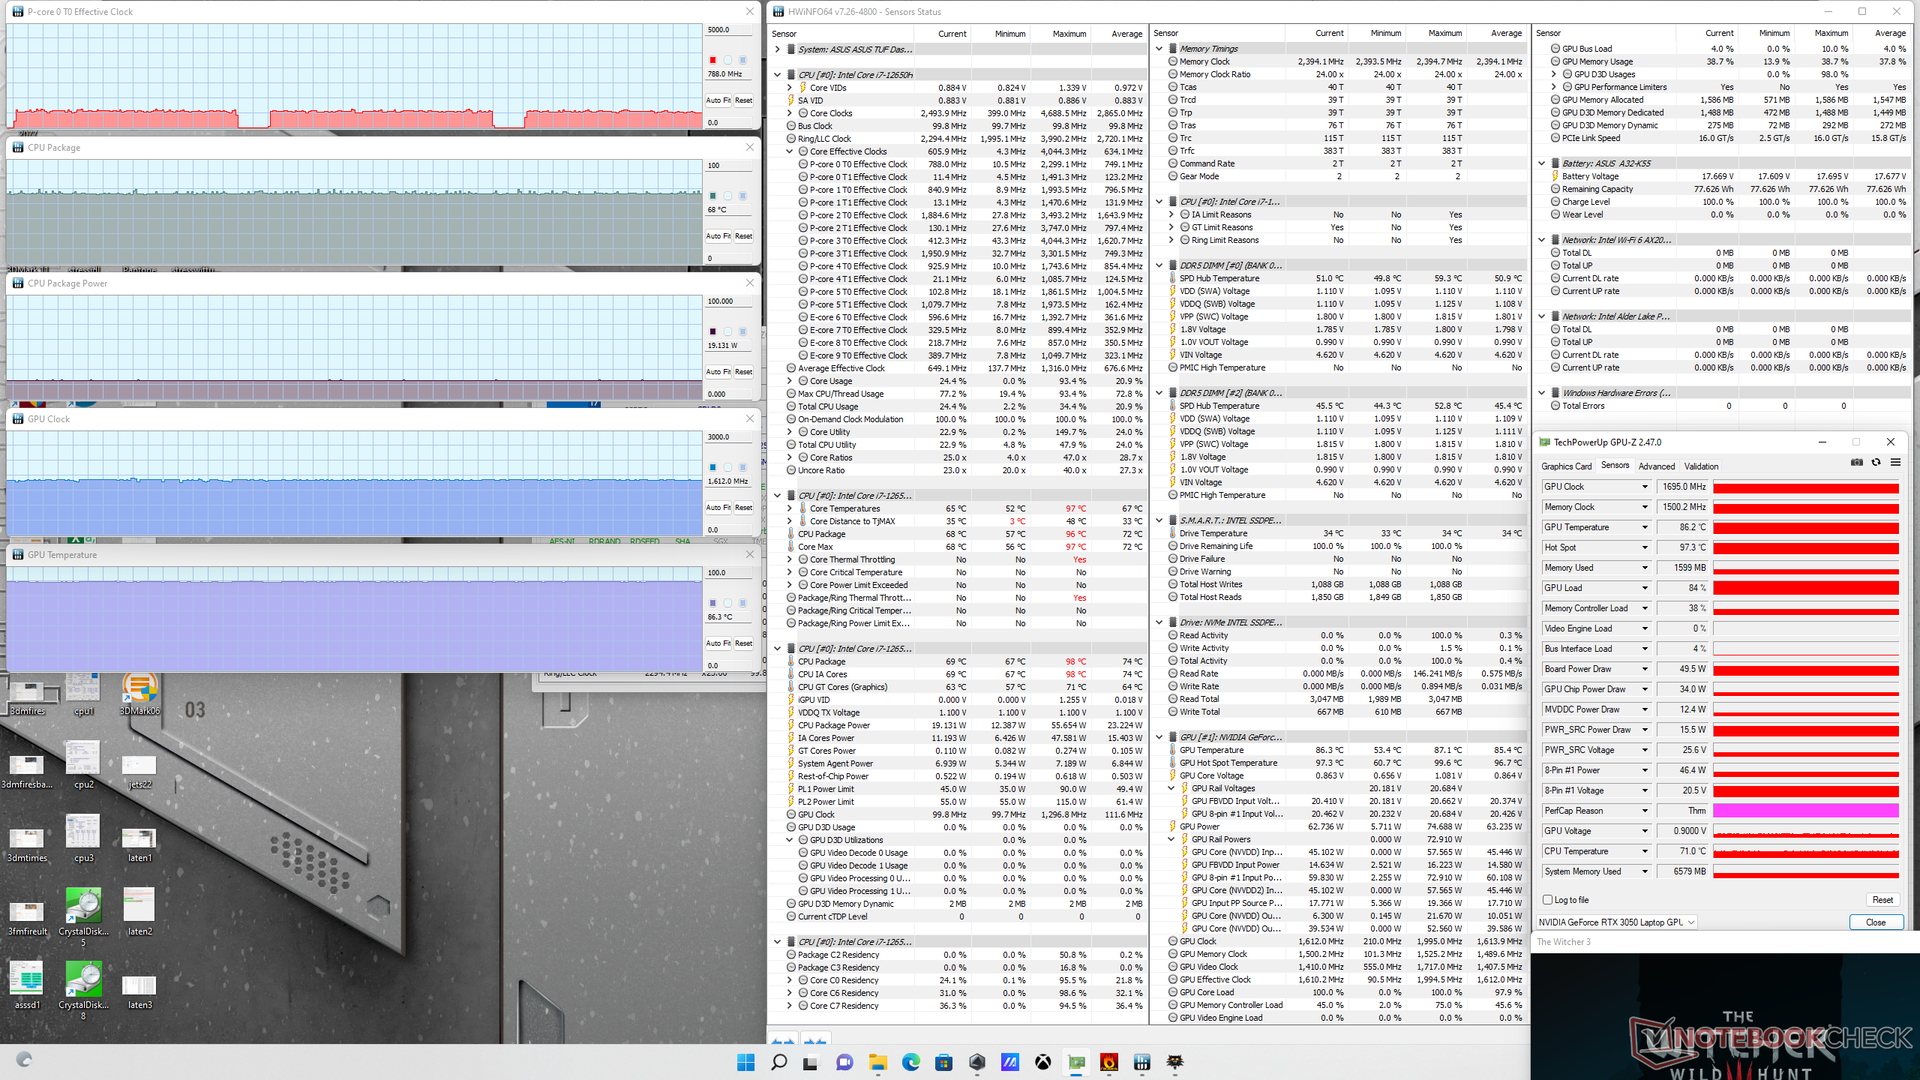
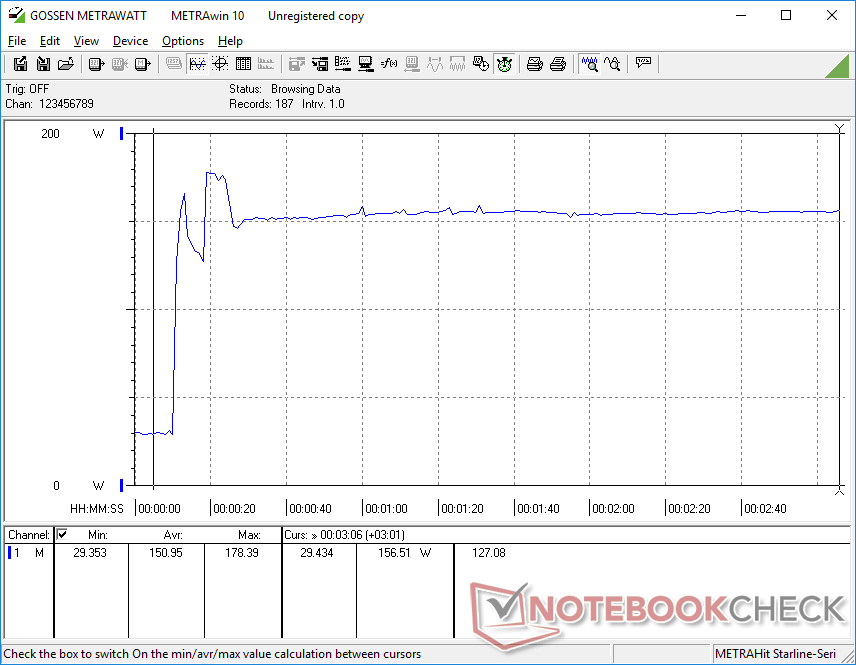
GPU-klockan, minnesklockan och kärntemperaturen skulle stabiliseras vid 1612 MHz, 1500 MHz respektive 86 C när vi körde Witcher 3 på den balanserade strömprofilen. GPU-klockan och minnesklockan skulle öka bara något om man körde i Turbo-läge, men GPU-temperaturen skulle förbli densamma eftersom fläktljudet är högre i Turbo-läge som nämnts ovan för att kompensera för de högre klockorna. Observera att både GPU- och CPU-paketets strömförbrukning skulle öka från 50 W till 65 W respektive 19 W till 28 W om man körde Witcher 3 i turboläge.
GPU-temperaturen när man spelar är lika varm som på FX517ZR trots att vår GPU är mycket långsammare.
| CPU-klocka (GHz) | GPU-klocka (MHz) | Genomsnittlig CPU-temperatur (°C) | Genomsnittlig GPU-temperatur (°C) | |
| System Idle | -- | -- | 42 | 39 |
| Prime95 Stress | ~2.9 | -- | 95 | 52 |
| Prime95 + FurMark Stress | 2.0 | 1455 | 84 | 87 |
| Witcher 3 Stress (balanserat läge) | ~0,8 | 1612 | 68 | 86 |
| Witcher 3 Stress (Turbo-läge) | ~0,9 | 1665 | 78 | 86 |
Högtalare
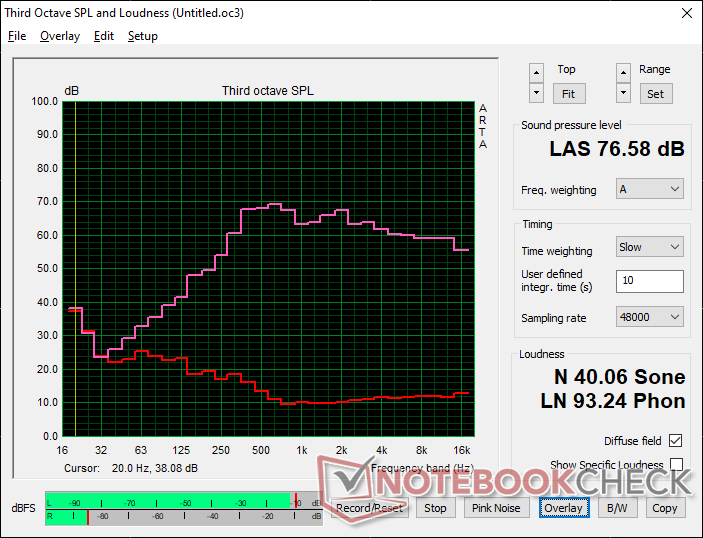
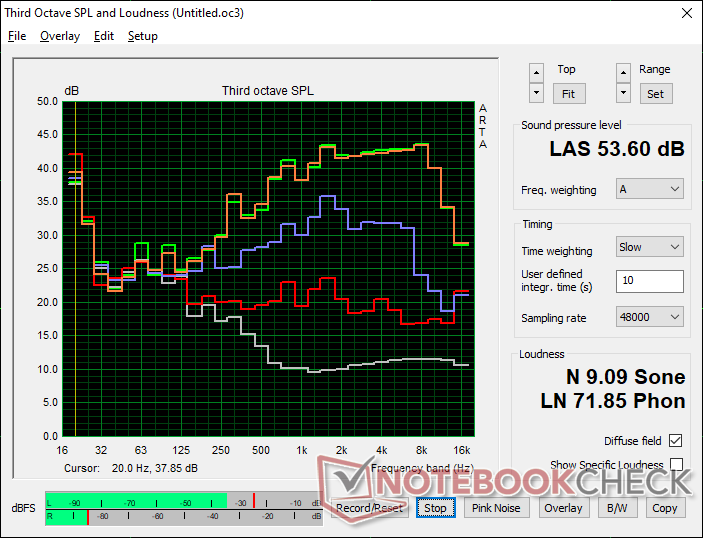
Asus TUF Dash F15 FX517ZC ljudanalys
(±) | högtalarljudstyrkan är genomsnittlig men bra (76.6 dB)
Bas 100 - 315 Hz
(±) | reducerad bas - i genomsnitt 11.8% lägre än medianen
(±) | linjäriteten för basen är genomsnittlig (8.6% delta till föregående frekvens)
Mellan 400 - 2000 Hz
(±) | högre mellan - i genomsnitt 6.1% högre än median
(+) | mids är linjära (4.9% delta till föregående frekvens)
Högsta 2 - 16 kHz
(+) | balanserade toppar - endast 1.6% från medianen
(+) | toppar är linjära (2.8% delta till föregående frekvens)
Totalt 100 - 16 000 Hz
(+) | det totala ljudet är linjärt (14.2% skillnad mot median)
Jämfört med samma klass
» 25% av alla testade enheter i den här klassen var bättre, 7% liknande, 68% sämre
» Den bästa hade ett delta på 6%, genomsnittet var 18%, sämst var 132%
Jämfört med alla testade enheter
» 17% av alla testade enheter var bättre, 4% liknande, 79% sämre
» Den bästa hade ett delta på 4%, genomsnittet var 23%, sämst var 134%
Apple MacBook Pro 16 2021 M1 Pro ljudanalys
(+) | högtalare kan spela relativt högt (84.7 dB)
Bas 100 - 315 Hz
(+) | bra bas - bara 3.8% från medianen
(+) | basen är linjär (5.2% delta till föregående frekvens)
Mellan 400 - 2000 Hz
(+) | balanserad mellan - endast 1.3% från medianen
(+) | mids är linjära (2.1% delta till föregående frekvens)
Högsta 2 - 16 kHz
(+) | balanserade toppar - endast 1.9% från medianen
(+) | toppar är linjära (2.7% delta till föregående frekvens)
Totalt 100 - 16 000 Hz
(+) | det totala ljudet är linjärt (4.6% skillnad mot median)
Jämfört med samma klass
» 0% av alla testade enheter i den här klassen var bättre, 0% liknande, 100% sämre
» Den bästa hade ett delta på 5%, genomsnittet var 17%, sämst var 45%
Jämfört med alla testade enheter
» 0% av alla testade enheter var bättre, 0% liknande, 100% sämre
» Den bästa hade ett delta på 4%, genomsnittet var 23%, sämst var 134%
Energihantering - Fortfarande strömhungrig
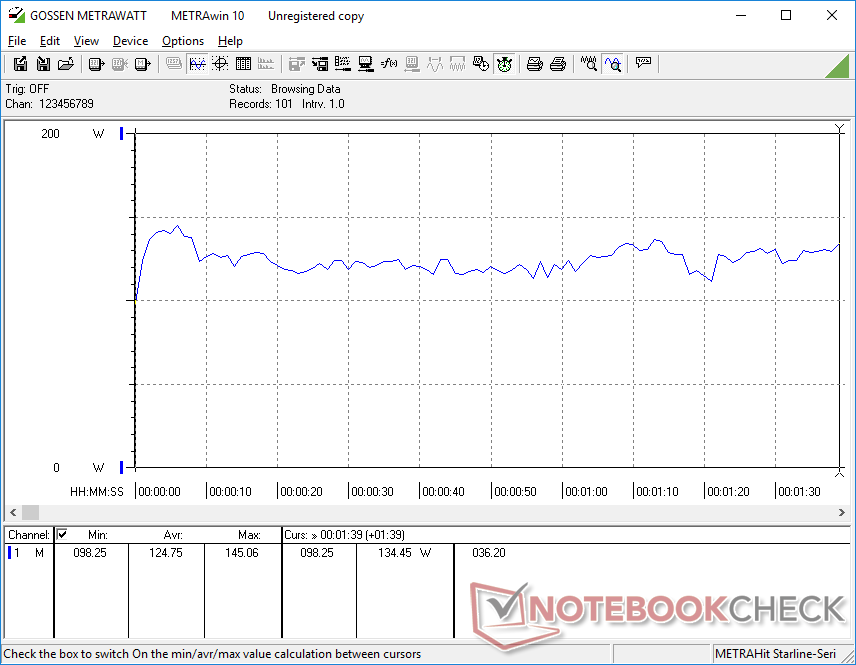
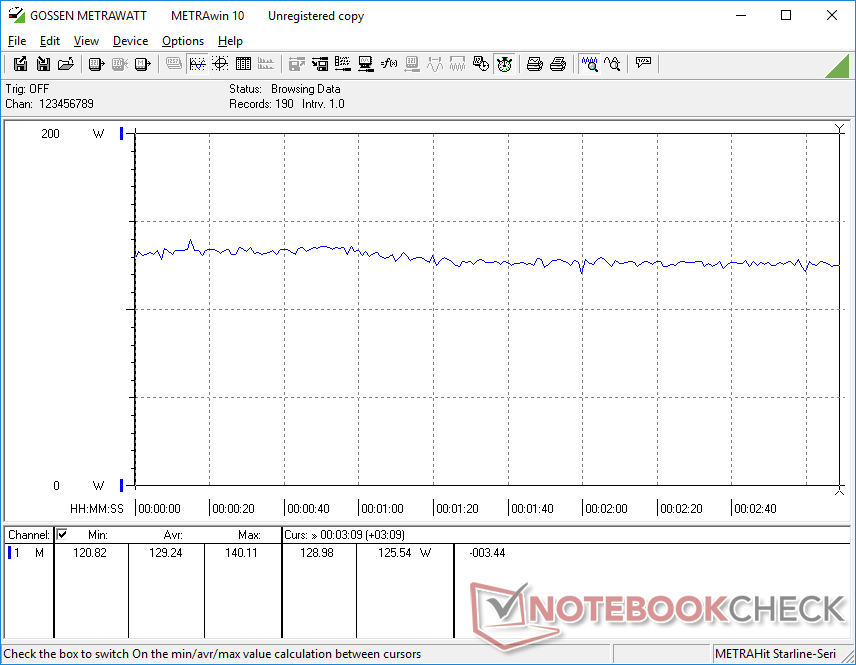
Effektförbrukning
Om RTX 3050 är 40 procent långsammare än RTX 3070, betyder det att vi kan förvänta oss att strömförbrukningen också är 40 procent lägre? Tyvärr skulle vår FX517ZC kräva bara 7 procent mindre än FX517ZR när vi körde samma spel med samma grafiska inställningar
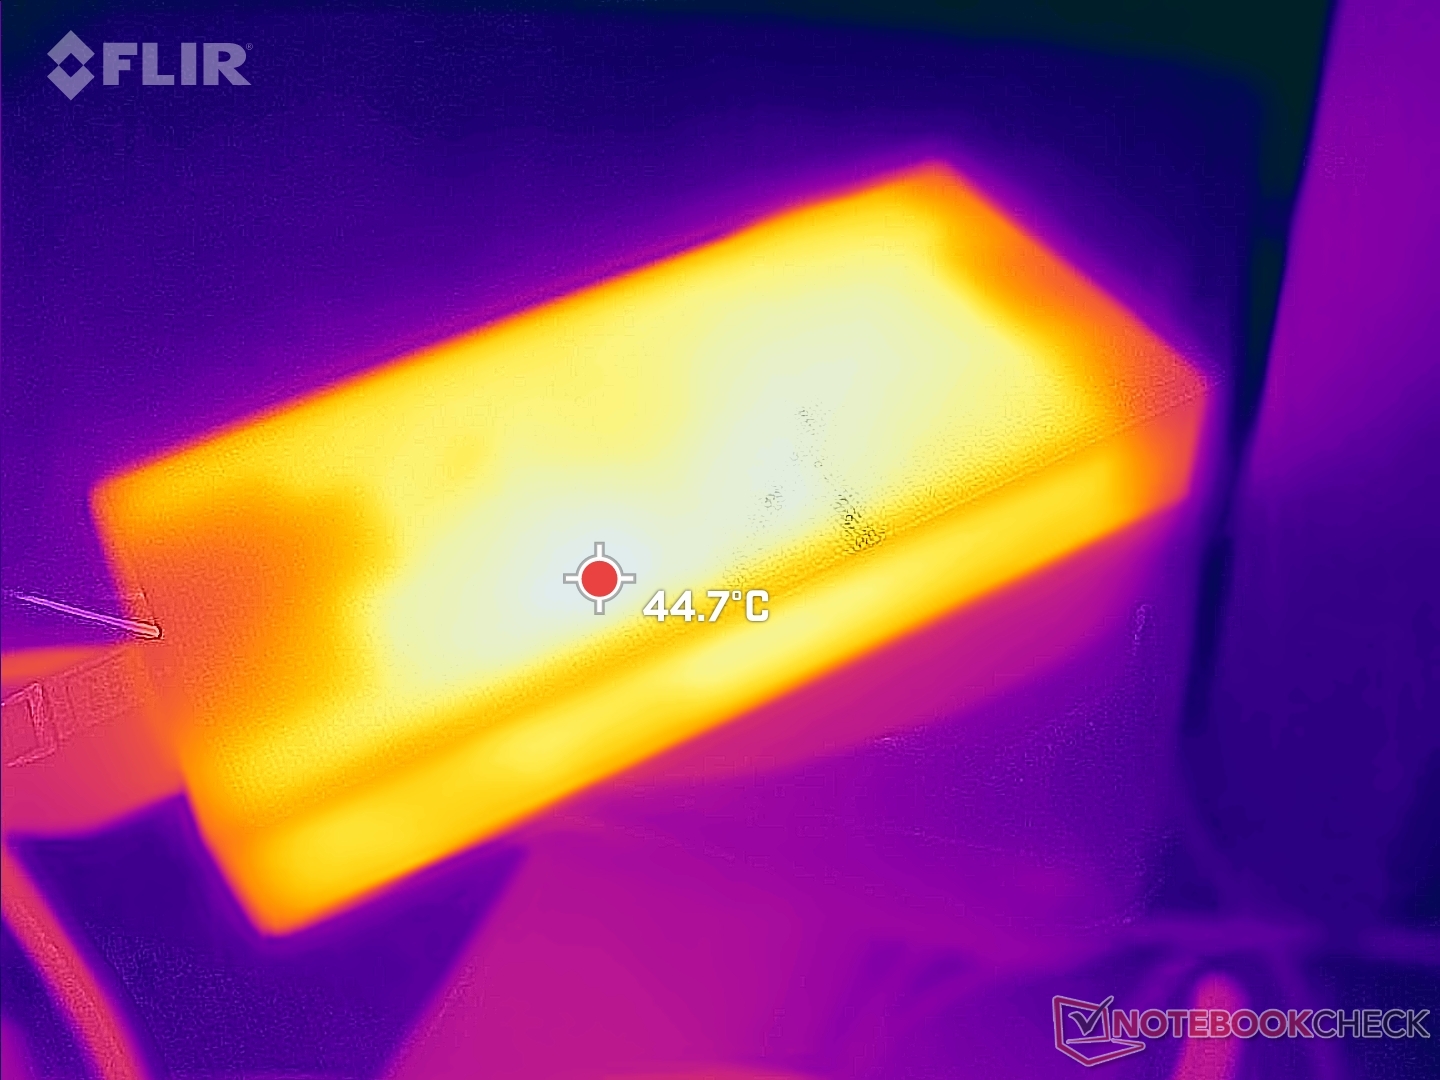
Observera att FX517ZC levereras med en 180 W AC-adapter (~15 x 7,2 x 2,3 cm) medan FX517ZR levereras med en något större 200 W-adapter.
| Av/Standby | |
| Låg belastning | |
| Hög belastning |
|
Förklaring:
min: | |
| Asus TUF Dash F15 FX517ZC i7-12650H, GeForce RTX 3050 4GB Laptop GPU, Intel SSD 670p SSDPEKNU512GZ, IPS, 2560x1440, 15.6" | Asus TUF Dash F15 FX517ZR i7-12650H, GeForce RTX 3070 Laptop GPU, Samsung PM991a MZVLQ1T0HBLB, IPS, 2560x1440, 15.6" | Dell G15 5510 i5-10500H, GeForce RTX 3050 4GB Laptop GPU, SK Hynix BC711 HFM512GD3HX015N, IPS, 1920x1080, 15.6" | MSI Bravo 15 B5DD-010US R5 5600H, Radeon RX 5500M, Kingston OM8PCP3512F-AB, IPS, 1920x1080, 15.6" | Lenovo Ideapad Gaming 3 15IHU-82K1002RGE i5-11300H, GeForce RTX 3050 Ti Laptop GPU, Micron 2210 MTFDHBA512QFD, IPS, 1920x1080, 15.6" | Gigabyte G5 GD i5-11400H, GeForce RTX 3050 4GB Laptop GPU, ESR512GTLG-E6GBTNB4, IPS, 1920x1080, 15.6" | |
|---|---|---|---|---|---|---|
| Power Consumption | 4% | 28% | 33% | 35% | 6% | |
| Idle Minimum * (Watt) | 9.2 | 10 -9% | 3 67% | 6.6 28% | 4.9 47% | 13 -41% |
| Idle Average * (Watt) | 15.9 | 14 12% | 8 50% | 9.8 38% | 8.3 48% | 15 6% |
| Idle Maximum * (Watt) | 29.5 | 20 32% | 13 56% | 10.8 63% | 8.9 70% | 20 32% |
| Load Average * (Watt) | 124.8 | 122 2% | 103 17% | 70.5 44% | 81 35% | 102 18% |
| Witcher 3 ultra * (Watt) | 129.2 | 138.6 -7% | 139.5 -8% | 103.2 20% | 119 8% | 124 4% |
| Load Maximum * (Watt) | 178.4 | 189 -6% | 204 -14% | 175 2% | 172 4% | 148 17% |
* ... mindre är bättre
Power Consumption Witcher 3 / Stresstest
Power Consumption external Monitor
Batteritid - inte så lång
Batteritiden är kortare än förväntat, men vi tror att det är en bugg. När vi ställer in den balanserade strömprofilen med den integrerade GPU:n aktiv via MSHybrid kan vi bara registrera en drifttid på bara 4 timmar jämfört med 7 timmar på FX517ZR. Resultaten skulle inte förbättras ens efter att vi upprepade testet.
| Asus TUF Dash F15 FX517ZC i7-12650H, GeForce RTX 3050 4GB Laptop GPU, 76 Wh | Asus TUF Dash F15 FX517ZR i7-12650H, GeForce RTX 3070 Laptop GPU, 76 Wh | Dell G15 5510 i5-10500H, GeForce RTX 3050 4GB Laptop GPU, 56 Wh | MSI Bravo 15 B5DD-010US R5 5600H, Radeon RX 5500M, 53 Wh | Lenovo Ideapad Gaming 3 15IHU-82K1002RGE i5-11300H, GeForce RTX 3050 Ti Laptop GPU, 45 Wh | Gigabyte G5 GD i5-11400H, GeForce RTX 3050 4GB Laptop GPU, 41 Wh | |
|---|---|---|---|---|---|---|
| Batteridrifttid | 75% | 50% | 58% | 65% | -22% | |
| WiFi v1.3 (h) | 4 | 7 75% | 6 50% | 6.3 58% | 6.6 65% | 3.1 -22% |
| Reader / Idle (h) | 10.8 | 11.3 | 9.2 | 5.7 | ||
| H.264 (h) | 5.8 | 7.7 | 3.6 | |||
| Load (h) | 2.3 | 1 | 1 | 1.1 | 1.1 |
För
Emot
Omdöme - Pris på ingångsnivå med en utmärkt skärm på avancerad nivå
Förutom den uppenbara prisbesparingen kan man föredra bärbara speldatorer på instegsnivå för att de har tystare fläktar, svalare temperaturer, längre batteritid och lägre strömförbrukning jämfört med kraftfullare alternativ i den högre prisklassen. Därför förväntade vi oss att Asus TUF Dash F15 FX517ZC och dess RTX 3050 skulle vara tystare, svalare, ha längre livslängd och vara mindre krävande än dess motsvarighet TUF Dash F15 FX517ZR RTX 3070. Verkligheten är att eventuella skillnader mellan FX517ZC och FX517ZR när det gäller temperatur, strömförbrukning och buller tyvärr är små i förhållande till den mycket stora skillnaden i GPU-prestanda mellan dem. Med andra ord, om du hoppades att FX517ZC skulle vara märkbart tystare, svalare och ha längre livslängd än sina högre konfigurationer, så kan du bli besviken.
Asus TUF Dash F15 FX517ZC har en bättre 1440p165 IPS-skärm än vad som förväntas för sin prisklass. Strömförbrukning, fläktljud och batteritid är dock inte bättre än på snabbare modeller i högre prisklass.
För en bärbar dator för spel på instegsnivå är FX517ZC dock fortfarande ganska bra eftersom den inte snålar med skärmen, RAM eller CPU som många andra bärbara datorer för spel tenderar att göra i 1000 dollar och under. 1440p-panelen erbjuder full P3-täckning, snabba svarstider, adaptiv synkronisering och 165 Hz vilket är en sällsynthet på ett budgetsystem. Den 12:e generationens Core i7-12650H CPU, även om den inte skiljer sig så mycket från den 11:e generationens Core i7-11800H, passar bra ihop med den prisvärda RTX 3050 GPU:n i det här fallet.
Pris och tillgänglighet
Asus TUF Dash F15 FX517-serie är nu allmänt tillgänglig på nätet. Vår specifika RTX 3050 SKU är dock ovanlig. Användare kommer att hitta RTX 3050 Ti, RTX 3060 och RTX 3070-konfigurationer som är mer lättillgängliga i skrivande stund. RTX 3060-konfigurationen finns på på Amazon för 1070 USD medan RTX 3050 Ti kan hittas på Best Buy för 1200 dollar.
Asus TUF Dash F15 FX517ZC
- 08/08/2022 v7 (old)
Allen Ngo
Price comparison

