Recension av Eurocom Nightsky TXi317: Fartdåre med 125 W GeForce RTX 3080 Ti
")
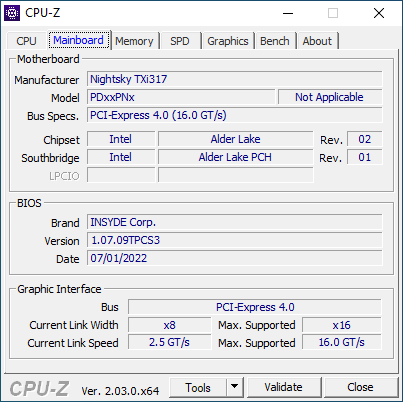
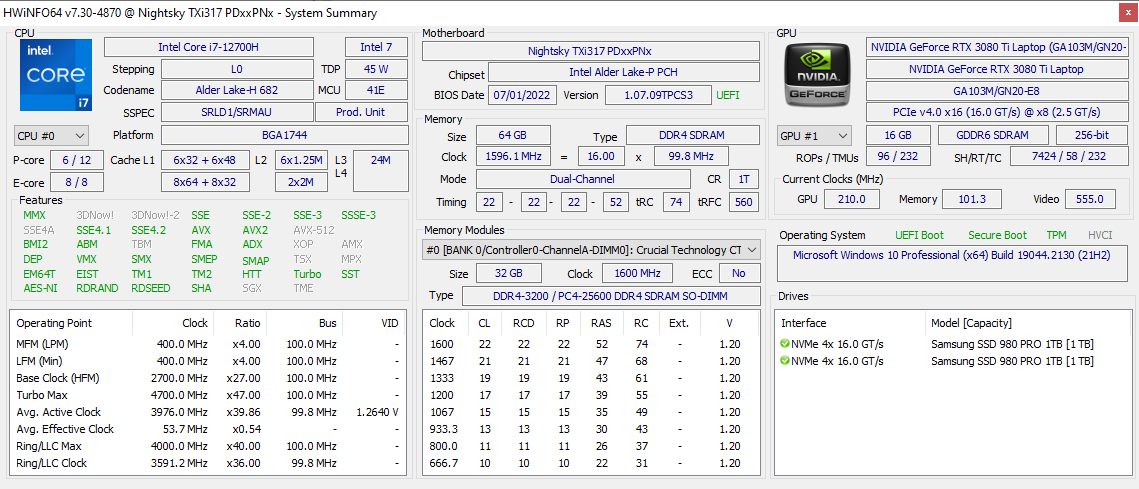
Nightsky TXi317 är den senaste 17,3-tums bärbara speldatorn från Eurocom som använder Intels 12:e generationens Alder Lake-H CPU:er och upp till 155 W TGP GeForce RTX 3080 Ti GPU för att vara en av de snabbaste bärbara speldatorerna som finns tillgängliga för närvarande. Den delar samma Tongfang-chassikonstruktion som Schenker XMG Pro 17 E22 och därför rekommenderar vi att du kollar in vår befintliga recension här för mer information om chassit och dess fysiska egenskaper.
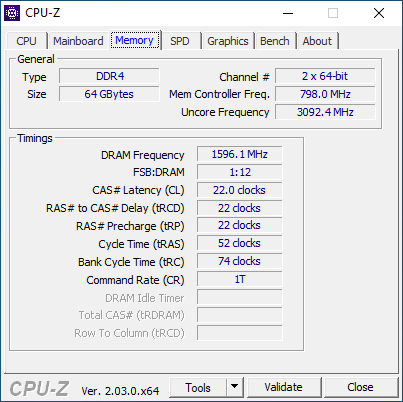
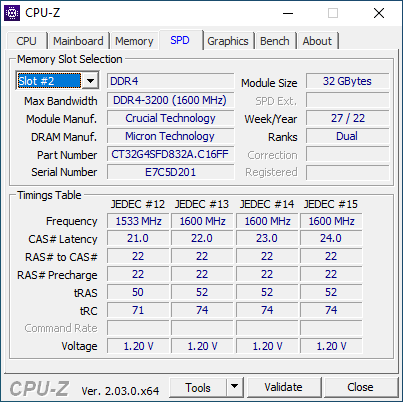
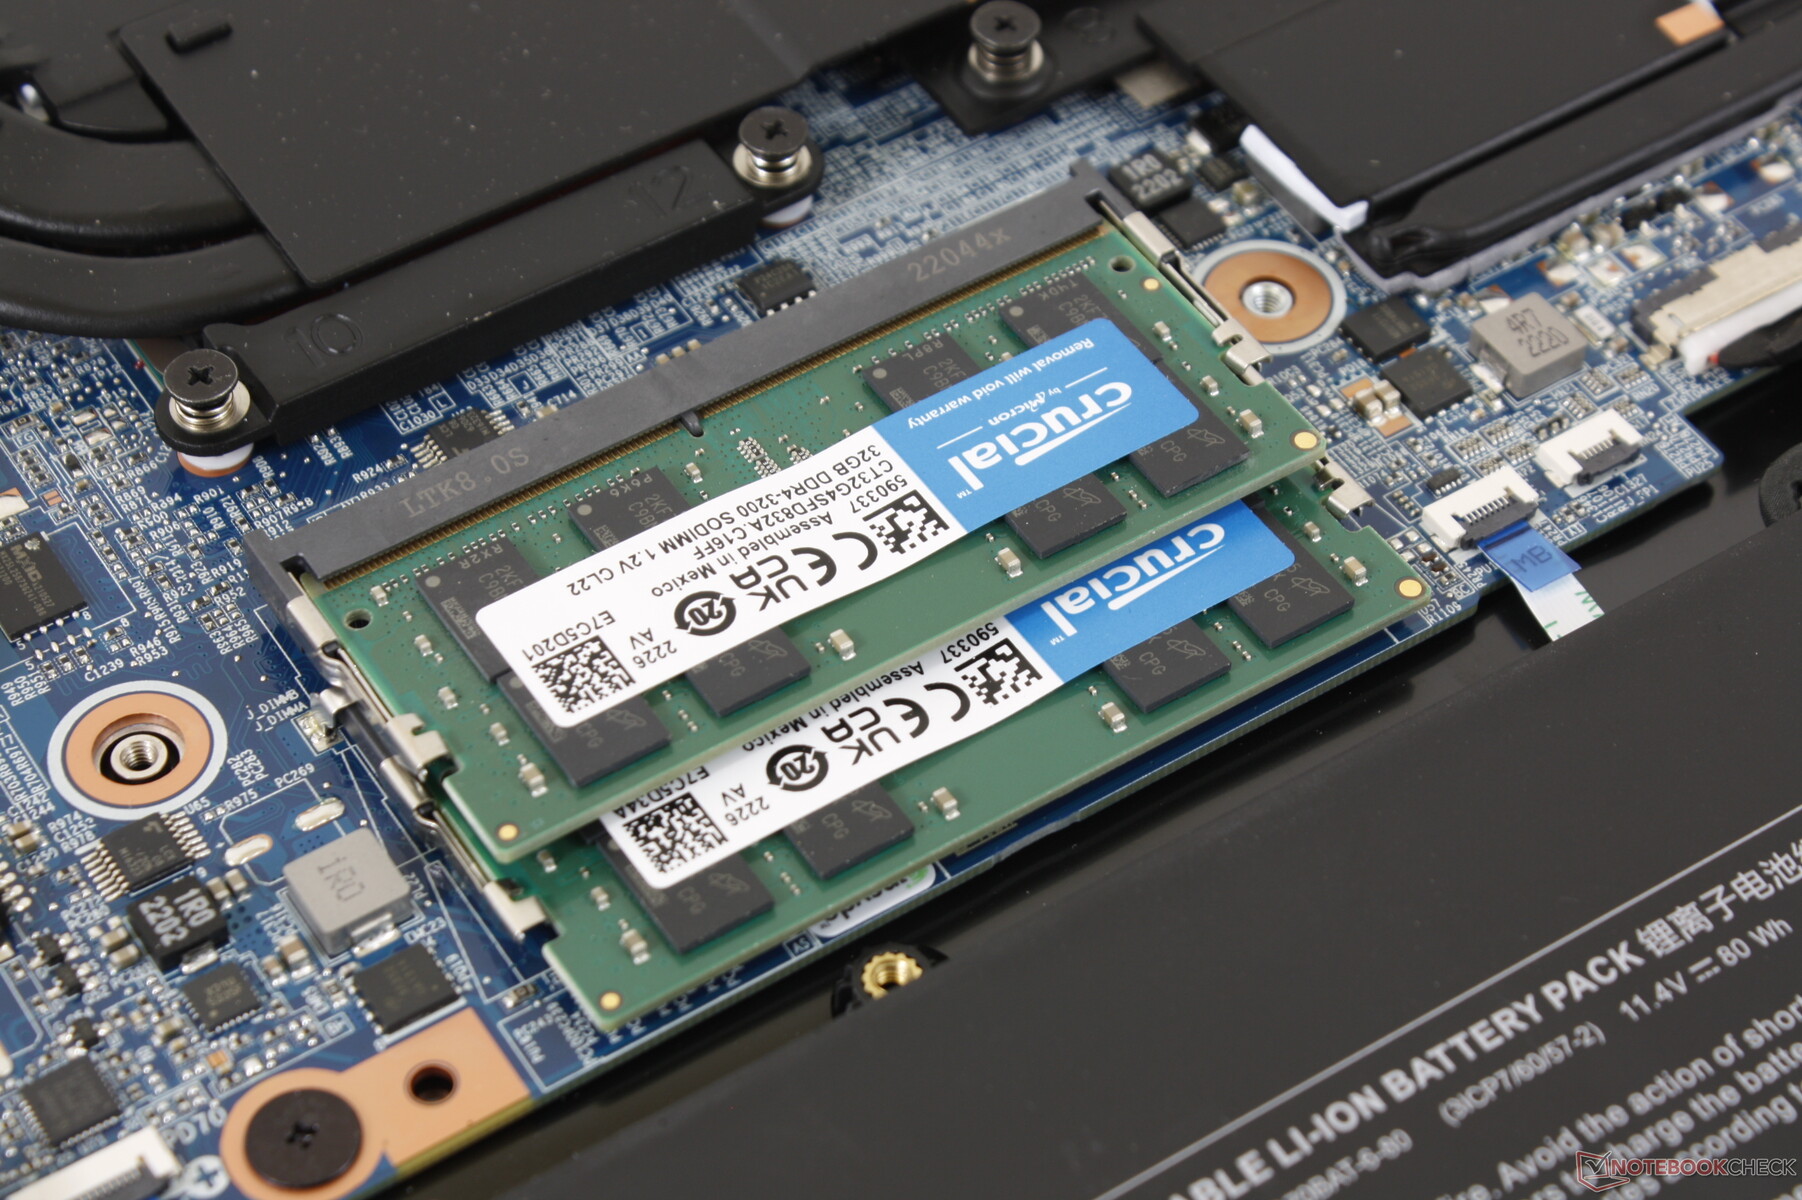
Vår recensionskonfiguration är utrustad med Core i7-12700H CPU, 144 Hz 1080p IPS-skärm, GeForce RTX 3080 Ti GPU och 64 GB RAM för cirka 4100 USD. Det lägsta GPU-alternativet är GeForce RTX 3070 Ti, vilket placerar Nightsky TXi317 helt och hållet på marknaden för bärbara datorer för spelentusiaster.
Direkta konkurrenter är andra högpresterande bärbara 17-tums gamingdatorer med hög prestanda som t.ex Aorus 17X,MSI Raider GE77ellerAlienware x17 R2.
Fler recensioner av Eurocom:
Potentiella konkurrenter i jämförelse
Gradering | Datum | Modell | Vikt | Höjd | Storlek | Upplösning | Pris |
|---|---|---|---|---|---|---|---|
| 85.3 % v7 (old) | 10/2022 | Eurocom Nightsky TXi317 i7-12700H, GeForce RTX 3080 Ti Laptop GPU | 2.9 kg | 27 mm | 17.30" | 1920x1080 | |
| 85.4 % v7 (old) | 07/2022 | Schenker XMG Pro 17 E22 i9-12900H, GeForce RTX 3080 Ti Laptop GPU | 2.8 kg | 27 mm | 17.30" | 2560x1440 | |
| 83.7 % v7 (old) | 08/2022 | Aorus 17X XES i9-12900HX, GeForce RTX 3070 Ti Laptop GPU | 2.7 kg | 30 mm | 17.30" | 1920x1080 | |
| 86.8 % v7 (old) | 07/2022 | MSI Raider GE77 HX 12UHS i9-12900HX, GeForce RTX 3080 Ti Laptop GPU | 3.1 kg | 25.9 mm | 17.30" | 3840x2160 | |
| 89.9 % v7 (old) | 07/2022 | Razer Blade 17 Early 2022 i9-12900H, GeForce RTX 3080 Ti Laptop GPU | 2.8 kg | 19.9 mm | 17.30" | 3840x2160 | |
| 89.2 % v7 (old) | 05/2022 | Alienware x17 R2 P48E i9-12900HK, GeForce RTX 3080 Ti Laptop GPU | 3.1 kg | 20.9 mm | 17.30" | 1920x1080 |
Hölje
Det finns en ytlig skillnad mellan Nightsky TXi317 och XMG Pro 17 E22: De bakre hörnen på Eurocom-designen har blanka bronsfärgade lister medan Schenker-designen inte har det. I övrigt är deras chassikonstruktioner identiska.
SD-kortläsare
| SD Card Reader | |
| average JPG Copy Test (av. of 3 runs) | |
| Alienware x17 R2 P48E (AV Pro V60) | |
| Razer Blade 17 Early 2022 (AV PRO microSD 128 GB V60) | |
| Schenker XMG Pro 17 E22 (AV PRO microSD 128 GB V60) | |
| MSI Raider GE77 HX 12UHS (AV PRO microSD 128 GB V60) | |
| Eurocom Nightsky TXi317 (AV Pro V60) | |
| maximum AS SSD Seq Read Test (1GB) | |
| Alienware x17 R2 P48E (AV Pro V60) | |
| Eurocom Nightsky TXi317 (AV Pro V60) | |
| Schenker XMG Pro 17 E22 (AV PRO microSD 128 GB V60) | |
Kommunikation
Wi-Fi 6 är standard, och trots modellens höga prisnivå finns det inga Wi-Fi 6E-alternativ från tillverkaren. Överföringshastigheterna är ändå stabila och utan anslutningsproblem.
| Networking | |
| iperf3 transmit AX12 | |
| Alienware x17 R2 P48E | |
| iperf3 receive AX12 | |
| Alienware x17 R2 P48E | |
| iperf3 receive AXE11000 6GHz | |
| Aorus 17X XES | |
| MSI Raider GE77 HX 12UHS | |
| iperf3 receive AXE11000 | |
| Schenker XMG Pro 17 E22 | |
| Razer Blade 17 Early 2022 | |
| Eurocom Nightsky TXi317 | |
| iperf3 transmit AXE11000 6GHz | |
| Aorus 17X XES | |
| iperf3 transmit AXE11000 | |
| Eurocom Nightsky TXi317 | |
Webbkamera
Kameran har endast 1 MP och inga 2 MP-alternativ, vilket återigen är en besvikelse med tanke på modellens höga prisklass.


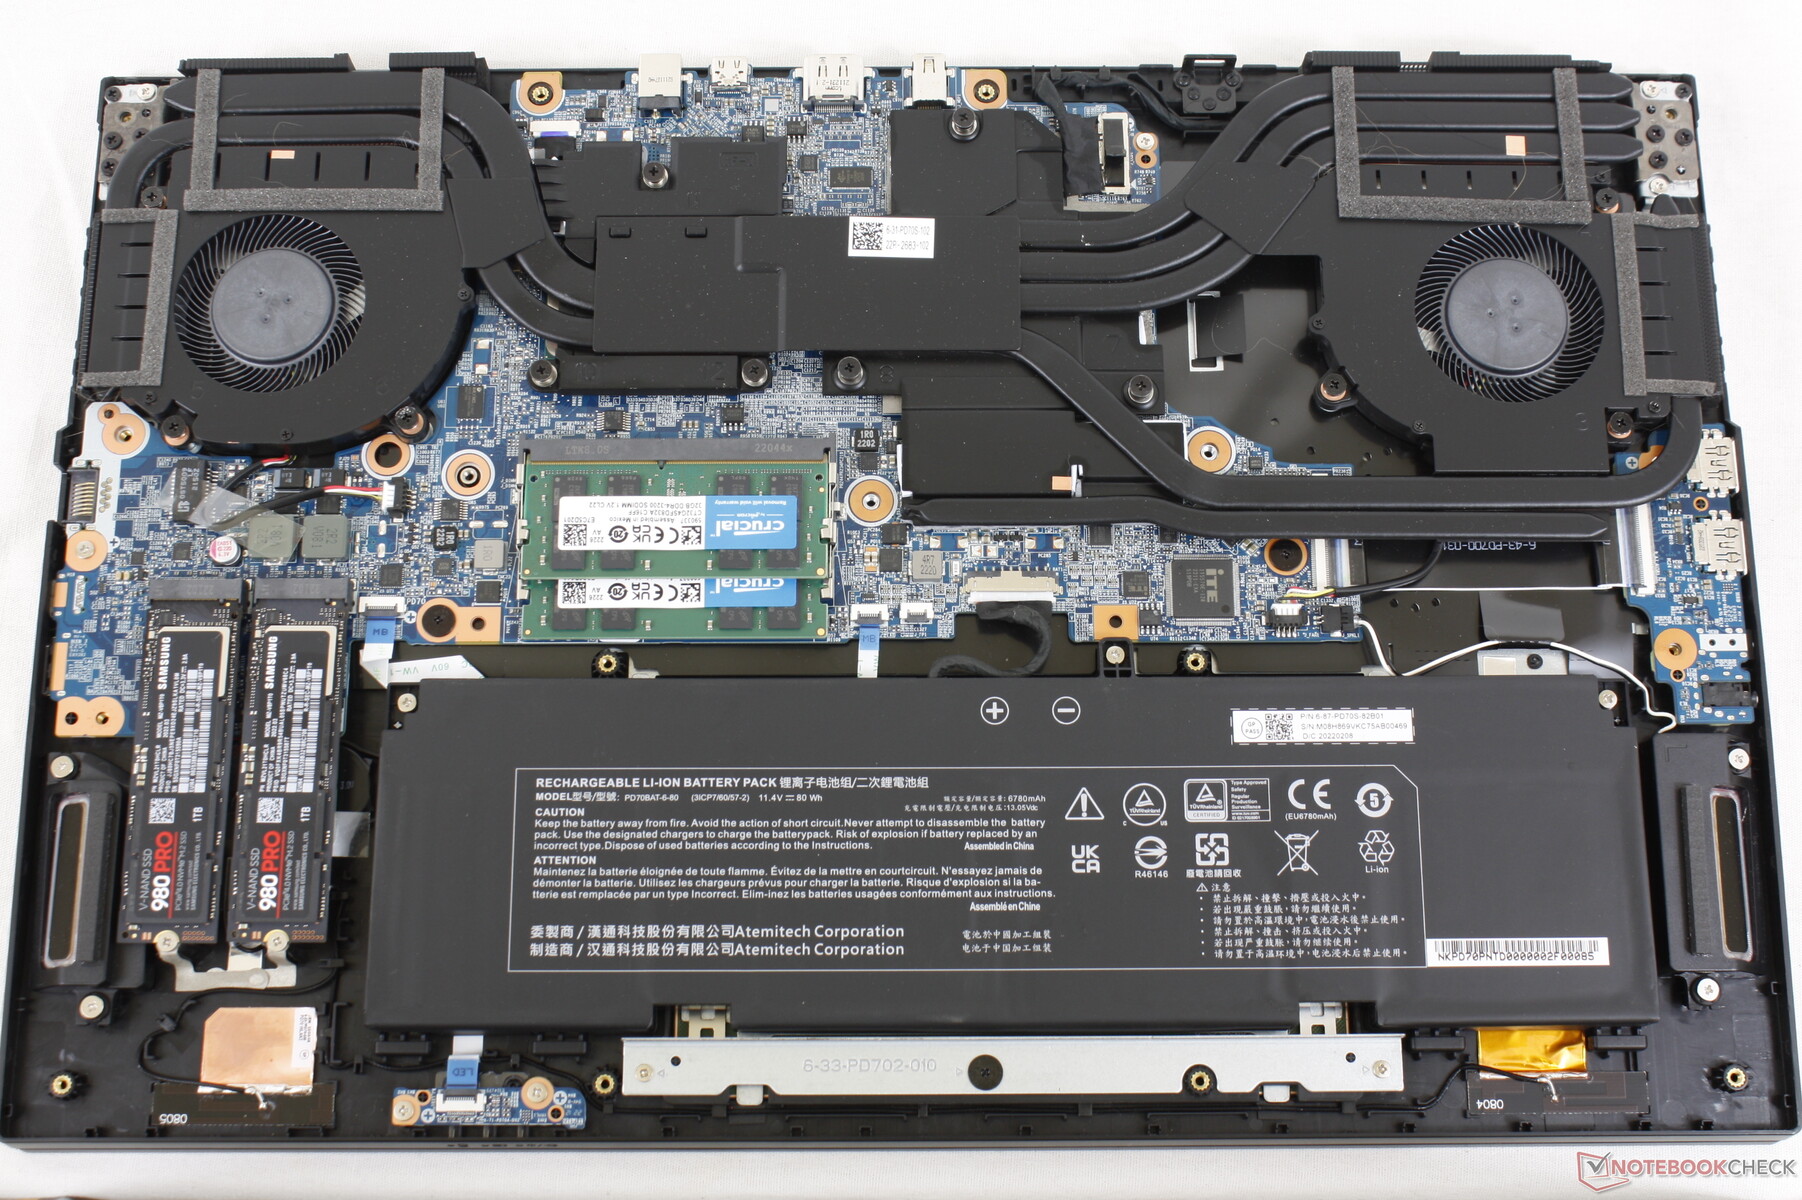
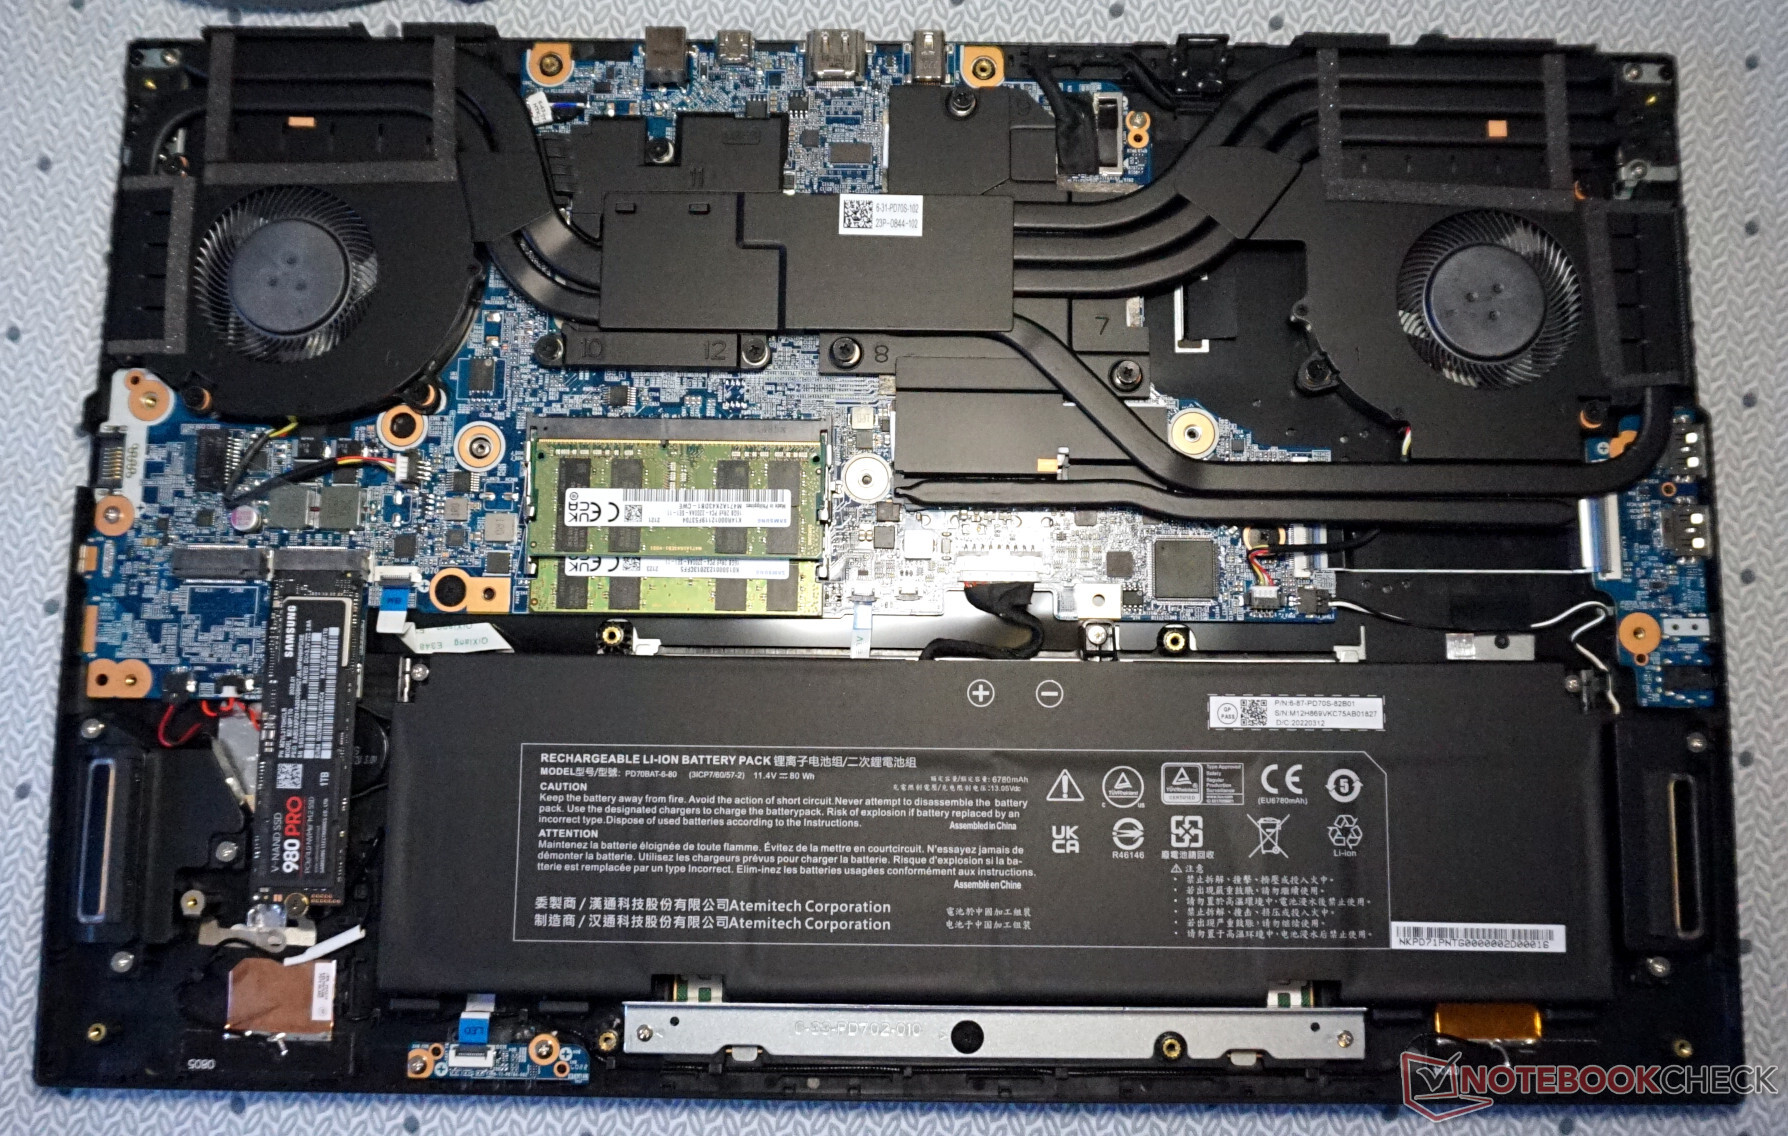
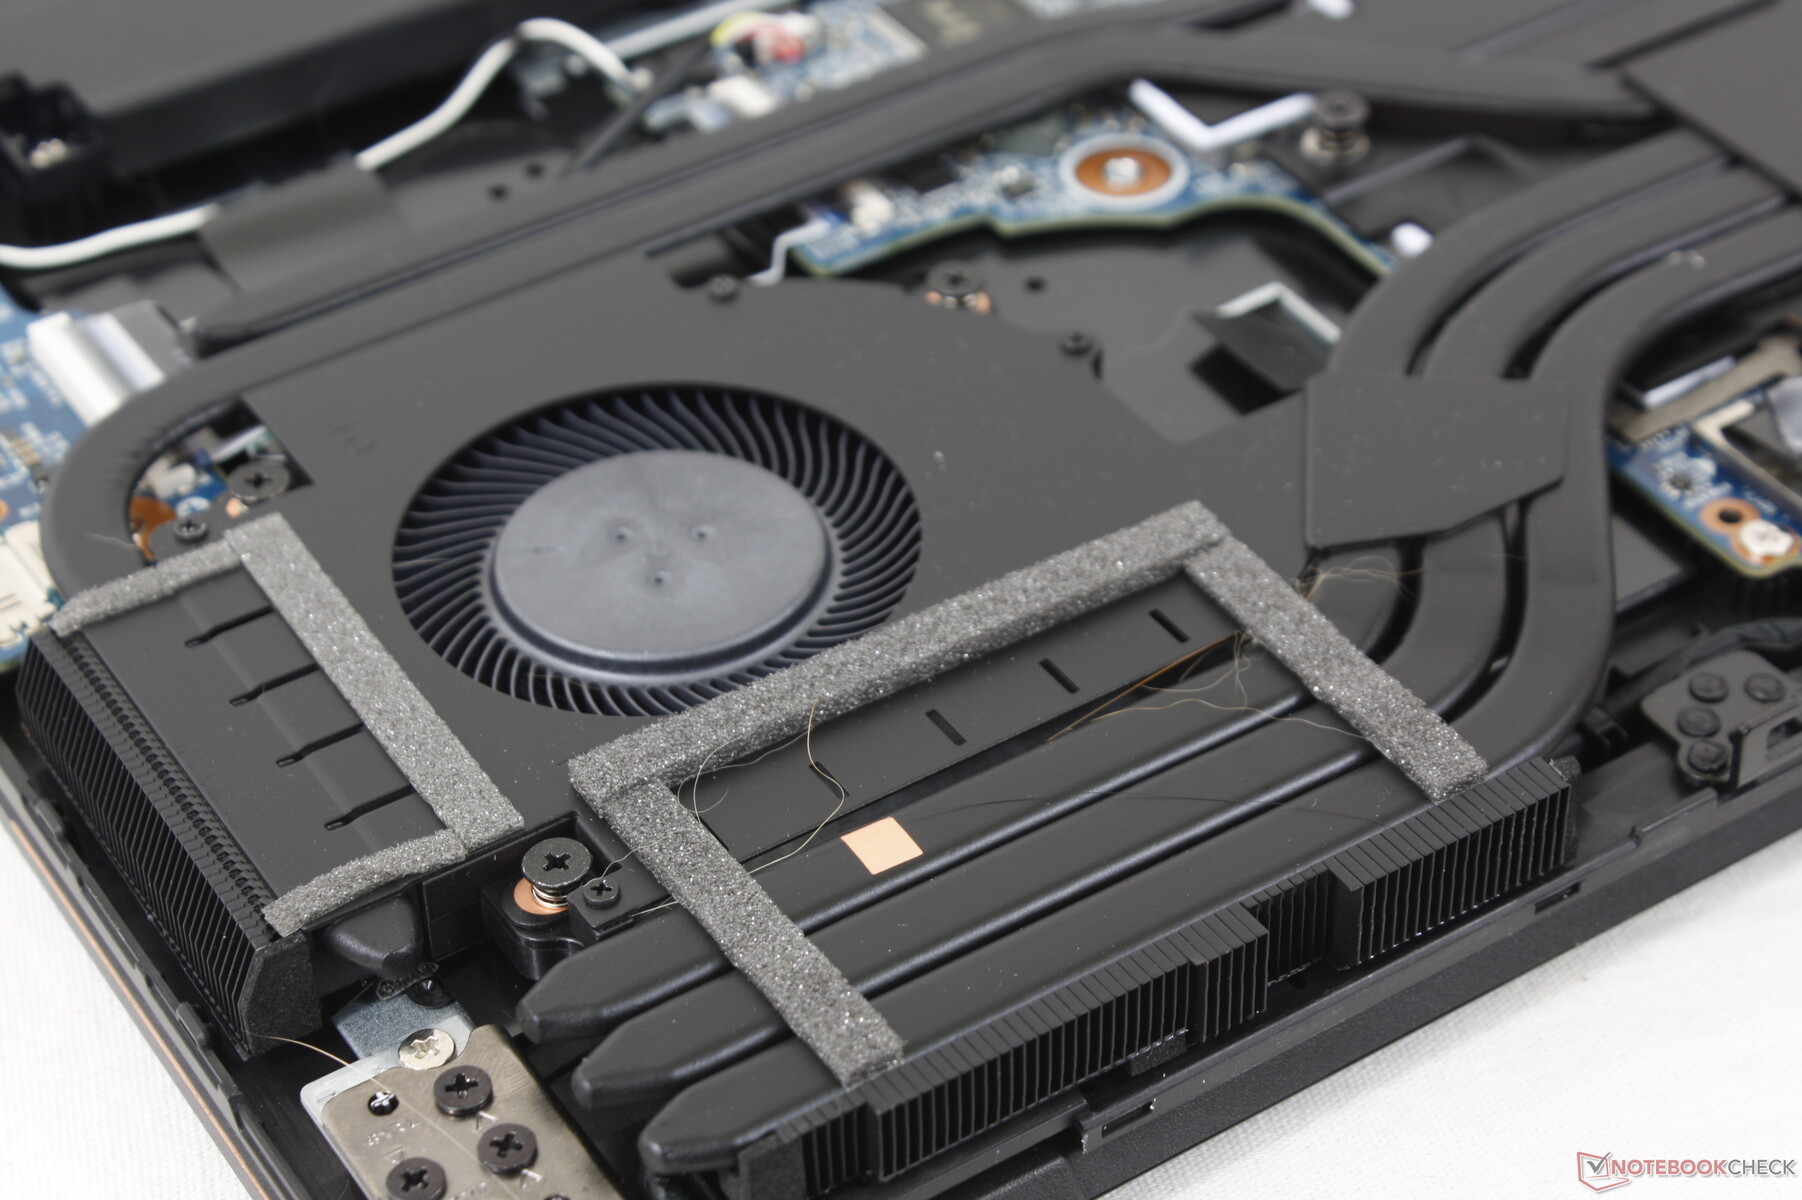
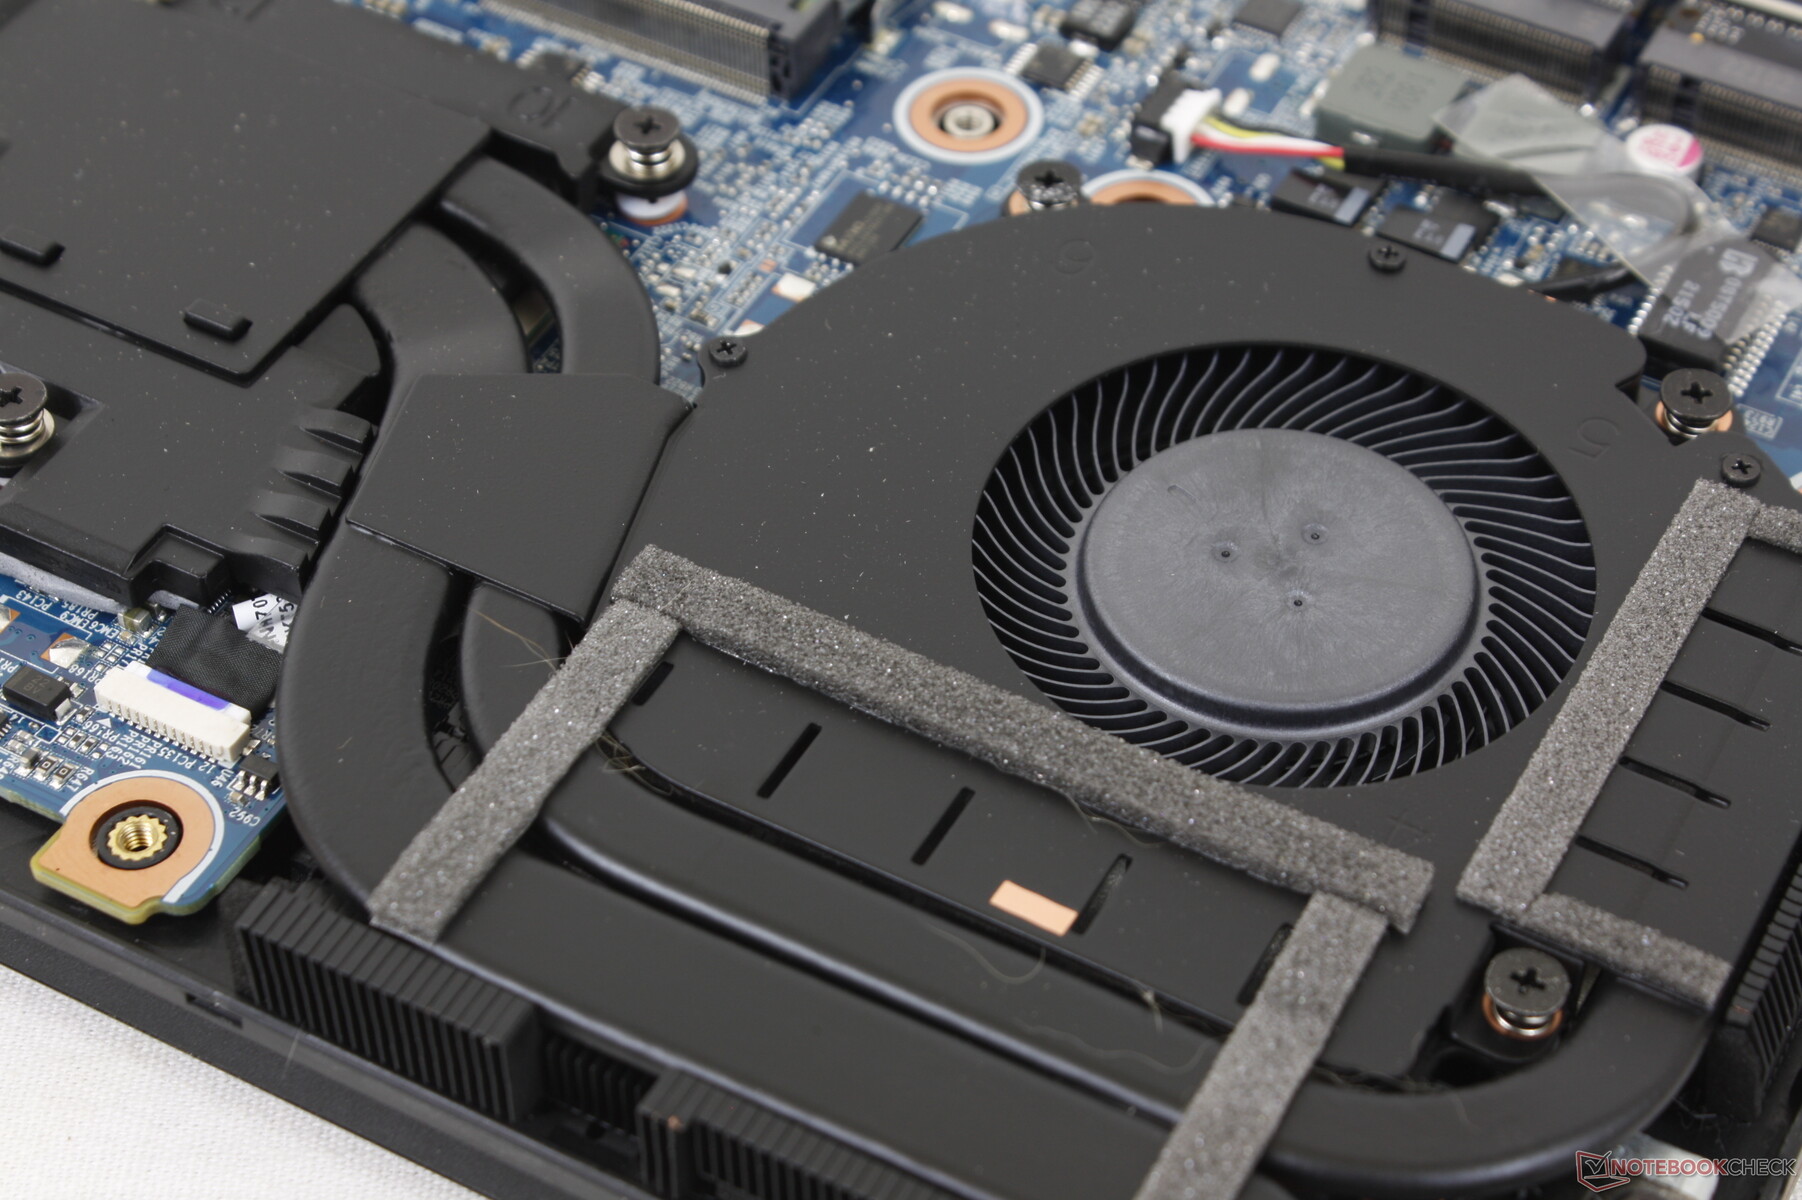
Underhåll
Bottenpanelen är säkrad med 16 Philips-skruvar för att underlätta service. De flesta andra bärbara speldatorer har dock betydligt färre skruvar, och det krävs därför lite mer tålamod för att öppna Eurocom.
Tillbehör och garanti
I förpackningen finns inga extra tillbehör utöver nätadapter och pappersarbete. Den vanliga ettåriga begränsade tillverkargarantin gäller om den köps i USA.
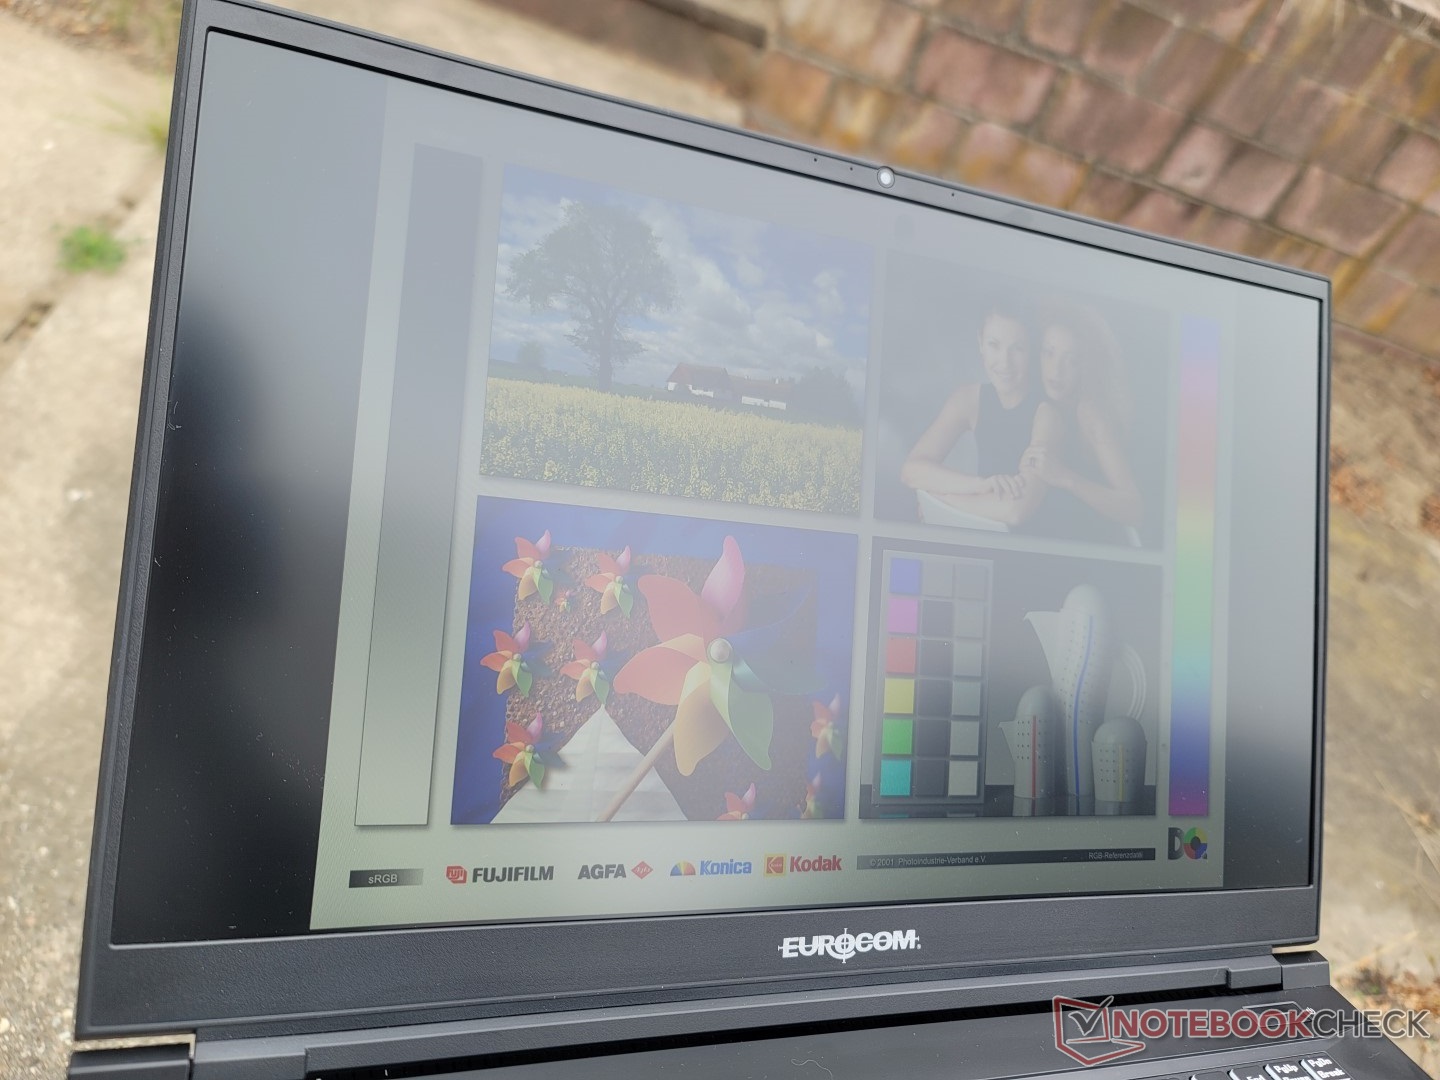
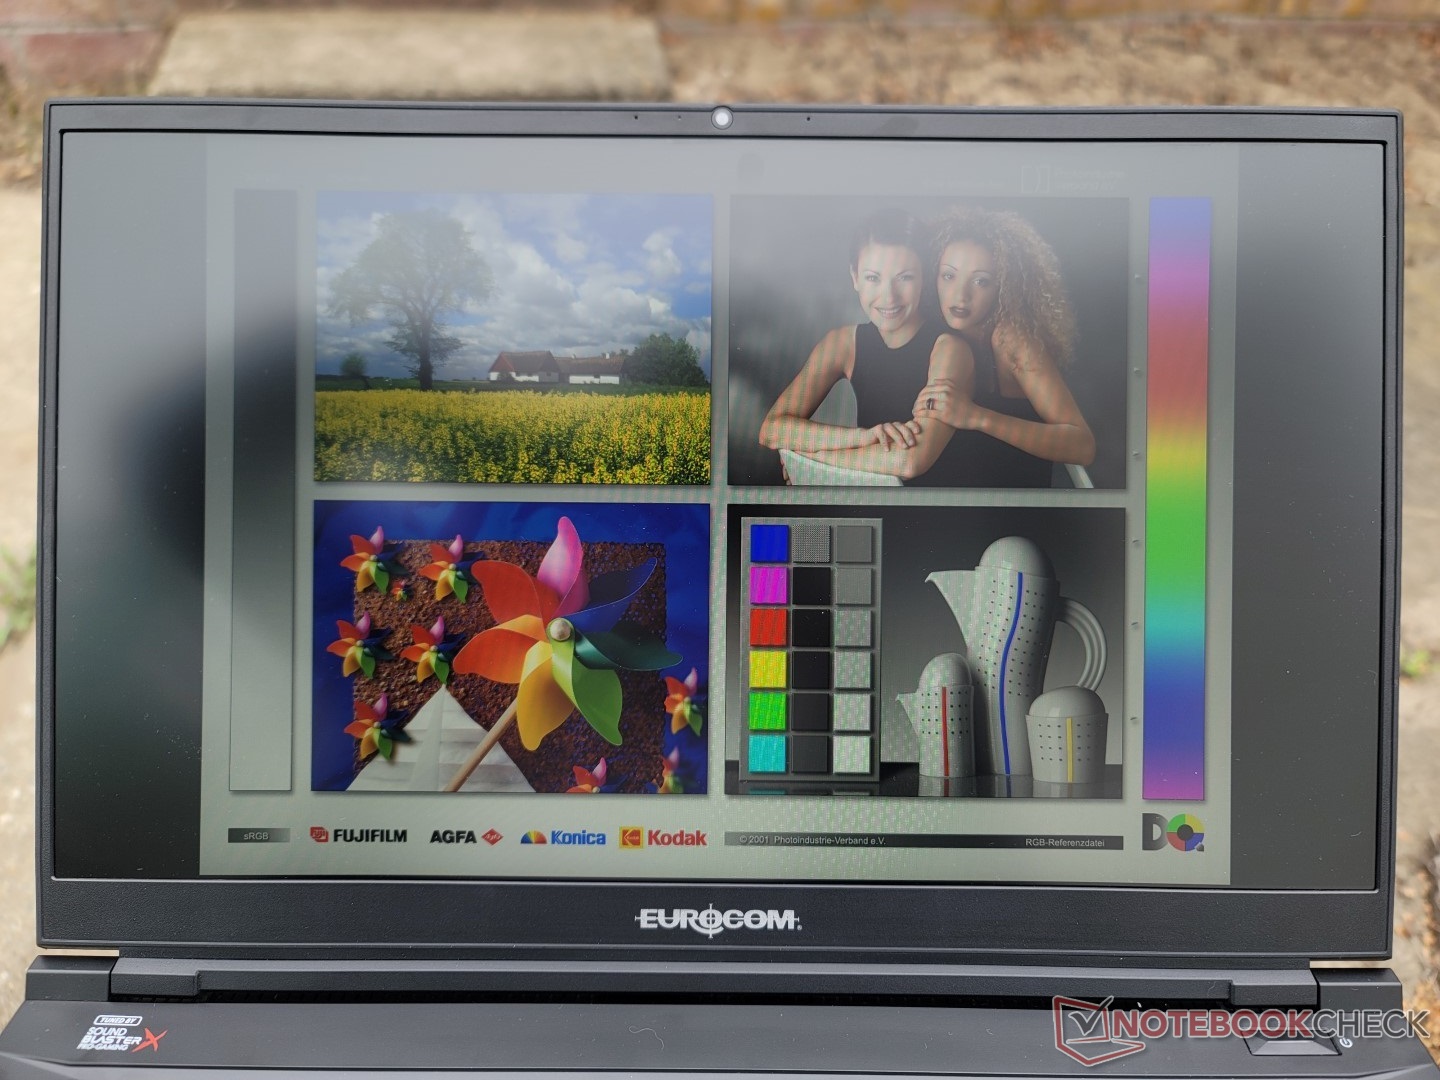
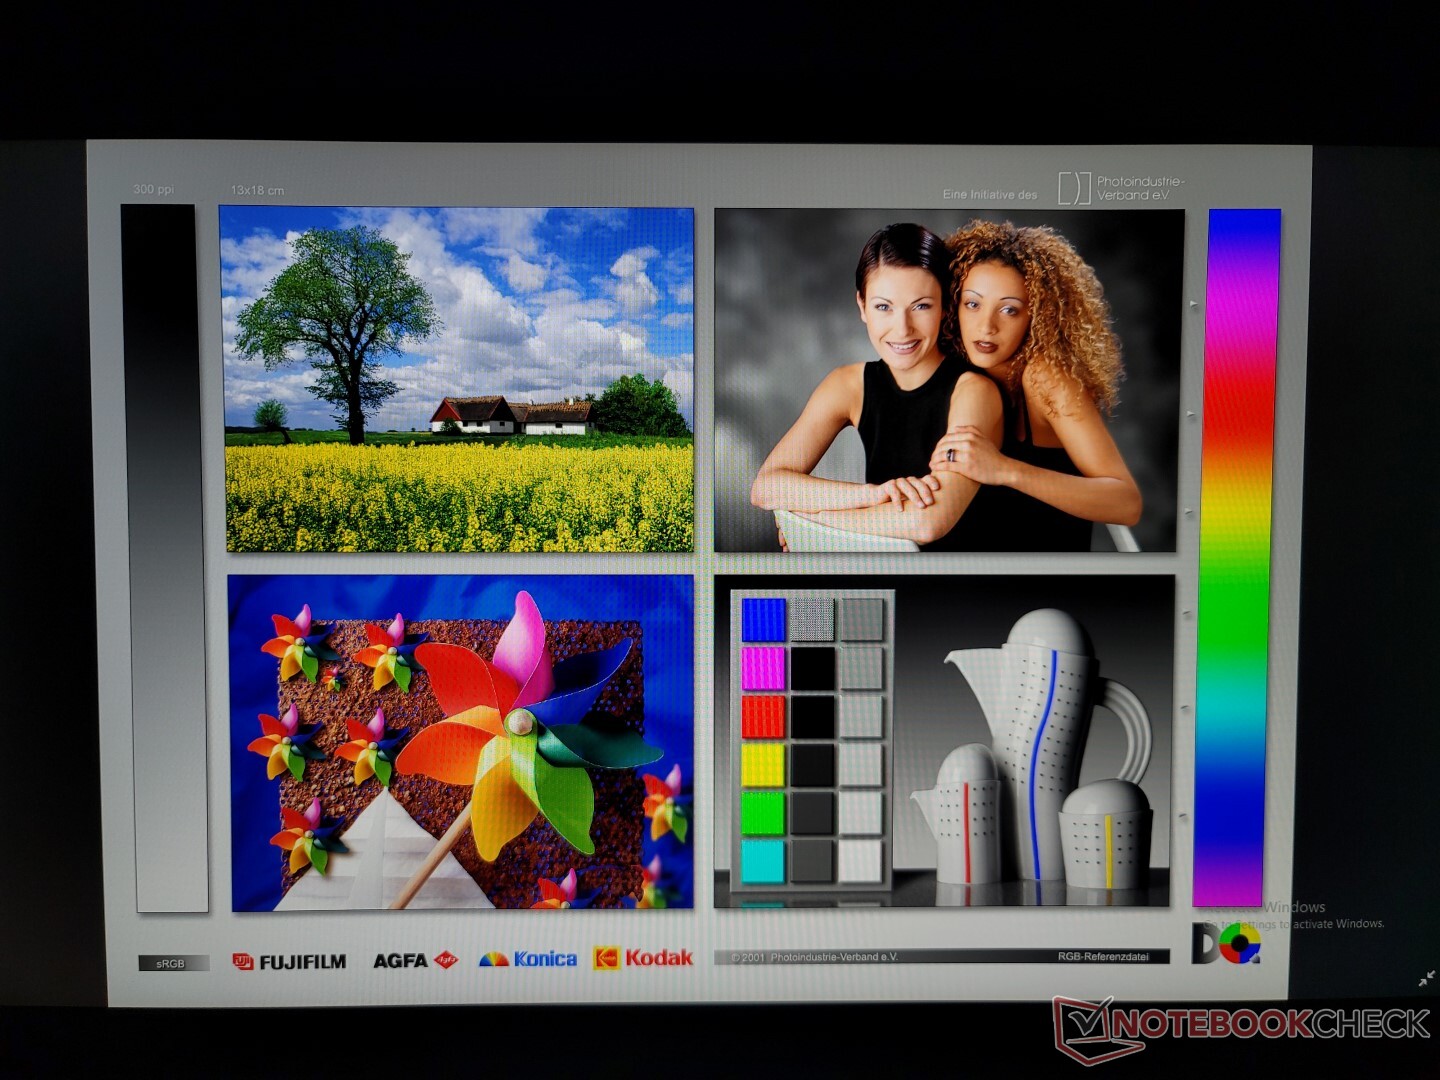
Skärm
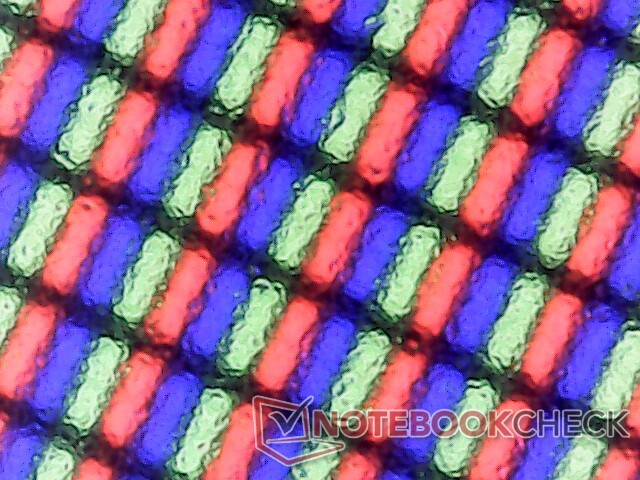
Vår testenhet använder samma LG Philips LP173WFG-SPB3 IPS-panel som finns på Schenker XMG Focus 17. Jämfört med 1440p BOE-panelen på XMG Pro 17 E22 erbjuder vår 1080p LG Philips-panel smalare färger, en långsammare uppdateringsfrekvens och långsammare svarstider för svartvitt, vilket gör den mer till en mellanklassskärm än en högklassig. Den är dock fortfarande mycket bra, men 1440p passar definitivt bättre än 1080p för en bärbar dator som körs med en GeForce RTX 3080 Ti GPU.
Lyckligtvis kommer TXi317 med tre paneler att välja mellan som sträcker sig från 1080p till 4K. Tänk på att ingen av dem är OLED och att de inte heller kan erbjuda full AdobeRGB-täckning.
- 1080p, 144 Hz, 100 % sRGB, IPS
- 1440p, 165 Hz, 100 % sRGB, IPS
- 2160p, 60 Hz, 100 % sRGB, IPS
| |||||||||||||||||||||||||
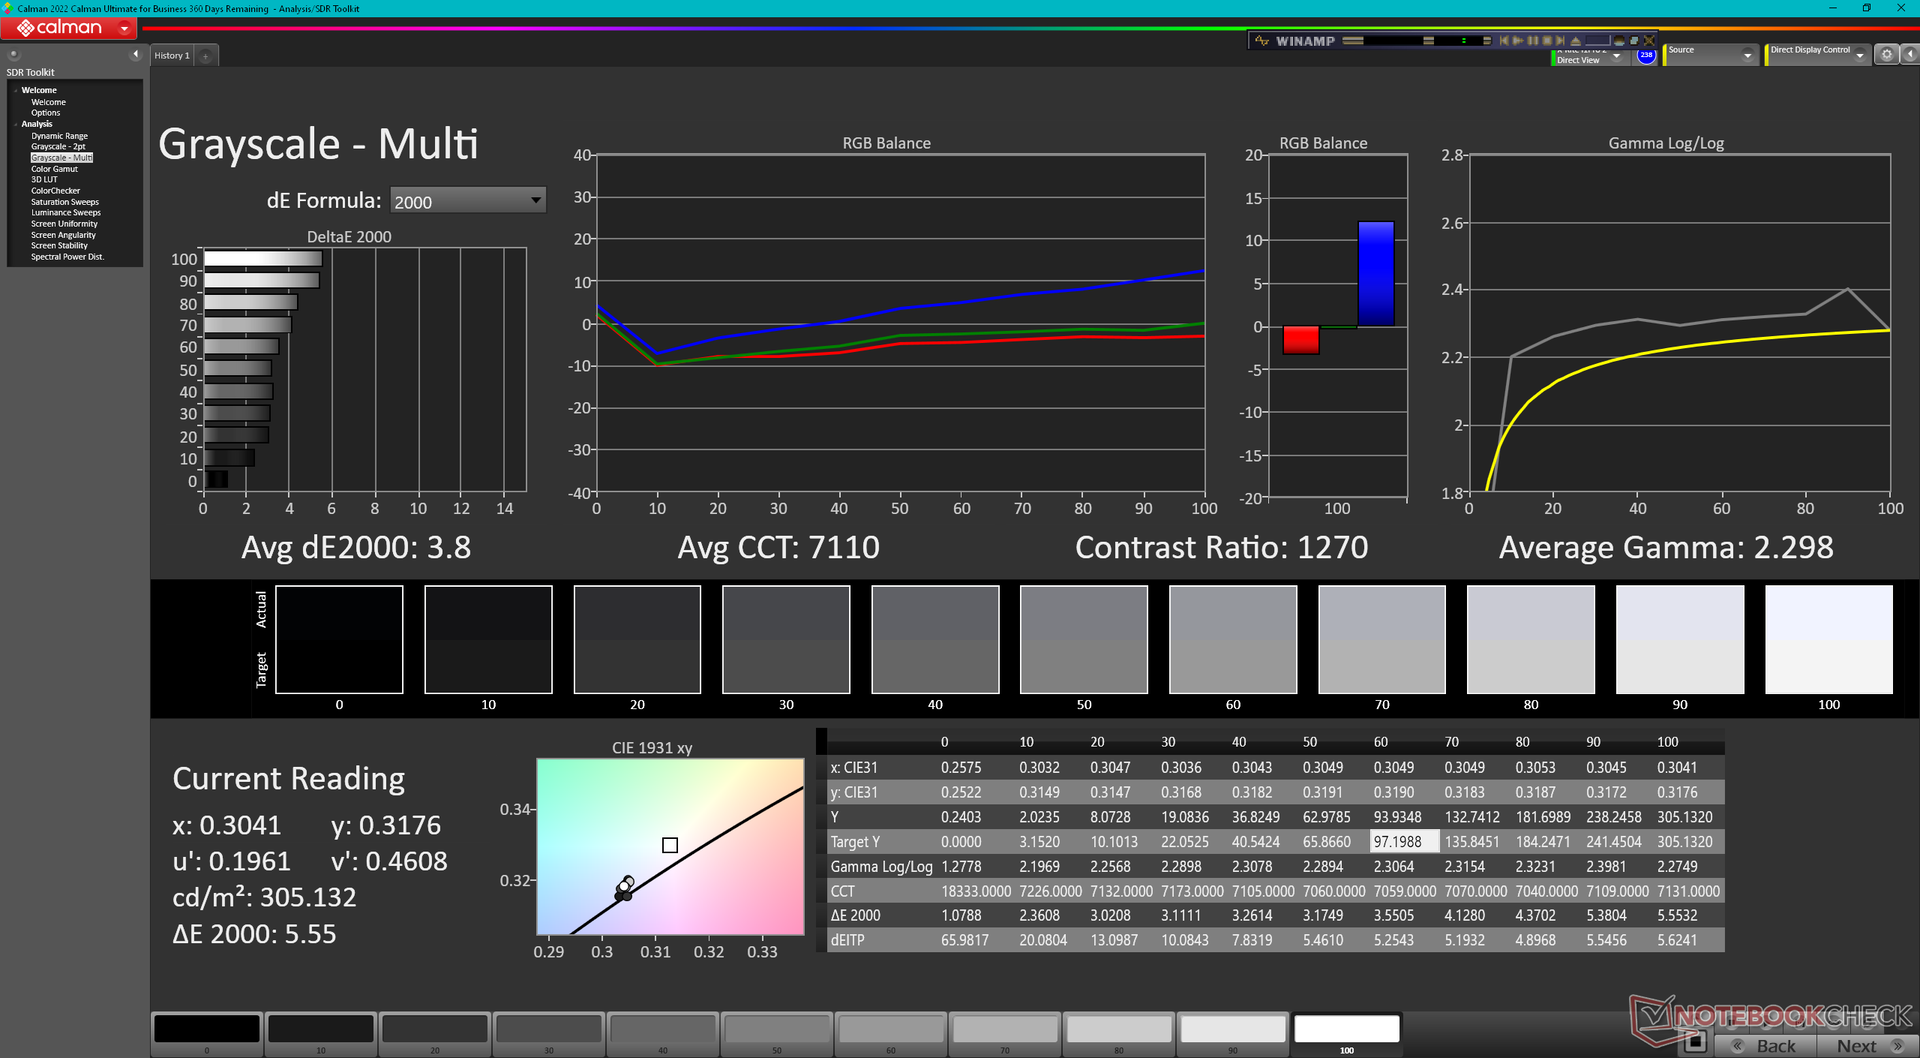
Distribution av ljusstyrkan: 88 %
Mitt på batteriet: 303.9 cd/m²
Kontrast: 1013:1 (Svärta: 0.3 cd/m²)
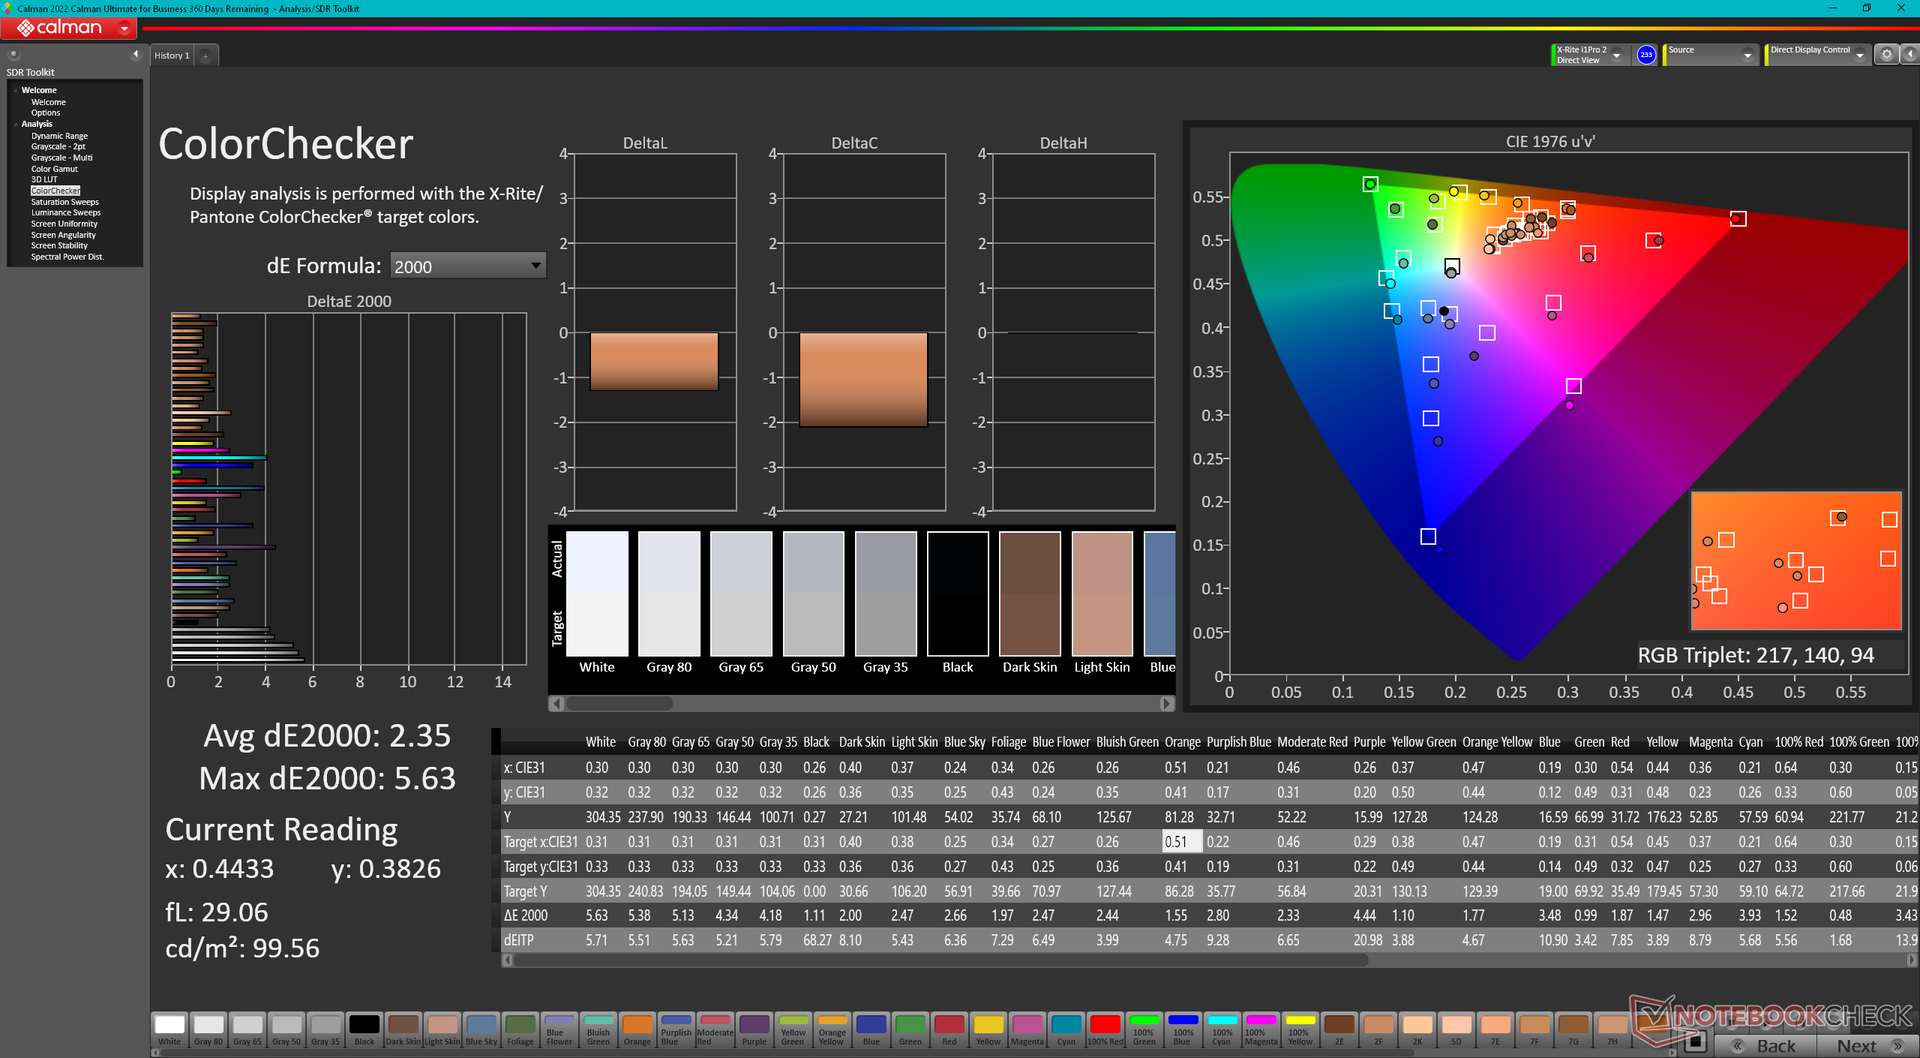
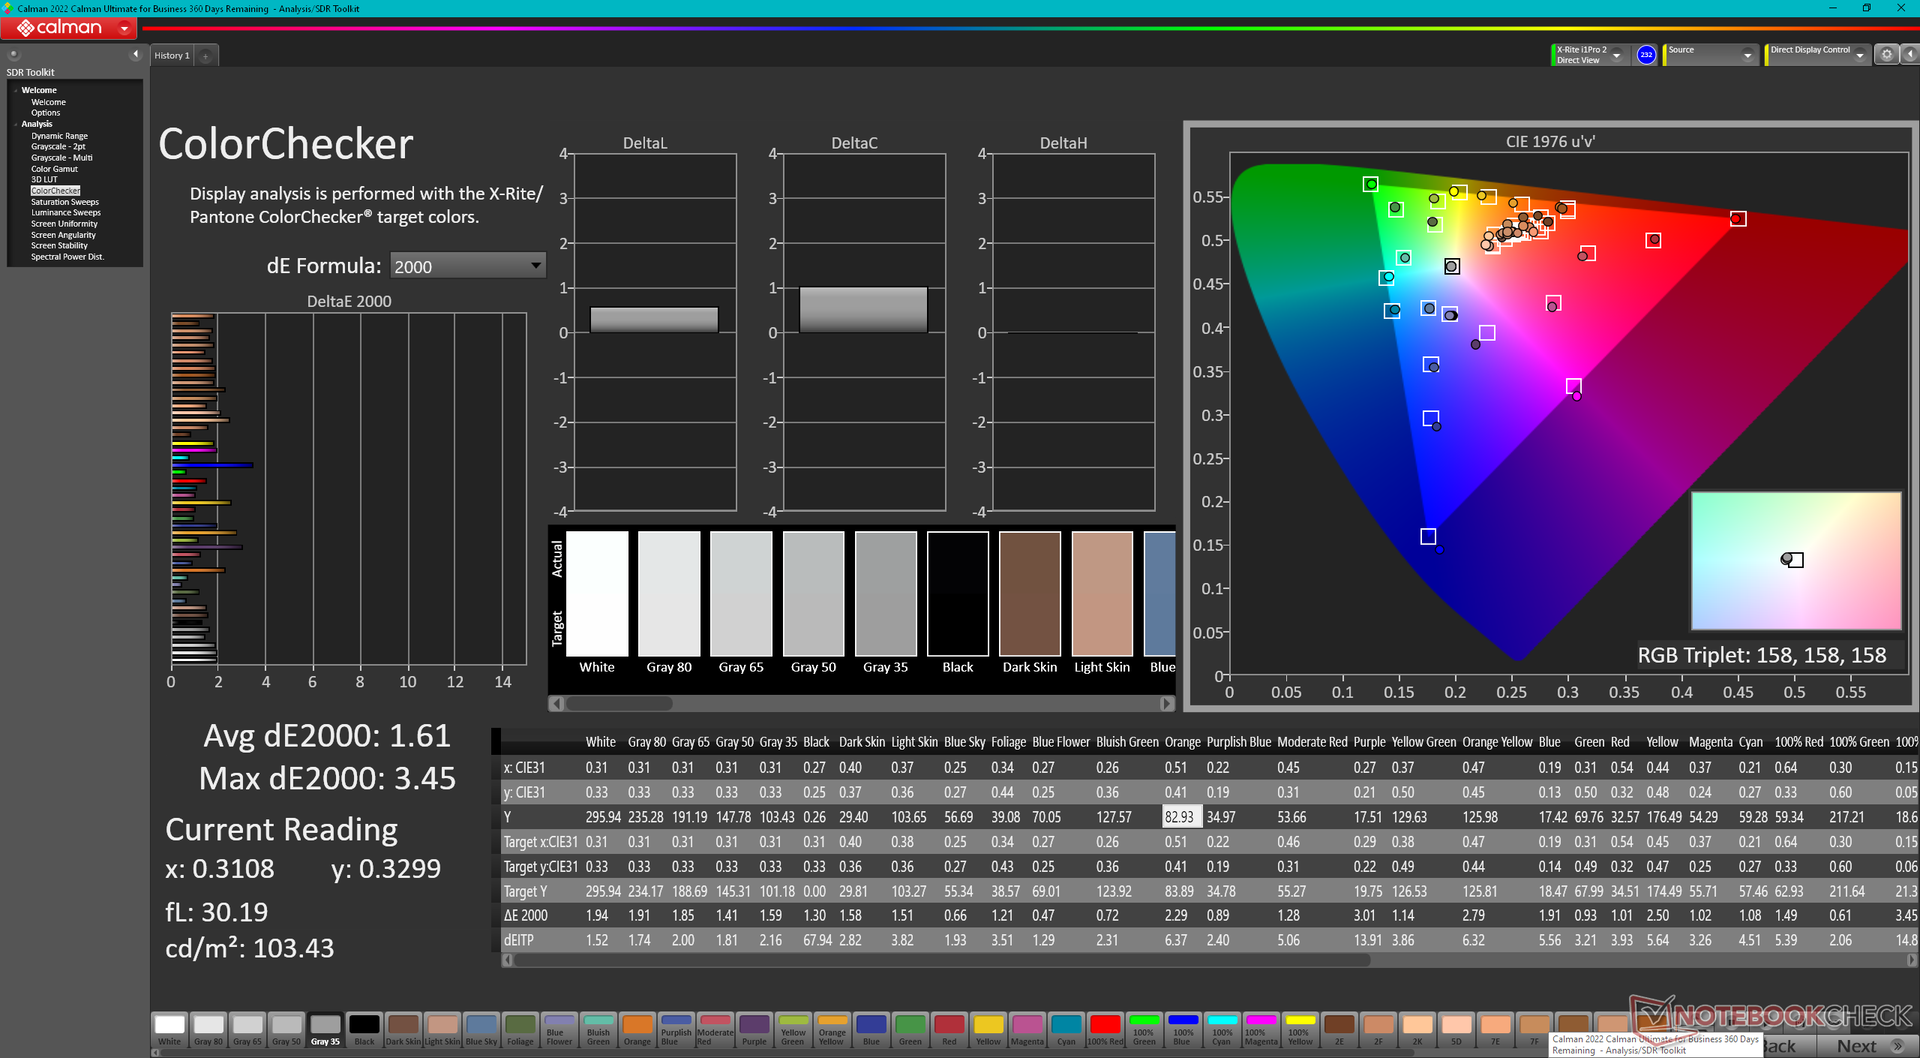
ΔE ColorChecker Calman: 2.35 | ∀{0.5-29.43 Ø4.71}
calibrated: 1.61
ΔE Greyscale Calman: 3.8 | ∀{0.09-98 Ø4.96}
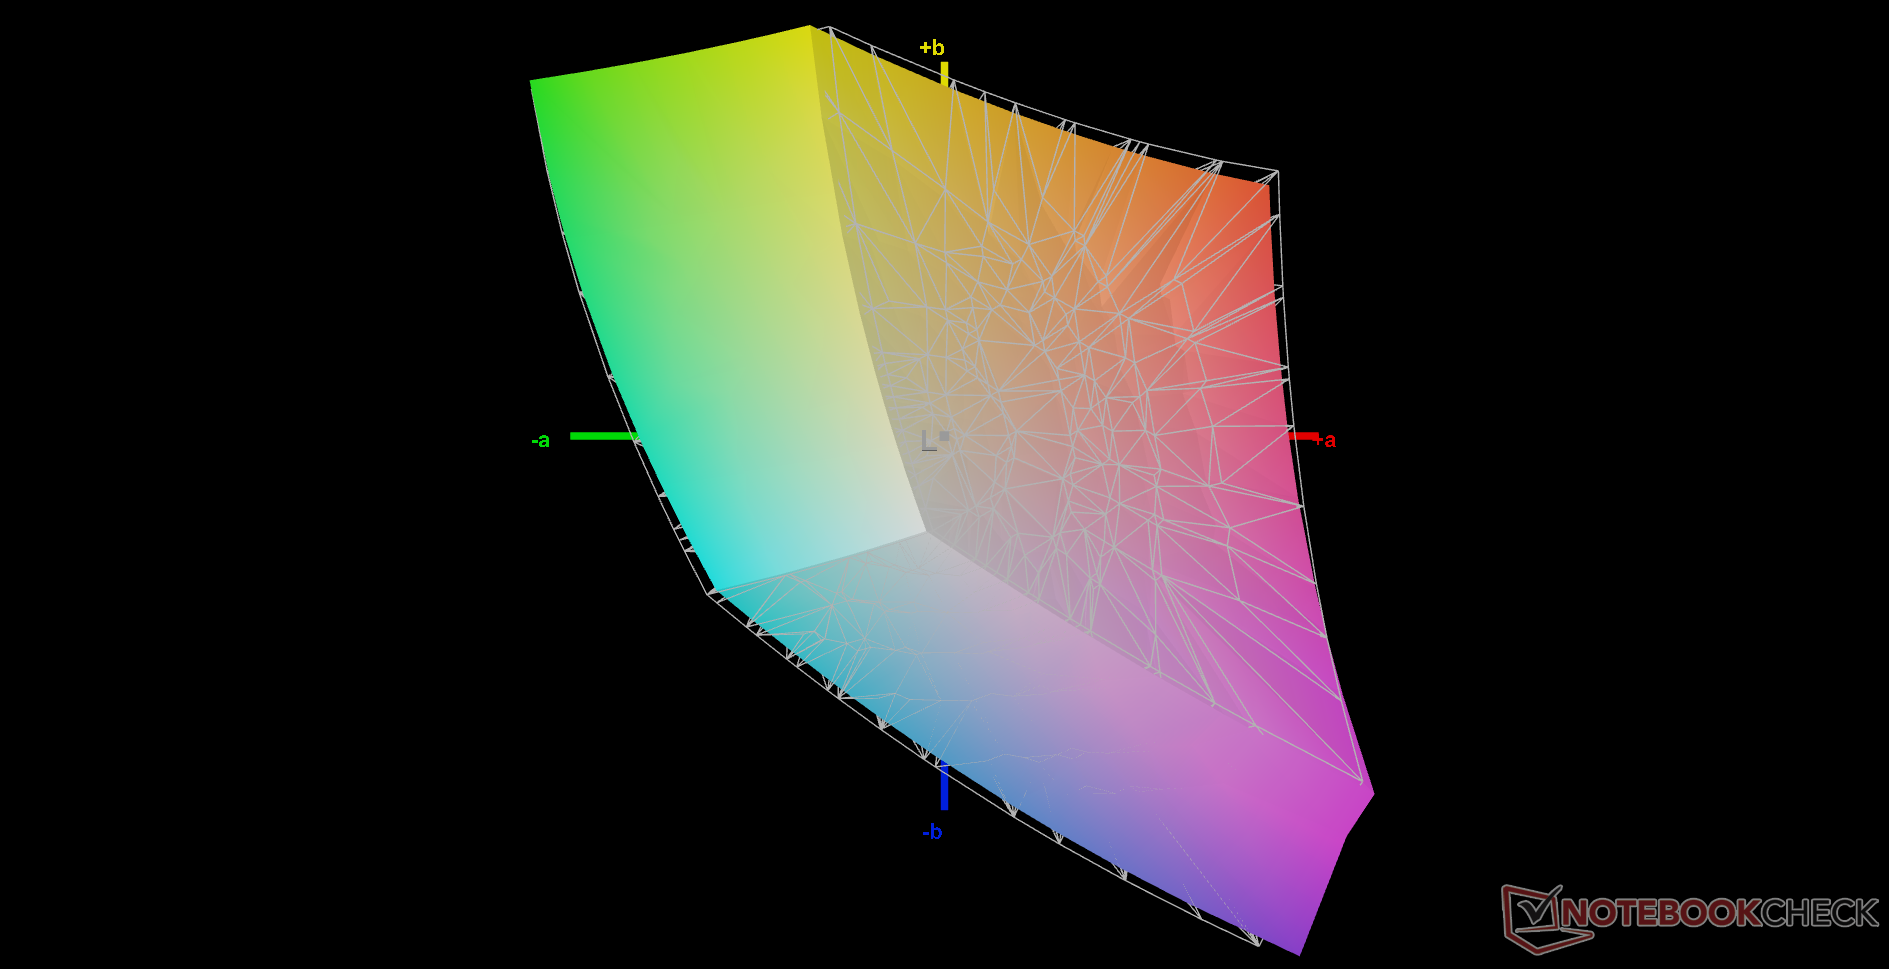
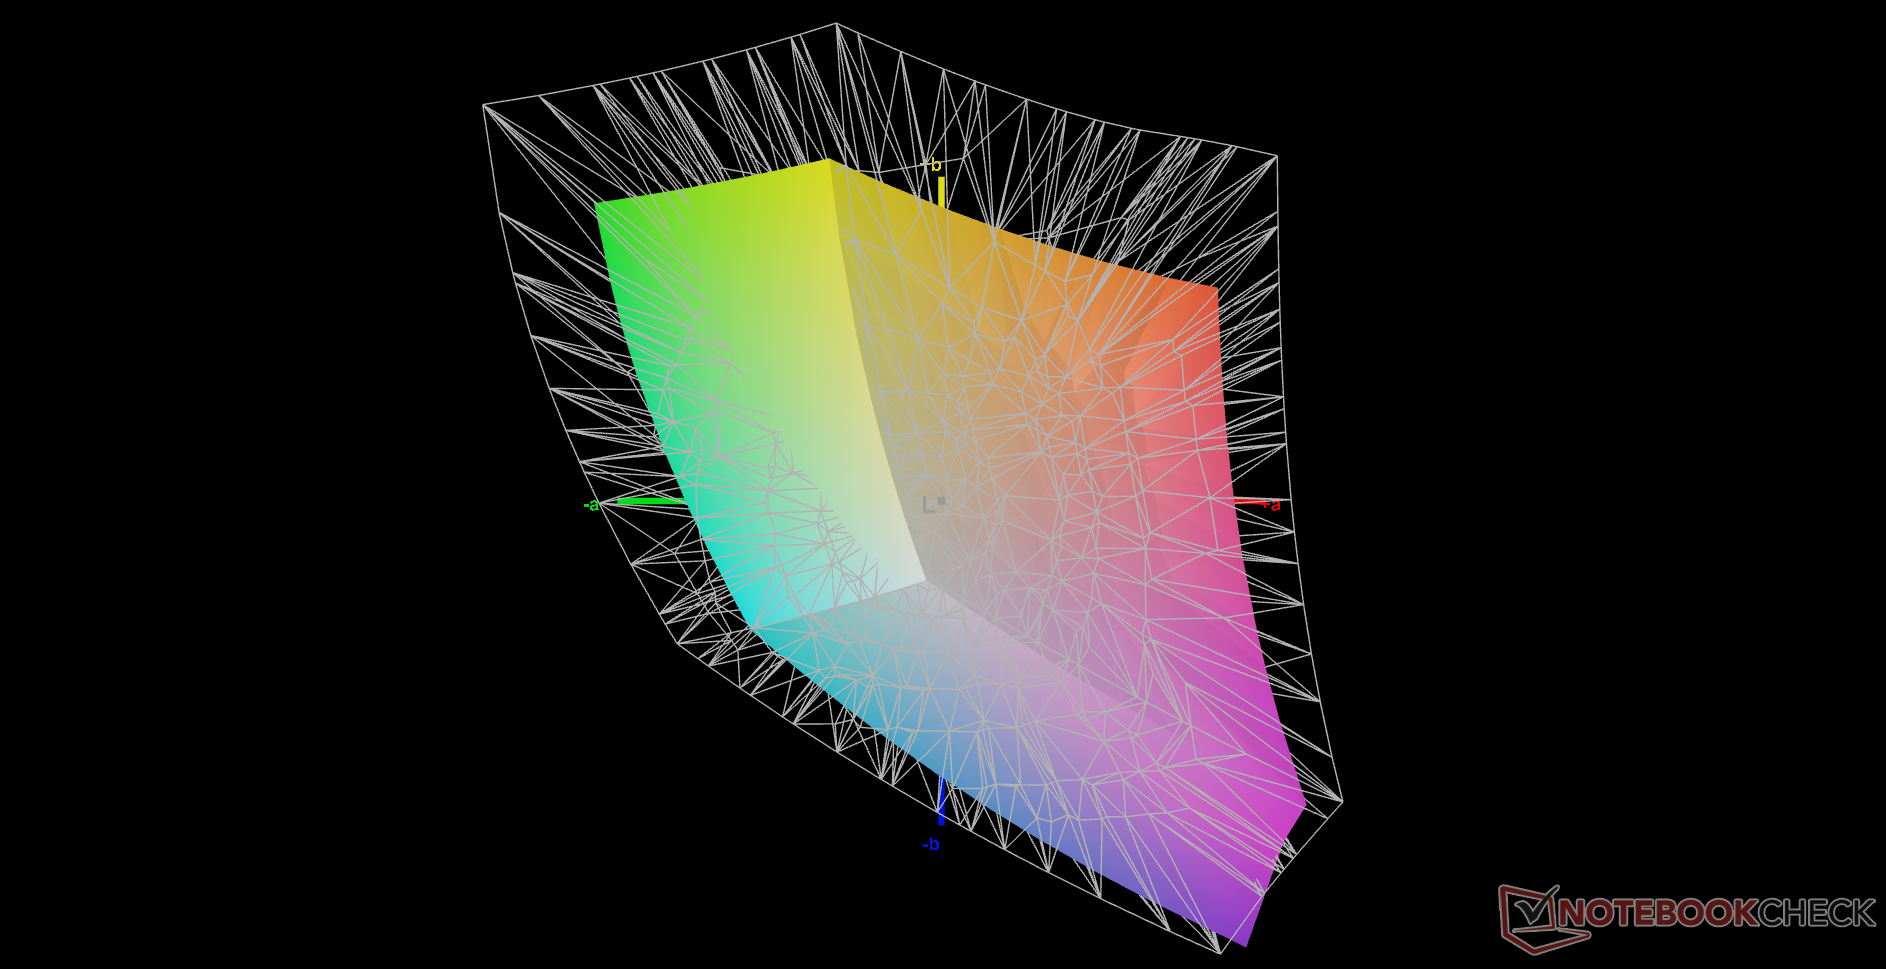
65.4% AdobeRGB 1998 (Argyll 3D)
95.2% sRGB (Argyll 3D)
64.5% Display P3 (Argyll 3D)
Gamma: 2.3
CCT: 7110 K
| Eurocom Nightsky TXi317 LG Philips LP173WFG-SPB3, IPS, 1920x1080, 17.3" | Schenker XMG Pro 17 E22 BOE099D, IPS, 2560x1440, 17.3" | Aorus 17X XES Sharp SHP1563, IPS, 1920x1080, 17.3" | MSI Raider GE77 HX 12UHS AU Optronics B173ZAN06.1, IPS, 3840x2160, 17.3" | Razer Blade 17 Early 2022 AU Optronics B173ZAN06.9, IPS, 3840x2160, 17.3" | Alienware x17 R2 P48E AU Optronics B173HAN, IPS, 1920x1080, 17.3" | |
|---|---|---|---|---|---|---|
| Display | 29% | 8% | 29% | 31% | 17% | |
| Display P3 Coverage (%) | 64.5 | 97.5 51% | 70.1 9% | 96.6 50% | 99.4 54% | 79.2 23% |
| sRGB Coverage (%) | 95.2 | 99.9 5% | 99.9 5% | 99.8 5% | 100 5% | 99.8 5% |
| AdobeRGB 1998 Coverage (%) | 65.4 | 85.2 30% | 71.9 10% | 85.8 31% | 87.3 33% | 79.6 22% |
| Response Times | 44% | 58% | 47% | 39% | -1% | |
| Response Time Grey 50% / Grey 80% * (ms) | 10.4 ? | 5.4 ? 48% | 3.4 ? 67% | 5.8 ? 44% | 7.5 ? 28% | 12.4 ? -19% |
| Response Time Black / White * (ms) | 11.2 ? | 6.8 ? 39% | 5.8 ? 48% | 5.6 ? 50% | 5.6 ? 50% | 9.2 ? 18% |
| PWM Frequency (Hz) | ||||||
| Screen | 5% | -24% | -19% | 33% | 2% | |
| Brightness middle (cd/m²) | 303.9 | 349 15% | 278 -9% | 381 25% | 503 66% | 365.4 20% |
| Brightness (cd/m²) | 292 | 319 9% | 273 -7% | 371 27% | 486 66% | 344 18% |
| Brightness Distribution (%) | 88 | 83 -6% | 79 -10% | 84 -5% | 84 -5% | 85 -3% |
| Black Level * (cd/m²) | 0.3 | 0.32 -7% | 0.26 13% | 0.52 -73% | 0.44 -47% | 0.29 3% |
| Contrast (:1) | 1013 | 1091 8% | 1069 6% | 733 -28% | 1143 13% | 1260 24% |
| Colorchecker dE 2000 * | 2.35 | 2.5 -6% | 3.96 -69% | 1.08 54% | 3.17 -35% | |
| Colorchecker dE 2000 max. * | 5.63 | 6.87 -22% | 10.78 -91% | 4.54 19% | 7.69 -37% | |
| Colorchecker dE 2000 calibrated * | 1.61 | 0.64 60% | 1.07 34% | 2.53 -57% | 0.6 63% | 0.51 68% |
| Greyscale dE 2000 * | 3.8 | 3.9 -3% | 6.8 -79% | 1.3 66% | 5.3 -39% | |
| Gamma | 2.3 96% | 2.09 105% | 2.224 99% | 2.151 102% | 2.18 101% | |
| CCT | 7110 91% | 7192 90% | 7651 85% | 6541 99% | 5879 111% | |
| Totalt genomsnitt (program/inställningar) | 26% /
16% | 14% /
-5% | 19% /
6% | 34% /
33% | 6% /
5% |
* ... mindre är bättre
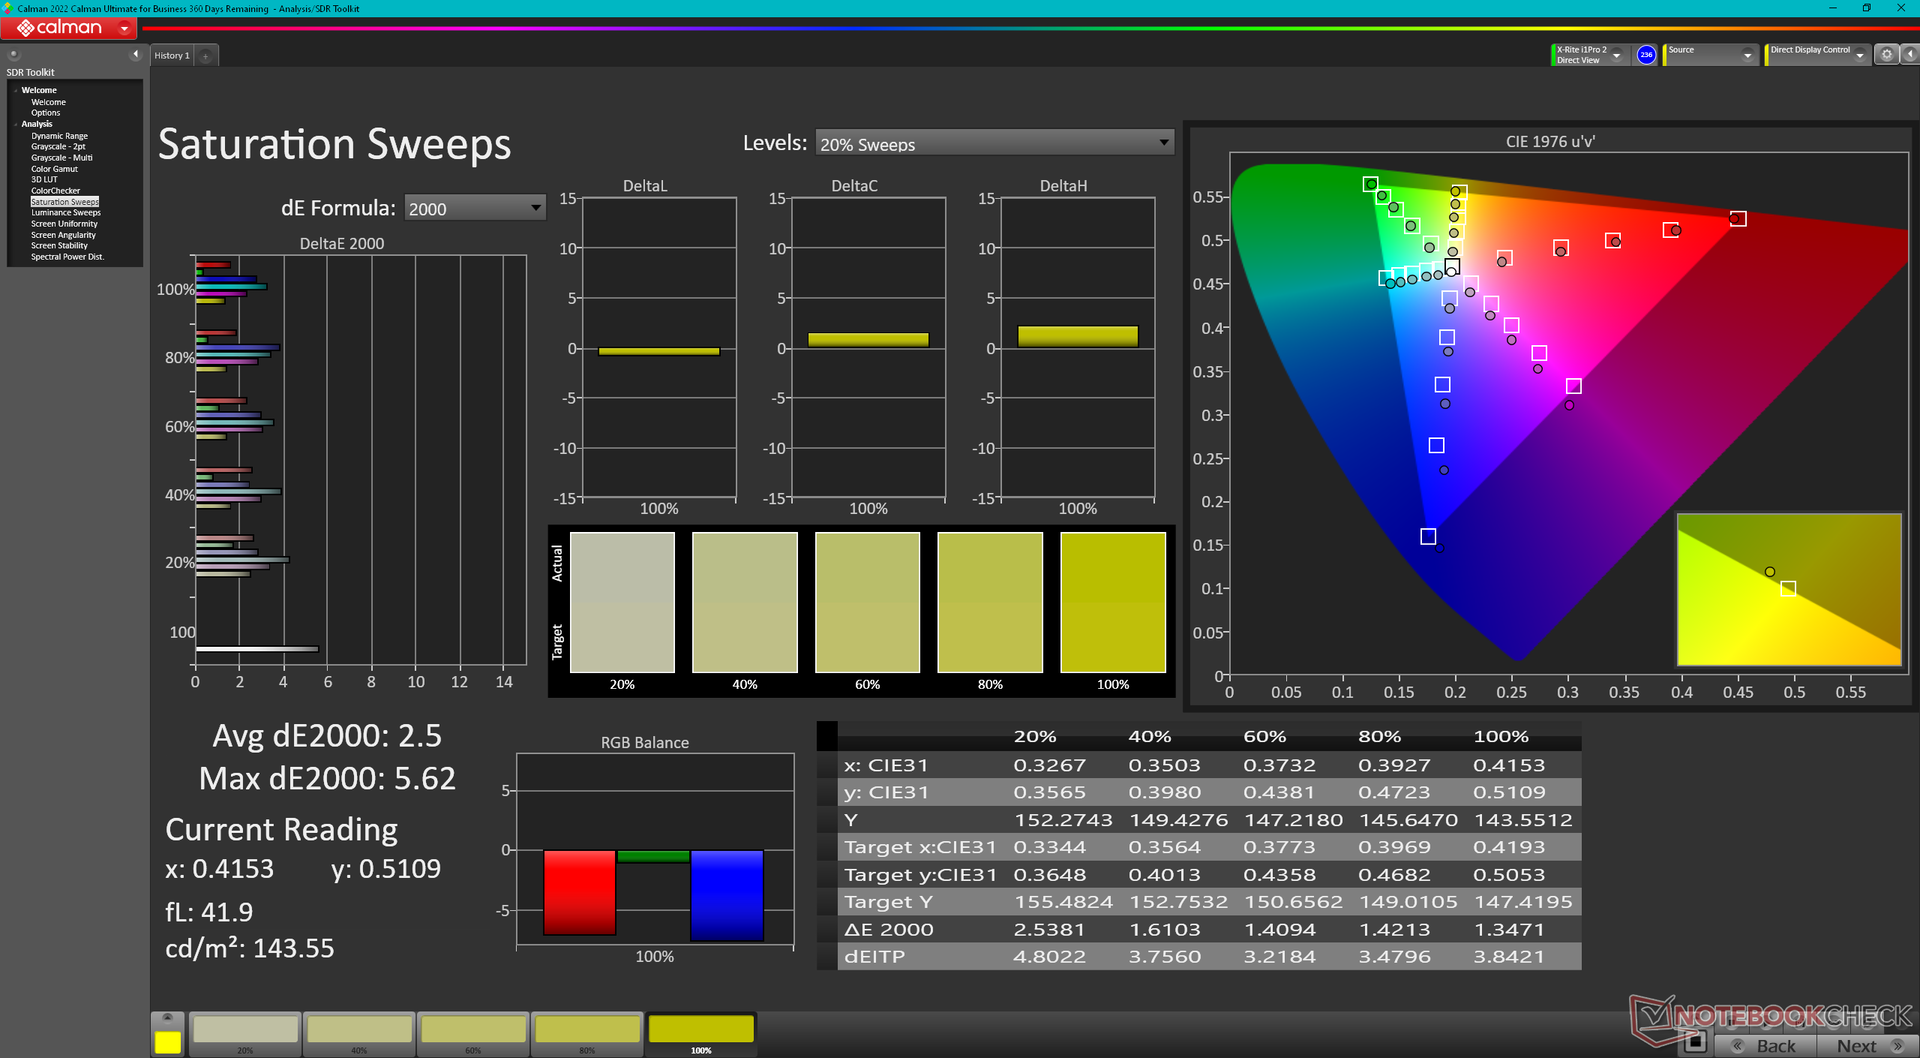
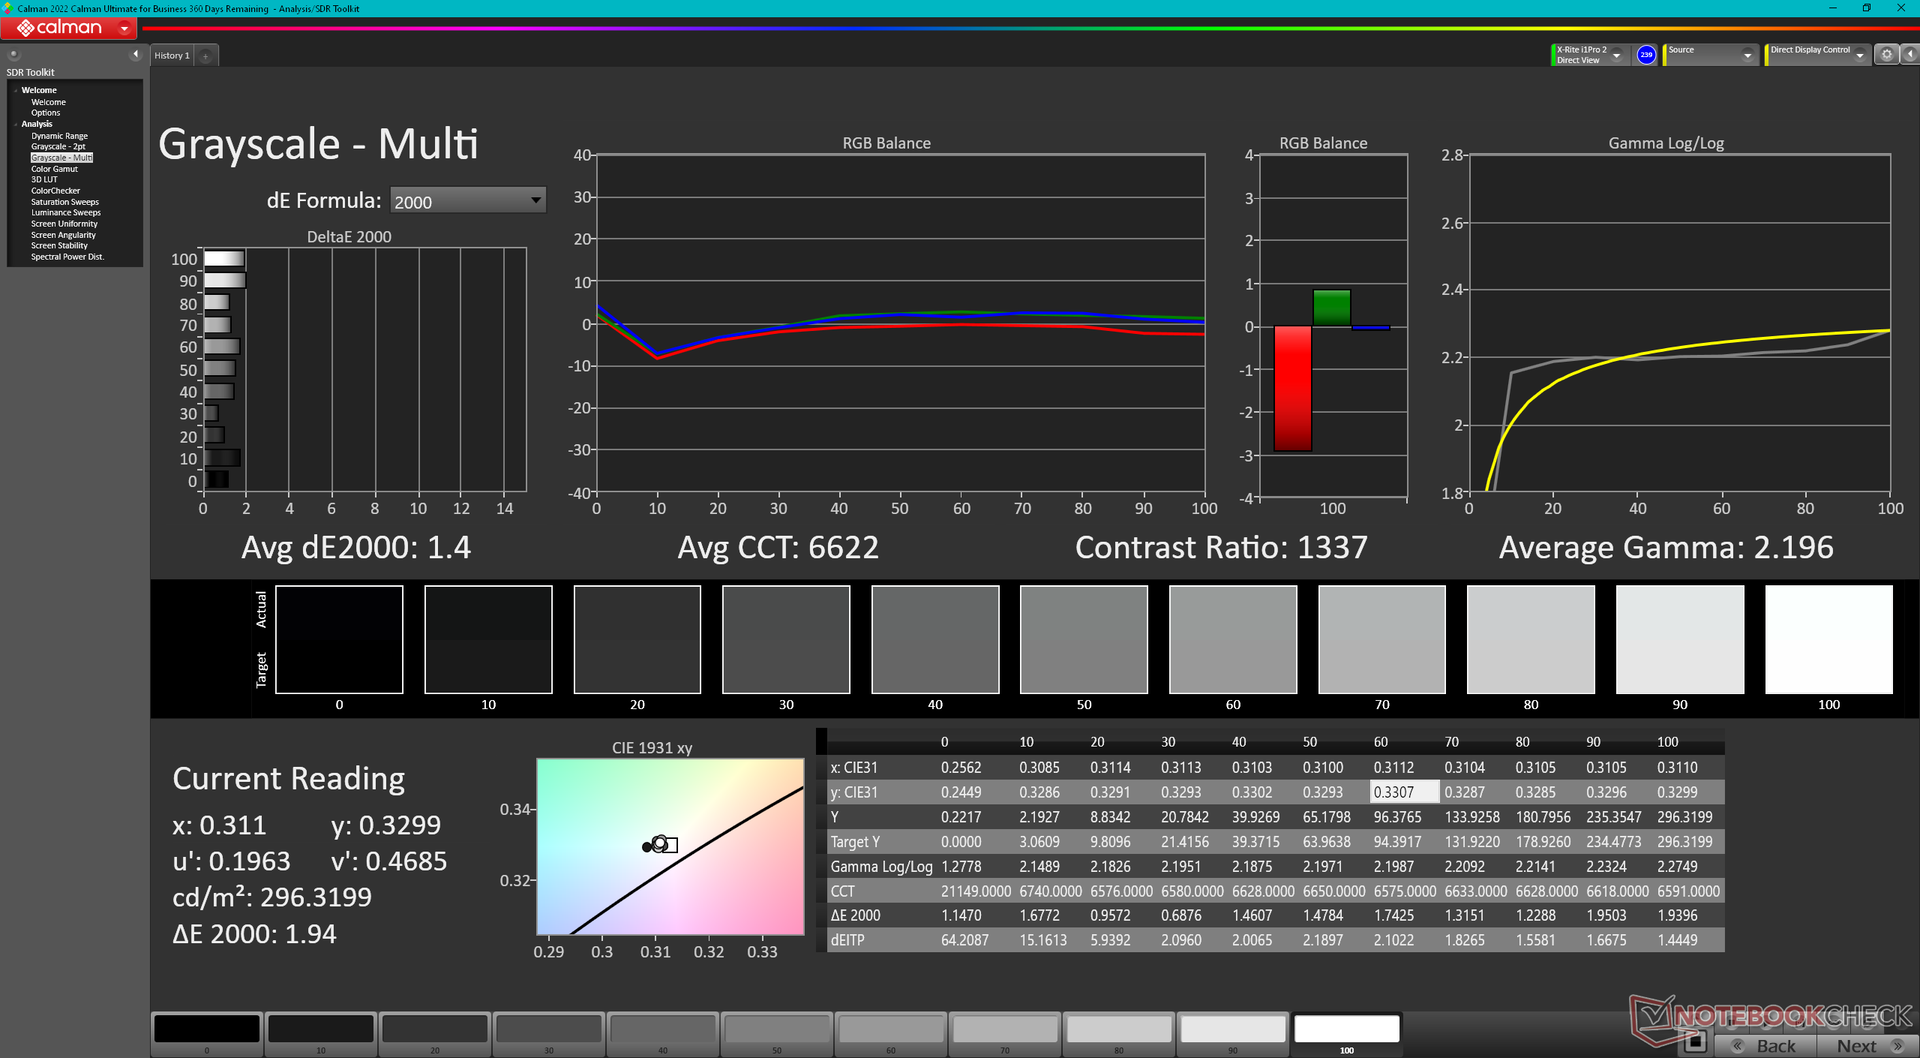
Eurocom kalibrerar skärmen åt dig mot en avgift. Vår testenhet kom okalibrerad med genomsnittliga gråskala- och färgdeltaE-värden på 3,8 respektive 2,35, vilket faktiskt inte är så illa. Att kalibrera panelen själv skulle förbättra dessa medelvärden ytterligare till 1,4 och 1,61. Vår kalibrerade profil kan laddas ner gratis ovan.

Visa svarstider
| ↔ Svarstid svart till vitt | ||
|---|---|---|
| 11.2 ms ... stiga ↗ och falla ↘ kombinerat | ↗ 6 ms stiga | 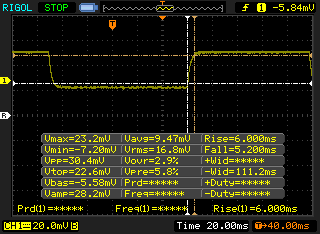 |
| ↘ 5.2 ms hösten | ||
| Skärmen visar bra svarsfrekvens i våra tester, men kan vara för långsam för konkurrenskraftiga spelare. I jämförelse sträcker sig alla testade enheter från 0.1 (minst) till 240 (maximalt) ms. » 30 % av alla enheter är bättre. Det betyder att den uppmätta svarstiden är bättre än genomsnittet av alla testade enheter (19.8 ms). | ||
| ↔ Svarstid 50 % grått till 80 % grått | ||
| 10.4 ms ... stiga ↗ och falla ↘ kombinerat | ↗ 6 ms stiga | 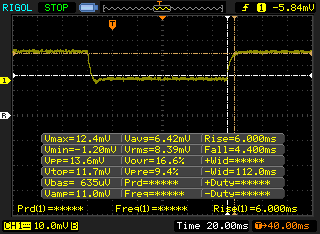 |
| ↘ 4.4 ms hösten | ||
| Skärmen visar bra svarsfrekvens i våra tester, men kan vara för långsam för konkurrenskraftiga spelare. I jämförelse sträcker sig alla testade enheter från 0.165 (minst) till 636 (maximalt) ms. » 24 % av alla enheter är bättre. Det betyder att den uppmätta svarstiden är bättre än genomsnittet av alla testade enheter (30.9 ms). | ||
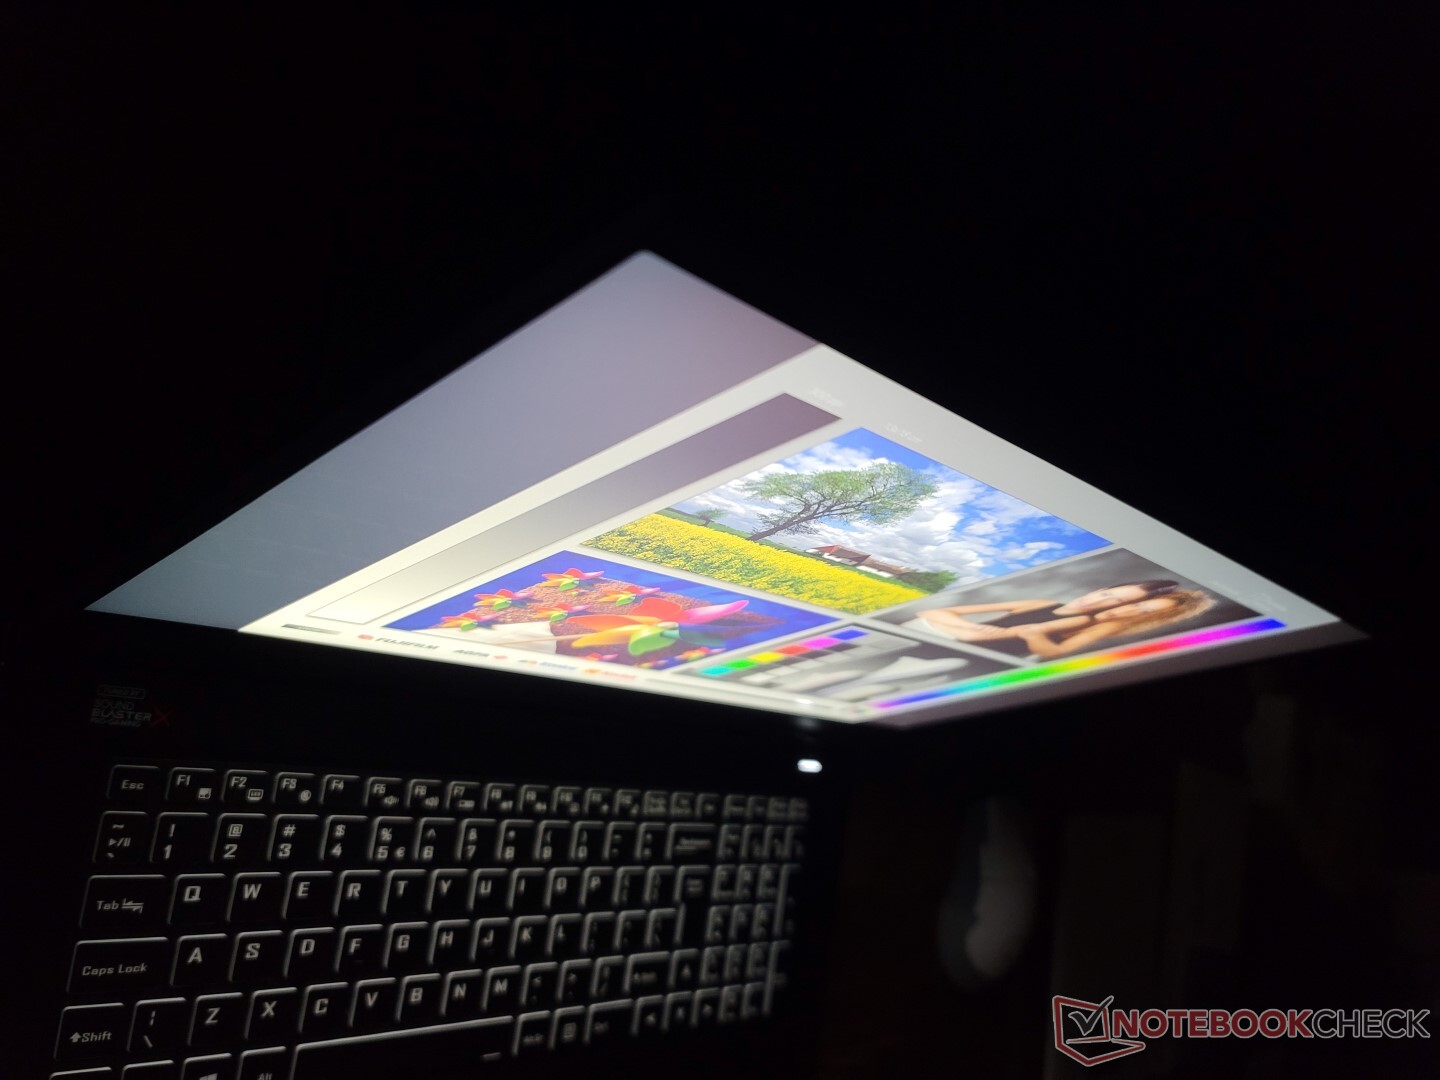
Skärmflimmer / PWM (Puls-Width Modulation)
| Skärmflimmer / PWM upptäcktes inte | 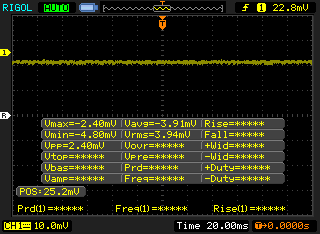 | ||
Som jämförelse: 52 % av alla testade enheter använder inte PWM för att dämpa skärmen. Om PWM upptäcktes mättes ett medelvärde av 7744 (minst: 5 - maximum: 343500) Hz. | |||
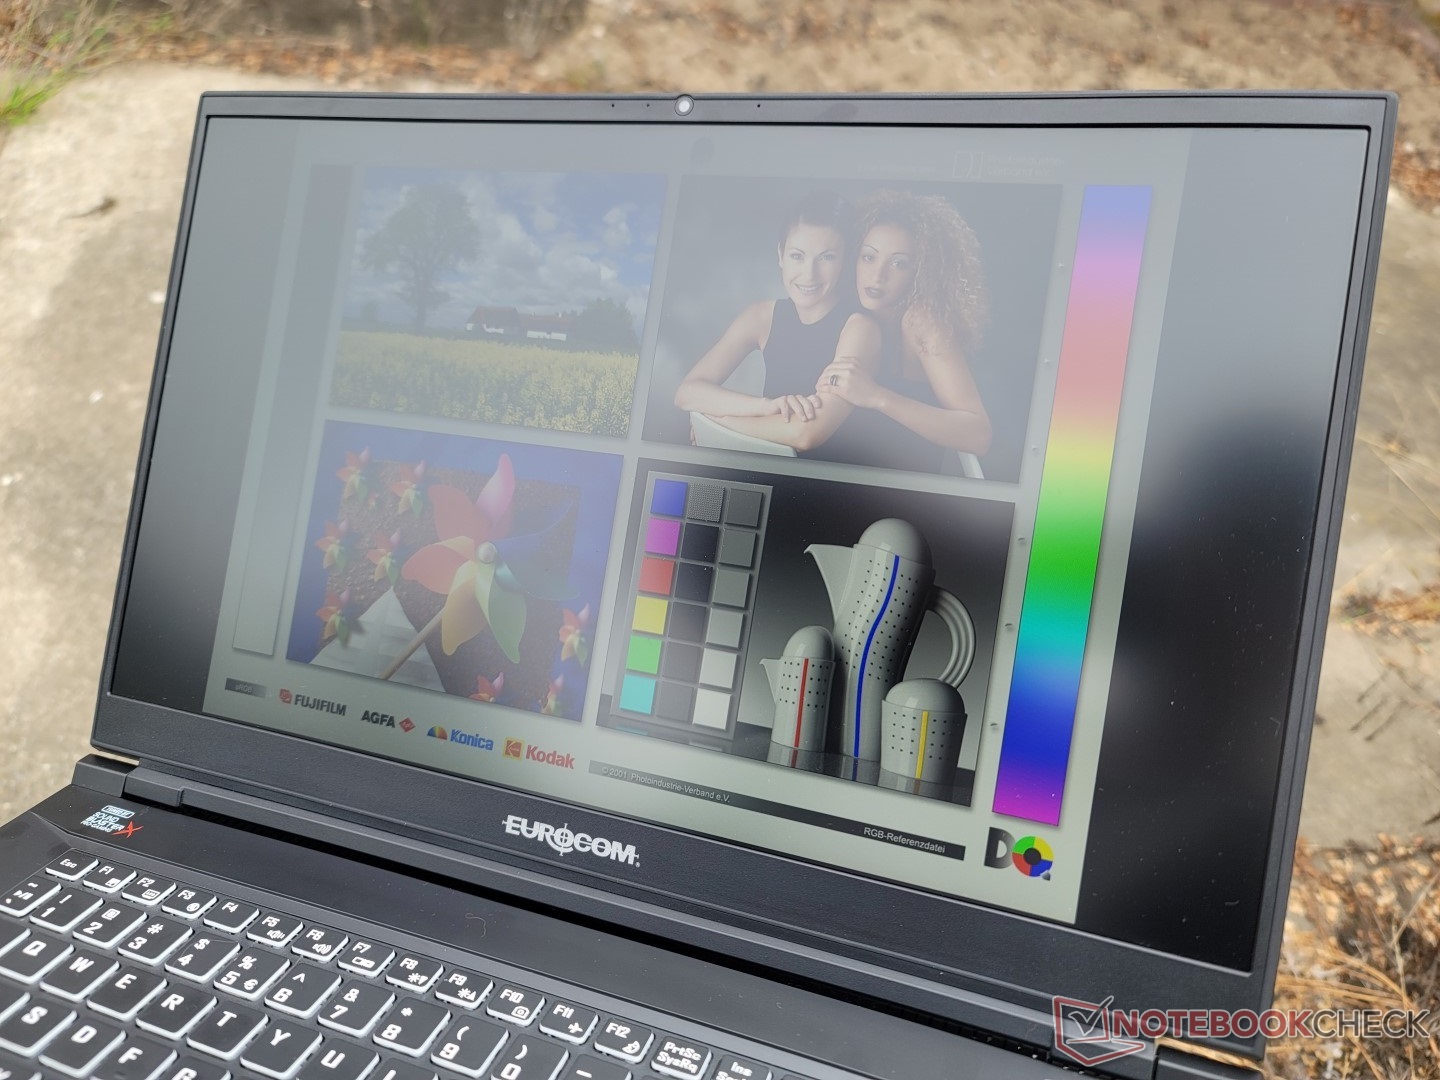
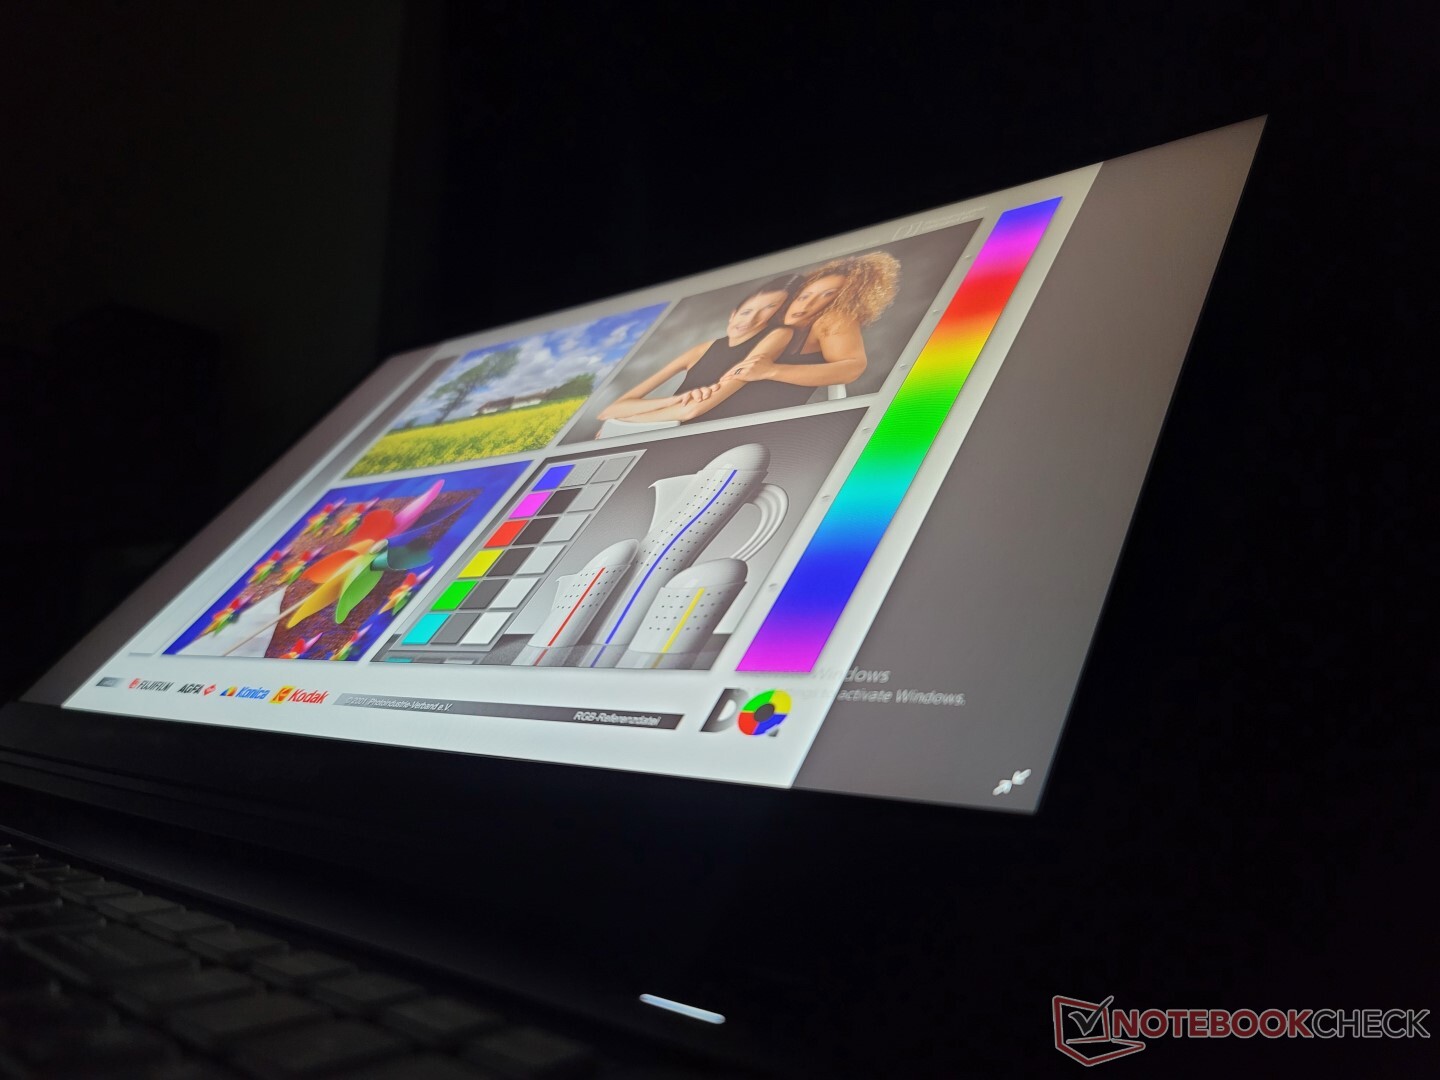
Med 300 nits maximal ljusstyrka är skärmen ungefär genomsnittlig när det gäller synlighet utomhus jämfört med andra bärbara 17-tums gamingdatorer. Några alternativ, som t.ex.Razer Blade 17, har mycket ljusare skärmar på över 500 nits för bättre läsbarhet utomhus.
Prestanda
Provningsförhållanden
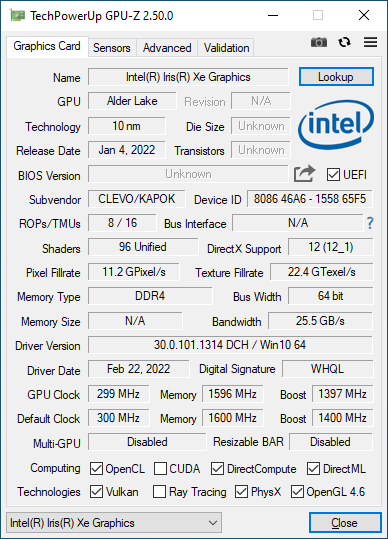
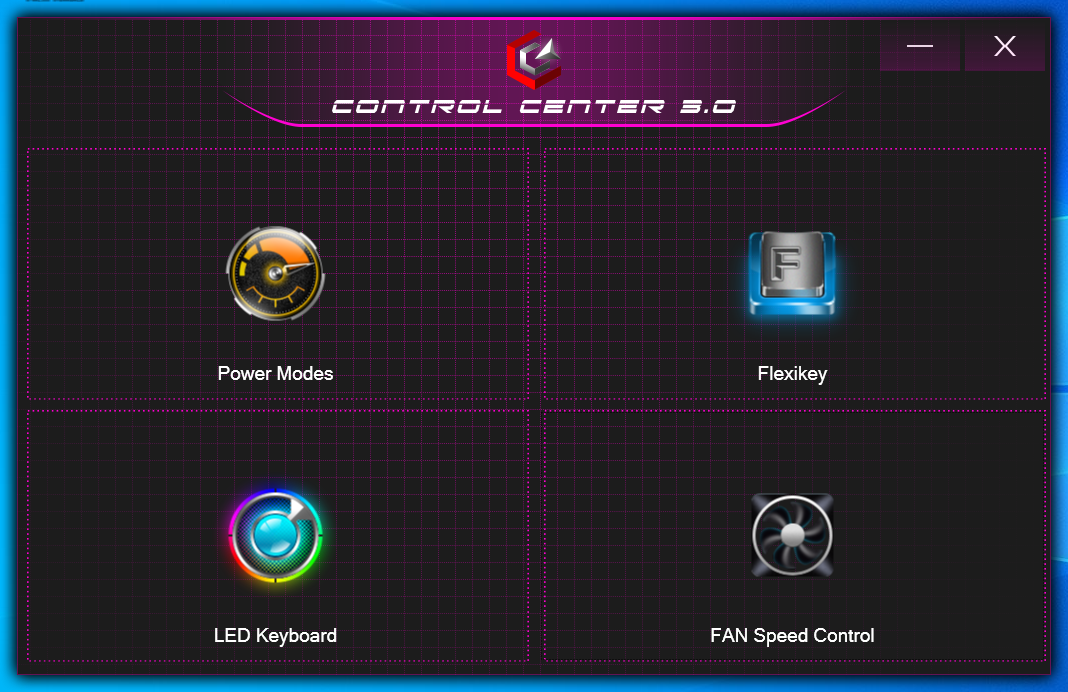
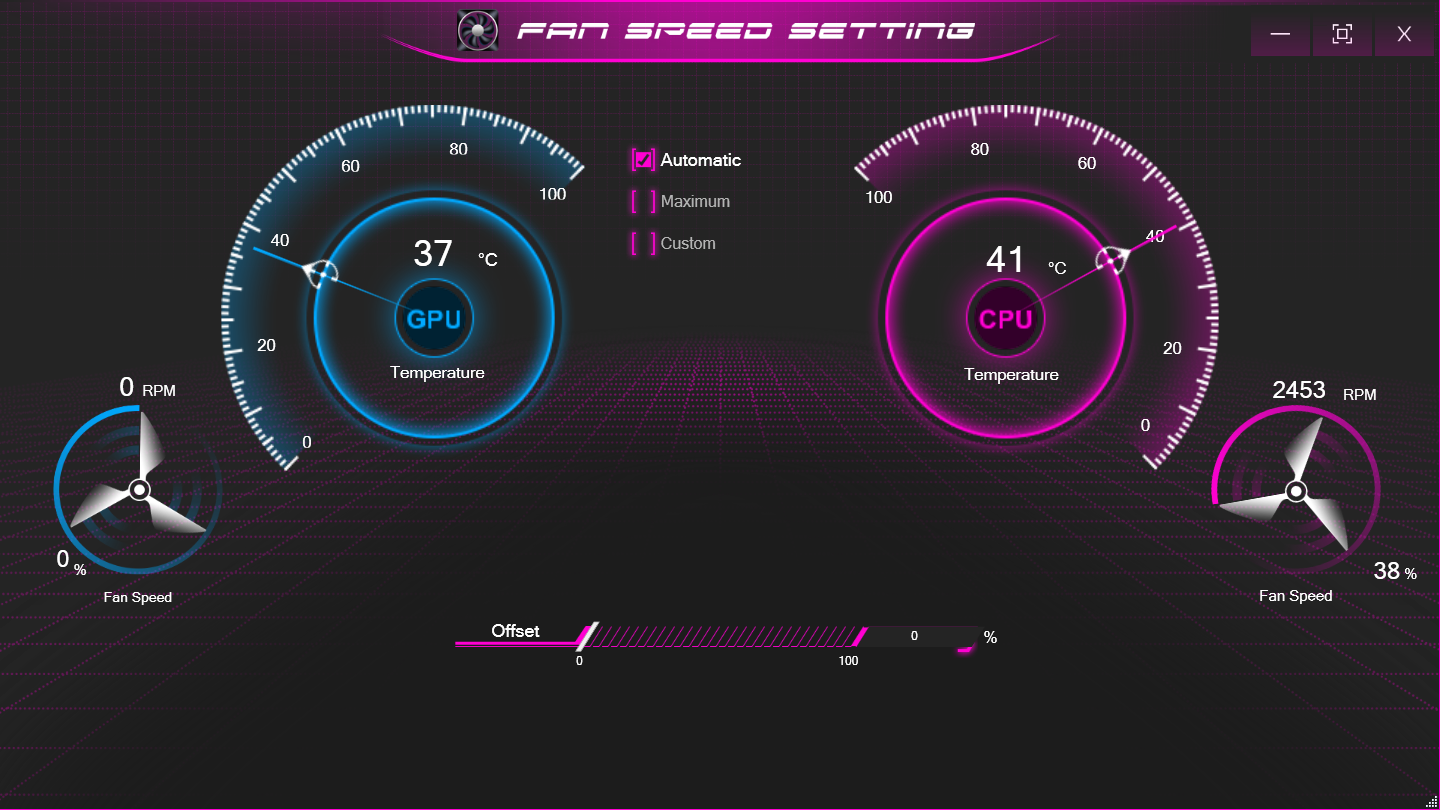
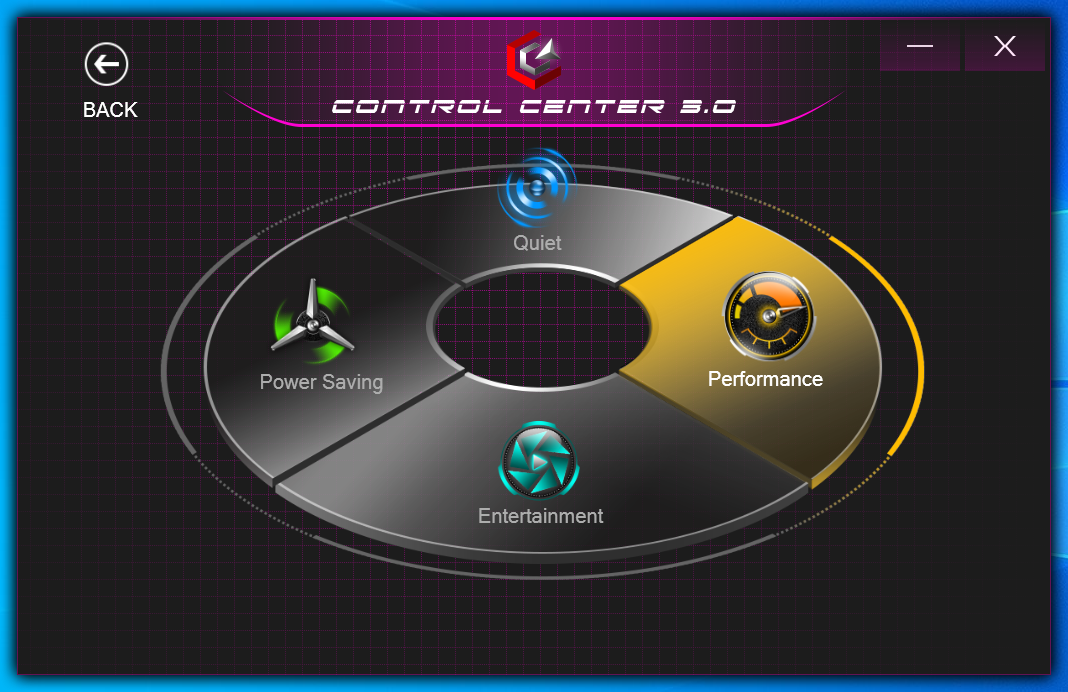
Vår enhet ställdes in i prestandaläge via både Windows och den förinstallerade programvaran Control Center 3.0 innan vi körde några av nedanstående benchmarks för att få högsta möjliga poäng. Vi såg också till att ställa in Nvidia Optimus till diskret grafik; MUX stöds tyvärr inte här.
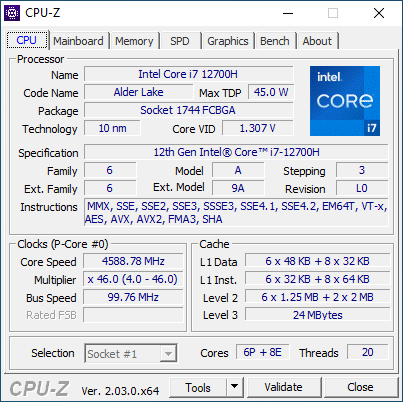
Processor
Den råa prestandan för flera trådar är cirka 10 procent snabbare än den genomsnittliga bärbara datorn i vår databas som är utrustad med samma Core i7-12700H. Processorn i HP Envy 16är till exempel mycket långsammare än vår Eurocom, även efter att ha tagit hänsyn till eventuell prestandadämpning
Uppgradering till Core i9-12900H förväntas öka processorprestandan endast marginellt med cirka 5-10 procent, baserat på våra erfarenheter med Alienware x15 R2 och Schenker XMG Pro 17 E22
CineBench R15 körde inte korrekt på vår enhet, precis som på det senaste Eurocom-systemet som vi recenserade tidigare i år. Vi har kontaktat tillverkaren och de kunde bekräfta våra resultat. Benchmarken har utelämnats för den här recensionen.
Cinebench R23 Multi Loop
Cinebench R23: Multi Core | Single Core
Cinebench R15: CPU Multi 64Bit | CPU Single 64Bit
Blender: v2.79 BMW27 CPU
7-Zip 18.03: 7z b 4 | 7z b 4 -mmt1
Geekbench 5.5: Multi-Core | Single-Core
HWBOT x265 Benchmark v2.2: 4k Preset
LibreOffice : 20 Documents To PDF
R Benchmark 2.5: Overall mean
| Cinebench R20 / CPU (Multi Core) | |
| MSI Raider GE77 HX 12UHS | |
| Alienware x17 R2 P48E | |
| Schenker XMG Pro 17 E22 | |
| Eurocom Nightsky TXi317 | |
| Genomsnitt Intel Core i7-12700H (1576 - 7407, n=64) | |
| Schenker XMG Neo 17 M22 | |
| Alienware x17 RTX 3080 P48E | |
| Razer Blade 17 (i7-12800H, RTX 3070 Ti) | |
| Asus Strix Scar 17 G733QSA-XS99 | |
| Schenker XMG Apex 17 M21 | |
| Razer Blade 17 Early 2022 | |
| Razer Blade Pro 17 2021 (QHD Touch) | |
| Schenker XMG Core 17 (Early 2021) | |
| Cinebench R20 / CPU (Single Core) | |
| MSI Raider GE77 HX 12UHS | |
| Schenker XMG Pro 17 E22 | |
| Alienware x17 R2 P48E | |
| Razer Blade 17 (i7-12800H, RTX 3070 Ti) | |
| Razer Blade 17 Early 2022 | |
| Eurocom Nightsky TXi317 | |
| Genomsnitt Intel Core i7-12700H (300 - 704, n=64) | |
| Schenker XMG Neo 17 M22 | |
| Alienware x17 RTX 3080 P48E | |
| Asus Strix Scar 17 G733QSA-XS99 | |
| Schenker XMG Apex 17 M21 | |
| Razer Blade Pro 17 2021 (QHD Touch) | |
| Schenker XMG Core 17 (Early 2021) | |
| Cinebench R23 / Multi Core | |
| MSI Raider GE77 HX 12UHS | |
| Alienware x17 R2 P48E | |
| Eurocom Nightsky TXi317 | |
| Schenker XMG Pro 17 E22 | |
| Genomsnitt Intel Core i7-12700H (4032 - 19330, n=64) | |
| Razer Blade 17 (i7-12800H, RTX 3070 Ti) | |
| Schenker XMG Neo 17 M22 | |
| Alienware x17 RTX 3080 P48E | |
| Asus Strix Scar 17 G733QSA-XS99 | |
| Schenker XMG Apex 17 M21 | |
| Razer Blade 17 Early 2022 | |
| Razer Blade Pro 17 2021 (QHD Touch) | |
| Schenker XMG Core 17 (Early 2021) | |
| Cinebench R23 / Single Core | |
| Schenker XMG Pro 17 E22 | |
| Razer Blade 17 Early 2022 | |
| MSI Raider GE77 HX 12UHS | |
| Alienware x17 R2 P48E | |
| Razer Blade 17 (i7-12800H, RTX 3070 Ti) | |
| Eurocom Nightsky TXi317 | |
| Genomsnitt Intel Core i7-12700H (778 - 1826, n=63) | |
| Schenker XMG Neo 17 M22 | |
| Alienware x17 RTX 3080 P48E | |
| Asus Strix Scar 17 G733QSA-XS99 | |
| Schenker XMG Apex 17 M21 | |
| Razer Blade Pro 17 2021 (QHD Touch) | |
| Schenker XMG Core 17 (Early 2021) | |
| Cinebench R15 / CPU Multi 64Bit | |
| MSI Raider GE77 HX 12UHS | |
| Alienware x17 R2 P48E | |
| Schenker XMG Pro 17 E22 | |
| Razer Blade 17 (i7-12800H, RTX 3070 Ti) | |
| Genomsnitt Intel Core i7-12700H (1379 - 2916, n=70) | |
| Schenker XMG Neo 17 M22 | |
| Asus Strix Scar 17 G733QSA-XS99 | |
| Alienware x17 RTX 3080 P48E | |
| Schenker XMG Apex 17 M21 | |
| Razer Blade 17 Early 2022 | |
| Razer Blade Pro 17 2021 (QHD Touch) | |
| Schenker XMG Core 17 (Early 2021) | |
| Cinebench R15 / CPU Single 64Bit | |
| MSI Raider GE77 HX 12UHS | |
| Schenker XMG Pro 17 E22 | |
| Alienware x17 R2 P48E | |
| Razer Blade 17 (i7-12800H, RTX 3070 Ti) | |
| Razer Blade 17 Early 2022 | |
| Genomsnitt Intel Core i7-12700H (113 - 263, n=65) | |
| Schenker XMG Neo 17 M22 | |
| Asus Strix Scar 17 G733QSA-XS99 | |
| Schenker XMG Apex 17 M21 | |
| Alienware x17 RTX 3080 P48E | |
| Razer Blade Pro 17 2021 (QHD Touch) | |
| Schenker XMG Core 17 (Early 2021) | |
| Blender / v2.79 BMW27 CPU | |
| Schenker XMG Core 17 (Early 2021) | |
| Razer Blade 17 Early 2022 | |
| Razer Blade Pro 17 2021 (QHD Touch) | |
| Schenker XMG Apex 17 M21 | |
| Asus Strix Scar 17 G733QSA-XS99 | |
| Genomsnitt Intel Core i7-12700H (168 - 732, n=63) | |
| Razer Blade 17 (i7-12800H, RTX 3070 Ti) | |
| Alienware x17 RTX 3080 P48E | |
| Schenker XMG Neo 17 M22 | |
| Schenker XMG Pro 17 E22 | |
| Eurocom Nightsky TXi317 | |
| Alienware x17 R2 P48E | |
| MSI Raider GE77 HX 12UHS | |
| 7-Zip 18.03 / 7z b 4 | |
| MSI Raider GE77 HX 12UHS | |
| Alienware x17 R2 P48E | |
| Eurocom Nightsky TXi317 | |
| Schenker XMG Pro 17 E22 | |
| Schenker XMG Neo 17 M22 | |
| Razer Blade 17 (i7-12800H, RTX 3070 Ti) | |
| Asus Strix Scar 17 G733QSA-XS99 | |
| Genomsnitt Intel Core i7-12700H (22844 - 73067, n=63) | |
| Schenker XMG Apex 17 M21 | |
| Alienware x17 RTX 3080 P48E | |
| Razer Blade 17 Early 2022 | |
| Razer Blade Pro 17 2021 (QHD Touch) | |
| Schenker XMG Core 17 (Early 2021) | |
| 7-Zip 18.03 / 7z b 4 -mmt1 | |
| MSI Raider GE77 HX 12UHS | |
| Schenker XMG Pro 17 E22 | |
| Razer Blade 17 Early 2022 | |
| Eurocom Nightsky TXi317 | |
| Schenker XMG Neo 17 M22 | |
| Alienware x17 R2 P48E | |
| Razer Blade 17 (i7-12800H, RTX 3070 Ti) | |
| Asus Strix Scar 17 G733QSA-XS99 | |
| Genomsnitt Intel Core i7-12700H (2743 - 5972, n=63) | |
| Schenker XMG Apex 17 M21 | |
| Schenker XMG Core 17 (Early 2021) | |
| Alienware x17 RTX 3080 P48E | |
| Razer Blade Pro 17 2021 (QHD Touch) | |
| Geekbench 5.5 / Multi-Core | |
| MSI Raider GE77 HX 12UHS | |
| Alienware x17 R2 P48E | |
| Schenker XMG Pro 17 E22 | |
| Eurocom Nightsky TXi317 | |
| Razer Blade 17 (i7-12800H, RTX 3070 Ti) | |
| Genomsnitt Intel Core i7-12700H (5144 - 13745, n=64) | |
| Schenker XMG Neo 17 M22 | |
| Razer Blade 17 Early 2022 | |
| Schenker XMG Apex 17 M21 | |
| Asus Strix Scar 17 G733QSA-XS99 | |
| Razer Blade Pro 17 2021 (QHD Touch) | |
| Schenker XMG Core 17 (Early 2021) | |
| Geekbench 5.5 / Single-Core | |
| MSI Raider GE77 HX 12UHS | |
| Alienware x17 R2 P48E | |
| Schenker XMG Pro 17 E22 | |
| Razer Blade 17 Early 2022 | |
| Eurocom Nightsky TXi317 | |
| Razer Blade 17 (i7-12800H, RTX 3070 Ti) | |
| Genomsnitt Intel Core i7-12700H (803 - 1851, n=64) | |
| Schenker XMG Neo 17 M22 | |
| Asus Strix Scar 17 G733QSA-XS99 | |
| Schenker XMG Apex 17 M21 | |
| Razer Blade Pro 17 2021 (QHD Touch) | |
| Schenker XMG Core 17 (Early 2021) | |
| HWBOT x265 Benchmark v2.2 / 4k Preset | |
| MSI Raider GE77 HX 12UHS | |
| Alienware x17 R2 P48E | |
| Schenker XMG Pro 17 E22 | |
| Schenker XMG Neo 17 M22 | |
| Alienware x17 RTX 3080 P48E | |
| Asus Strix Scar 17 G733QSA-XS99 | |
| Genomsnitt Intel Core i7-12700H (4.67 - 21.8, n=64) | |
| Eurocom Nightsky TXi317 | |
| Razer Blade 17 (i7-12800H, RTX 3070 Ti) | |
| Schenker XMG Apex 17 M21 | |
| Razer Blade 17 Early 2022 | |
| Razer Blade Pro 17 2021 (QHD Touch) | |
| Schenker XMG Core 17 (Early 2021) | |
| LibreOffice / 20 Documents To PDF | |
| Schenker XMG Core 17 (Early 2021) | |
| Schenker XMG Neo 17 M22 | |
| Schenker XMG Apex 17 M21 | |
| Alienware x17 RTX 3080 P48E | |
| Genomsnitt Intel Core i7-12700H (34.2 - 95.3, n=63) | |
| Asus Strix Scar 17 G733QSA-XS99 | |
| Razer Blade Pro 17 2021 (QHD Touch) | |
| MSI Raider GE77 HX 12UHS | |
| Razer Blade 17 (i7-12800H, RTX 3070 Ti) | |
| Alienware x17 R2 P48E | |
| Eurocom Nightsky TXi317 | |
| Razer Blade 17 Early 2022 | |
| Schenker XMG Pro 17 E22 | |
| R Benchmark 2.5 / Overall mean | |
| Razer Blade Pro 17 2021 (QHD Touch) | |
| Schenker XMG Core 17 (Early 2021) | |
| Alienware x17 RTX 3080 P48E | |
| Schenker XMG Apex 17 M21 | |
| Asus Strix Scar 17 G733QSA-XS99 | |
| Schenker XMG Neo 17 M22 | |
| Genomsnitt Intel Core i7-12700H (0.4441 - 1.052, n=63) | |
| Razer Blade 17 (i7-12800H, RTX 3070 Ti) | |
| Eurocom Nightsky TXi317 | |
| Razer Blade 17 Early 2022 | |
| Schenker XMG Pro 17 E22 | |
| Alienware x17 R2 P48E | |
| MSI Raider GE77 HX 12UHS | |
Cinebench R23: Multi Core | Single Core
Cinebench R15: CPU Multi 64Bit | CPU Single 64Bit
Blender: v2.79 BMW27 CPU
7-Zip 18.03: 7z b 4 | 7z b 4 -mmt1
Geekbench 5.5: Multi-Core | Single-Core
HWBOT x265 Benchmark v2.2: 4k Preset
LibreOffice : 20 Documents To PDF
R Benchmark 2.5: Overall mean
* ... mindre är bättre
AIDA64: FP32 Ray-Trace | FPU Julia | CPU SHA3 | CPU Queen | FPU SinJulia | FPU Mandel | CPU AES | CPU ZLib | FP64 Ray-Trace | CPU PhotoWorxx
| Performance rating | |
| MSI Raider GE77 HX 12UHS | |
| Aorus 17X XES | |
| Eurocom Nightsky TXi317 | |
| Alienware x17 R2 P48E | |
| Genomsnitt Intel Core i7-12700H | |
| Schenker XMG Pro 17 E22 | |
| Razer Blade 17 Early 2022 | |
| AIDA64 / FP32 Ray-Trace | |
| MSI Raider GE77 HX 12UHS | |
| Eurocom Nightsky TXi317 | |
| Aorus 17X XES | |
| Genomsnitt Intel Core i7-12700H (2585 - 17957, n=64) | |
| Alienware x17 R2 P48E | |
| Schenker XMG Pro 17 E22 | |
| Razer Blade 17 Early 2022 | |
| AIDA64 / FPU Julia | |
| MSI Raider GE77 HX 12UHS | |
| Eurocom Nightsky TXi317 | |
| Aorus 17X XES | |
| Genomsnitt Intel Core i7-12700H (12439 - 90760, n=64) | |
| Alienware x17 R2 P48E | |
| Schenker XMG Pro 17 E22 | |
| Razer Blade 17 Early 2022 | |
| AIDA64 / CPU SHA3 | |
| MSI Raider GE77 HX 12UHS | |
| Eurocom Nightsky TXi317 | |
| Aorus 17X XES | |
| Alienware x17 R2 P48E | |
| Genomsnitt Intel Core i7-12700H (833 - 4242, n=64) | |
| Schenker XMG Pro 17 E22 | |
| Razer Blade 17 Early 2022 | |
| AIDA64 / CPU Queen | |
| Alienware x17 R2 P48E | |
| Schenker XMG Pro 17 E22 | |
| Aorus 17X XES | |
| Eurocom Nightsky TXi317 | |
| MSI Raider GE77 HX 12UHS | |
| Genomsnitt Intel Core i7-12700H (57923 - 103202, n=63) | |
| Razer Blade 17 Early 2022 | |
| AIDA64 / FPU SinJulia | |
| MSI Raider GE77 HX 12UHS | |
| Aorus 17X XES | |
| Alienware x17 R2 P48E | |
| Eurocom Nightsky TXi317 | |
| Schenker XMG Pro 17 E22 | |
| Genomsnitt Intel Core i7-12700H (3249 - 9939, n=64) | |
| Razer Blade 17 Early 2022 | |
| AIDA64 / FPU Mandel | |
| MSI Raider GE77 HX 12UHS | |
| Aorus 17X XES | |
| Eurocom Nightsky TXi317 | |
| Genomsnitt Intel Core i7-12700H (7135 - 44760, n=64) | |
| Alienware x17 R2 P48E | |
| Schenker XMG Pro 17 E22 | |
| Razer Blade 17 Early 2022 | |
| AIDA64 / CPU AES | |
| MSI Raider GE77 HX 12UHS | |
| Eurocom Nightsky TXi317 | |
| Aorus 17X XES | |
| Alienware x17 R2 P48E | |
| Schenker XMG Pro 17 E22 | |
| Genomsnitt Intel Core i7-12700H (31839 - 144360, n=64) | |
| Razer Blade 17 Early 2022 | |
| AIDA64 / CPU ZLib | |
| MSI Raider GE77 HX 12UHS | |
| Alienware x17 R2 P48E | |
| Eurocom Nightsky TXi317 | |
| Schenker XMG Pro 17 E22 | |
| Aorus 17X XES | |
| Genomsnitt Intel Core i7-12700H (305 - 1171, n=64) | |
| Razer Blade 17 Early 2022 | |
| AIDA64 / FP64 Ray-Trace | |
| MSI Raider GE77 HX 12UHS | |
| Aorus 17X XES | |
| Eurocom Nightsky TXi317 | |
| Genomsnitt Intel Core i7-12700H (1437 - 9692, n=64) | |
| Alienware x17 R2 P48E | |
| Schenker XMG Pro 17 E22 | |
| Razer Blade 17 Early 2022 | |
| AIDA64 / CPU PhotoWorxx | |
| MSI Raider GE77 HX 12UHS | |
| Aorus 17X XES | |
| Razer Blade 17 Early 2022 | |
| Alienware x17 R2 P48E | |
| Genomsnitt Intel Core i7-12700H (12863 - 52207, n=64) | |
| Eurocom Nightsky TXi317 | |
| Schenker XMG Pro 17 E22 | |
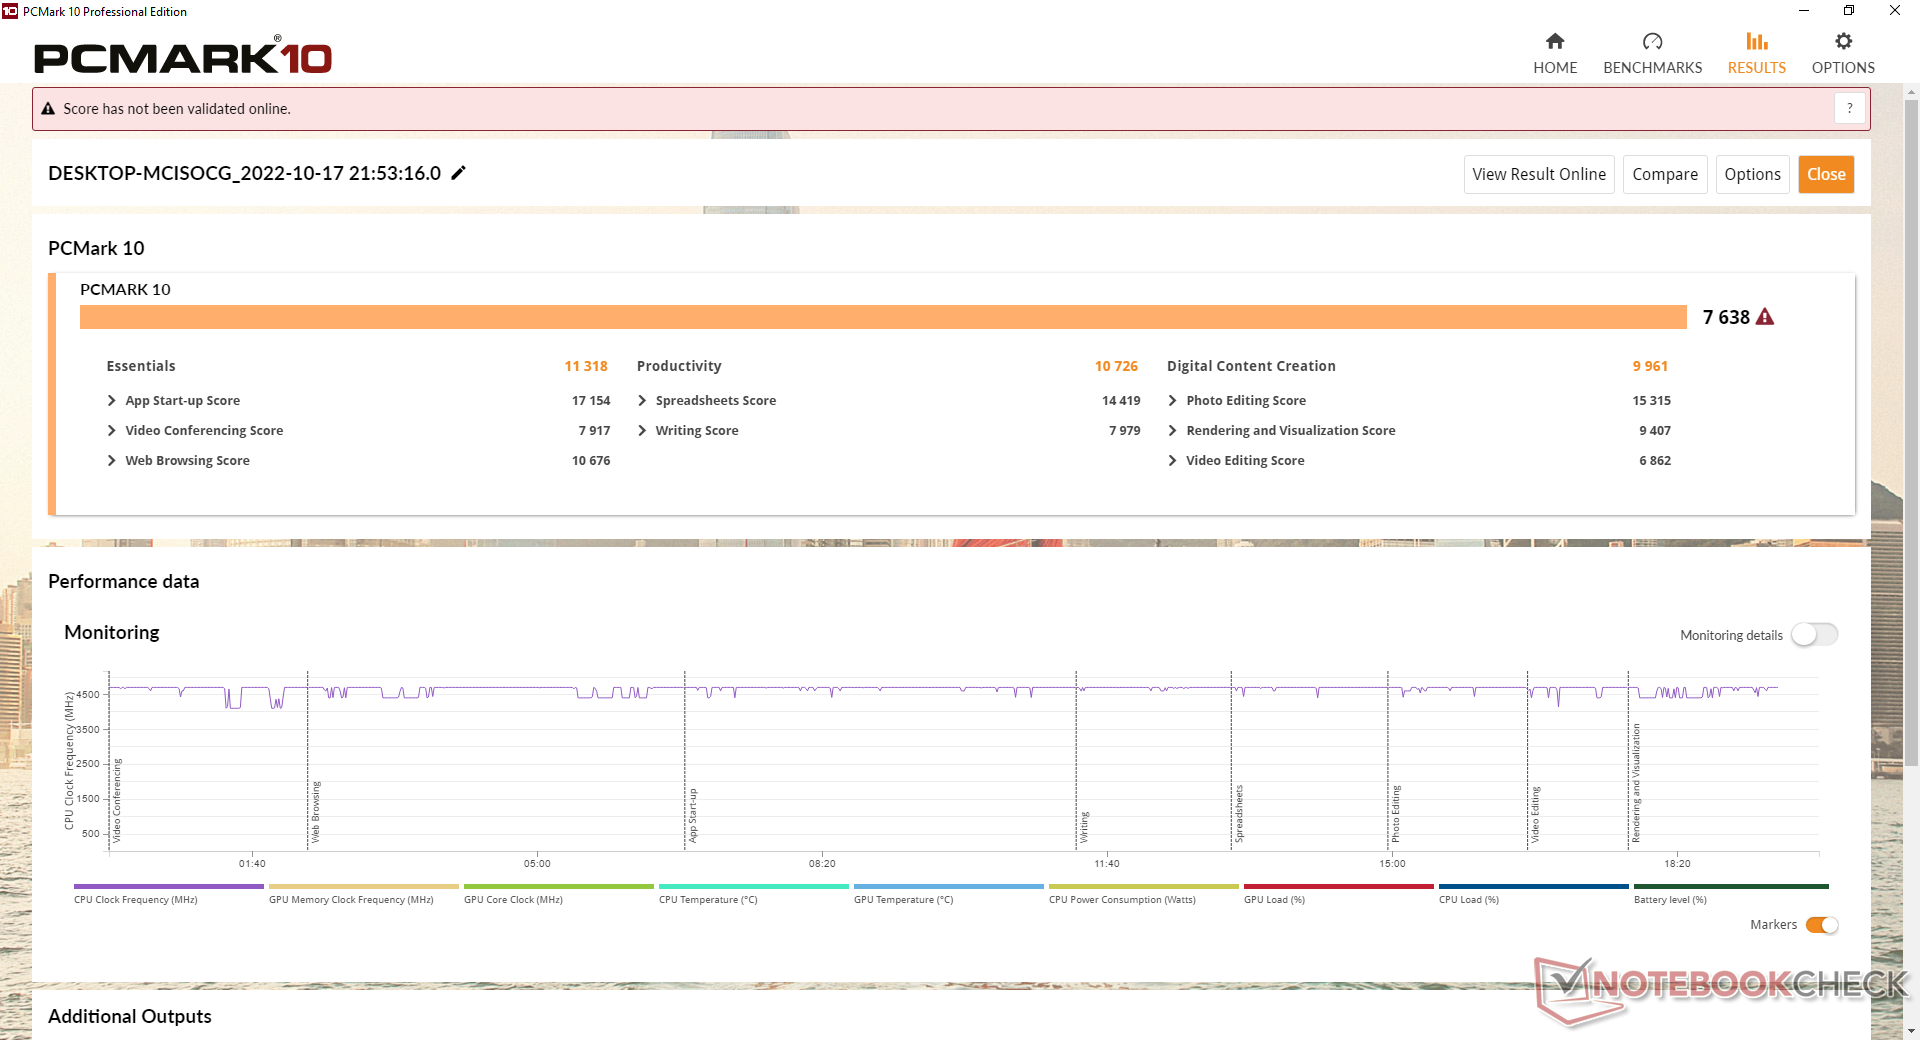
Systemets prestanda
CrossMark: Overall | Productivity | Creativity | Responsiveness
| PCMark 10 / Score | |
| Alienware x17 R2 P48E | |
| Aorus 17X XES | |
| Schenker XMG Pro 17 E22 | |
| Eurocom Nightsky TXi317 | |
| Genomsnitt Intel Core i7-12700H, NVIDIA GeForce RTX 3080 Ti Laptop GPU (6868 - 7638, n=7) | |
| Razer Blade 17 Early 2022 | |
| MSI Raider GE77 HX 12UHS | |
| PCMark 10 / Essentials | |
| Eurocom Nightsky TXi317 | |
| Alienware x17 R2 P48E | |
| Schenker XMG Pro 17 E22 | |
| Aorus 17X XES | |
| Genomsnitt Intel Core i7-12700H, NVIDIA GeForce RTX 3080 Ti Laptop GPU (9987 - 11318, n=7) | |
| Razer Blade 17 Early 2022 | |
| MSI Raider GE77 HX 12UHS | |
| PCMark 10 / Productivity | |
| Eurocom Nightsky TXi317 | |
| Aorus 17X XES | |
| Schenker XMG Pro 17 E22 | |
| Alienware x17 R2 P48E | |
| MSI Raider GE77 HX 12UHS | |
| Genomsnitt Intel Core i7-12700H, NVIDIA GeForce RTX 3080 Ti Laptop GPU (8944 - 10726, n=7) | |
| Razer Blade 17 Early 2022 | |
| PCMark 10 / Digital Content Creation | |
| Alienware x17 R2 P48E | |
| Aorus 17X XES | |
| Schenker XMG Pro 17 E22 | |
| Genomsnitt Intel Core i7-12700H, NVIDIA GeForce RTX 3080 Ti Laptop GPU (8956 - 12249, n=7) | |
| Razer Blade 17 Early 2022 | |
| Eurocom Nightsky TXi317 | |
| MSI Raider GE77 HX 12UHS | |
| CrossMark / Overall | |
| MSI Raider GE77 HX 12UHS | |
| Aorus 17X XES | |
| Alienware x17 R2 P48E | |
| Eurocom Nightsky TXi317 | |
| Genomsnitt Intel Core i7-12700H, NVIDIA GeForce RTX 3080 Ti Laptop GPU (1761 - 1861, n=4) | |
| Razer Blade 17 Early 2022 | |
| CrossMark / Productivity | |
| MSI Raider GE77 HX 12UHS | |
| Aorus 17X XES | |
| Alienware x17 R2 P48E | |
| Eurocom Nightsky TXi317 | |
| Razer Blade 17 Early 2022 | |
| Genomsnitt Intel Core i7-12700H, NVIDIA GeForce RTX 3080 Ti Laptop GPU (1645 - 1800, n=4) | |
| CrossMark / Creativity | |
| MSI Raider GE77 HX 12UHS | |
| Aorus 17X XES | |
| Alienware x17 R2 P48E | |
| Genomsnitt Intel Core i7-12700H, NVIDIA GeForce RTX 3080 Ti Laptop GPU (1936 - 2041, n=4) | |
| Eurocom Nightsky TXi317 | |
| Razer Blade 17 Early 2022 | |
| CrossMark / Responsiveness | |
| Aorus 17X XES | |
| MSI Raider GE77 HX 12UHS | |
| Eurocom Nightsky TXi317 | |
| Alienware x17 R2 P48E | |
| Genomsnitt Intel Core i7-12700H, NVIDIA GeForce RTX 3080 Ti Laptop GPU (1461 - 1868, n=4) | |
| Razer Blade 17 Early 2022 | |
| PCMark 10 Score | 7638 poäng | |
Hjälp | ||
| AIDA64 / Memory Copy | |
| MSI Raider GE77 HX 12UHS | |
| Aorus 17X XES | |
| Razer Blade 17 Early 2022 | |
| Alienware x17 R2 P48E | |
| Genomsnitt Intel Core i7-12700H (25615 - 80511, n=64) | |
| Eurocom Nightsky TXi317 | |
| Schenker XMG Pro 17 E22 | |
| AIDA64 / Memory Read | |
| MSI Raider GE77 HX 12UHS | |
| Aorus 17X XES | |
| Razer Blade 17 Early 2022 | |
| Alienware x17 R2 P48E | |
| Genomsnitt Intel Core i7-12700H (25586 - 79442, n=64) | |
| Eurocom Nightsky TXi317 | |
| Schenker XMG Pro 17 E22 | |
| AIDA64 / Memory Write | |
| MSI Raider GE77 HX 12UHS | |
| Aorus 17X XES | |
| Razer Blade 17 Early 2022 | |
| Genomsnitt Intel Core i7-12700H (23679 - 88660, n=64) | |
| Alienware x17 R2 P48E | |
| Eurocom Nightsky TXi317 | |
| Schenker XMG Pro 17 E22 | |
| AIDA64 / Memory Latency | |
| Alienware x17 R2 P48E | |
| Schenker XMG Pro 17 E22 | |
| Eurocom Nightsky TXi317 | |
| Aorus 17X XES | |
| MSI Raider GE77 HX 12UHS | |
| Genomsnitt Intel Core i7-12700H (76.2 - 133.9, n=62) | |
* ... mindre är bättre
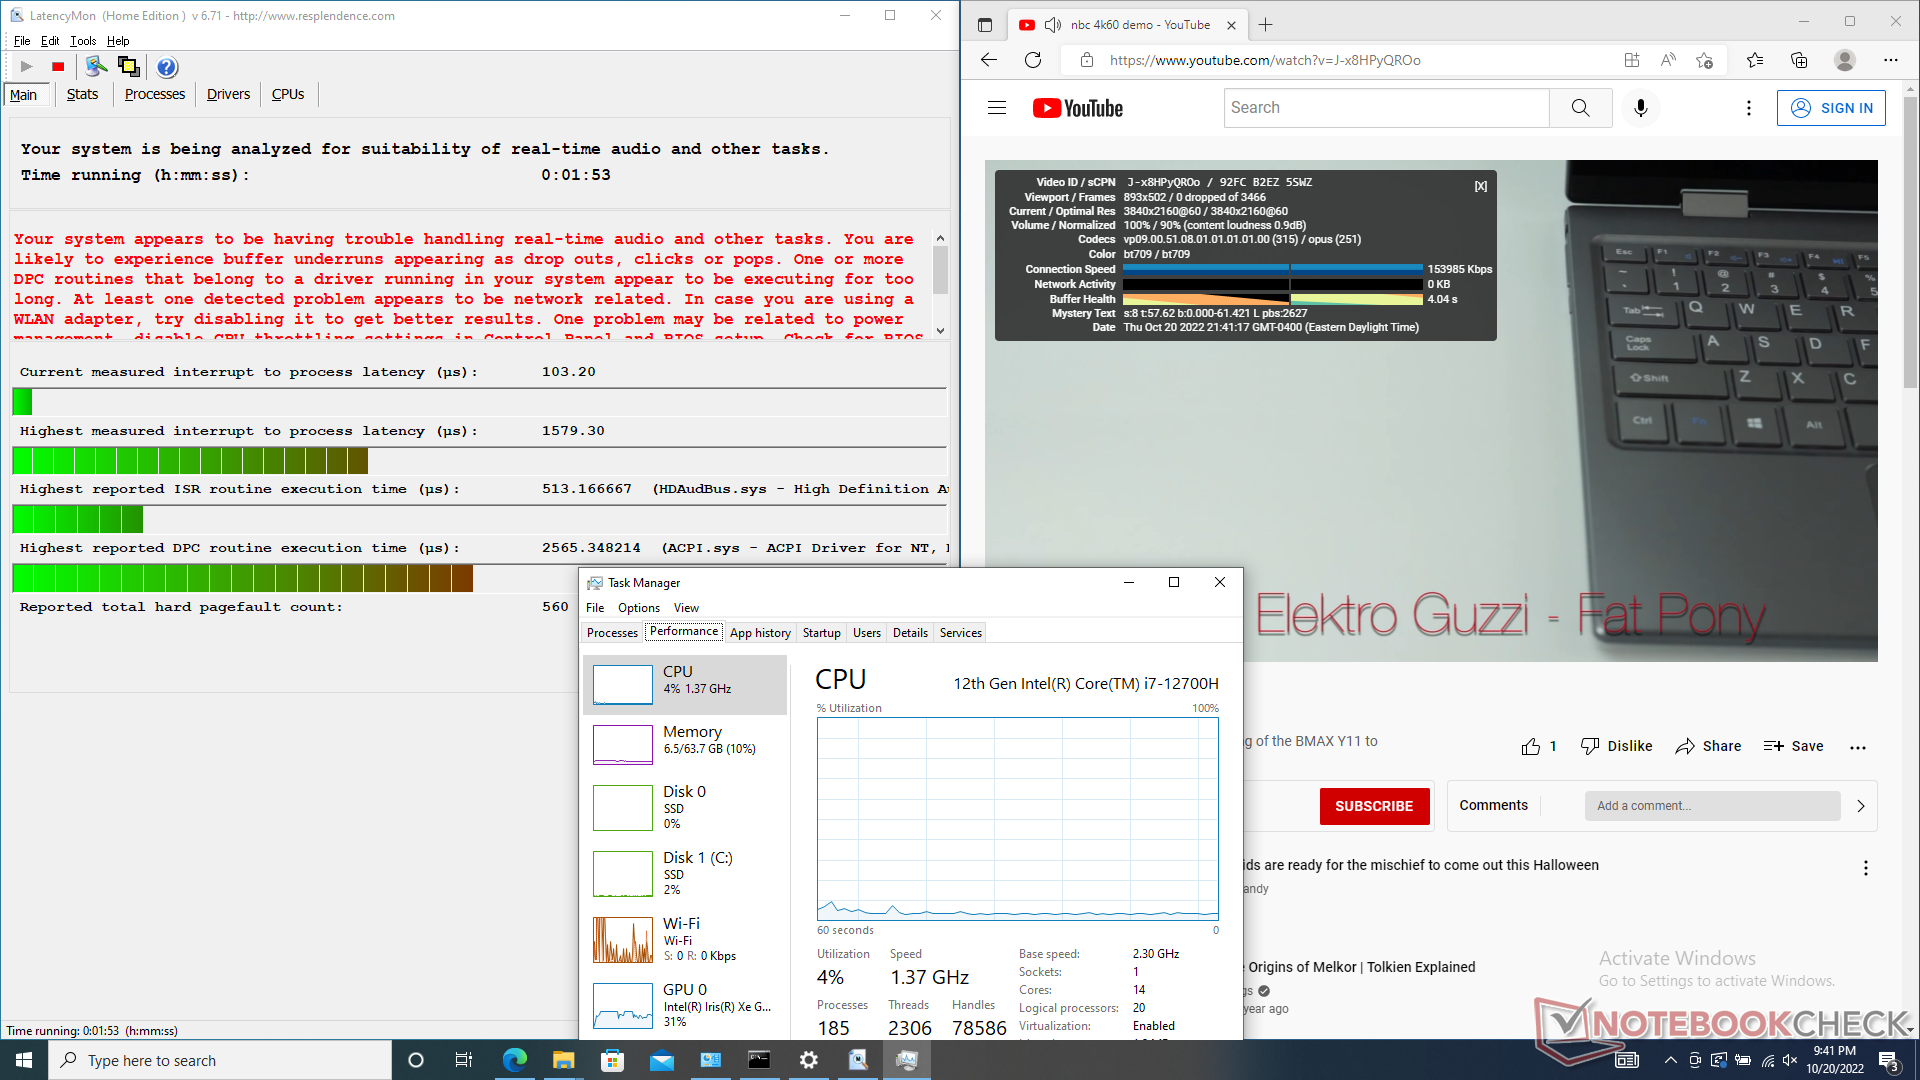
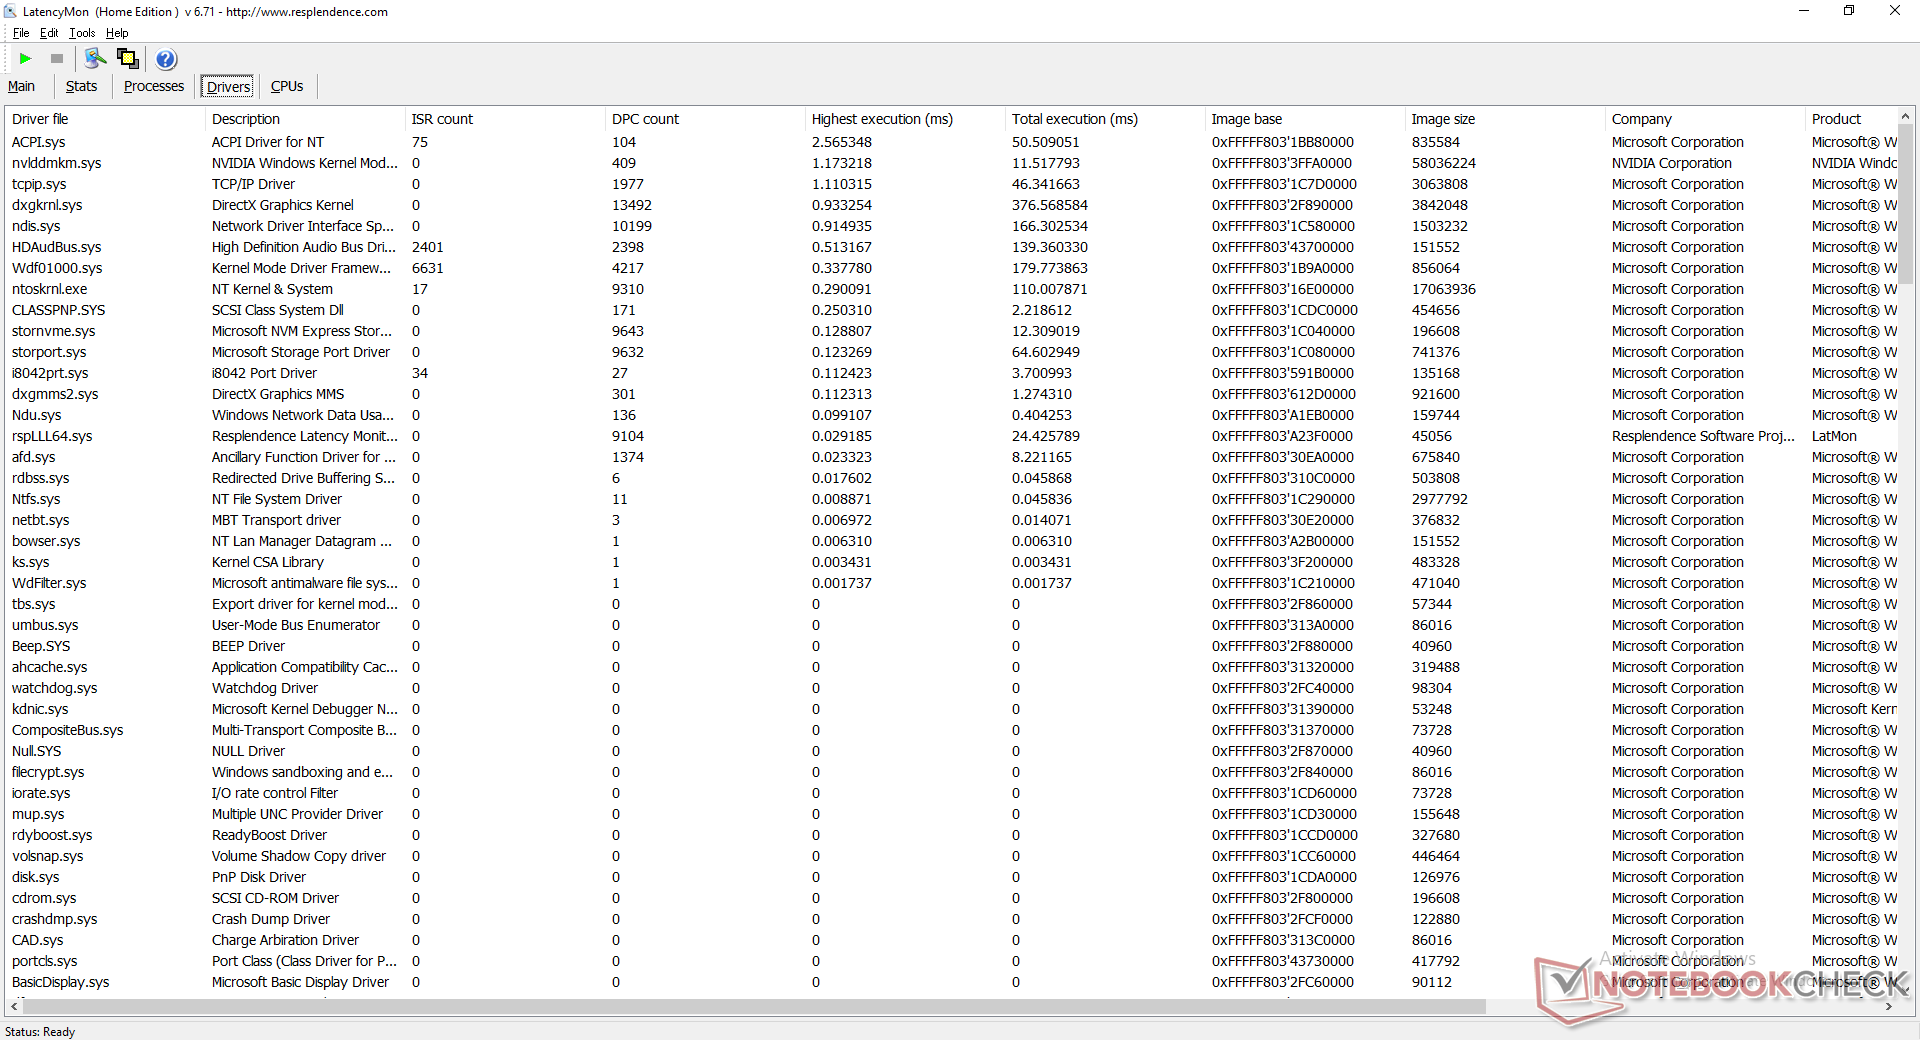
DPC-latenstid
LatencyMon avslöjar DPC-problem när man öppnar flera webbläsarflikar på vår hemsida. uppspelning av 4K-video vid 60 FPS är annars perfekt utan några tappade bilder.
| DPC Latencies / LatencyMon - interrupt to process latency (max), Web, Youtube, Prime95 | |
| MSI Raider GE77 HX 12UHS | |
| Eurocom Nightsky TXi317 | |
| Aorus 17X XES | |
| Alienware x17 R2 P48E | |
| Schenker XMG Pro 17 E22 | |
| Razer Blade 17 Early 2022 | |
* ... mindre är bättre
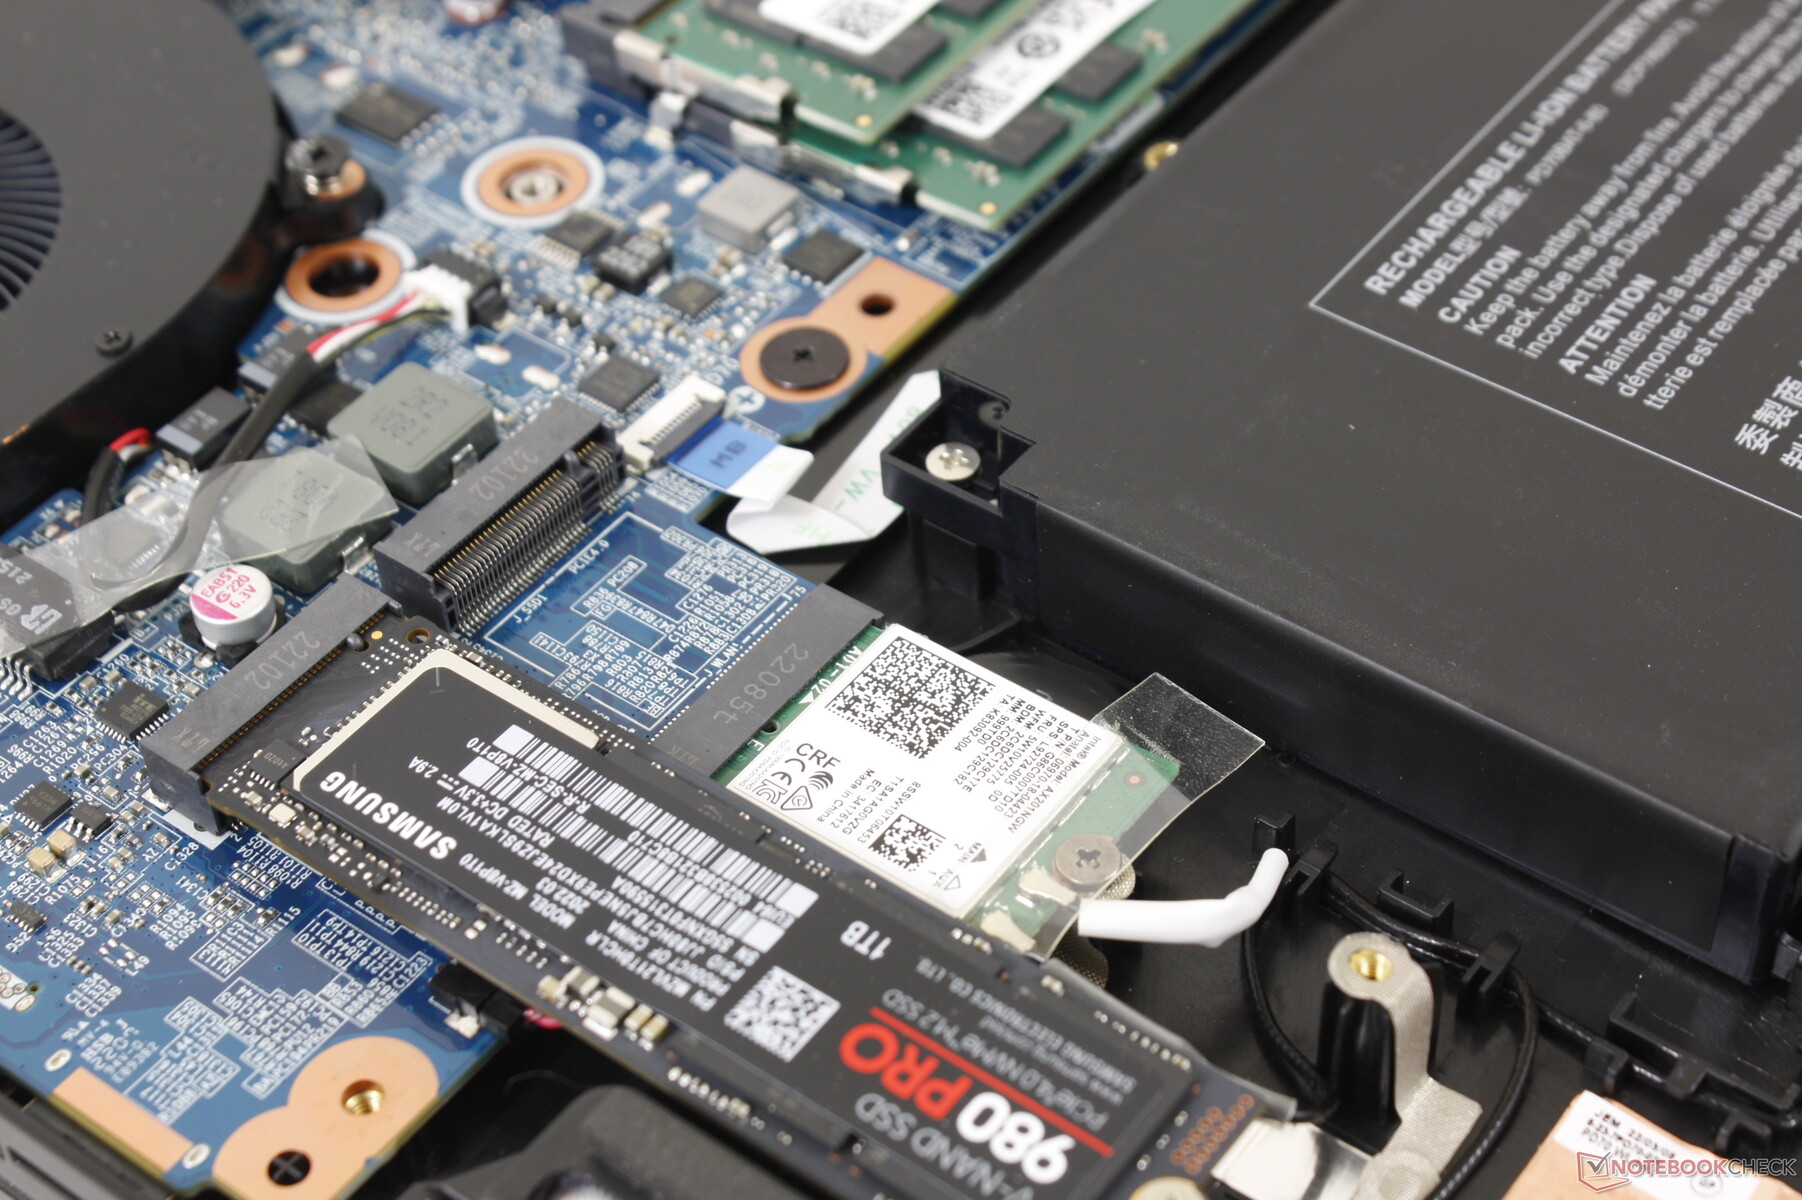
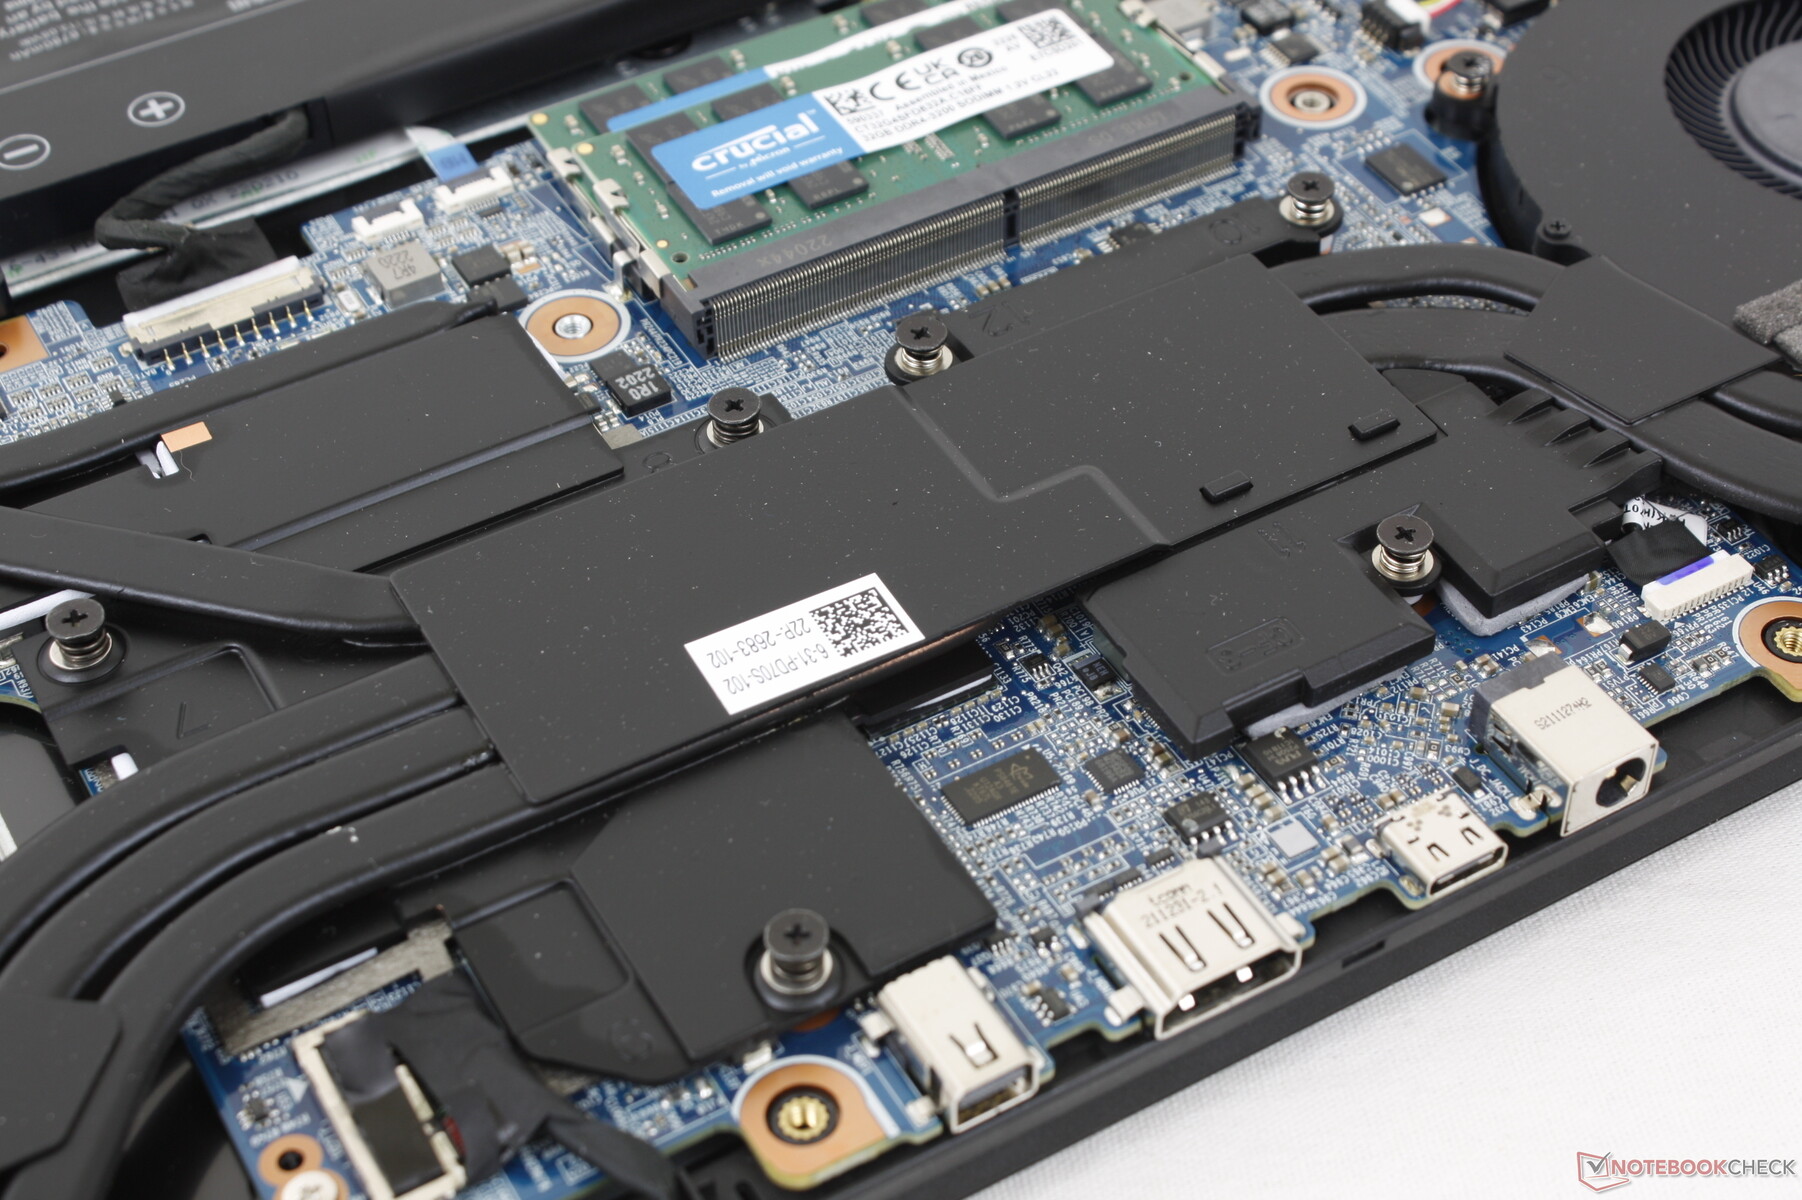
Lagringsenheter
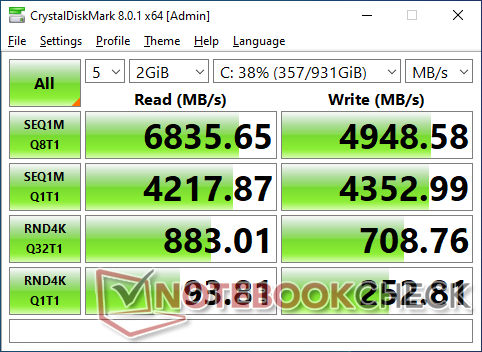
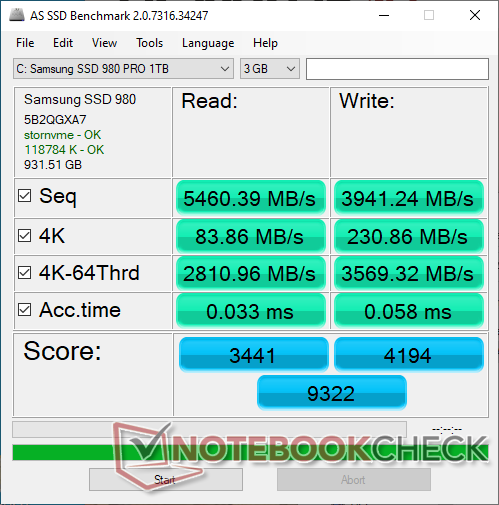
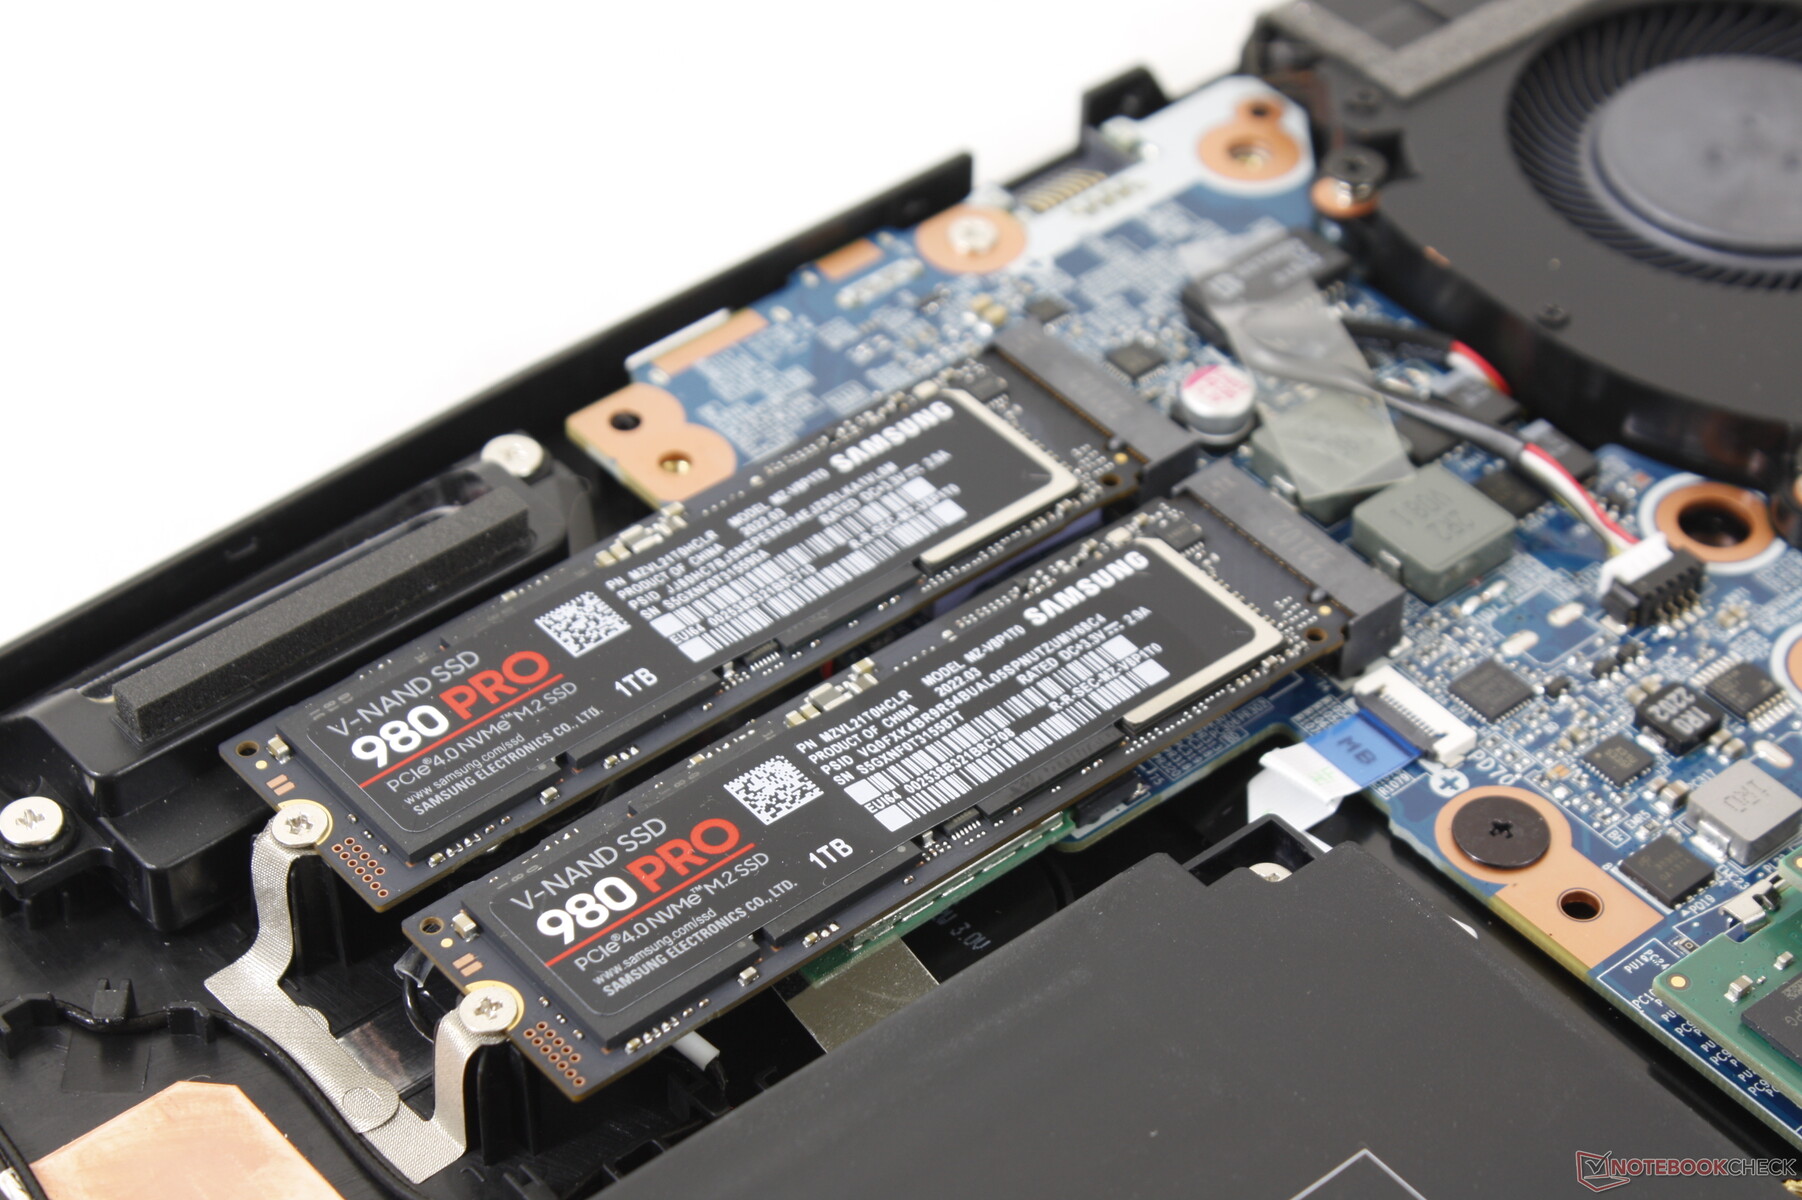
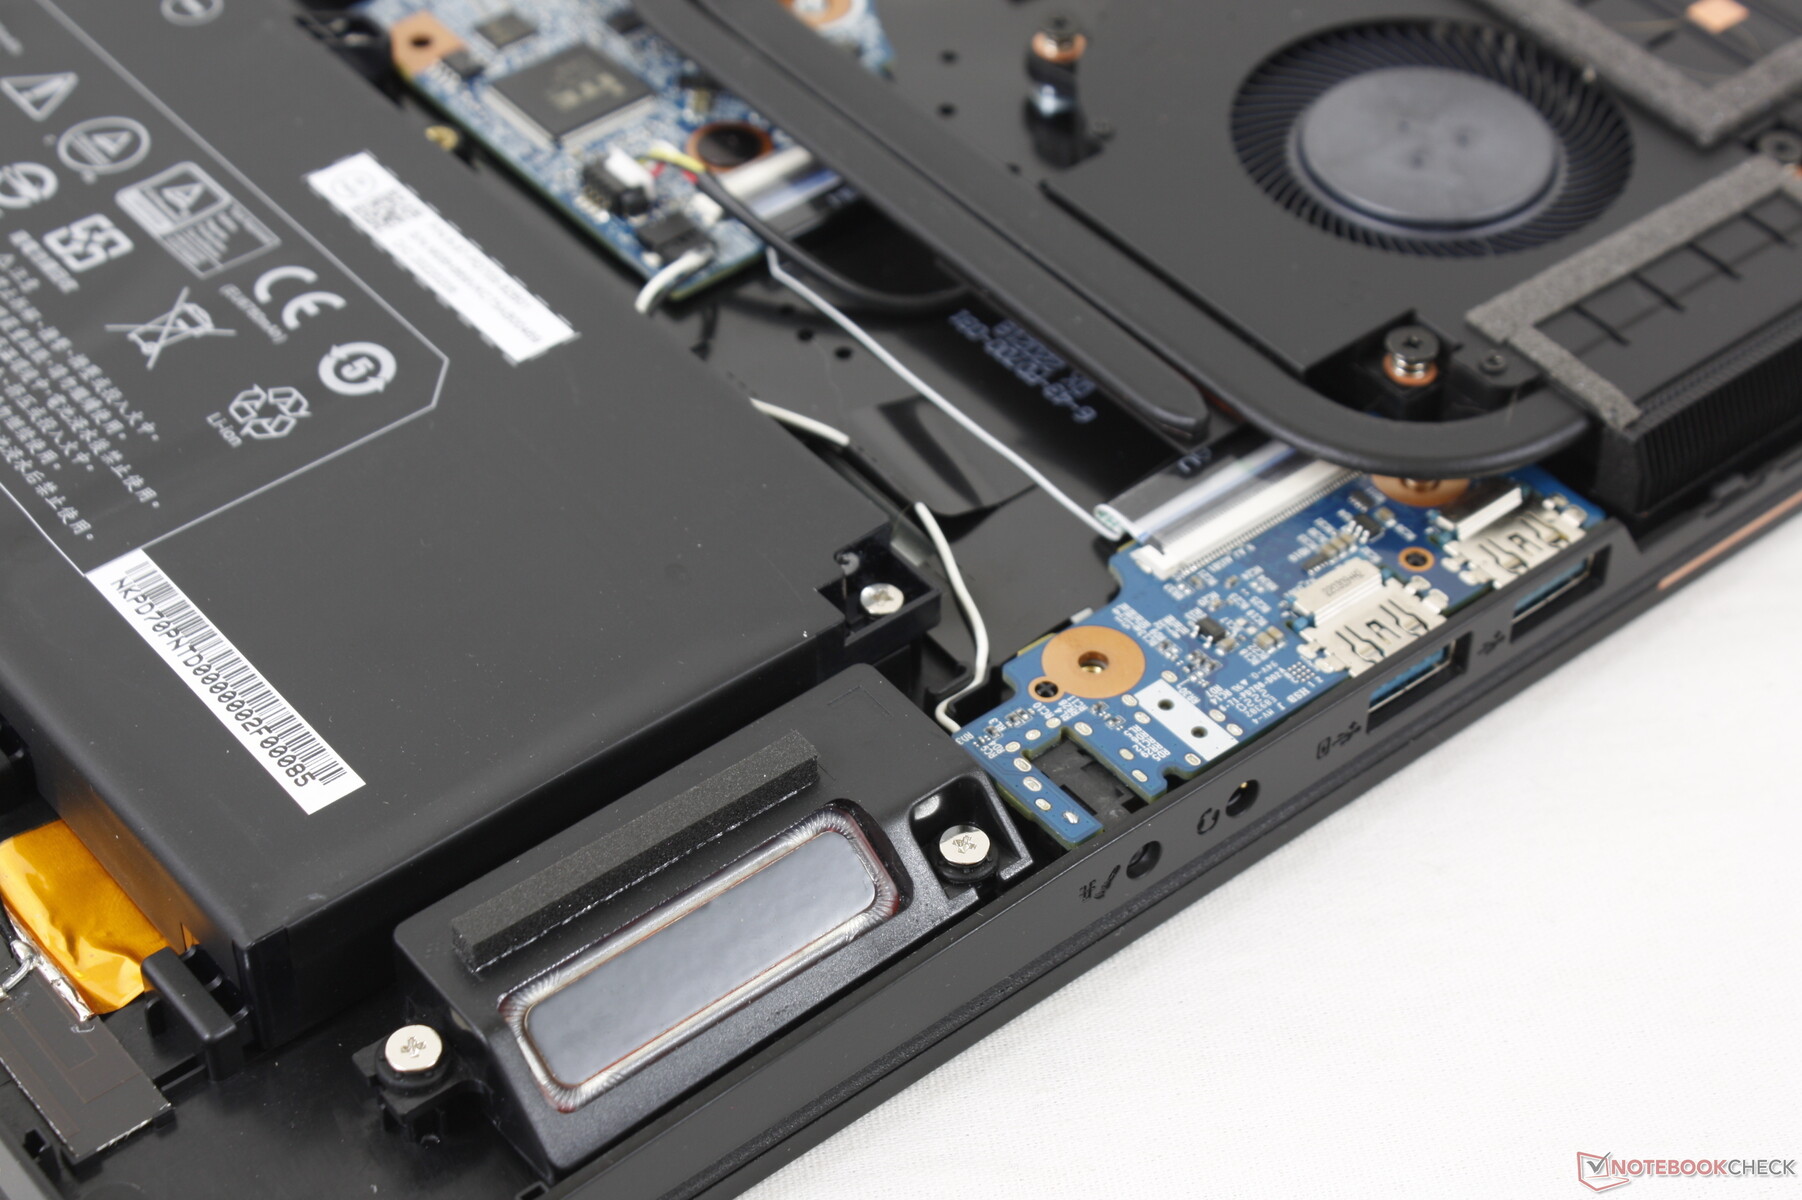
De två interna M.2 2280-fackplatserna kan vardera stödja PCIe4 x4 SSD-diskar för galna hastigheter, åtminstone i teorin. I verkligheten är det dock troligt att enheterna kommer att strypa eftersom chassit inte har någon inbyggd värmespridare för SSD-enheterna. 1 TB Samsung 980 Pro PCIe4 x4 NVMe SSD i vår testenhet skulle sjunka till 1400 MB/s från en ursprunglig toppnotering på 6800 MB/s när DiskSpd kördes i en slinga, vilket visas i diagrammet nedan. Sådana resultat är i allmänhet acceptabla för bärbara speldatorer med låg budget, men de är en besvikelse att se på avancerade maskiner som denna.

| Drive Performance rating - Percent | |
| MSI Raider GE77 HX 12UHS | |
| Eurocom Nightsky TXi317 | |
| Aorus 17X XES | |
| Schenker XMG Pro 17 E22 | |
| Razer Blade 17 Early 2022 | |
| Alienware x17 R2 P48E | |
* ... mindre är bättre
Disk Throttling: DiskSpd Read Loop, Queue Depth 8
GPU-prestanda
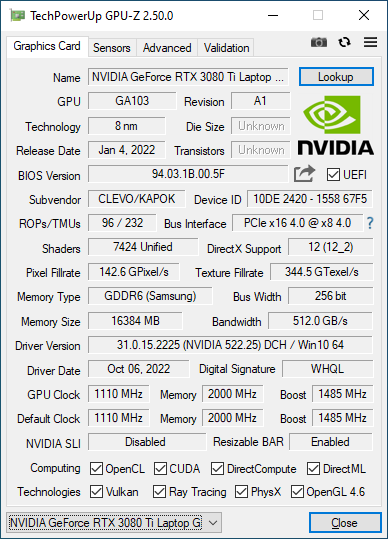
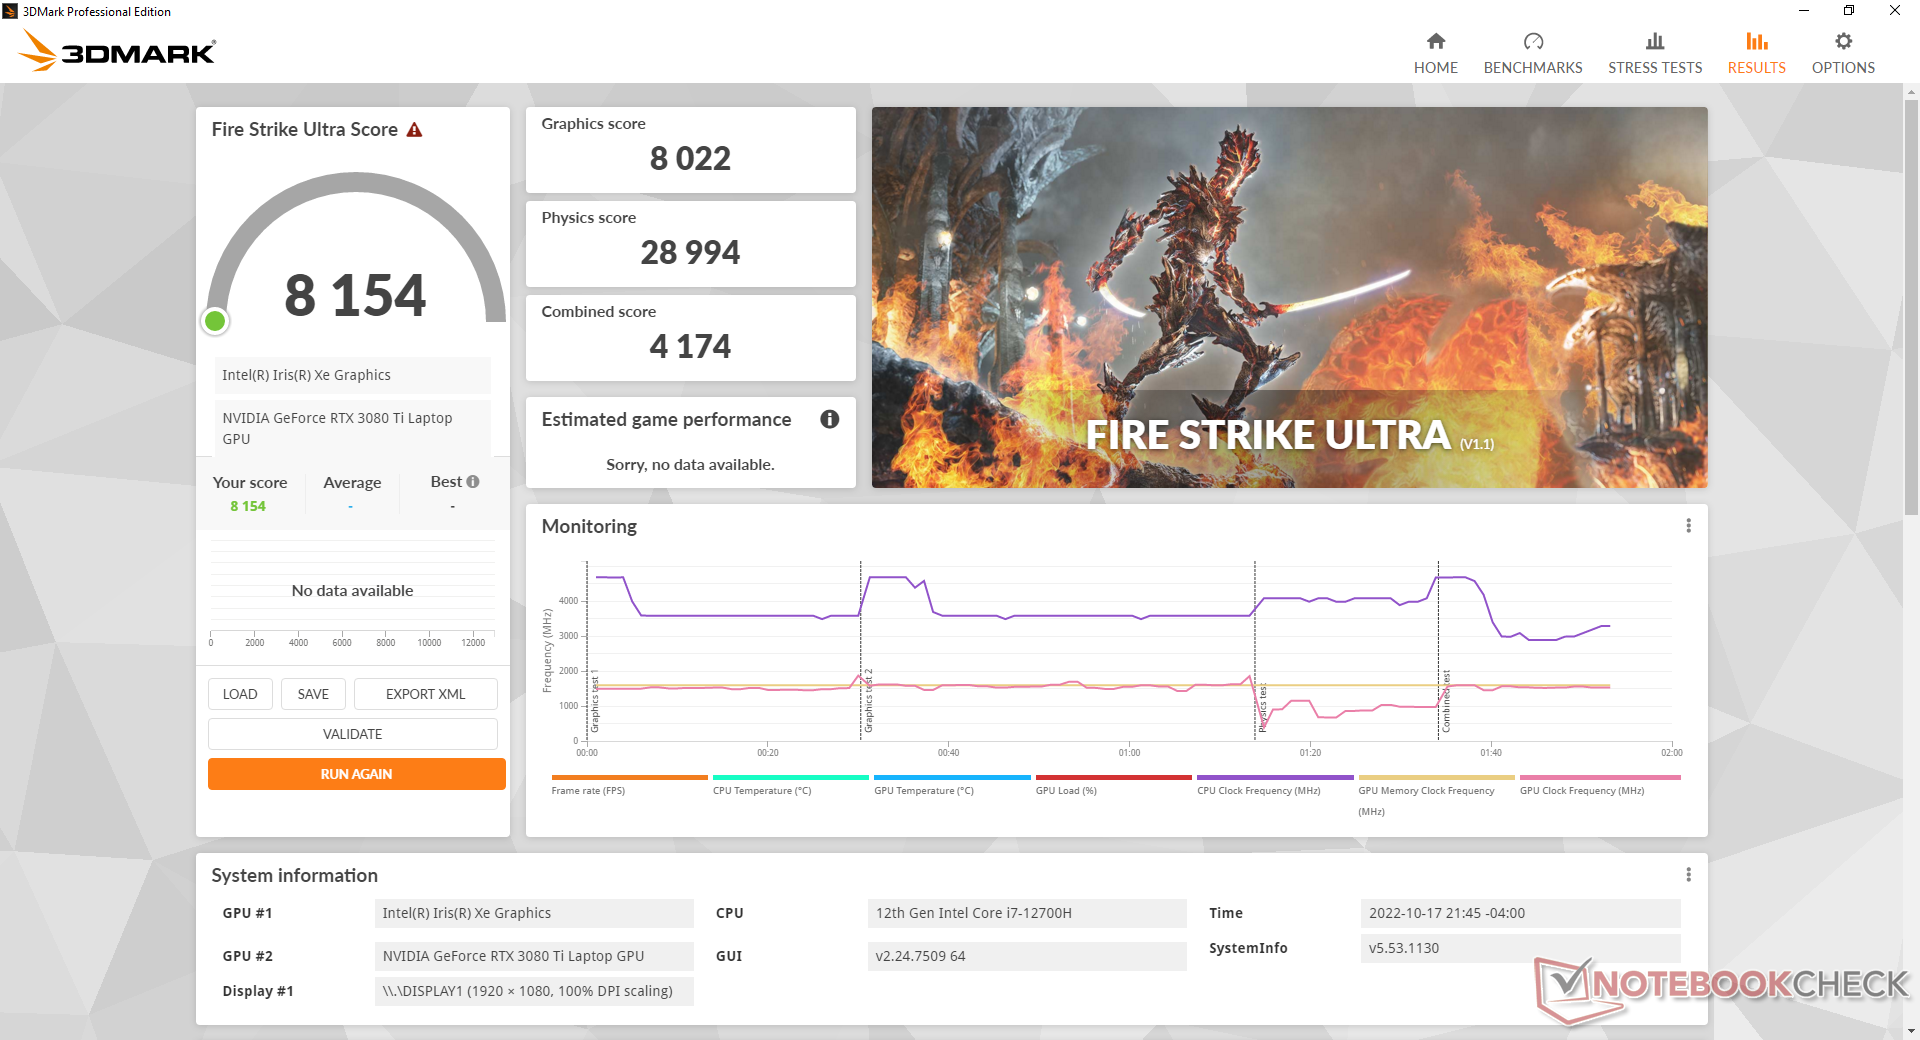
Grafikprestandan är utmärkt med resultat som är något bättre än de flesta andra bärbara datorer med samma GeForce RTX 3080 Ti GPU. TGP på 125 W är inte den högsta som den Alienware x17 R2 och även den Razer Blade 17 har högre mål, men det är åtminstone högre än på många ultratunna bärbara datorer som MSI GS-serien.
Intressant nog uppger Nvidia Control Panel en TGP på 155 W medan Eurocom uppger en TGP på 125 W. Den senare siffran verkar vara det mer exakta målet vilket vårt avsnitt om stresstest nedan kommer att visa.
Nedgradering till GeForce RTX 3070 Ti kommer endast att påverka grafikprestandan med cirka 10 procent. Den totala prestandan är ungefär 20 till 30 procent långsammare än vår referens skrivbord GeForce RTX 3080.
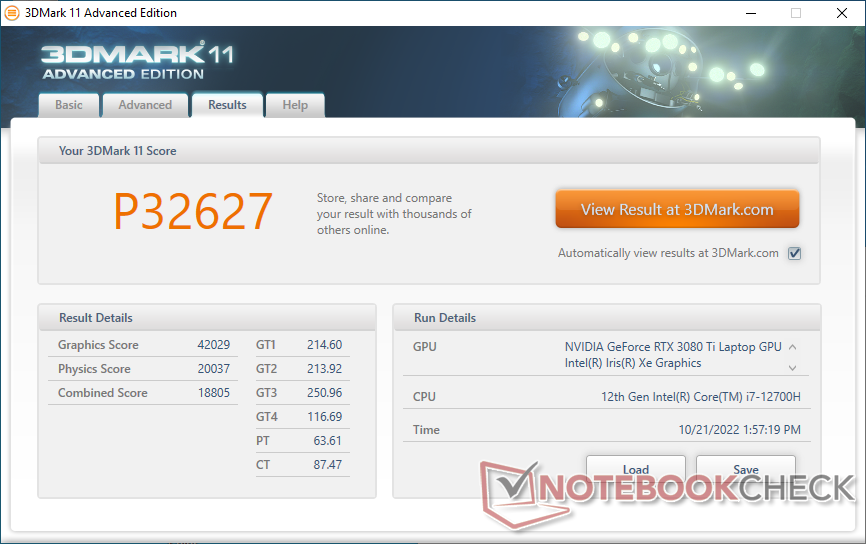
| 3DMark 11 Performance | 32627 poäng | |
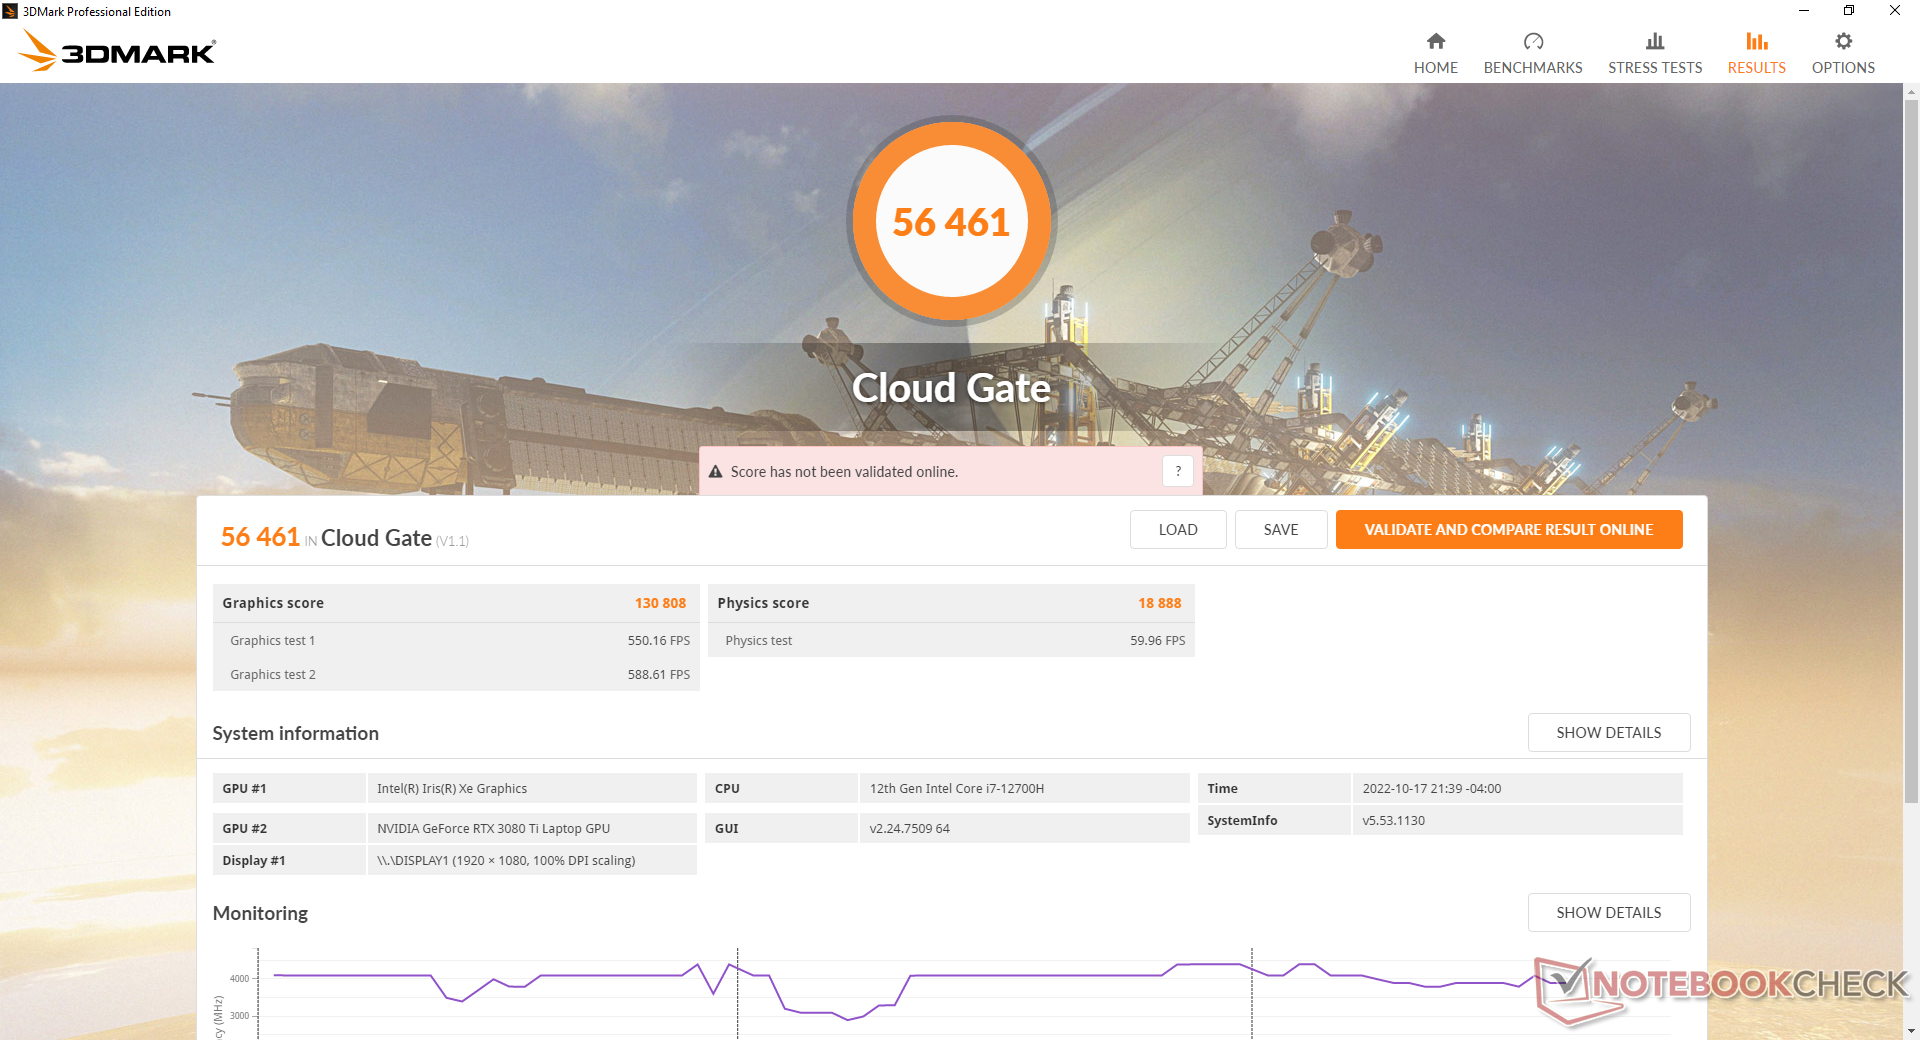
| 3DMark Cloud Gate Standard Score | 56461 poäng | |
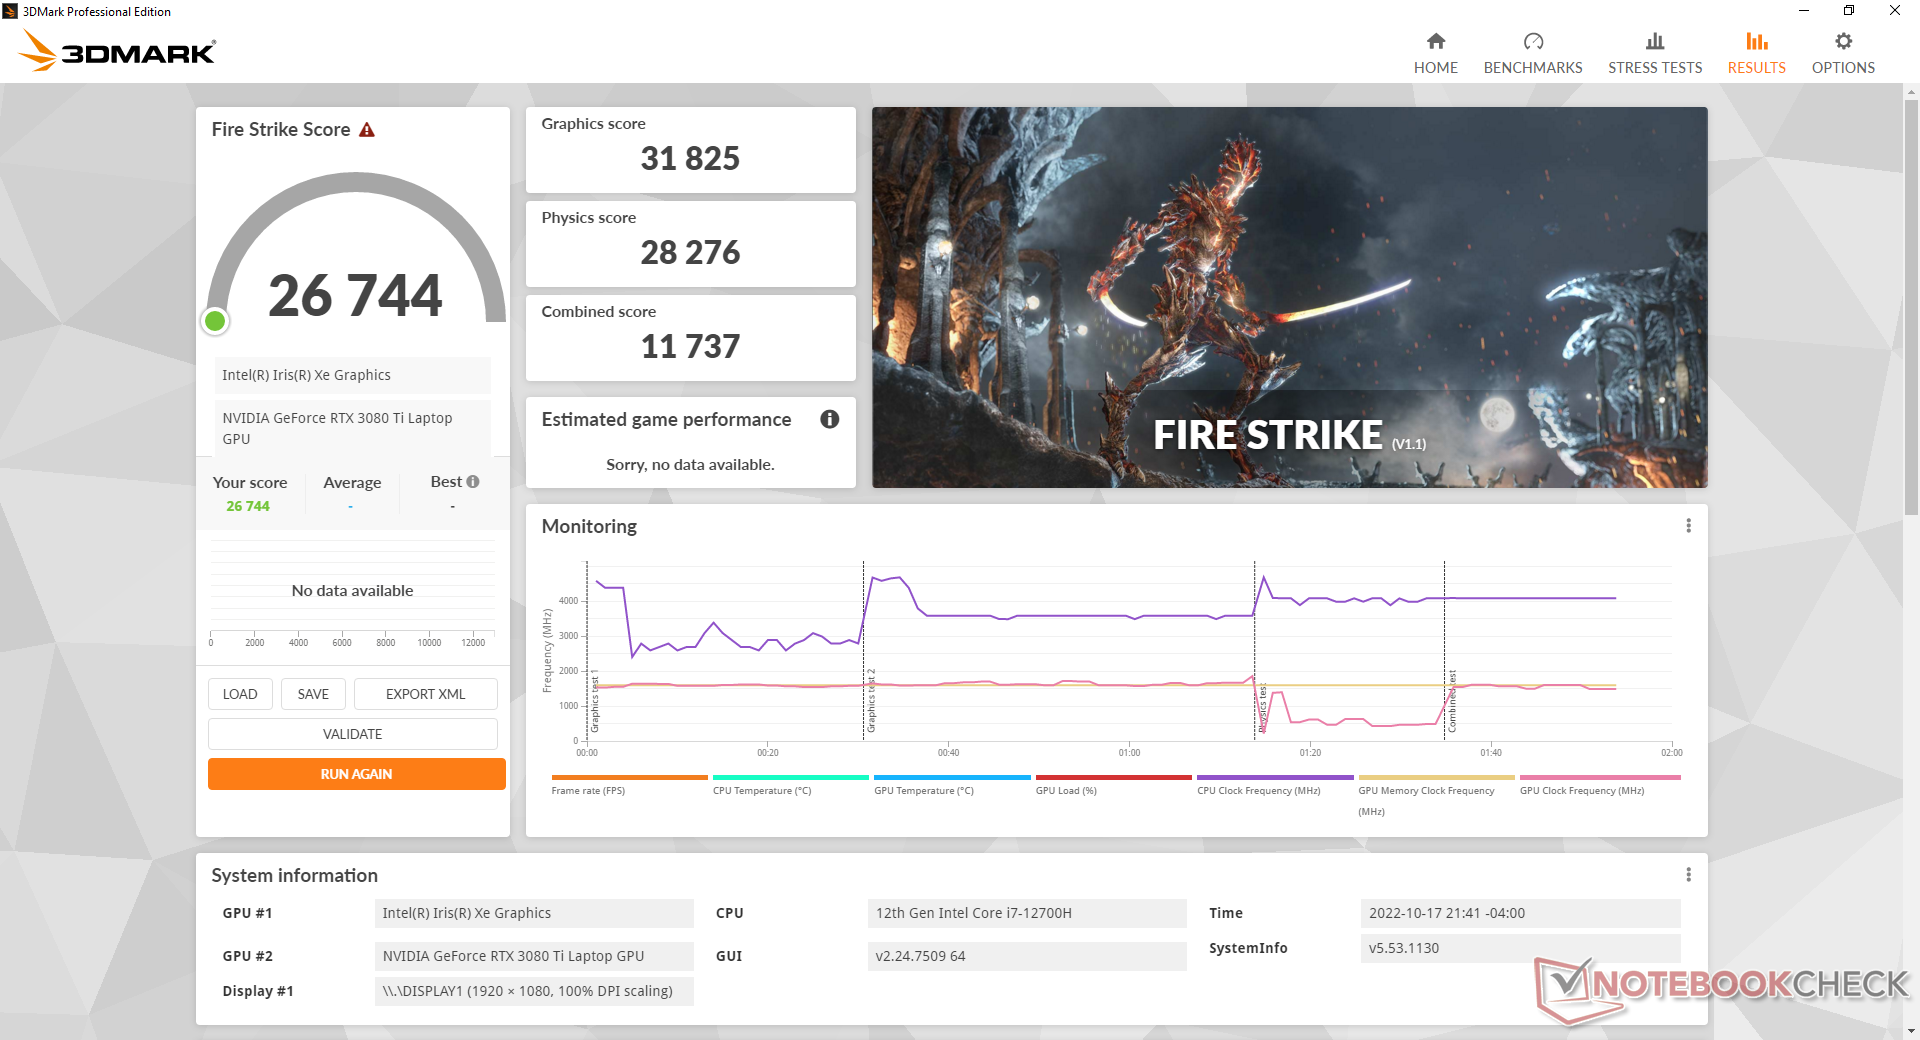
| 3DMark Fire Strike Score | 26744 poäng | |
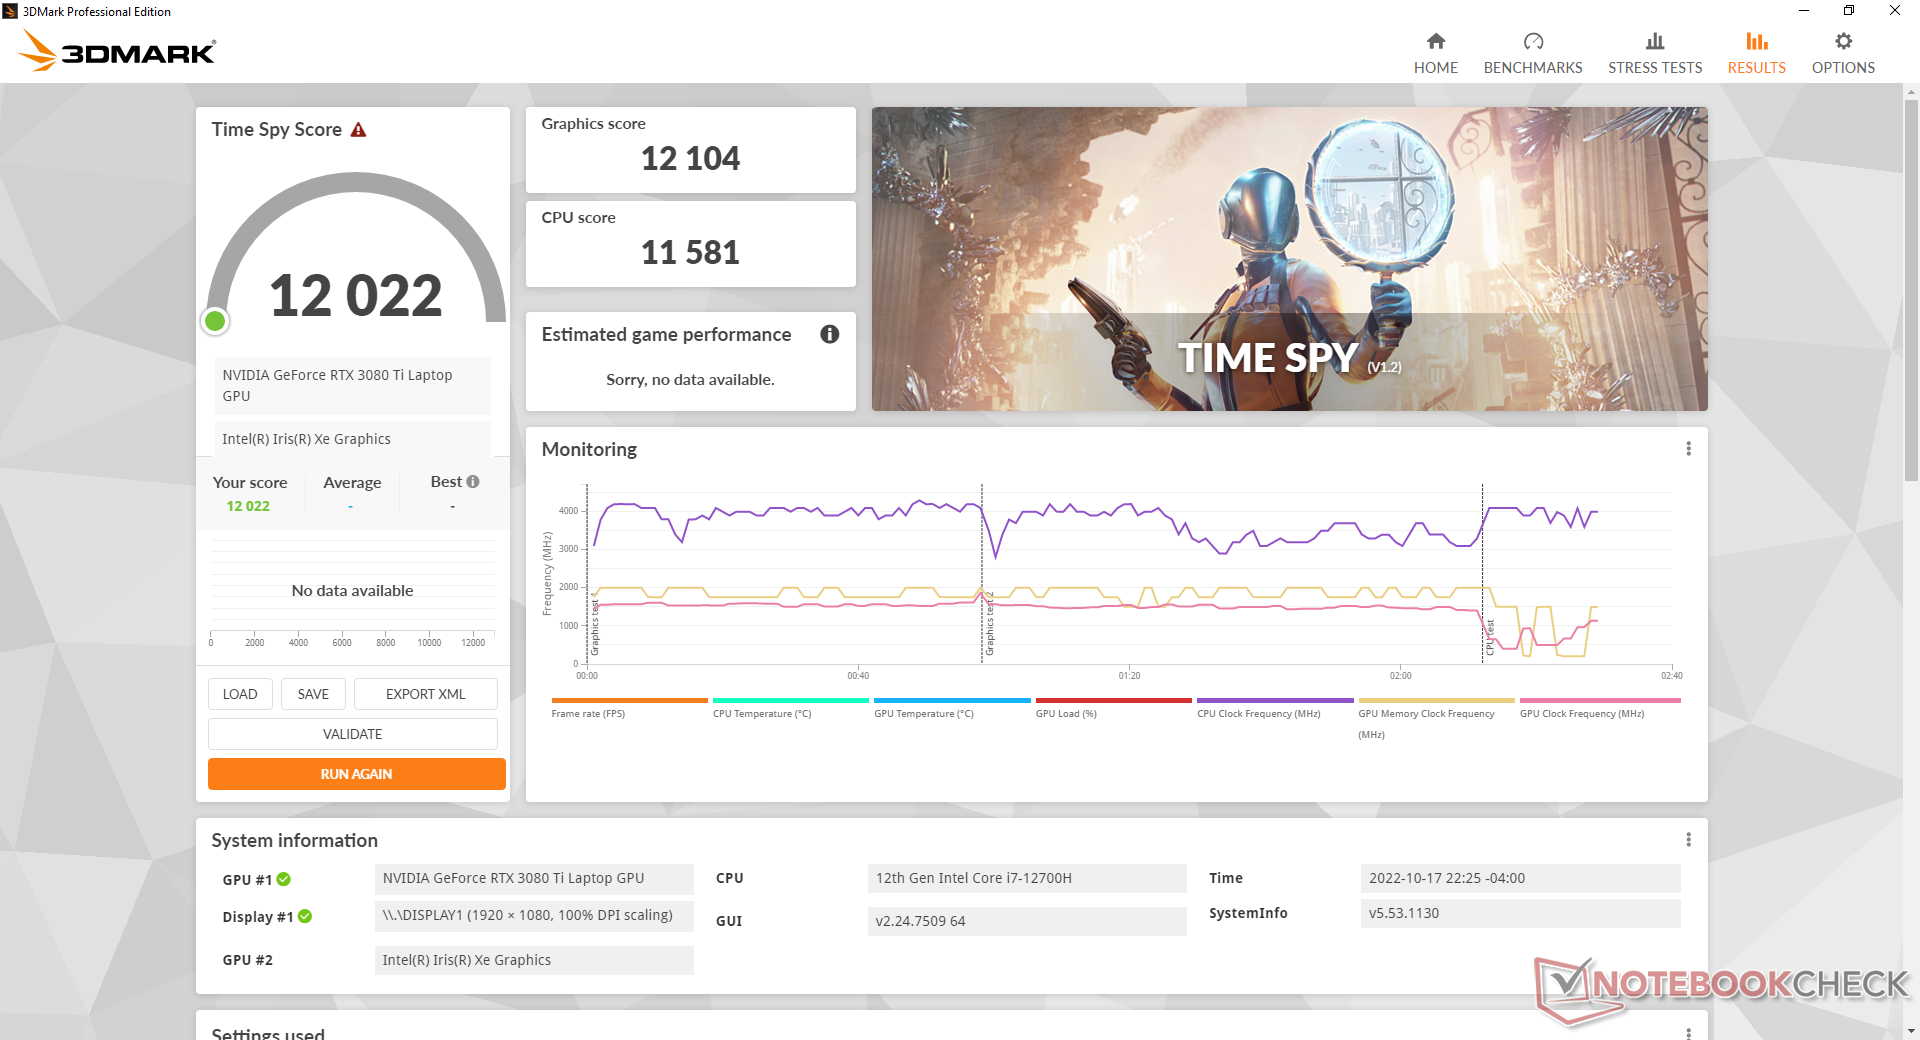
| 3DMark Time Spy Score | 12022 poäng | |
Hjälp | ||
* ... mindre är bättre
Witcher 3 FPS Chart
| låg | med. | hög | ultra | |
|---|---|---|---|---|
| GTA V (2015) | 186.2 | 181.3 | 169.5 | 107.4 |
| The Witcher 3 (2015) | 391.9 | 313.9 | 212.5 | 109.4 |
| Dota 2 Reborn (2015) | 176.1 | 157.9 | 148.6 | 140.8 |
| Final Fantasy XV Benchmark (2018) | 200 | 147.4 | 115.1 | |
| X-Plane 11.11 (2018) | 124.3 | 106.6 | 96.4 | |
| Strange Brigade (2018) | 416 | 273 | 226 | 199.8 |
| Cyberpunk 2077 1.6 (2022) | 135.4 | 123.2 | 96.2 | 80 |
Utsläpp
Systembrus
Det finns nästan alltid ett visst fläktljud från maskinen. Fläktarna tenderar att gå på tomgång om de står på skrivbordet, men även de minsta belastningar som t.ex. webbsurfning ger upphov till ett fläktljud på 30 dB(A) mot en tyst bakgrund på 23 dB(A). Fläktljudet når snabbt sin högsta nivå på 56 dB(A) när man kör mer krävande belastningar som 3DMark 06 eller spel, även om man ställer in den balanserade strömprofilen. Det här är en bärbar dator för spel som inte är rädd för att vara högljudd oavsett inställning av strömprofilen.
De flesta andra bärbara 17-tums gamingdatorer når också upp till 50 dB(A) eller högre när de används under liknande förhållanden, så det här problemet är inte unikt för Eurocom. Icke desto mindre tenderar Eurocom-maskinen att bli högre plötsligt och i snabbare takt.
Ljudnivå
| Låg belastning |
| 23.3 / 30.7 / 30.7 dB(A) |
| Hög belastning |
| 56.2 / 55.9 dB(A) |
 | ||
30 dB tyst 40 dB(A) hörbar 50 dB(A) högt ljud |
||
min: | ||
| Eurocom Nightsky TXi317 GeForce RTX 3080 Ti Laptop GPU, i7-12700H, Samsung SSD 980 Pro 1TB MZ-V8P1T0BW | Schenker XMG Pro 17 E22 GeForce RTX 3080 Ti Laptop GPU, i9-12900H, Samsung SSD 980 Pro 1TB MZ-V8P1T0BW | Aorus 17X XES GeForce RTX 3070 Ti Laptop GPU, i9-12900HX, Gigabyte AG470S1TB-SI B10 | MSI Raider GE77 HX 12UHS GeForce RTX 3080 Ti Laptop GPU, i9-12900HX, Samsung PM9A1 MZVL22T0HBLB | Razer Blade 17 Early 2022 GeForce RTX 3080 Ti Laptop GPU, i9-12900H, Samsung PM9A1 MZVL21T0HCLR | Alienware x17 R2 P48E GeForce RTX 3080 Ti Laptop GPU, i9-12900HK, 2x Samsung PM9A1 1TB (RAID 0) | |
|---|---|---|---|---|---|---|
| Noise | -12% | -7% | -11% | 2% | 16% | |
| av / miljö * (dB) | 23.3 | 26 -12% | 26 -12% | 26 -12% | 26 -12% | 22.7 3% |
| Idle Minimum * (dB) | 23.3 | 26 -12% | 28 -20% | 26 -12% | 26 -12% | 23.1 1% |
| Idle Average * (dB) | 30.7 | 34 -11% | 32 -4% | 34 -11% | 27 12% | 23.1 25% |
| Idle Maximum * (dB) | 30.7 | 42 -37% | 38 -24% | 46 -50% | 32 -4% | 23.1 25% |
| Load Average * (dB) | 56.2 | 58 -3% | 53 6% | 50 11% | 50 11% | 31.9 43% |
| Witcher 3 ultra * (dB) | 56.1 | 57 -2% | 54 4% | 55 2% | 51 9% | 52.5 6% |
| Load Maximum * (dB) | 55.9 | 58 -4% | 55 2% | 57 -2% | 51 9% | 52.5 6% |
* ... mindre är bättre
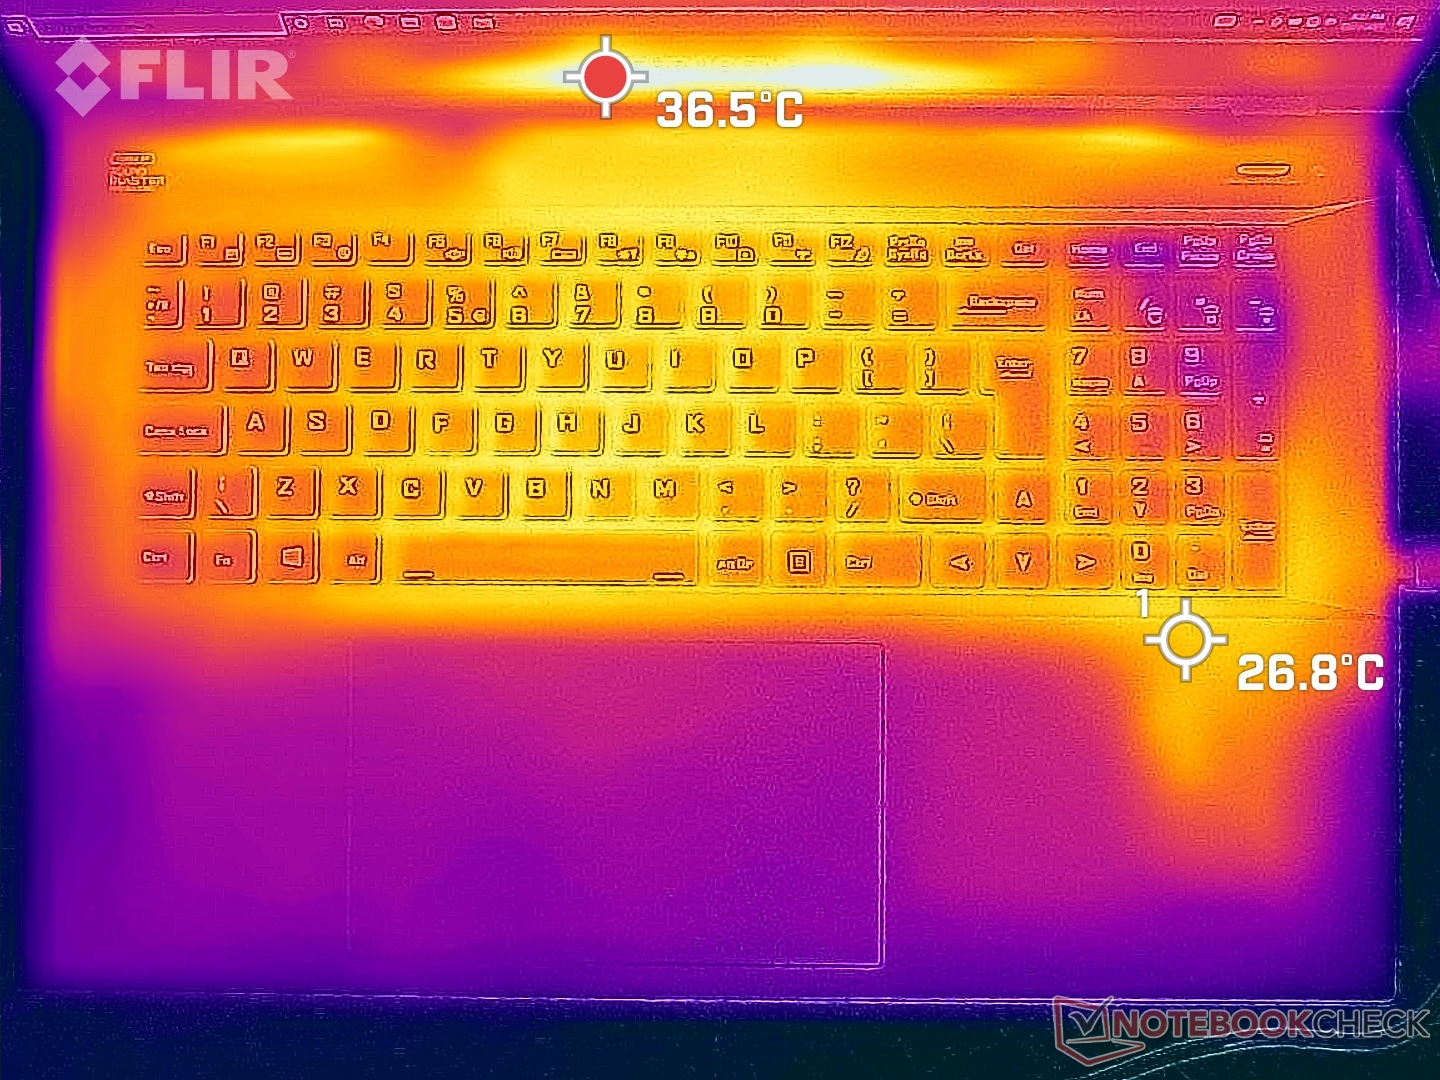
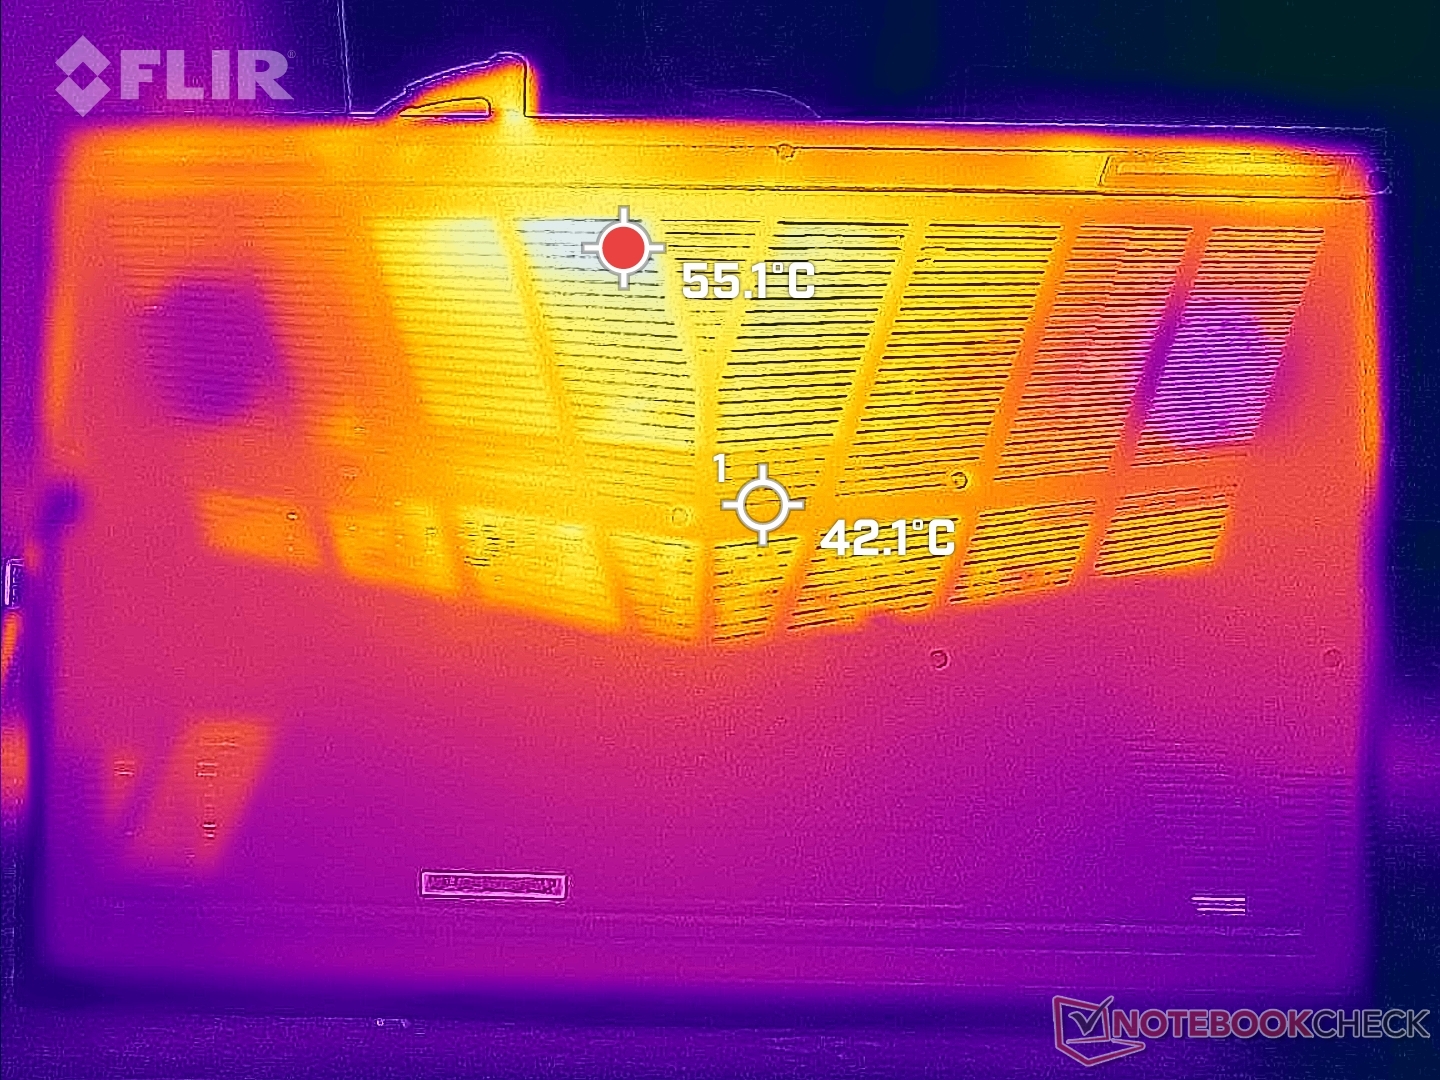
Temperatur
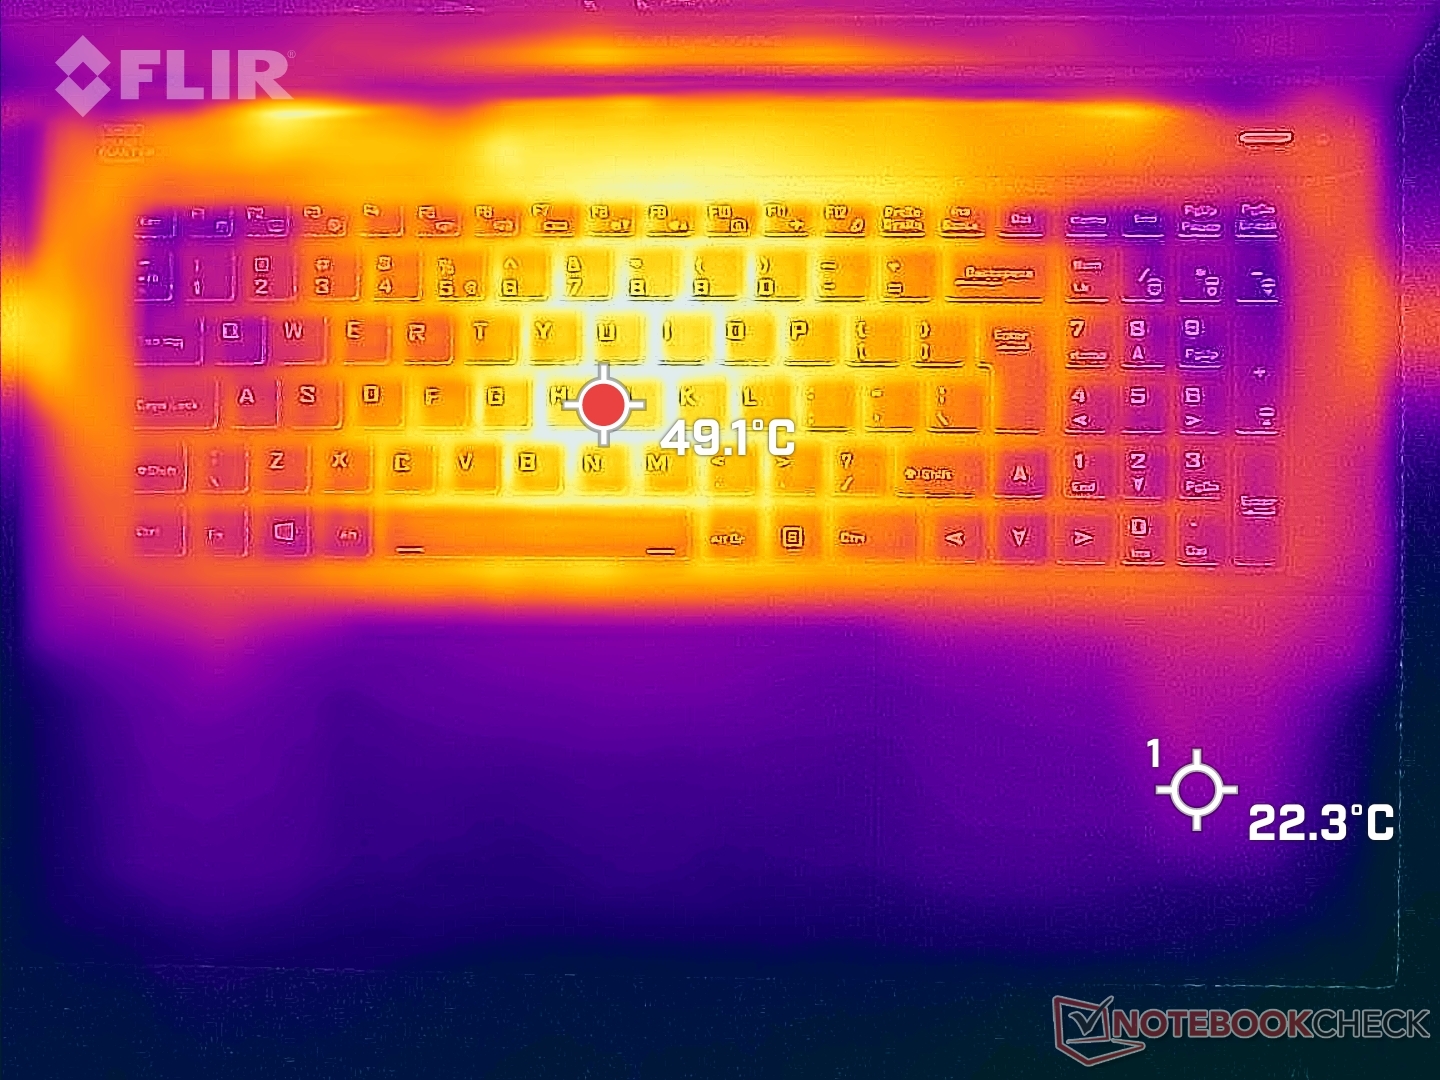
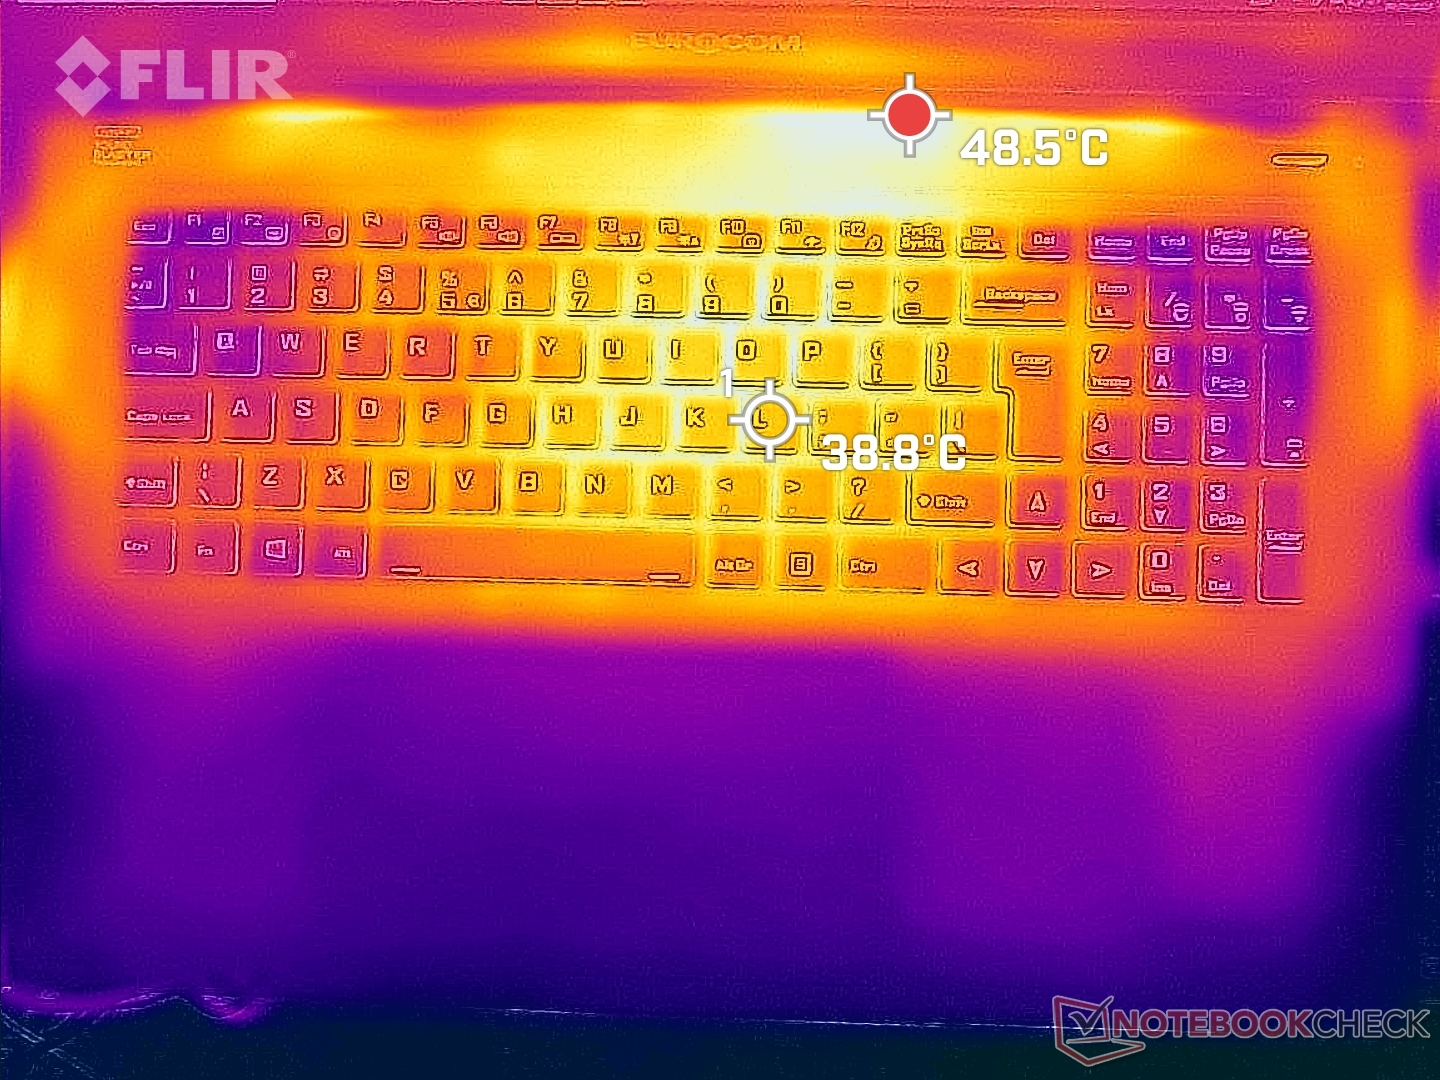
Yttemperaturerna är varmast i mitten av tangentbordet medan handflatorna är mycket svalare för bekvämare spelande. Tunnare bärbara datorer som Razer Blade 17 har märkbart varmare handflatsstöd för att vara mer obekväma i handen
Observera att det högra handledsstödet på Nightsky TXi317 alltid kommer att vara lite varmare än det vänstra handledsstödet eftersom M.2 SSD-enheterna är placerade under det högra handledsstödet.
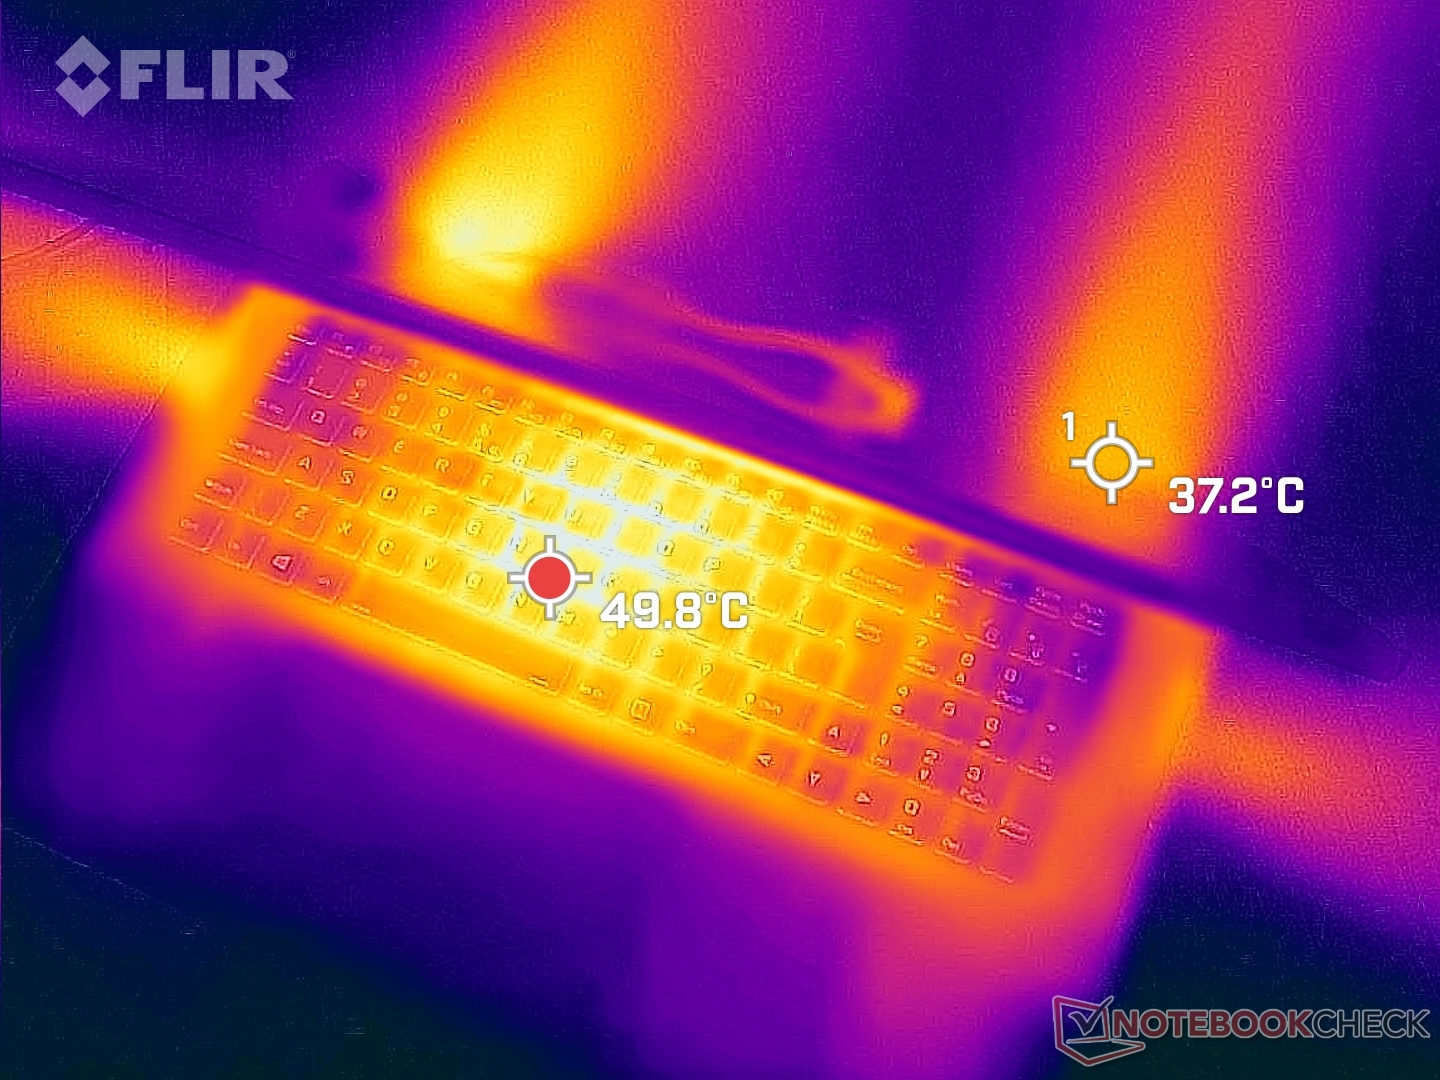
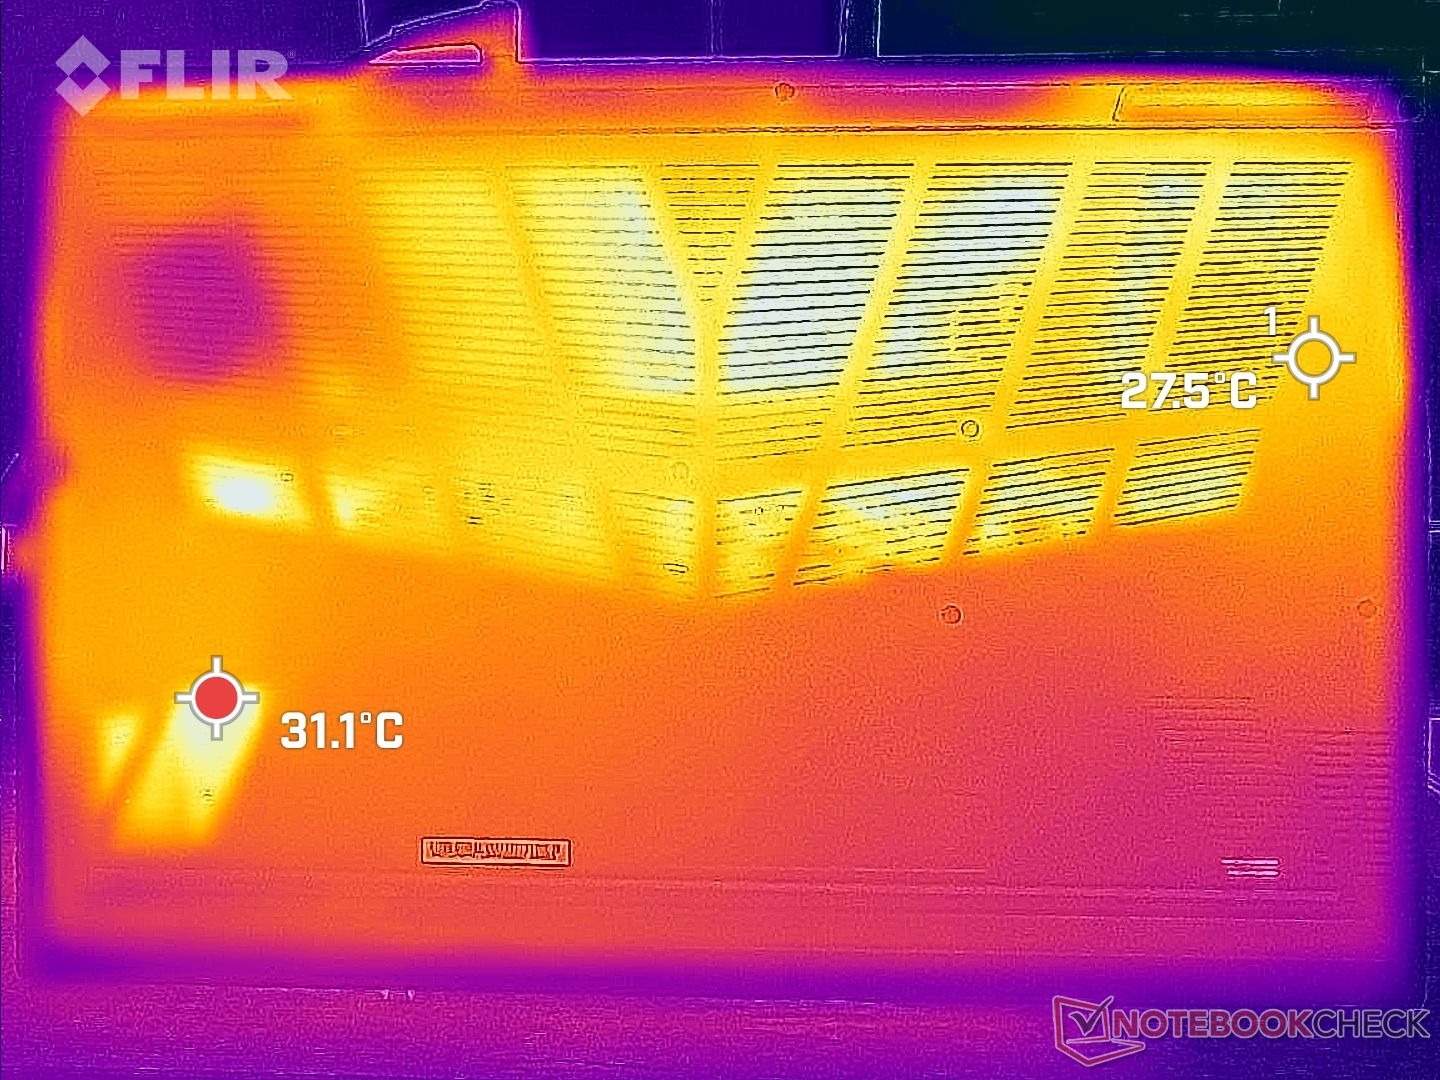
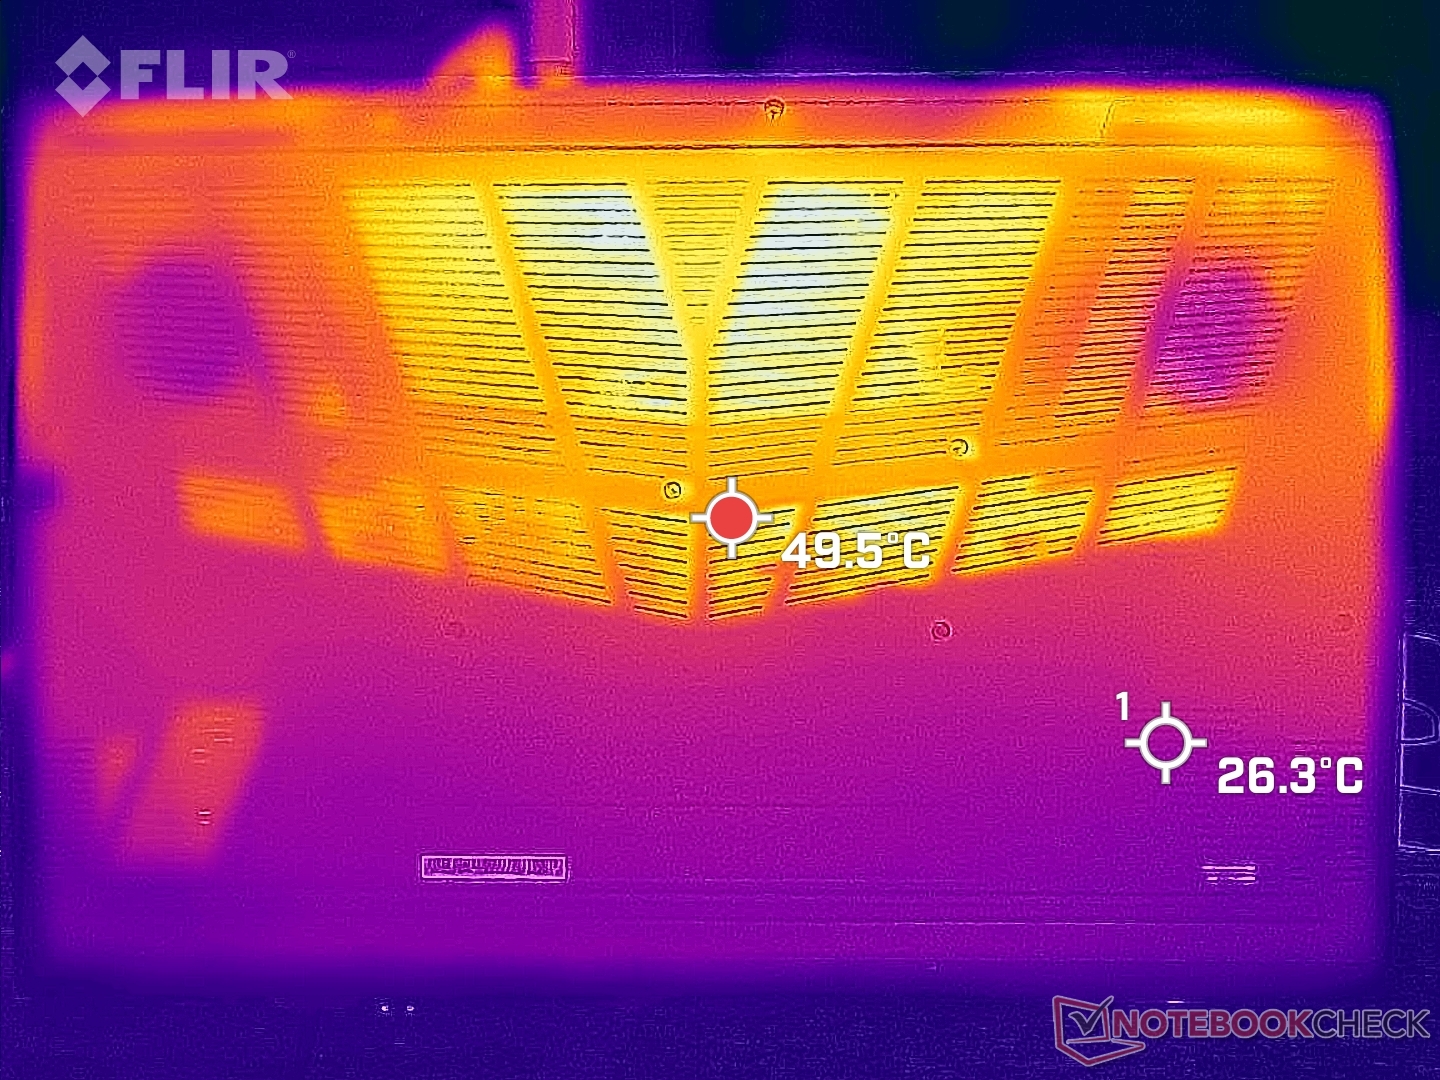
(-) Den maximala temperaturen på ovansidan är 50.4 °C / 123 F, jämfört med genomsnittet av 40.4 °C / 105 F , allt från 21.2 till 68.8 °C för klassen Gaming.
(-) Botten värms upp till maximalt 47.6 °C / 118 F, jämfört med genomsnittet av 43.2 °C / 110 F
(+) Vid tomgångsbruk är medeltemperaturen för ovansidan 29.4 °C / 85 F, jämfört med enhetsgenomsnittet på 33.9 °C / ### class_avg_f### F.
(-) När du spelar The Witcher 3 är medeltemperaturen för ovansidan 39.2 °C / 103 F, jämfört med enhetsgenomsnittet på 33.9 °C / ## #class_avg_f### F.
(+) Handledsstöden och pekplattan är kallare än hudtemperaturen med maximalt 31.2 °C / 88.2 F och är därför svala att ta på.
(-) Medeltemperaturen för handledsstödsområdet på liknande enheter var 28.8 °C / 83.8 F (-2.4 °C / -4.4 F).
| Eurocom Nightsky TXi317 Intel Core i7-12700H, NVIDIA GeForce RTX 3080 Ti Laptop GPU | Schenker XMG Pro 17 E22 Intel Core i9-12900H, NVIDIA GeForce RTX 3080 Ti Laptop GPU | Aorus 17X XES Intel Core i9-12900HX, NVIDIA GeForce RTX 3070 Ti Laptop GPU | MSI Raider GE77 HX 12UHS Intel Core i9-12900HX, NVIDIA GeForce RTX 3080 Ti Laptop GPU | Razer Blade 17 Early 2022 Intel Core i9-12900H, NVIDIA GeForce RTX 3080 Ti Laptop GPU | Alienware x17 R2 P48E Intel Core i9-12900HK, NVIDIA GeForce RTX 3080 Ti Laptop GPU | |
|---|---|---|---|---|---|---|
| Heat | -12% | -15% | -19% | -10% | 7% | |
| Maximum Upper Side * (°C) | 50.4 | 56 -11% | 54 -7% | 53 -5% | 50 1% | 49.6 2% |
| Maximum Bottom * (°C) | 47.6 | 60 -26% | 58 -22% | 58 -22% | 56 -18% | 42.4 11% |
| Idle Upper Side * (°C) | 32.6 | 34 -4% | 37 -13% | 38 -17% | 36 -10% | 29.2 10% |
| Idle Bottom * (°C) | 33.2 | 36 -8% | 39 -17% | 43 -30% | 38 -14% | 32 4% |
* ... mindre är bättre
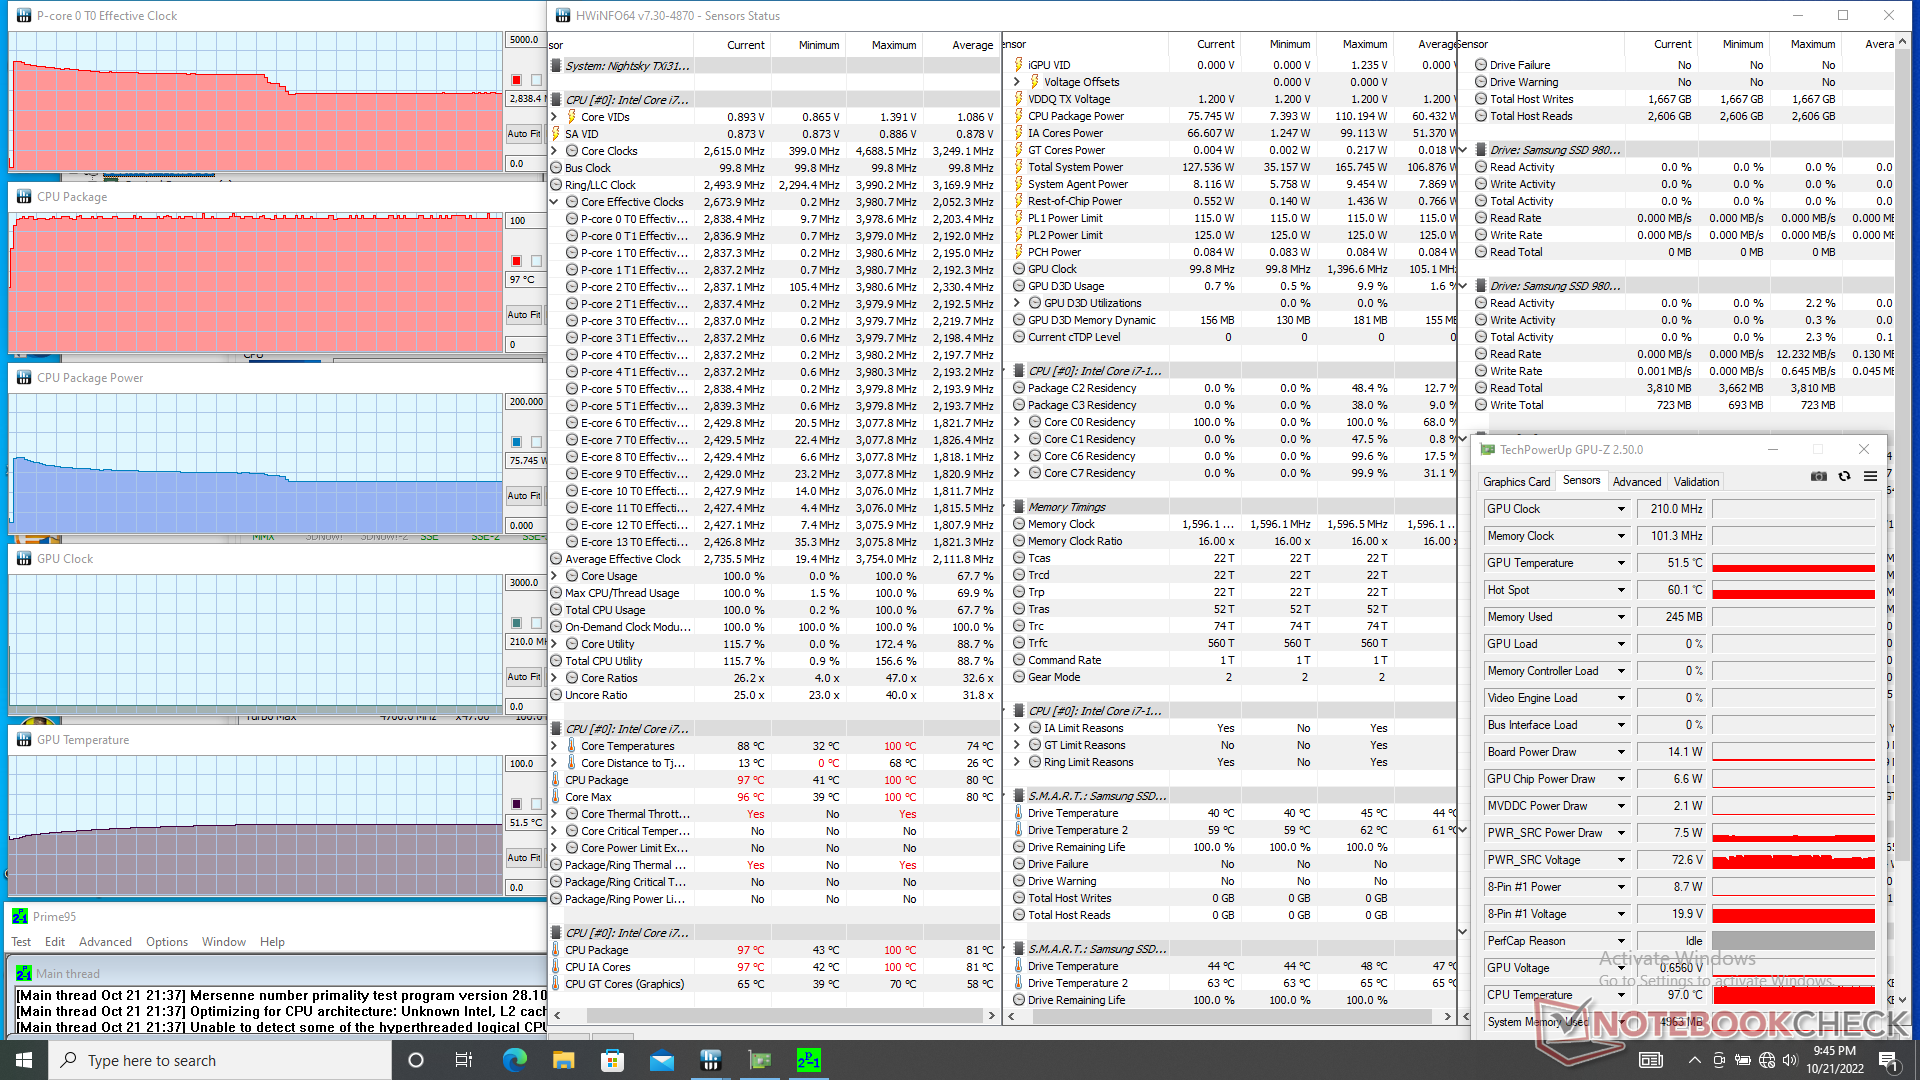
Stresstest
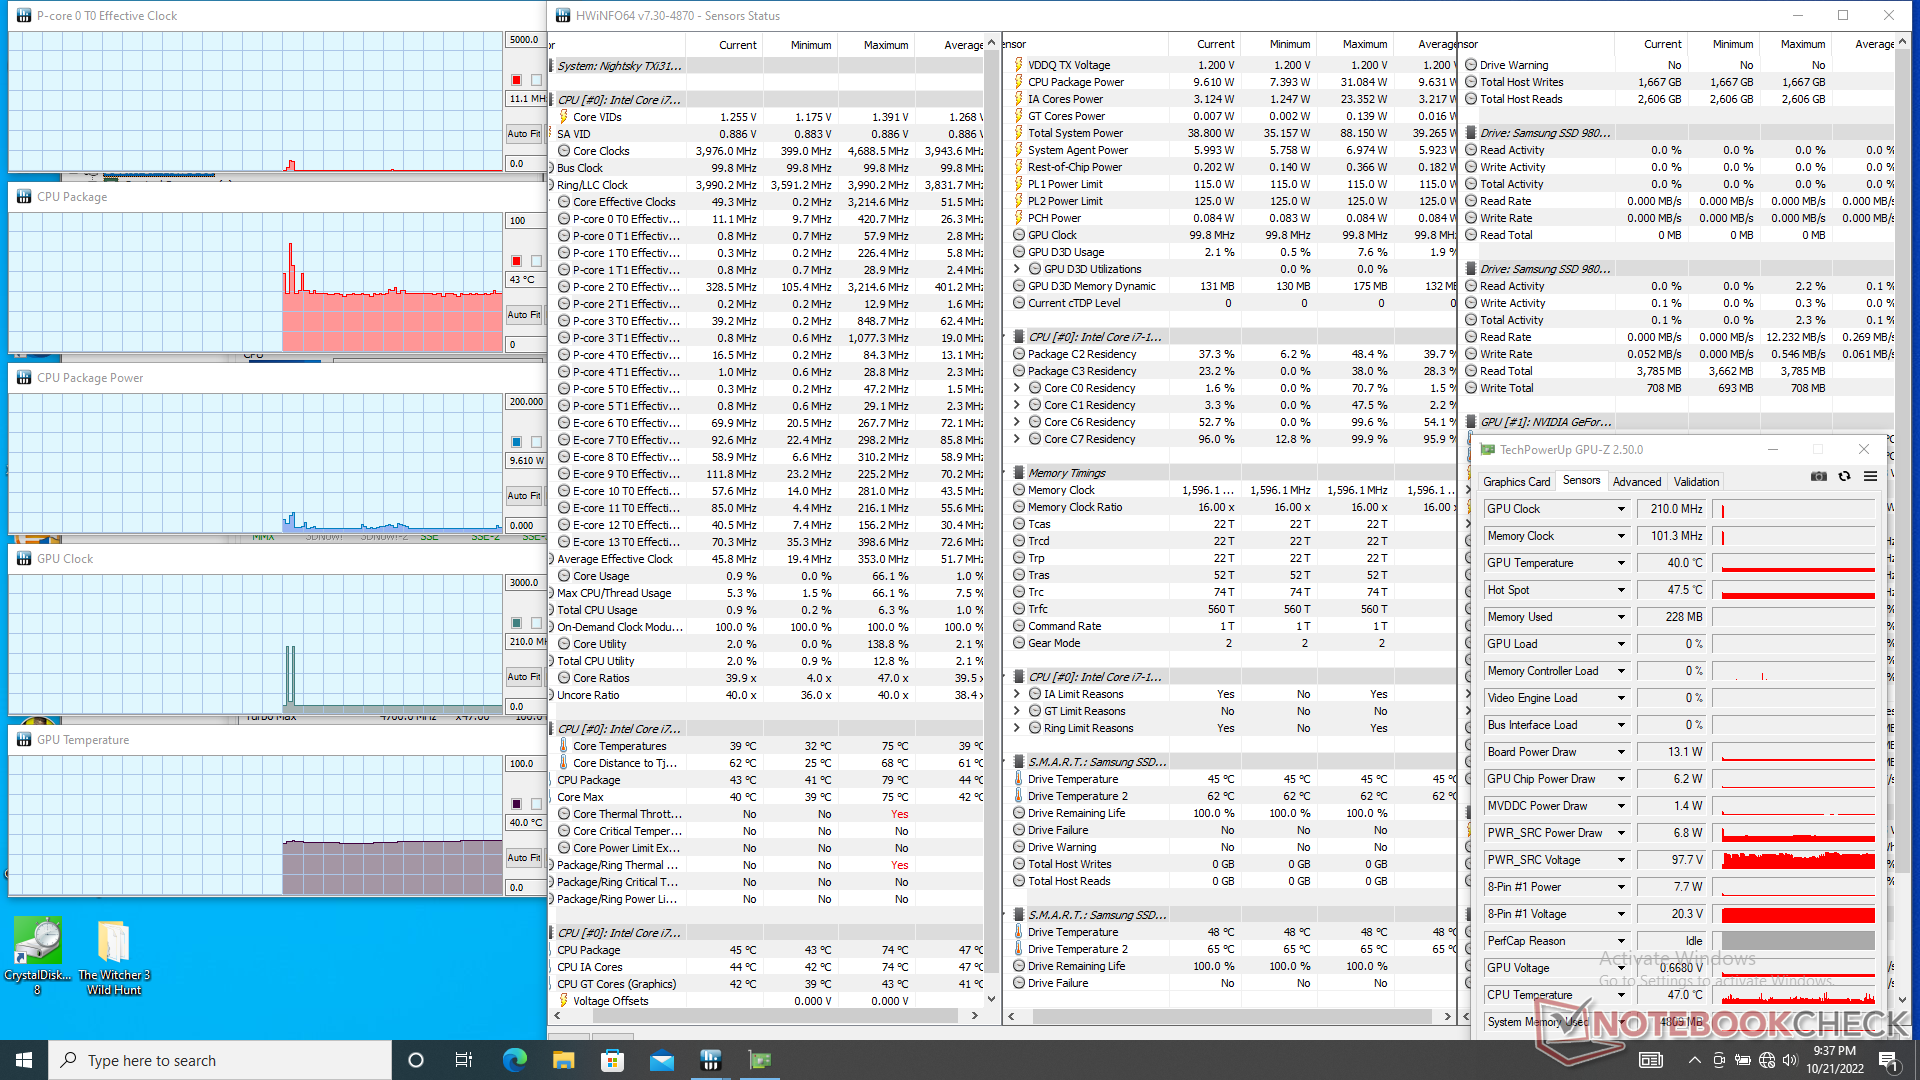
CPU-klockfrekvens, temperatur och strömförbrukning på kortet skulle stiga till 4 GHz, 97 C respektive 110 W när Prime95 stressar. Klockfrekvensen och strömförbrukningen skulle sedan sjunka stadigt innan de stabiliserades vid 2,8 GHz respektive 76 W, utan att kärnans temperatur förändrades. Genom att upprepa samma test påDell G16 7620 med en identisk processor skulle resultera i något snabbare stabila klockfrekvenser på cirka 3,3 GHz men liknande kärntemperaturer på nästan 100 C.
GPU:s klockfrekvens, temperatur och strömförbrukning på kortet skulle stabiliseras vid 1432 MHz, 87 C respektive 121 W när man körde Witcher 3. Om testet upprepas med strömprofilen "underhållning" skulle GPU-prestandan minska något: klockfrekvensen och strömförbrukningen skulle sjunka till 1327 MHz respektive 110 W, utan att temperaturen förändrades. Det är olyckligt att vi inte kan komma närmare det påstådda 125 W till 155 W TGP-målet.
Körning av Witcher 3 på MSI GS77 med samma RTX 3080 Ti GPU skulle resultera i en långsammare GPU-klockfrekvens, svalare kärntemperatur och lägre strömförbrukning på 1432 MHz, 75 C respektive 105 W på kortet jämfört med vår Eurocom.
Prestandan är begränsad om den drivs med batterier. Ett Fire Strike -test på batteridrift skulle ge fysik- och grafikpoäng på 12300 respektive 5071 poäng, jämfört med 28276 respektive 31825 poäng när den är ansluten till elnätet.
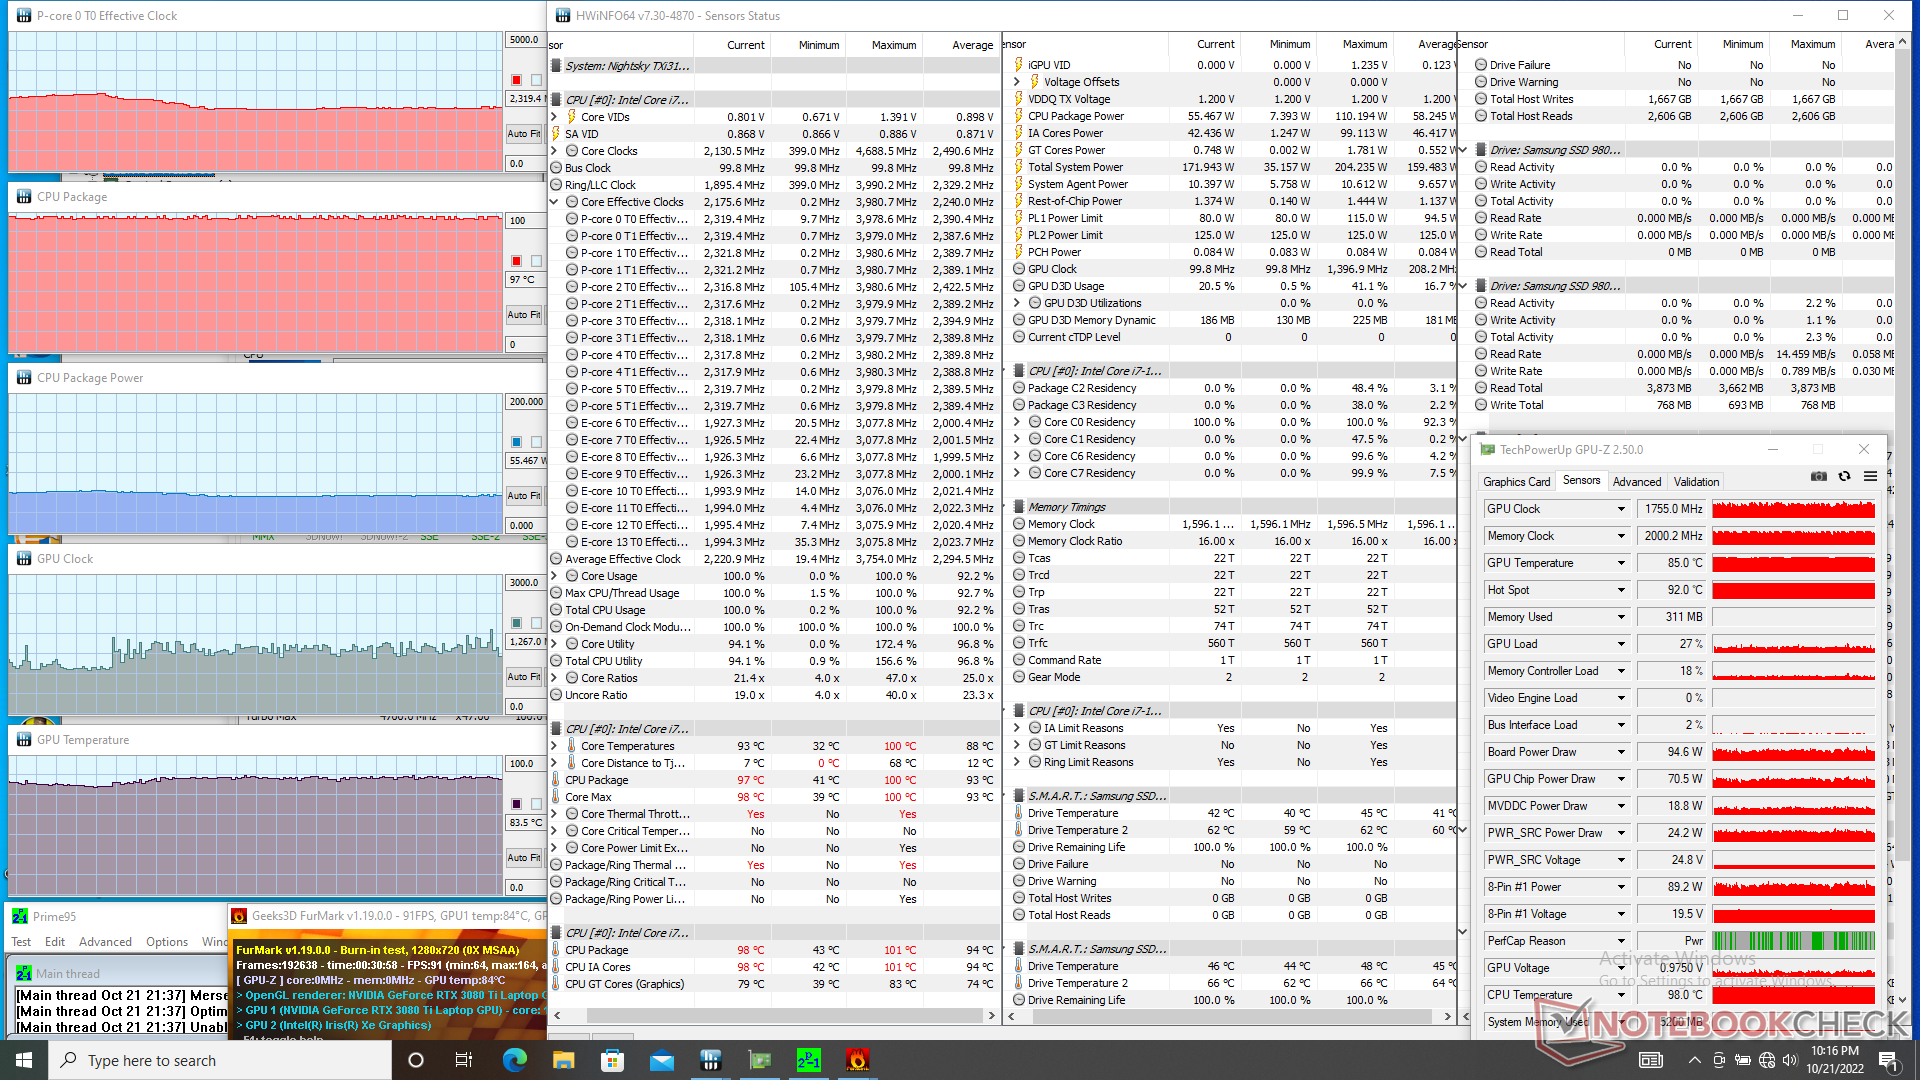
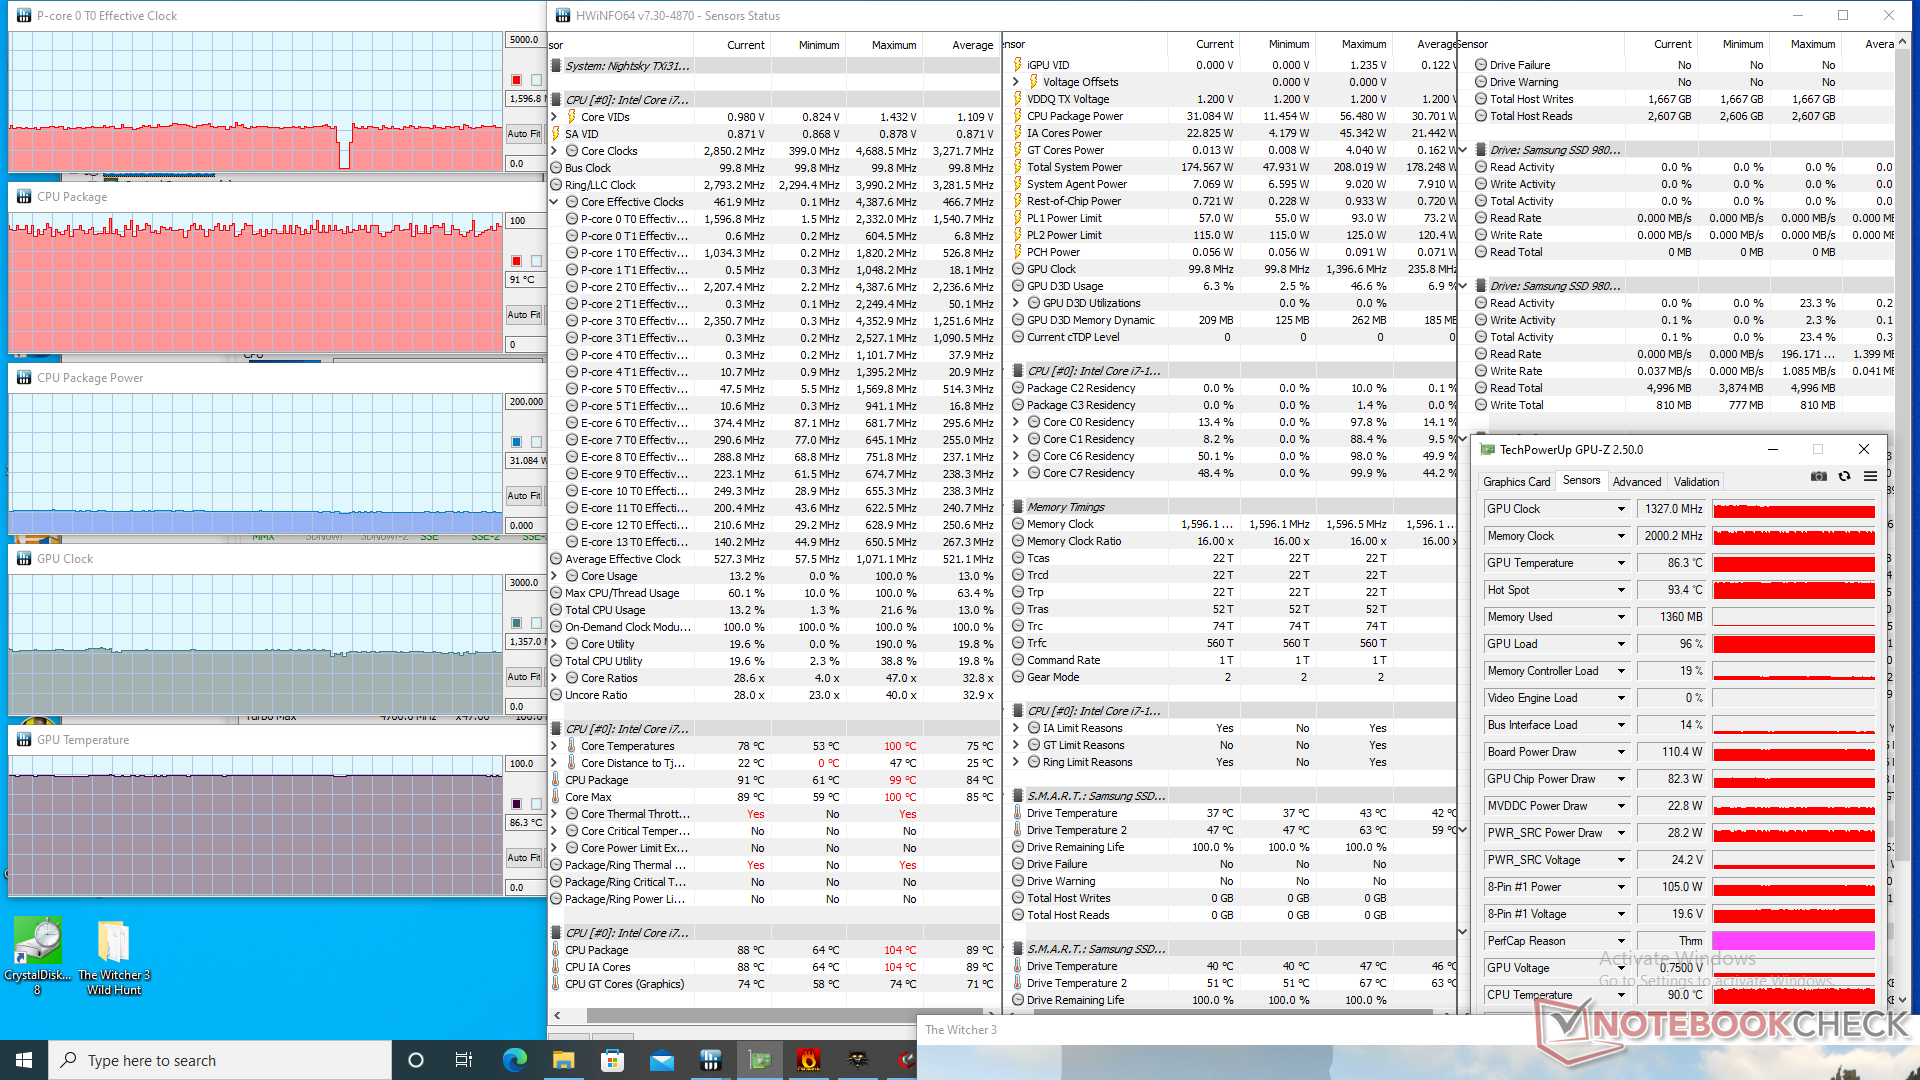
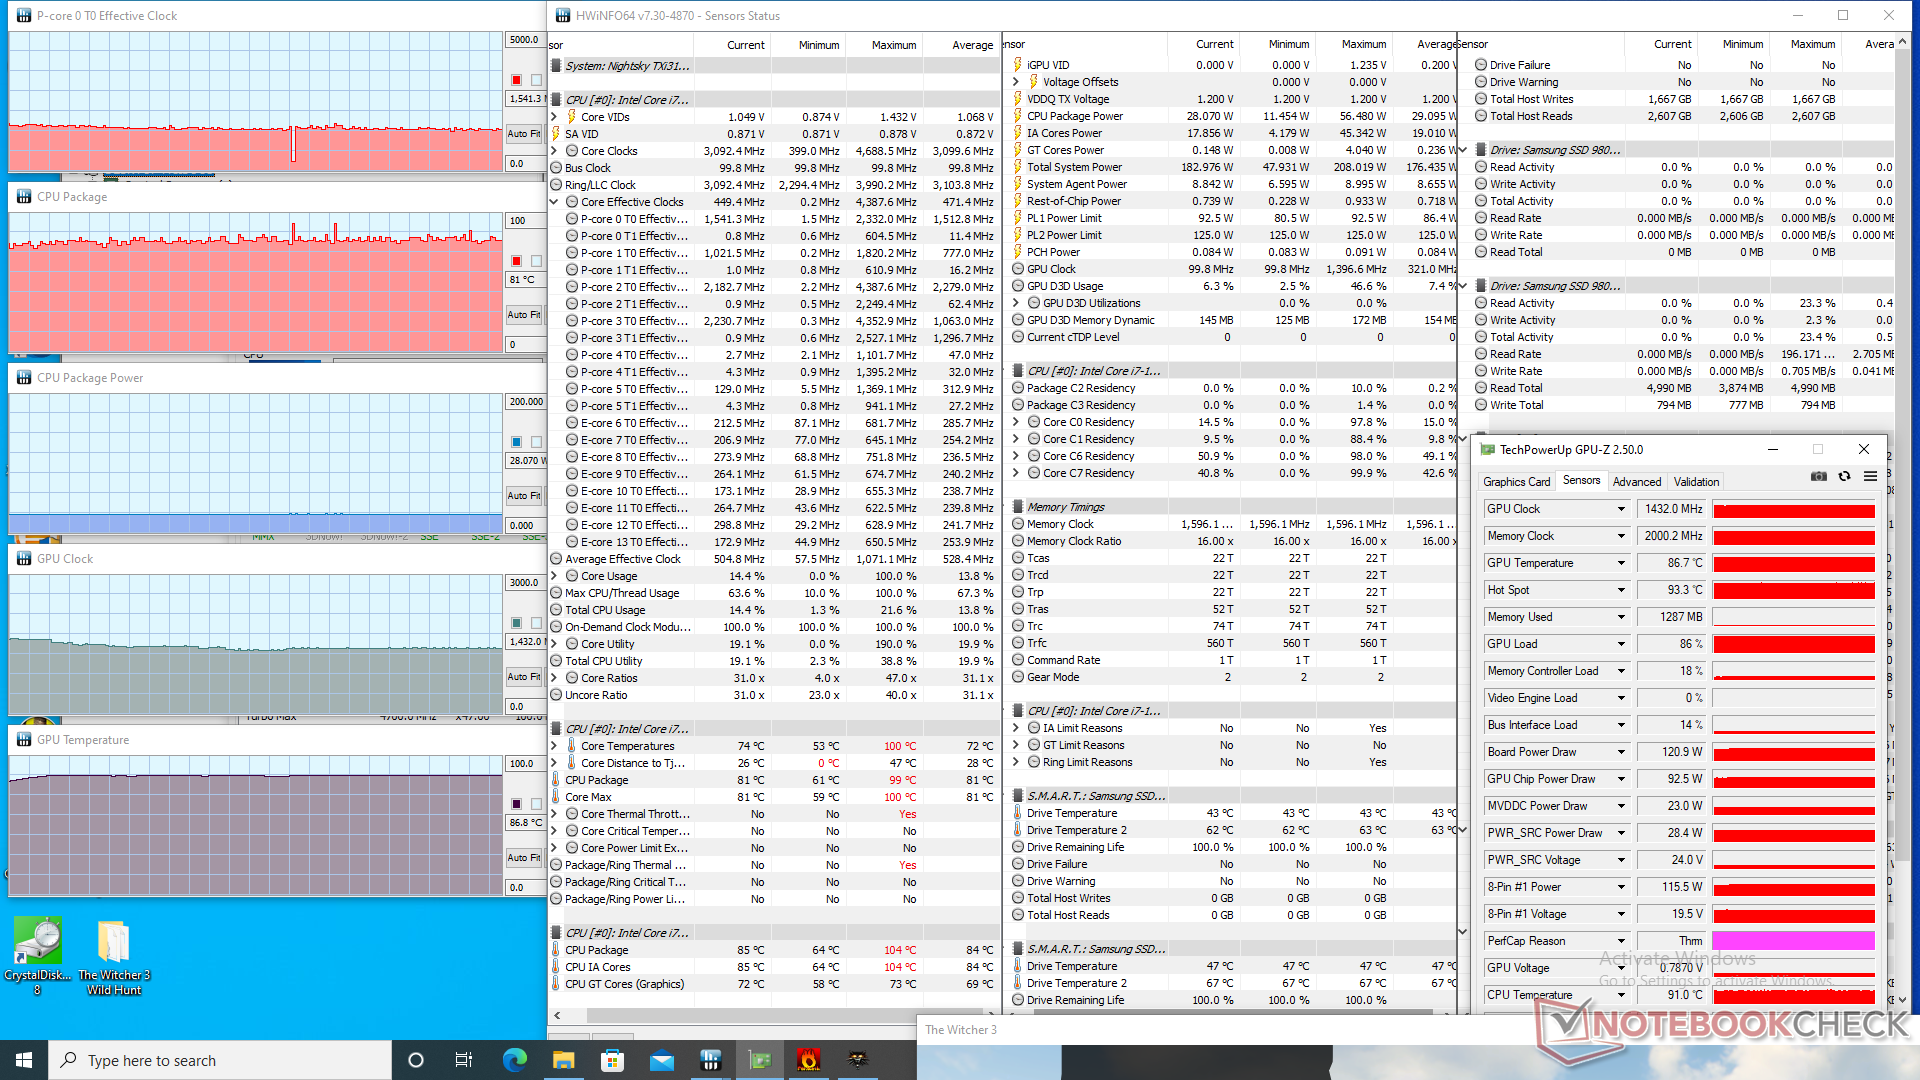
| CPU-klocka (GHz) | GPU-klocka (MHz) | Genomsnittlig CPU-temperatur (°C) | Genomsnittlig GPU-temperatur (°C) | |
| Systemets tomgång | -- | -- | 43 | 40 |
| Prime95 Stress | 2.8 | -- | 97 | 52 |
| Prime95 + FurMark Stress | 2.3 - 2.8 | 1267 - 1755 | 97 | 84 |
| Witcher 3 Stress | 1,5 | 1432 | 81 | 87 |
Högtalare
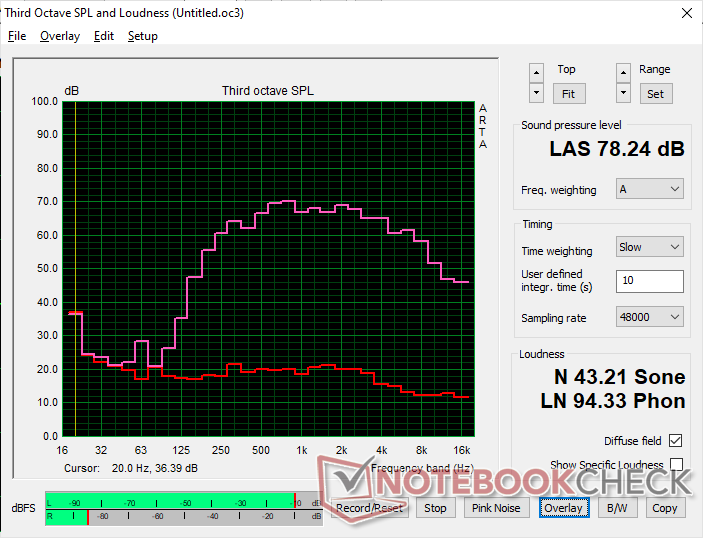
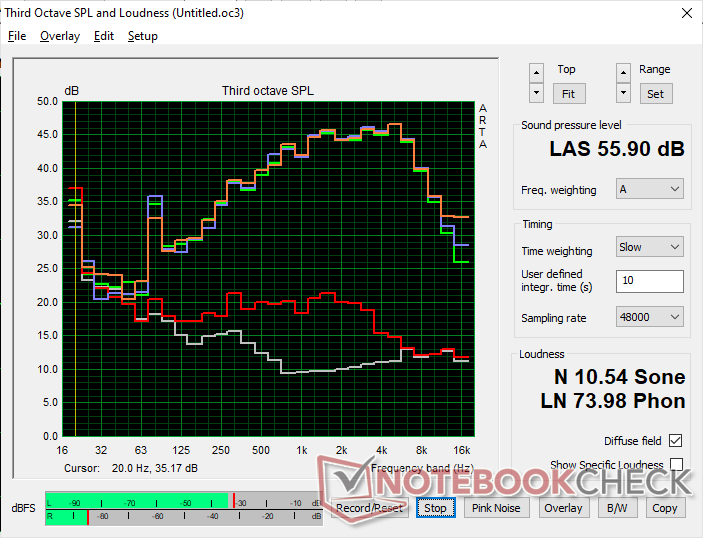
Eurocom Nightsky TXi317 ljudanalys
(±) | högtalarljudstyrkan är genomsnittlig men bra (78.2 dB)
Bas 100 - 315 Hz
(±) | reducerad bas - i genomsnitt 14.6% lägre än medianen
(-) | basen är inte linjär (16.5% delta till föregående frekvens)
Mellan 400 - 2000 Hz
(±) | högre mellan - i genomsnitt 5.1% högre än median
(+) | mids är linjära (5% delta till föregående frekvens)
Högsta 2 - 16 kHz
(+) | balanserade toppar - endast 4% från medianen
(+) | toppar är linjära (6.2% delta till föregående frekvens)
Totalt 100 - 16 000 Hz
(±) | linjäriteten för det totala ljudet är genomsnittlig (20.4% skillnad mot median)
Jämfört med samma klass
» 72% av alla testade enheter i den här klassen var bättre, 6% liknande, 22% sämre
» Den bästa hade ett delta på 6%, genomsnittet var 18%, sämst var 132%
Jämfört med alla testade enheter
» 54% av alla testade enheter var bättre, 8% liknande, 38% sämre
» Den bästa hade ett delta på 4%, genomsnittet var 23%, sämst var 134%
Apple MacBook Pro 16 2021 M1 Pro ljudanalys
(+) | högtalare kan spela relativt högt (84.7 dB)
Bas 100 - 315 Hz
(+) | bra bas - bara 3.8% från medianen
(+) | basen är linjär (5.2% delta till föregående frekvens)
Mellan 400 - 2000 Hz
(+) | balanserad mellan - endast 1.3% från medianen
(+) | mids är linjära (2.1% delta till föregående frekvens)
Högsta 2 - 16 kHz
(+) | balanserade toppar - endast 1.9% från medianen
(+) | toppar är linjära (2.7% delta till föregående frekvens)
Totalt 100 - 16 000 Hz
(+) | det totala ljudet är linjärt (4.6% skillnad mot median)
Jämfört med samma klass
» 0% av alla testade enheter i den här klassen var bättre, 0% liknande, 100% sämre
» Den bästa hade ett delta på 5%, genomsnittet var 17%, sämst var 45%
Jämfört med alla testade enheter
» 0% av alla testade enheter var bättre, 0% liknande, 100% sämre
» Den bästa hade ett delta på 4%, genomsnittet var 23%, sämst var 134%
Energiförvaltning
Effektförbrukning
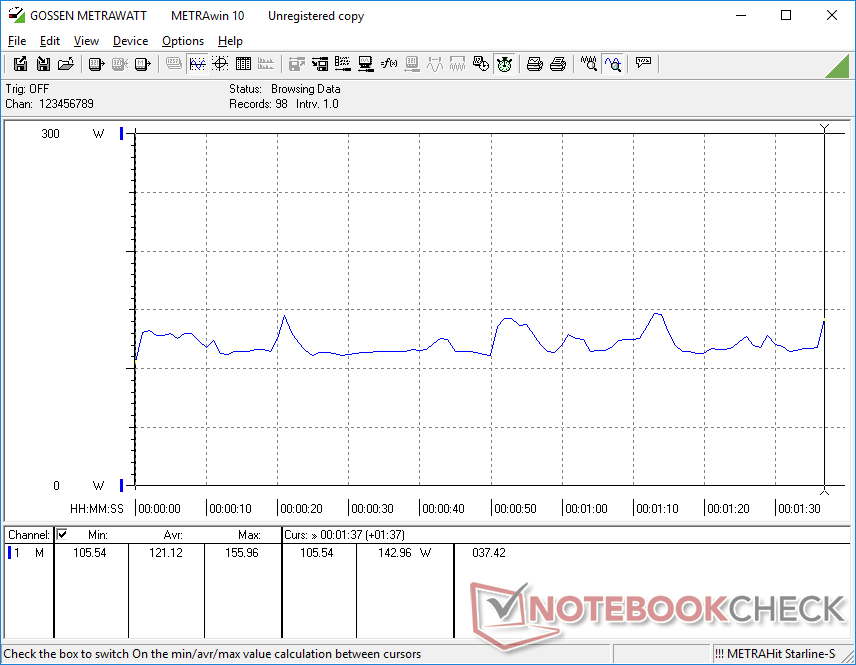
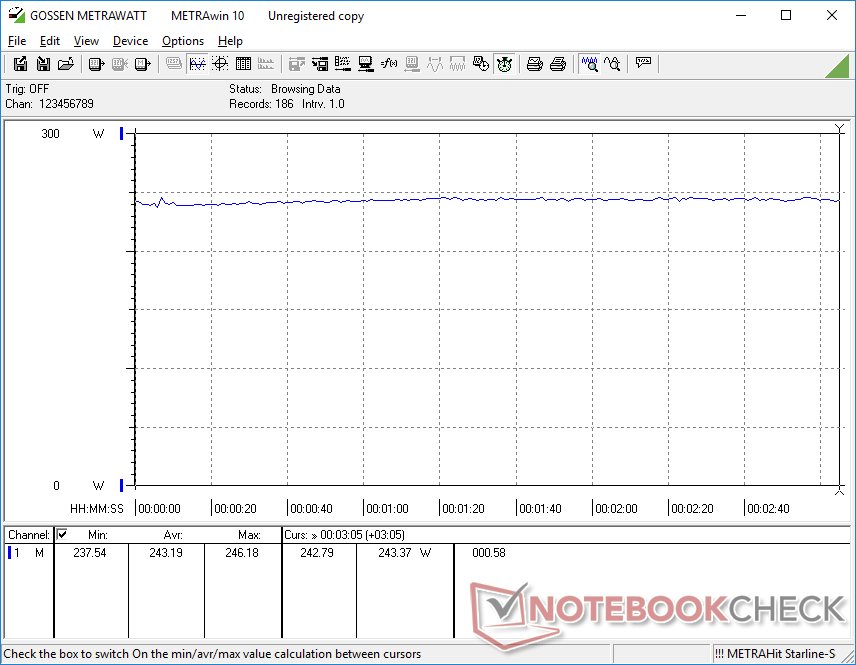
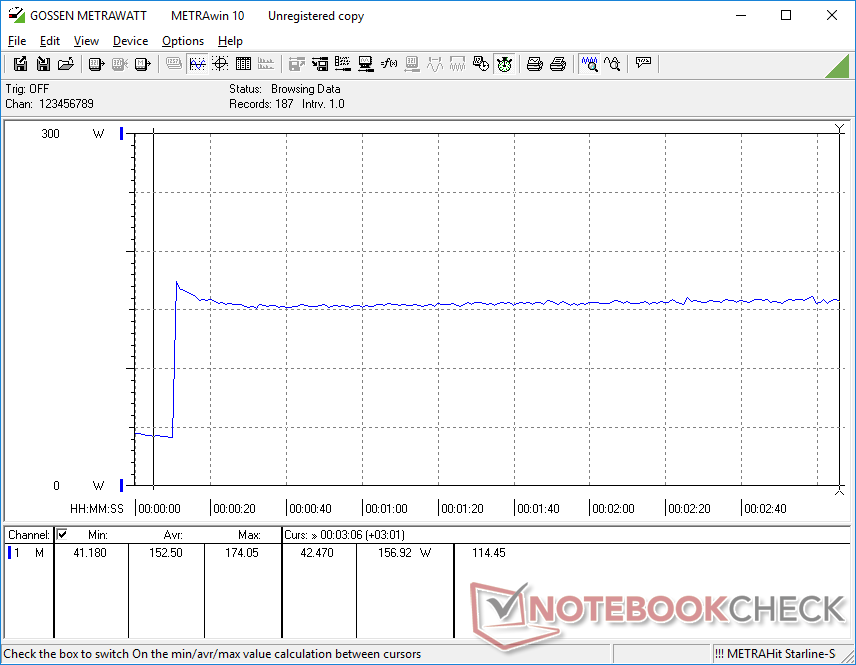
Vid tomgång på skrivbordet med den lägsta ljusstyrkan och strömprofilen skulle det krävas knappt 13 W för att vara jämförbart med XMG Pro 17 E22. Detta kan dock stiga till så mycket som 40 W om man använder den högsta ljusstyrkan och prestandakraftprofilen med den diskreta Nvidia GPU:n aktiv. Det rekommenderas att köra på lägre effektinställningar om den extra prestandan inte behövs på grund av de betydande energibesparingarna.
Strömförbrukning vid drift Witcher 3 är nästan identisk med vad vi registrerade på denMSI Raider GE77 som är utrustad med samma GPU. Systemet är mycket mer krävande än äldre bärbara speldatorer med GeForce RTX 2080, t.ex.Lenovo Legion 7 15 med över 80 W
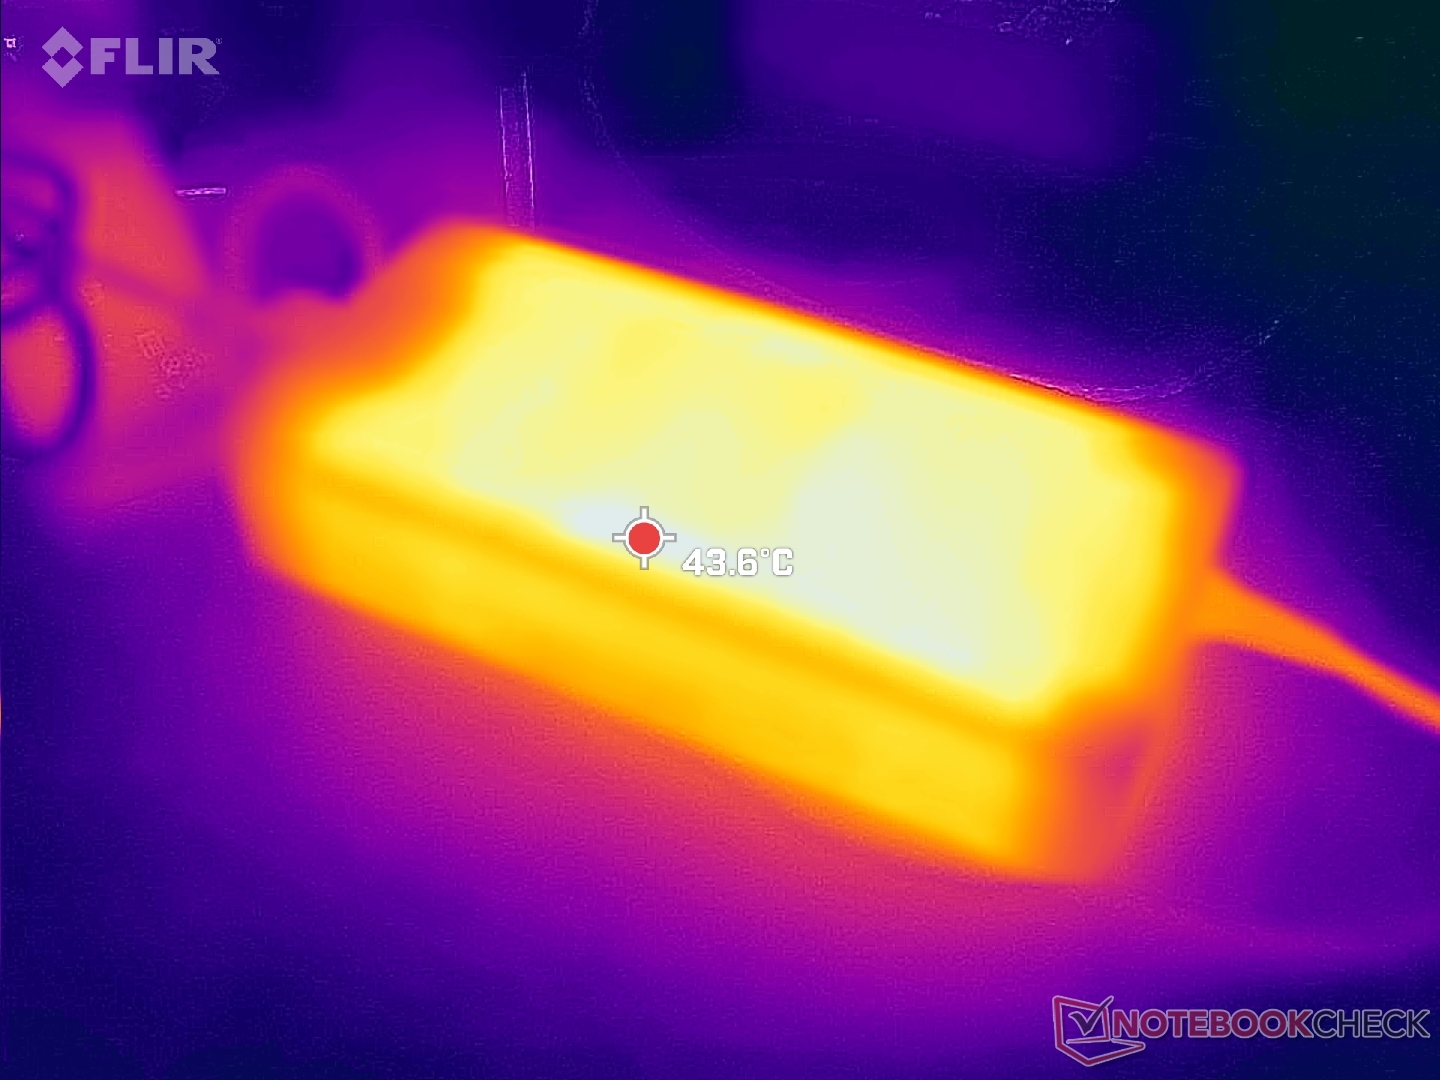
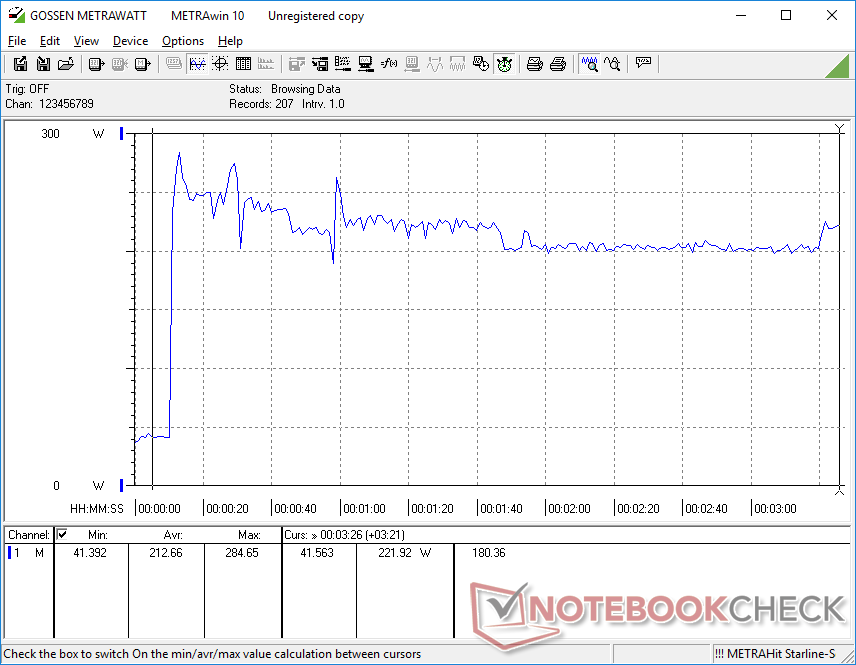
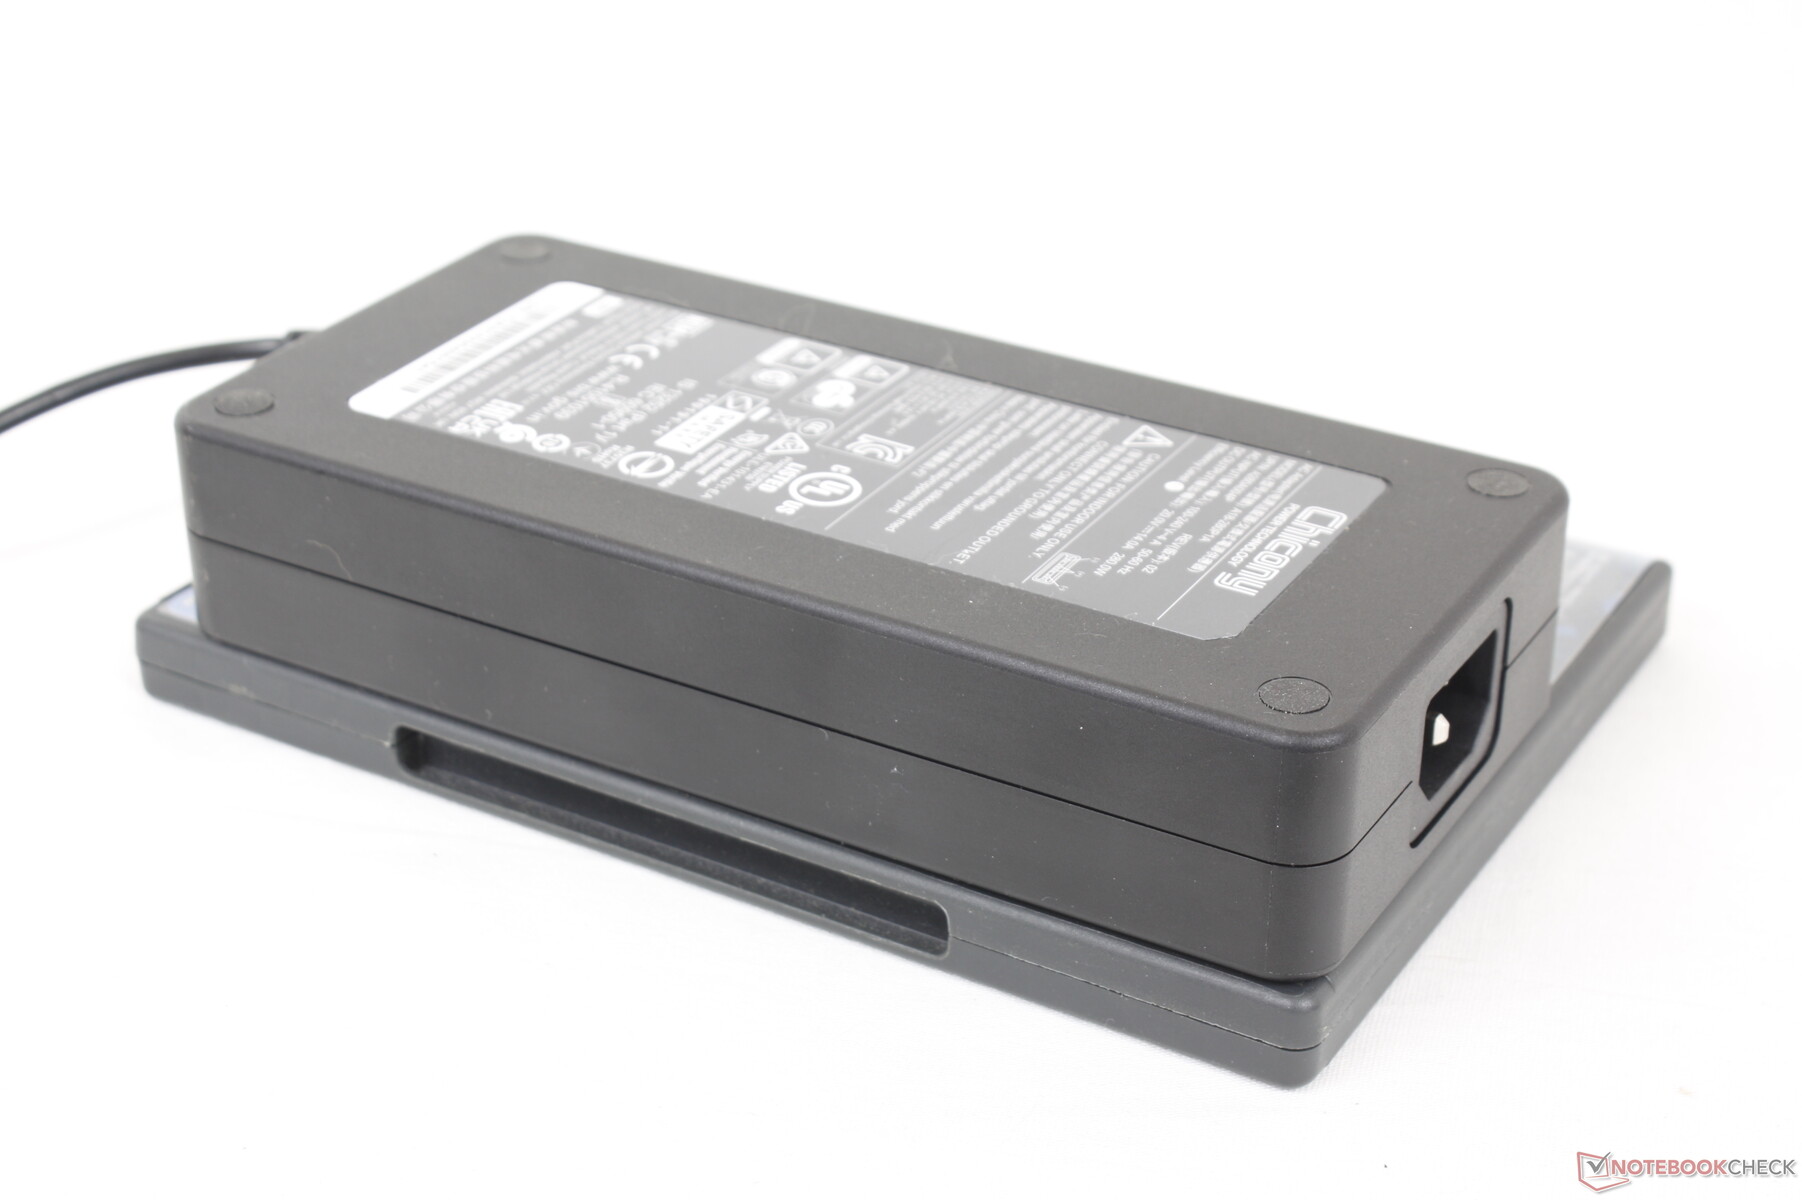
Vi kan registrera ett maximalt uttag på 285 W från den stora (~18 x 8,5 x 3,5 cm) 280 W AC-adaptern när både CPU och GPU är 100 procent utnyttjade. Den här hastigheten är endast tillfällig som vår graf nedan visar på grund av termiska begränsningar. Systemet kan fortfarande köra spel och ladda i en rimlig takt samtidigt.
| Av/Standby | |
| Låg belastning | |
| Hög belastning |
|
Förklaring:
min: | |
| Eurocom Nightsky TXi317 i7-12700H, GeForce RTX 3080 Ti Laptop GPU, Samsung SSD 980 Pro 1TB MZ-V8P1T0BW, IPS, 1920x1080, 17.3" | Schenker XMG Pro 17 E22 i9-12900H, GeForce RTX 3080 Ti Laptop GPU, Samsung SSD 980 Pro 1TB MZ-V8P1T0BW, IPS, 2560x1440, 17.3" | Aorus 17X XES i9-12900HX, GeForce RTX 3070 Ti Laptop GPU, Gigabyte AG470S1TB-SI B10, IPS, 1920x1080, 17.3" | MSI Raider GE77 HX 12UHS i9-12900HX, GeForce RTX 3080 Ti Laptop GPU, Samsung PM9A1 MZVL22T0HBLB, IPS, 3840x2160, 17.3" | Razer Blade 17 Early 2022 i9-12900H, GeForce RTX 3080 Ti Laptop GPU, Samsung PM9A1 MZVL21T0HCLR, IPS, 3840x2160, 17.3" | Alienware x17 R2 P48E i9-12900HK, GeForce RTX 3080 Ti Laptop GPU, 2x Samsung PM9A1 1TB (RAID 0), IPS, 1920x1080, 17.3" | |
|---|---|---|---|---|---|---|
| Power Consumption | 17% | -6% | 4% | 6% | -25% | |
| Idle Minimum * (Watt) | 12.8 | 13 -2% | 18 -41% | 13 -2% | 17 -33% | 24.1 -88% |
| Idle Average * (Watt) | 33.9 | 17 50% | 28 17% | 19 44% | 23 32% | 28.5 16% |
| Idle Maximum * (Watt) | 39.1 | 26 34% | 36 8% | 29 26% | 34 13% | 60 -53% |
| Load Average * (Watt) | 121.1 | 120 1% | 153 -26% | 143 -18% | 120 1% | 128.7 -6% |
| Witcher 3 ultra * (Watt) | 243 | 221 9% | 221 9% | 247 -2% | 229 6% | 254 -5% |
| Load Maximum * (Watt) | 284.7 | 266 7% | 290 -2% | 352 -24% | 243 15% | 323 -13% |
* ... mindre är bättre
Power Consumption Witcher 3 / Stresstest
Power Consumption external Monitor
Batteritid
WLAN-driftstiden är kort med drygt 4 timmars surfning i verkligheten innan du behöver ladda. Vår enhet var inställd på strömprofilen Balanserad med iGPU:n aktiv innan vi körde batteritidstestet. Resultaten liknar Razer Blade 17 eller Razer Blade 17 Aorus 17X men fortfarande över två timmar kortare än för Schenker XMG Pro 17 E22.
Laddningen från tom till full kapacitet är mycket långsam och tar cirka 2,5 timmar. De flesta bärbara datorer för spel tar bara 1,5 till 2 timmar i jämförelse. Systemet kan inte laddas via USB-C.
| Eurocom Nightsky TXi317 i7-12700H, GeForce RTX 3080 Ti Laptop GPU, 80 Wh | Schenker XMG Pro 17 E22 i9-12900H, GeForce RTX 3080 Ti Laptop GPU, 80 Wh | Aorus 17X XES i9-12900HX, GeForce RTX 3070 Ti Laptop GPU, 99 Wh | MSI Raider GE77 HX 12UHS i9-12900HX, GeForce RTX 3080 Ti Laptop GPU, 99.99 Wh | Razer Blade 17 Early 2022 i9-12900H, GeForce RTX 3080 Ti Laptop GPU, 82 Wh | Alienware x17 R2 P48E i9-12900HK, GeForce RTX 3080 Ti Laptop GPU, 87 Wh | |
|---|---|---|---|---|---|---|
| Batteridrifttid | 62% | 5% | 29% | -10% | -52% | |
| WiFi v1.3 (h) | 4.2 | 6.8 62% | 4.4 5% | 5.4 29% | 3.8 -10% | 2 -52% |
| H.264 (h) | 4.6 | 3.8 | 6.5 | 4.8 | ||
| Load (h) | 1.5 | 1.4 | 2 | 1.7 | 0.8 | |
| Reader / Idle (h) | 9.8 | 7.1 | 3.9 |
För
Emot
Omdöme - Behöver en chassiuppdatering
Eurocom Nightsky TXi317 har CPU- och GPU-prestanda som en stor bärbar dator med flaggskepp för spel, men utan många av de extrafunktioner som vi förväntar oss av en mellanstor design. Mest anmärkningsvärt är att modellen inte kan köra SSD-diskar under längre perioder utan att behöva strypa överföringshastigheterna. Målgruppen av prestandaanvändare är snarare besvikna över att de inte kan utnyttja sina nya PCIe4 x4-enheter fullt ut. Alternativ som Alienware x17eller MSI GE66 serien har vanligtvis värmespridare över sina interna SSD-diskar av just denna anledning.
Eurocom Nightsky TXi317 har prestanda som en dyr spellaptop men saknar många av de grundläggande och avancerade extrafunktioner som en sådan har.
Fler mindre nackdelar är den mycket lågupplösta webbkameran, ingen sekretesslucka, avsaknad av USB-C PD-stöd, ingen Advanced Optimus, inga Wi-Fi 6E-alternativ och de mycket varma kärntemperaturerna som når nästan 90 C när man spelar. Chassit hamnar även på efterkälken när det gäller service eftersom bottenpanelen tar längre tid att ta bort än på de flesta andra bärbara speldatorer nuförtiden. För 3 000 dollar och uppåt erbjuder Nightsky TXi317 helt enkelt inte alls lika mycket som andra high-end konkurrenter.
Pris och tillgänglighet
Nightsky TXi317 kan köpas direkt från Eurocom här i olika konfigurationer från 3000 USD.
Eurocom Nightsky TXi317
- 10/26/2022 v7 (old)
Allen Ngo
Price comparison

