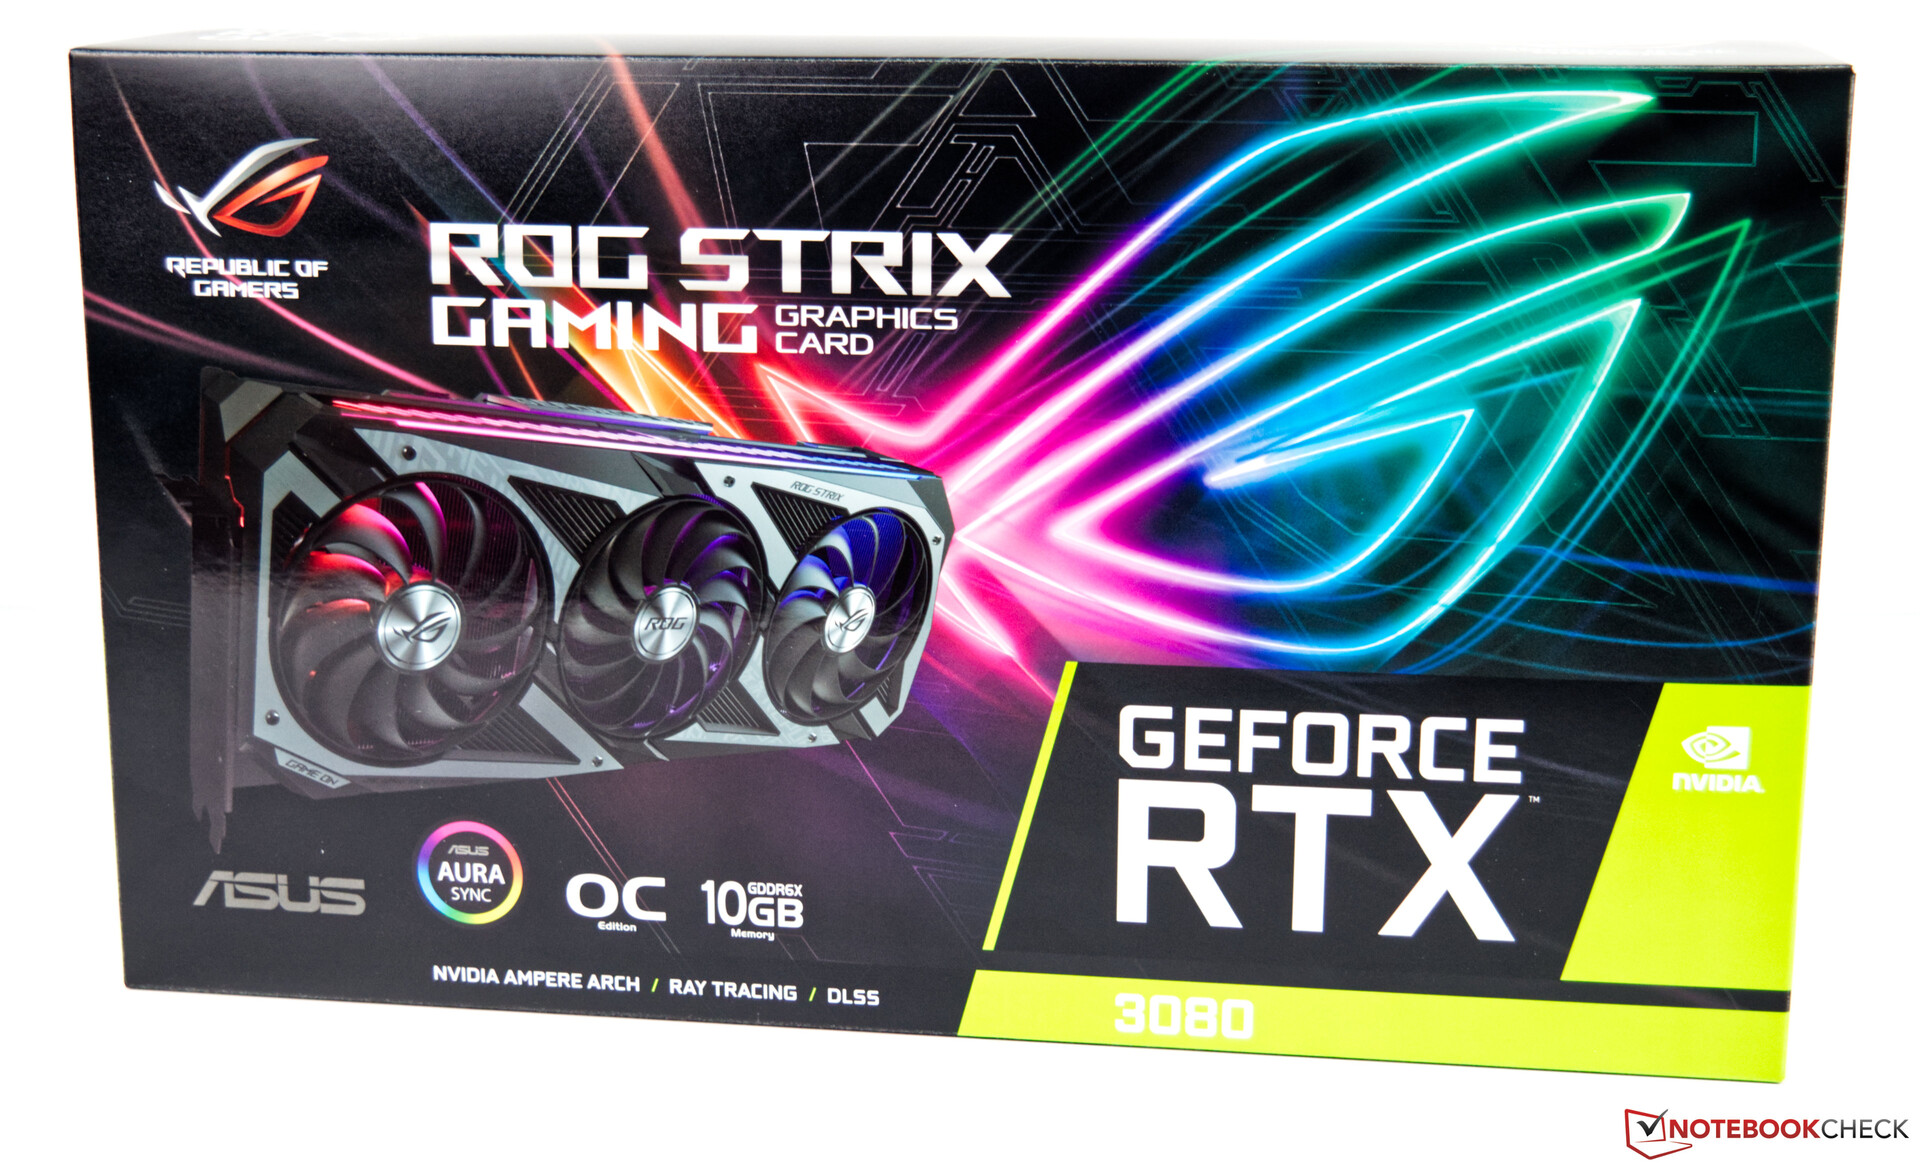
Test: Asus GeForce RTX 3080 ROG Strix Gaming OC (Sammanfattning)


| Unigine Superposition | |
| 1280x720 720p Low | |
| Titan RTX | |
| Asus GeForce RTX 3080 ROG Strix Gaming OC | |
| 1920x1080 1080p High | |
| GeForce RTX 3090 | |
| Asus GeForce RTX 3080 ROG Strix Gaming OC | |
| Titan RTX | |
| 1920x1080 1080p Extreme | |
| GeForce RTX 3090 | |
| Asus GeForce RTX 3080 ROG Strix Gaming OC | |
| Titan RTX | |
| 3840x2160 4k Optimized | |
| GeForce RTX 3090 | |
| Asus GeForce RTX 3080 ROG Strix Gaming OC | |
| Titan RTX | |
| 7680x4320 8k Optimized | |
| GeForce RTX 3090 | |
| Asus GeForce RTX 3080 ROG Strix Gaming OC | |
| Titan RTX | |
| Unigine Heaven 4.0 | |
| Extreme Preset OpenGL | |
| Asus GeForce RTX 3080 ROG Strix Gaming OC | |
| Titan RTX | |
| GeForce RTX 2080 Ti (Desktop) | |
| GeForce RTX 2080 Super (Desktop) | |
| GeForce RTX 2080 (Desktop) | |
| GeForce RTX 2070 Super (Desktop) | |
| GeForce RTX 2070 (Desktop) | |
| GeForce RTX 2060 Super (Desktop) | |
| GeForce RTX 2060 (Desktop) | |
| Radeon RX 5700 XT (Desktop) | |
| Radeon VII | |
| Radeon RX 5700 (Desktop) | |
| Extreme Preset DX11 | |
| GeForce RTX 3090 | |
| Titan RTX | |
| Asus GeForce RTX 3080 ROG Strix Gaming OC | |
| GeForce RTX 2080 Ti (Desktop) | |
| GeForce RTX 2080 (Desktop) | |
| GeForce RTX 2080 Super (Desktop) | |
| GeForce RTX 2070 Super (Desktop) | |
| GeForce RTX 2070 (Desktop) | |
| GeForce RTX 2060 Super (Desktop) | |
| Radeon VII | |
| Radeon RX 5700 XT (Desktop) | |
| GeForce RTX 2060 (Desktop) | |
| Radeon RX 5700 (Desktop) | |
| Unigine Valley 1.0 | |
| 1920x1080 Extreme HD DirectX AA:x8 | |
| GeForce RTX 3090 | |
| Titan RTX | |
| Asus GeForce RTX 3080 ROG Strix Gaming OC | |
| GeForce RTX 2080 Ti (Desktop) | |
| GeForce RTX 2080 Super (Desktop) | |
| GeForce RTX 2080 (Desktop) | |
| GeForce RTX 2070 Super (Desktop) | |
| GeForce RTX 2070 (Desktop) | |
| Radeon VII | |
| GeForce RTX 2060 Super (Desktop) | |
| Radeon RX 5700 XT (Desktop) | |
| Radeon RX 5700 (Desktop) | |
| GeForce RTX 2060 (Desktop) | |
| 1920x1080 Extreme HD Preset OpenGL AA:x8 | |
| Asus GeForce RTX 3080 ROG Strix Gaming OC | |
| Titan RTX | |
| GeForce RTX 2080 Ti (Desktop) | |
| GeForce RTX 2080 Super (Desktop) | |
| GeForce RTX 2080 (Desktop) | |
| GeForce RTX 2070 Super (Desktop) | |
| GeForce RTX 2070 (Desktop) | |
| GeForce RTX 2060 Super (Desktop) | |
| Radeon RX 5700 XT (Desktop) | |
| GeForce RTX 2060 (Desktop) | |
| Radeon RX 5700 (Desktop) | |
| Radeon VII | |
| SiSoft Sandra 2016 | |
| GP Financial Analysis (FP High/Double Precision) | |
| Radeon VII | |
| Asus GeForce RTX 3080 ROG Strix Gaming OC | |
| GeForce RTX 2080 Ti (Desktop) | |
| GeForce RTX 2080 (Desktop) | |
| GeForce RTX 2080 Super (Desktop) | |
| GeForce RTX 2070 Super (Desktop) | |
| GeForce RTX 2070 (Desktop) | |
| GeForce RTX 2060 Super (Desktop) | |
| GeForce RTX 2060 (Desktop) | |
| Radeon RX 5700 XT (Desktop) | |
| Radeon RX 5700 (Desktop) | |
| GP Cryptography (Higher Security AES256+SHA2-512) | |
| Asus GeForce RTX 3080 ROG Strix Gaming OC | |
| GeForce RTX 2080 Ti (Desktop) | |
| GeForce RTX 2080 (Desktop) | |
| Radeon VII | |
| GeForce RTX 2080 Super (Desktop) | |
| GeForce RTX 2070 Super (Desktop) | |
| GeForce RTX 2070 (Desktop) | |
| GeForce RTX 2060 Super (Desktop) | |
| GeForce RTX 2060 (Desktop) | |
| Image Processing | |
| Asus GeForce RTX 3080 ROG Strix Gaming OC | |
| Radeon VII | |
| GeForce RTX 2080 Ti (Desktop) | |
| GeForce RTX 2080 Super (Desktop) | |
| GeForce RTX 2080 (Desktop) | |
| GeForce RTX 2070 Super (Desktop) | |
| GeForce RTX 2070 (Desktop) | |
| GeForce RTX 2060 Super (Desktop) | |
| Radeon RX 5700 XT (Desktop) | |
| GeForce RTX 2060 (Desktop) | |
| Radeon RX 5700 (Desktop) | |
| 3DMark 05 Standard | 46192 poäng | |
| 3DMark 06 Standard Score | 44255 poäng | |
| 3DMark Vantage P Result | 93066 poäng | |
| 3DMark 11 Performance | 32211 poäng | |
| 3DMark Ice Storm Standard Score | 238949 poäng | |
| 3DMark Cloud Gate Standard Score | 75364 poäng | |
| 3DMark Fire Strike Score | 33440 poäng | |
| 3DMark Fire Strike Extreme Score | 20455 poäng | |
| 3DMark Time Spy Score | 15712 poäng | |
Hjälp | ||
The Witcher 3 frame progression - Ultra preset
| Far Cry New Dawn - 3840x2160 Ultra Preset | |
| GeForce RTX 3090 | |
| Asus GeForce RTX 3080 ROG Strix Gaming OC | |
| Titan RTX | |
| Titan RTX | |
| GeForce RTX 2080 Ti (Desktop) | |
| GeForce RTX 2080 Super (Desktop) | |
| GeForce RTX 2080 (Desktop) | |
| Radeon VII | |
| GeForce RTX 2070 Super (Desktop) | |
| Radeon RX 5700 XT (Desktop) | |
| GeForce RTX 2070 (Desktop) | |
| Radeon RX 5700 (Desktop) | |
| GeForce RTX 2060 Super (Desktop) | |
| RX Vega 64 | |
| GeForce RTX 2060 (Desktop) | |
| Far Cry 5 - 3840x2160 Ultra Preset AA:T | |
| GeForce RTX 3090 | |
| Asus GeForce RTX 3080 ROG Strix Gaming OC | |
| Titan RTX | |
| Titan RTX | |
| GeForce RTX 2080 Ti (Desktop) | |
| GeForce RTX 2080 Super (Desktop) | |
| GeForce RTX 2080 (Desktop) | |
| Radeon VII | |
| GeForce RTX 2070 Super (Desktop) | |
| Radeon RX 5700 XT (Desktop) | |
| GeForce RTX 2070 (Desktop) | |
| GeForce RTX 2060 Super (Desktop) | |
| Radeon RX 5700 (Desktop) | |
| RX Vega 64 | |
| GeForce RTX 2060 (Desktop) | |
| F1 2020 - 3840x2160 Ultra High Preset AA:T AF:16x | |
| GeForce RTX 3090 | |
| Asus GeForce RTX 3080 ROG Strix Gaming OC | |
| Titan RTX | |
| Borderlands 3 - 3840x2160 Badass Overall Quality (DX11) | |
| GeForce RTX 3090 | |
| Asus GeForce RTX 3080 ROG Strix Gaming OC | |
| Titan RTX | |
| Titan RTX | |
| GeForce RTX 2080 Ti (Desktop) | |
| Metro Exodus - 3840x2160 Ultra Quality AF:16x | |
| GeForce RTX 3090 | |
| Asus GeForce RTX 3080 ROG Strix Gaming OC | |
| Titan RTX | |
| Titan RTX | |
| GeForce RTX 2080 Ti (Desktop) | |
| RX Vega 64 | |
| GeForce RTX 2080 Super (Desktop) | |
| GeForce RTX 2080 (Desktop) | |
| Radeon VII | |
| GeForce RTX 2070 Super (Desktop) | |
| GeForce RTX 2070 (Desktop) | |
| GeForce RTX 2060 Super (Desktop) | |
| Radeon RX 5700 XT (Desktop) | |
| Radeon RX 5700 (Desktop) | |
| GeForce RTX 2060 (Desktop) | |
| Red Dead Redemption 2 - 3840x2160 Maximum Settings | |
| GeForce RTX 3090 | |
| Asus GeForce RTX 3080 ROG Strix Gaming OC | |
| Titan RTX | |
| Rise of the Tomb Raider - 3840x2160 High Preset AA:FX AF:4x | |
| Asus GeForce RTX 3080 ROG Strix Gaming OC | |
| GeForce RTX 2080 Ti (Desktop) | |
| GeForce RTX 2080 Super (Desktop) | |
| GeForce RTX 2080 (Desktop) | |
| GeForce RTX 2070 Super (Desktop) | |
| GeForce RTX 2070 (Desktop) | |
| Radeon VII | |
| GeForce RTX 2060 Super (Desktop) | |
| RX Vega 64 | |
| GeForce RTX 2060 (Desktop) | |
| Shadow of the Tomb Raider - 3840x2160 Highest Preset AA:T | |
| GeForce RTX 3090 | |
| Asus GeForce RTX 3080 ROG Strix Gaming OC | |
| Titan RTX | |
| Titan RTX | |
| GeForce RTX 2080 Ti (Desktop) | |
| GeForce RTX 2080 Super (Desktop) | |
| GeForce RTX 2080 (Desktop) | |
| Radeon VII | |
| GeForce RTX 2070 Super (Desktop) | |
| GeForce RTX 2070 (Desktop) | |
| Radeon RX 5700 XT (Desktop) | |
| GeForce RTX 2060 Super (Desktop) | |
| Radeon RX 5700 (Desktop) | |
| GeForce RTX 2060 (Desktop) | |
| RX Vega 64 | |
| låg | med. | hög | ultra | QHD | 4K | |
|---|---|---|---|---|---|---|
| GTA V (2015) | 187 | 187 | 184 | 130 | 122 | 136 |
| The Witcher 3 (2015) | 427 | 375 | 286 | 152 | 115 | |
| Dota 2 Reborn (2015) | 216.6 | 197.1 | 184.4 | 168.7 | 159.1 | |
| Rise of the Tomb Raider (2016) | 327 | 231 | 217 | 217 | 107 | |
| Final Fantasy XV Benchmark (2018) | 228 | 205 | 156 | 124 | 76.1 | |
| X-Plane 11.11 (2018) | 165 | 153 | 123 | 105 | ||
| Far Cry 5 (2018) | 184 | 162 | 155 | 145 | 137 | 95 |
| Strange Brigade (2018) | 567 | 416 | 336 | 289 | 220 | 135 |
| Shadow of the Tomb Raider (2018) | 227 | 206 | 198 | 185 | 147 | 83.9 |
| Battlefield V (2018) | 192 | 178 | 163 | 152 | 132 | 94.2 |
| Apex Legends (2019) | 144 | 144 | 144 | 144 | 144 | 143 |
| Far Cry New Dawn (2019) | 150 | 132 | 127 | 115 | 110 | 89 |
| Metro Exodus (2019) | 212 | 155 | 143 | 111 | 92.2 | 64.1 |
| The Division 2 (2019) | 240 | 197 | 168 | 140 | 107 | 65 |
| Anno 1800 (2019) | 142 | 139 | 99.3 | 54.1 | 52.5 | 46.3 |
| Rage 2 (2019) | 294 | 209 | 182 | 180 | 134 | 72.1 |
| Control (2019) | 240 | 196 | 155 | 106 | 56.2 | |
| Borderlands 3 (2019) | 165 | 143 | 129 | 128 | 103 | 61.5 |
| Star Wars Jedi Fallen Order (2019) | 134 | 132 | 133 | 132 | 92.9 | |
| Red Dead Redemption 2 (2019) | 167 | 154 | 135 | 96 | 81 | 56 |
| Hunt Showdown (2020) | 236 | 173 | 172 | 155 | 95.8 | |
| Doom Eternal (2020) | 283 | 277 | 270 | 268 | 248 | 153 |
| F1 2020 (2020) | 367 | 255 | 239 | 185 | 155 | 118 |
| Horizon Zero Dawn (2020) | 164 | 151 | 147 | 141 | 133 | 95 |
| Flight Simulator 2020 (2020) | 115 | 97.4 | 79.9 | 62.8 | 55.6 | 37.3 |
| Serious Sam 4 (2020) | 182.5 | 148.6 | 138.1 | 135.2 | 124.8 | 117 |
| Mafia Definitive Edition (2020) | 199 | 184 | 169 | 137 | 78.2 | |
| Star Wars Squadrons (2020) | 586 | 433 | 379 | 358 | 266 | 169 |
| FIFA 21 (2020) | 306 | 312 | 293 | 295 | 295 | 284 |
| Watch Dogs Legion (2020) | 147 | 146 | 125 | 103 | 81.6 | 54.1 |
| Dirt 5 (2020) | 176 | 121 | 111 | 111 | 69.1 | 55.3 |
| LuxMark v2.0 64Bit | |
| Room GPUs-only | |
| Zotac Gaming GeForce RTX 3090 Trinity | |
| ASUS GeForce RTX 3080 ROG STRIX OC GAMING | |
| Nvidia Titan RTX | |
| MSI RTX 2080 Ti Gaming X Trio | |
| KFA2 GeForce RTX 2080 Ti EX | |
| AMD Radeon VII | |
| MSI RTX 2080 Gaming X Trio | |
| Nvidia GeForce RTX 2080 Super | |
| Nvidia GeForce RTX 2070 Super | |
| MSI RTX 2070 Gaming Z 8G | |
| Nvidia GeForce RTX 2060 Super | |
| MSI RTX 2060 Gaming Z 6G | |
| AMD Radeon RX 5700 XT | |
| AMD Radeon RX 5700 | |
| Sala GPUs-only | |
| Zotac Gaming GeForce RTX 3090 Trinity | |
| ASUS GeForce RTX 3080 ROG STRIX OC GAMING | |
| Nvidia Titan RTX | |
| MSI RTX 2080 Ti Gaming X Trio | |
| KFA2 GeForce RTX 2080 Ti EX | |
| MSI RTX 2080 Gaming X Trio | |
| Nvidia GeForce RTX 2080 Super | |
| Nvidia GeForce RTX 2070 Super | |
| MSI RTX 2070 Gaming Z 8G | |
| Nvidia GeForce RTX 2060 Super | |
| AMD Radeon VII | |
| AMD Radeon RX 5700 XT | |
| MSI RTX 2060 Gaming Z 6G | |
| AMD Radeon RX 5700 | |
| Power Consumption | |
| 1920x1080 The Witcher 3 ultra (external Monitor) | |
| ASUS GeForce RTX 3080 ROG STRIX OC GAMING (Idle: 88.3 W) | |
| KFA2 GeForce RTX 2080 Ti EX (Idle: 100.5 W) | |
| AMD Radeon RX Vega 64 (Idle: 74.3 W) | |
| MSI RTX 2080 Gaming X Trio (Idle: 87.78 W) | |
| Nvidia GeForce RTX 2080 Super (Idle: 78.87 W) | |
| AMD Radeon RX 5700 XT (Idle: 69.8 W) | |
| Nvidia GeForce RTX 2070 Super (96.8 fps, Idle: 80.5 W) | |
| MSI RTX 2070 Gaming Z 8G (Idle: 73.3 W) | |
| AMD Radeon VII (Idle: 81.39 W) | |
| Nvidia GeForce RTX 2060 Super (82.7 fps, Idle: 77.12 W) | |
| AMD Radeon RX 5700 (84.2 fps, Idle: 64.5 W) | |
| MSI RTX 2060 Gaming Z 6G (Idle: 74.66 W) | |
| 1280x720 FurMark 1.19 GPU Stress Test (external Monitor) | |
| ASUS GeForce RTX 3080 ROG STRIX OC GAMING (Idle: 88.3 W) | |
| AMD Radeon VII (Idle: 81.39 W) | |
| MSI RTX 2080 Gaming X Trio | |
| KFA2 GeForce RTX 2080 Ti EX (Idle: 100.5 W) | |
| Nvidia GeForce RTX 2080 Super (Idle: 78.87 W) | |
| MSI RTX 2070 Gaming Z 8G (Idle: 73.3 W) | |
| AMD Radeon RX 5700 XT (239 fps, Idle: 69.8 W) | |
| Nvidia GeForce RTX 2070 Super (283 fps, Idle: 80.5 W) | |
| MSI RTX 2060 Gaming Z 6G (Idle: 74.66 W) | |
| Nvidia GeForce RTX 2060 Super (237 fps, Idle: 77.12 W) | |
| AMD Radeon RX 5700 (207 fps, Idle: 64.5 W) | |
* ... mindre är bättre
För
Emot
Läs den fullständiga versionen av den här recensionen på engelska här.
Med GeForce RTX 3080 ROG Strix Gaming OC har Asus onekligen släppt ett riktigt snabbt grafikkort. Det kan spela alla de senaste spelen. Men det är bara när man spelar i en upplösning högre än 1080p som det här grafikkortet verkligen börjar kännas bra. Där kan den nya Ampere-generationen verkligen skilja sig från Turing. Om du dessutom har DLSS och Ray Tracing på är fördelarna med den nya arkitekturen ännu större. Men man får leva med en nackdel i fråga om VRAM jämfört med RTX 2080 Ti, för RTX 3080 har 10 GB jämfört med 11 GB på 2080 Ti. På lång sikt kan detta leda till fall för RTX 3080, för AMD har redan utannonserat sina tre toppmodeller från 6000-serien och de har alla 16 GB VRAM. Det går många rykten kring vad Nvidia ska hitta på härnäst och det påstås att ett RTX 3080 Ti med fler shaders och 20 GB VRAM redan är under konstruktion.
Men vad hjälper det med ett snabbt grafikkort om det inte går att få tag på? Nvidia, och därmed också deras kort-partners, har redan kastat bort en del potential eftersom de inte kan möta efterfrågan. Enligt interna rapporter lär den situationen fortsätta ända in i 2021.
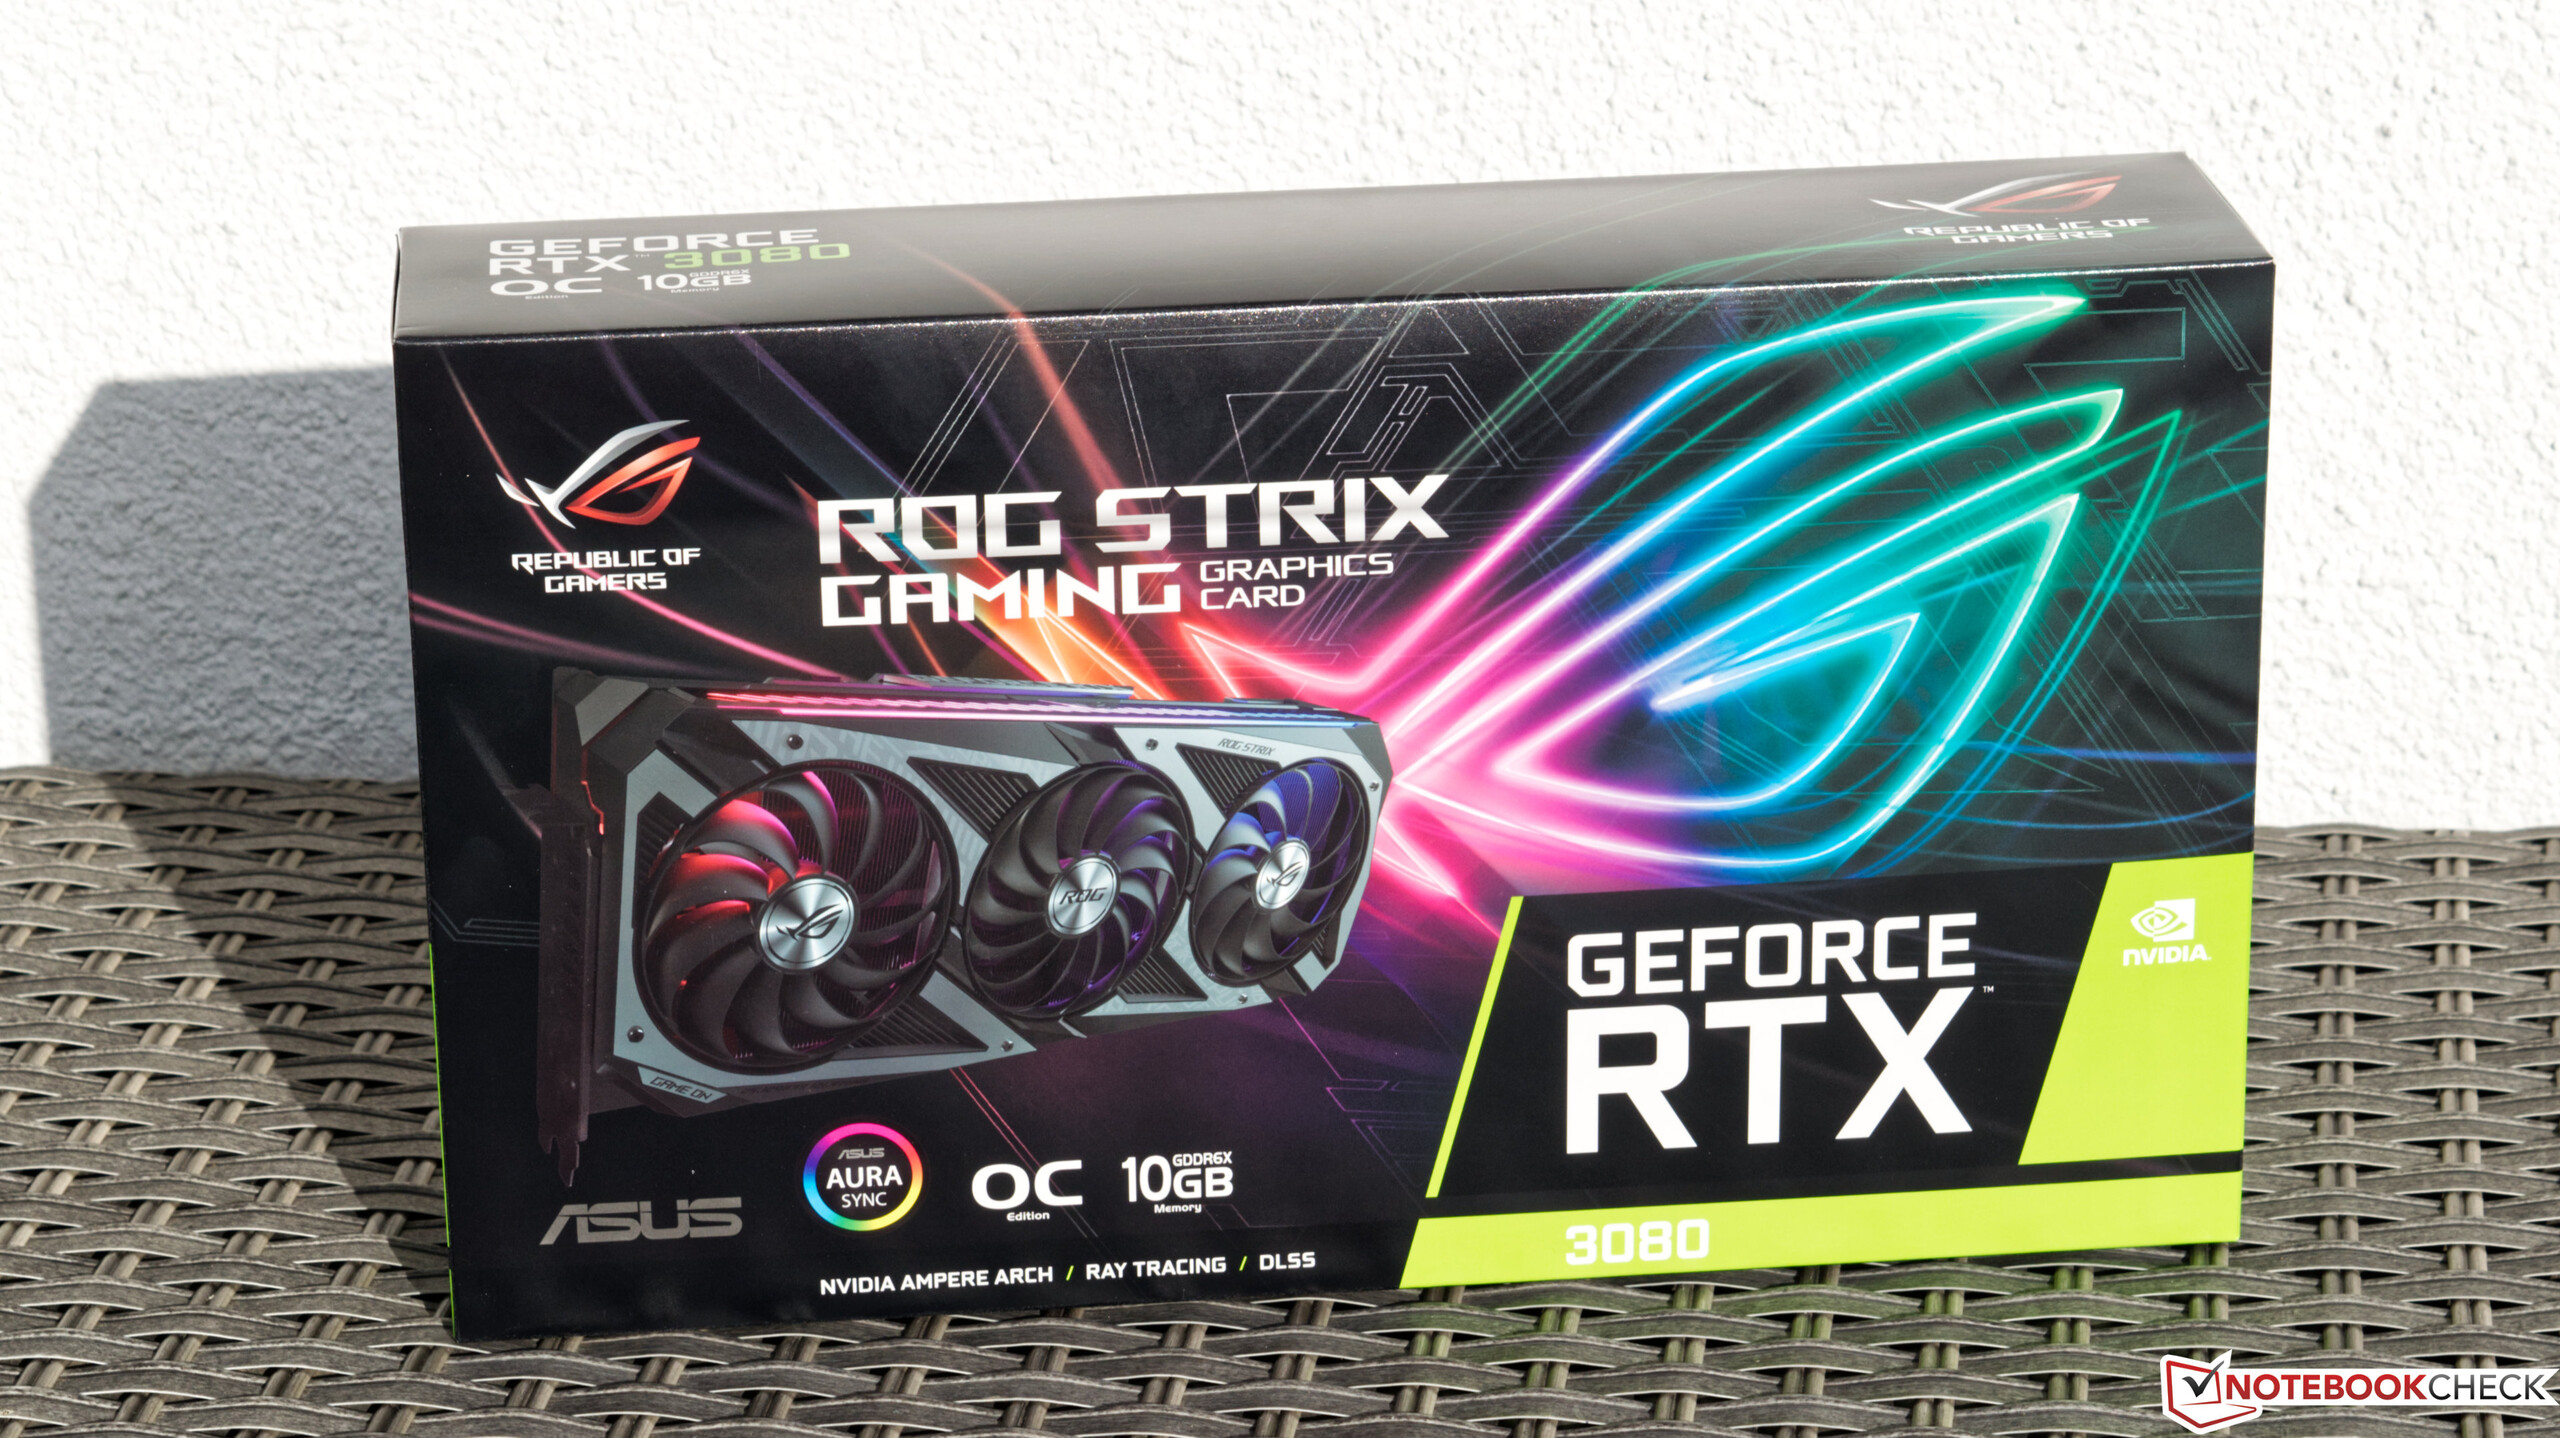
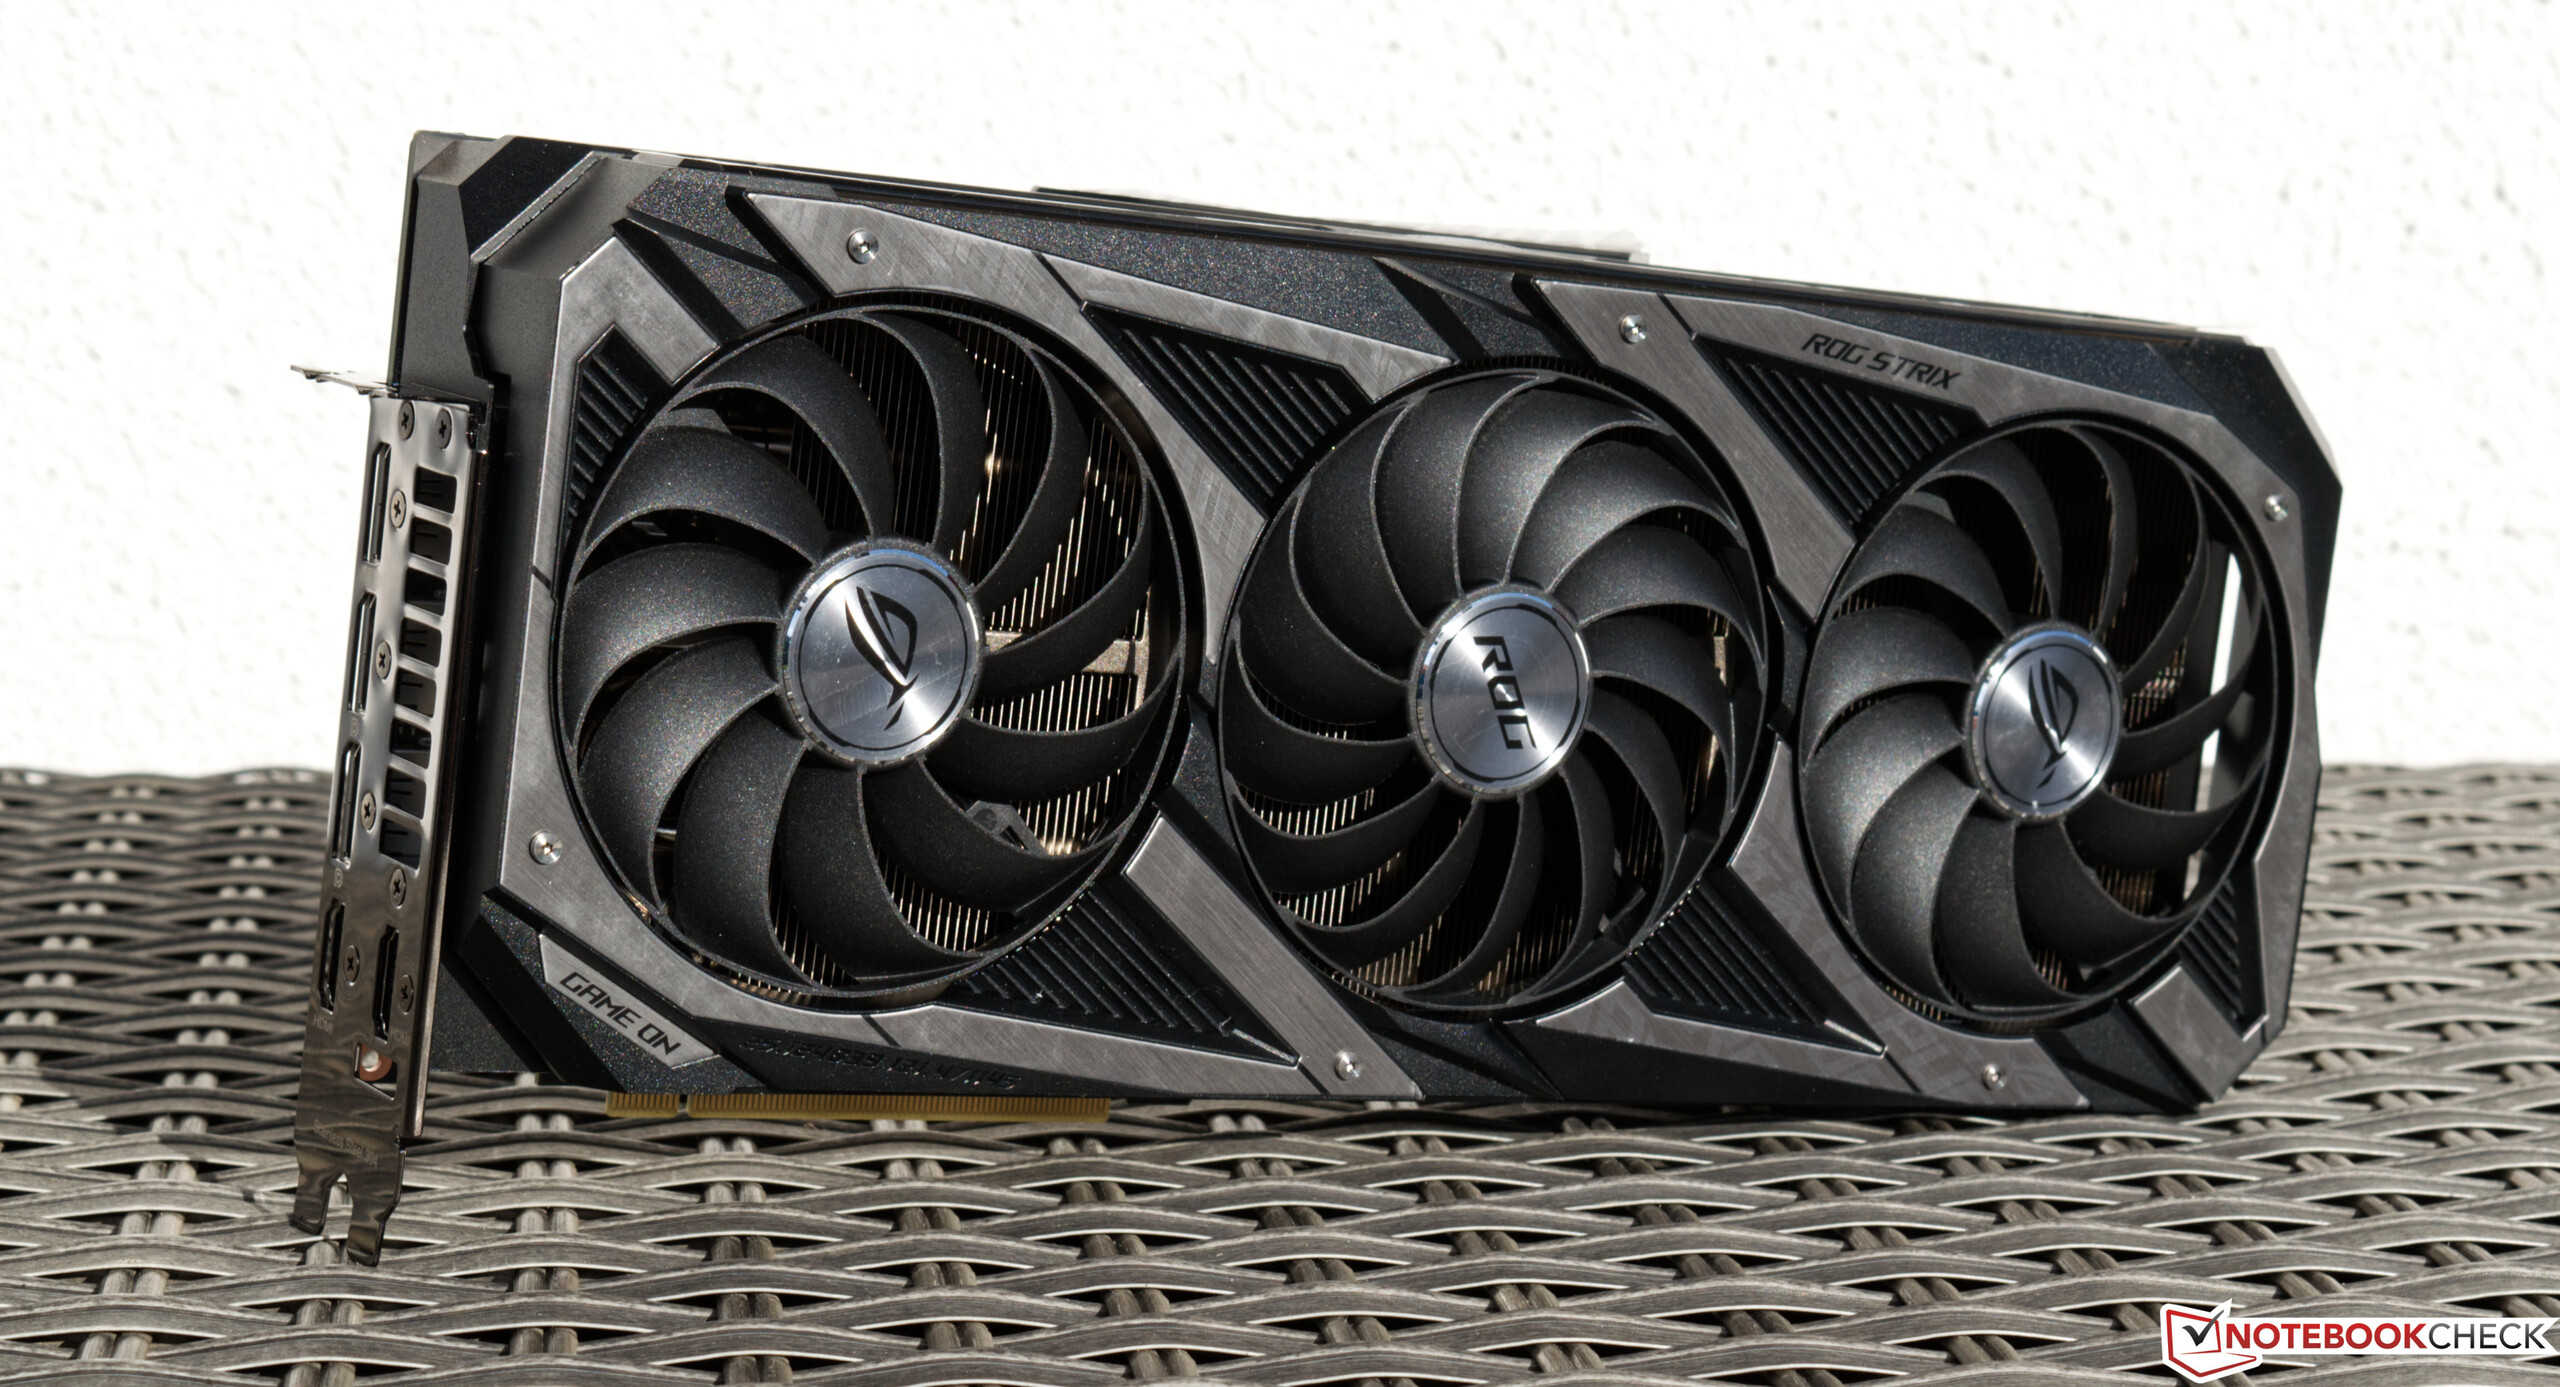
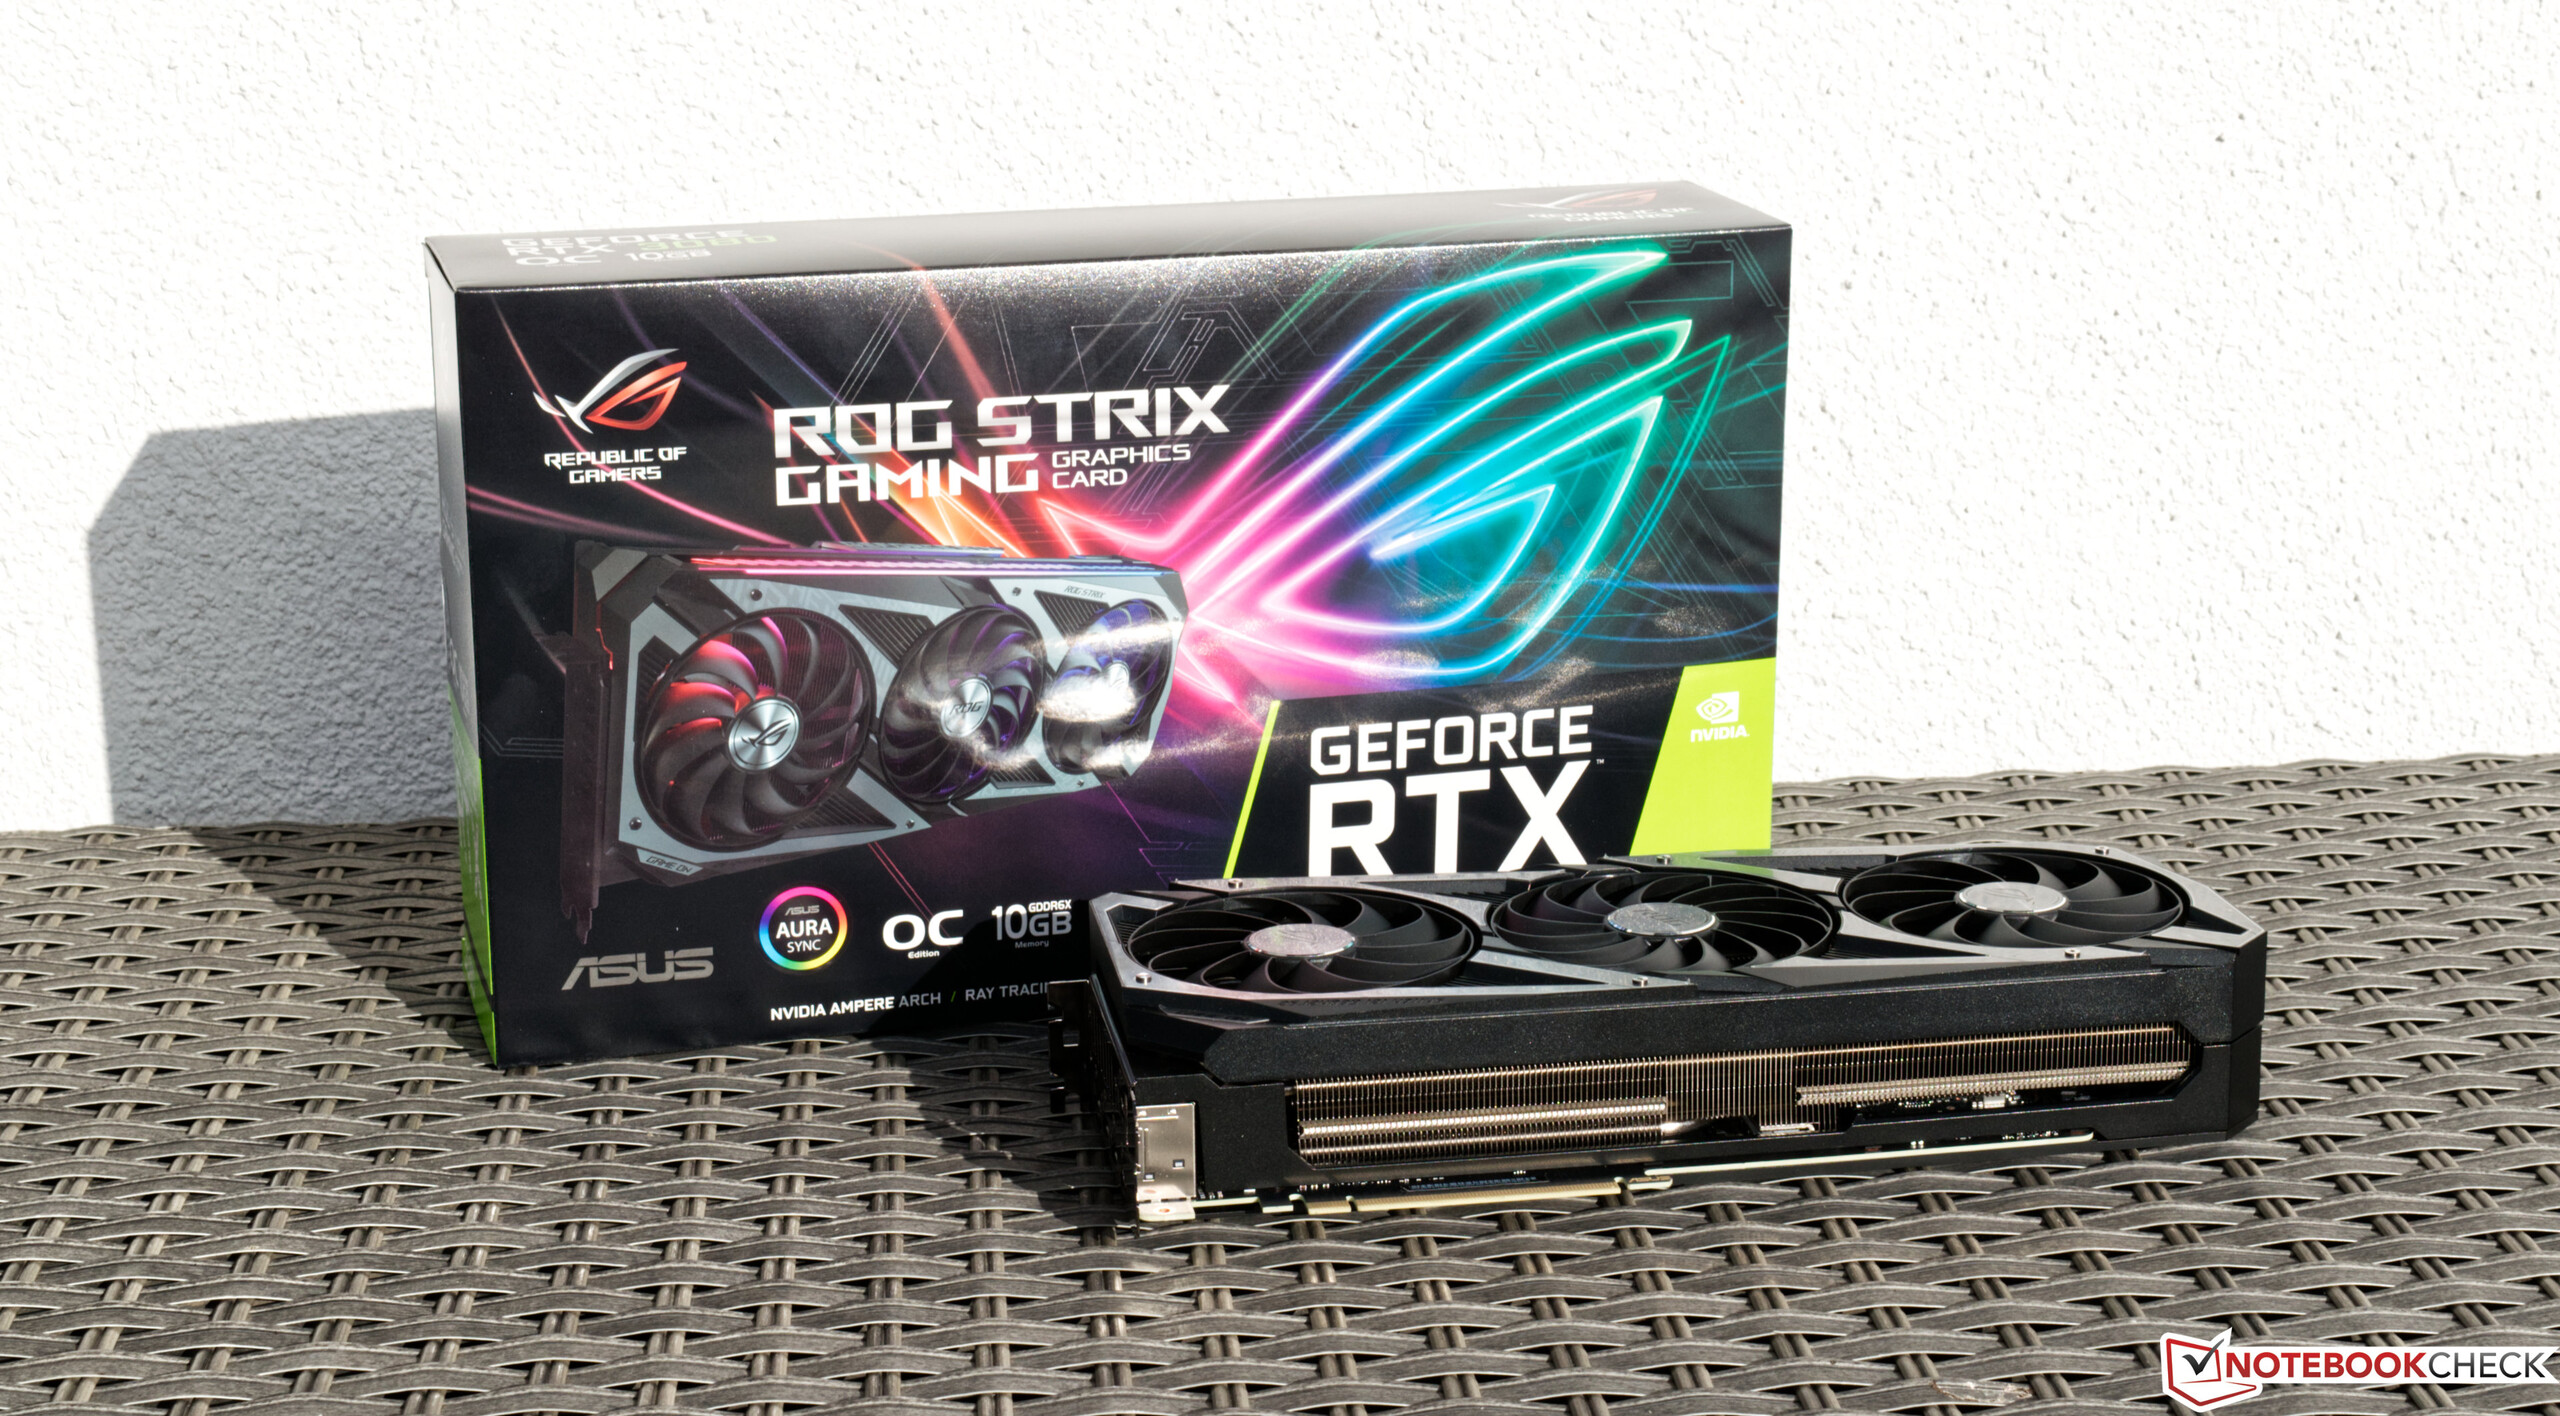
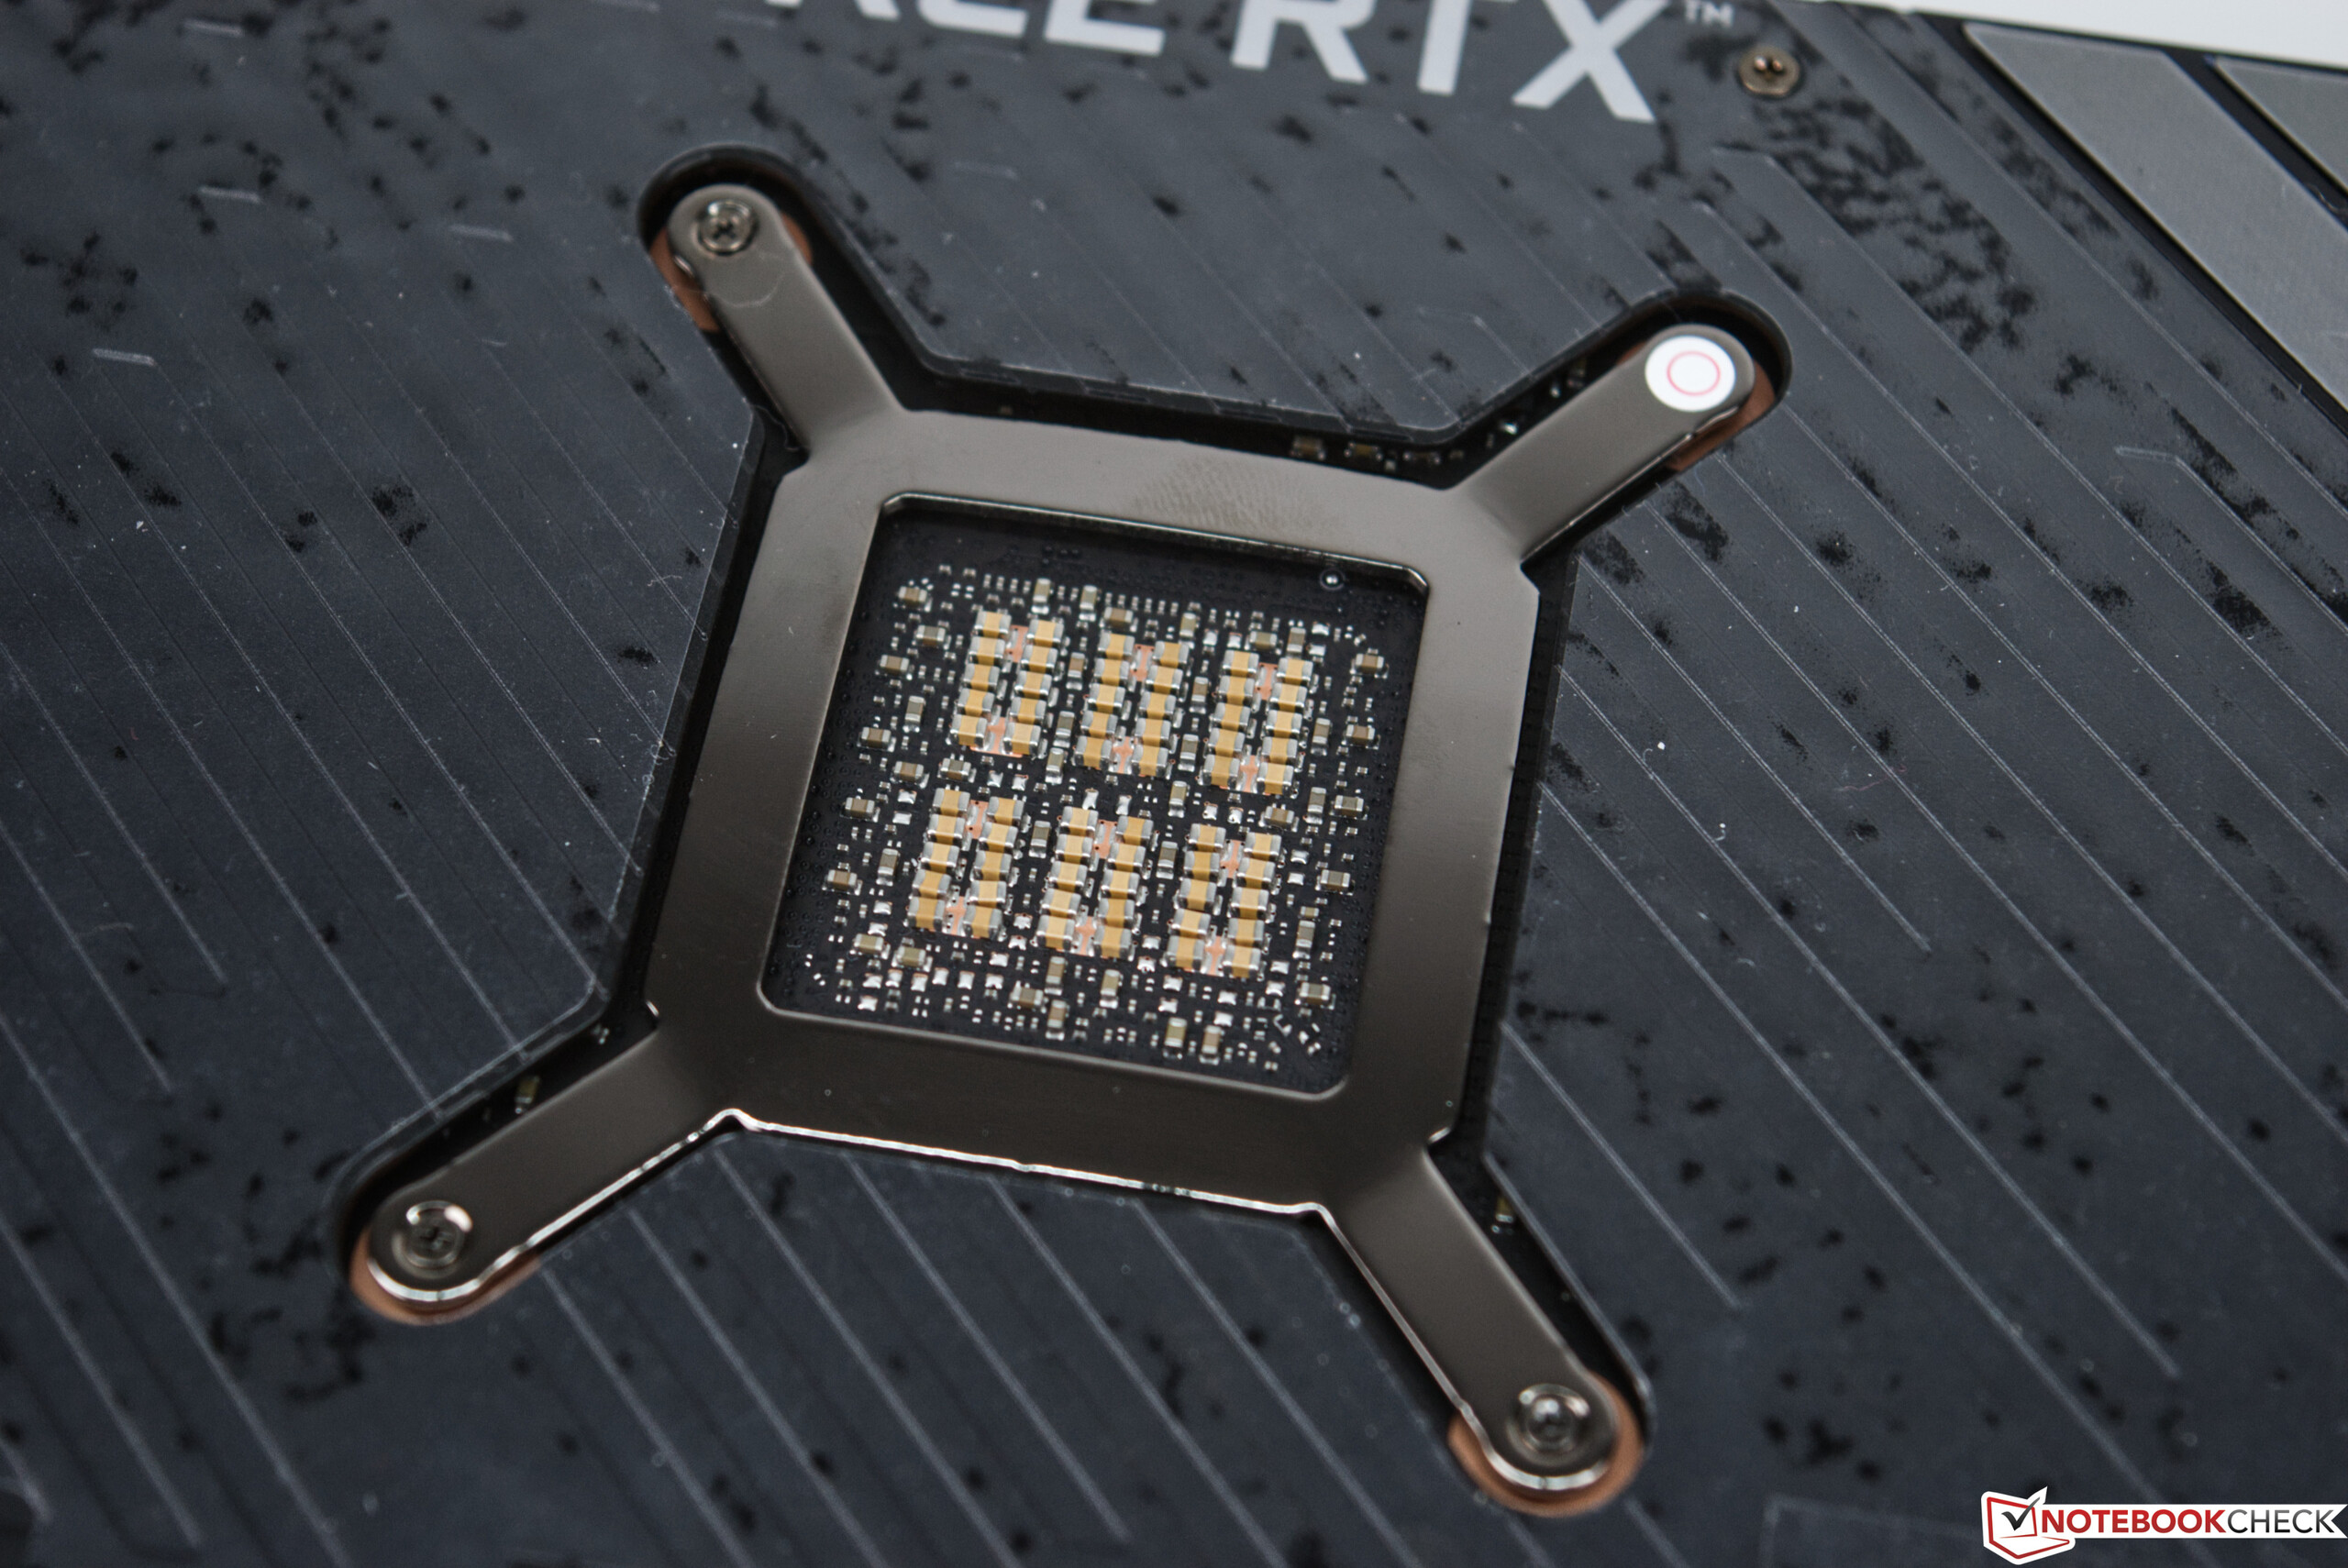
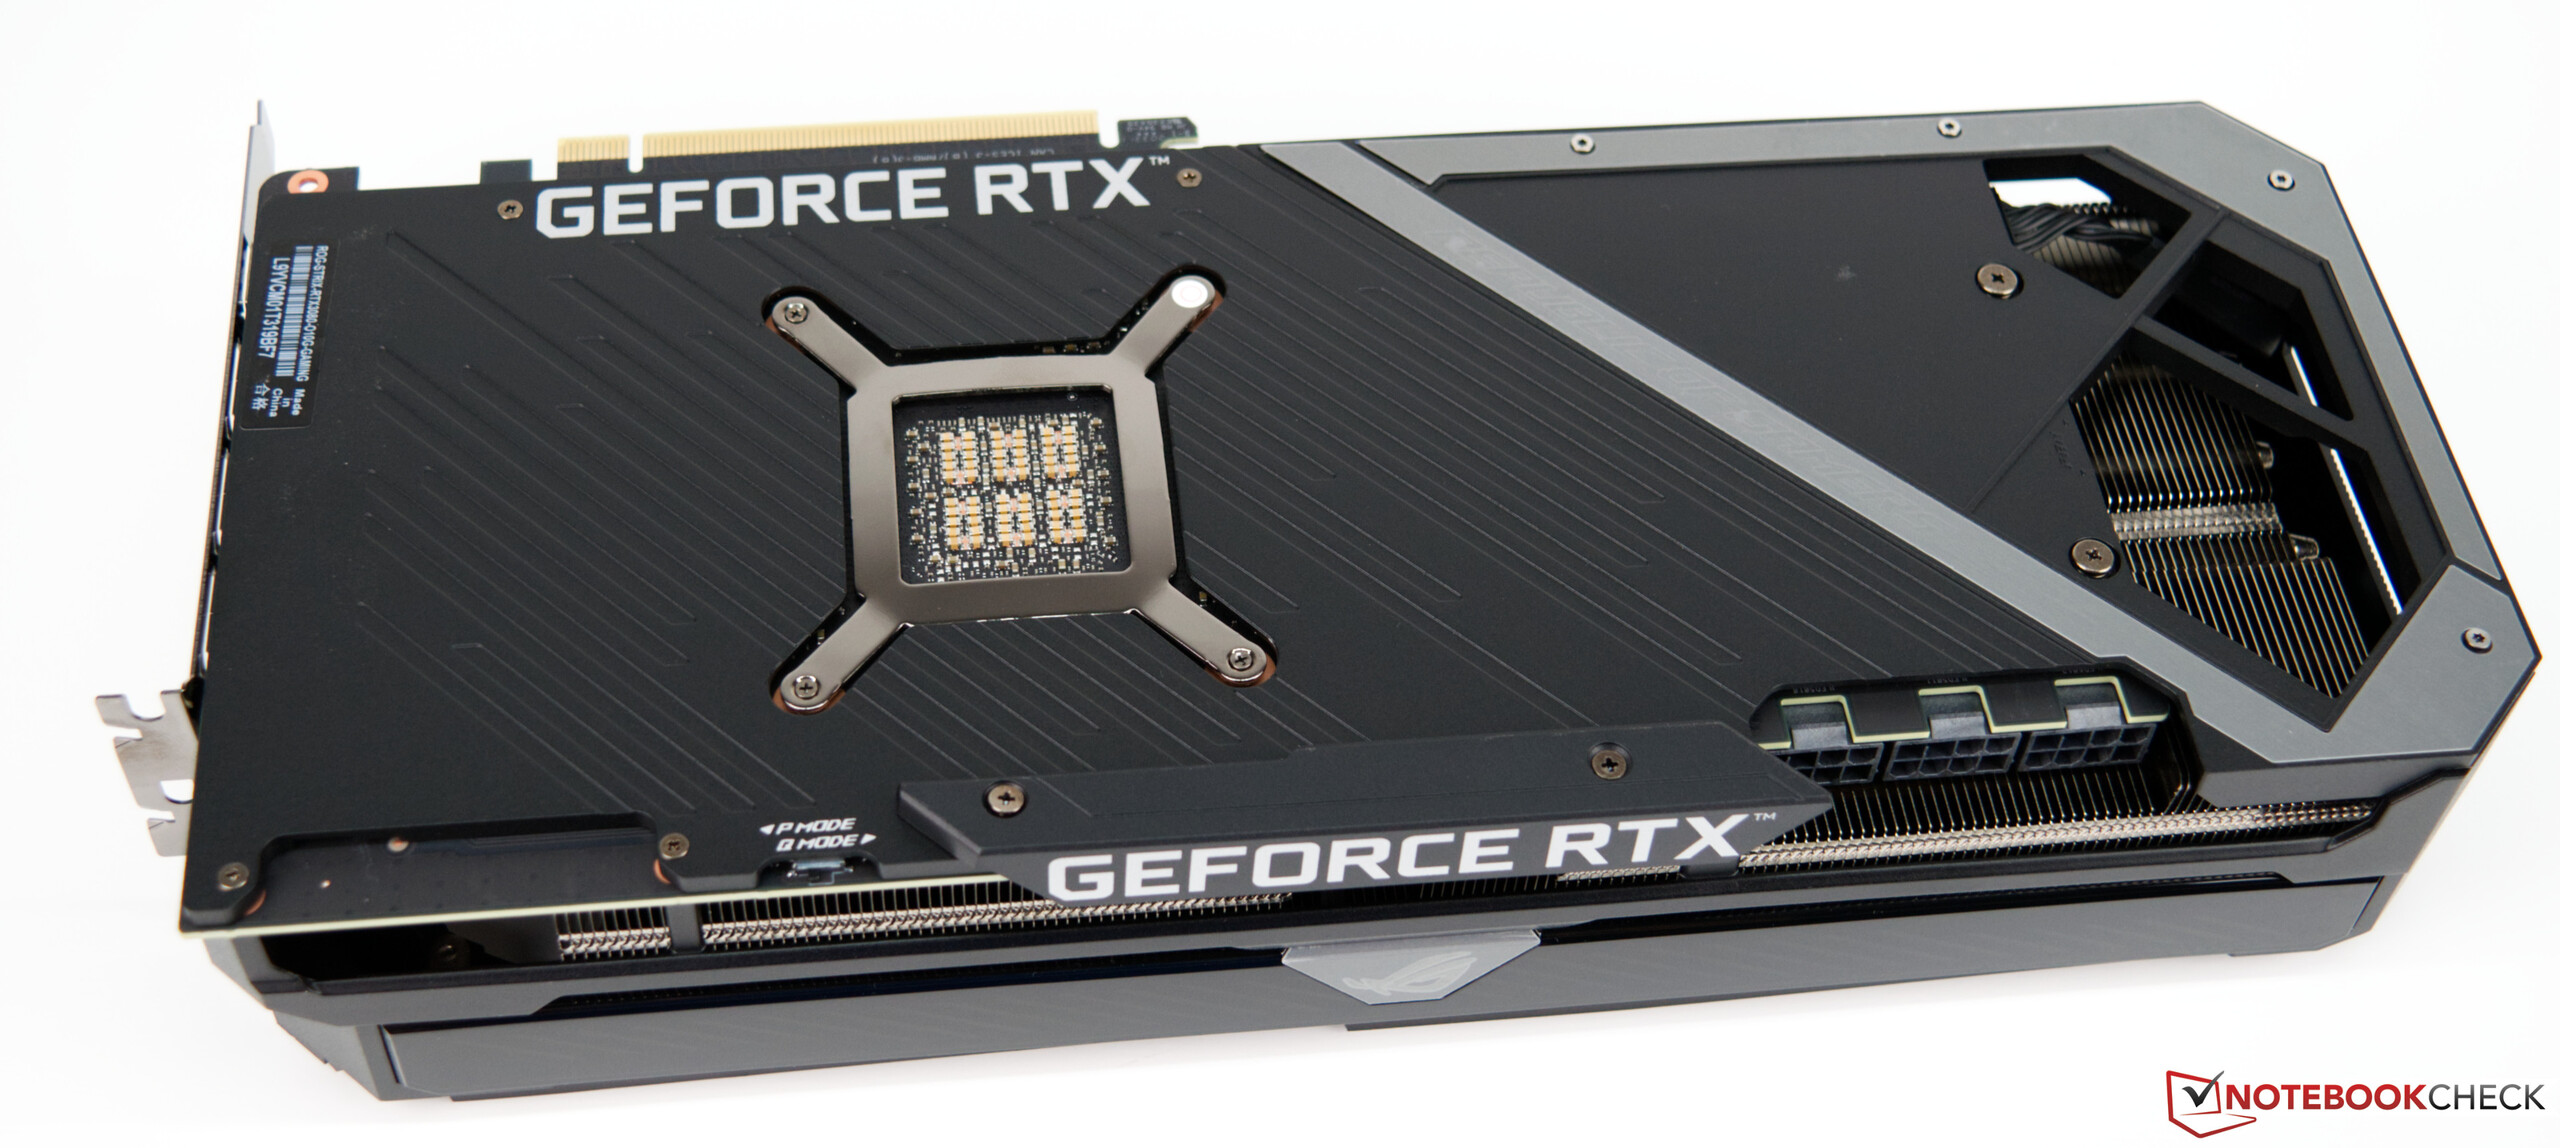
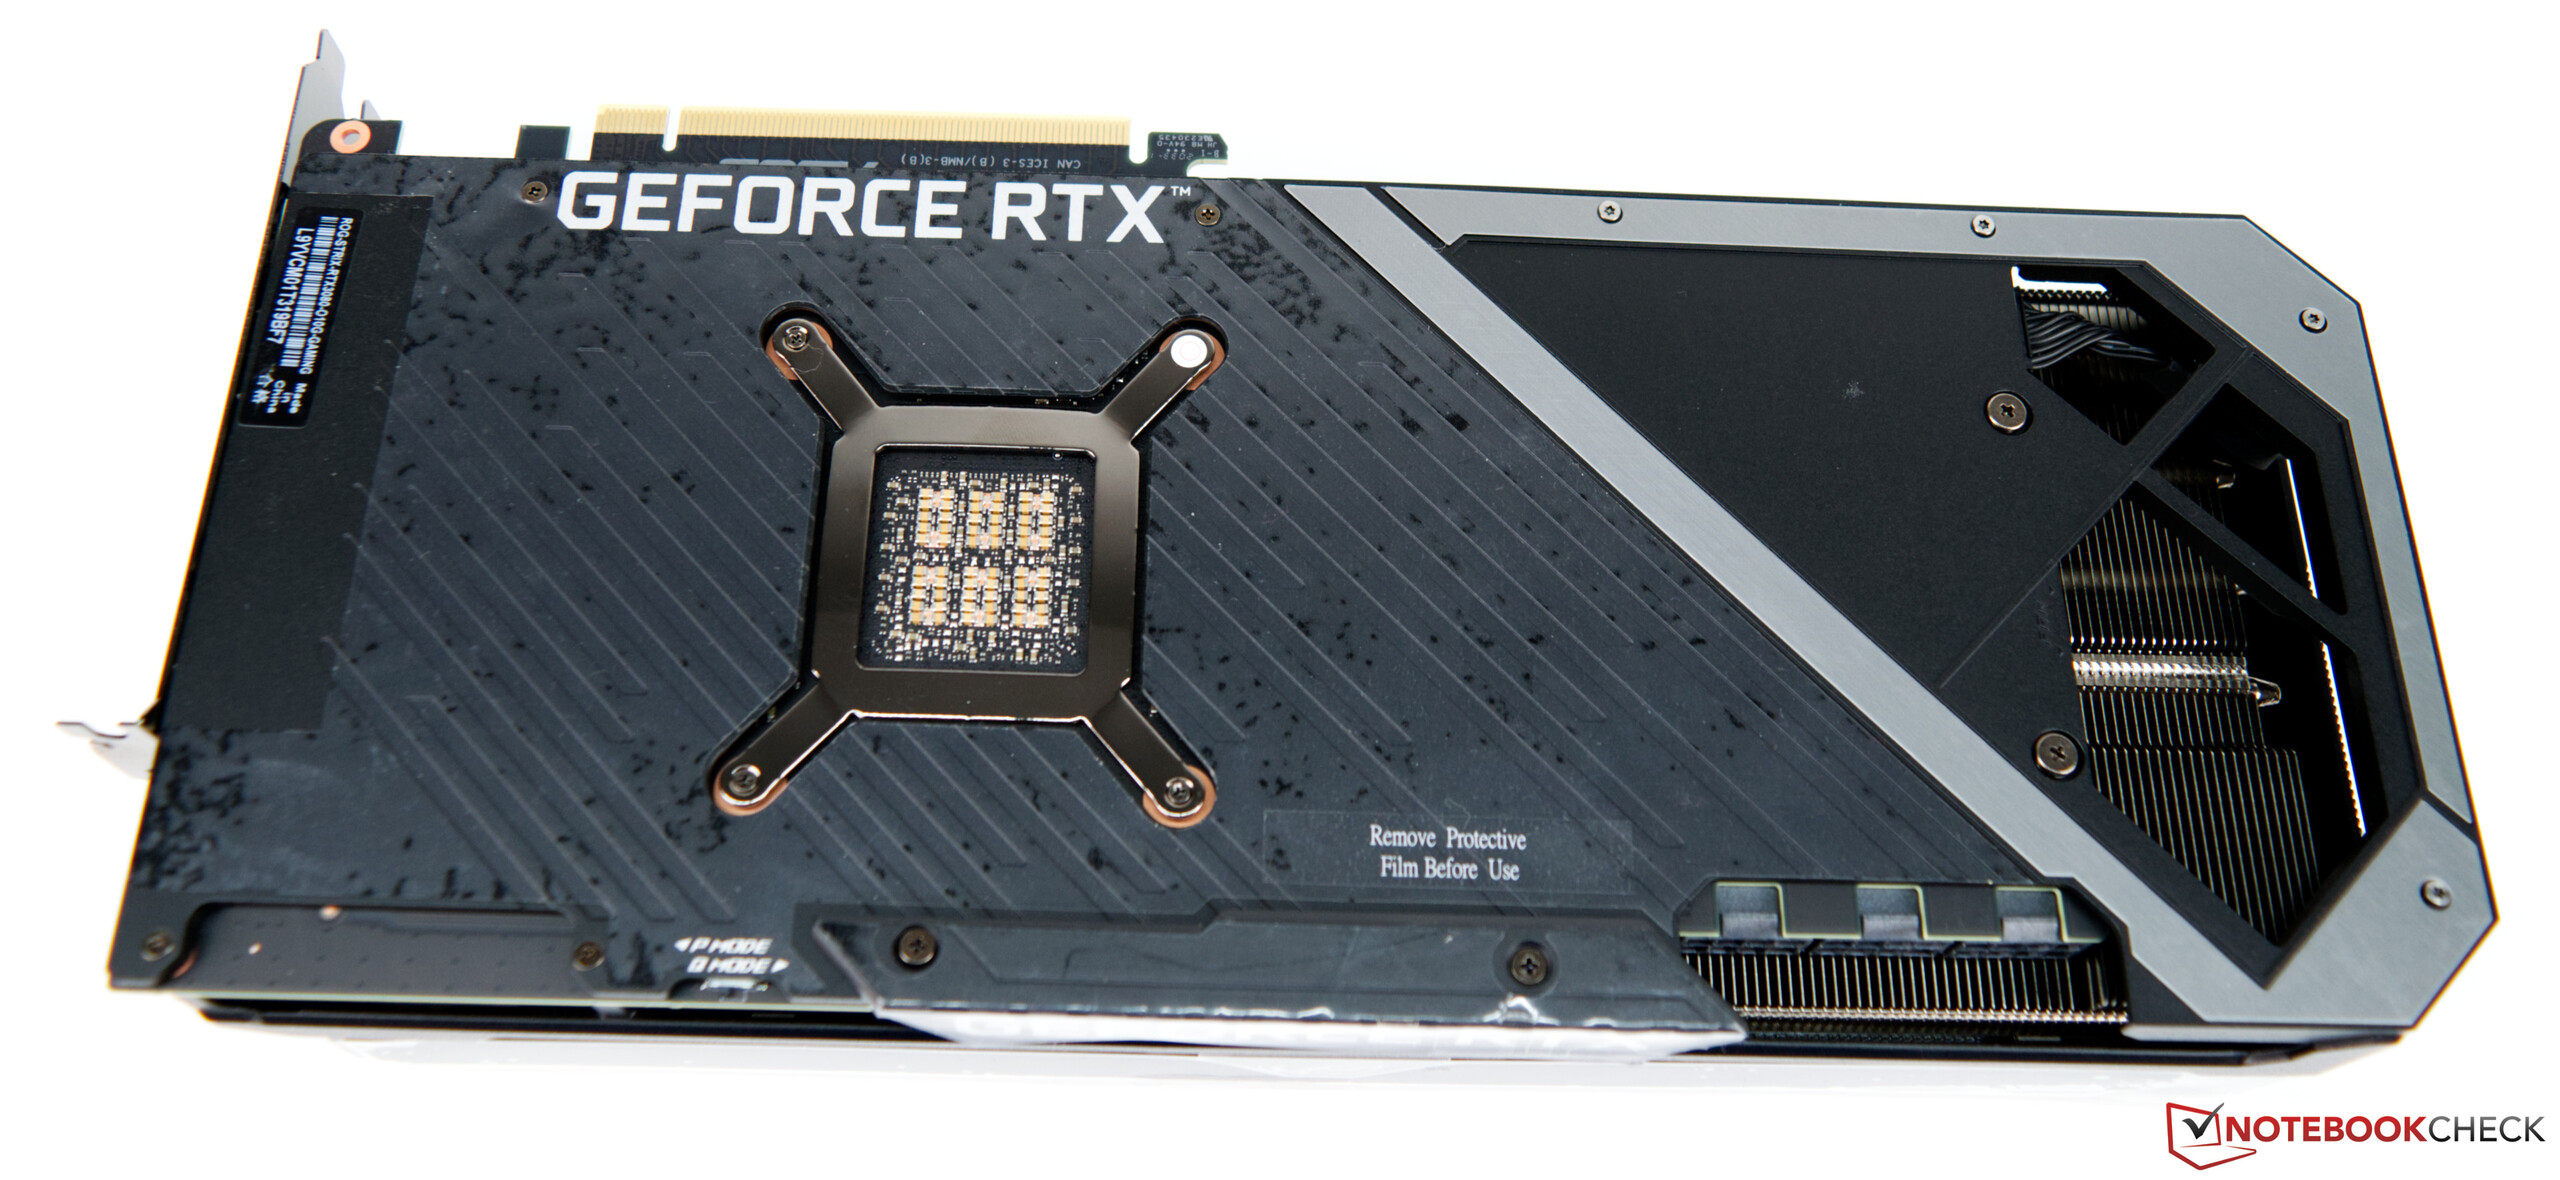
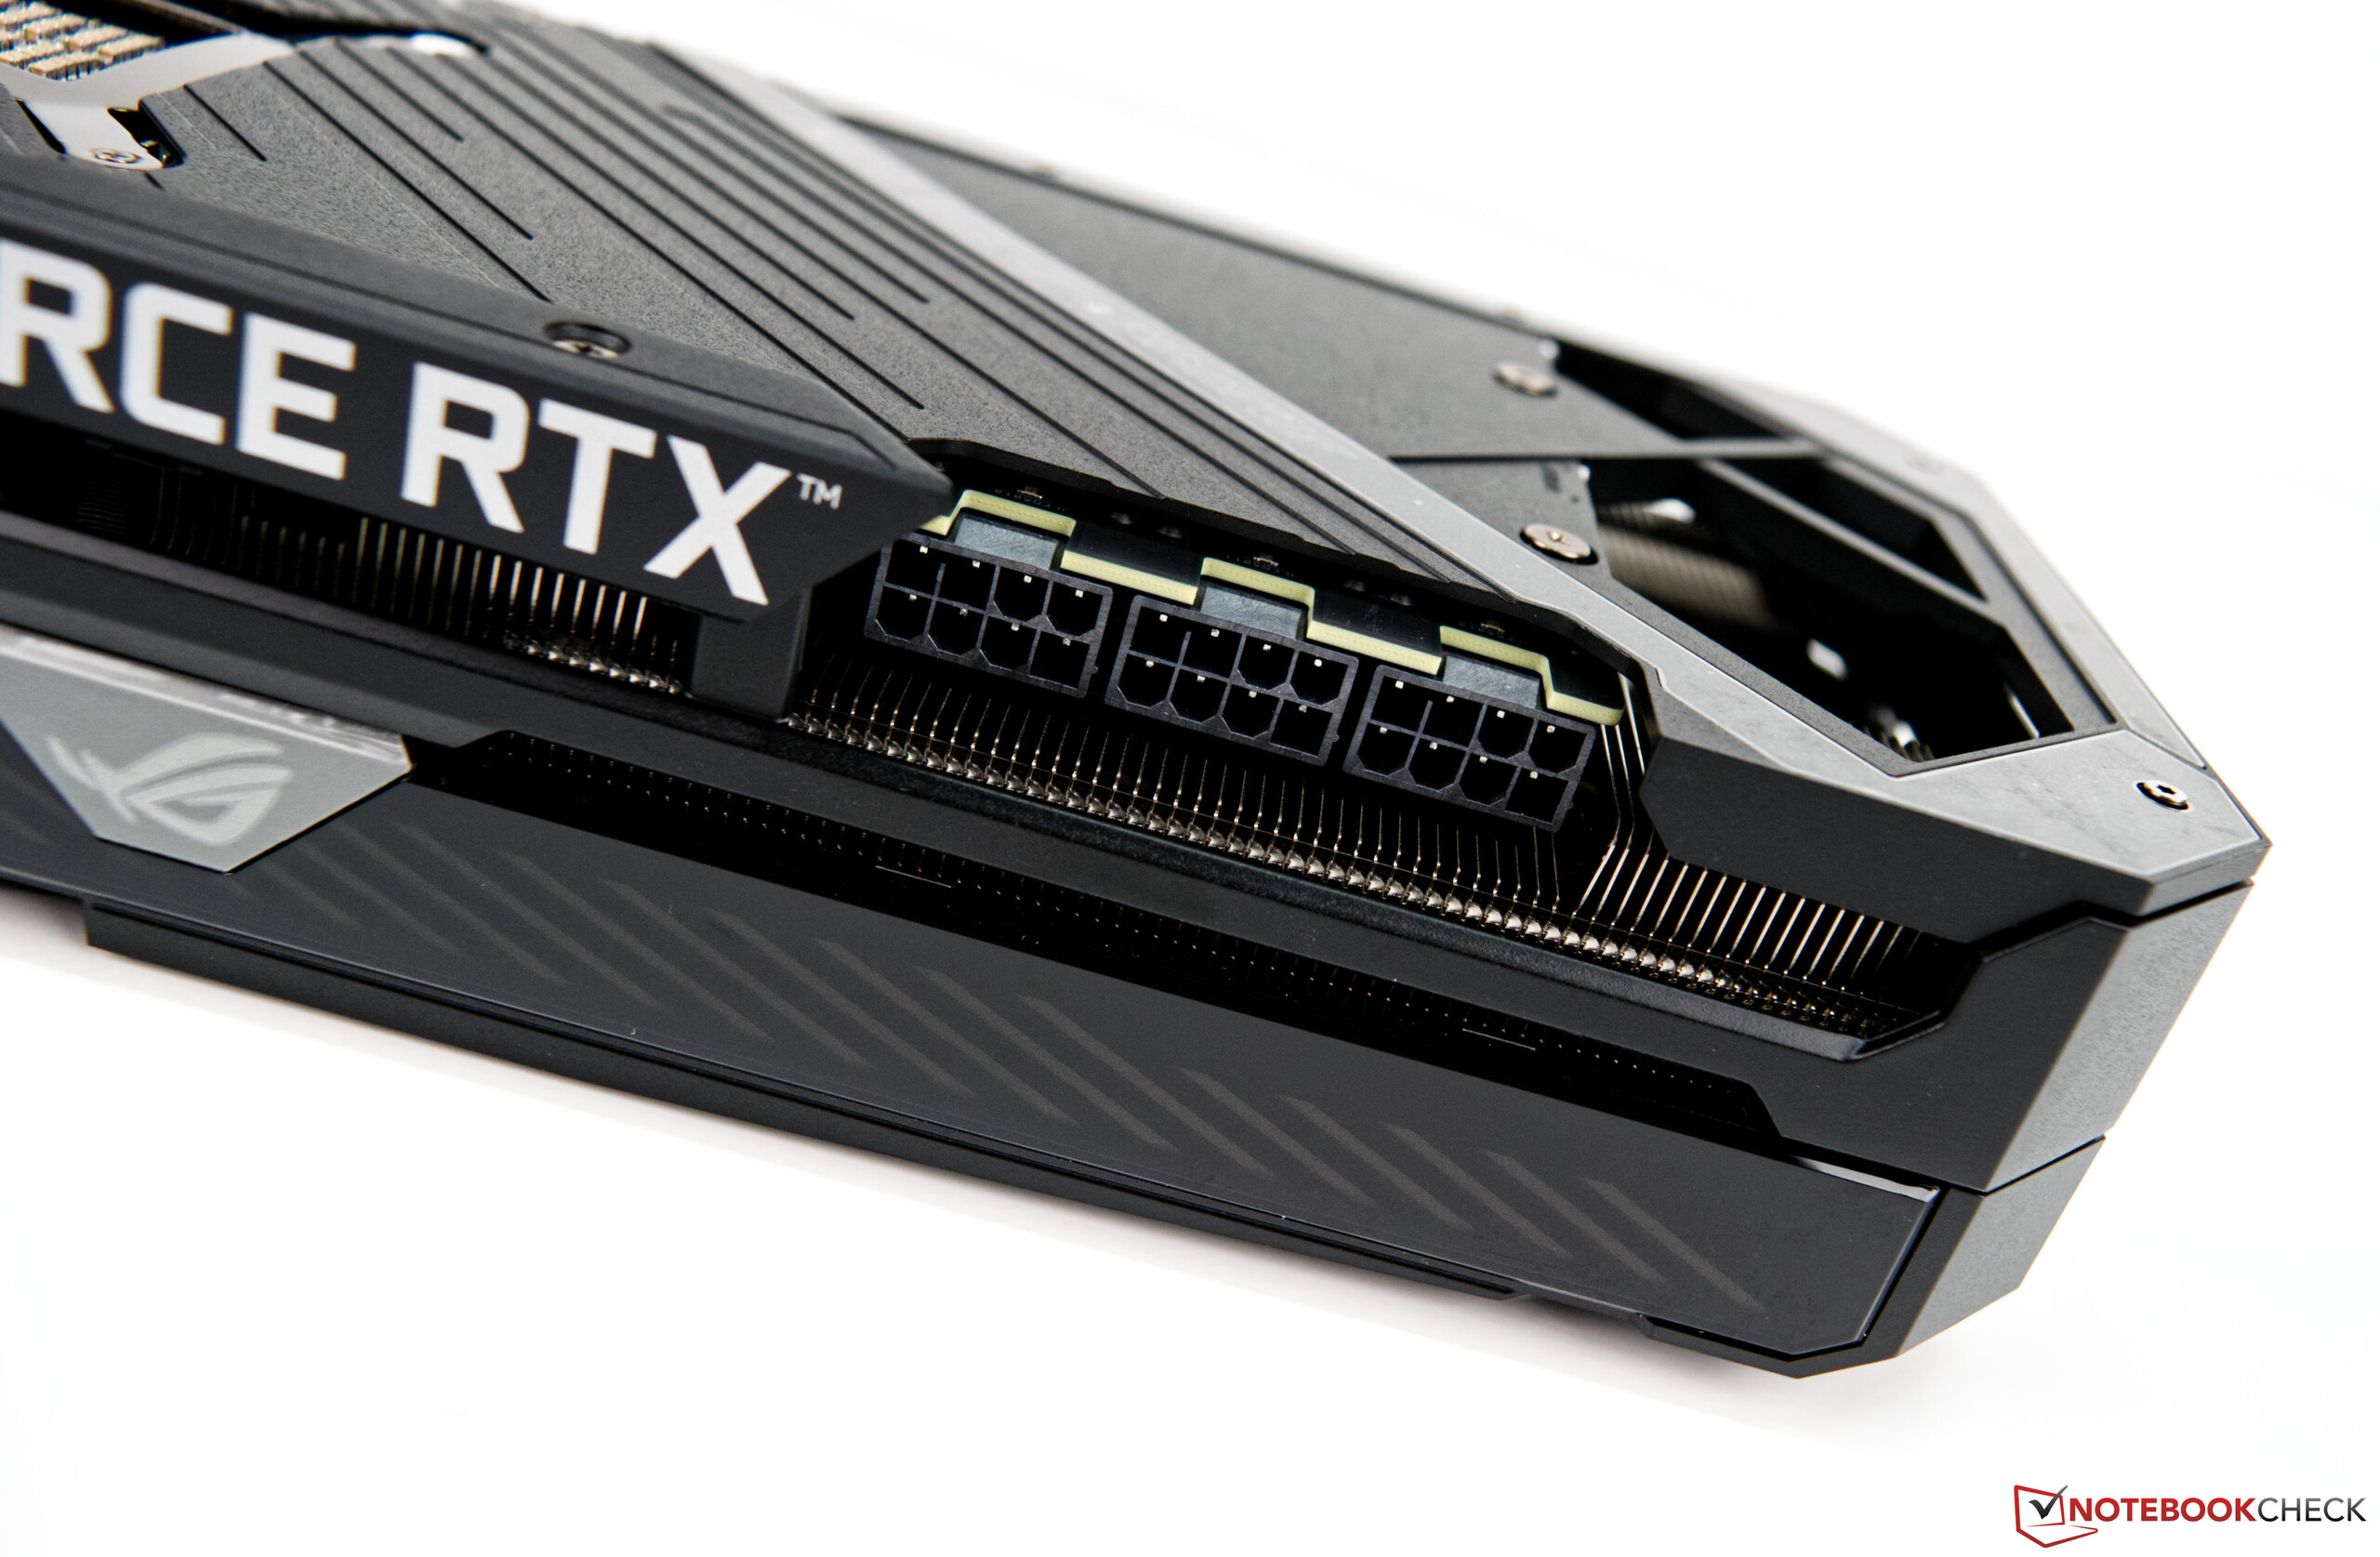
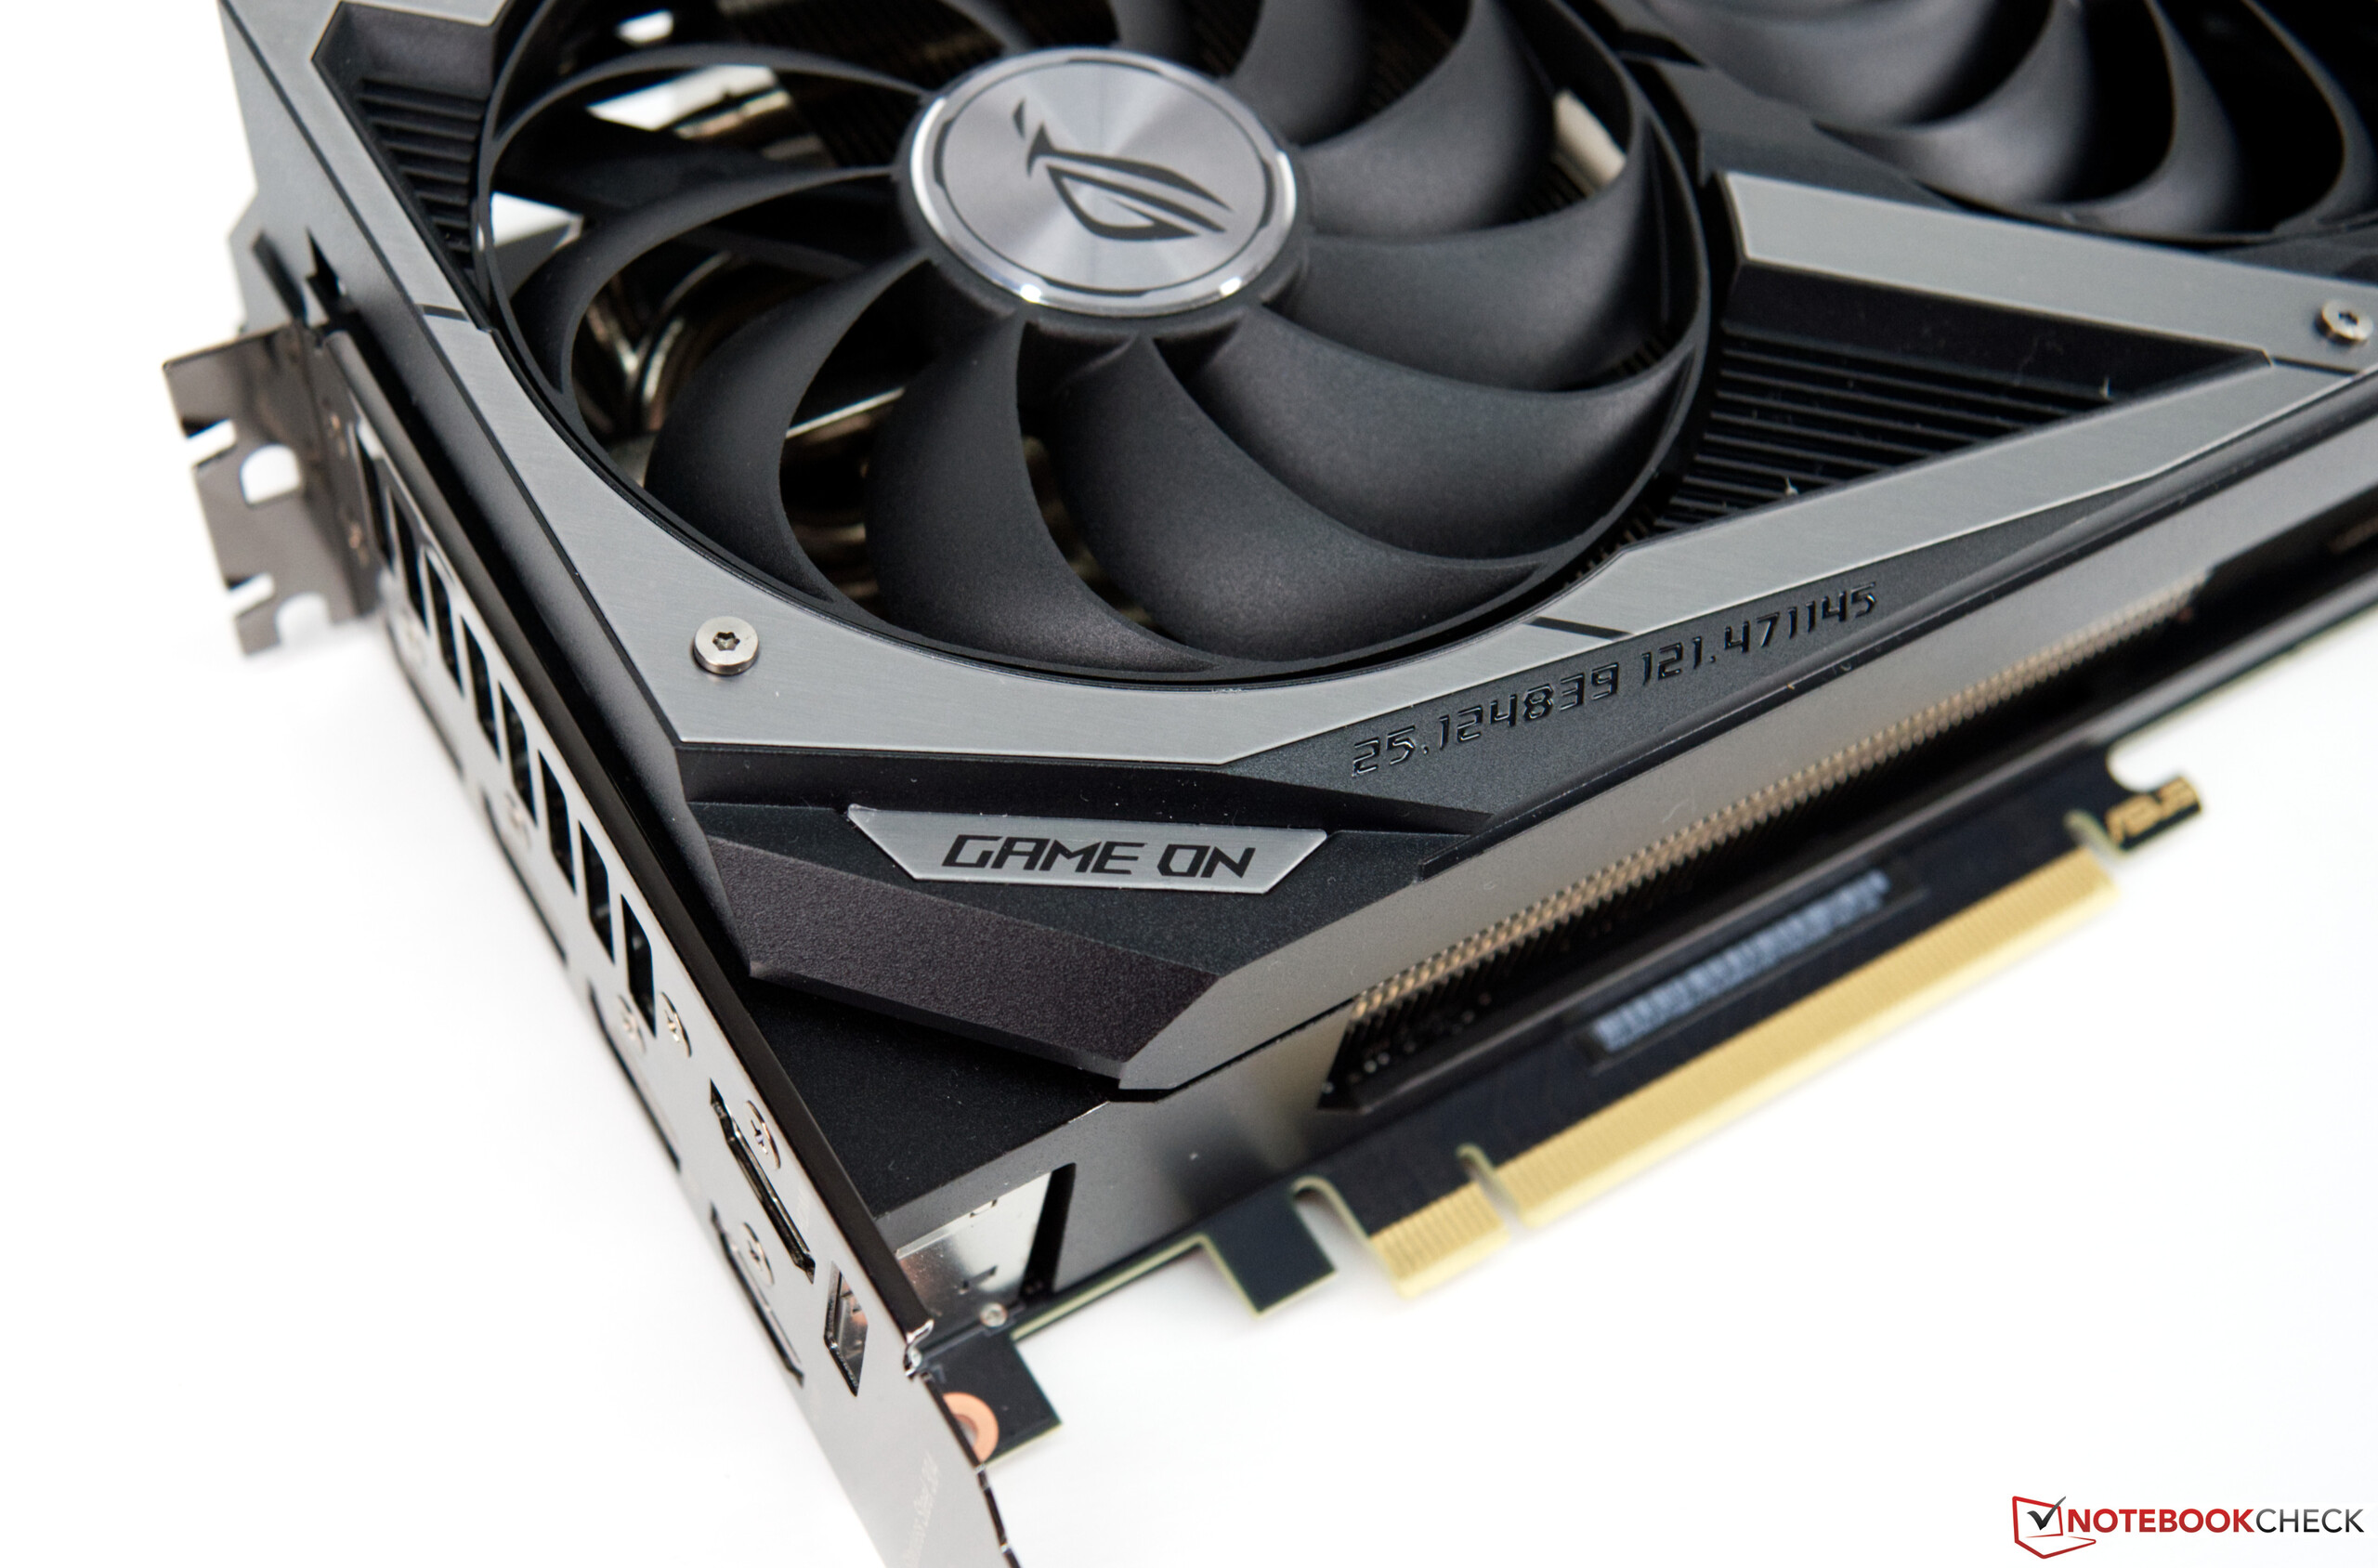
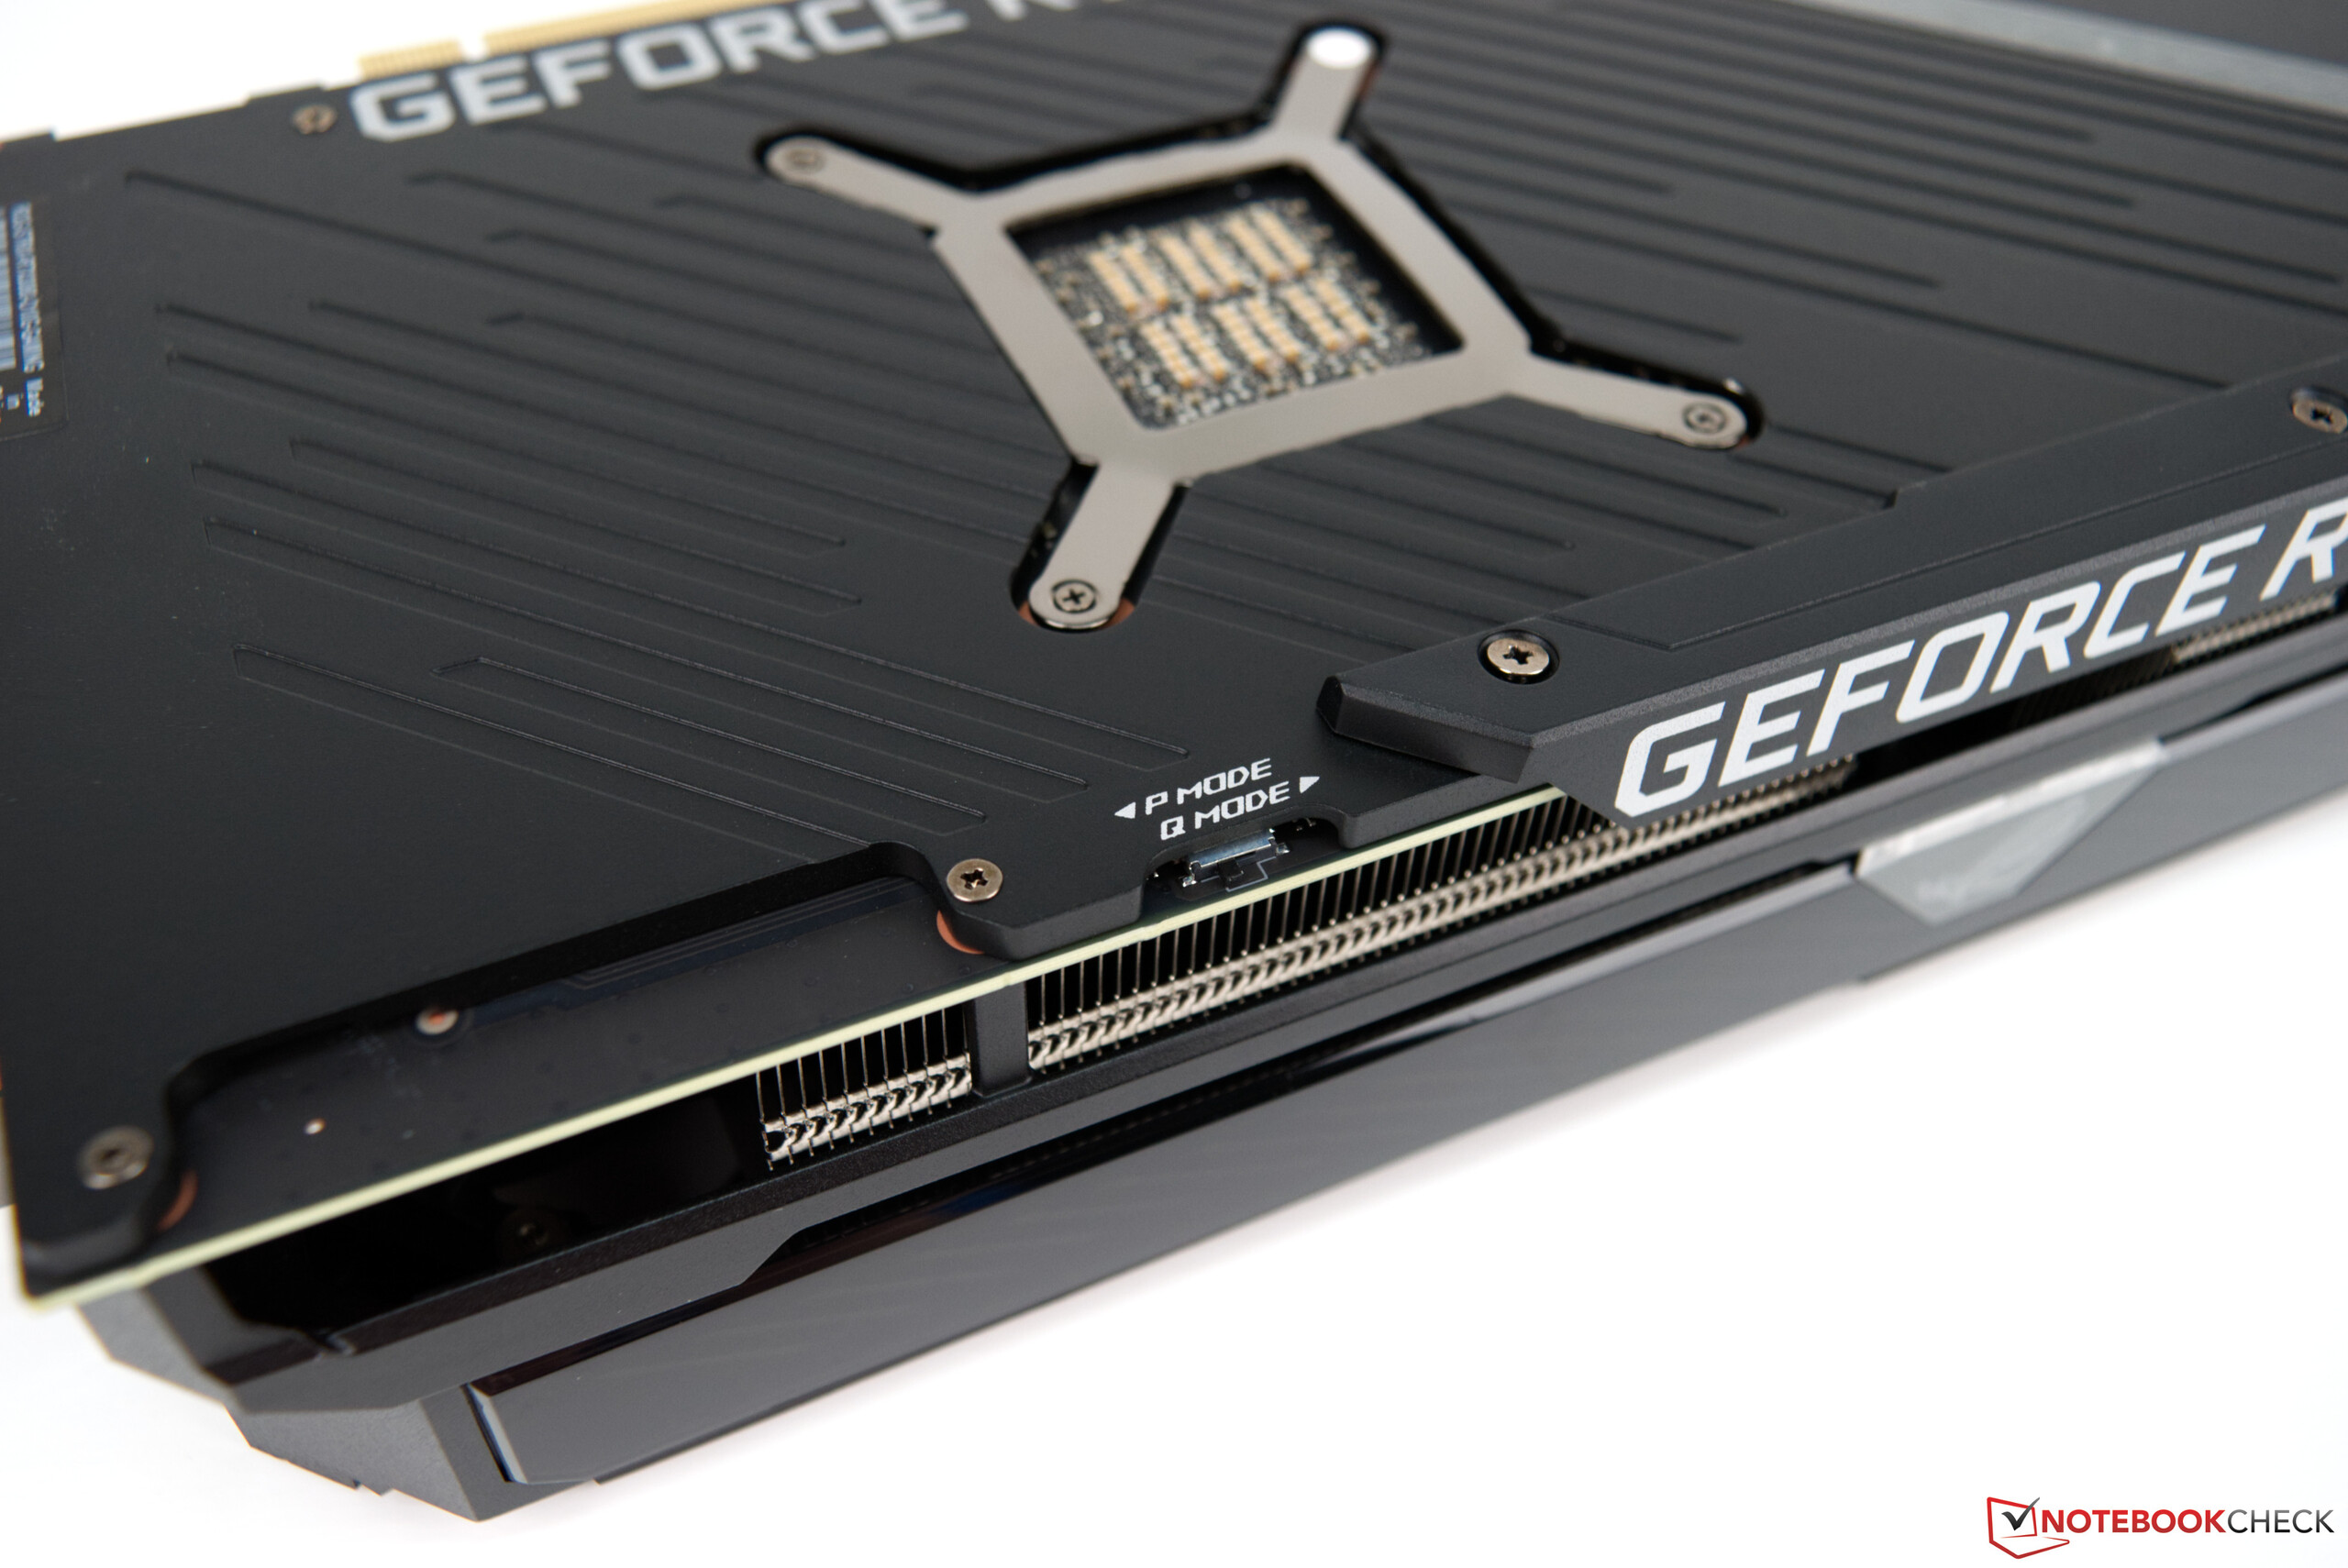
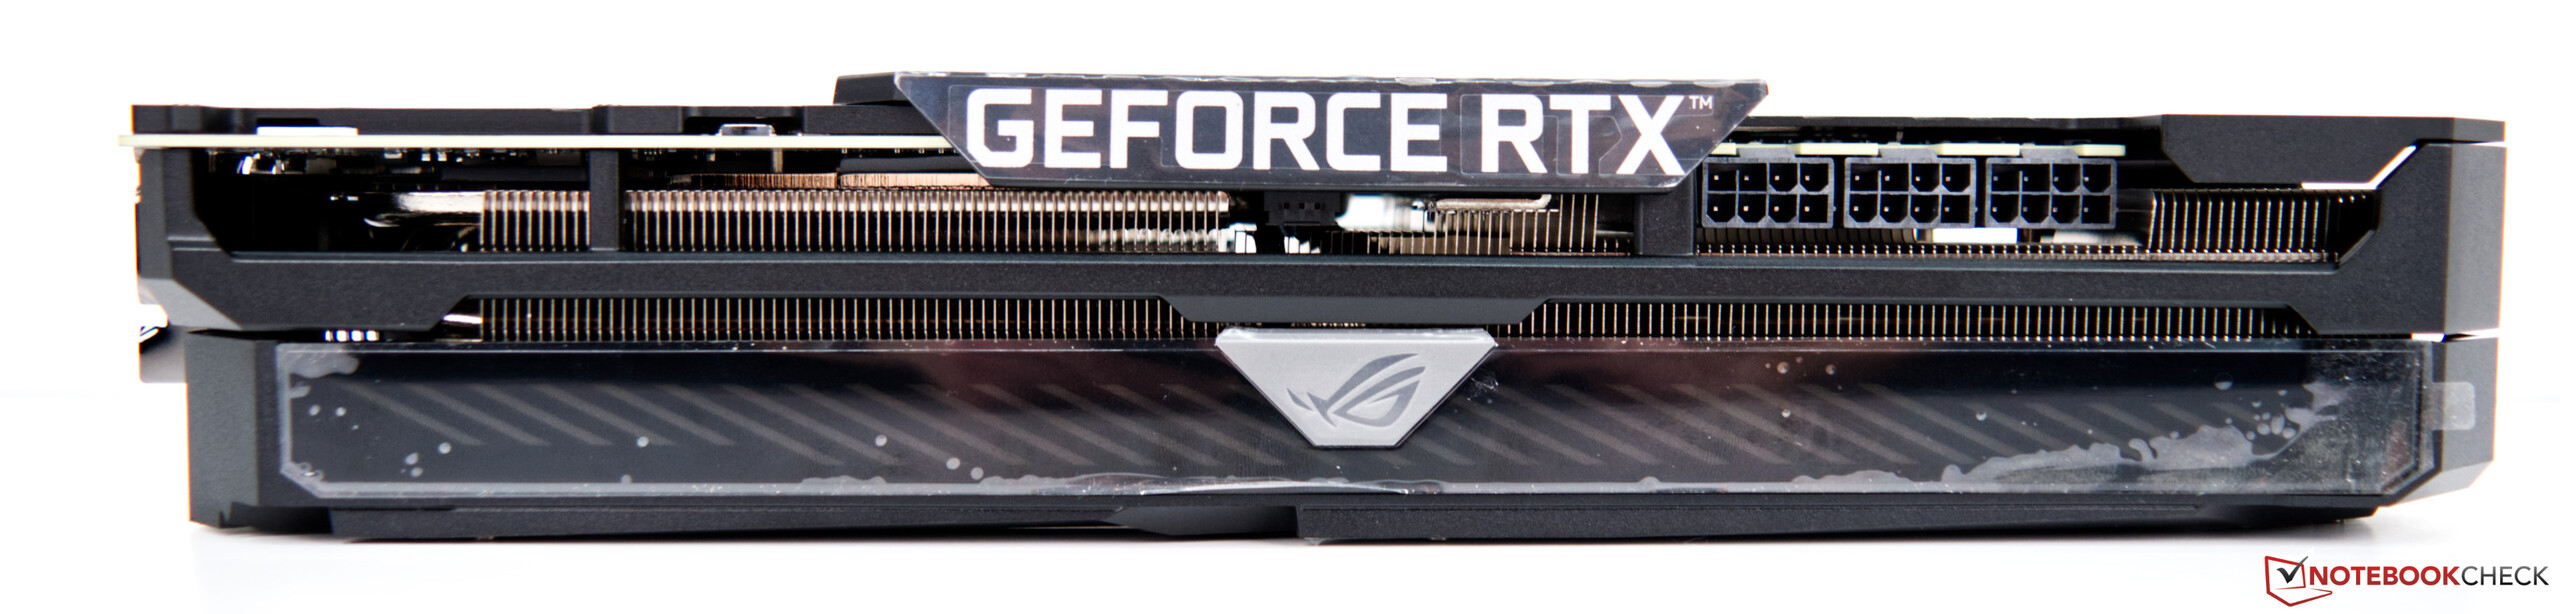
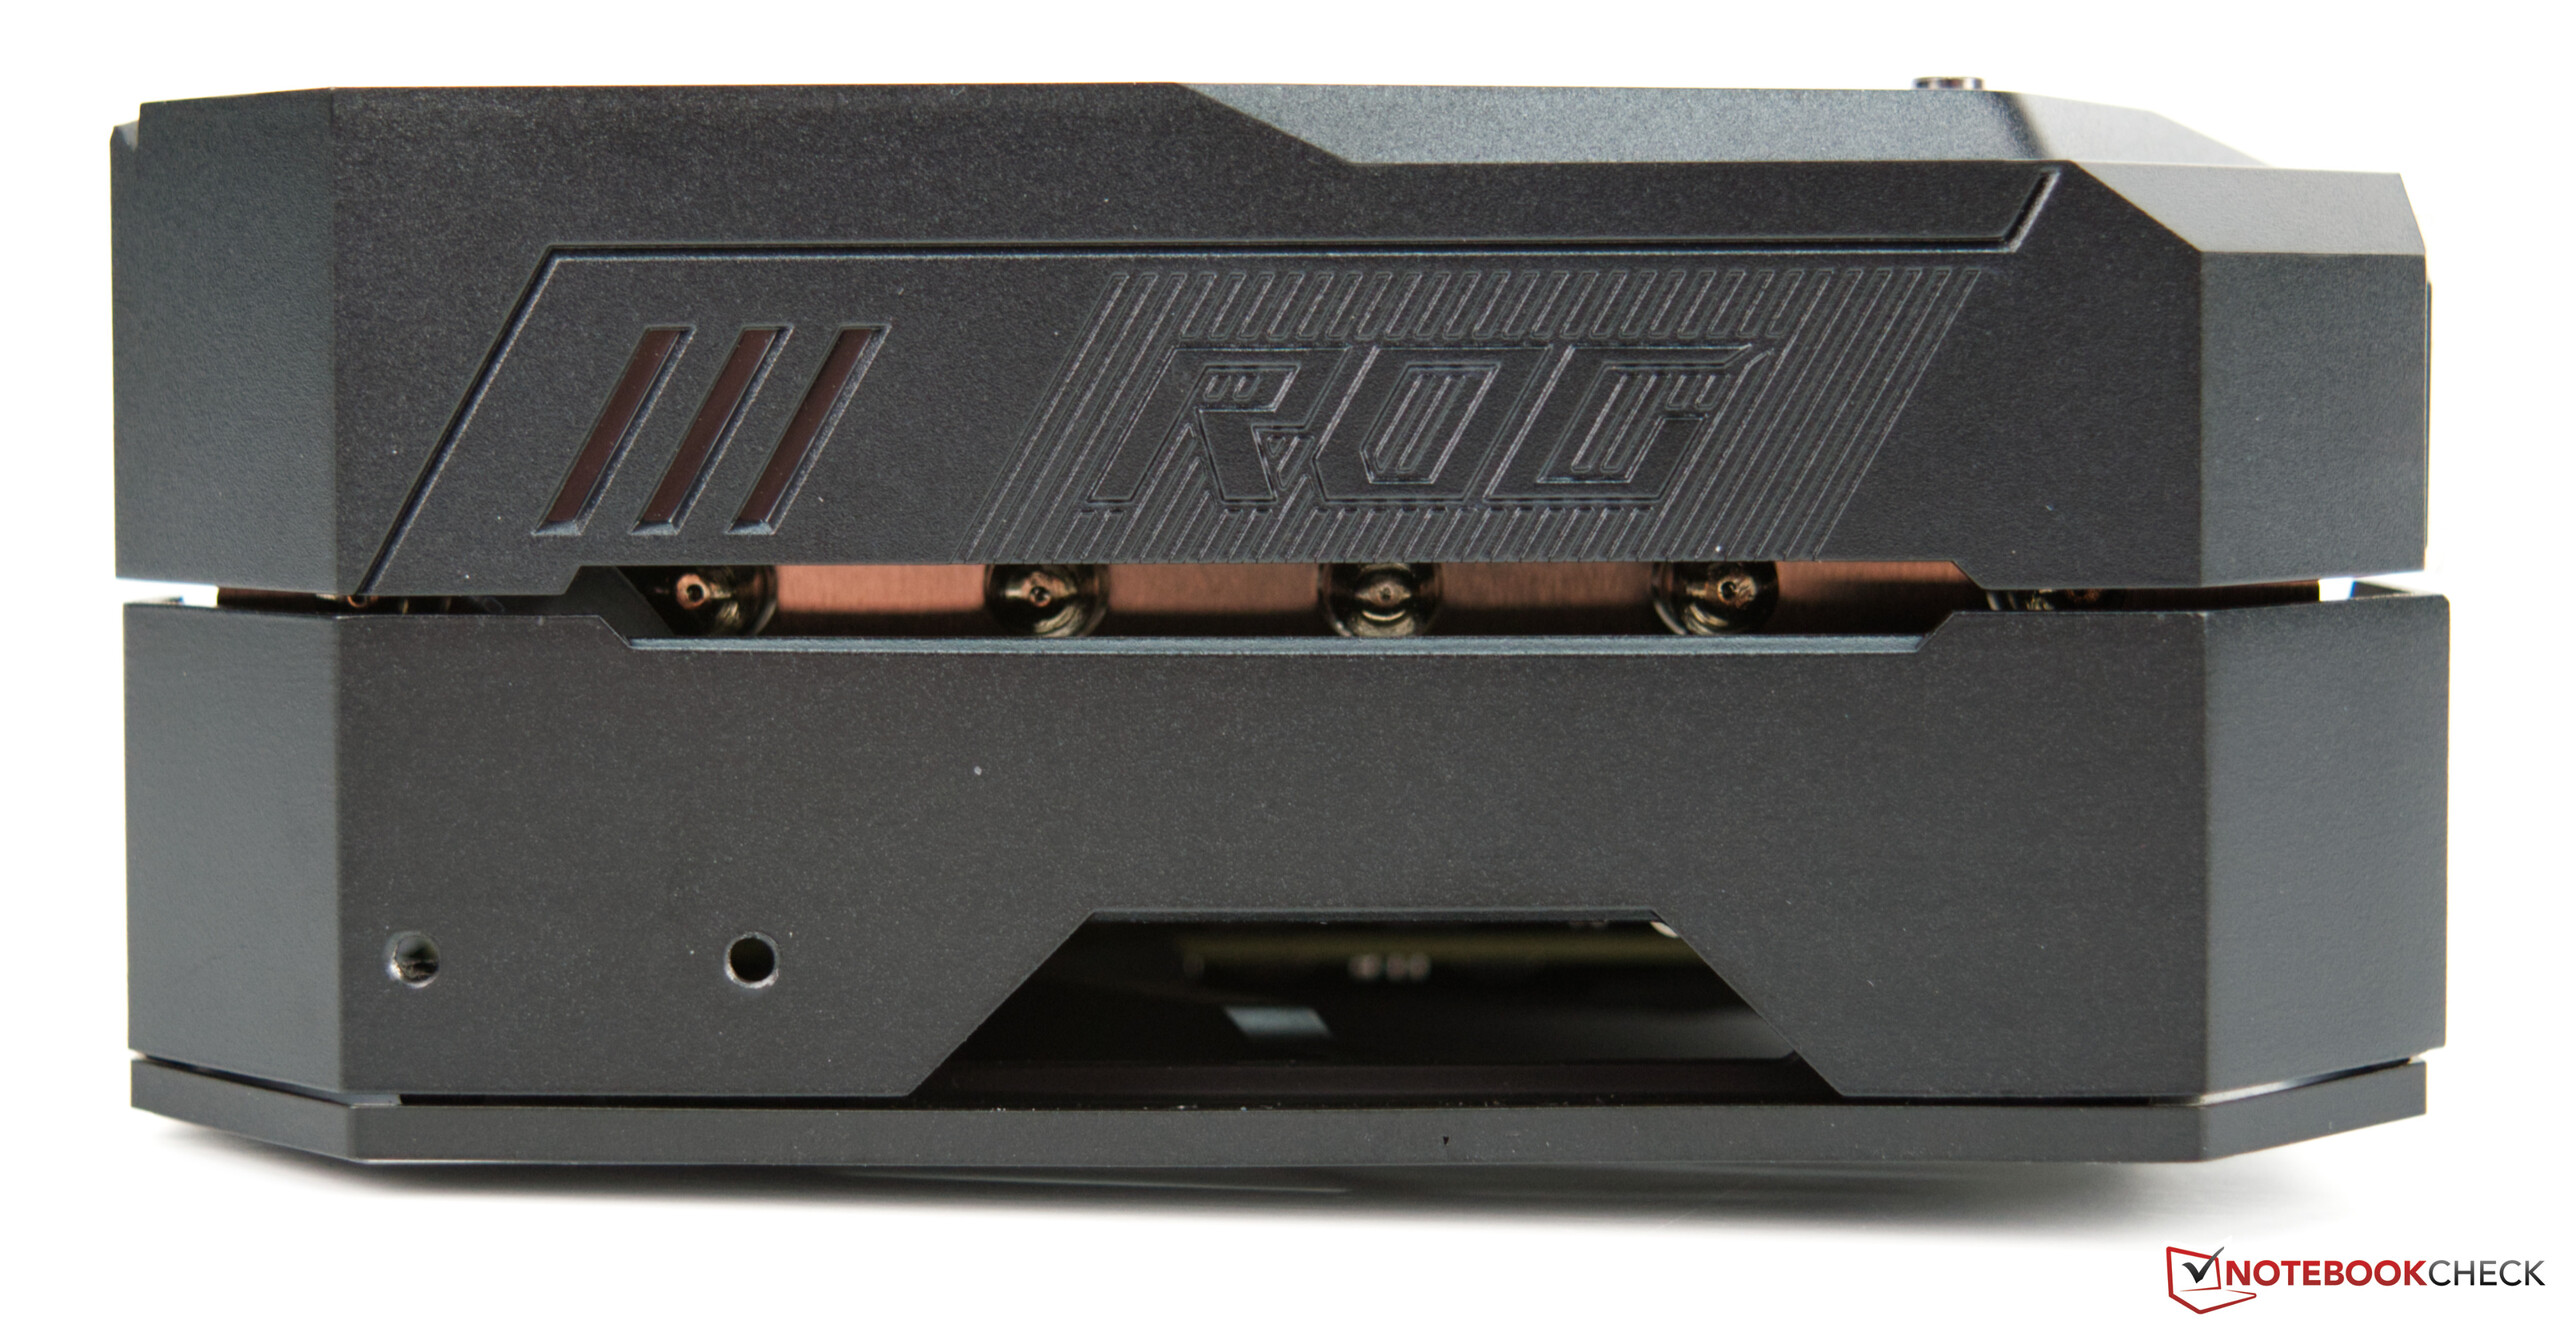
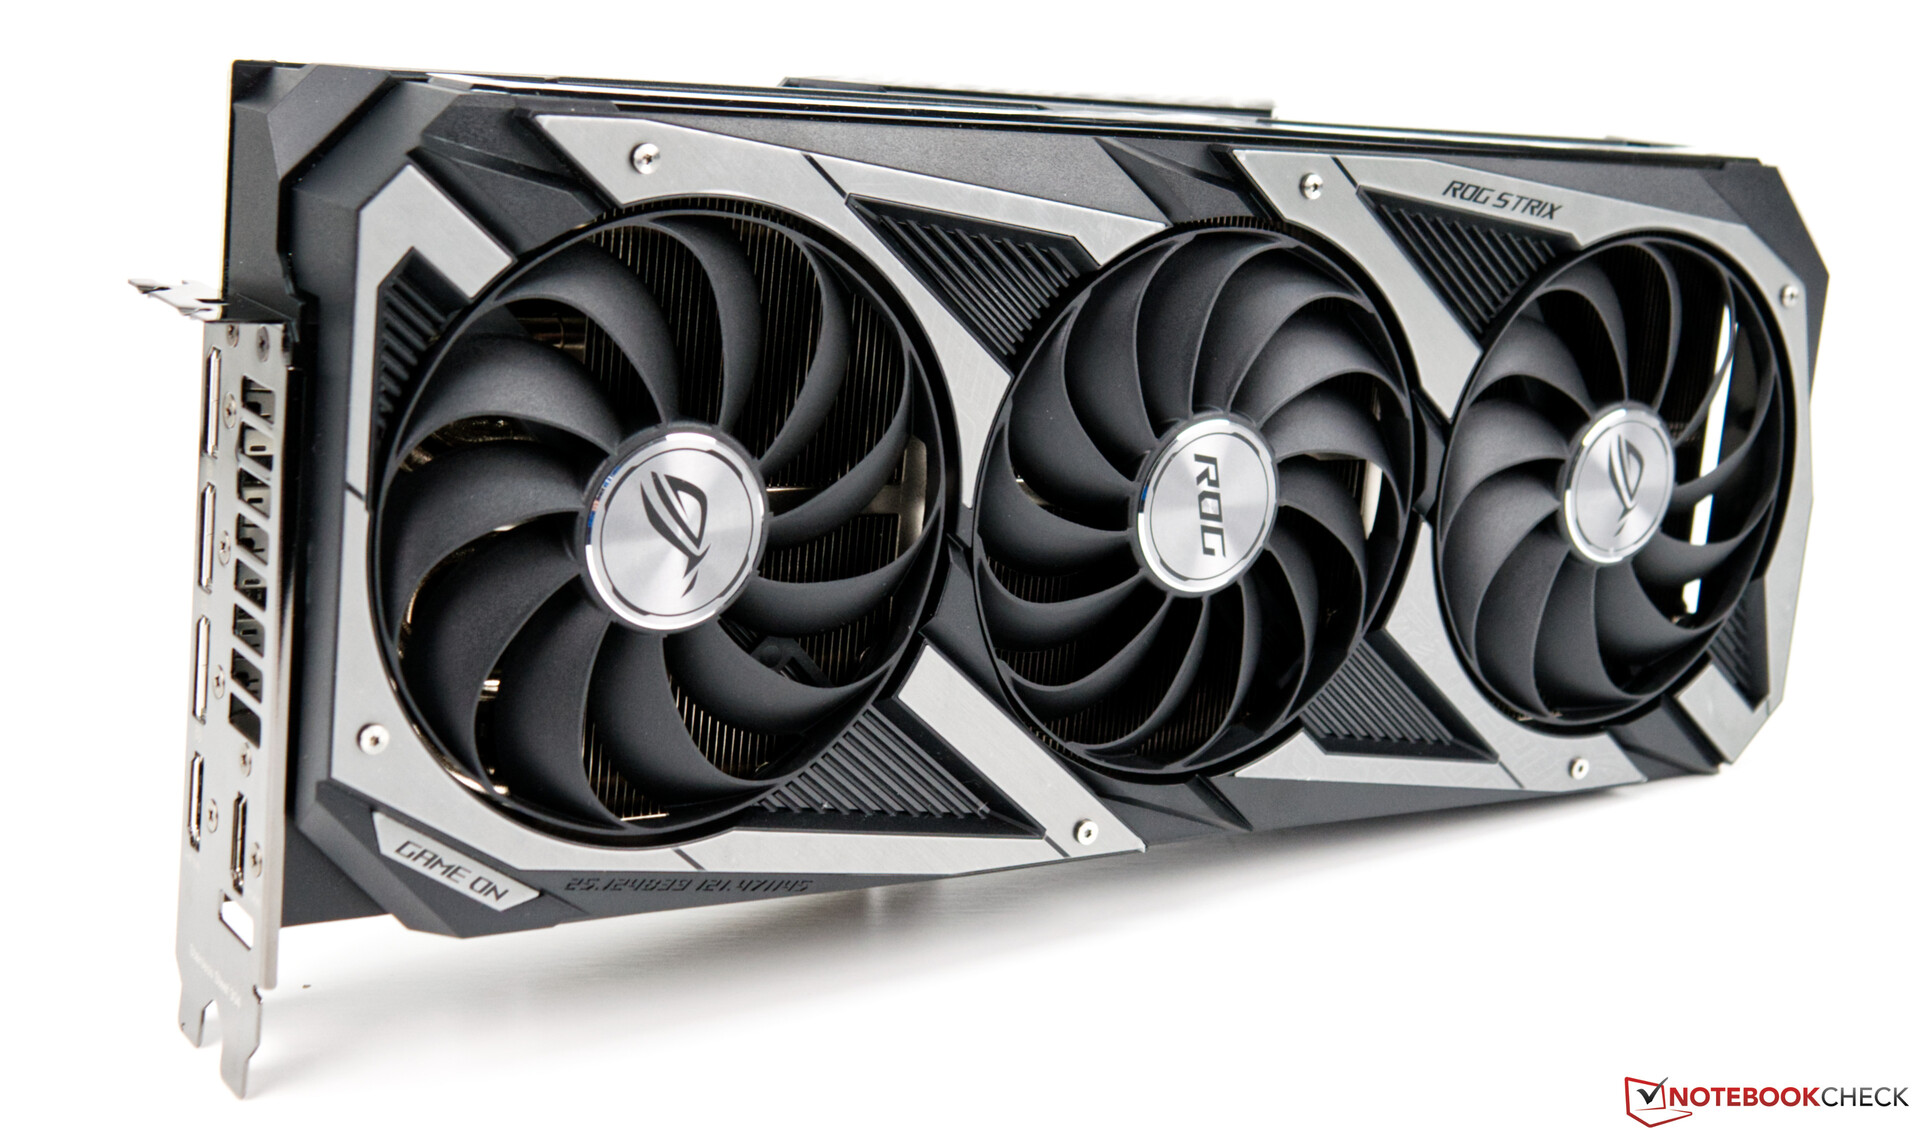
Asus GeForce RTX 3080 ROG Strix Gaming OC är ett av de snabbaste RTX 3080-grafikkorten och det kommer dessutom med bra kylning. Den genomtänkta kylenheten övertygar och med diskret RGB-belysning finns det något att vila blicken på.
Den som lyckas få tag på ett RTX 3080 kommer belönas med en hel del grafikprestanda. Men detta resulterar också i hög energiförbrukning, vilket man bör betänka om man köper kortet. Det är viktigt med rätt nätaggregat så att systemet inte kraschar vid belastning. Asus rekommenderar ett nätaggregat på minst 850 watt till modellen vi recenserat.
Asus GeForce RTX 3080 ROG Strix Gaming OC kostar för tillfället 10.000 kronor. Det är 3.000 kronor mer än riktpriset för Founders Edition, men de små kvantiteterna av tillgängliga kort driver upp priserna något extremt, så till och med Founders Edition säljs ibland för över 10.000 kronor. Vårt råd är därför att vänta och se vad konkurrenterna gör så att du inte ångrar ditt val senare.
Alla prestandatester och mätvärden för RTX 3080 går att hitta på vår grafikkortssida för GeForce RTX 3080 (uppdateras regelbundet)
