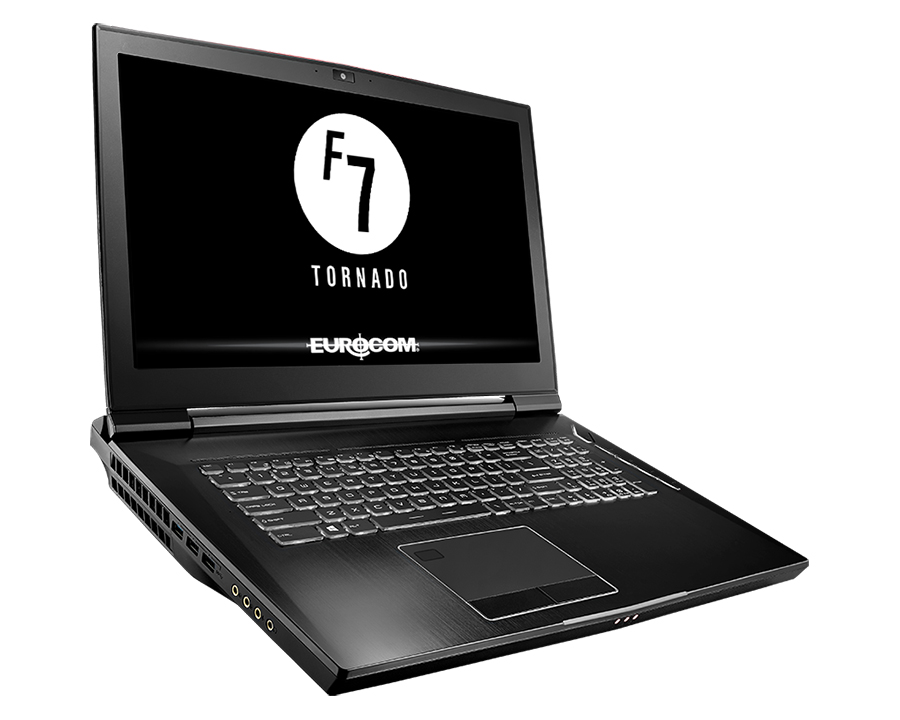
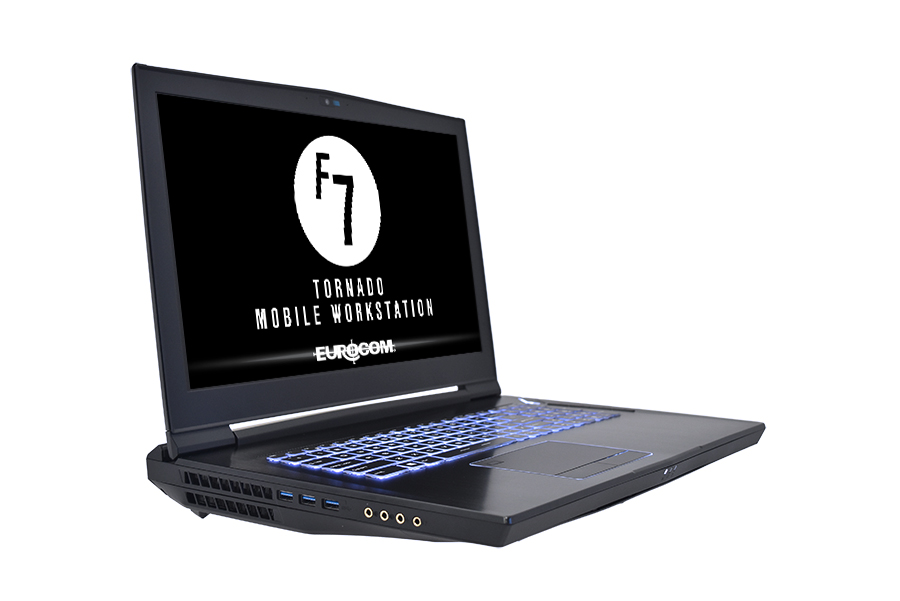
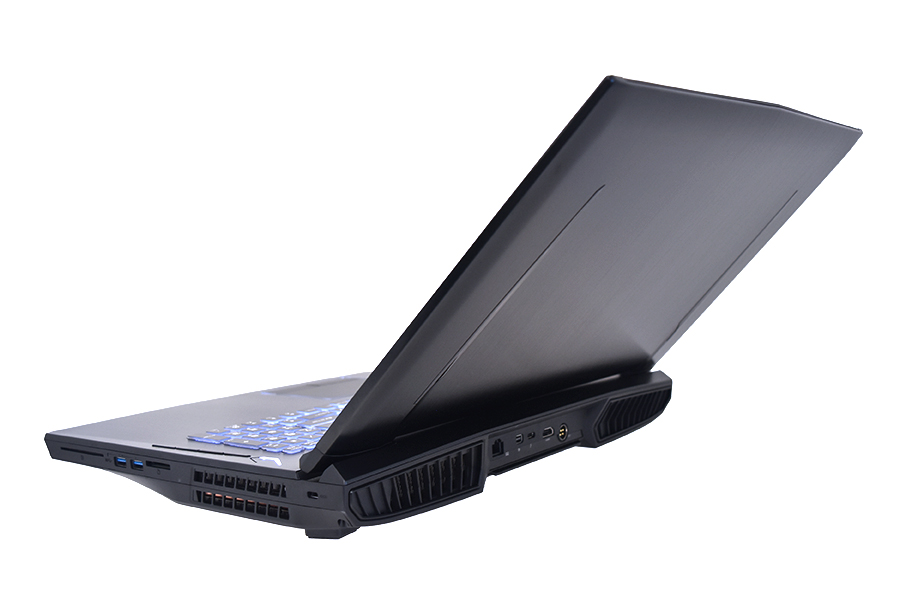
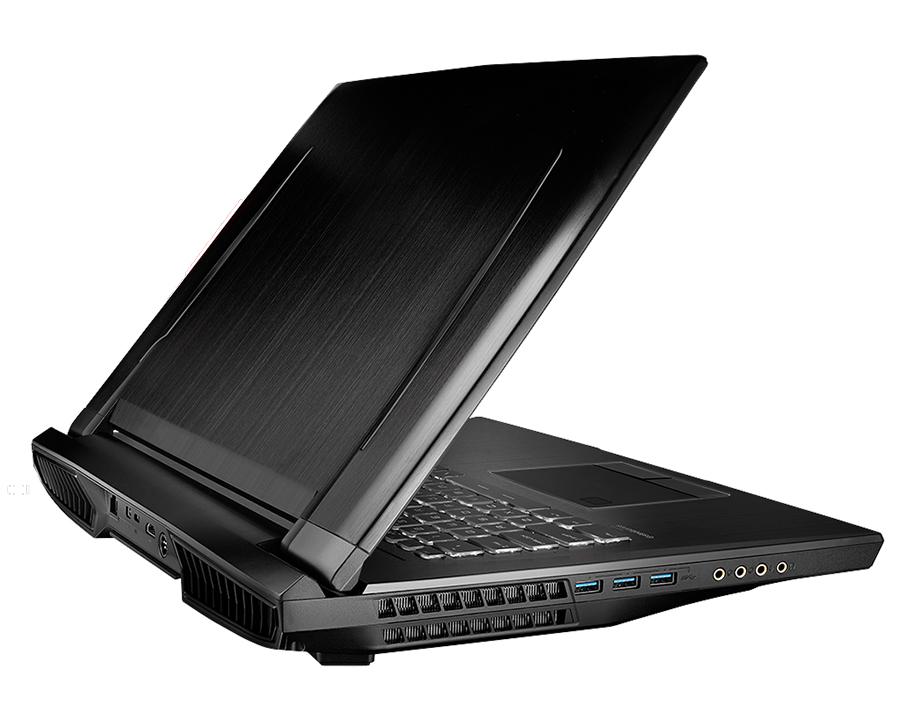
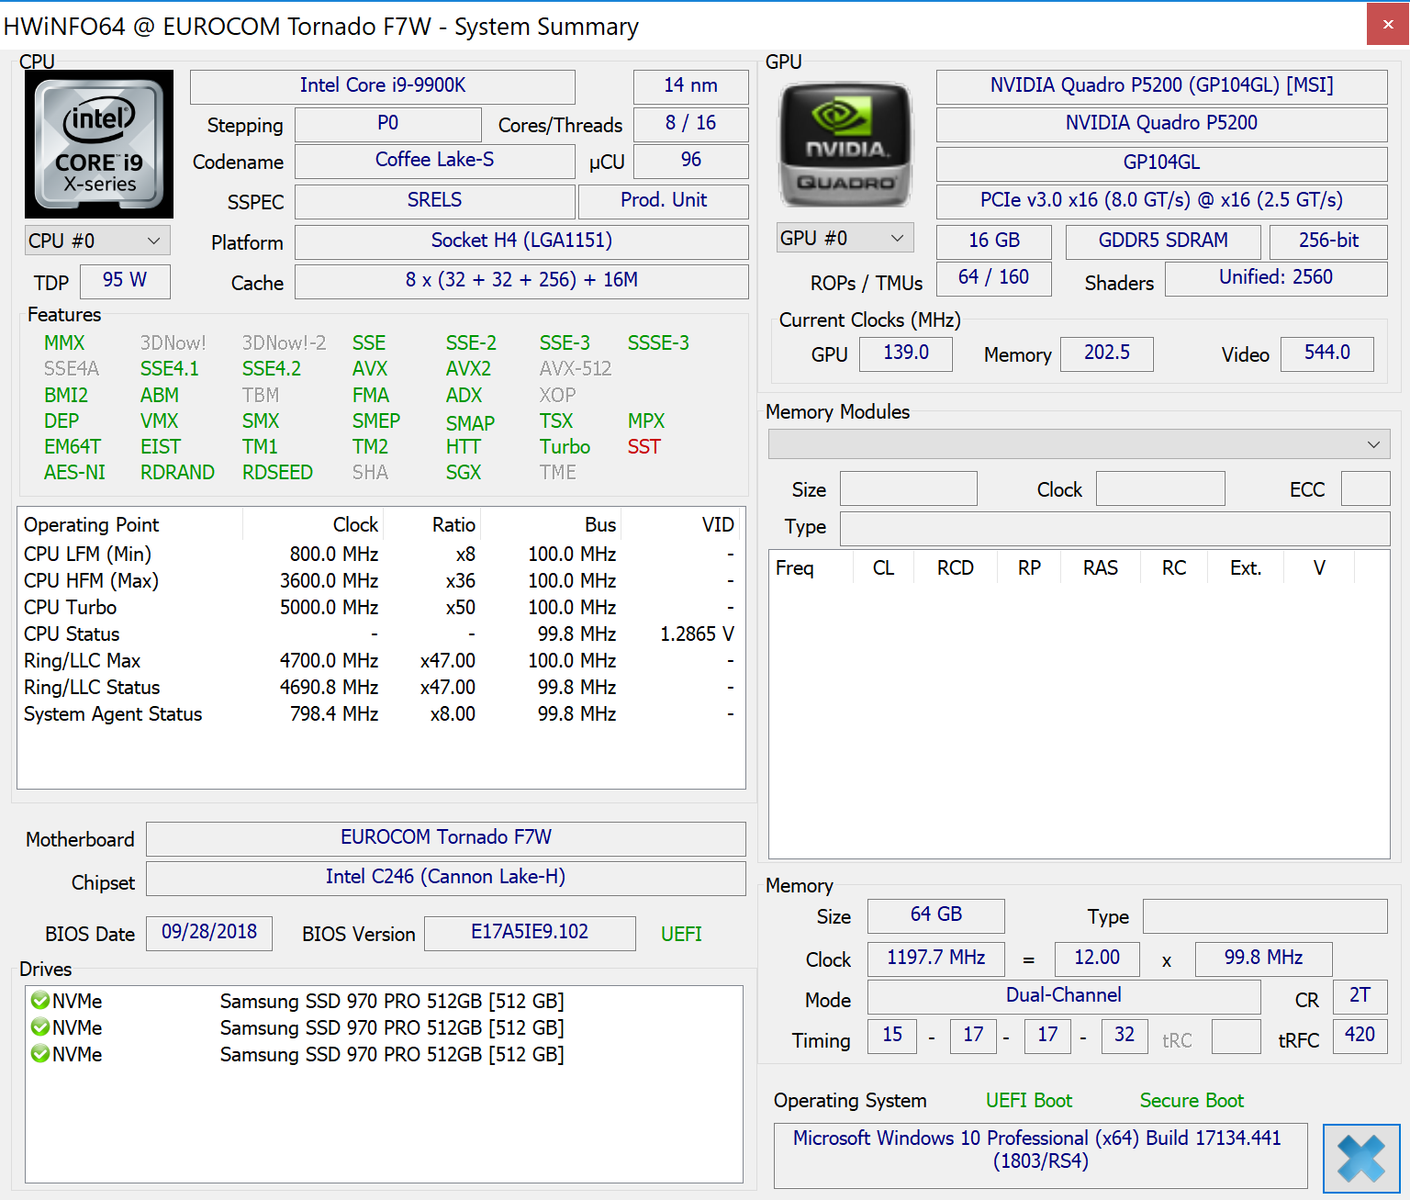
Test: Eurocom Tornado F7W (i9-9900K, Quadro P5200) Arbetsstation (Sammanfattning)
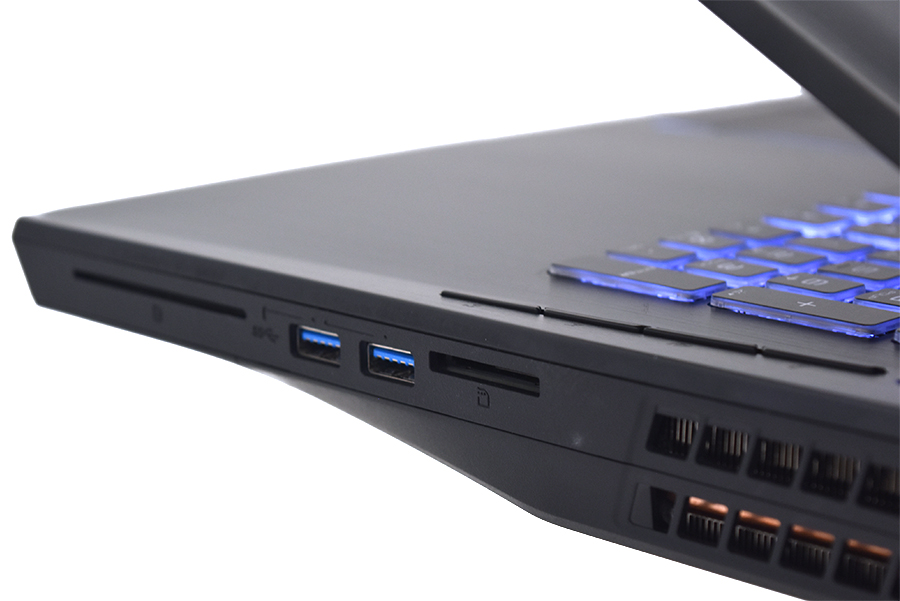
| SD Card Reader | |
| average JPG Copy Test (av. of 3 runs) | |
| Asus Chimera G703GI (Toshiba Exceria Pro SDXC 64 GB UHS-II) | |
| Eurocom Sky X7C (Toshiba Exceria Pro SDXC 64 GB UHS-II) | |
| Eurocom Sky X9C (Toshiba Exceria Pro SDXC 64 GB UHS-II) | |
| Eurocom Tornado F7W (Toshiba Exceria Pro SDXC 64 GB UHS-II) | |
| HP Omen X 17-ap0xx (Toshiba Exceria Pro SDXC 64 GB UHS-II) | |
| maximum AS SSD Seq Read Test (1GB) | |
| Asus Chimera G703GI (Toshiba Exceria Pro SDXC 64 GB UHS-II) | |
| Eurocom Sky X7C (Toshiba Exceria Pro SDXC 64 GB UHS-II) | |
| Eurocom Sky X9C (Toshiba Exceria Pro SDXC 64 GB UHS-II) | |
| Eurocom Tornado F7W (Toshiba Exceria Pro SDXC 64 GB UHS-II) | |
| HP Omen X 17-ap0xx (Toshiba Exceria Pro SDXC 64 GB UHS-II) | |
| |||||||||||||||||||||||||
Distribution av ljusstyrkan: 92 %
Mitt på batteriet: 328.2 cd/m²
Kontrast: 887:1 (Svärta: 0.37 cd/m²)
ΔE ColorChecker Calman: 6.62 | ∀{0.5-29.43 Ø4.71}
calibrated: 3.93
ΔE Greyscale Calman: 6.7 | ∀{0.09-98 Ø4.96}
100% sRGB (Argyll 1.6.3 3D)
87.9% AdobeRGB 1998 (Argyll 1.6.3 3D)
98.3% AdobeRGB 1998 (Argyll 3D)
100% sRGB (Argyll 3D)
85.9% Display P3 (Argyll 3D)
Gamma: 2.44
CCT: 6462 K
| Eurocom Tornado F7W AU Optronics B173ZAN01.0, IPS, 17.3", 3840x2160 | Eurocom Sky X7C AU Optronics B173ZAN01.0, IPS, 17.3", 3840x2160 | Asus Chimera G703GI B173HAN03.2 (AUO329D), IPS, 17.3", 1920x1080 | HP Omen X 17-ap0xx AU Optronics B173HW01, IPS, 17.3", 1920x1080 | Eurocom Sky X9C ID: AUO109B, Name: AU Optronics B173ZAN01.0, IPS, 17.3", 3840x2160 | MSI GT75 8RG-090 Titan CMN N173HHE-G32 (CMN1747), TN, 17.3", 1920x1080 | |
|---|---|---|---|---|---|---|
| Display | 0% | -21% | -24% | 1% | -2% | |
| Display P3 Coverage (%) | 85.9 | 86 0% | 65.8 -23% | 63.7 -26% | 86.6 1% | 90.9 6% |
| sRGB Coverage (%) | 100 | 99.9 0% | 92.6 -7% | 88.2 -12% | 100 0% | 100 0% |
| AdobeRGB 1998 Coverage (%) | 98.3 | 98.9 1% | 67 -32% | 64.2 -35% | 99.4 1% | 86.2 -12% |
| Response Times | 10% | 75% | -5% | 0% | 81% | |
| Response Time Grey 50% / Grey 80% * (ms) | 40 ? | 38.4 ? 4% | 6.4 ? 84% | 44 ? -10% | 43.6 ? -9% | 8 ? 80% |
| Response Time Black / White * (ms) | 31.6 ? | 26.8 ? 15% | 10.8 ? 66% | 31.6 ? -0% | 28.8 ? 9% | 5.6 ? 82% |
| PWM Frequency (Hz) | 26000 ? | |||||
| Screen | 1% | 19% | 15% | 2% | 22% | |
| Brightness middle (cd/m²) | 328.2 | 333 1% | 285 -13% | 343 5% | 347.7 6% | 240 -27% |
| Brightness (cd/m²) | 310 | 330 6% | 275 -11% | 332 7% | 324 5% | 248 -20% |
| Brightness Distribution (%) | 92 | 88 -4% | 82 -11% | 83 -10% | 87 -5% | 83 -10% |
| Black Level * (cd/m²) | 0.37 | 0.4 -8% | 0.22 41% | 0.35 5% | 0.4 -8% | 0.22 41% |
| Contrast (:1) | 887 | 833 -6% | 1295 46% | 980 10% | 869 -2% | 1091 23% |
| Colorchecker dE 2000 * | 6.62 | 5.87 11% | 3.18 52% | 3.35 49% | 6.39 3% | 2.14 68% |
| Colorchecker dE 2000 max. * | 9.49 | 9.74 -3% | 5.99 37% | 5.62 41% | 9.69 -2% | 5.04 47% |
| Colorchecker dE 2000 calibrated * | 3.93 | 4.59 -17% | 1.73 56% | 2.5 36% | 1.54 61% | |
| Greyscale dE 2000 * | 6.7 | 4.5 33% | 2.93 56% | 2.4 64% | 5.4 19% | 1.62 76% |
| Gamma | 2.44 90% | 2.34 94% | 2.45 90% | 2.35 94% | 2.4 92% | 2.28 96% |
| CCT | 6462 101% | 6384 102% | 7165 91% | 6495 100% | 6271 104% | 6846 95% |
| Color Space (Percent of AdobeRGB 1998) (%) | 87.9 | 88 0% | 60 -32% | 57 -35% | 87.8 0% | 77 -12% |
| Color Space (Percent of sRGB) (%) | 100 | 100 0% | 93 -7% | 88 -12% | 100 0% | 100 0% |
| Totalt genomsnitt (program/inställningar) | 4% /
2% | 24% /
19% | -5% /
5% | 1% /
1% | 34% /
25% |
* ... mindre är bättre
Visa svarstider
| ↔ Svarstid svart till vitt | ||
|---|---|---|
| 31.6 ms ... stiga ↗ och falla ↘ kombinerat | ↗ 18 ms stiga | 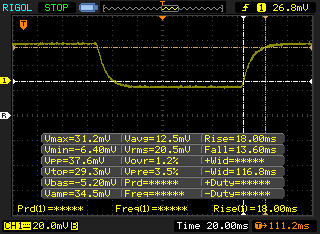 |
| ↘ 13.6 ms hösten | ||
| Skärmen visar långsamma svarsfrekvenser i våra tester och kommer att vara otillfredsställande för spelare. I jämförelse sträcker sig alla testade enheter från 0.1 (minst) till 240 (maximalt) ms. » 85 % av alla enheter är bättre. Detta innebär att den uppmätta svarstiden är sämre än genomsnittet av alla testade enheter (19.8 ms). | ||
| ↔ Svarstid 50 % grått till 80 % grått | ||
| 40 ms ... stiga ↗ och falla ↘ kombinerat | ↗ 18.8 ms stiga | 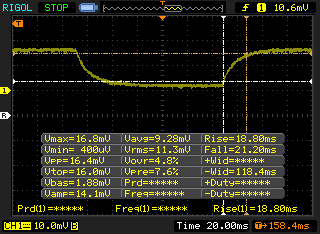 |
| ↘ 21.2 ms hösten | ||
| Skärmen visar långsamma svarsfrekvenser i våra tester och kommer att vara otillfredsställande för spelare. I jämförelse sträcker sig alla testade enheter från 0.165 (minst) till 636 (maximalt) ms. » 61 % av alla enheter är bättre. Detta innebär att den uppmätta svarstiden är sämre än genomsnittet av alla testade enheter (31 ms). | ||
Skärmflimmer / PWM (Puls-Width Modulation)
| Skärmflimmer / PWM upptäcktes inte | 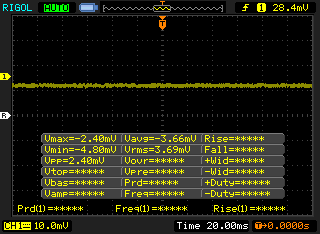 | ||
Som jämförelse: 52 % av alla testade enheter använder inte PWM för att dämpa skärmen. Om PWM upptäcktes mättes ett medelvärde av 7754 (minst: 5 - maximum: 343500) Hz. | |||
| Cinebench R10 | |
| Rendering Multiple CPUs 32Bit | |
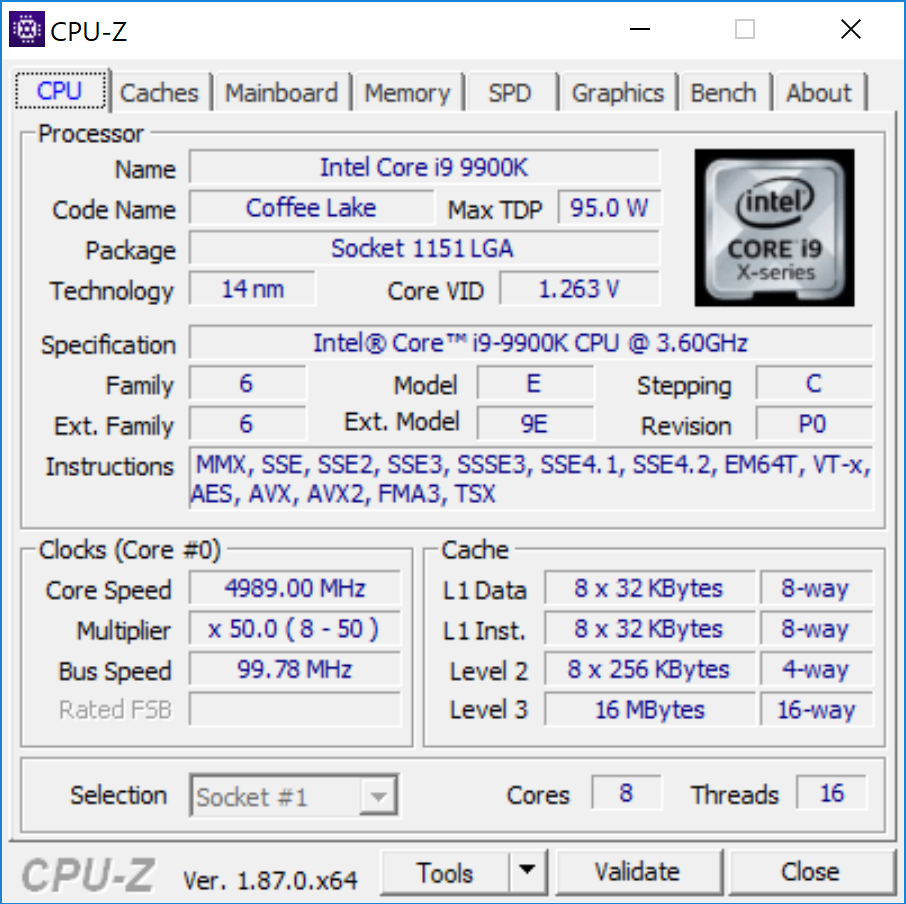
| Intel Core i9-9900K, AMD Radeon RX Vega 64 | |
| Genomsnitt Intel Core i9-9900K (36683 - 49142, n=4) | |
| Eurocom Sky X9C | |
| Eurocom Tornado F7W | |
| Eurocom Sky X7C | |
| Asus GL702ZC-GC104T | |
| Eurocom Tornado F5 | |
| Eurocom Sky MX5 R3 | |
| Rendering Single 32Bit | |
| Eurocom Tornado F7W | |
| Genomsnitt Intel Core i9-9900K (7786 - 8042, n=4) | |
| Intel Core i9-9900K, AMD Radeon RX Vega 64 | |
| Eurocom Sky X9C | |
| Eurocom Tornado F5 | |
| Eurocom Sky X7C | |
| Eurocom Sky MX5 R3 | |
| Asus GL702ZC-GC104T | |
* ... mindre är bättre
| PCMark 8 Home Score Accelerated v2 | 5130 poäng | |
| PCMark 10 Score | 6255 poäng | |
Hjälp | ||
| Eurocom Tornado F7W 3x Samsung SSD 970 Pro 512GB (RAID 0) | Eurocom Sky X7C 2x Samsung SSD 970 Pro 512GB (RAID 0) | Asus Chimera G703GI 2x Intel 760p 512 GB + 1x Samsung SM961 512 GB (RAID) | MSI GT75 8RG-090 Titan 2x Samsung PM961 MZVLW256HEHP (RAID 0) | Eurocom Tornado F5 Samsung SSD 960 Pro 512 GB m.2 | |
|---|---|---|---|---|---|
| AS SSD | 11% | 43% | 3% | 11% | |
| Seq Read (MB/s) | 2139 | 3147 47% | 4886 128% | 3058 43% | 2819 32% |
| Seq Write (MB/s) | 2447 | 2866 17% | 4110 68% | 2196 -10% | 2046 -16% |
| 4K Read (MB/s) | 29.7 | 48.74 64% | 57.4 93% | 38.37 29% | 51 72% |
| 4K Write (MB/s) | 102.5 | 116.7 14% | 141.3 38% | 97.7 -5% | 150.5 47% |
| 4K-64 Read (MB/s) | 1299 | 1348 4% | 1453 12% | 1347 4% | 1179 -9% |
| 4K-64 Write (MB/s) | 1236 | 1203 -3% | 1303 5% | 1236 0% | 1334 8% |
| Access Time Read * (ms) | 0.045 | 0.034 24% | 0.03 33% | 0.056 -24% | 0.03 33% |
| Access Time Write * (ms) | 0.033 | 0.032 3% | 0.026 21% | 0.038 -15% | 0.024 27% |
| Score Read (Points) | 1543 | 1712 11% | 1999 30% | 1691 10% | 1512 -2% |
| Score Write (Points) | 1583 | 1606 1% | 1855 17% | 1553 -2% | 1689 7% |
| Score Total (Points) | 3928 | 4184 7% | 4843 23% | 4066 4% | 3943 0% |
| Copy ISO MB/s (MB/s) | 2320 | 2330 0% | 1614 -30% | ||
| Copy Program MB/s (MB/s) | 621 | 518 -17% | 635 2% | ||
| Copy Game MB/s (MB/s) | 1585 | 1321 -17% | 1310 -17% | ||
| CrystalDiskMark 5.2 / 6 | 11% | 44% | -11% | ||
| Write 4K (MB/s) | 116.3 | 152.2 31% | 130.2 12% | 111.8 -4% | |
| Read 4K (MB/s) | 52.7 | 60.4 15% | 57.3 9% | 42.09 -20% | |
| Write Seq (MB/s) | 2539 | 3002 18% | 4049 59% | 2288 -10% | |
| Read Seq (MB/s) | 2972 | 3329 12% | 5325 79% | 3321 12% | |
| Write 4K Q32T1 (MB/s) | 454.6 | 432.9 -5% | 383.2 -16% | 308.3 -32% | |
| Read 4K Q32T1 (MB/s) | 515 | 494 -4% | 424.9 -17% | 364.9 -29% | |
| Write Seq Q32T1 (MB/s) | 3101 | 3391 9% | 4316 39% | 2440 -21% | |
| Read Seq Q32T1 (MB/s) | 3078 | 3405 11% | 8905 189% | 3485 13% | |
| Totalt genomsnitt (program/inställningar) | 11% /
11% | 44% /
43% | -4% /
-3% | 11% /
11% |
* ... mindre är bättre

| 3DMark 11 | |
| 1280x720 Performance GPU | |
| Eurocom Sky X9C | |
| Eurocom Sky X7C | |
| Eurocom Tornado F7W | |
| Eurocom Tornado F5W | |
| Dell Precision 7720 | |
| Lenovo ThinkPad P72-20MB000EGE | |
| MSI WS63VR 7RL-023US | |
| Dell Precision 5530 2-in-1 | |
| Dell Precision 5530 Xeon E-2176M | |
| 1280x720 Performance Combined | |
| Eurocom Tornado F7W | |
| Eurocom Sky X7C | |
| Eurocom Sky X9C | |
| Lenovo ThinkPad P72-20MB000EGE | |
| Dell Precision 7720 | |
| Eurocom Tornado F5W | |
| MSI WS63VR 7RL-023US | |
| Dell Precision 5530 2-in-1 | |
| Dell Precision 5530 Xeon E-2176M | |
| 3DMark | |
| 1920x1080 Fire Strike Graphics | |
| Eurocom Sky X9C | |
| Eurocom Tornado F7W | |
| Eurocom Tornado F5W | |
| Dell Precision 7720 | |
| Lenovo ThinkPad P72-20MB000EGE | |
| MSI WS63VR 7RL-023US | |
| Dell Precision 5530 2-in-1 | |
| Dell Precision 5530 Xeon E-2176M | |
| 2560x1440 Time Spy Graphics | |
| Eurocom Tornado F7W | |
| Lenovo ThinkPad P72-20MB000EGE | |
| Dell Precision 7720 | |
| Dell Precision 5530 2-in-1 | |
| Dell Precision 5530 Xeon E-2176M | |
| SPECviewperf 13 | |
| 3ds Max (3dsmax-06) | |
| Eurocom Tornado F7W | |
| Lenovo ThinkPad P72-20MB000EGE | |
| Catia (catia-05) | |
| Eurocom Tornado F7W | |
| Lenovo ThinkPad P72-20MB000EGE | |
| Creo (creo-02) | |
| Eurocom Tornado F7W | |
| Lenovo ThinkPad P72-20MB000EGE | |
| Energy (energy-02) | |
| Eurocom Tornado F7W | |
| Lenovo ThinkPad P72-20MB000EGE | |
| Maya (maya-05) | |
| Eurocom Tornado F7W | |
| Lenovo ThinkPad P72-20MB000EGE | |
| Medical (medical-02) | |
| Eurocom Tornado F7W | |
| Lenovo ThinkPad P72-20MB000EGE | |
| Showcase (showcase-02) | |
| Eurocom Tornado F7W | |
| Lenovo ThinkPad P72-20MB000EGE | |
| Siemens NX (snx-03) | |
| Eurocom Tornado F7W | |
| Lenovo ThinkPad P72-20MB000EGE | |
| Solidworks (sw-04) | |
| Eurocom Tornado F7W | |
| Lenovo ThinkPad P72-20MB000EGE | |
| 3DMark 06 Standard Score | 44390 poäng | |
| 3DMark Vantage P Result | 65844 poäng | |
| 3DMark 11 Performance | 22226 poäng | |
| 3DMark Ice Storm Standard Score | 185544 poäng | |
| 3DMark Cloud Gate Standard Score | 47810 poäng | |
| 3DMark Fire Strike Score | 16723 poäng | |
| 3DMark Time Spy Score | 6713 poäng | |
Hjälp | ||
| låg | med. | hög | ultra | 4K | |
|---|---|---|---|---|---|
| Sleeping Dogs (2012) | 344.2 | 288.1 | 267.3 | 118.8 | |
| Guild Wars 2 (2012) | 145.1 | 83.5 | 85.4 | ||
| StarCraft II: Heart of the Swarm (2013) | 753 | 346.2 | 296.6 | 218.9 | |
| BioShock Infinite (2013) | 435 | 375.5 | 346.5 | ||
| Metro: Last Light (2013) | 177.5 | 175.2 | 171.6 | 119.2 | |
| Thief (2014) | 149.4 | 145.1 | 145.7 | 114.2 | |
| The Witcher 3 (2015) | 303.5 | 211.6 | 116.1 | 63.4 | 43.9 |
| Batman: Arkham Knight (2015) | 186 | 176 | 131 | 90 | 50 |
| Metal Gear Solid V (2015) | 60 | 60 | 60 | 60 | 60 |
| Fallout 4 (2015) | 241.9 | 236.3 | 46.8 | ||
| Rise of the Tomb Raider (2016) | 292.9 | 210.1 | 121.5 | 101 | 44.9 |
| Ashes of the Singularity (2016) | 113 | 99.1 | 97.8 | 43.5 | |
| Overwatch (2016) | 300 | 300 | 252.2 | 174.1 | 88.7 |
| Prey (2017) | 145 | 144.6 | 145 | 144.1 | 60.9 |
| Rocket League (2017) | 248.5 | 247 | 185.8 | 92.5 | |
| Dirt 4 (2017) | 354.1 | 221.2 | 126 | 84.4 | 56.8 |
| Middle-earth: Shadow of War (2017) | 219 | 137 | 106 | 84 | 33 |
| Destiny 2 (2017) | 13 | 12.7 | 12.6 | 12.2 | 12.3 |
| Monster Hunter World (2018) | 183.5 | 110.1 | 100.4 | 77.4 | 24.1 |
| F1 2018 (2018) | 212 | 152 | 125 | 83 | 46 |
| Shadow of the Tomb Raider (2018) | 147 | 91 | 84 | 72 | 26 |
| Eurocom Tornado F7W Quadro P5200, i9-9900K, 3x Samsung SSD 970 Pro 512GB (RAID 0) | Acer Predator Helios 500 PH517-51-93LS GeForce GTX 1070 Mobile, i9-8950HK, Liteon CA1-8D512 | Asus Chimera G703GI GeForce GTX 1080 Mobile, i9-8950HK, 2x Intel 760p 512 GB + 1x Samsung SM961 512 GB (RAID) | HP Omen X 17-ap0xx GeForce GTX 1080 Mobile, i7-7820HK, Samsung PM961 MZVLW256HEHP | Eurocom Sky X9C GeForce GTX 1080 SLI (Laptop), i7-8700K, 2x Samsung SSD 960 Pro 1TB m.2 NVMe (RAID 0) | MSI GT75 8RG-090 Titan GeForce GTX 1080 Mobile, i9-8950HK, 2x Samsung PM961 MZVLW256HEHP (RAID 0) | |
|---|---|---|---|---|---|---|
| Noise | 16% | -2% | 9% | -5% | -2% | |
| av / miljö * (dB) | 28.2 | 29.4 -4% | 29 -3% | 28.3 -0% | 28.4 -1% | 30 -6% |
| Idle Minimum * (dB) | 33.2 | 29.4 11% | 30 10% | 31.5 5% | 34.2 -3% | 32 4% |
| Idle Average * (dB) | 33.2 | 29.4 11% | 34 -2% | 31.6 5% | 39.6 -19% | 34 -2% |
| Idle Maximum * (dB) | 33.2 | 30.1 9% | 42 -27% | 31.6 5% | 39.6 -19% | 37 -11% |
| Load Average * (dB) | 47 | 36 23% | 53 -13% | 36.8 22% | 48.5 -3% | 43 9% |
| Witcher 3 ultra * (dB) | 52.2 | 37.6 28% | 51 2% | 48.2 8% | 54 -3% | 57 -9% |
| Load Maximum * (dB) | 64 | 42.2 34% | 53 17% | 52.1 19% | 56.5 12% | 62 3% |
* ... mindre är bättre
Ljudnivå
| Låg belastning |
| 33.2 / 33.2 / 33.2 dB(A) |
| Hög belastning |
| 47 / 64 dB(A) |
 | ||
30 dB tyst 40 dB(A) hörbar 50 dB(A) högt ljud |
||
min: | ||
(+) Den maximala temperaturen på ovansidan är 34 °C / 93 F, jämfört med genomsnittet av 38.2 °C / 101 F , allt från 22.2 till 69.8 °C för klassen Workstation.
(-) Botten värms upp till maximalt 47.6 °C / 118 F, jämfört med genomsnittet av 41.1 °C / 106 F
(+) Vid tomgångsbruk är medeltemperaturen för ovansidan 21.3 °C / 70 F, jämfört med enhetsgenomsnittet på 32 °C / ### class_avg_f### F.
(+) När du spelar The Witcher 3 är medeltemperaturen för ovansidan 28.6 °C / 83 F, jämfört med enhetsgenomsnittet på 32 °C / ## #class_avg_f### F.
(+) Handledsstöden och pekplattan är kallare än hudtemperaturen med maximalt 22.6 °C / 72.7 F och är därför svala att ta på.
(+) Medeltemperaturen för handledsstödsområdet på liknande enheter var 27.8 °C / 82 F (+5.2 °C / 9.3 F).
Eurocom Tornado F7W ljudanalys
(±) | högtalarljudstyrkan är genomsnittlig men bra (80.7 dB)
Bas 100 - 315 Hz
(±) | reducerad bas - i genomsnitt 12% lägre än medianen
(±) | linjäriteten för basen är genomsnittlig (9% delta till föregående frekvens)
Mellan 400 - 2000 Hz
(+) | balanserad mellan - endast 4.8% från medianen
(±) | linjäriteten för mids är genomsnittlig (7.7% delta till föregående frekvens)
Högsta 2 - 16 kHz
(+) | balanserade toppar - endast 4.5% från medianen
(+) | toppar är linjära (5.7% delta till föregående frekvens)
Totalt 100 - 16 000 Hz
(±) | linjäriteten för det totala ljudet är genomsnittlig (15.9% skillnad mot median)
Jämfört med samma klass
» 39% av alla testade enheter i den här klassen var bättre, 10% liknande, 51% sämre
» Den bästa hade ett delta på 7%, genomsnittet var 17%, sämst var 35%
Jämfört med alla testade enheter
» 25% av alla testade enheter var bättre, 5% liknande, 70% sämre
» Den bästa hade ett delta på 4%, genomsnittet var 23%, sämst var 134%
Apple MacBook 12 (Early 2016) 1.1 GHz ljudanalys
(+) | högtalare kan spela relativt högt (83.6 dB)
Bas 100 - 315 Hz
(±) | reducerad bas - i genomsnitt 11.3% lägre än medianen
(±) | linjäriteten för basen är genomsnittlig (14.2% delta till föregående frekvens)
Mellan 400 - 2000 Hz
(+) | balanserad mellan - endast 2.4% från medianen
(+) | mids är linjära (5.5% delta till föregående frekvens)
Högsta 2 - 16 kHz
(+) | balanserade toppar - endast 2% från medianen
(+) | toppar är linjära (4.5% delta till föregående frekvens)
Totalt 100 - 16 000 Hz
(+) | det totala ljudet är linjärt (10.2% skillnad mot median)
Jämfört med samma klass
» 7% av alla testade enheter i den här klassen var bättre, 2% liknande, 90% sämre
» Den bästa hade ett delta på 5%, genomsnittet var 18%, sämst var 53%
Jämfört med alla testade enheter
» 5% av alla testade enheter var bättre, 1% liknande, 94% sämre
» Den bästa hade ett delta på 4%, genomsnittet var 23%, sämst var 134%
| Av/Standby | |
| Låg belastning | |
| Hög belastning |
|
Förklaring:
min: | |
| Eurocom Tornado F7W i9-9900K, Quadro P5200, 3x Samsung SSD 970 Pro 512GB (RAID 0), IPS, 3840x2160, 17.3" | Eurocom Sky X7C i7-8086K, GeForce GTX 1080 Mobile, 2x Samsung SSD 970 Pro 512GB (RAID 0), IPS, 3840x2160, 17.3" | Asus Chimera G703GI i9-8950HK, GeForce GTX 1080 Mobile, 2x Intel 760p 512 GB + 1x Samsung SM961 512 GB (RAID), IPS, 1920x1080, 17.3" | Eurocom Sky X9C i7-8700K, GeForce GTX 1080 SLI (Laptop), 2x Samsung SSD 960 Pro 1TB m.2 NVMe (RAID 0), IPS, 3840x2160, 17.3" | MSI GT75 8RG-090 Titan i9-8950HK, GeForce GTX 1080 Mobile, 2x Samsung PM961 MZVLW256HEHP (RAID 0), TN, 1920x1080, 17.3" | Eurocom Tornado F5 i7-7700K, GeForce GTX 1070 Mobile, Samsung SSD 960 Pro 512 GB m.2, IPS, 1920x1080, 15.6" | |
|---|---|---|---|---|---|---|
| Power Consumption | 10% | -7% | -54% | -8% | 22% | |
| Idle Minimum * (Watt) | 28.5 | 33.3 -17% | 29 -2% | 54.7 -92% | 31 -9% | 21.2 26% |
| Idle Average * (Watt) | 36.7 | 40.1 -9% | 37 -1% | 55.7 -52% | 35 5% | 25.1 32% |
| Idle Maximum * (Watt) | 37.8 | 42.1 -11% | 46 -22% | 56.8 -50% | 45 -19% | 26.3 30% |
| Load Average * (Watt) | 144.6 | 95.6 34% | 156 -8% | 183.7 -27% | 130 10% | 169.4 -17% |
| Witcher 3 ultra * (Watt) | 218.9 | 152.9 30% | 252 -15% | 454.8 -108% | 268 -22% | |
| Load Maximum * (Watt) | 336 | 220 35% | 314 7% | 321.8 4% | 374 -11% | 202.4 40% |
* ... mindre är bättre
| Eurocom Tornado F7W i9-9900K, Quadro P5200, 90 Wh | Eurocom Sky X7C i7-8086K, GeForce GTX 1080 Mobile, 82 Wh | Asus Chimera G703GI i9-8950HK, GeForce GTX 1080 Mobile, 71 Wh | Eurocom Sky X9C i7-8700K, GeForce GTX 1080 SLI (Laptop), 89 Wh | MSI GT75 8RG-090 Titan i9-8950HK, GeForce GTX 1080 Mobile, 75 Wh | Eurocom Tornado F5 i7-7700K, GeForce GTX 1070 Mobile, 75.24 Wh | |
|---|---|---|---|---|---|---|
| Batteridrifttid | -20% | -27% | -57% | 20% | ||
| WiFi v1.3 (h) | 3 | 2.4 -20% | 2.2 -27% | 1.3 -57% | 3.6 20% | |
| Reader / Idle (h) | 2.8 | 1.4 | 3.8 | 4.9 | ||
| Load (h) | 0.9 | 0.8 | 1.1 | 1.1 |
För
Emot
Läs den fullständiga versionen av den här recensionen på engelska här.
De största anledningarna till att välja en arbetsstation från Eurocom är prestandan, konfigurationsalternativen och de goda servicemöjligheterna. Konkurrerande system från mer välkända märken som Lenovo, Dell eller HP har oftast långsammare hårdvara, färre uppgraderingsalternativ och ett ogillande mot att användaren meckar. Den som ämnar utnyttja dessa tre fördelar kommer att uppskatta Tornado F7W.
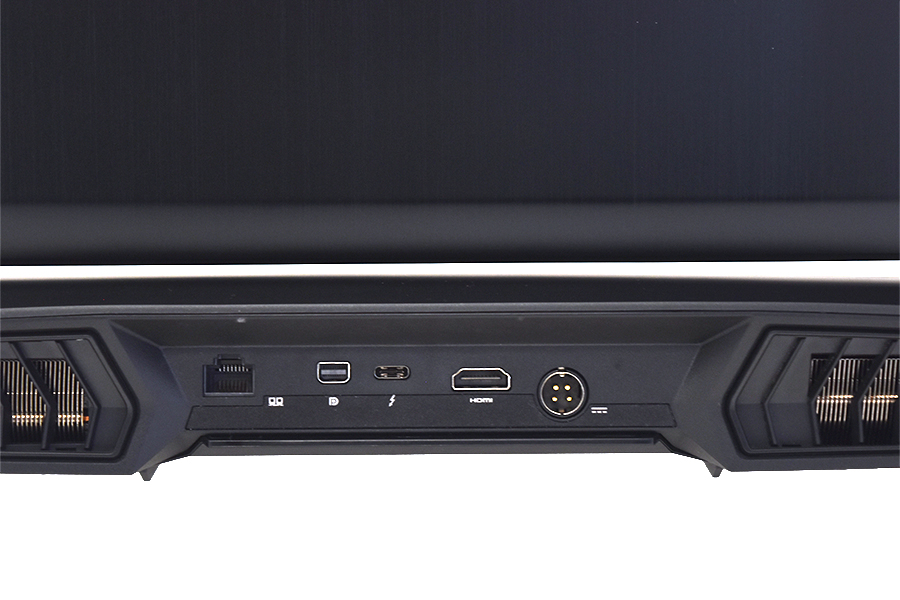
När man går på djupet ser man att det finns många förbättringar som skulle kunna göras. I synnerhet kunde CPU-prestandan varit bättre då man i det här chassit inte får ut den fulla potentialen ur en Core i9-9900K. 4K UHD-skärmen är aningen grynigare än vi är vana vid, till och med för att vara en matt skärm och den aktivt kylda nätadaptern låter ibland mer än själva datorn vid genomsnittlig belastning. Vi upplevde också till synes buggigt BIOS och WLAN. Detta är troligen unikt för vår enhet, men är ändå värt att nämna. Slutligen finns det ett antal mindre klagomål som i slutändan blir ganska många, såsom att det numeriska tangentbordet har små knappar, att RGB-bakgrundsbelysning och 10 Gbit Ethernet saknas, att de bakre portarna är svåra att nå och att kabeln från nätadaptern är tjock och otymplig. En del av dessa saker hade kunnat ursäktas på ett billigare alternativ, men med tanke på priset förväntar man sig allt och lite till.
Eurocom Tornado F7W har ingen like bland arbetsstationer på 17 tum. Dess extrema prestanda och mångsidiga hårdvara bör tilltala proffs som inte har några problem med att byta ut komponenter eller felsöka själva. Men det finns ändå ett antal mindre irritationsmoment och brister som vi hoppas kommer åtgärdas till nästa version.
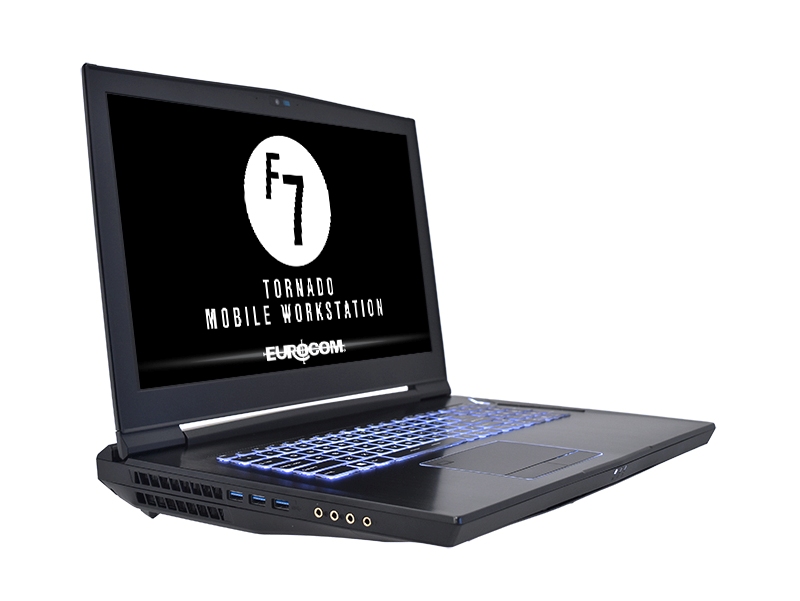
Eurocom Tornado F7W
- 12/06/2018 v6 (old)
Allen Ngo
Price comparison
