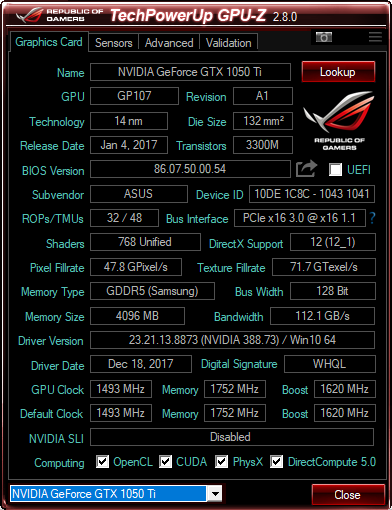
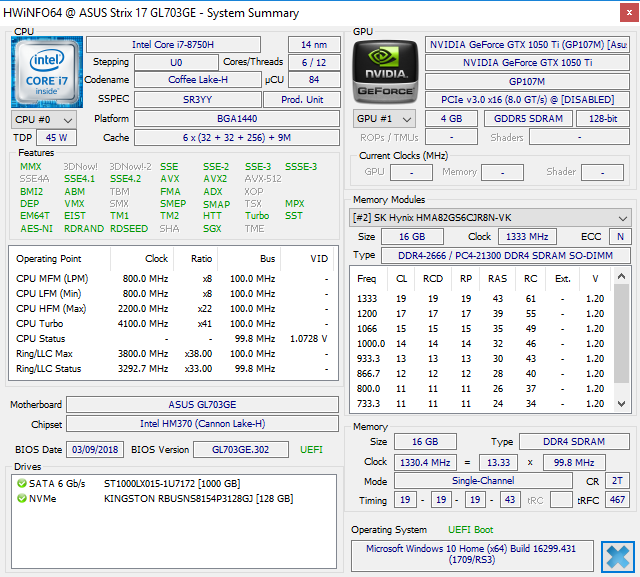
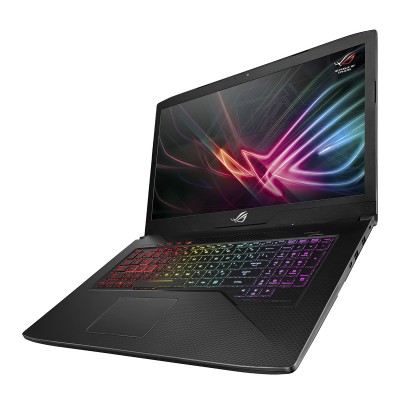
Test: Asus GL703GE (Core i7-8750H, GTX 1050 Ti) Laptop (Sammanfattning)
| SD Card Reader | |
| average JPG Copy Test (av. of 3 runs) | |
| Genomsnitt av klass Gaming (20.9 - 210, n=54, senaste 2 åren) | |
| Asus GL703GE-ES73 (Toshiba Exceria Pro SDXC 64 GB UHS-II) | |
| HP Omen 17-w206ng (Toshiba Exceria Pro SDXC 64 GB UHS-II) | |
| Asus Strix GL703VM-DB74 (Toshiba Exceria Pro SDXC 64 GB UHS-II) | |
| MSI GE72 7RE-046 (Toshiba Exceria Pro SDXC 64 GB UHS-II) | |
| maximum AS SSD Seq Read Test (1GB) | |
| Genomsnitt av klass Gaming (25.5 - 261, n=51, senaste 2 åren) | |
| Asus Strix GL703VM-DB74 (Toshiba Exceria Pro SDXC 64 GB UHS-II) | |
| Asus GL703GE-ES73 (Toshiba Exceria Pro SDXC 64 GB UHS-II) | |
| HP Omen 17-w206ng (Toshiba Exceria Pro SDXC 64 GB UHS-II) | |
| MSI GE72 7RE-046 (Toshiba Exceria Pro SDXC 64 GB UHS-II) | |
| Networking | |
| iperf3 transmit AX12 | |
| Asus GL703GE-ES73 | |
| HP Omen 17-w206ng | |
| Asus Strix GL703VM-DB74 | |
| MSI GE72 7RE-046 | |
| iperf3 receive AX12 | |
| HP Omen 17-w206ng | |
| Asus GL703GE-ES73 | |
| Asus Strix GL703VM-DB74 | |
| MSI GE72 7RE-046 | |
| |||||||||||||||||||||||||
Distribution av ljusstyrkan: 86 %
Mitt på batteriet: 331.1 cd/m²
Kontrast: 1068:1 (Svärta: 0.31 cd/m²)
ΔE ColorChecker Calman: 2.86 | ∀{0.5-29.43 Ø4.72}
calibrated: 2.66
ΔE Greyscale Calman: 4.3 | ∀{0.09-98 Ø4.97}
100% sRGB (Argyll 1.6.3 3D)
75% AdobeRGB 1998 (Argyll 1.6.3 3D)
83.1% AdobeRGB 1998 (Argyll 3D)
99.8% sRGB (Argyll 3D)
90.1% Display P3 (Argyll 3D)
Gamma: 2.268
CCT: 7034 K
| Asus GL703GE-ES73 Chi Mei CMN1747, TN, 17.3", 1920x1080 | Asus Strix GL703VM-DB74 AU Optronics B173HAN01.1, IPS, 17.3", 1920x1080 | HP Omen 17-w206ng Chi Mei CMN1738, IPS, 17.3", 1920x1080 | MSI GE72 7RE-046 N173HHE-G32 (CMN1747), TN LED, 17.3", 1920x1080 | |
|---|---|---|---|---|
| Display | -23% | -17% | 1% | |
| Display P3 Coverage (%) | 90.1 | 61.5 -32% | 67.2 -25% | 90.7 1% |
| sRGB Coverage (%) | 99.8 | 87.2 -13% | 93.1 -7% | 99.9 0% |
| AdobeRGB 1998 Coverage (%) | 83.1 | 62.7 -25% | 67.4 -19% | 85.2 3% |
| Response Times | -172% | -212% | -68% | |
| Response Time Grey 50% / Grey 80% * (ms) | 11.6 ? | 30.8 ? -166% | 38 ? -228% | 27 ? -133% |
| Response Time Black / White * (ms) | 8.8 ? | 24.4 ? -177% | 26 ? -195% | 9 ? -2% |
| PWM Frequency (Hz) | 26040 ? | 200 ? | ||
| Screen | -17% | -12% | -24% | |
| Brightness middle (cd/m²) | 331.1 | 319.5 -4% | 318 -4% | 253 -24% |
| Brightness (cd/m²) | 312 | 293 -6% | 295 -5% | 230 -26% |
| Brightness Distribution (%) | 86 | 67 -22% | 79 -8% | 86 0% |
| Black Level * (cd/m²) | 0.31 | 0.65 -110% | 0.25 19% | 0.24 23% |
| Contrast (:1) | 1068 | 492 -54% | 1272 19% | 1054 -1% |
| Colorchecker dE 2000 * | 2.86 | 3.17 -11% | 4.7 -64% | 5.01 -75% |
| Colorchecker dE 2000 max. * | 6.35 | 5.32 16% | 8.8 -39% | 10.4 -64% |
| Colorchecker dE 2000 calibrated * | 2.66 | |||
| Greyscale dE 2000 * | 4.3 | 1.6 63% | 5 -16% | 7.26 -69% |
| Gamma | 2.268 97% | 2.22 99% | 2.28 96% | 2.09 105% |
| CCT | 7034 92% | 6668 97% | 7374 88% | 6329 103% |
| Color Space (Percent of AdobeRGB 1998) (%) | 75 | 56 -25% | 61 -19% | 76 1% |
| Color Space (Percent of sRGB) (%) | 100 | 87 -13% | 93 -7% | 100 0% |
| Totalt genomsnitt (program/inställningar) | -71% /
-39% | -80% /
-40% | -30% /
-24% |
* ... mindre är bättre
Visa svarstider
| ↔ Svarstid svart till vitt | ||
|---|---|---|
| 8.8 ms ... stiga ↗ och falla ↘ kombinerat | ↗ 6 ms stiga | 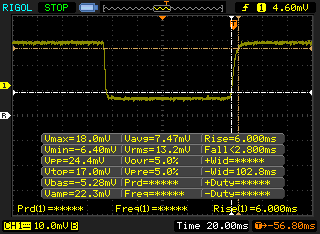 |
| ↘ 2.8 ms hösten | ||
| Skärmen visar snabba svarsfrekvenser i våra tester och bör passa för spel. I jämförelse sträcker sig alla testade enheter från 0.1 (minst) till 240 (maximalt) ms. » 25 % av alla enheter är bättre. Det betyder att den uppmätta svarstiden är bättre än genomsnittet av alla testade enheter (19.8 ms). | ||
| ↔ Svarstid 50 % grått till 80 % grått | ||
| 11.6 ms ... stiga ↗ och falla ↘ kombinerat | ↗ 6 ms stiga | 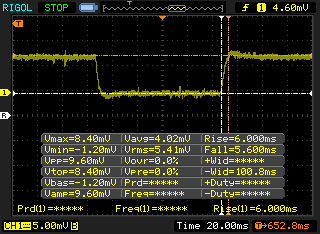 |
| ↘ 5.6 ms hösten | ||
| Skärmen visar bra svarsfrekvens i våra tester, men kan vara för långsam för konkurrenskraftiga spelare. I jämförelse sträcker sig alla testade enheter från 0.165 (minst) till 636 (maximalt) ms. » 25 % av alla enheter är bättre. Det betyder att den uppmätta svarstiden är bättre än genomsnittet av alla testade enheter (31 ms). | ||
Skärmflimmer / PWM (Puls-Width Modulation)
| Skärmflimmer / PWM upptäckt | 26040 Hz | ≤ 25 % ljusstyrka inställning | 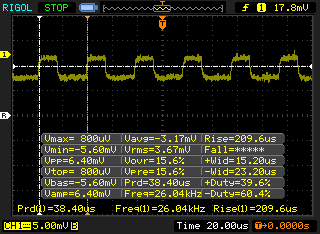 |
Displayens bakgrundsbelysning flimrar vid 26040 Hz (i värsta fall, t.ex. med PWM) Flimrande upptäckt vid en ljusstyrkeinställning på 25 % och lägre. Det ska inte finnas något flimmer eller PWM över denna ljusstyrkeinställning. Frekvensen för 26040 Hz är ganska hög, så de flesta användare som är känsliga för PWM bör inte märka något flimmer. Som jämförelse: 52 % av alla testade enheter använder inte PWM för att dämpa skärmen. Om PWM upptäcktes mättes ett medelvärde av 7747 (minst: 5 - maximum: 343500) Hz. | |||
* ... mindre är bättre
| PCMark 8 Home Score Accelerated v2 | 4148 poäng | |
| PCMark 8 Creative Score Accelerated v2 | 5254 poäng | |
| PCMark 8 Work Score Accelerated v2 | 5288 poäng | |
| PCMark 10 Score | 4532 poäng | |
Hjälp | ||
| Asus GL703GE-ES73 Kingston RBUSNS8154P3128GJ | HP Omen 17-w206ng Samsung PM961 MZVLW256HEHP | MSI GE72 7RE-046 Toshiba HG6 THNSNJ256G8NY | Gigabyte Aero 15X v8 Toshiba NVMe THNSN5512GPU7 | Dell XPS 15 9575 i5-8305G Toshiba XG5 KXG50ZNV256G | |
|---|---|---|---|---|---|
| AS SSD | |||||
| Copy Game MB/s (MB/s) | 343.5 | 250.5 -27% | |||
| Copy Program MB/s (MB/s) | 101.8 | 174.9 72% | |||
| Copy ISO MB/s (MB/s) | 443.6 | 392.7 -11% | |||
| Score Total (Points) | 634 | 2172 243% | 969 53% | 2536 300% | 1113 76% |
| Score Write (Points) | 196 | 165 -16% | 324 65% | 939 379% | 307 57% |
| Score Read (Points) | 311 | 1390 347% | 424 36% | 1092 251% | 595 91% |
| Access Time Write * (ms) | 0.07 | 1.881 -2587% | 0.032 54% | 0.046 34% | 0.056 20% |
| Access Time Read * (ms) | 0.27 | 0.056 79% | 0.119 56% | 0.119 56% | 0.146 46% |
| 4K-64 Write (MB/s) | 116 | 129.5 12% | 175.3 51% | 742 540% | 181.2 56% |
| 4K-64 Read (MB/s) | 193.1 | 1101 470% | 351.1 82% | 847 339% | 337.1 75% |
| 4K Write (MB/s) | 59.1 | 1.31 -98% | 101.5 72% | 80.4 36% | 92.7 57% |
| 4K Read (MB/s) | 18.93 | 48.92 158% | 21.41 13% | 23.36 23% | 24.78 31% |
| Seq Write (MB/s) | 212.8 | 346.2 63% | 475.5 123% | 1163 447% | 334.3 57% |
| Seq Read (MB/s) | 993 | 2399 142% | 515 -48% | 2213 123% | 2335 135% |
* ... mindre är bättre

| 3DMark 06 Standard Score | 32246 poäng | |
| 3DMark 11 Performance | 9097 poäng | |
| 3DMark Ice Storm Standard Score | 131234 poäng | |
| 3DMark Cloud Gate Standard Score | 25678 poäng | |
| 3DMark Fire Strike Score | 7074 poäng | |
| 3DMark Fire Strike Extreme Score | 3602 poäng | |
Hjälp | ||
| Counter-Strike: GO - 1920x1080 (Very) High, FXAA AA:4x MS AF:8x (sortera efter värde) | |
| Asus GL703GE-ES73 | |
| Genomsnitt NVIDIA GeForce GTX 1050 Ti Mobile (n=1) | |
| The Witcher 3 - 1920x1080 Ultra Graphics & Postprocessing (HBAO+) (sortera efter värde) | |
| Asus GL703GE-ES73 | |
| Genomsnitt NVIDIA GeForce GTX 1050 Ti Mobile (14 - 38, n=31) | |
| Genomsnitt av klass Gaming (104.7 - 240, n=6, senaste 2 åren) | |
| Rocket League - 1920x1080 High Quality AA:High FX (sortera efter värde) | |
| Asus GL703GE-ES73 | |
| Genomsnitt NVIDIA GeForce GTX 1050 Ti Mobile (106 - 158, n=4) | |
| låg | med. | hög | ultra | |
|---|---|---|---|---|
| Counter-Strike: GO (2012) | 124 | |||
| Dota 2 (2013) | 65 | |||
| The Witcher 3 (2015) | 26 | |||
| Hitman 2016 (2016) | 42 | 41 | ||
| Deus Ex Mankind Divided (2016) | 38 | 19 | ||
| Rocket League (2017) | 108 | |||
| Dirt 4 (2017) | 41 | |||
| Middle-earth: Shadow of War (2017) | 60 | 44 | 37 |
Ljudnivå
| Låg belastning |
| 28.2 / 30 / 32 dB(A) |
| Hög belastning |
| 36 / 48.8 dB(A) |
 | ||
30 dB tyst 40 dB(A) hörbar 50 dB(A) högt ljud |
||
min: | ||
| Asus GL703GE-ES73 GeForce GTX 1050 Ti Mobile, i7-8750H, Kingston RBUSNS8154P3128GJ | Asus Strix GL703VM-DB74 GeForce GTX 1060 Mobile, i7-7700HQ, Seagate Mobile HDD 1TB ST1000LX015-1U7172 | HP Omen 17-w206ng GeForce GTX 1050 Ti Mobile, i7-7700HQ, Samsung PM961 MZVLW256HEHP | MSI GE72 7RE-046 GeForce GTX 1050 Ti Mobile, i7-7700HQ, Toshiba HG6 THNSNJ256G8NY | MSI GS65 8RF-019DE Stealth Thin GeForce GTX 1070 Max-Q, i7-8750H, Samsung SSD PM981 MZVLB512HAJQ | Gigabyte Aero 15X v8 GeForce GTX 1070 Max-Q, i7-8750H, Toshiba NVMe THNSN5512GPU7 | MSI GV72 7RD-1048XPL GeForce GTX 1050 Mobile, i5-7300HQ, ADATA SX7000NP 128 GB | Dell XPS 15 9575 i5-8305G Vega M GL / 870, i5-8305G, Toshiba XG5 KXG50ZNV256G | Acer Nitro 5 AN515-52 GeForce GTX 1050 Ti Mobile, i5-8300H | |
|---|---|---|---|---|---|---|---|---|---|
| Noise | -3% | -13% | -12% | -2% | -10% | -1% | 6% | ||
| av / miljö * (dB) | 28.2 | 28.4 -1% | 30 -6% | 30 -6% | 30 -6% | 29 -3% | 27.8 1% | ||
| Idle Minimum * (dB) | 28.2 | 30.2 -7% | 34 -21% | 34 -21% | 30 -6% | 30 -6% | 31.1 -10% | 27.8 1% | |
| Idle Average * (dB) | 30 | 30.2 -1% | 35 -17% | 35 -17% | 31 -3% | 31 -3% | 31.1 -4% | 27.8 7% | |
| Idle Maximum * (dB) | 32 | 30.2 6% | 36 -13% | 36 -13% | 34 -6% | 35 -9% | 31.1 3% | 27.8 13% | |
| Load Average * (dB) | 36 | 38.4 -7% | 47 -31% | 41 -14% | 43 -19% | 49 -36% | 38.7 -8% | 35 3% | |
| Witcher 3 ultra * (dB) | 48.8 | 49.7 -2% | 48 2% | 42 14% | 51 -5% | 44.2 9% | |||
| Load Maximum * (dB) | 48.8 | 54.5 -12% | 52 -7% | 49 -0% | 44 10% | 54 -11% | 42.5 13% | 44.2 9% |
* ... mindre är bättre
(-) Den maximala temperaturen på ovansidan är 58.6 °C / 137 F, jämfört med genomsnittet av 40.4 °C / 105 F , allt från 21.2 till 68.8 °C för klassen Gaming.
(-) Botten värms upp till maximalt 59.4 °C / 139 F, jämfört med genomsnittet av 43.2 °C / 110 F
(+) Vid tomgångsbruk är medeltemperaturen för ovansidan 27.3 °C / 81 F, jämfört med enhetsgenomsnittet på 33.9 °C / ### class_avg_f### F.
(±) När du spelar The Witcher 3 är medeltemperaturen för ovansidan 35.6 °C / 96 F, jämfört med enhetsgenomsnittet på 33.9 °C / ## #class_avg_f### F.
(+) Handledsstöden och pekplattan är kallare än hudtemperaturen med maximalt 25.8 °C / 78.4 F och är därför svala att ta på.
(+) Medeltemperaturen för handledsstödsområdet på liknande enheter var 28.8 °C / 83.8 F (+3 °C / 5.4 F).
| Asus GL703GE-ES73 GeForce GTX 1050 Ti Mobile, i7-8750H, Kingston RBUSNS8154P3128GJ | Asus Strix GL703VM-DB74 GeForce GTX 1060 Mobile, i7-7700HQ, Seagate Mobile HDD 1TB ST1000LX015-1U7172 | HP Omen 17-w206ng GeForce GTX 1050 Ti Mobile, i7-7700HQ, Samsung PM961 MZVLW256HEHP | MSI GE72 7RE-046 GeForce GTX 1050 Ti Mobile, i7-7700HQ, Toshiba HG6 THNSNJ256G8NY | MSI GS65 8RF-019DE Stealth Thin GeForce GTX 1070 Max-Q, i7-8750H, Samsung SSD PM981 MZVLB512HAJQ | Gigabyte Aero 15X v8 GeForce GTX 1070 Max-Q, i7-8750H, Toshiba NVMe THNSN5512GPU7 | MSI GV72 7RD-1048XPL GeForce GTX 1050 Mobile, i5-7300HQ, ADATA SX7000NP 128 GB | Dell XPS 15 9575 i5-8305G Vega M GL / 870, i5-8305G, Toshiba XG5 KXG50ZNV256G | |
|---|---|---|---|---|---|---|---|---|
| Heat | -7% | 11% | 19% | 18% | 12% | 32% | 25% | |
| Maximum Upper Side * (°C) | 58.6 | 64.6 -10% | 55.6 5% | 45.8 22% | 49 16% | 53 10% | 42.7 27% | 44.8 24% |
| Maximum Bottom * (°C) | 59.4 | 57.2 4% | 57.7 3% | 45.2 24% | 63 -6% | 65 -9% | 38.8 35% | 40 33% |
| Idle Upper Side * (°C) | 35 | 37.6 -7% | 32.2 8% | 31.7 9% | 24 31% | 26 26% | 24.4 30% | 28 20% |
| Idle Bottom * (°C) | 37 | 43 -16% | 27.2 26% | 29.9 19% | 25 32% | 30 19% | 23.2 37% | 29.4 21% |
* ... mindre är bättre
Asus GL703GE-ES73 ljudanalys
(-) | inte särskilt höga högtalare (69.6 dB)
Bas 100 - 315 Hz
(±) | reducerad bas - i genomsnitt 6.9% lägre än medianen
(±) | linjäriteten för basen är genomsnittlig (11.6% delta till föregående frekvens)
Mellan 400 - 2000 Hz
(+) | balanserad mellan - endast 3% från medianen
(+) | mids är linjära (4.9% delta till föregående frekvens)
Högsta 2 - 16 kHz
(+) | balanserade toppar - endast 1.4% från medianen
(+) | toppar är linjära (5.5% delta till föregående frekvens)
Totalt 100 - 16 000 Hz
(+) | det totala ljudet är linjärt (13.2% skillnad mot median)
Jämfört med samma klass
» 19% av alla testade enheter i den här klassen var bättre, 4% liknande, 77% sämre
» Den bästa hade ett delta på 6%, genomsnittet var 18%, sämst var 132%
Jämfört med alla testade enheter
» 13% av alla testade enheter var bättre, 3% liknande, 84% sämre
» Den bästa hade ett delta på 4%, genomsnittet var 23%, sämst var 134%
MSI GE72 7RE-046 ljudanalys
(+) | högtalare kan spela relativt högt (91 dB)
Bas 100 - 315 Hz
(-) | nästan ingen bas - i genomsnitt 17.2% lägre än medianen
(±) | linjäriteten för basen är genomsnittlig (9.2% delta till föregående frekvens)
Mellan 400 - 2000 Hz
(+) | balanserad mellan - endast 3.3% från medianen
(+) | mids är linjära (4.7% delta till föregående frekvens)
Högsta 2 - 16 kHz
(+) | balanserade toppar - endast 3.3% från medianen
(+) | toppar är linjära (4% delta till föregående frekvens)
Totalt 100 - 16 000 Hz
(+) | det totala ljudet är linjärt (13.7% skillnad mot median)
Jämfört med samma klass
» 21% av alla testade enheter i den här klassen var bättre, 7% liknande, 72% sämre
» Den bästa hade ett delta på 6%, genomsnittet var 18%, sämst var 132%
Jämfört med alla testade enheter
» 15% av alla testade enheter var bättre, 4% liknande, 81% sämre
» Den bästa hade ett delta på 4%, genomsnittet var 23%, sämst var 134%
| Av/Standby | |
| Låg belastning | |
| Hög belastning |
|
Förklaring:
min: | |
| Asus GL703GE-ES73 i7-8750H, GeForce GTX 1050 Ti Mobile, Kingston RBUSNS8154P3128GJ, TN, 1920x1080, 17.3" | Asus Strix GL703VM-DB74 i7-7700HQ, GeForce GTX 1060 Mobile, Seagate Mobile HDD 1TB ST1000LX015-1U7172, IPS, 1920x1080, 17.3" | HP Omen 17-w206ng i7-7700HQ, GeForce GTX 1050 Ti Mobile, Samsung PM961 MZVLW256HEHP, IPS, 1920x1080, 17.3" | MSI GE72 7RE-046 i7-7700HQ, GeForce GTX 1050 Ti Mobile, Toshiba HG6 THNSNJ256G8NY, TN LED, 1920x1080, 17.3" | Gigabyte Aero 15X v8 i7-8750H, GeForce GTX 1070 Max-Q, Toshiba NVMe THNSN5512GPU7, IPS, 1920x1080, 15.6" | |
|---|---|---|---|---|---|
| Power Consumption | -13% | 4% | -4% | -9% | |
| Idle Minimum * (Watt) | 12.8 | 17.3 -35% | 11 14% | 14 -9% | 14 -9% |
| Idle Average * (Watt) | 18.1 | 21.8 -20% | 18 1% | 20 -10% | 18 1% |
| Idle Maximum * (Watt) | 24.7 | 23 7% | 24 3% | 25 -1% | 22 11% |
| Load Average * (Watt) | 98.4 | 79.2 20% | 84 15% | 82 17% | 91 8% |
| Witcher 3 ultra * (Watt) | 122.5 | 101 18% | 142 -16% | ||
| Load Maximum * (Watt) | 114.6 | 158.2 -38% | 146 -27% | 135 -18% | 173 -51% |
* ... mindre är bättre
| Asus GL703GE-ES73 i7-8750H, GeForce GTX 1050 Ti Mobile, 64 Wh | Asus Strix GL703VM-DB74 i7-7700HQ, GeForce GTX 1060 Mobile, 64 Wh | HP Omen 17-w206ng i7-7700HQ, GeForce GTX 1050 Ti Mobile, 62 Wh | MSI GE72 7RE-046 i7-7700HQ, GeForce GTX 1050 Ti Mobile, 51.4 Wh | Gigabyte Aero 15X v8 i7-8750H, GeForce GTX 1070 Max-Q, 94.24 Wh | MSI GV72 7RD-1048XPL i5-7300HQ, GeForce GTX 1050 Mobile, 41.4 Wh | Dell XPS 15 9575 i5-8305G i5-8305G, Vega M GL / 870, 75 Wh | |
|---|---|---|---|---|---|---|---|
| Batteridrifttid | -17% | 87% | -35% | 141% | 0% | 83% | |
| Reader / Idle (h) | 5.8 | 4 -31% | 13.3 129% | 12.7 119% | 5.8 0% | 11.1 91% | |
| WiFi v1.3 (h) | 4.8 | 3.2 -33% | 6.3 31% | 3.1 -35% | 8.6 79% | 9.4 96% | |
| Load (h) | 0.8 | 0.9 13% | 1.6 100% | 2.6 225% | 1.3 63% | ||
| WiFi (h) | 3.3 |
För
Emot

Läs den fullständiga versionen av den här recensionen på engelska här.
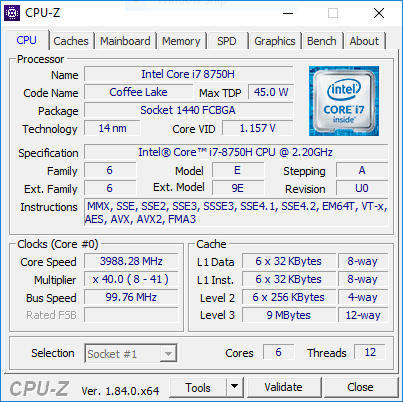
Asus GL703GE är, väsentligen, en förfining av Asus 17-tums ROG Strix-serie. GTX 1050 Ti-varianten bockar av många rutor utan att låta särskilt många saker falla genom sprickorna. Showens stjärna är utan tvekan Intel Core i7-8750H. Den nya sexkärniga CPU:n kommer troligen att sitta i dom flesta spellaptop-modellerna i år, och även om GL703GE är skaplig på att visa upp den nya processorns förmåga så kanske den inte är bäst på det. Det finns en rejäl förbättring över den fyrkärniga i7-7700HQ, men GL703GE ligger en aning efter andra maskiner med 8750H. Trots det så står Coffee Lake för den uppfräschning som Intels CPU:er på 45W har behövt i åratal och kommer definitivt att lovordas av gamers och andra proffsanvändare.
Samtidigt som GeForce GTX 1050 Ti inte riktigt är kapabel till att dra nytta av 8750H så uppnår den en bra balans mellan prestanda och effektivitet. 120 Hz-skärmen resulterar i en lockande enhet riktad åt tävlingsspelare. Spel ser skarpa och smidiga ut och en del tävlingstitlar kan pressas till över 100 FPS för att fullt ut dra fördel av den höga uppdateringsfrekvensen. Ett GTX 1060 hade gett bättre resultat på bekostnad av mer värme och högre energiåtgång. Resten av enheten är fortfarande ett utmärkt paket.
Sammantaget så är Intels nya Coffee Lake Core i7-8750H fördelaktig för processor-intensiva uppgifter. Men trots att den nya processorn framhävs som det huvudsakliga försäljningsargumentet så är GTX 1050 Ti inte riktigt den GPU som 8750H förtjänar. Om du inte behöver den uppgraderade CPU:n för processortungt arbete så finns det väldigt få anledningar att uppgradera. Med ett rekommenderat pris på 11 000 kronor så är GL703GE inte värd vad den erbjuder; GPU:n verkar vara en dålig partner till processorn. GL703VM, som kombinerar GTX 1060 och Core i7-7700HQ, kan vara mer prisvärd för runt 1 000 kronor extra.
Asus GL703GE-ES73
- 05/12/2018 v6 (old)
Sam Medley
Price comparison
