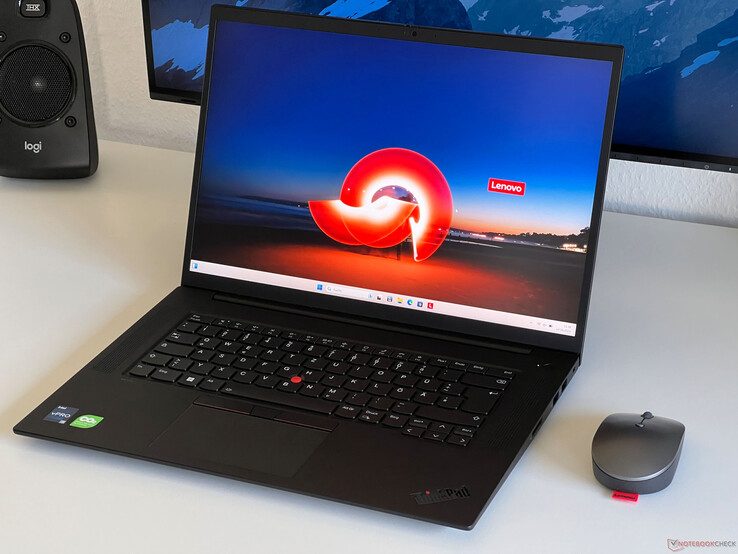
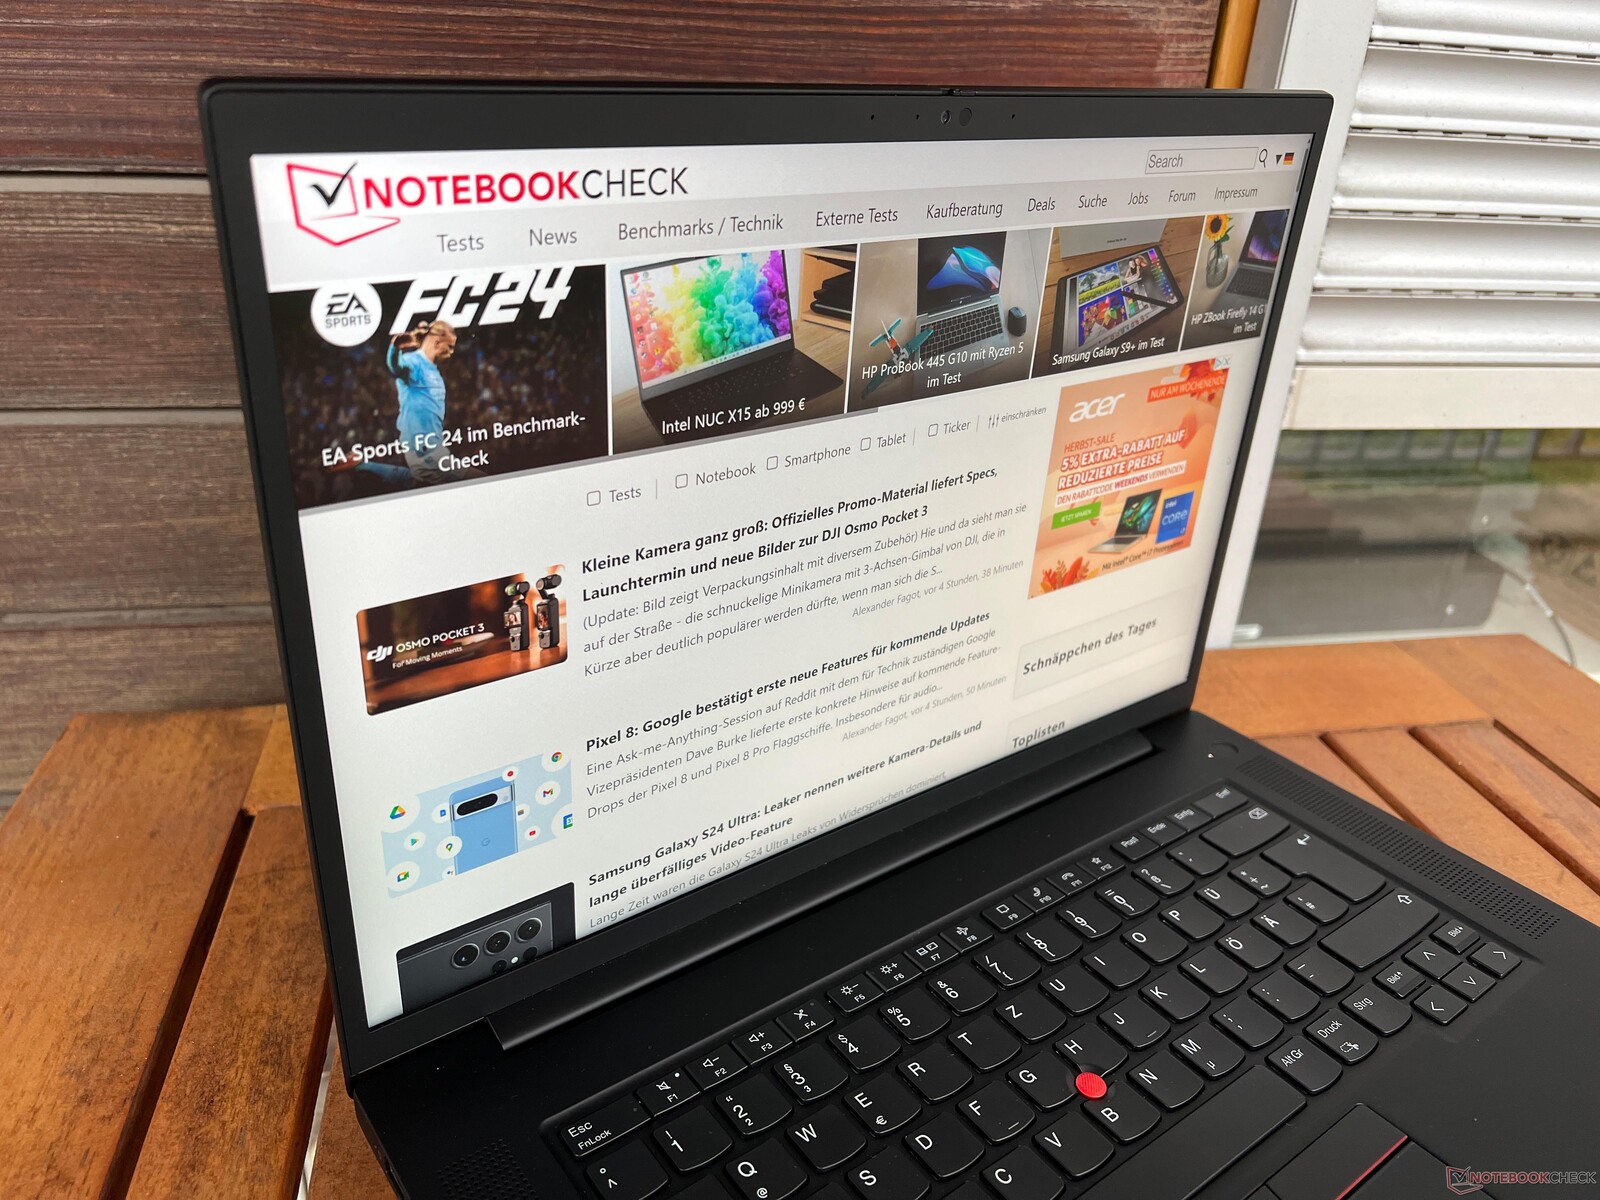
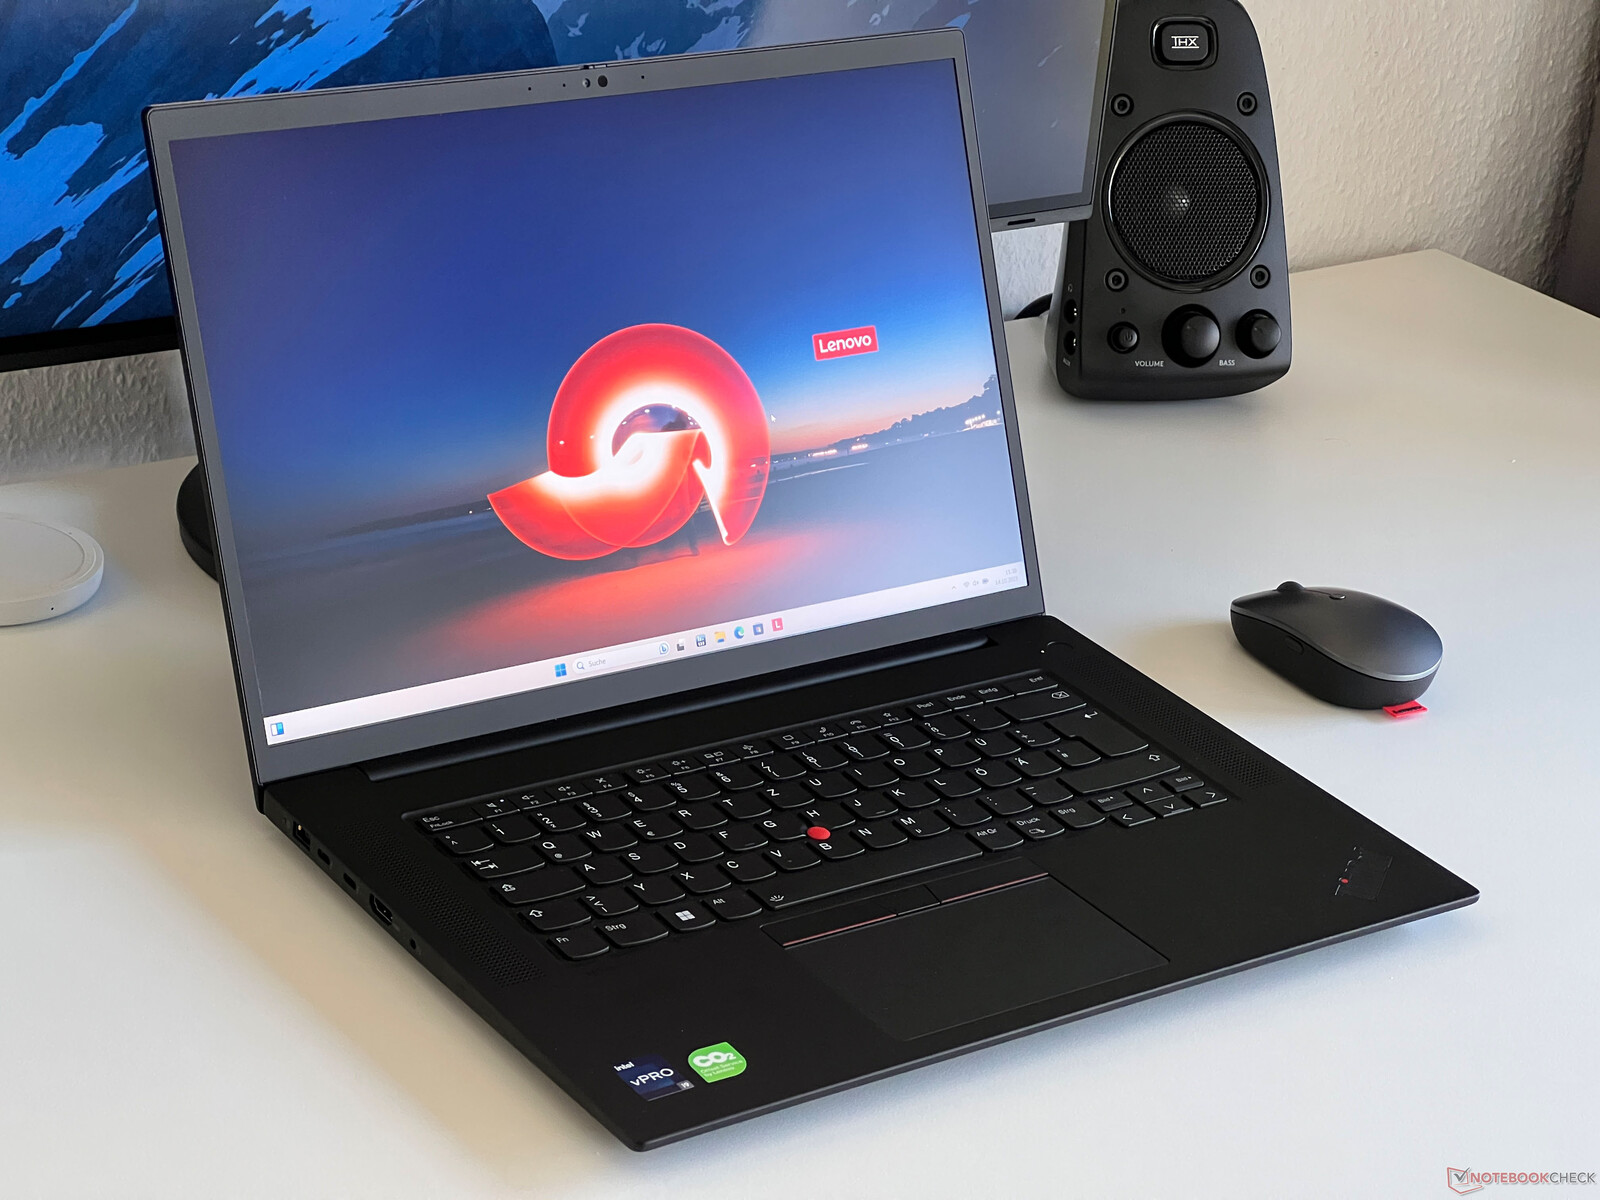
Lenovo ThinkPad P1 G6 i test - Mobil arbetsstation ersätter ThinkPad X1 Extreme
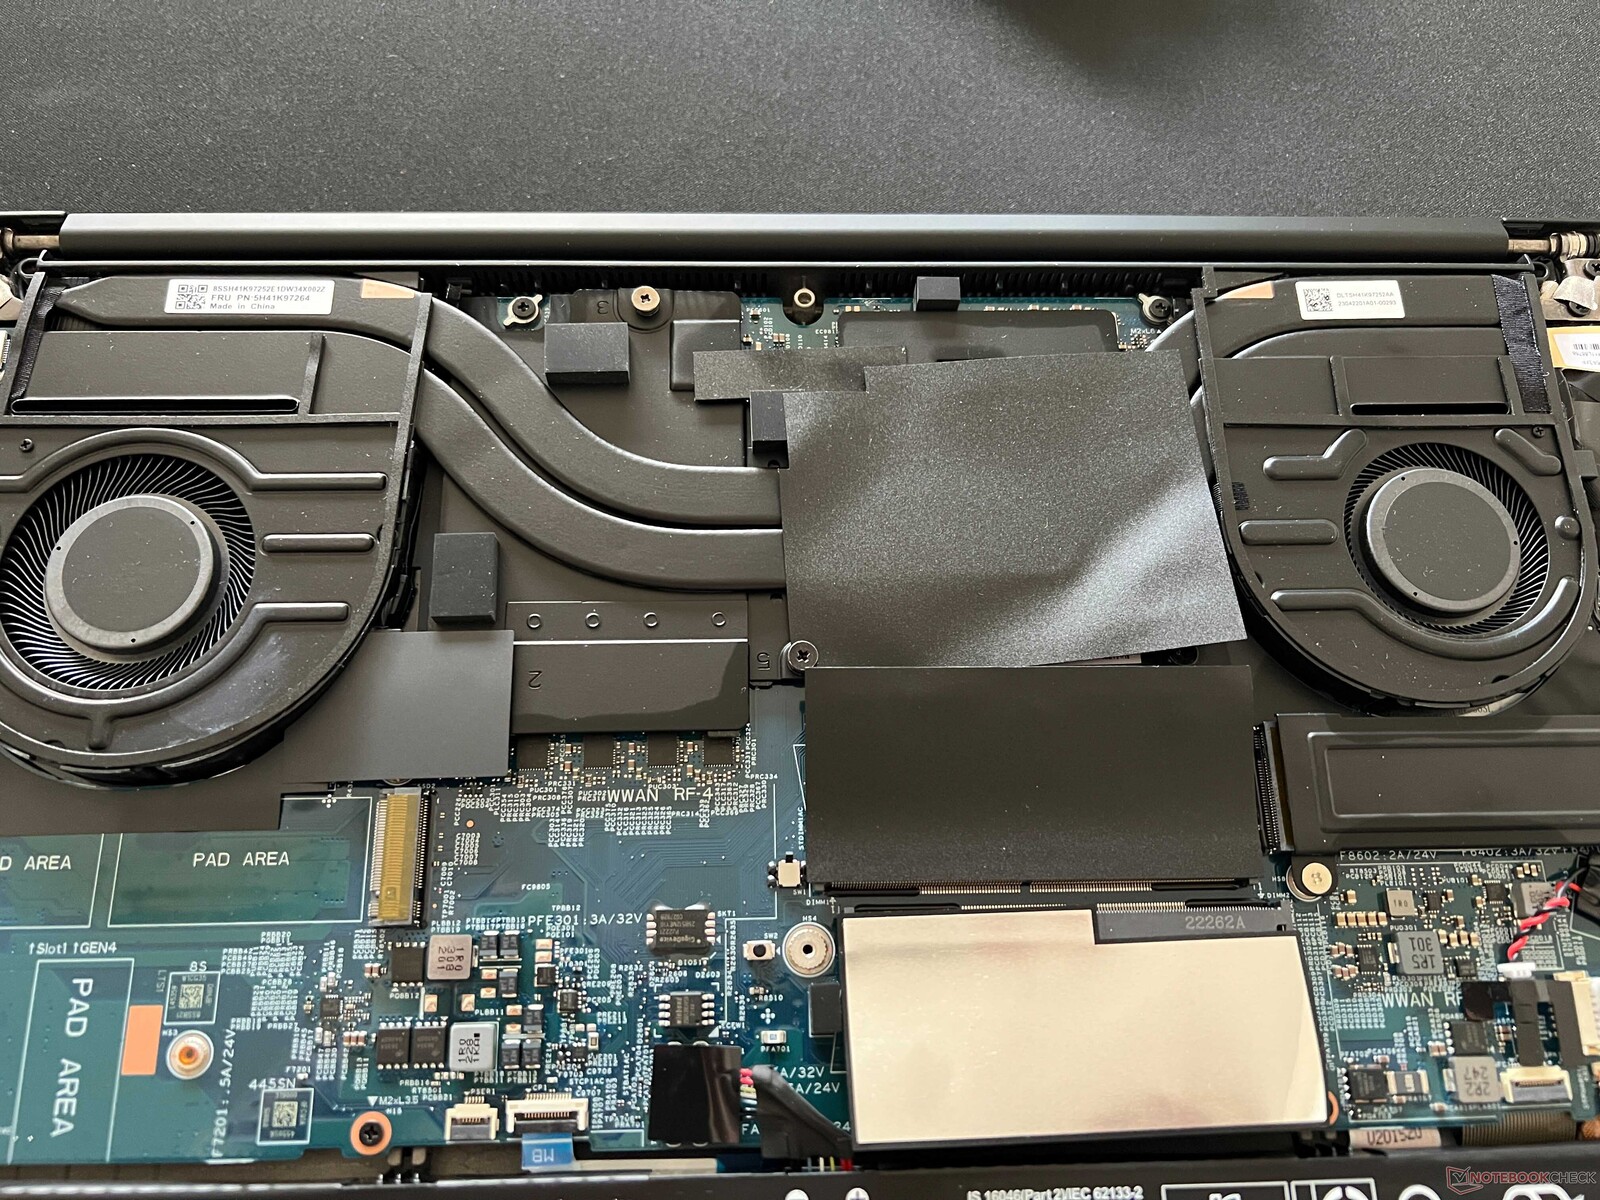
I flera år hade Lenovo två stora 16-tumsmodeller i sitt sortiment: Lenovo ThinkPad X1 Extreme och dess identiskt uppbyggda arbetsstation, ThinkPad P1. Nu har portföljen strömlinjeformats och den nya ThinkPad P1 Gen 6 tar över båda rollerna omedelbart. Det finns ingen efterföljare till förra årets ThinkPad X1 Extreme Gen 5 längre. Nya ThinkPad P1 Gen 6 finns tillgänglig med både GeForce GPU:er för konsumenter och grafikadaptrar för professionella användare, vilket ger mångsidiga valmöjligheter. Höljesdesignen är i stort sett oförändrad och det finns fortfarande två grundmodeller. Beroende på det valda grafikkortet används antingen konventionell kylning eller en ångkammare (för GeForce RTX 4060/RTX 3500 Ada).
Utbudet av komponenter i ThinkPad P1 Gen 6 är omfattande. Den använder alltid Intels senaste 45-Watt Raptor-Lake-processorer, och grafikkortsalternativen sträcker sig från RTX 1000 Ada till RTX 5000 Ada (eller GeForce RTX 4060, 4080, eller 4090). Denna stora variation resulterar i betydande prisskillnader. Basmodellen, utrustad med Core i7-13700H, 32 GB RAM och RTX 1000 Ada, börjar för närvarande på cirka 2850 USD. Priserna kan dock lätt överstiga 6 350 USD för avancerade konfigurationer med Core i9, RTX 5000 Ada, 96 GB RAM och OLED-skärm.
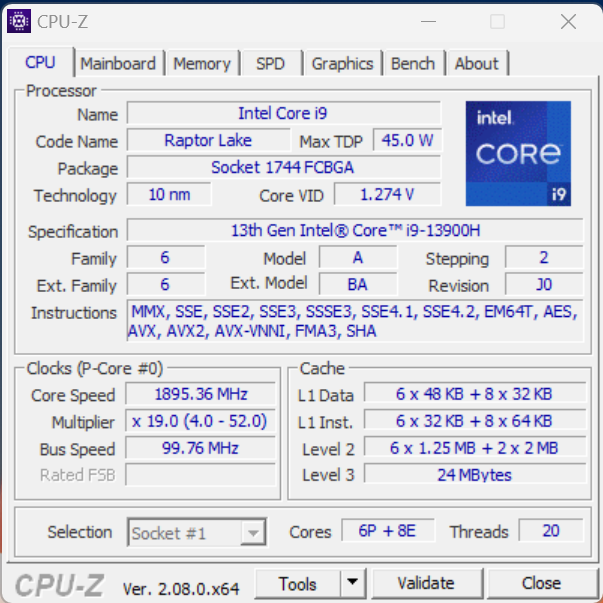
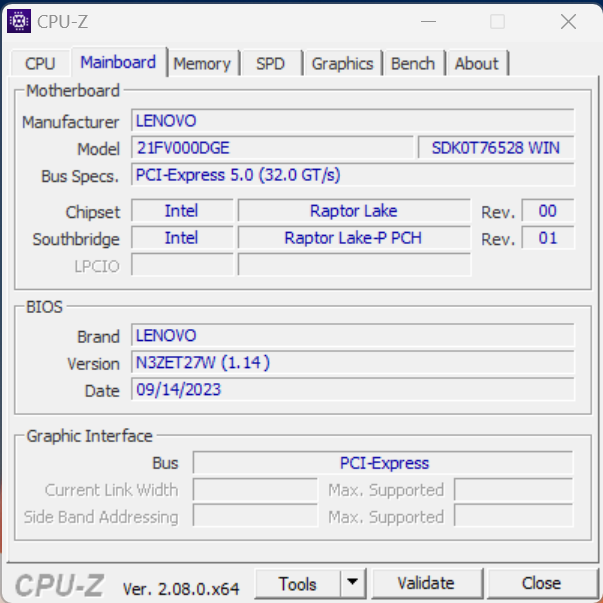
Vår testenhet, som har produktnumret 21FV000DGE, kostar för närvarande cirka 3 400 USD. Den är utrustad med Core i9-13900HrTX 2000 Ada, 32 GB RAM-minne och en 1 TB SSD. Dessutom ingår tillvalet WQHD IPS-panel med en uppdateringsfrekvens på 165 Hz. De som har tillgång till Lenovos Campus-program kan få den här modellen för cirka 3 000 USD.
Potentiella konkurrenter i jämförelse
Gradering | Datum | Modell | Vikt | Höjd | Storlek | Upplösning | Pris |
|---|---|---|---|---|---|---|---|
| 91.7 % v7 (old) | 10/2023 | Lenovo ThinkPad P1 G6-21FV000DGE i9-13900H, RTX 2000 Ada Generation Laptop | 1.9 kg | 17.5 mm | 16.00" | 2560x1600 | |
| 89 % v7 (old) | 08/2023 | Dell Precision 5000 5680 i9-13900H, RTX 5000 Ada Generation Laptop | 2.3 kg | 22.17 mm | 16.00" | 3840x2400 | |
| 88.8 % v7 (old) | 05/2023 | Samsung Galaxy Book3 Ultra 16, i9-13900H RTX 4070 i9-13900H, GeForce RTX 4070 Laptop GPU | 1.8 kg | 16.8 mm | 16.00" | 2880x1800 | |
| 90.1 % v7 (old) | 11/2022 | HP ZBook Studio 16 G9 62U04EA i7-12800H, RTX A2000 Laptop GPU | 1.8 kg | 19 mm | 16.00" | 3840x2400 | |
| 84.3 % v7 (old) | 11/2022 | MSI CreatorPro Z16P B12UKST i7-12700H, RTX A3000 Laptop GPU | 2.4 kg | 19 mm | 16.00" | 2560x1600 | |
| 88.6 % v7 (old) | 07/2023 | Schenker VISION 16 Pro (M23) i7-13700H, GeForce RTX 4070 Laptop GPU | 1.6 kg | 17.1 mm | 16.00" | 2560x1600 |
Case - Stabilitet tack vare kolfiber och magnesium
Lenovo behåller den välkända designen för ThinkPad P1 Gen 6, i linje med föregångarna G4- och G5-generationerna. Den svarta designen kan uppfattas som antingen enkel eller ospännande, beroende på individuella perspektiv. ThinkPads distinkta identitet förblir dock omisskännlig. Modeller med OLED-skärm fortsätter att ha ett skärmlock med kolfibermönster, även om det är en tryckt design snarare än faktisk kolfiber. Överlag har designen ett modernt utseende, men de släta ytorna är känsliga för smuts och fett med tiden, vilket kräver regelbunden rengöring.
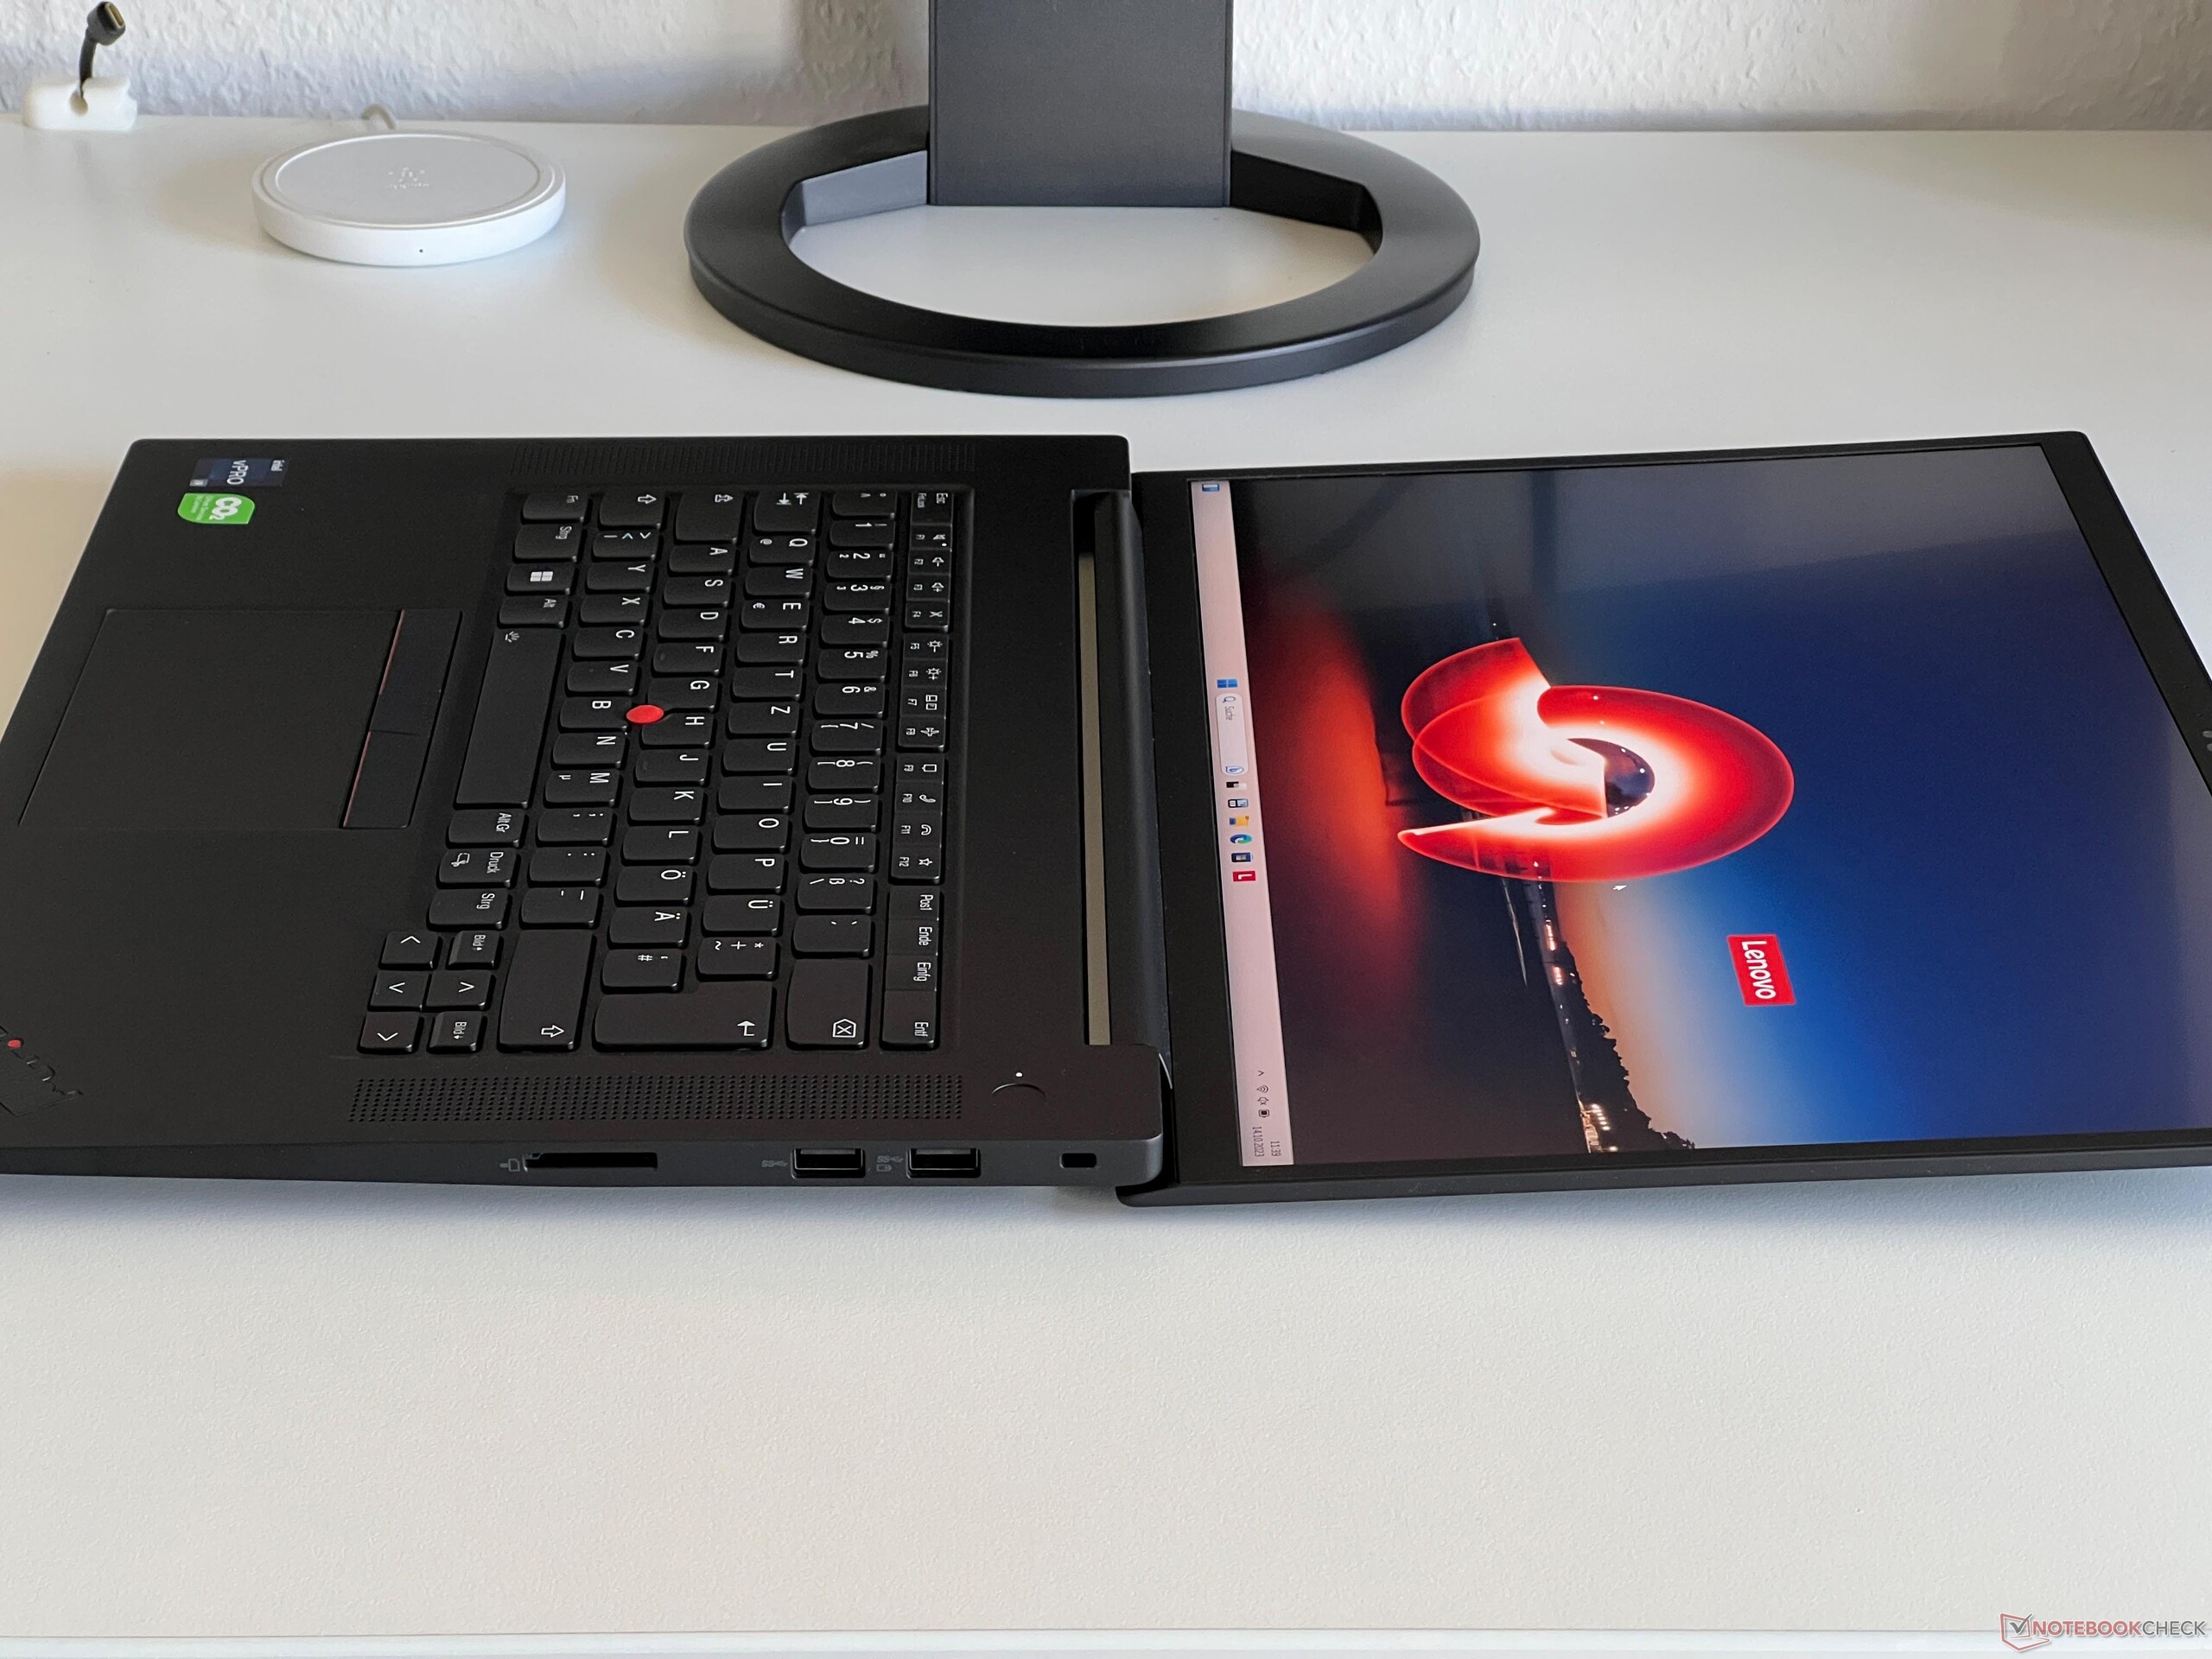
Konstruktionen kombinerar kolfiber och magnesium, vilket garanterar en exceptionell stabilitet. Både basenheten och displaylocket är robusta, utan några märkbara vridningar eller tryckpunkter. Det finns inga problem med bildförvrängningar eller knarrande ljud. De två gångjärnen (maximal öppningsvinkel 180 grader) gör att locket kan öppnas med en hand samtidigt som tillräcklig spänning bibehålls för att förhindra märkbar studsning.
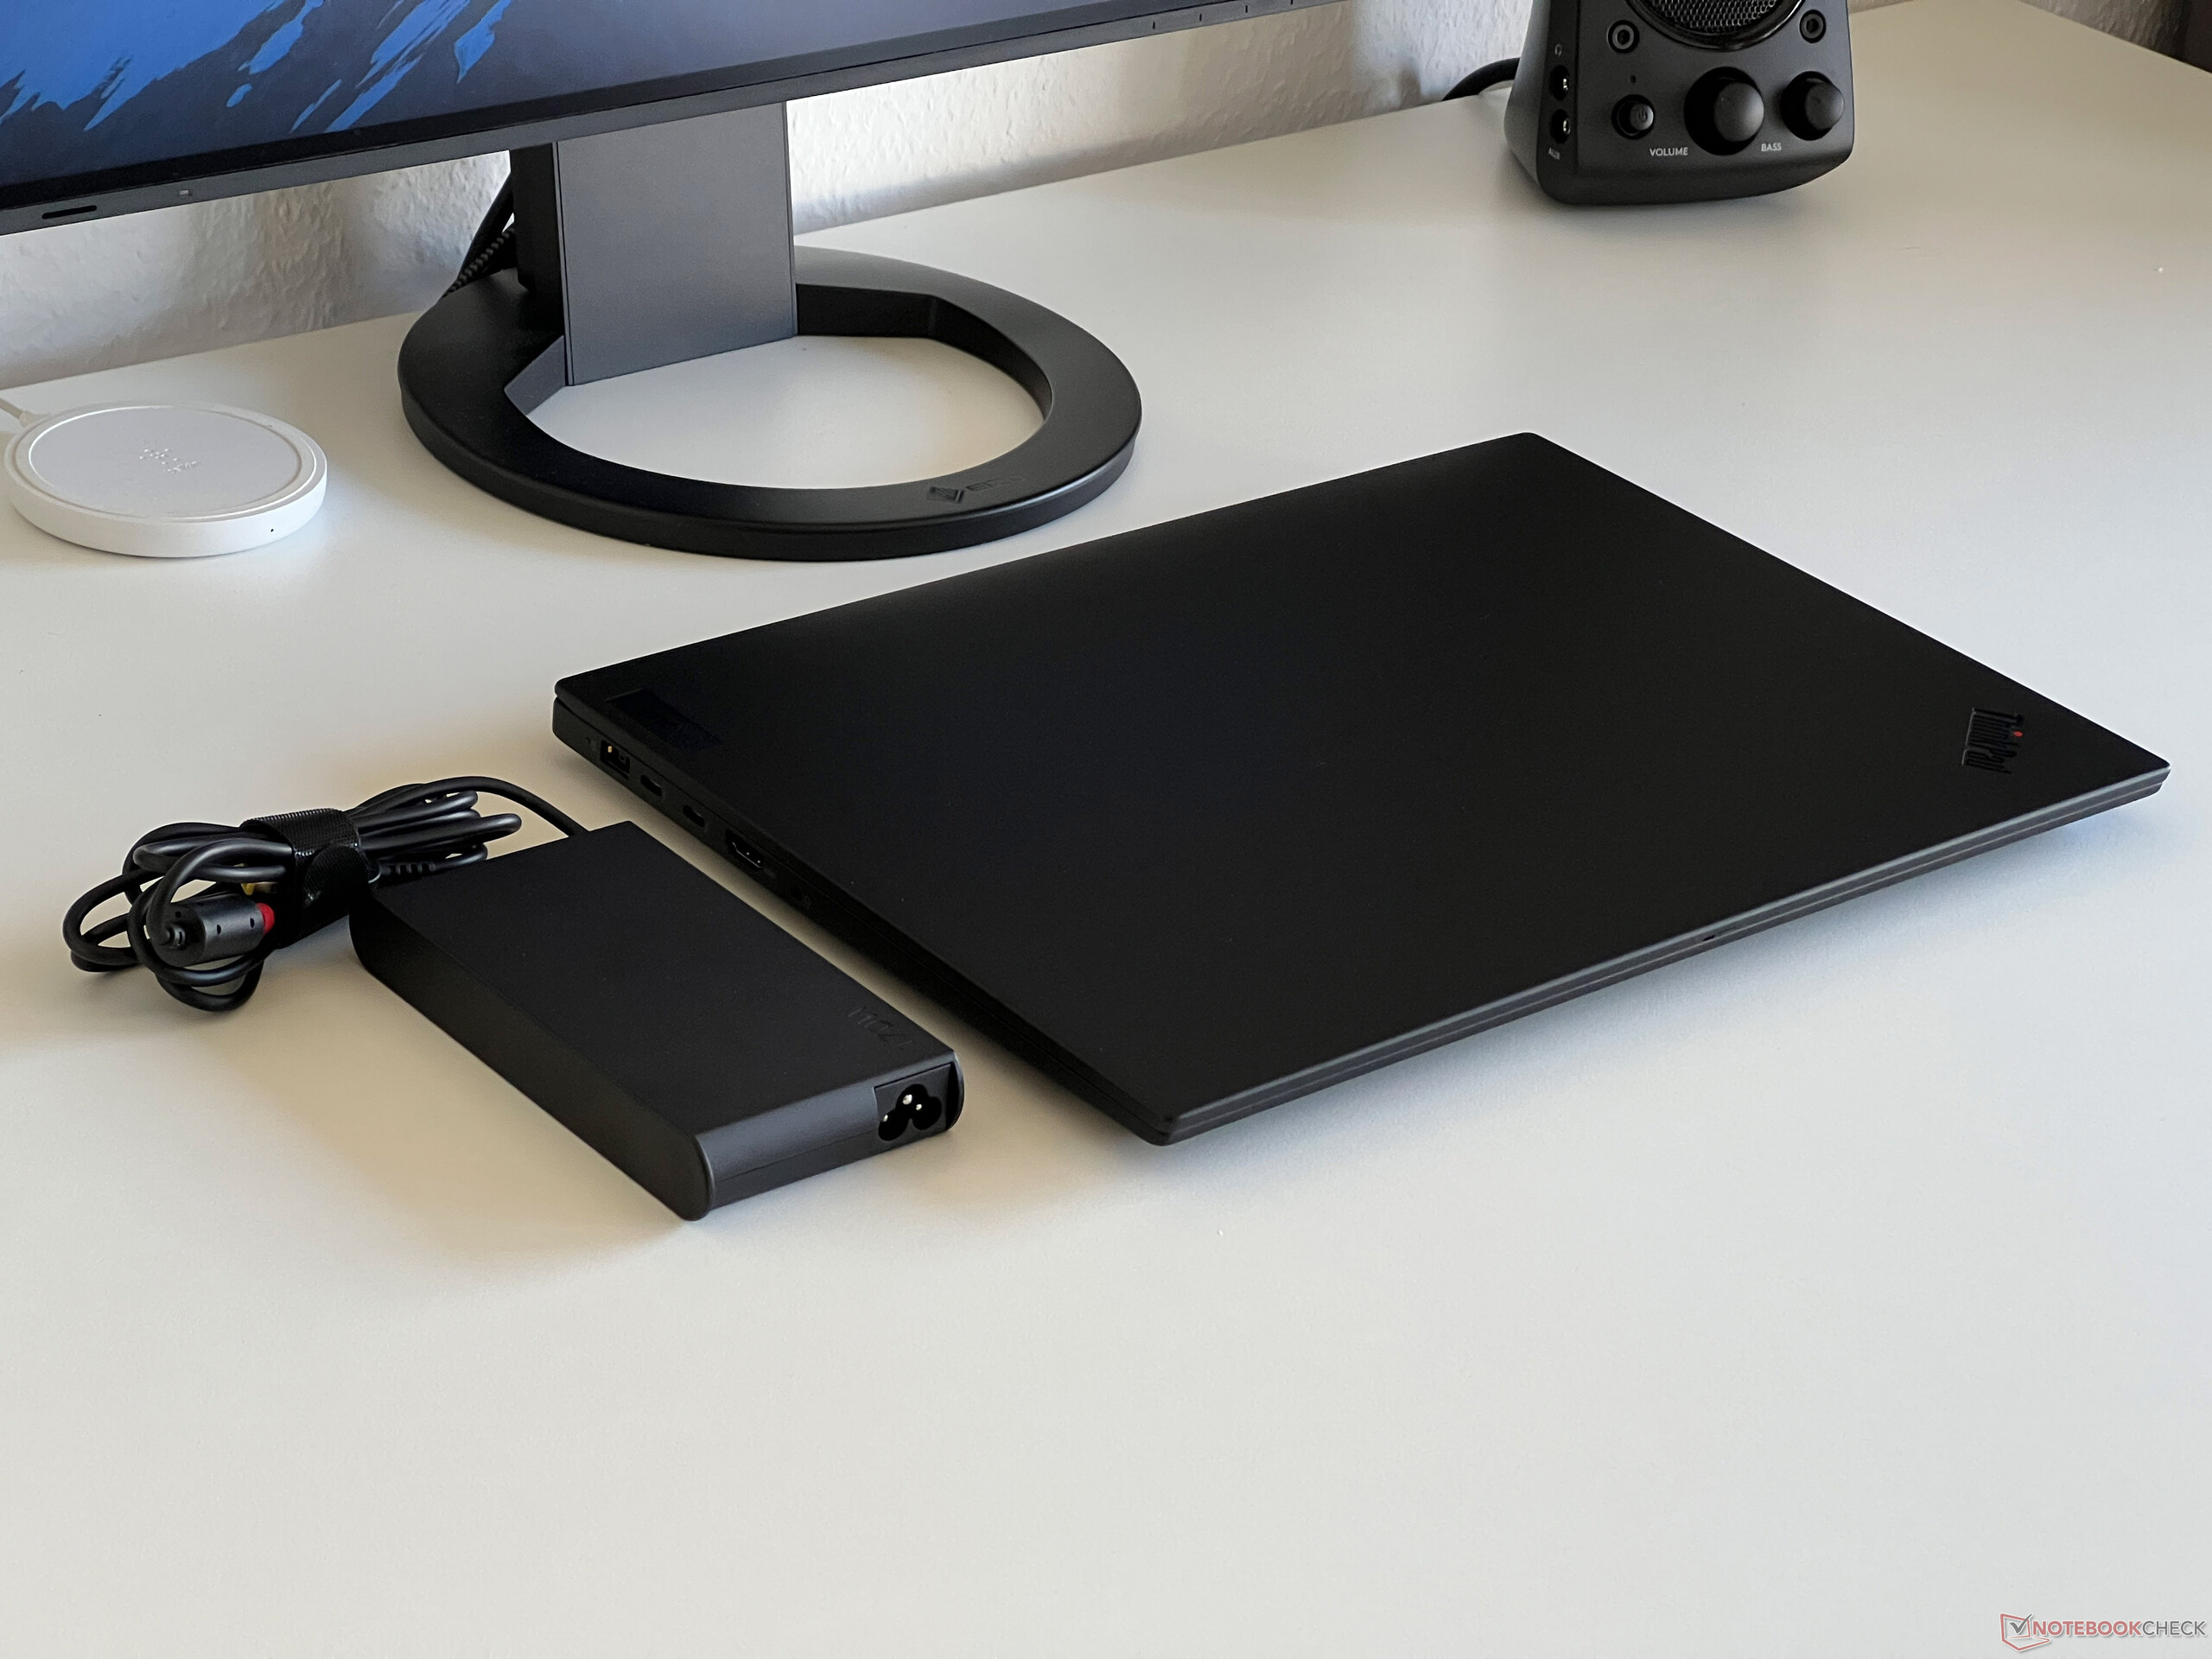
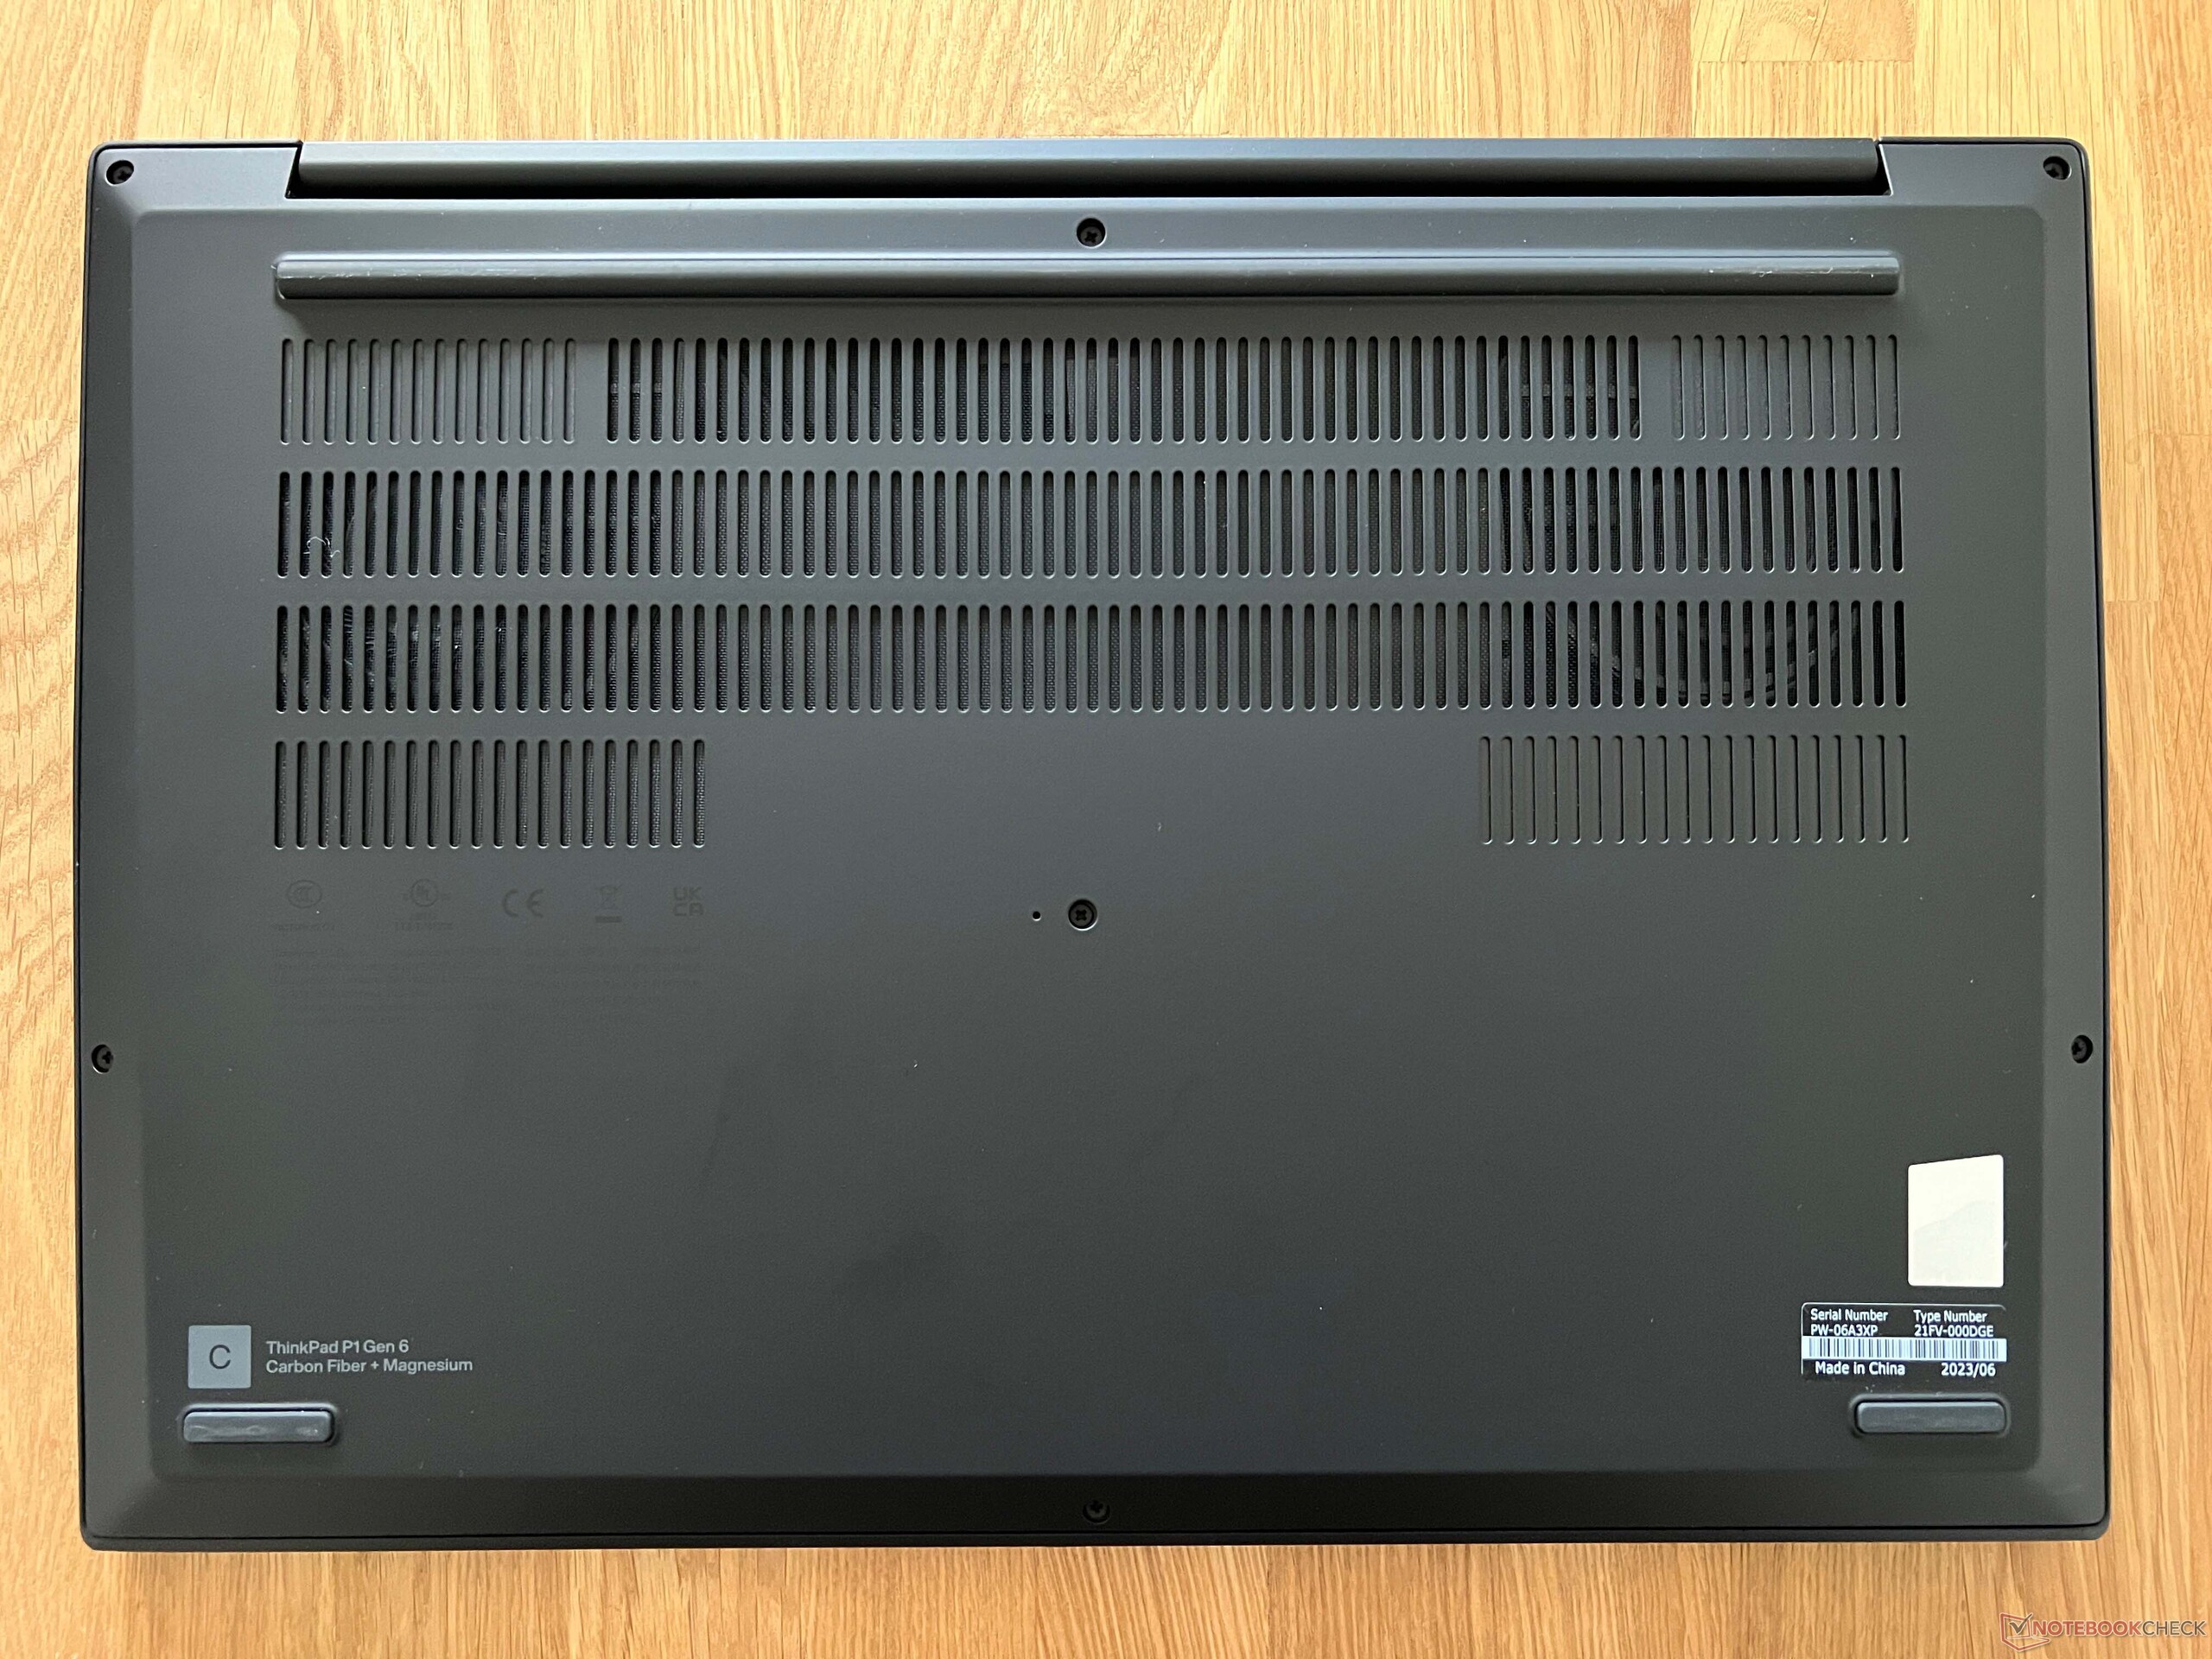
De jämförbara prylarna har ett liknande fotavtryck, men de är betydligt tyngre. ThinkPad P1 Gen 6 är en av de lättaste varianterna med en vikt på strax under 4,19 lbs och överträffas endast av Schenker Vision 16. Strömförsörjningen på 170 watt lägger till ytterligare 1,23 kg till den totala vikten.
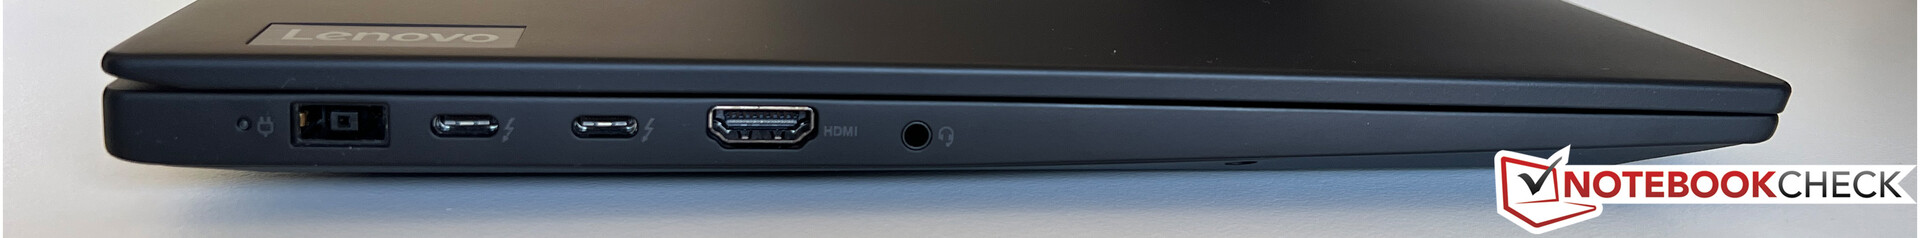
Anslutningsmöjligheter - Thunderbolt och Wi-Fi 6E
Portarna har inte ändrats och alla viktiga standarder är fortfarande tillgängliga. Dessutom kan de två USB-C-portarna med Thunderbolt 4 användas för laddning och leverera en effekt på minst 90 watt.
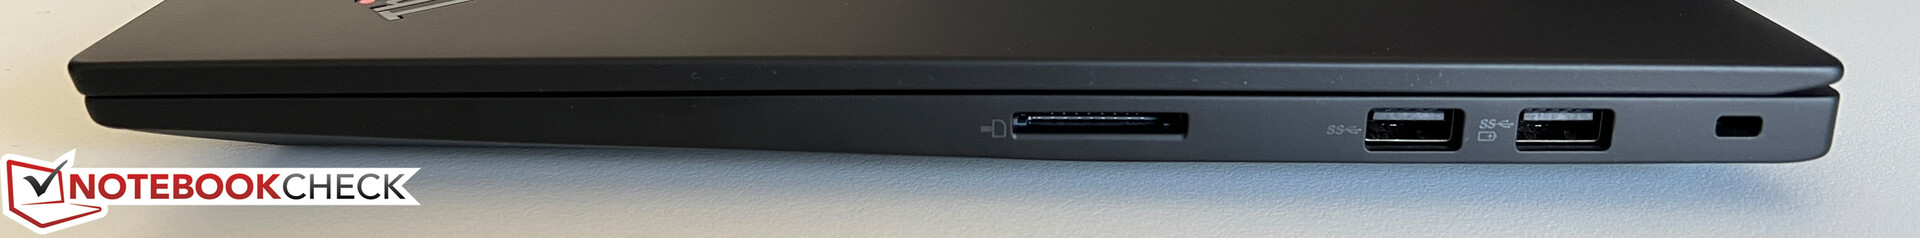
SD-kortläsare
Den rätta kortläsaren ger bara genomsnittliga överföringshastigheter. Överföringshastigheterna är ungefär 80 MB/s när de kombineras med vårt referenskort (Angelbird AV Pro V60).
Kommunikation
Inga förändringar när det gäller WLAN-modulen; Intel AX211-kortet används fortfarande och stöder moderna 6 GHz-nätverk. Överföringshastigheterna är utmärkta, och under våra tester stötte vi inte på några anslutningsproblem. Även om det inte finns någon Ethernet-port kan den läggas till via en kompatibel USB-C-adapter. Inuti höljet finns en M.2-2242-kortplats för en WWAN-modul, men de nödvändiga antennerna är inte förinstallerade, vilket förhindrar eftermontering för WWAN-anslutning.
| Networking | |
| Lenovo ThinkPad P1 G6-21FV000DGE | |
| iperf3 transmit AXE11000 | |
| iperf3 receive AXE11000 | |
| Dell Precision 5000 5680 | |
| iperf3 transmit AXE11000 | |
| iperf3 receive AXE11000 | |
| iperf3 transmit AXE11000 6GHz | |
| iperf3 receive AXE11000 6GHz | |
| Samsung Galaxy Book3 Ultra 16, i9-13900H RTX 4070 | |
| iperf3 transmit AXE11000 | |
| iperf3 receive AXE11000 | |
| iperf3 transmit AXE11000 6GHz | |
| iperf3 receive AXE11000 6GHz | |
| HP ZBook Studio 16 G9 62U04EA | |
| iperf3 transmit AXE11000 6GHz | |
| iperf3 receive AXE11000 6GHz | |
| MSI CreatorPro Z16P B12UKST | |
| iperf3 transmit AXE11000 6GHz | |
| iperf3 receive AXE11000 6GHz | |
| Schenker VISION 16 Pro (M23) | |
| iperf3 transmit AXE11000 | |
| iperf3 receive AXE11000 | |
| Lenovo ThinkPad X1 Extreme G5-21DE003RGE | |
| iperf3 transmit AXE11000 6GHz | |
| iperf3 receive AXE11000 6GHz | |
Webbkamera
1080p-kameran tar anständiga bilder i bra ljusförhållanden och det finns en mekanisk slutare. Dessutom finns en IR-kamera tillgänglig för ansiktsigenkänning via Windows Hello.


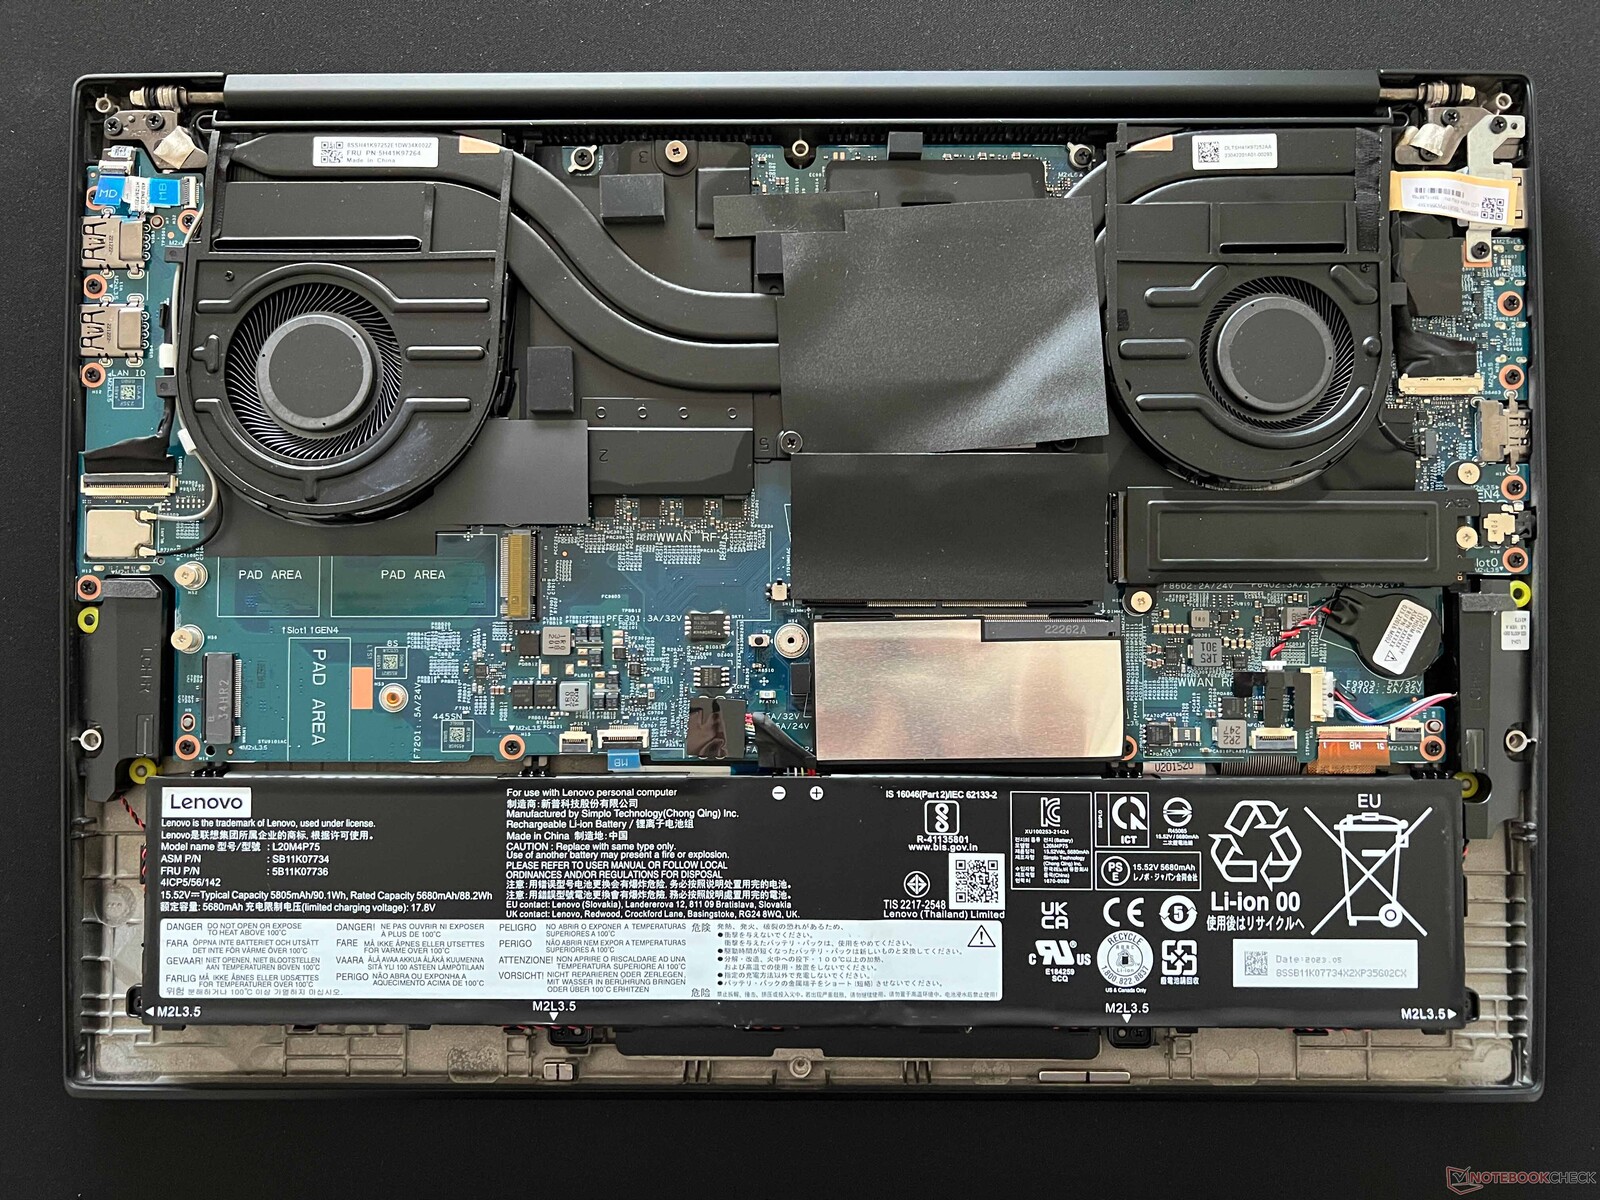
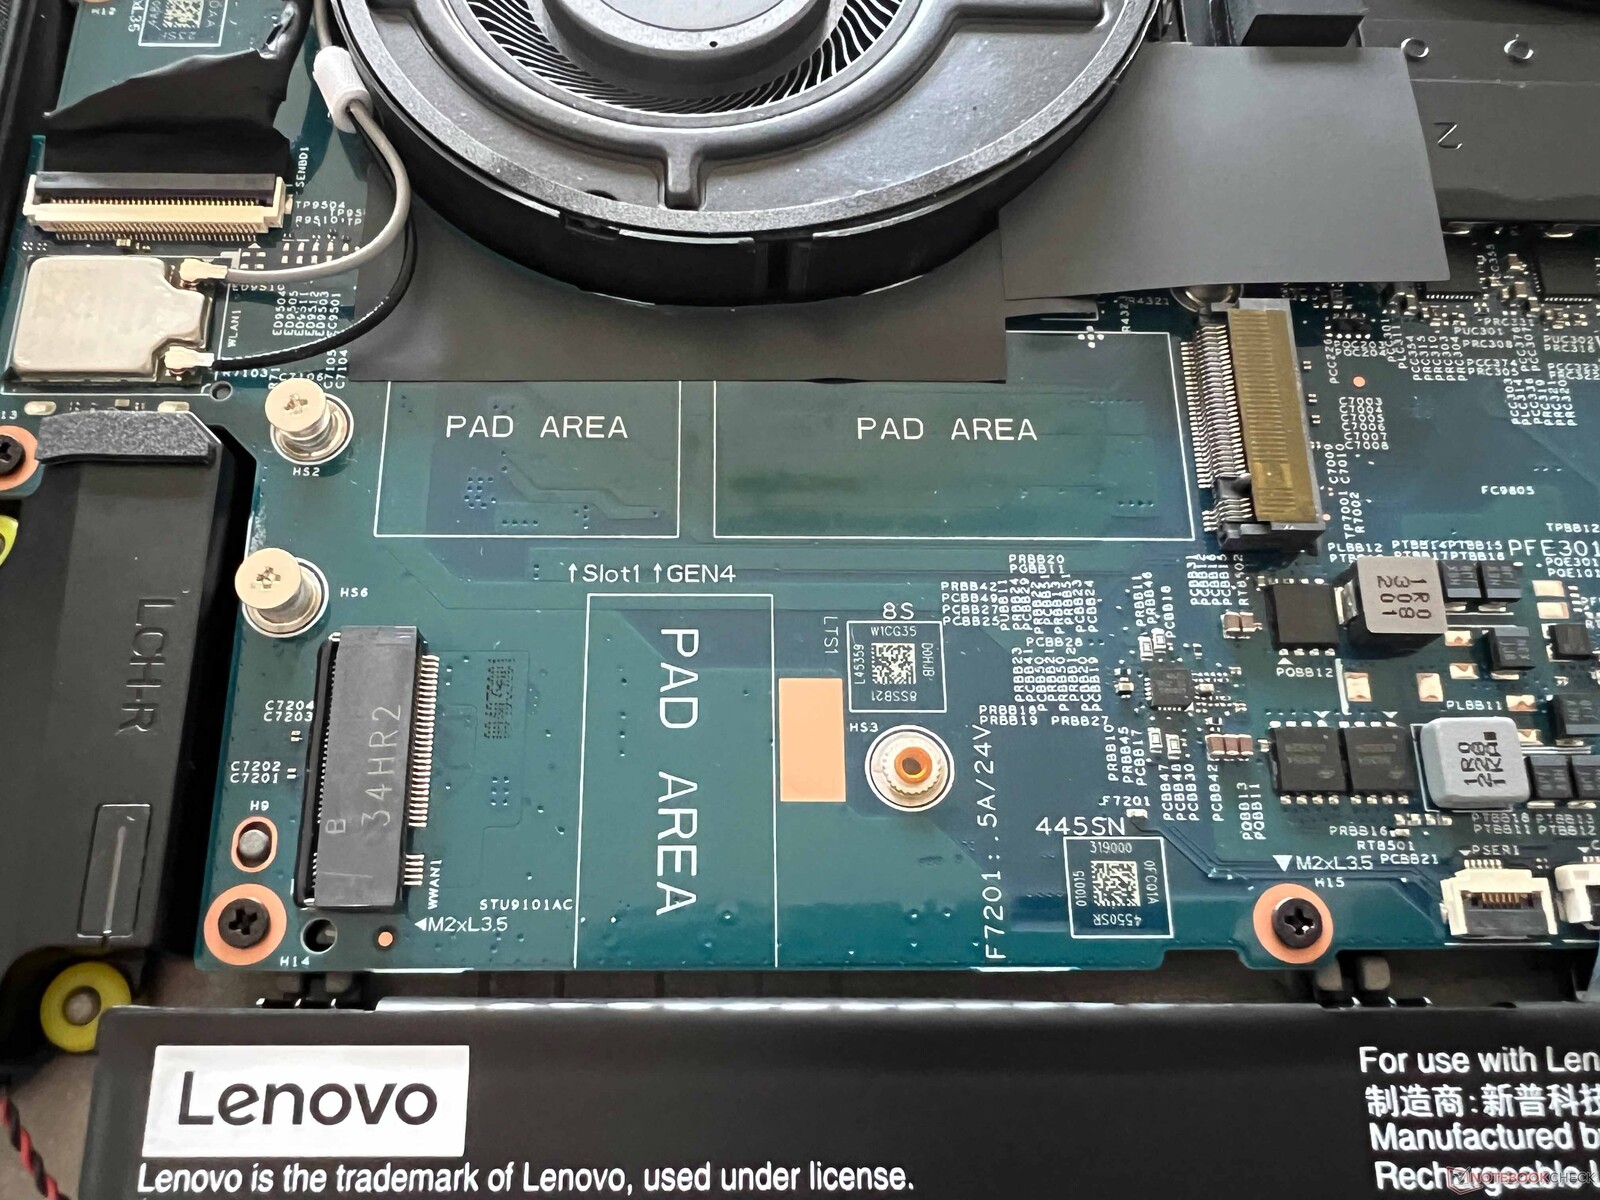
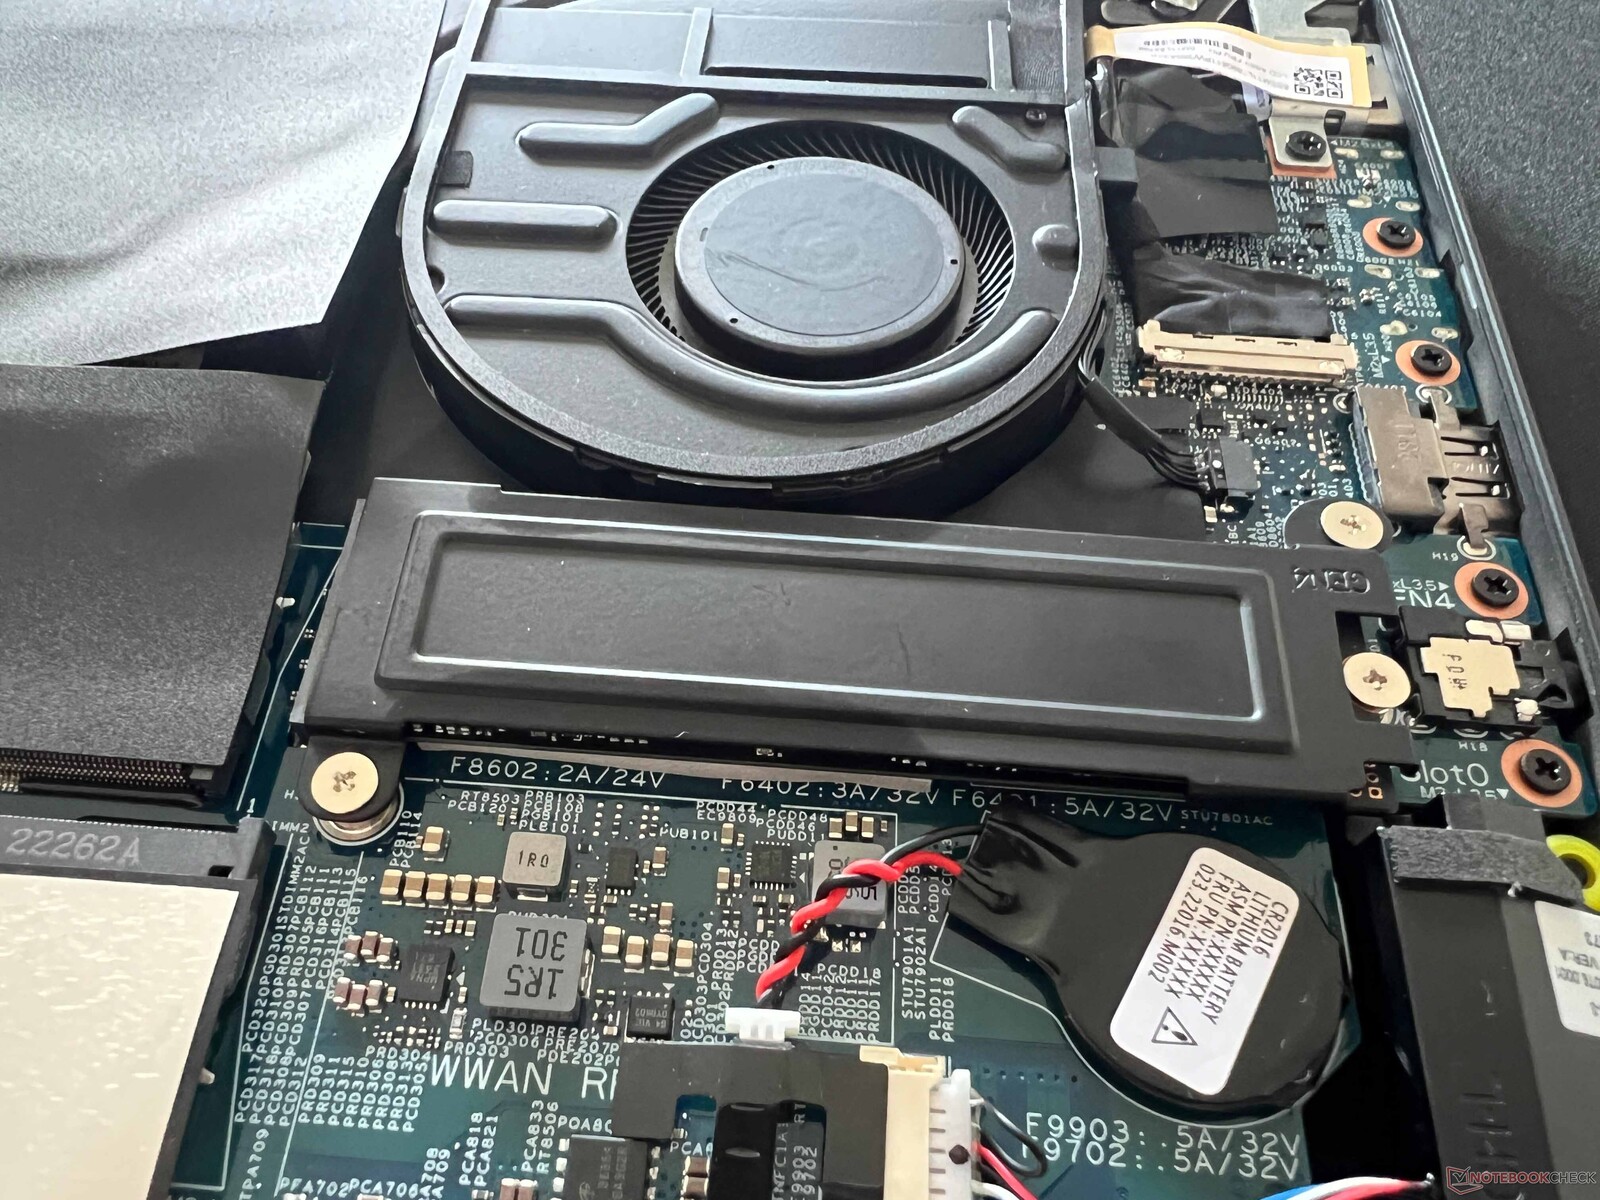
Underhåll
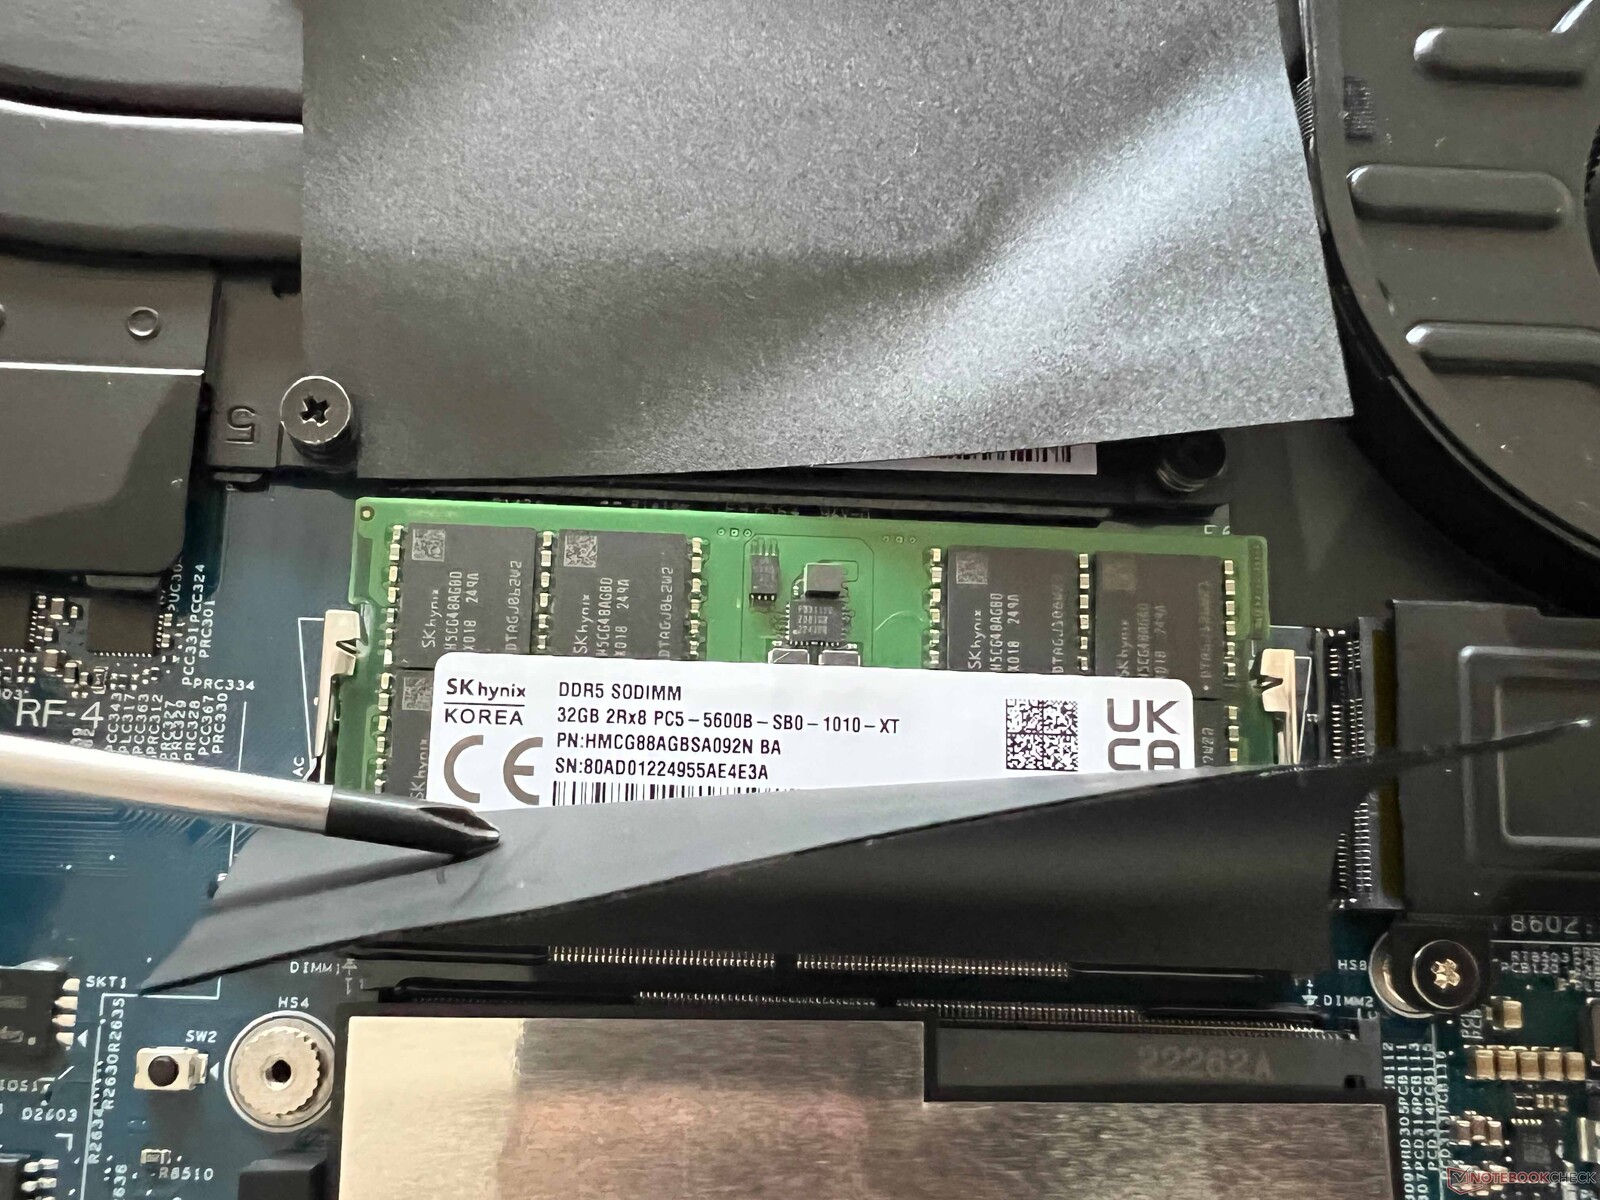
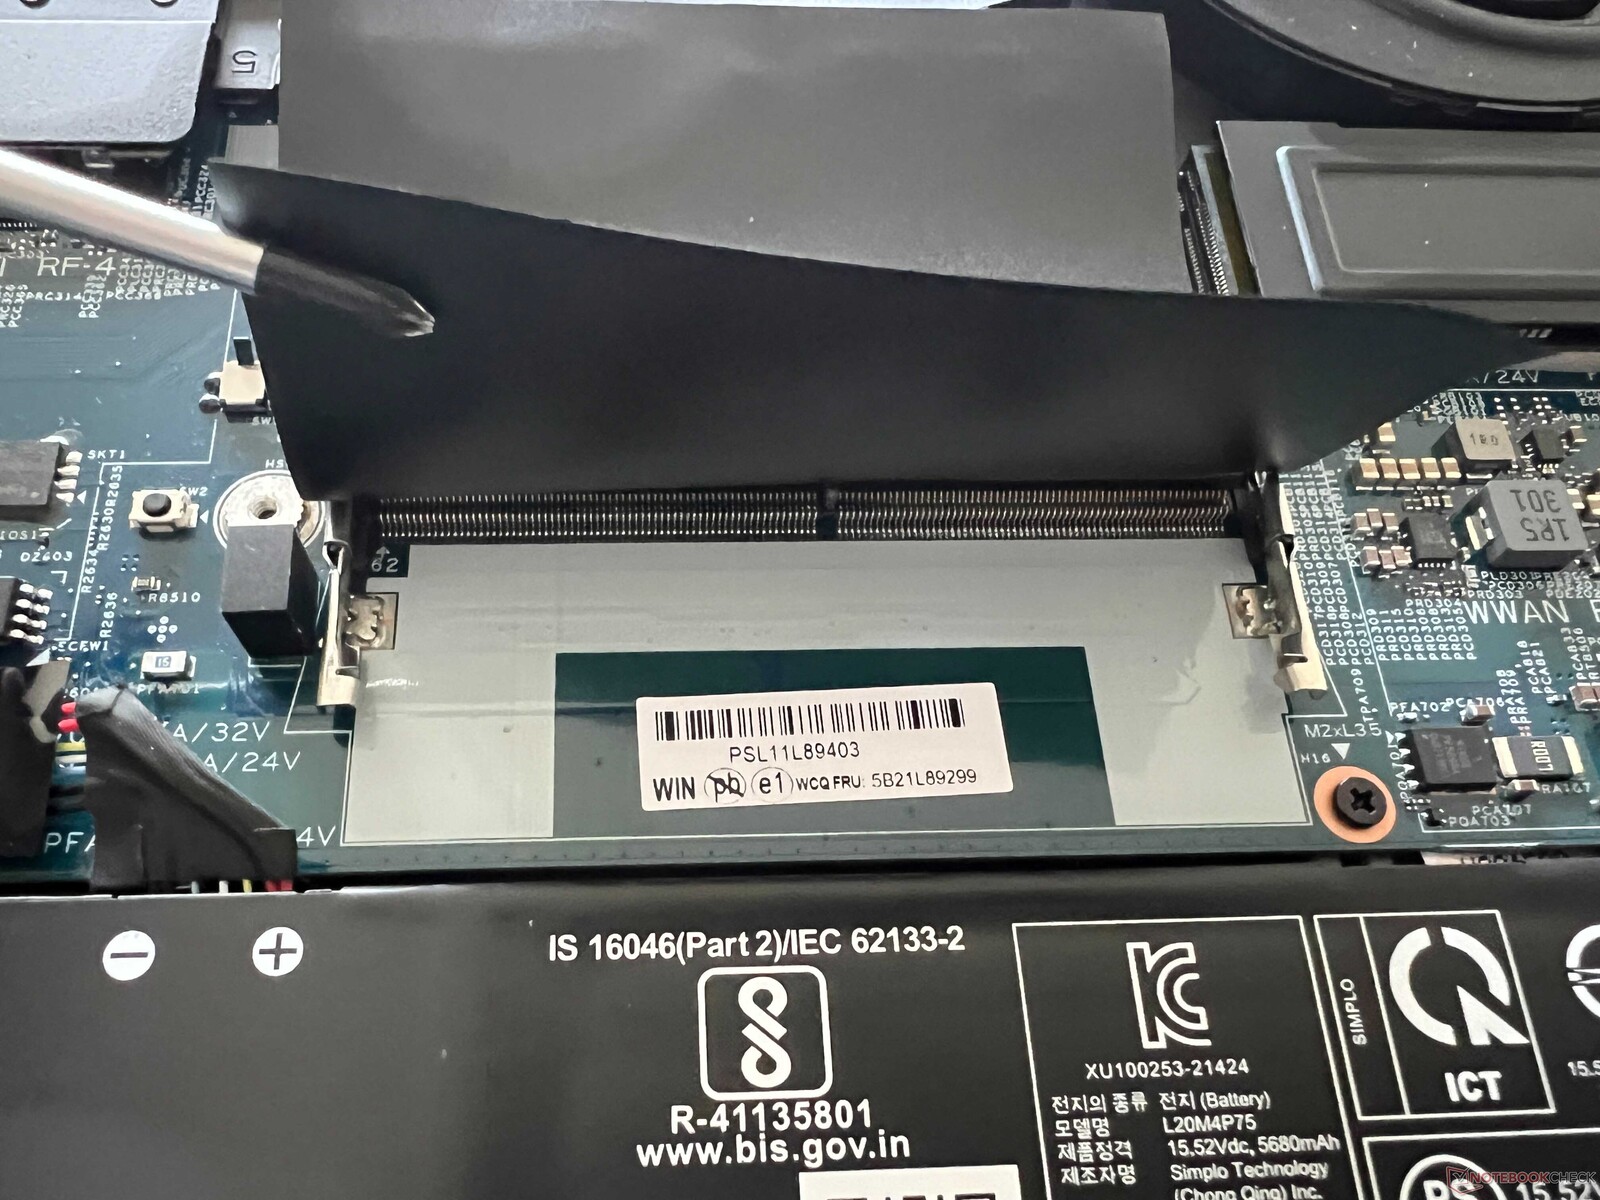
Det nedre höljet kan enkelt tas bort. Vår testenhet har konventionell kylning med kylflänsar, vilket möjliggör två platser för M.2-2280 SSD-enheter. Dessutom finns det två SODIMM-kortplatser för RAM-moduler, men WLAN-modulen kan inte bytas ut.
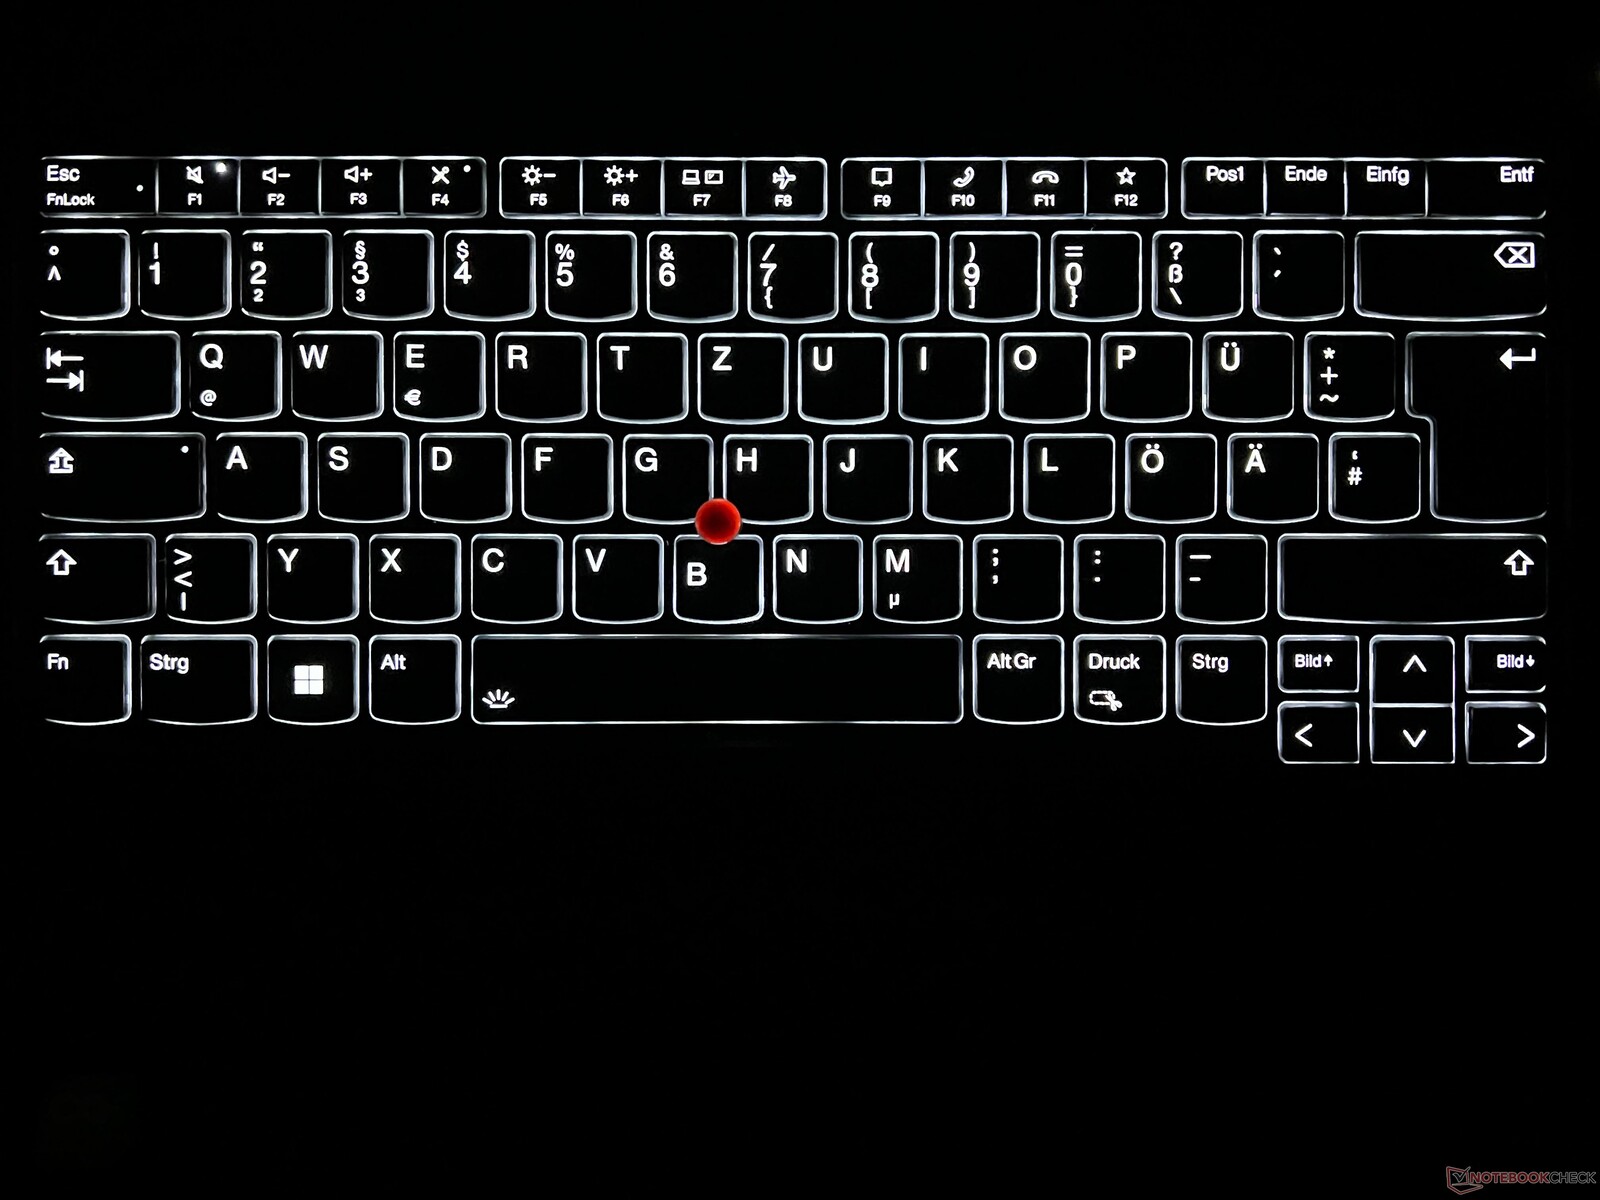
Inmatningsenheter - 1,5 mm slaglängd
Lenovo har använt ett tangentbord med 0,06-tums slaglängd för ThinkPad P1 under de senaste två åren, oförändrat i den nuvarande modellen. Medan tangentbordet ger en bekväm skrivupplevelse, vilket möjliggör utökade texter utan problem, matchar det inte längre kvaliteten på tidigare modeller. I detta avseende finns det inga betydande fördelar jämfört med konkurrenterna. Den vita bakgrundsbelysningen i två steg visar sig vara fördelaktig under svaga ljusförhållanden, även om den saknar automatisk aktivering via en sensor.
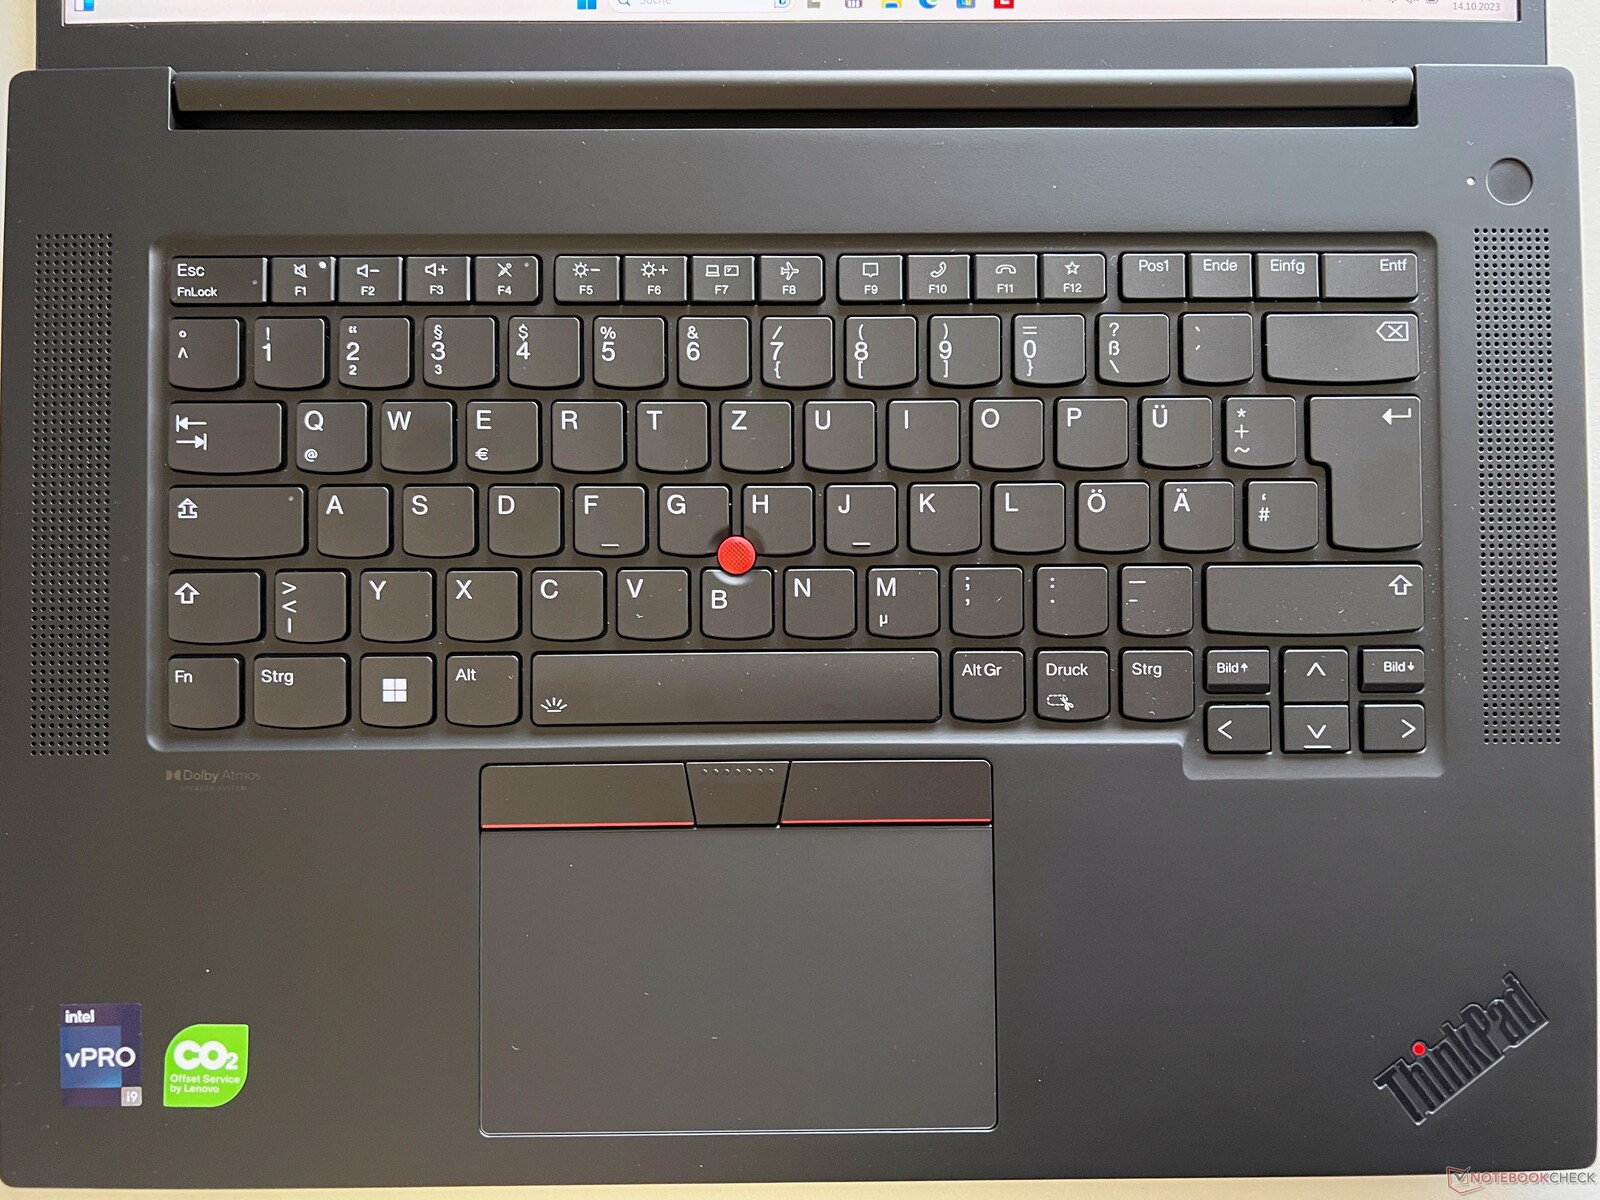
ClickPad har utmärkta glidegenskaper och en högkvalitativ mekanism som ger tysta och mjuka klickljud. För musstyrning finns dessutom TrackPoint och dedikerade knappar tillgängliga. De platta tangenterna ger en bra och tyst skrivupplevelse och fungerar utan problem, även om tangenterna på vår testenhet verkar något skramlande.
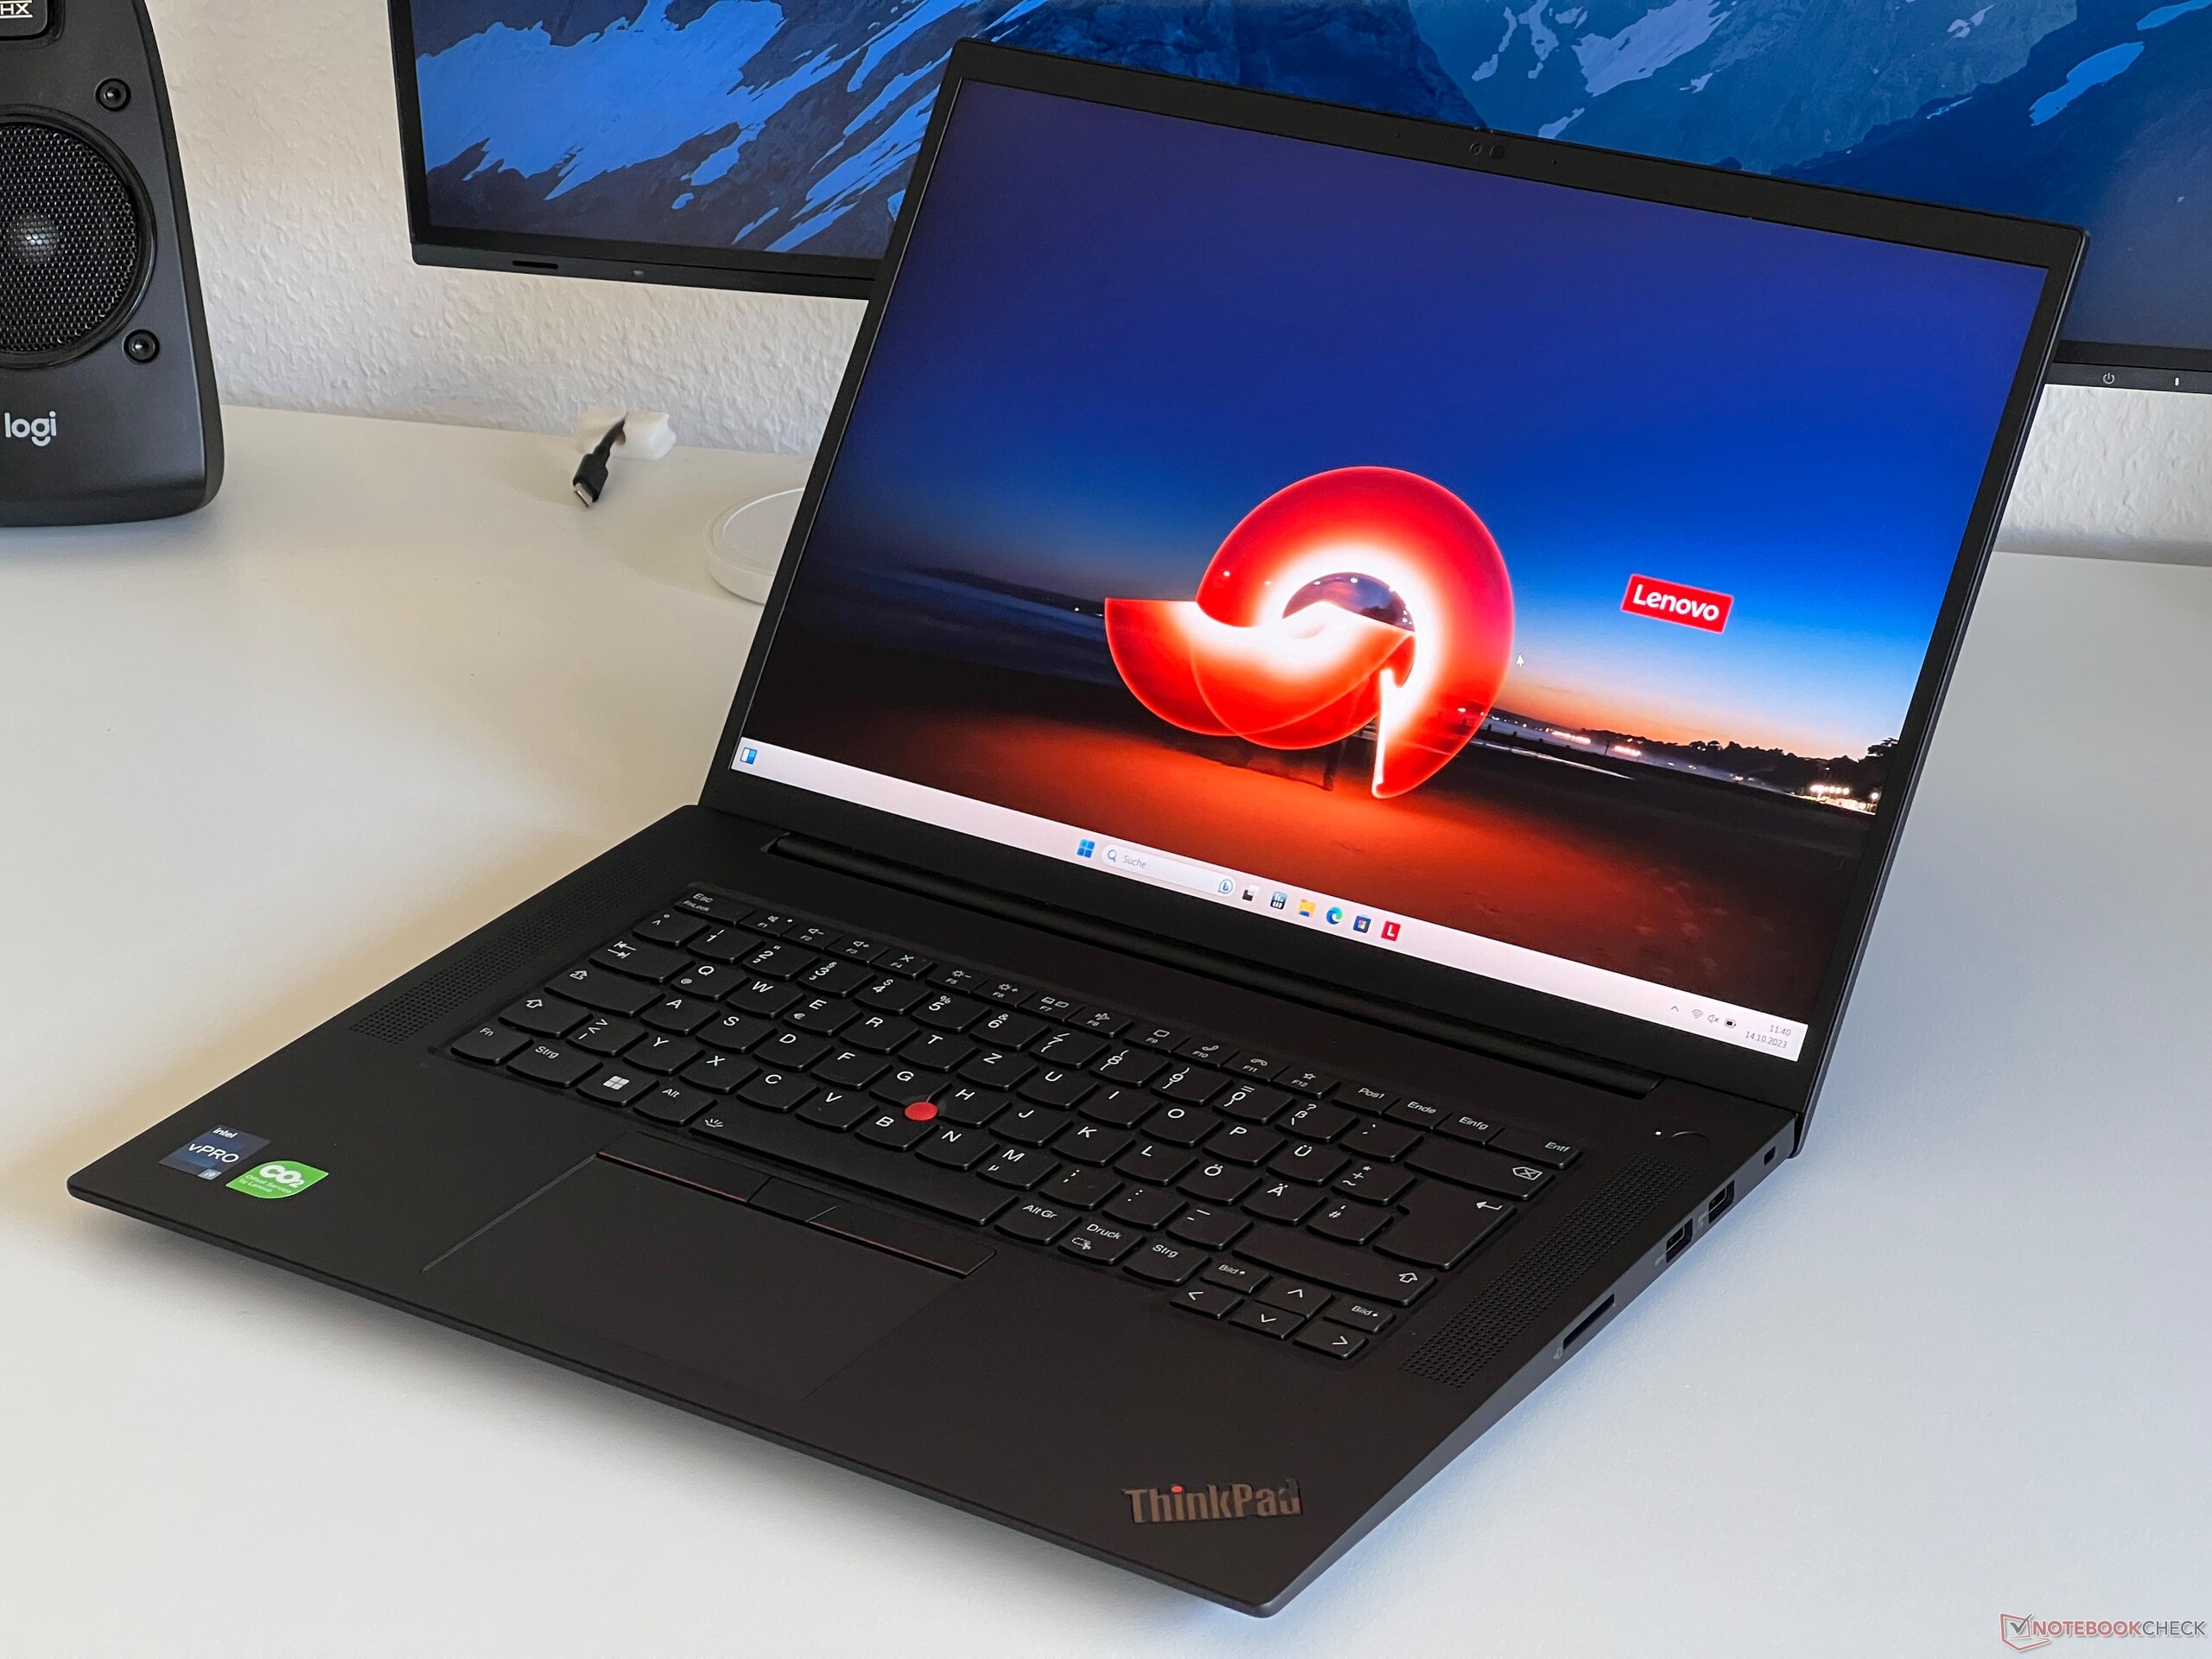
Display - Matt IPS-panel med 165 Hz och 500 cd/m²

Lenovo introducerade den valfria 165 Hz-skärmen med WQHD-upplösning i förra årets G5-generation, men det är först nu som vi kan testa den. Standardkonfigurationen inkluderar en matt Full HD-panel med 300 cd/m² ljusstyrka. Dessutom finns det ett alternativ för en 4K OLED-skärm med full P3-täckning. Det är värt att notera att 4K IPS-modellen med AdobeRGB-täckning, som vi testade i förra årets ThinkPad X1 Extreme, inte är tillgänglig i den här versionen.
Den valfria IPS-skärmen i vår testenhet utmärker sig genom sin utmärkta subjektiva bildkvalitet. Färgerna är livfulla och rörelserna är otroligt mjuka tack vare den höga uppdateringsfrekvensen, vilket gör allt innehåll exceptionellt skarpt. Även i ljusa områden finns det ingen kornighet, och skärmen uppvisar inga problem med PWM-flimmer. Dessutom är responstiderna imponerande snabba och det finns inga märkbara spökeffekter. Vid hög ljusstyrka kan man se en liten halo på en mörk bakgrund, men detta är inte ett betydande problem vid praktisk användning.
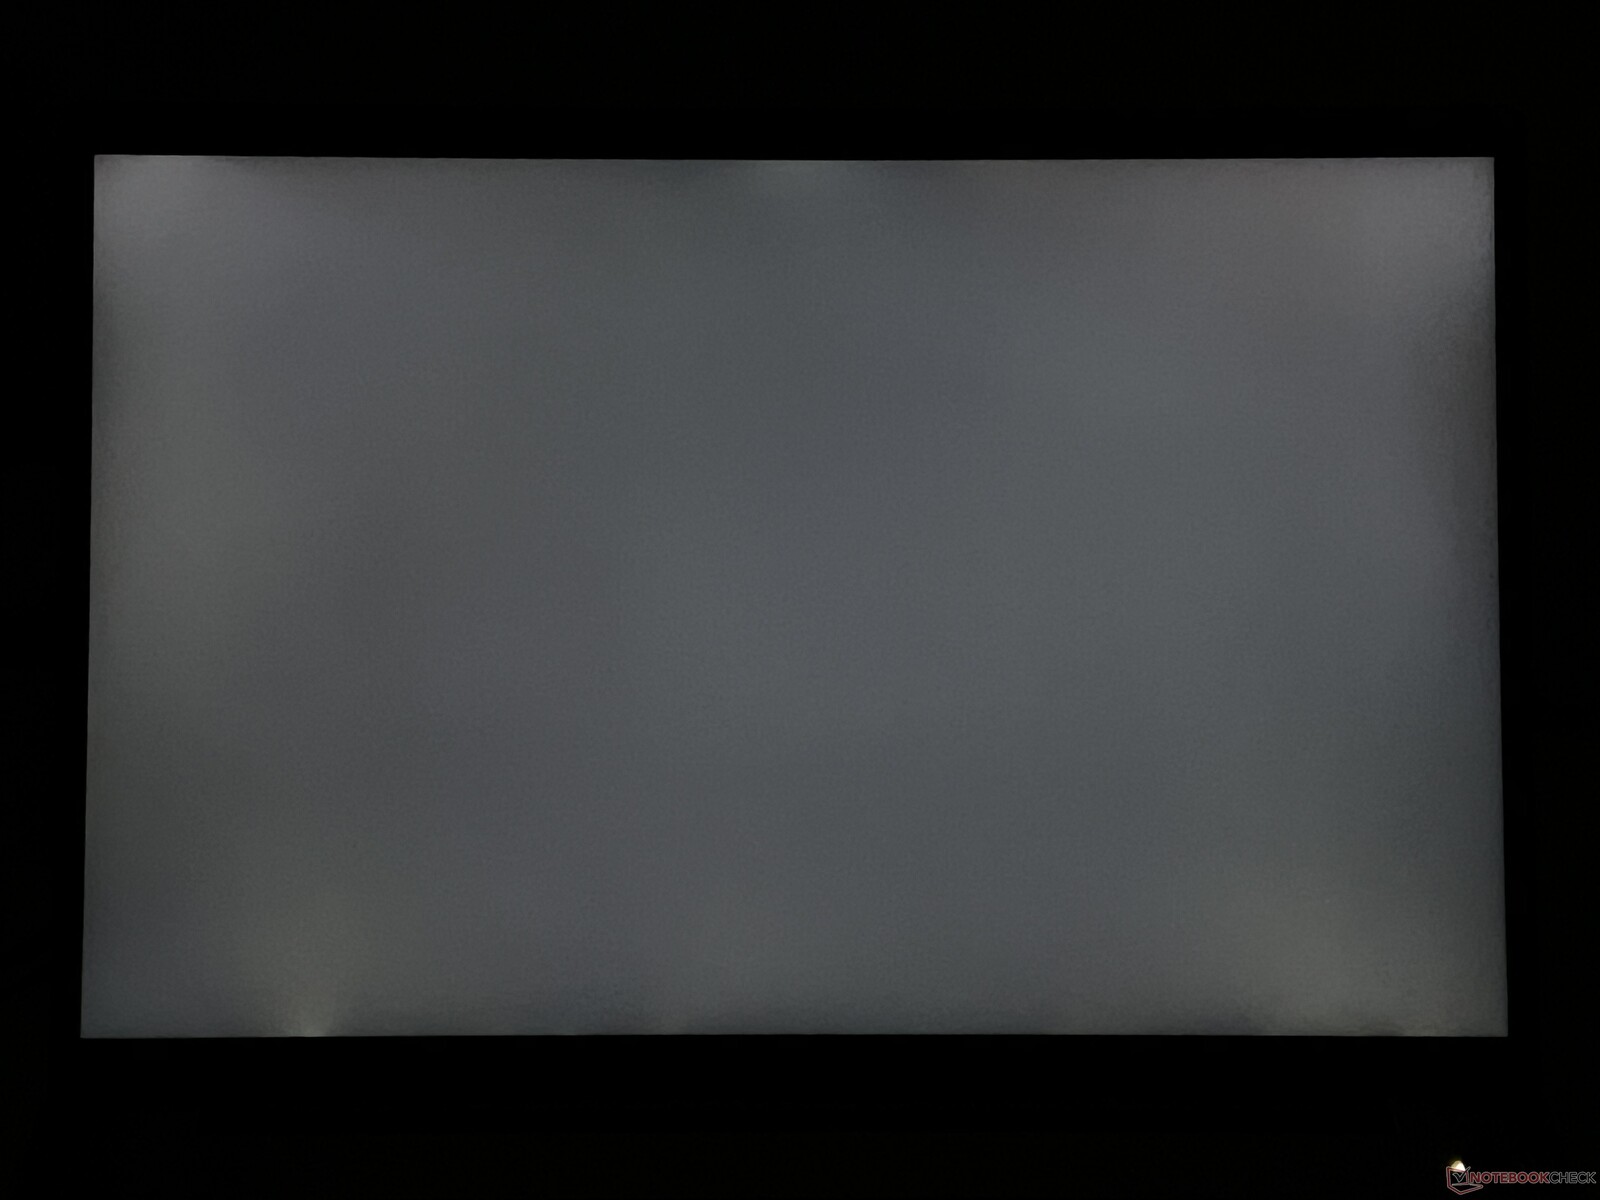
Lenovo hävdar en ljusstyrka på 500 cd/m², en siffra som vi kan bekräfta, åtminstone i mitten av skärmen. Den genomsnittliga ljusstyrkan för vårt testexemplar mäter strax under 485 cd/m², vilket är en avsevärd förbättring jämfört med standardpanelen. Svartvärdet (0,36 cd/m²) påverkas något av den höga ljusstyrkan. Trots detta överstiger det maximala kontrastförhållandet fortfarande 1400:1.
| |||||||||||||||||||||||||
Distribution av ljusstyrkan: 89 %
Mitt på batteriet: 520 cd/m²
Kontrast: 1447:1 (Svärta: 0.36 cd/m²)
ΔE ColorChecker Calman: 1.2 | ∀{0.5-29.43 Ø4.71}
calibrated: 1
ΔE Greyscale Calman: 1.4 | ∀{0.09-98 Ø4.96}
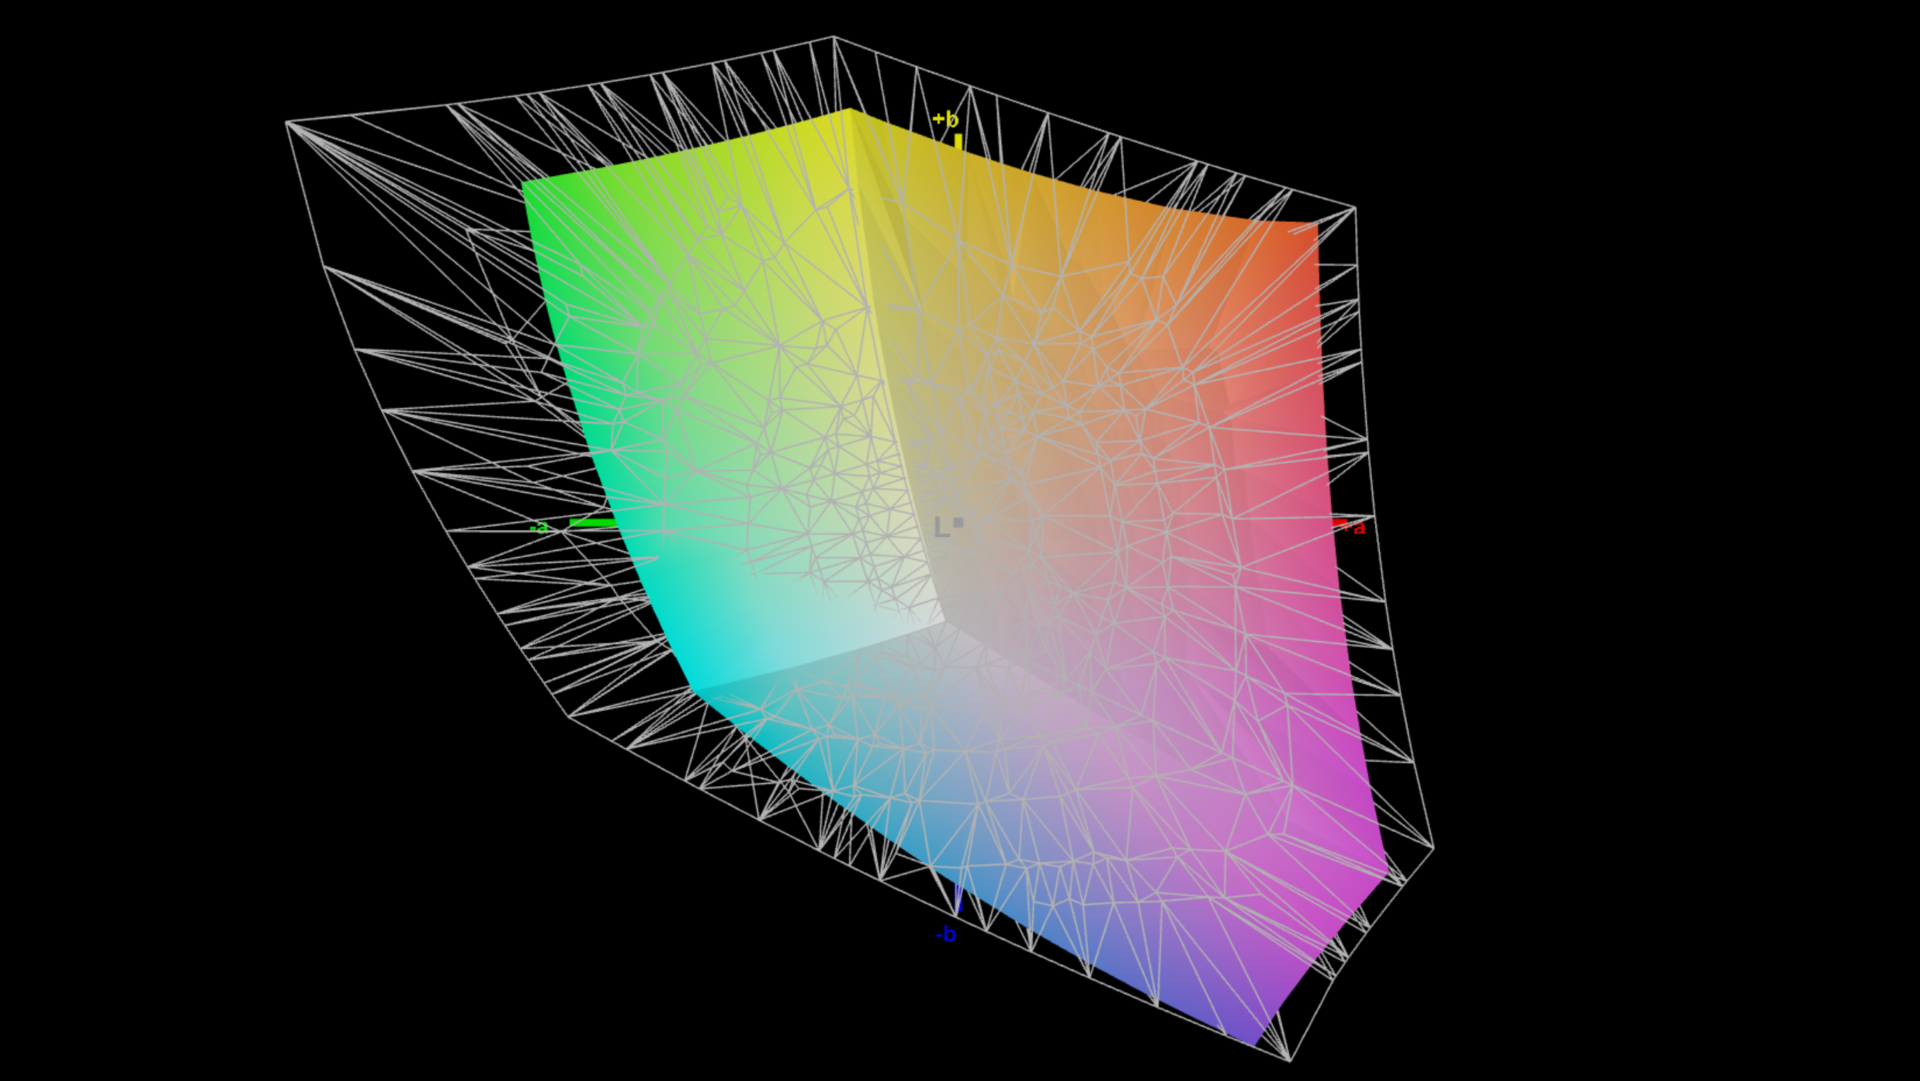
70.2% AdobeRGB 1998 (Argyll 3D)
97.5% sRGB (Argyll 3D)
68.1% Display P3 (Argyll 3D)
Gamma: 2.25
CCT: 6682 K
| Lenovo ThinkPad P1 G6-21FV000DGE NE160QDM-NY1, IPS, 2560x1600, 16" | Dell Precision 5000 5680 Samsung 160YV03, OLED, 3840x2400, 16" | Samsung Galaxy Book3 Ultra 16, i9-13900H RTX 4070 Samsung SDC4185 ATNA60CL03-0, OLED / AMOLED, 2880x1800, 16" | HP ZBook Studio 16 G9 62U04EA BOE0A52, IPS, 3840x2400, 16" | MSI CreatorPro Z16P B12UKST B160QAN02.N, IPS, 2560x1600, 16" | Schenker VISION 16 Pro (M23) NE160QDM-NZ1, IPS, 2560x1600, 16" | Lenovo ThinkPad X1 Extreme G5-21DE003RGE LP160UQ1-SPB1, IPS, 3840x2400, 16" | |
|---|---|---|---|---|---|---|---|
| Display | 30% | 27% | 23% | 23% | 1% | 22% | |
| Display P3 Coverage (%) | 68.1 | 99.9 47% | 95.3 40% | 97.5 43% | 97.6 43% | 68.8 1% | 84.6 24% |
| sRGB Coverage (%) | 97.5 | 100 3% | 99.1 2% | 99.9 2% | 99.9 2% | 98.8 1% | 99.2 2% |
| AdobeRGB 1998 Coverage (%) | 70.2 | 97.5 39% | 97.4 39% | 86.3 23% | 87.4 25% | 70 0% | 97.7 39% |
| Response Times | 85% | 82% | 12% | 15% | 8% | -168% | |
| Response Time Grey 50% / Grey 80% * (ms) | 13.7 ? | 1.68 ? 88% | 2 ? 85% | 15.3 ? -12% | 12.8 ? 7% | 13.7 ? -0% | 46 ? -236% |
| Response Time Black / White * (ms) | 9.6 ? | 1.77 ? 82% | 2 ? 79% | 6.1 ? 36% | 7.4 ? 23% | 8.1 ? 16% | 19.2 ? -100% |
| PWM Frequency (Hz) | 60 ? | 250 ? | |||||
| Screen | -79% | -51% | 0% | -10% | -74% | -29% | |
| Brightness middle (cd/m²) | 521 | 345.7 -34% | 403 -23% | 554 6% | 407 -22% | 384 -26% | 476 -9% |
| Brightness (cd/m²) | 484 | 349 -28% | 408 -16% | 516 7% | 388 -20% | 371 -23% | 470 -3% |
| Brightness Distribution (%) | 89 | 98 10% | 98 10% | 84 -6% | 88 -1% | 88 -1% | 90 1% |
| Black Level * (cd/m²) | 0.36 | 0.47 -31% | 0.36 -0% | 0.3 17% | 0.35 3% | ||
| Contrast (:1) | 1447 | 1179 -19% | 1131 -22% | 1280 -12% | 1360 -6% | ||
| Colorchecker dE 2000 * | 1.2 | 3.59 -199% | 2.63 -119% | 1 17% | 1.3 -8% | 3.4 -183% | 1.9 -58% |
| Colorchecker dE 2000 max. * | 2.5 | 7.02 -181% | 4.07 -63% | 2.4 4% | 2.5 -0% | 9.2 -268% | 4.7 -88% |
| Colorchecker dE 2000 calibrated * | 1 | 0.99 1% | 0.6 40% | 0.7 30% | 1.3 -30% | 1.3 -30% | |
| Greyscale dE 2000 * | 1.4 | 3.1 -121% | 2.69 -92% | 1.6 -14% | 2.1 -50% | 3.4 -143% | 2.4 -71% |
| Gamma | 2.25 98% | 2.13 103% | 2.48 89% | 2.29 96% | 2.26 97% | 2.16 102% | 2.24 98% |
| CCT | 6682 97% | 6448 101% | 6907 94% | 6458 101% | 6437 101% | 7462 87% | 6377 102% |
| Totalt genomsnitt (program/inställningar) | 12% /
-24% | 19% /
-5% | 12% /
7% | 9% /
1% | -22% /
-47% | -58% /
-38% |
* ... mindre är bättre
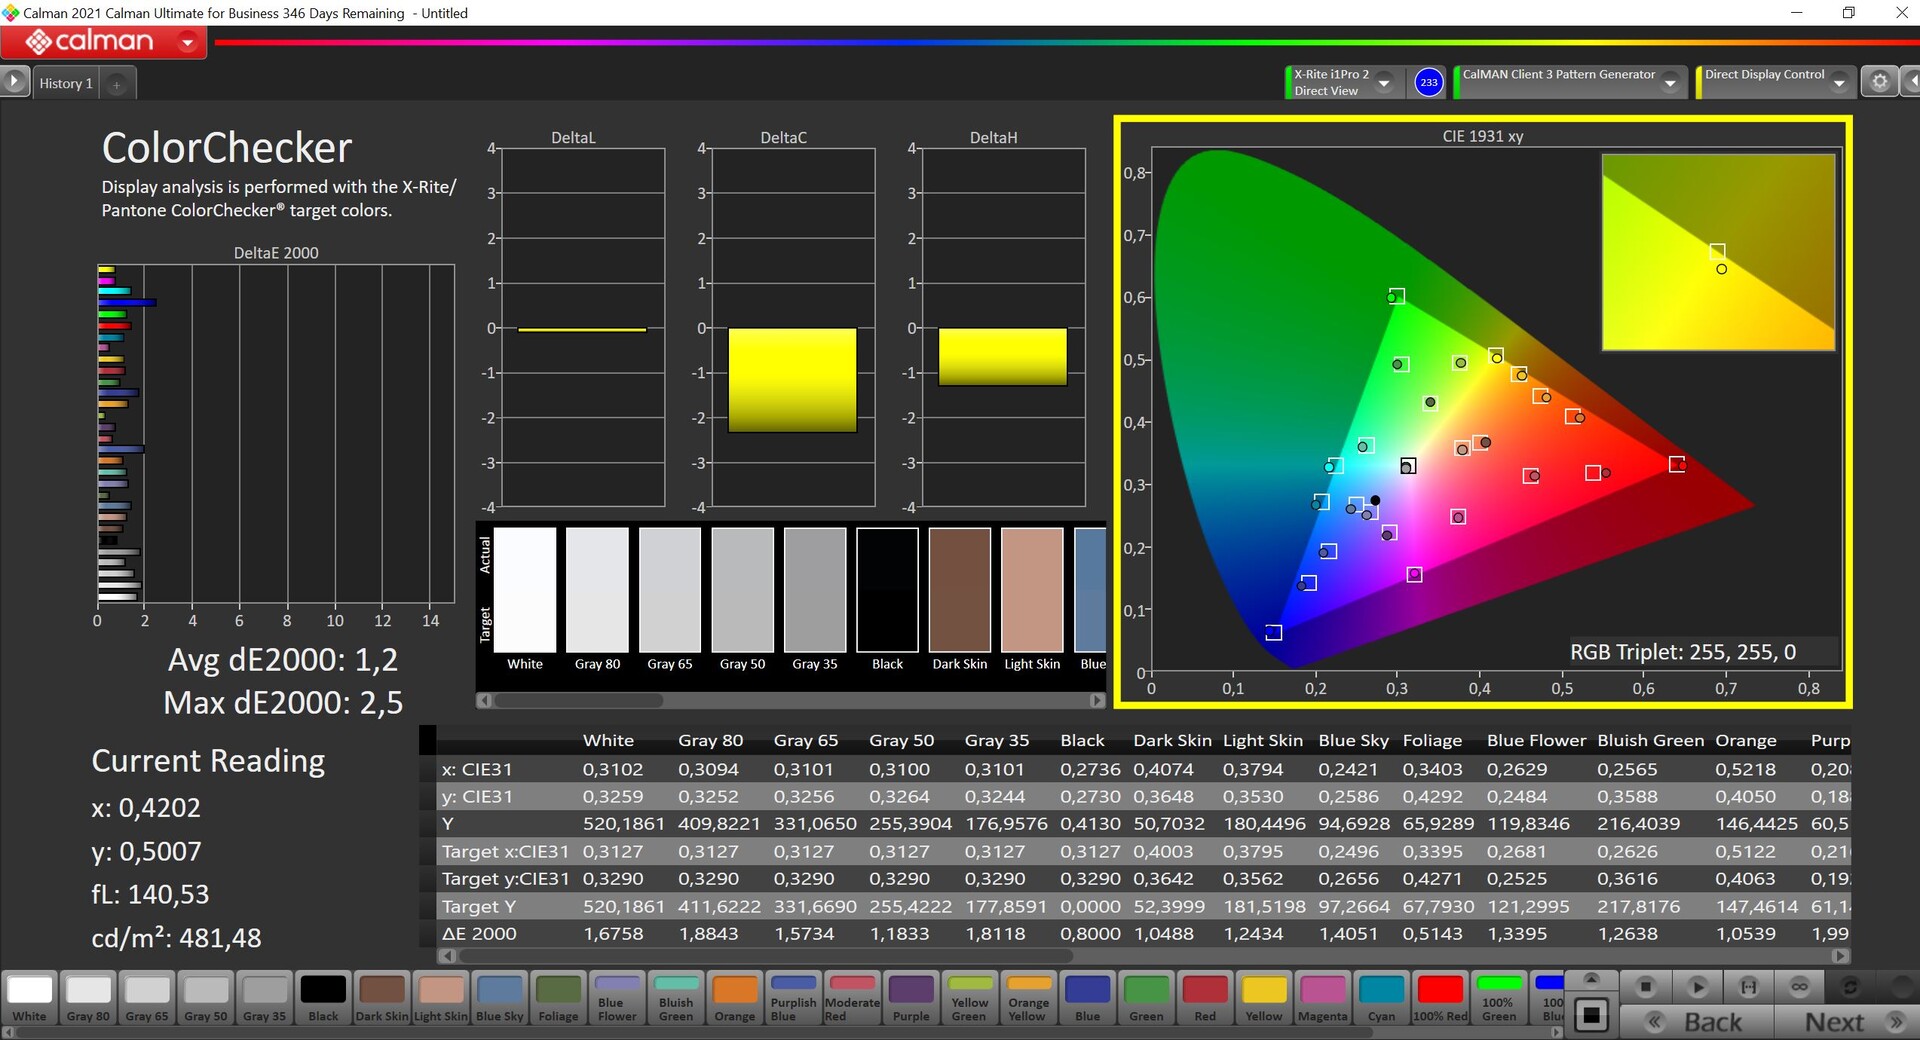
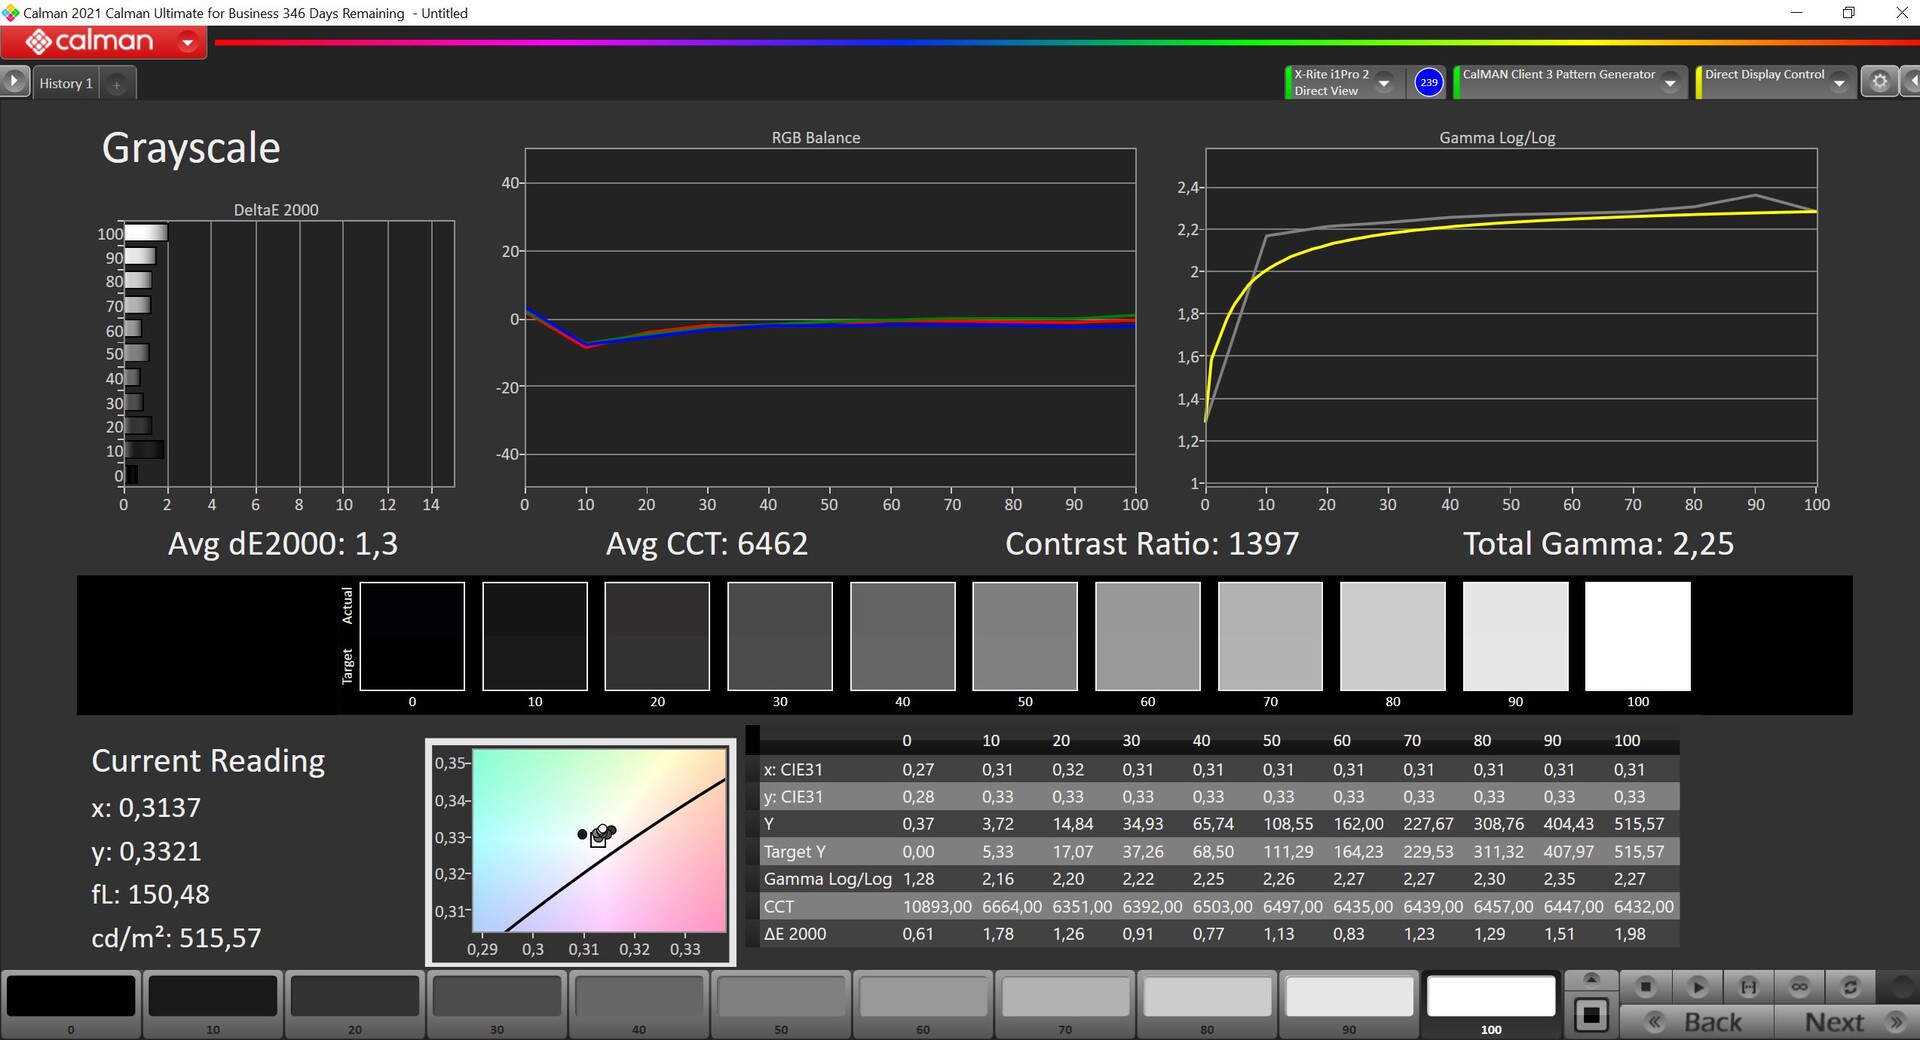
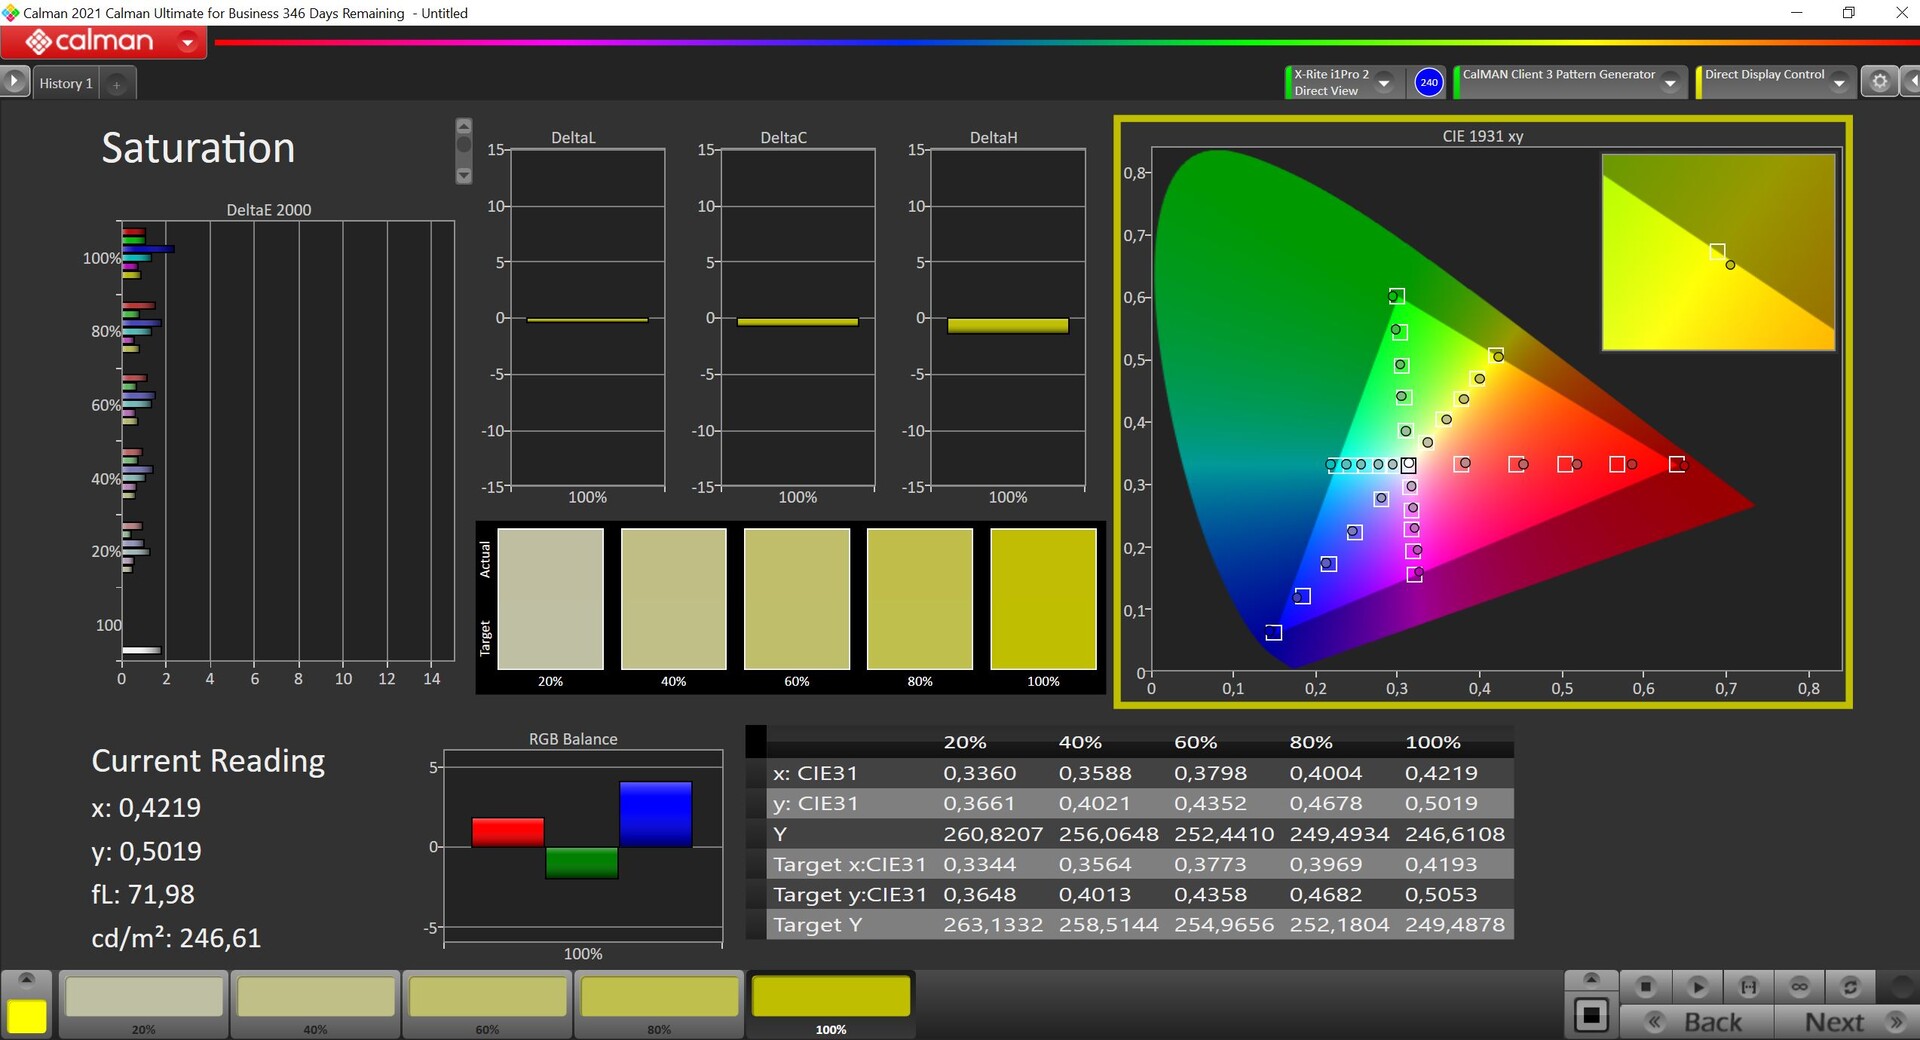
Alla ThinkPad P1 Gen 6-skärmar är fabrikskalibrerade och kunderna kan välja mellan en mängd olika färgprofiler. Standardprofilen uppvisar utmärkta värden, vilket framgår av vår analys med den professionella programvaran CalMAN. Dessa värden är redan mycket imponerande, med inga DeltaE-2000-avvikelser som överstiger 3 i vare sig gråskalan eller färgerna. Den enda lilla nackdelen är färgtemperaturen i gråskalan, som skulle kunna vara lite varmare. Detta är ett obetydligt problem och användarna behöver inte göra någon ytterligare kalibrering. Vi kunde minimera färgskillnaderna något och få färgtemperaturen närmare det optimala värdet med hjälp av vår egen kalibrering (den relevanta profilen finns tillgänglig för gratis nedladdning ovan).

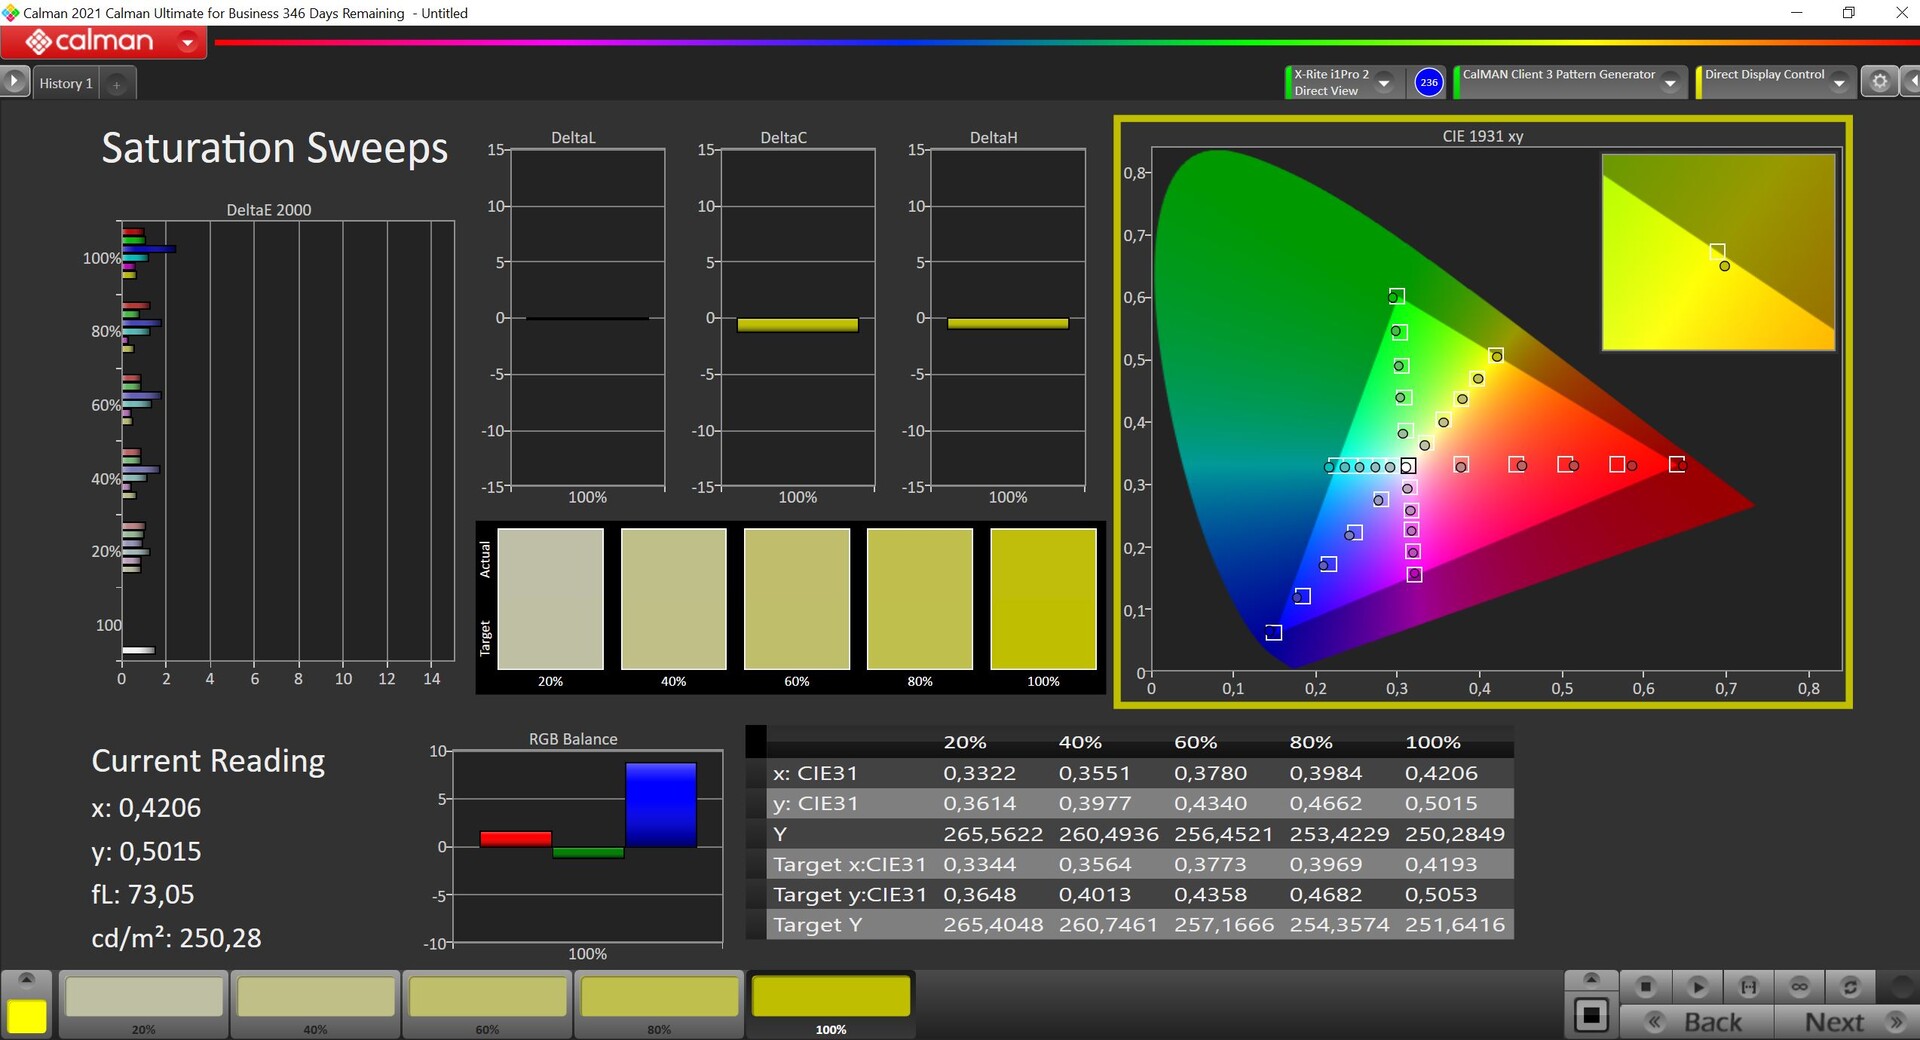

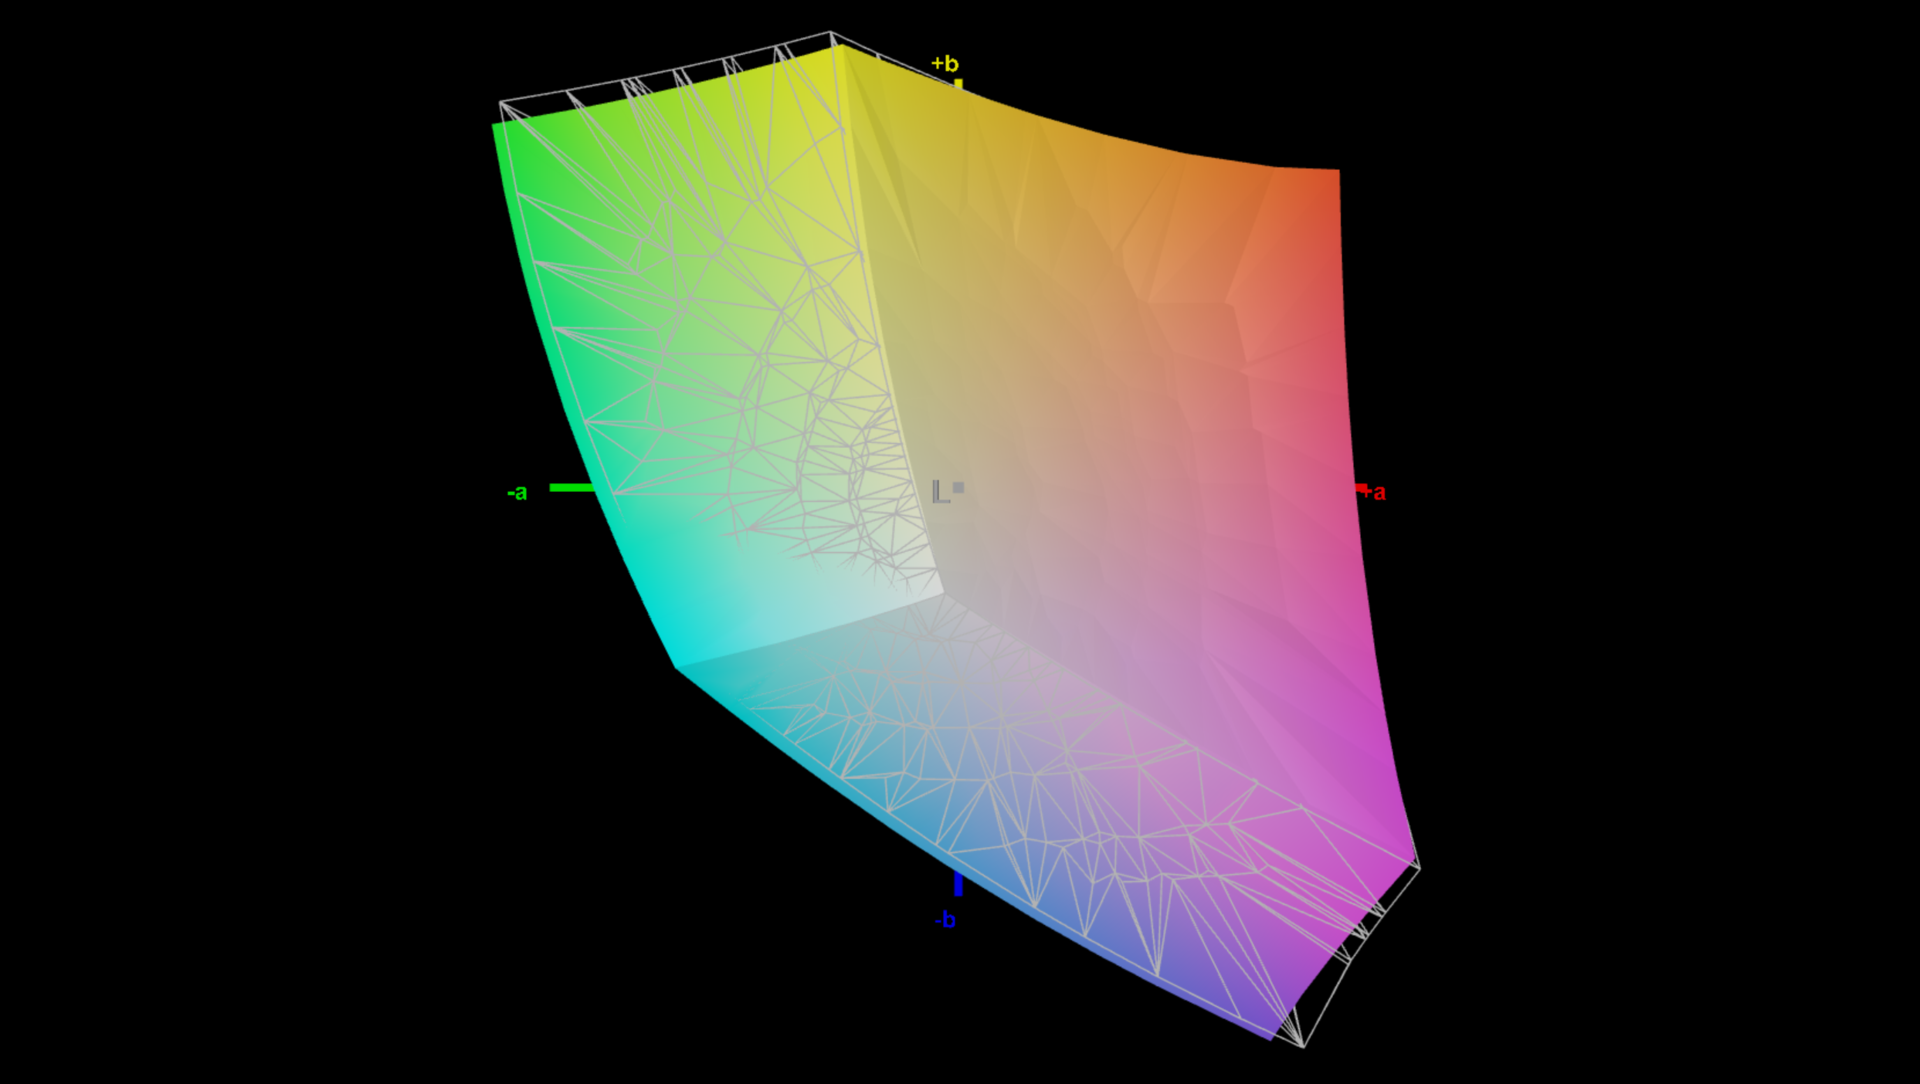
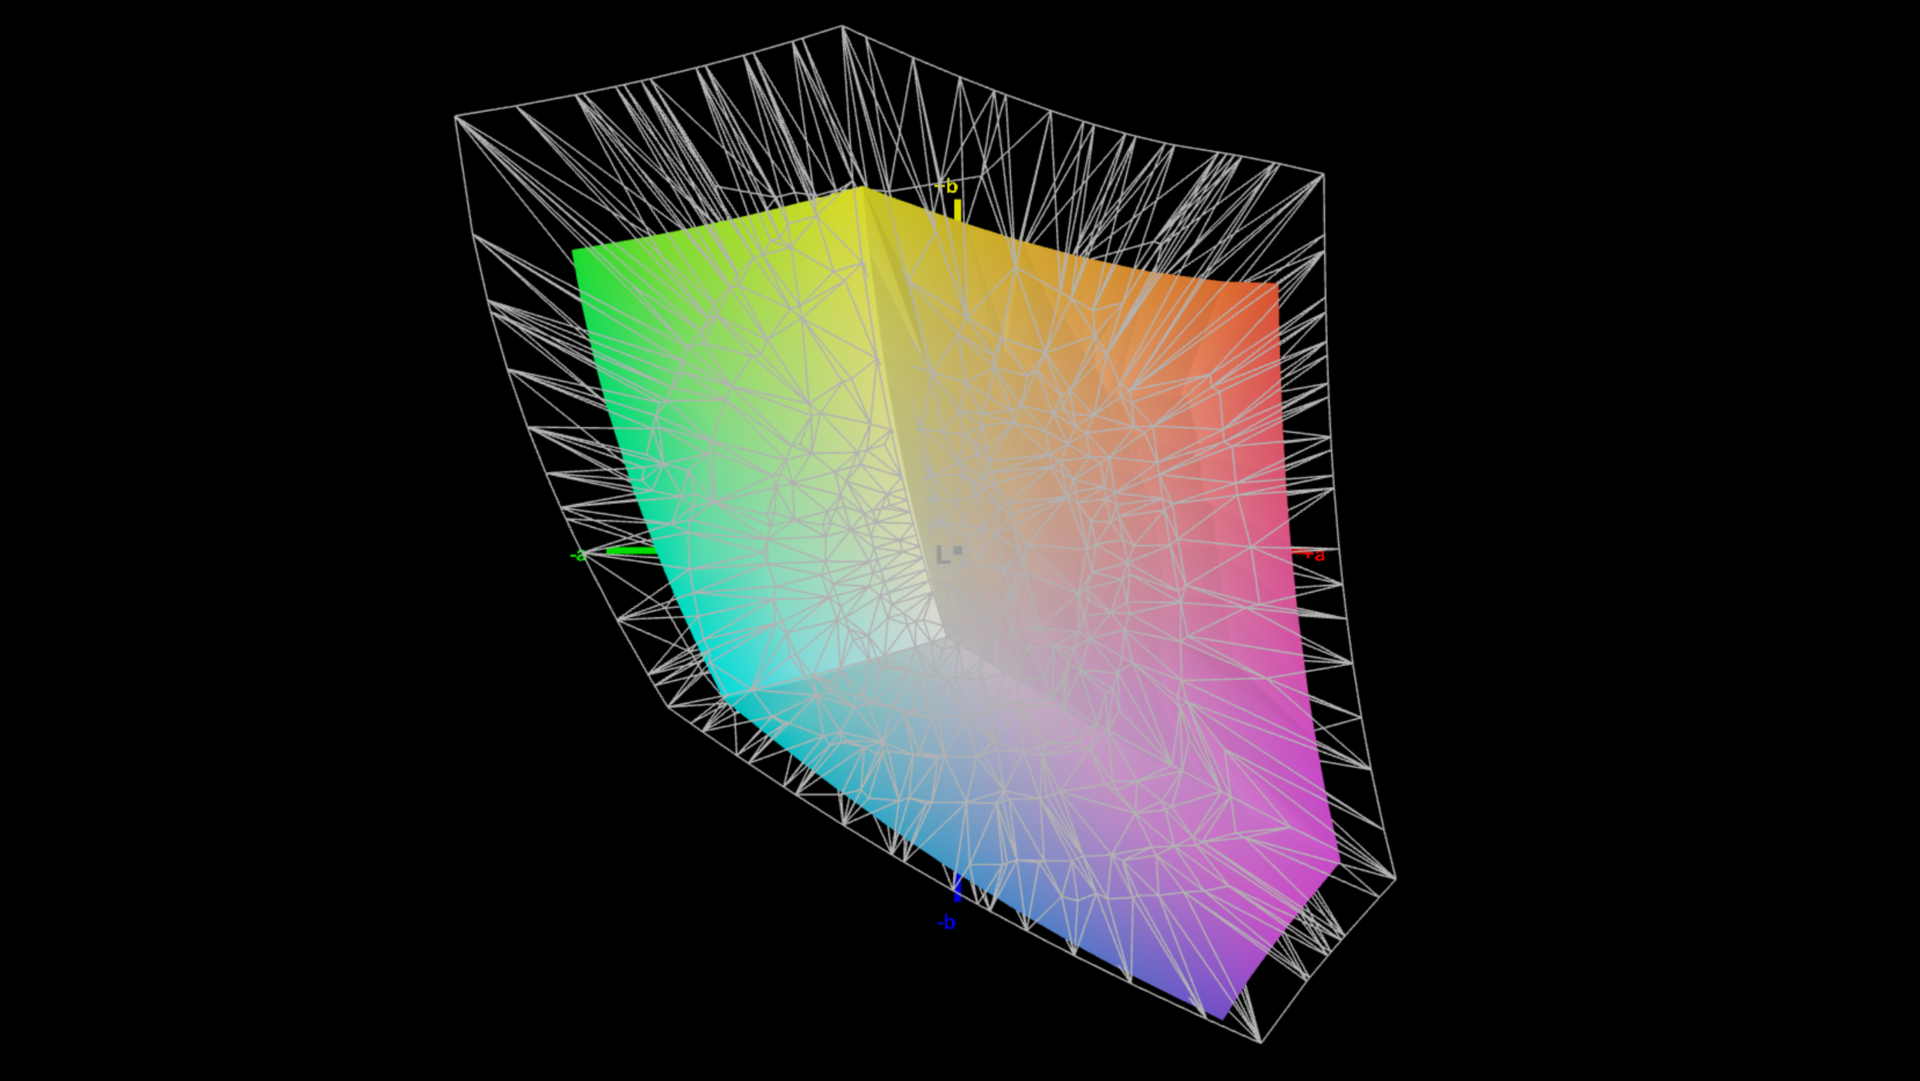
Skärmen täcker helt den mindre sRGB-färgrymden, vilket är tillräckligt för många tillämpningar. Om du behöver den större P3-färgrymden måste du använda OLED-panelen, men vi rekommenderar vanligtvis 165 Hz-panelen på grund av OLED:s nackdelar som PWM och högre strömförbrukning.
Visa svarstider
| ↔ Svarstid svart till vitt | ||
|---|---|---|
| 9.6 ms ... stiga ↗ och falla ↘ kombinerat | ↗ 4.8 ms stiga | 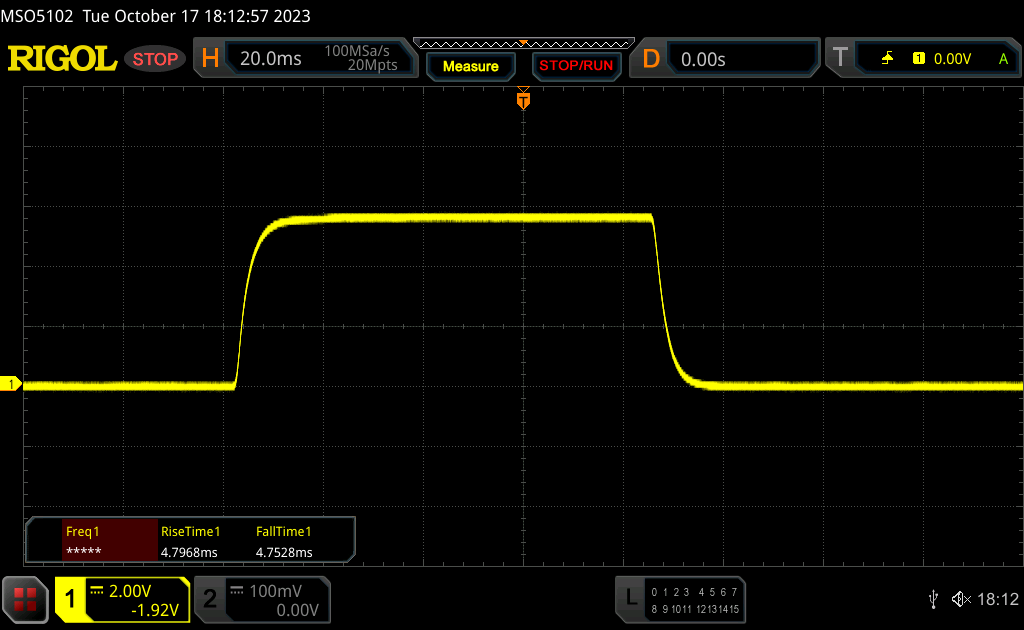 |
| ↘ 4.8 ms hösten | ||
| Skärmen visar snabba svarsfrekvenser i våra tester och bör passa för spel. I jämförelse sträcker sig alla testade enheter från 0.1 (minst) till 240 (maximalt) ms. » 26 % av alla enheter är bättre. Det betyder att den uppmätta svarstiden är bättre än genomsnittet av alla testade enheter (19.8 ms). | ||
| ↔ Svarstid 50 % grått till 80 % grått | ||
| 13.7 ms ... stiga ↗ och falla ↘ kombinerat | ↗ 6.7 ms stiga | 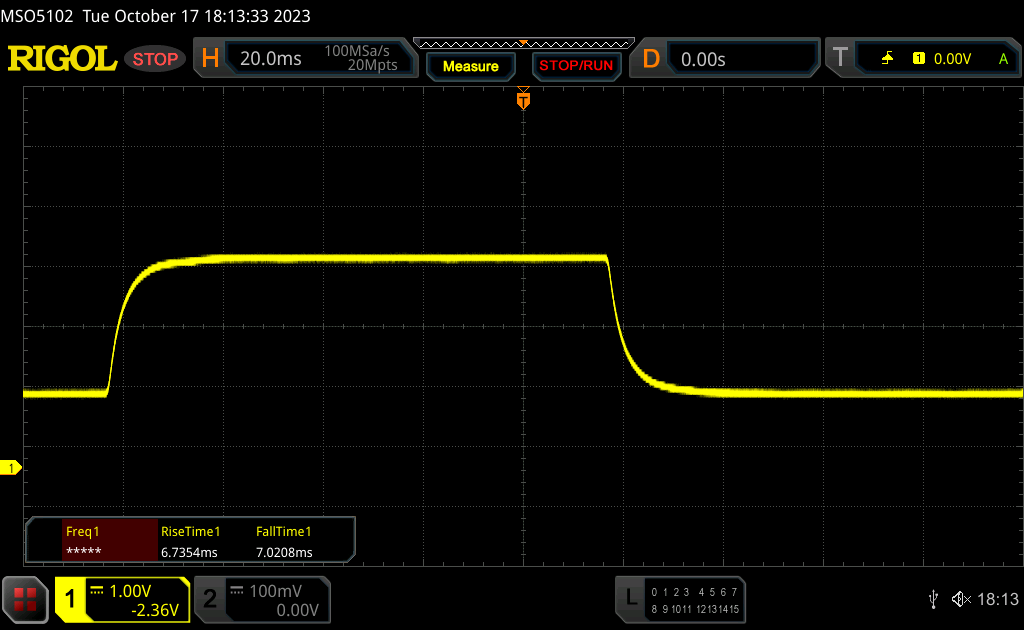 |
| ↘ 7 ms hösten | ||
| Skärmen visar bra svarsfrekvens i våra tester, men kan vara för långsam för konkurrenskraftiga spelare. I jämförelse sträcker sig alla testade enheter från 0.165 (minst) till 636 (maximalt) ms. » 28 % av alla enheter är bättre. Det betyder att den uppmätta svarstiden är bättre än genomsnittet av alla testade enheter (31 ms). | ||
Skärmflimmer / PWM (Puls-Width Modulation)
| Skärmflimmer / PWM upptäcktes inte | 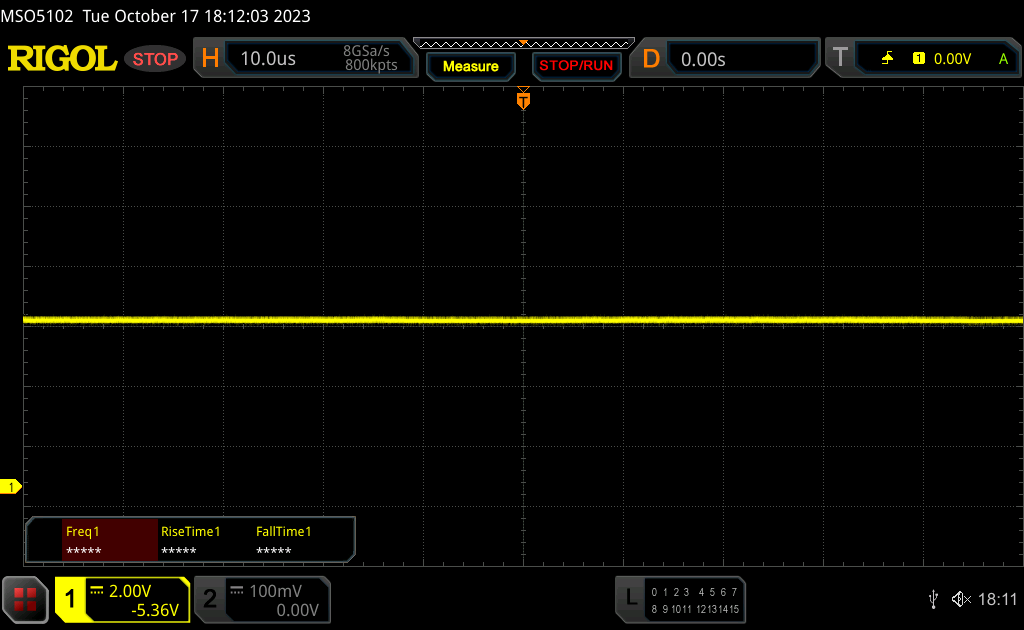 | ||
Som jämförelse: 52 % av alla testade enheter använder inte PWM för att dämpa skärmen. Om PWM upptäcktes mättes ett medelvärde av 7757 (minst: 5 - maximum: 343500) Hz. | |||
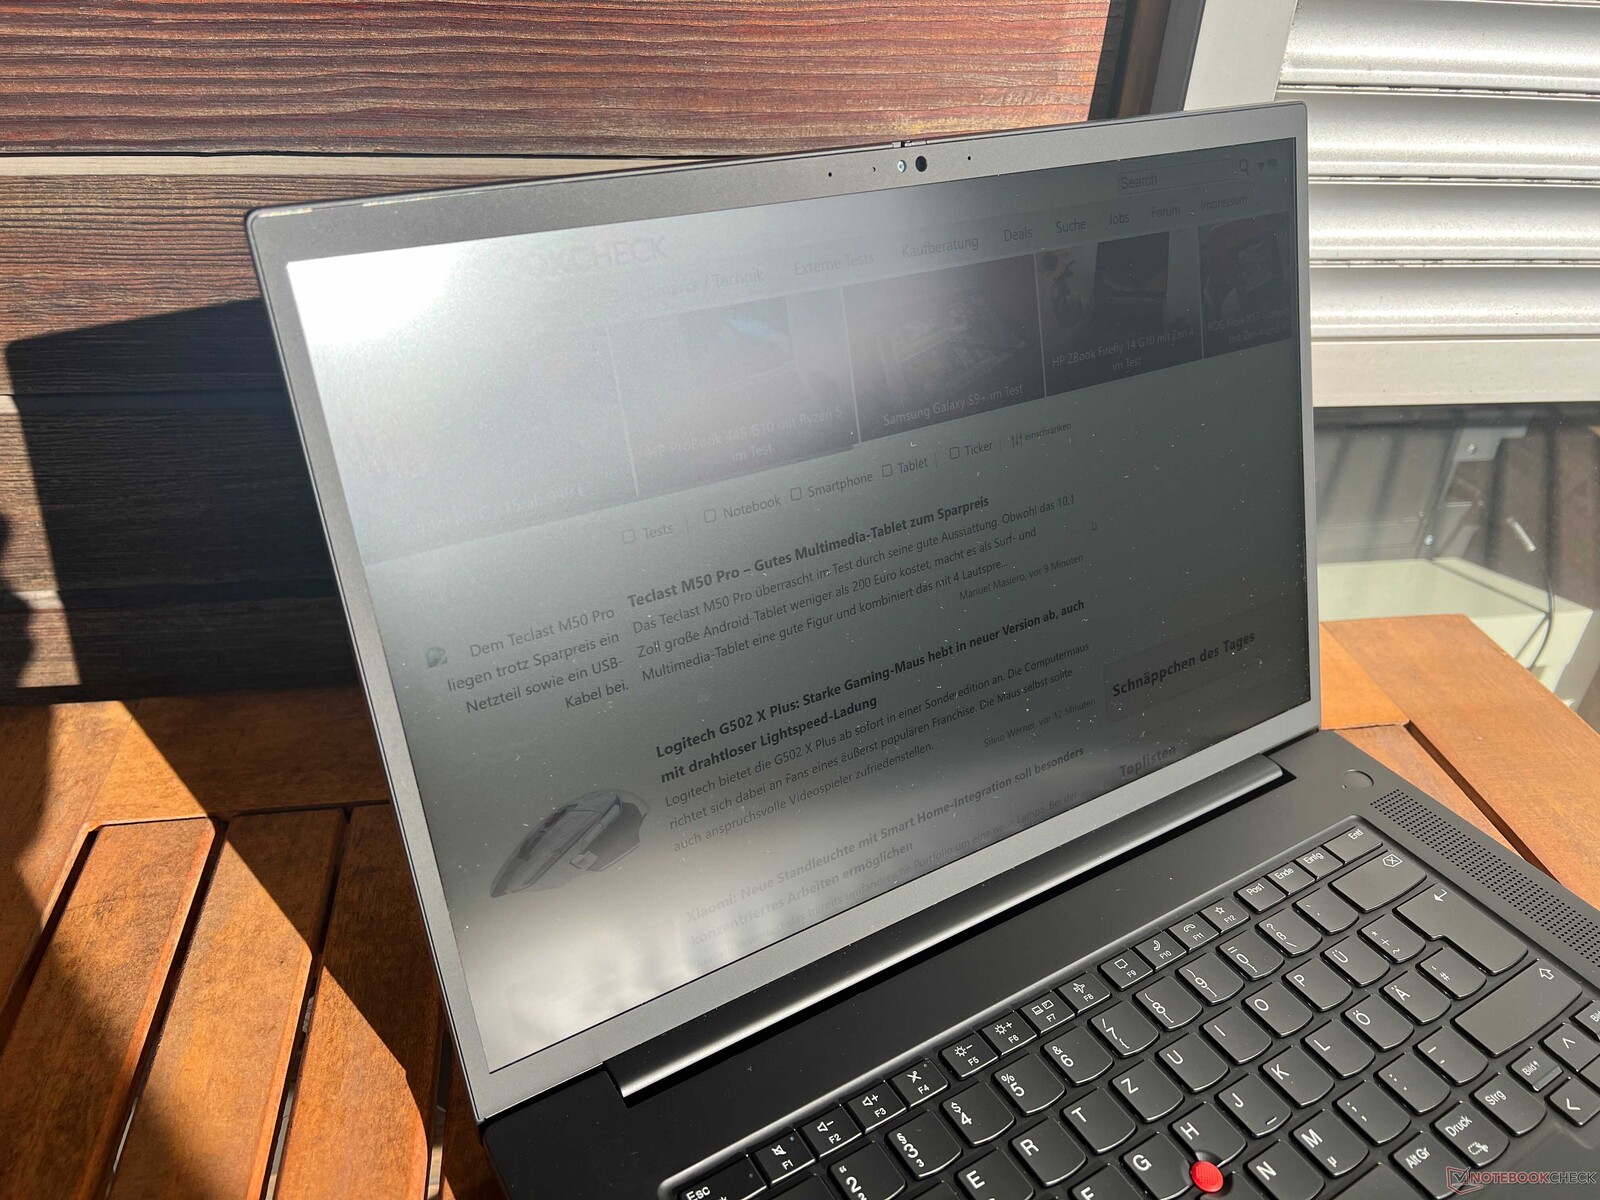
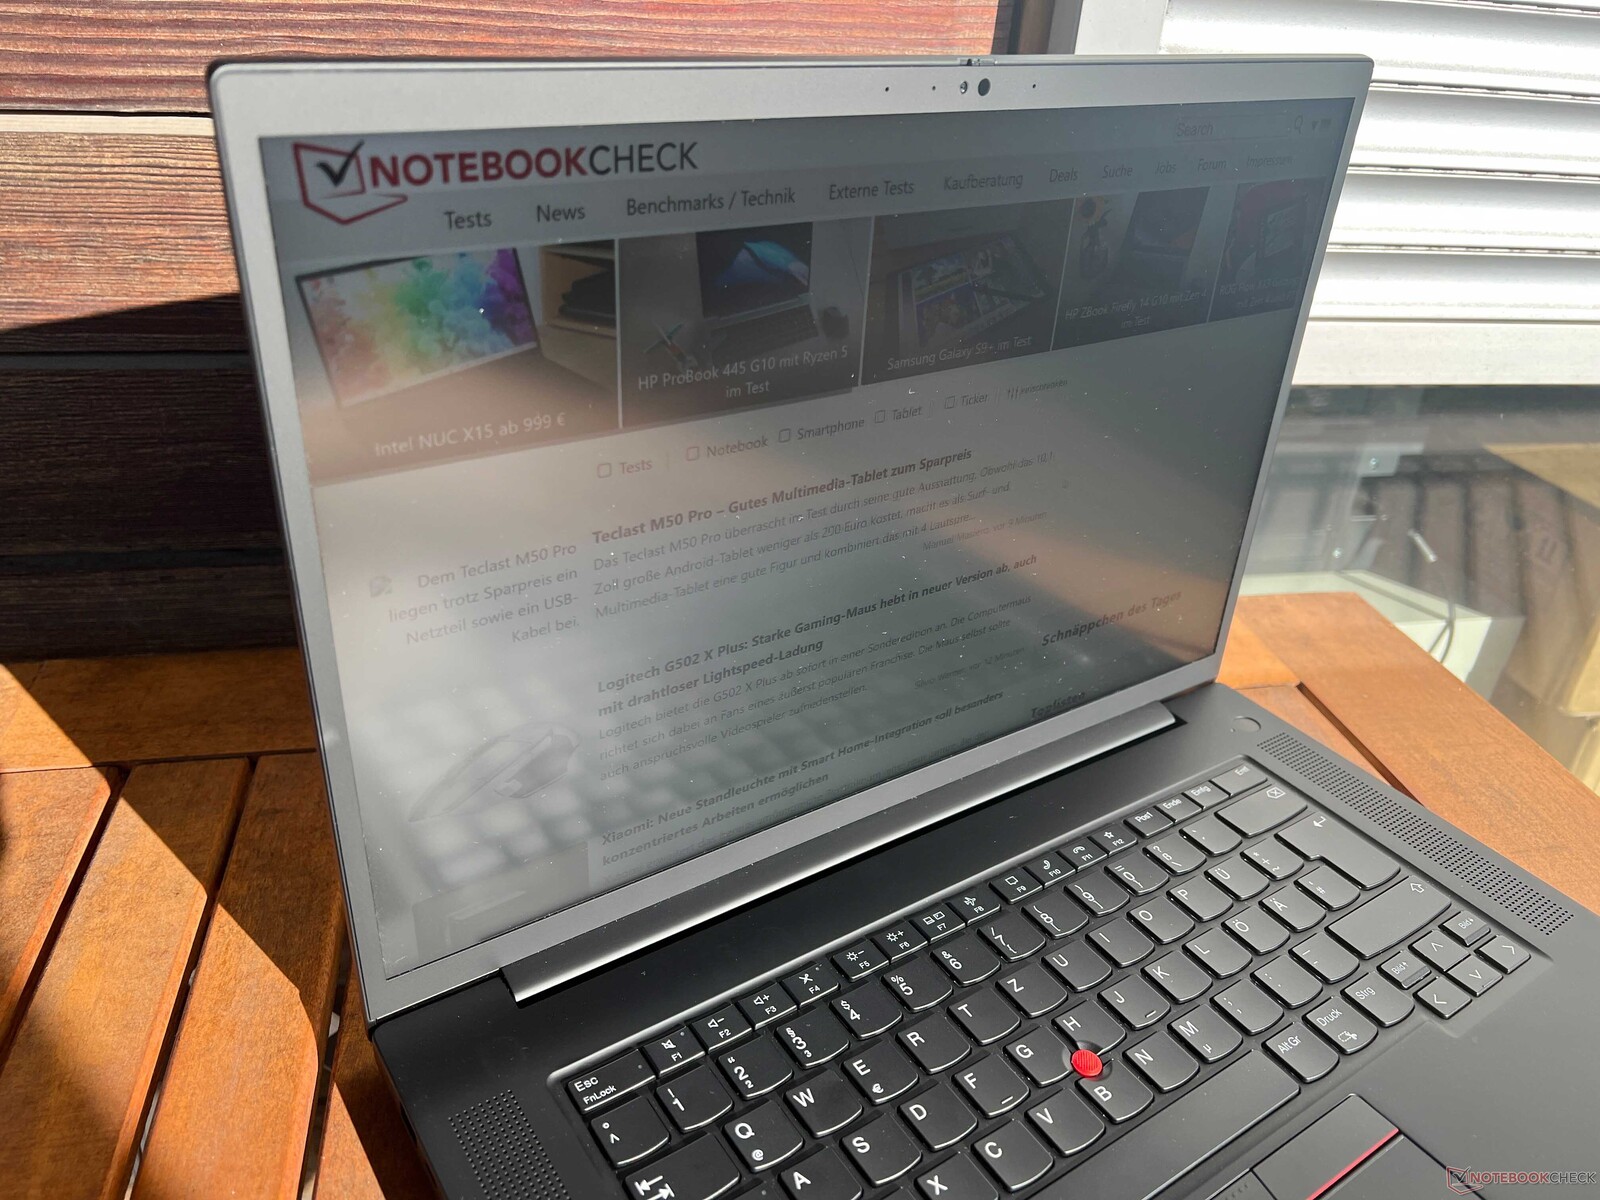
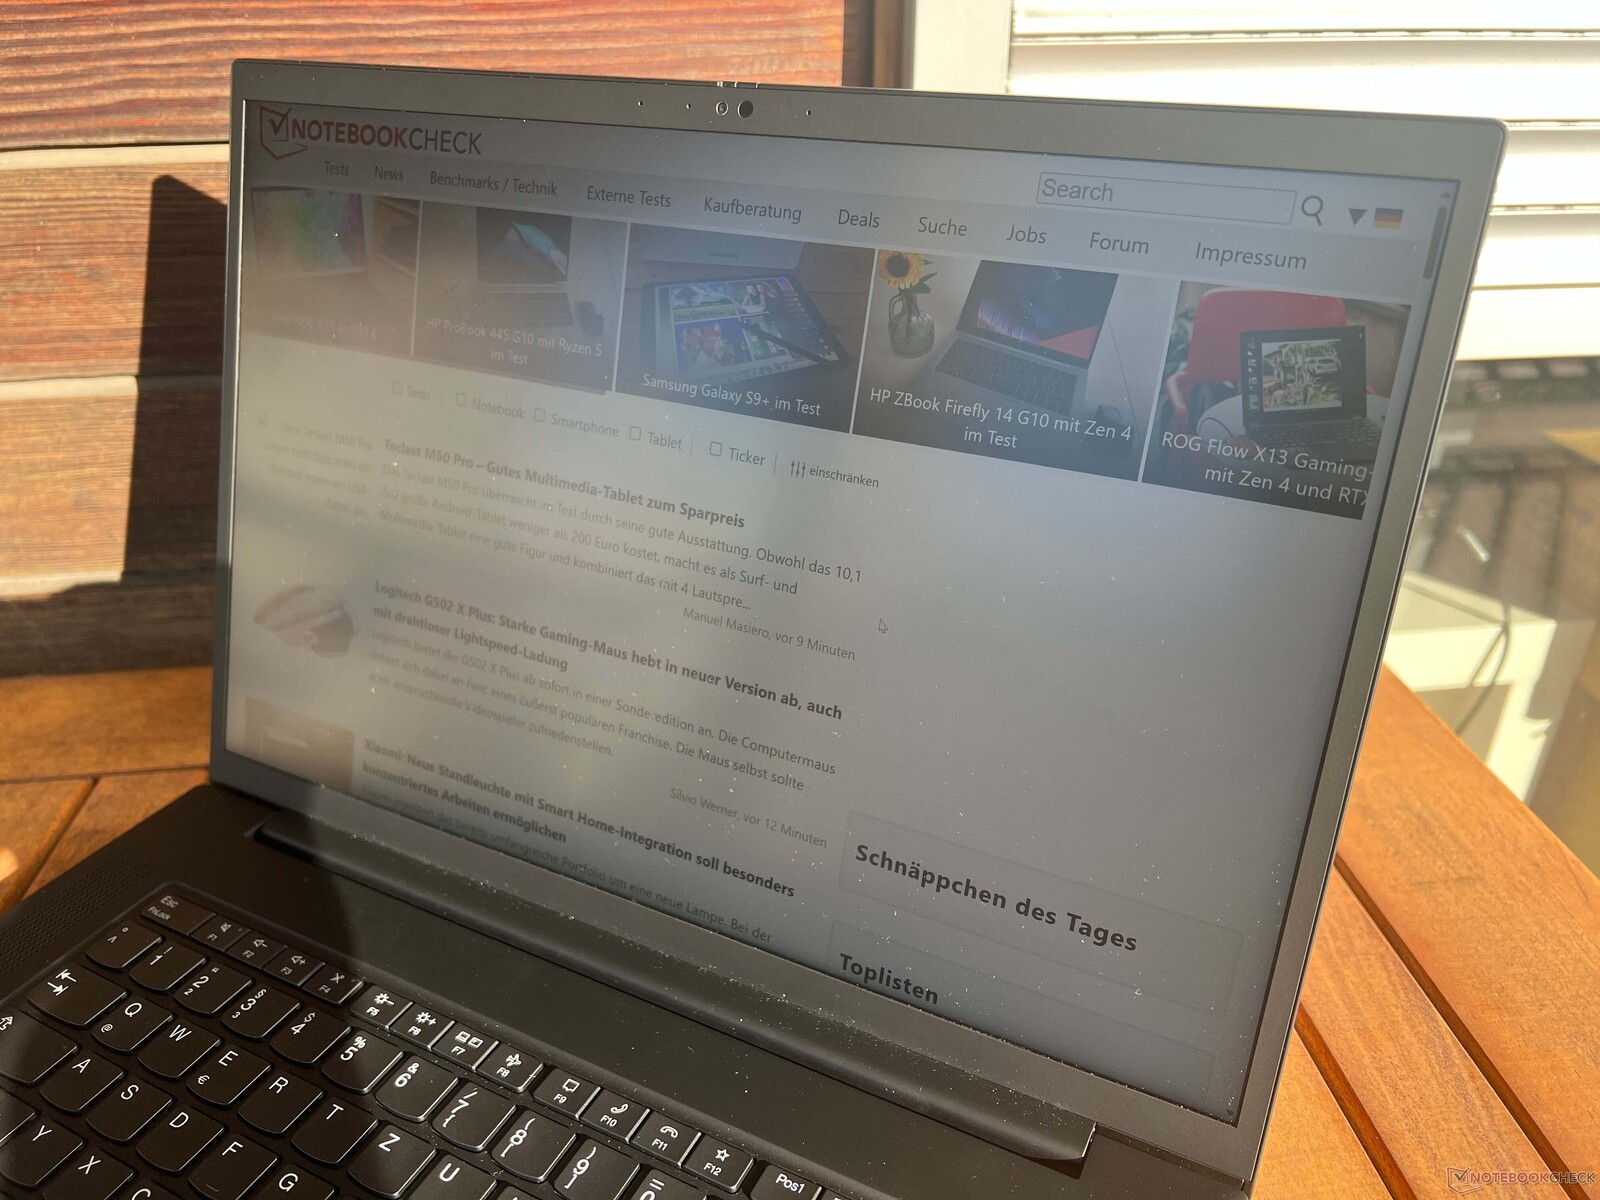
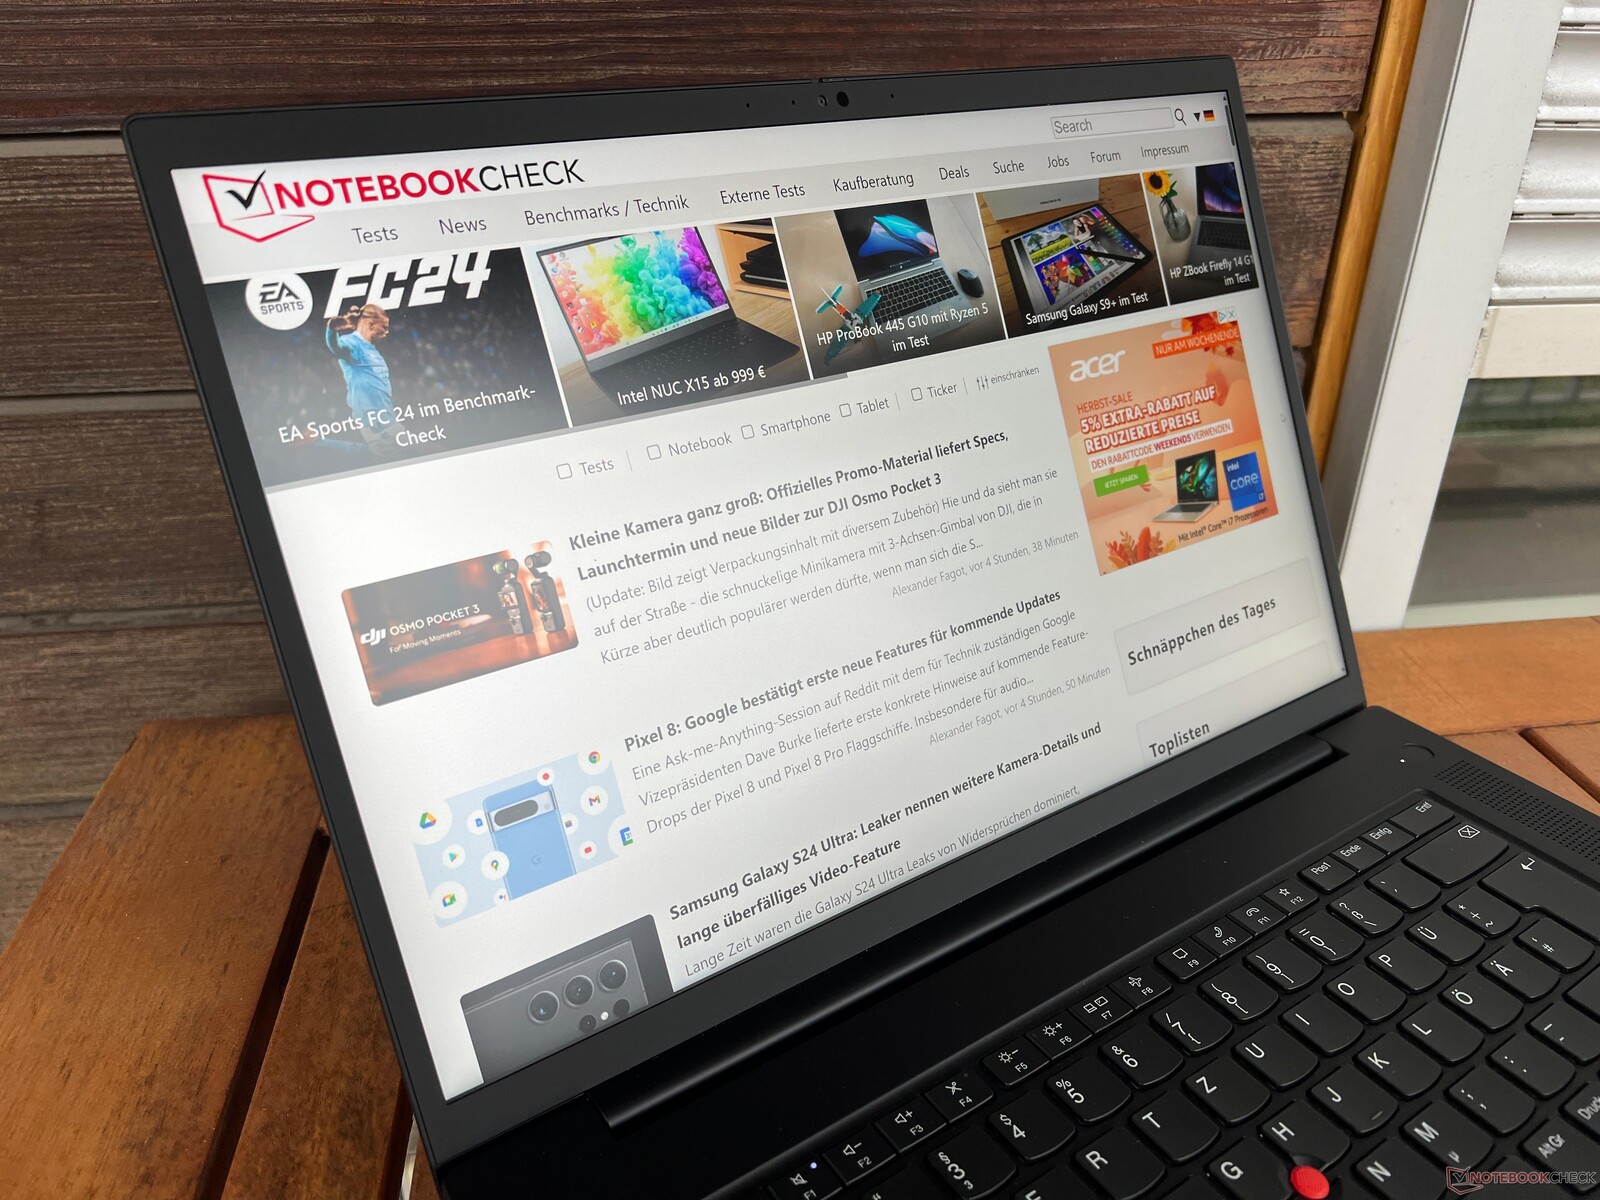
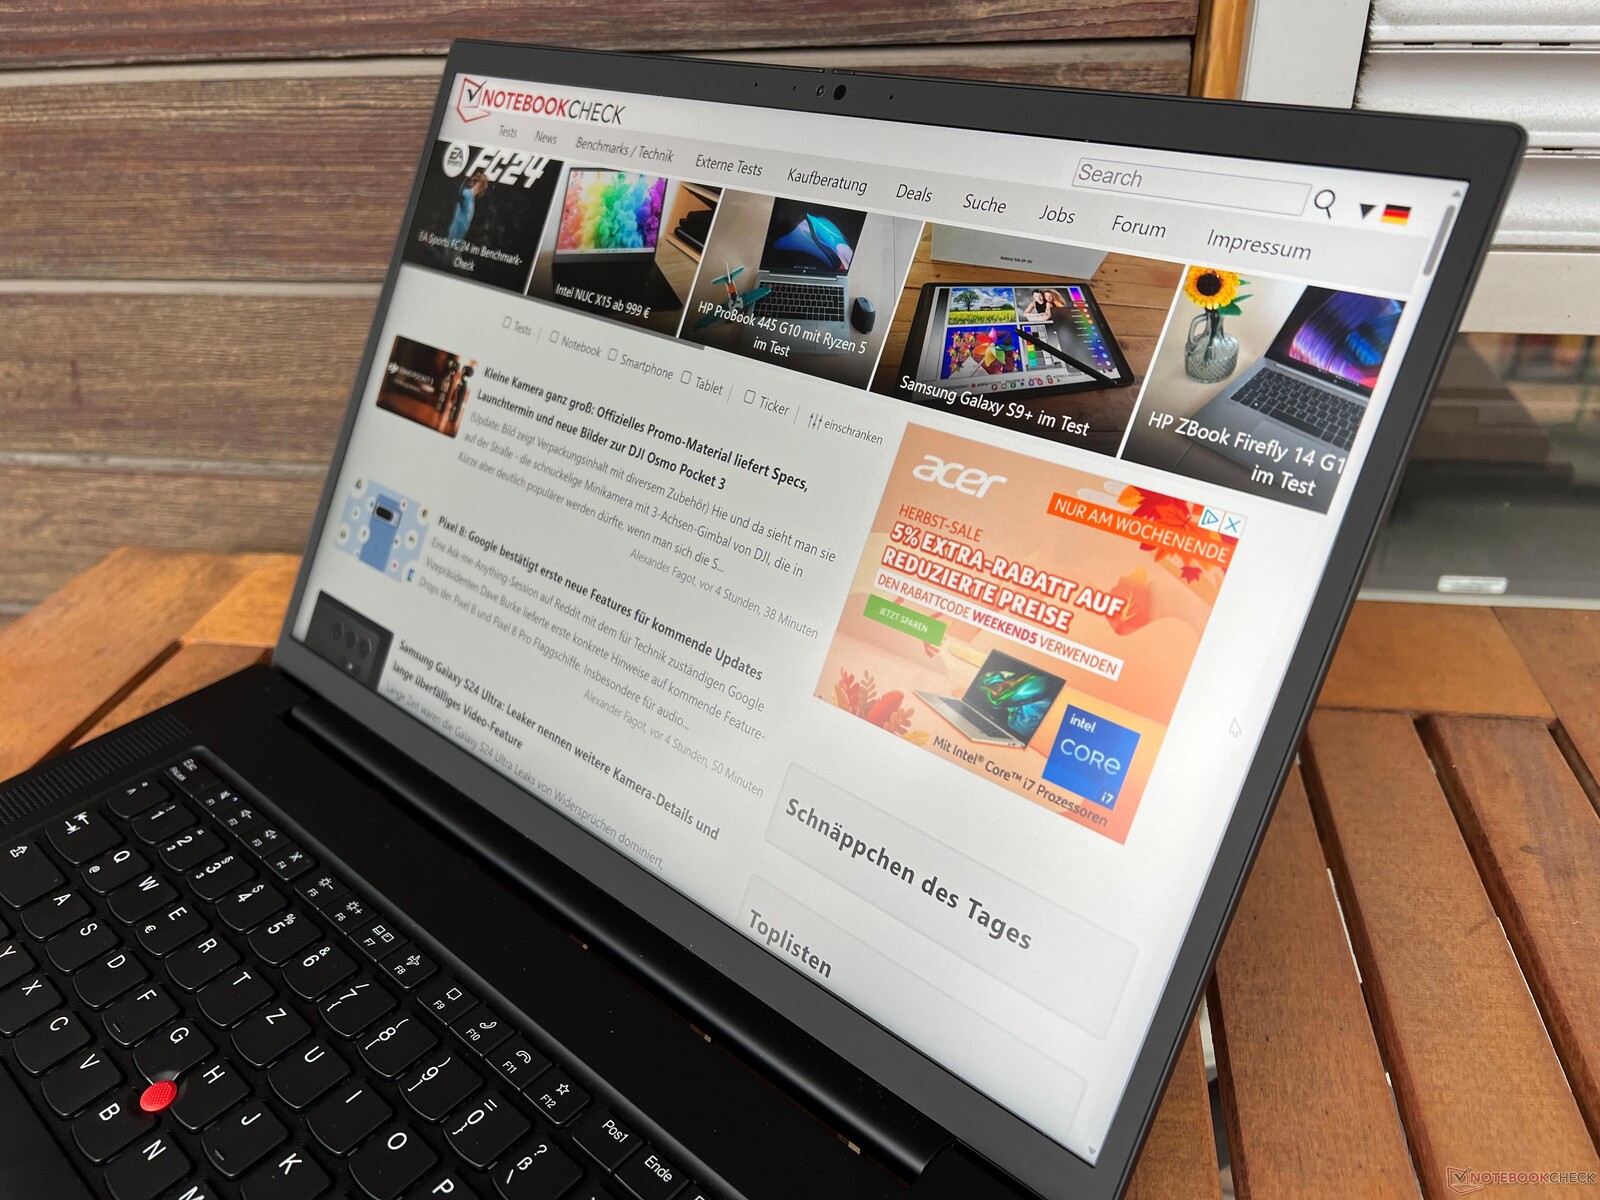
Den matta skärmen är användbar utomhus, även om den blir utmanande i direkt solljus. IPS-panelen ger utmärkt stabilitet i betraktningsvinkeln.

Prestanda - Raptor Lake och Ada Lovelace
Villkor för testning
Lenovo har inte använt separata energiprofiler på ThinkPad-modellerna under en längre tid. Smart Cooling-inställningarna är direkt kopplade till Windows standardströmförsörjningsprofiler. För följande riktmärken och mätningar använde vi profilen Bästa prestanda som standardinställning.
Processor - Core i7-13900H
Intel Core i9-139H Intel Core i9-13900H från Raptor-Lake-generationen har 6 högpresterande och 8 effektiva kärnor och kan hantera upp till 20 trådar. Den har betydligt högre maximala klockhastigheter än Core i7-13700H och stöder vPro-funktioner. Även om det var små förändringar i vårt Cinebench loop-test kan processorn i vår ThinkPad P1 Gen 6 förbruka upp till 96 watt tillfälligt och ungefär 84 watt kontinuerligt. Överlag är single-core-resultaten bra, men multi-core-prestandan har större potential. Det är tänkbart att processorer med förångningskammare ger bättre prestanda. Vid batteridrift är CPU:n begränsad till 57 watt maximal strömförbrukning, vilket resulterar i cirka 25 % sämre flerkärnig prestanda. Fler CPU-riktmärken finns listade i vårtekniska avsnitt.
Cinebench R15 Multi Loop
Cinebench R23: Multi Core | Single Core
Cinebench R20: CPU (Multi Core) | CPU (Single Core)
Cinebench R15: CPU Multi 64Bit | CPU Single 64Bit
Blender: v2.79 BMW27 CPU
7-Zip 18.03: 7z b 4 | 7z b 4 -mmt1
Geekbench 5.5: Multi-Core | Single-Core
HWBOT x265 Benchmark v2.2: 4k Preset
LibreOffice : 20 Documents To PDF
R Benchmark 2.5: Overall mean
| CPU Performance rating | |
| Genomsnitt av klass Workstation | |
| Dell Precision 5000 5680 | |
| Lenovo ThinkPad P1 G6-21FV000DGE | |
| HP ZBook Studio 16 G9 62U04EA | |
| Lenovo ThinkPad X1 Extreme G5-21DE003RGE | |
| Genomsnitt Intel Core i9-13900H | |
| MSI CreatorPro Z16P B12UKST | |
| Schenker VISION 16 Pro (M23) | |
| Samsung Galaxy Book3 Ultra 16, i9-13900H RTX 4070 | |
| Cinebench R23 / Multi Core | |
| Genomsnitt av klass Workstation (14621 - 38520, n=23, senaste 2 åren) | |
| Dell Precision 5000 5680 | |
| Lenovo ThinkPad P1 G6-21FV000DGE | |
| Lenovo ThinkPad X1 Extreme G5-21DE003RGE | |
| MSI CreatorPro Z16P B12UKST | |
| Genomsnitt Intel Core i9-13900H (11997 - 20385, n=28) | |
| HP ZBook Studio 16 G9 62U04EA | |
| Schenker VISION 16 Pro (M23) | |
| Samsung Galaxy Book3 Ultra 16, i9-13900H RTX 4070 | |
| Cinebench R23 / Single Core | |
| Lenovo ThinkPad P1 G6-21FV000DGE | |
| Genomsnitt av klass Workstation (1712 - 2228, n=23, senaste 2 åren) | |
| Dell Precision 5000 5680 | |
| Genomsnitt Intel Core i9-13900H (1297 - 2054, n=26) | |
| Schenker VISION 16 Pro (M23) | |
| HP ZBook Studio 16 G9 62U04EA | |
| Lenovo ThinkPad X1 Extreme G5-21DE003RGE | |
| MSI CreatorPro Z16P B12UKST | |
| Samsung Galaxy Book3 Ultra 16, i9-13900H RTX 4070 | |
| Cinebench R20 / CPU (Multi Core) | |
| Genomsnitt av klass Workstation (5760 - 15043, n=23, senaste 2 åren) | |
| Dell Precision 5000 5680 | |
| Lenovo ThinkPad P1 G6-21FV000DGE | |
| Lenovo ThinkPad X1 Extreme G5-21DE003RGE | |
| MSI CreatorPro Z16P B12UKST | |
| Genomsnitt Intel Core i9-13900H (4935 - 7716, n=25) | |
| HP ZBook Studio 16 G9 62U04EA | |
| Schenker VISION 16 Pro (M23) | |
| Samsung Galaxy Book3 Ultra 16, i9-13900H RTX 4070 | |
| Cinebench R20 / CPU (Single Core) | |
| Lenovo ThinkPad P1 G6-21FV000DGE | |
| Dell Precision 5000 5680 | |
| Genomsnitt av klass Workstation (671 - 857, n=23, senaste 2 åren) | |
| Schenker VISION 16 Pro (M23) | |
| Genomsnitt Intel Core i9-13900H (428 - 792, n=25) | |
| HP ZBook Studio 16 G9 62U04EA | |
| Lenovo ThinkPad X1 Extreme G5-21DE003RGE | |
| MSI CreatorPro Z16P B12UKST | |
| Samsung Galaxy Book3 Ultra 16, i9-13900H RTX 4070 | |
| Cinebench R15 / CPU Multi 64Bit | |
| Genomsnitt av klass Workstation (2489 - 5810, n=23, senaste 2 åren) | |
| Lenovo ThinkPad X1 Extreme G5-21DE003RGE | |
| Genomsnitt Intel Core i9-13900H (2061 - 3100, n=26) | |
| Lenovo ThinkPad P1 G6-21FV000DGE | |
| HP ZBook Studio 16 G9 62U04EA | |
| Dell Precision 5000 5680 | |
| Schenker VISION 16 Pro (M23) | |
| MSI CreatorPro Z16P B12UKST | |
| Samsung Galaxy Book3 Ultra 16, i9-13900H RTX 4070 | |
| Cinebench R15 / CPU Single 64Bit | |
| Genomsnitt av klass Workstation (191.4 - 328, n=23, senaste 2 åren) | |
| Dell Precision 5000 5680 | |
| Lenovo ThinkPad P1 G6-21FV000DGE | |
| Schenker VISION 16 Pro (M23) | |
| HP ZBook Studio 16 G9 62U04EA | |
| Genomsnitt Intel Core i9-13900H (211 - 297, n=26) | |
| Lenovo ThinkPad X1 Extreme G5-21DE003RGE | |
| MSI CreatorPro Z16P B12UKST | |
| Samsung Galaxy Book3 Ultra 16, i9-13900H RTX 4070 | |
| Blender / v2.79 BMW27 CPU | |
| Samsung Galaxy Book3 Ultra 16, i9-13900H RTX 4070 | |
| Schenker VISION 16 Pro (M23) | |
| Genomsnitt Intel Core i9-13900H (166 - 268, n=24) | |
| MSI CreatorPro Z16P B12UKST | |
| Dell Precision 5000 5680 | |
| Lenovo ThinkPad P1 G6-21FV000DGE | |
| HP ZBook Studio 16 G9 62U04EA | |
| Lenovo ThinkPad X1 Extreme G5-21DE003RGE | |
| Genomsnitt av klass Workstation (91 - 222, n=23, senaste 2 åren) | |
| 7-Zip 18.03 / 7z b 4 | |
| Genomsnitt av klass Workstation (60489 - 116969, n=23, senaste 2 åren) | |
| Lenovo ThinkPad P1 G6-21FV000DGE | |
| Dell Precision 5000 5680 | |
| HP ZBook Studio 16 G9 62U04EA | |
| MSI CreatorPro Z16P B12UKST | |
| Genomsnitt Intel Core i9-13900H (45045 - 79032, n=25) | |
| Lenovo ThinkPad X1 Extreme G5-21DE003RGE | |
| Schenker VISION 16 Pro (M23) | |
| Samsung Galaxy Book3 Ultra 16, i9-13900H RTX 4070 | |
| 7-Zip 18.03 / 7z b 4 -mmt1 | |
| Lenovo ThinkPad P1 G6-21FV000DGE | |
| Genomsnitt av klass Workstation (5126 - 6960, n=23, senaste 2 åren) | |
| Schenker VISION 16 Pro (M23) | |
| Dell Precision 5000 5680 | |
| Genomsnitt Intel Core i9-13900H (3665 - 6600, n=25) | |
| HP ZBook Studio 16 G9 62U04EA | |
| Lenovo ThinkPad X1 Extreme G5-21DE003RGE | |
| MSI CreatorPro Z16P B12UKST | |
| Samsung Galaxy Book3 Ultra 16, i9-13900H RTX 4070 | |
| Geekbench 5.5 / Multi-Core | |
| Genomsnitt av klass Workstation (11542 - 25554, n=23, senaste 2 åren) | |
| Dell Precision 5000 5680 | |
| HP ZBook Studio 16 G9 62U04EA | |
| Genomsnitt Intel Core i9-13900H (9094 - 15410, n=26) | |
| MSI CreatorPro Z16P B12UKST | |
| Schenker VISION 16 Pro (M23) | |
| Lenovo ThinkPad X1 Extreme G5-21DE003RGE | |
| Lenovo ThinkPad P1 G6-21FV000DGE | |
| Samsung Galaxy Book3 Ultra 16, i9-13900H RTX 4070 | |
| Geekbench 5.5 / Single-Core | |
| Genomsnitt av klass Workstation (1783 - 2183, n=23, senaste 2 åren) | |
| Dell Precision 5000 5680 | |
| Lenovo ThinkPad P1 G6-21FV000DGE | |
| Genomsnitt Intel Core i9-13900H (1140 - 2043, n=26) | |
| Schenker VISION 16 Pro (M23) | |
| HP ZBook Studio 16 G9 62U04EA | |
| Lenovo ThinkPad X1 Extreme G5-21DE003RGE | |
| MSI CreatorPro Z16P B12UKST | |
| Samsung Galaxy Book3 Ultra 16, i9-13900H RTX 4070 | |
| HWBOT x265 Benchmark v2.2 / 4k Preset | |
| Genomsnitt av klass Workstation (17.8 - 40.5, n=23, senaste 2 åren) | |
| Dell Precision 5000 5680 | |
| HP ZBook Studio 16 G9 62U04EA | |
| MSI CreatorPro Z16P B12UKST | |
| Lenovo ThinkPad P1 G6-21FV000DGE | |
| Genomsnitt Intel Core i9-13900H (14.1 - 22.3, n=25) | |
| Lenovo ThinkPad X1 Extreme G5-21DE003RGE | |
| Schenker VISION 16 Pro (M23) | |
| Samsung Galaxy Book3 Ultra 16, i9-13900H RTX 4070 | |
| LibreOffice / 20 Documents To PDF | |
| Samsung Galaxy Book3 Ultra 16, i9-13900H RTX 4070 | |
| Genomsnitt av klass Workstation (37.1 - 74.7, n=23, senaste 2 åren) | |
| Schenker VISION 16 Pro (M23) | |
| Genomsnitt Intel Core i9-13900H (34.4 - 82.8, n=25) | |
| Lenovo ThinkPad P1 G6-21FV000DGE | |
| HP ZBook Studio 16 G9 62U04EA | |
| Lenovo ThinkPad X1 Extreme G5-21DE003RGE | |
| Dell Precision 5000 5680 | |
| MSI CreatorPro Z16P B12UKST | |
| R Benchmark 2.5 / Overall mean | |
| Samsung Galaxy Book3 Ultra 16, i9-13900H RTX 4070 | |
| Lenovo ThinkPad X1 Extreme G5-21DE003RGE | |
| MSI CreatorPro Z16P B12UKST | |
| Genomsnitt Intel Core i9-13900H (0.4052 - 0.723, n=25) | |
| HP ZBook Studio 16 G9 62U04EA | |
| Genomsnitt av klass Workstation (0.3825 - 0.603, n=23, senaste 2 åren) | |
| Schenker VISION 16 Pro (M23) | |
| Lenovo ThinkPad P1 G6-21FV000DGE | |
| Dell Precision 5000 5680 | |
* ... mindre är bättre
AIDA64: FP32 Ray-Trace | FPU Julia | CPU SHA3 | CPU Queen | FPU SinJulia | FPU Mandel | CPU AES | CPU ZLib | FP64 Ray-Trace | CPU PhotoWorxx
| Performance rating | |
| Genomsnitt av klass Workstation | |
| MSI CreatorPro Z16P B12UKST | |
| Dell Precision 5000 5680 | |
| Lenovo ThinkPad P1 G6-21FV000DGE | |
| Genomsnitt Intel Core i9-13900H | |
| HP ZBook Studio 16 G9 62U04EA | |
| Lenovo ThinkPad X1 Extreme G5-21DE003RGE | |
| Schenker VISION 16 Pro (M23) | |
| Samsung Galaxy Book3 Ultra 16, i9-13900H RTX 4070 | |
| AIDA64 / FP32 Ray-Trace | |
| Genomsnitt av klass Workstation (16730 - 61611, n=23, senaste 2 åren) | |
| Lenovo ThinkPad P1 G6-21FV000DGE | |
| Lenovo ThinkPad X1 Extreme G5-21DE003RGE | |
| Dell Precision 5000 5680 | |
| HP ZBook Studio 16 G9 62U04EA | |
| Genomsnitt Intel Core i9-13900H (6788 - 19557, n=25) | |
| Samsung Galaxy Book3 Ultra 16, i9-13900H RTX 4070 | |
| MSI CreatorPro Z16P B12UKST | |
| Schenker VISION 16 Pro (M23) | |
| AIDA64 / FPU Julia | |
| Genomsnitt av klass Workstation (89597 - 186971, n=23, senaste 2 åren) | |
| Lenovo ThinkPad P1 G6-21FV000DGE | |
| Lenovo ThinkPad X1 Extreme G5-21DE003RGE | |
| HP ZBook Studio 16 G9 62U04EA | |
| Dell Precision 5000 5680 | |
| Genomsnitt Intel Core i9-13900H (22551 - 95579, n=25) | |
| MSI CreatorPro Z16P B12UKST | |
| Schenker VISION 16 Pro (M23) | |
| Samsung Galaxy Book3 Ultra 16, i9-13900H RTX 4070 | |
| AIDA64 / CPU SHA3 | |
| Genomsnitt av klass Workstation (4178 - 8975, n=23, senaste 2 åren) | |
| Lenovo ThinkPad X1 Extreme G5-21DE003RGE | |
| Lenovo ThinkPad P1 G6-21FV000DGE | |
| HP ZBook Studio 16 G9 62U04EA | |
| MSI CreatorPro Z16P B12UKST | |
| Genomsnitt Intel Core i9-13900H (2491 - 4270, n=25) | |
| Dell Precision 5000 5680 | |
| Samsung Galaxy Book3 Ultra 16, i9-13900H RTX 4070 | |
| Schenker VISION 16 Pro (M23) | |
| AIDA64 / CPU Queen | |
| Dell Precision 5000 5680 | |
| Lenovo ThinkPad P1 G6-21FV000DGE | |
| Genomsnitt av klass Workstation (60778 - 144411, n=23, senaste 2 åren) | |
| HP ZBook Studio 16 G9 62U04EA | |
| Genomsnitt Intel Core i9-13900H (65121 - 120936, n=25) | |
| Lenovo ThinkPad X1 Extreme G5-21DE003RGE | |
| MSI CreatorPro Z16P B12UKST | |
| Schenker VISION 16 Pro (M23) | |
| Samsung Galaxy Book3 Ultra 16, i9-13900H RTX 4070 | |
| AIDA64 / FPU SinJulia | |
| Genomsnitt av klass Workstation (8165 - 29343, n=23, senaste 2 åren) | |
| Lenovo ThinkPad P1 G6-21FV000DGE | |
| Dell Precision 5000 5680 | |
| Lenovo ThinkPad X1 Extreme G5-21DE003RGE | |
| Genomsnitt Intel Core i9-13900H (6108 - 11631, n=25) | |
| HP ZBook Studio 16 G9 62U04EA | |
| MSI CreatorPro Z16P B12UKST | |
| Schenker VISION 16 Pro (M23) | |
| Samsung Galaxy Book3 Ultra 16, i9-13900H RTX 4070 | |
| AIDA64 / FPU Mandel | |
| Genomsnitt av klass Workstation (44497 - 98153, n=23, senaste 2 åren) | |
| Lenovo ThinkPad P1 G6-21FV000DGE | |
| Lenovo ThinkPad X1 Extreme G5-21DE003RGE | |
| Dell Precision 5000 5680 | |
| HP ZBook Studio 16 G9 62U04EA | |
| Genomsnitt Intel Core i9-13900H (11283 - 48474, n=25) | |
| Samsung Galaxy Book3 Ultra 16, i9-13900H RTX 4070 | |
| MSI CreatorPro Z16P B12UKST | |
| Schenker VISION 16 Pro (M23) | |
| AIDA64 / CPU AES | |
| MSI CreatorPro Z16P B12UKST | |
| Genomsnitt av klass Workstation (73133 - 187841, n=23, senaste 2 åren) | |
| Genomsnitt Intel Core i9-13900H (3691 - 149377, n=25) | |
| Lenovo ThinkPad X1 Extreme G5-21DE003RGE | |
| Lenovo ThinkPad P1 G6-21FV000DGE | |
| HP ZBook Studio 16 G9 62U04EA | |
| Dell Precision 5000 5680 | |
| Schenker VISION 16 Pro (M23) | |
| Samsung Galaxy Book3 Ultra 16, i9-13900H RTX 4070 | |
| AIDA64 / CPU ZLib | |
| Genomsnitt av klass Workstation (929 - 2148, n=23, senaste 2 åren) | |
| Lenovo ThinkPad P1 G6-21FV000DGE | |
| Lenovo ThinkPad X1 Extreme G5-21DE003RGE | |
| HP ZBook Studio 16 G9 62U04EA | |
| Genomsnitt Intel Core i9-13900H (789 - 1254, n=25) | |
| MSI CreatorPro Z16P B12UKST | |
| Dell Precision 5000 5680 | |
| Samsung Galaxy Book3 Ultra 16, i9-13900H RTX 4070 | |
| Schenker VISION 16 Pro (M23) | |
| AIDA64 / FP64 Ray-Trace | |
| Genomsnitt av klass Workstation (8545 - 32891, n=23, senaste 2 åren) | |
| Lenovo ThinkPad P1 G6-21FV000DGE | |
| Lenovo ThinkPad X1 Extreme G5-21DE003RGE | |
| HP ZBook Studio 16 G9 62U04EA | |
| Dell Precision 5000 5680 | |
| Genomsnitt Intel Core i9-13900H (3655 - 10716, n=25) | |
| MSI CreatorPro Z16P B12UKST | |
| Schenker VISION 16 Pro (M23) | |
| Samsung Galaxy Book3 Ultra 16, i9-13900H RTX 4070 | |
| AIDA64 / CPU PhotoWorxx | |
| Genomsnitt av klass Workstation (37151 - 93684, n=23, senaste 2 åren) | |
| Samsung Galaxy Book3 Ultra 16, i9-13900H RTX 4070 | |
| Dell Precision 5000 5680 | |
| Schenker VISION 16 Pro (M23) | |
| MSI CreatorPro Z16P B12UKST | |
| Genomsnitt Intel Core i9-13900H (10871 - 50488, n=25) | |
| HP ZBook Studio 16 G9 62U04EA | |
| Lenovo ThinkPad P1 G6-21FV000DGE | |
| Lenovo ThinkPad X1 Extreme G5-21DE003RGE | |
Systemets prestanda
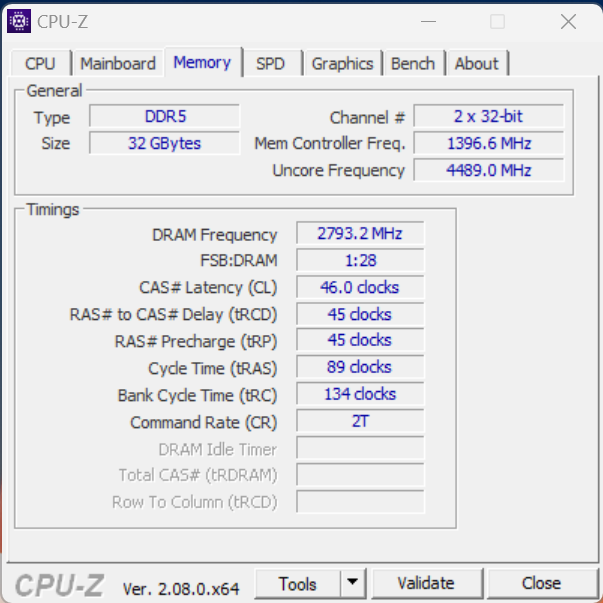
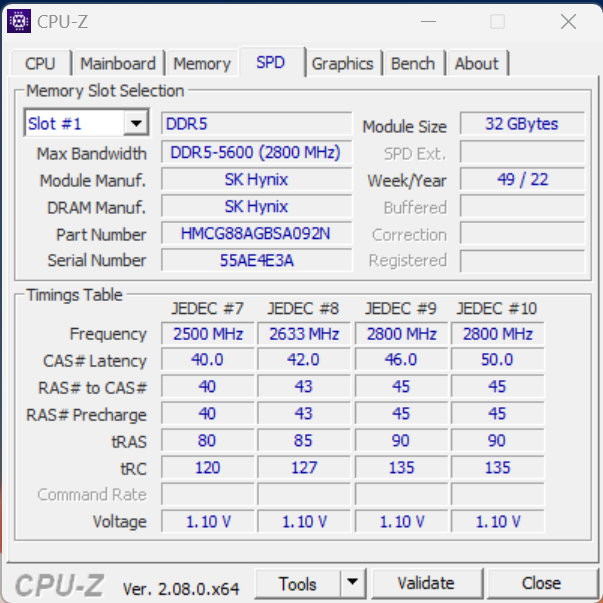
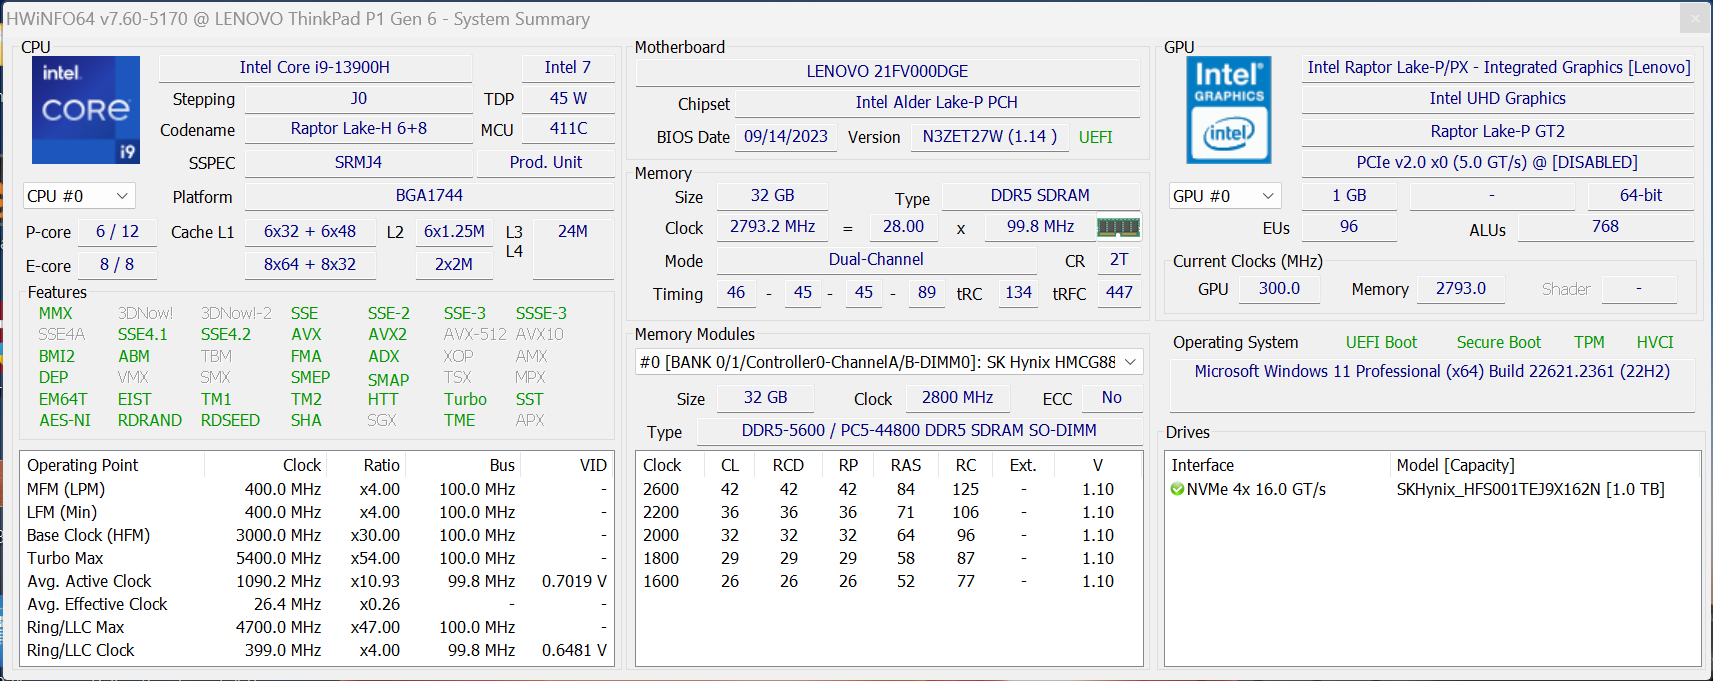
Systemprestandan hos ThinkPad P1 Gen 6 är enastående, ett faktum som stöds av både syntetiska riktmärken och vår subjektiva prestandautvärdering. Som väntat är RAM-värdena något lägre på grund av minnets enkelkanaliga konfiguration, jämfört med modeller med dubbelkanaligt RAM-minne. Under hela testet förekom inga problem med frysning eller stuttering.
CrossMark: Overall | Productivity | Creativity | Responsiveness
| PCMark 10 / Score | |
| Dell Precision 5000 5680 | |
| Genomsnitt av klass Workstation (6563 - 10409, n=19, senaste 2 åren) | |
| Lenovo ThinkPad P1 G6-21FV000DGE | |
| Genomsnitt Intel Core i9-13900H, NVIDIA RTX 2000 Ada Generation Laptop (n=1) | |
| Schenker VISION 16 Pro (M23) | |
| Lenovo ThinkPad X1 Extreme G5-21DE003RGE | |
| MSI CreatorPro Z16P B12UKST | |
| HP ZBook Studio 16 G9 62U04EA | |
| Samsung Galaxy Book3 Ultra 16, i9-13900H RTX 4070 | |
| PCMark 10 / Essentials | |
| Dell Precision 5000 5680 | |
| Lenovo ThinkPad P1 G6-21FV000DGE | |
| Genomsnitt Intel Core i9-13900H, NVIDIA RTX 2000 Ada Generation Laptop (n=1) | |
| Schenker VISION 16 Pro (M23) | |
| MSI CreatorPro Z16P B12UKST | |
| Lenovo ThinkPad X1 Extreme G5-21DE003RGE | |
| Genomsnitt av klass Workstation (9622 - 11157, n=19, senaste 2 åren) | |
| HP ZBook Studio 16 G9 62U04EA | |
| Samsung Galaxy Book3 Ultra 16, i9-13900H RTX 4070 | |
| PCMark 10 / Productivity | |
| Genomsnitt av klass Workstation (8789 - 20616, n=19, senaste 2 åren) | |
| Dell Precision 5000 5680 | |
| Lenovo ThinkPad P1 G6-21FV000DGE | |
| Genomsnitt Intel Core i9-13900H, NVIDIA RTX 2000 Ada Generation Laptop (n=1) | |
| Schenker VISION 16 Pro (M23) | |
| Lenovo ThinkPad X1 Extreme G5-21DE003RGE | |
| MSI CreatorPro Z16P B12UKST | |
| Samsung Galaxy Book3 Ultra 16, i9-13900H RTX 4070 | |
| HP ZBook Studio 16 G9 62U04EA | |
| PCMark 10 / Digital Content Creation | |
| Dell Precision 5000 5680 | |
| Genomsnitt av klass Workstation (8108 - 15631, n=19, senaste 2 åren) | |
| Schenker VISION 16 Pro (M23) | |
| Lenovo ThinkPad P1 G6-21FV000DGE | |
| Genomsnitt Intel Core i9-13900H, NVIDIA RTX 2000 Ada Generation Laptop (n=1) | |
| Lenovo ThinkPad X1 Extreme G5-21DE003RGE | |
| MSI CreatorPro Z16P B12UKST | |
| HP ZBook Studio 16 G9 62U04EA | |
| Samsung Galaxy Book3 Ultra 16, i9-13900H RTX 4070 | |
| CrossMark / Overall | |
| MSI CreatorPro Z16P B12UKST | |
| Genomsnitt av klass Workstation (1307 - 2267, n=22, senaste 2 åren) | |
| Dell Precision 5000 5680 | |
| Schenker VISION 16 Pro (M23) | |
| Lenovo ThinkPad P1 G6-21FV000DGE | |
| Genomsnitt Intel Core i9-13900H, NVIDIA RTX 2000 Ada Generation Laptop (n=1) | |
| HP ZBook Studio 16 G9 62U04EA | |
| Lenovo ThinkPad X1 Extreme G5-21DE003RGE | |
| Samsung Galaxy Book3 Ultra 16, i9-13900H RTX 4070 | |
| CrossMark / Productivity | |
| MSI CreatorPro Z16P B12UKST | |
| Schenker VISION 16 Pro (M23) | |
| Dell Precision 5000 5680 | |
| Lenovo ThinkPad P1 G6-21FV000DGE | |
| Genomsnitt Intel Core i9-13900H, NVIDIA RTX 2000 Ada Generation Laptop (n=1) | |
| Genomsnitt av klass Workstation (1130 - 2122, n=22, senaste 2 åren) | |
| HP ZBook Studio 16 G9 62U04EA | |
| Lenovo ThinkPad X1 Extreme G5-21DE003RGE | |
| Samsung Galaxy Book3 Ultra 16, i9-13900H RTX 4070 | |
| CrossMark / Creativity | |
| Genomsnitt av klass Workstation (1657 - 2725, n=22, senaste 2 åren) | |
| Dell Precision 5000 5680 | |
| HP ZBook Studio 16 G9 62U04EA | |
| MSI CreatorPro Z16P B12UKST | |
| Lenovo ThinkPad P1 G6-21FV000DGE | |
| Genomsnitt Intel Core i9-13900H, NVIDIA RTX 2000 Ada Generation Laptop (n=1) | |
| Schenker VISION 16 Pro (M23) | |
| Lenovo ThinkPad X1 Extreme G5-21DE003RGE | |
| Samsung Galaxy Book3 Ultra 16, i9-13900H RTX 4070 | |
| CrossMark / Responsiveness | |
| MSI CreatorPro Z16P B12UKST | |
| Schenker VISION 16 Pro (M23) | |
| Genomsnitt av klass Workstation (993 - 2096, n=22, senaste 2 åren) | |
| Lenovo ThinkPad P1 G6-21FV000DGE | |
| Genomsnitt Intel Core i9-13900H, NVIDIA RTX 2000 Ada Generation Laptop (n=1) | |
| Dell Precision 5000 5680 | |
| HP ZBook Studio 16 G9 62U04EA | |
| Lenovo ThinkPad X1 Extreme G5-21DE003RGE | |
| Samsung Galaxy Book3 Ultra 16, i9-13900H RTX 4070 | |
| PCMark 10 Score | 7522 poäng | |
Hjälp | ||
| AIDA64 / Memory Copy | |
| Genomsnitt av klass Workstation (56003 - 164795, n=23, senaste 2 åren) | |
| Dell Precision 5000 5680 | |
| Samsung Galaxy Book3 Ultra 16, i9-13900H RTX 4070 | |
| Schenker VISION 16 Pro (M23) | |
| MSI CreatorPro Z16P B12UKST | |
| HP ZBook Studio 16 G9 62U04EA | |
| Genomsnitt Intel Core i9-13900H (37448 - 74486, n=25) | |
| Lenovo ThinkPad P1 G6-21FV000DGE | |
| Lenovo ThinkPad X1 Extreme G5-21DE003RGE | |
| AIDA64 / Memory Read | |
| Genomsnitt av klass Workstation (55795 - 121563, n=23, senaste 2 åren) | |
| Schenker VISION 16 Pro (M23) | |
| Samsung Galaxy Book3 Ultra 16, i9-13900H RTX 4070 | |
| Dell Precision 5000 5680 | |
| MSI CreatorPro Z16P B12UKST | |
| HP ZBook Studio 16 G9 62U04EA | |
| Genomsnitt Intel Core i9-13900H (41599 - 75433, n=25) | |
| Lenovo ThinkPad P1 G6-21FV000DGE | |
| Lenovo ThinkPad X1 Extreme G5-21DE003RGE | |
| AIDA64 / Memory Write | |
| Samsung Galaxy Book3 Ultra 16, i9-13900H RTX 4070 | |
| Genomsnitt av klass Workstation (55663 - 214520, n=23, senaste 2 åren) | |
| Dell Precision 5000 5680 | |
| Schenker VISION 16 Pro (M23) | |
| MSI CreatorPro Z16P B12UKST | |
| Genomsnitt Intel Core i9-13900H (36152 - 88505, n=25) | |
| HP ZBook Studio 16 G9 62U04EA | |
| Lenovo ThinkPad P1 G6-21FV000DGE | |
| Lenovo ThinkPad X1 Extreme G5-21DE003RGE | |
| AIDA64 / Memory Latency | |
| Genomsnitt av klass Workstation (84.5 - 165.2, n=23, senaste 2 åren) | |
| Samsung Galaxy Book3 Ultra 16, i9-13900H RTX 4070 | |
| MSI CreatorPro Z16P B12UKST | |
| Dell Precision 5000 5680 | |
| HP ZBook Studio 16 G9 62U04EA | |
| Genomsnitt Intel Core i9-13900H (75.8 - 102.3, n=25) | |
| Lenovo ThinkPad X1 Extreme G5-21DE003RGE | |
| Schenker VISION 16 Pro (M23) | |
| Lenovo ThinkPad P1 G6-21FV000DGE | |
* ... mindre är bättre
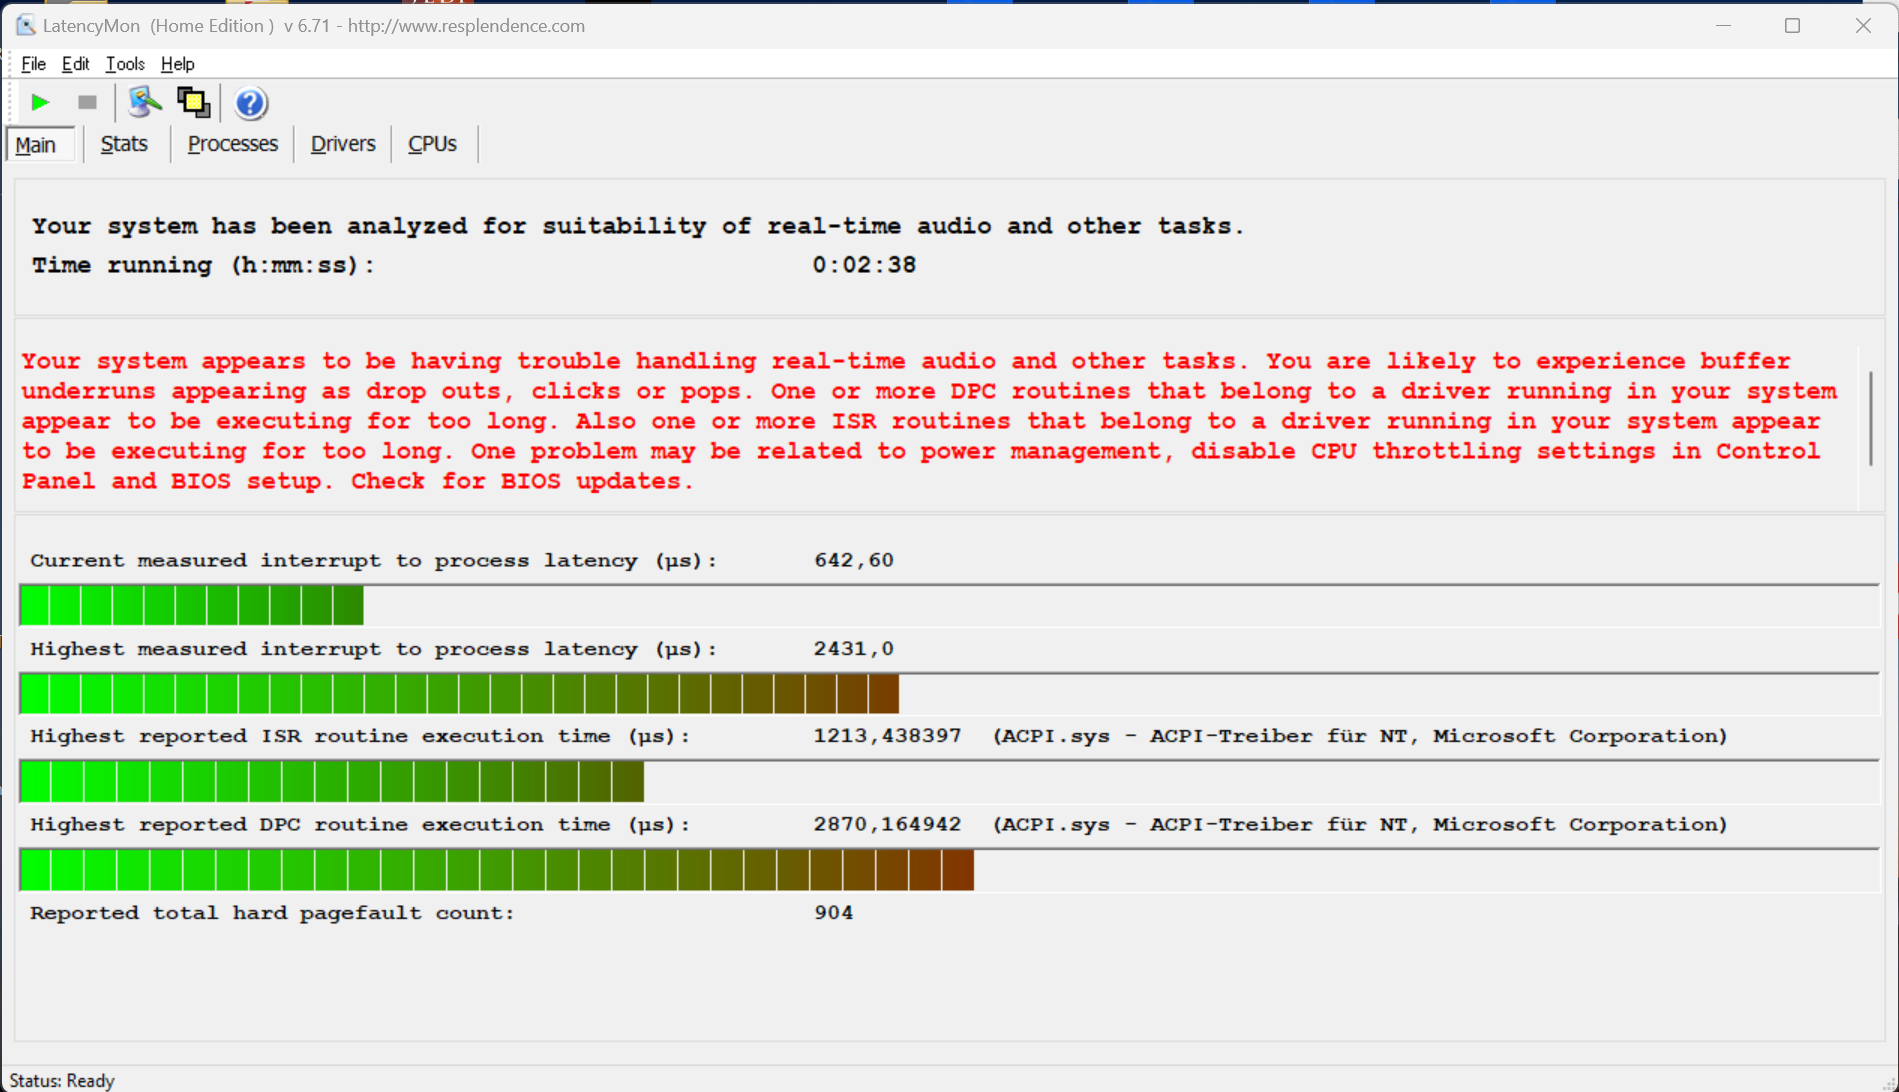
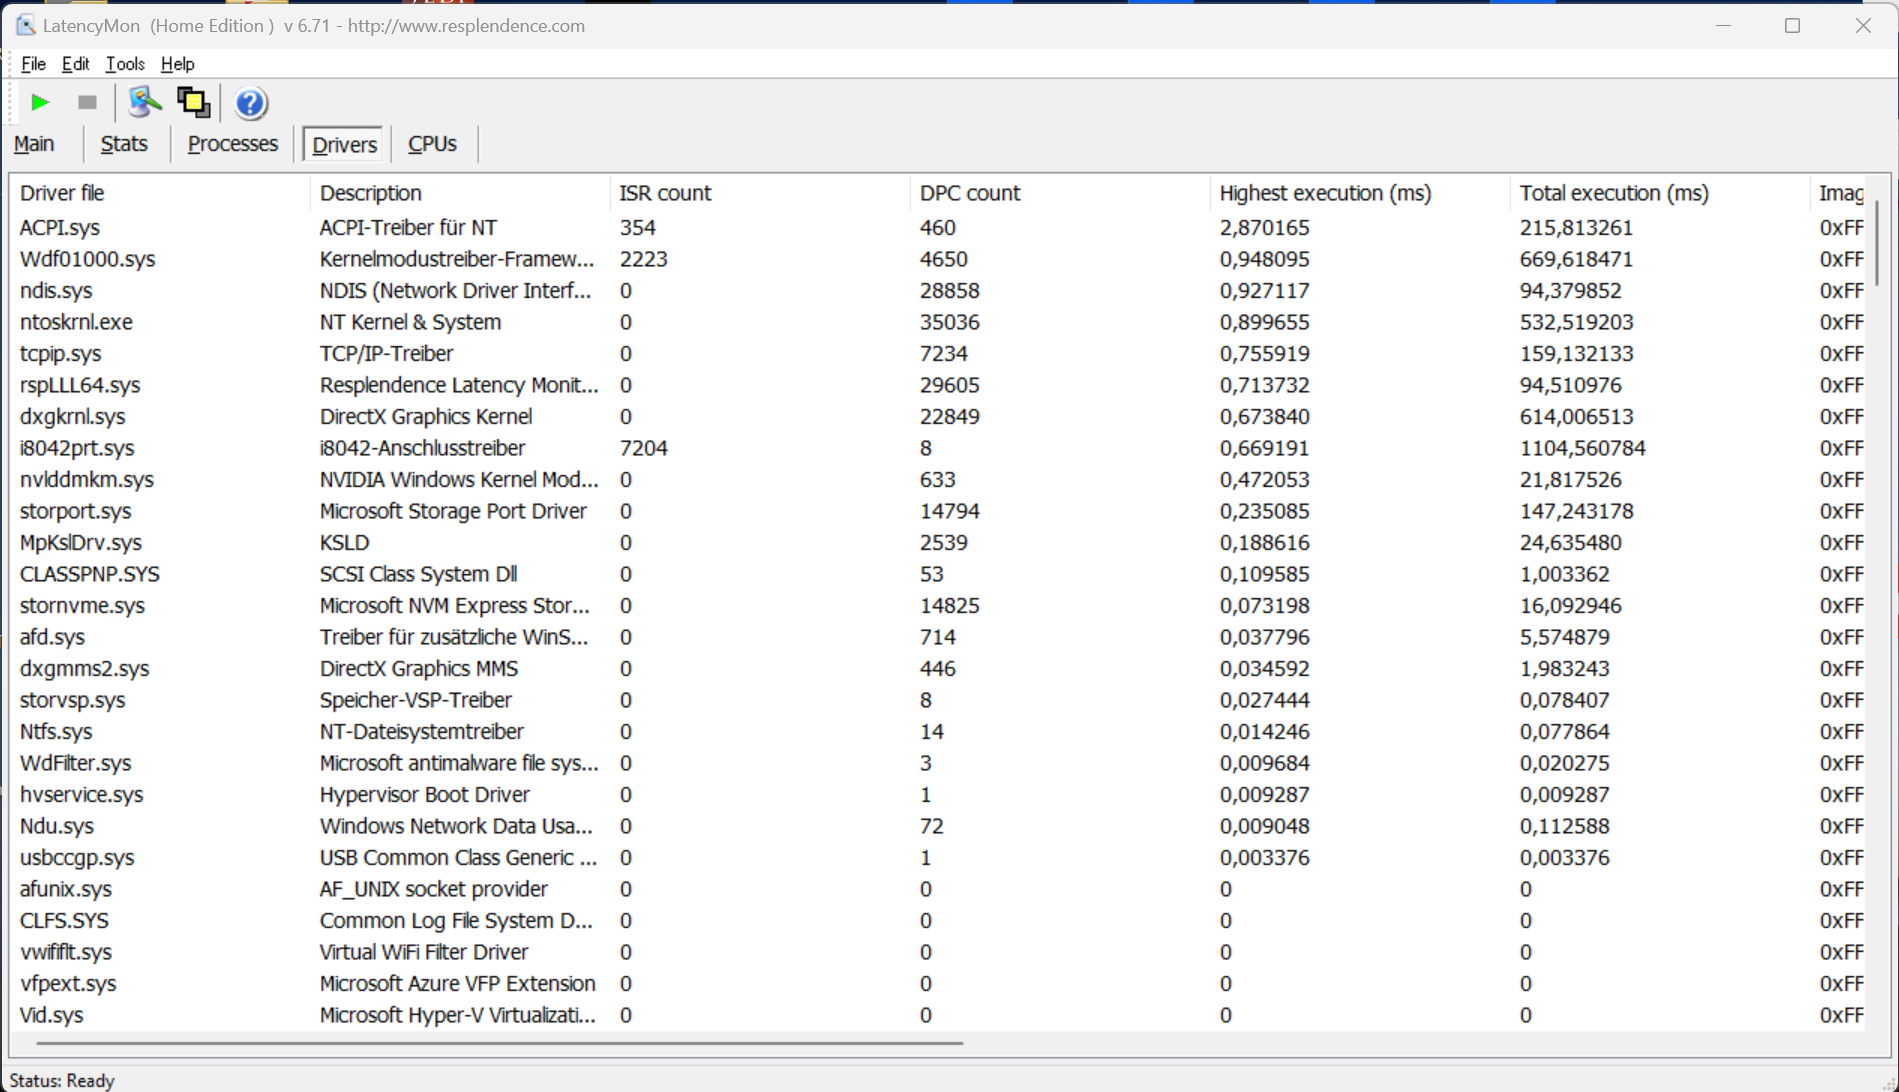
DPC-fördröjning
Vår testenhet visade svårigheter med ljudappar i realtid med den aktuella BIOS-versionen (1.14) i vårt standardiserade latens-test, som inkluderade webbsurfning, 4K YouTube-streaming och CPU-belastning. Under videouppspelning förlorades dock inga bildrutor.
| DPC Latencies / LatencyMon - interrupt to process latency (max), Web, Youtube, Prime95 | |
| Samsung Galaxy Book3 Ultra 16, i9-13900H RTX 4070 | |
| Lenovo ThinkPad P1 G6-21FV000DGE | |
| Dell Precision 5000 5680 | |
| Lenovo ThinkPad X1 Extreme G5-21DE003RGE | |
| HP ZBook Studio 16 G9 62U04EA | |
| Schenker VISION 16 Pro (M23) | |
| MSI CreatorPro Z16P B12UKST | |
* ... mindre är bättre
Lagringsenheter
Två snabba PCIe 4.0-kortplatser finns tillgängliga i P1 G6-konfigurationer med konventionell kylning. Vår testenhet är utrustad med 1 TB SK Hynix PC711, vilket ger 897 GB ledigt RAM-minne efter den första konfigurationen. PCIe 4.0 SSD har exceptionella överföringshastigheter och når över 7 GB/s vid topprestanda. Lenovo har också lagt till en metallplatta till SSD-enheten för att ge konsekvent prestanda även vid konstant användning. Det finns fler SSD-riktmärken tillgängliga här.

* ... mindre är bättre
Continuous power read: DiskSpd Read Loop, Queue Depth 8
Grafikkort - RTX 2000 Ada
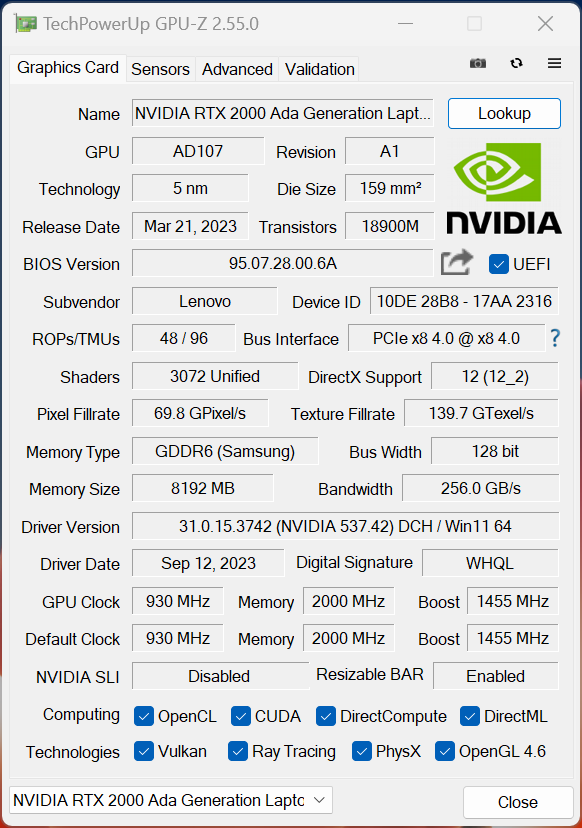
Lenovo inkluderar nu Nvidias senaste Ada Lovelace GPU:er. Förutom GeForce -modellerna RTX 4060 Bärbar dator, RTX 4080 Bärbar datoroch RTX 4090 Bärbar dator (alla med en 80-wattsvariant, enligt specifikationsbladet), och erbjuder även nya professionella modeller som RTX 1000 Ada (65 watt), RTX 2000 Ada (65 watt), RTX 3500 Ada, RTX 4000 Adaoch flaggskeppet RTX 5000 Ada (80 watt TGP).
Överraskande nog är RTX 2000 Ada i vårt granskningsprov baserat på GeForce RTX 4060 bärbar dator, och Lenovo har valt konventionell kylning. Som ett resultat fungerar det på "bara" 65 watt (inklusive 15 watt Dynamic Boost). I 3DMark-tester överträffar RTX 2000 Ada GeForce RTX 4060 laptop i Asus ROG Flow Z13 med några procentenheter, där GPU:n också får förbruka 65 watt (inklusive 15 watt Dynamic Boost). När det gäller ren prestanda representerar GPU:n ett betydande framsteg och överträffar den äldre RTX A3000 och den bärbara RTX 3060 i den tidigare ThinkPad X1 Extreme. Dessutom är fördelen jämfört med den gamla RTX A2000 nästan 70%.
I professionella benchmarks överträffar RTX 2000 Ada konsekvent den äldre
RTX A3000och den lämnar ofta 50-wattsversionen av RTX 3000 Ada bakom sig i den mer kompakta Dell Precision 5480.GPU:ns konsekventa prestanda även under långvarig belastning är ett stort plus. När RTX 2000 Ada drivs av ett batteri är den begränsad till en maximal användning på 45 watt, vilket resulterar i cirka 15% sämre grafikprestanda (7.107 poäng @ Time Spy Graphics). Fler GPU-riktmärken listas här.
| 3DMark 06 Standard Score | 53707 poäng | |
| 3DMark Vantage P Result | 37844 poäng | |
| 3DMark 11 Performance | 27558 poäng | |
| 3DMark Fire Strike Score | 19987 poäng | |
| 3DMark Time Spy Score | 8849 poäng | |
Hjälp | ||
| Geekbench 6.7 - GPU OpenCL | |
| HP ZBook Fury 16 G10 | |
| Dell Precision 5000 5680 | |
| Dell Precision 5480 | |
| Lenovo ThinkPad P1 G6-21FV000DGE | |
| Blender / v3.3 Classroom OPTIX/RTX | |
| HP ZBook Studio 16 G9 62U04EA | |
| Lenovo ThinkPad X1 Extreme G5-21DE003RGE | |
| MSI CreatorPro Z16P B12UKST | |
| Lenovo ThinkPad P1 G6-21FV000DGE | |
| Genomsnitt NVIDIA RTX 2000 Ada Generation Laptop (25 - 31, n=4) | |
| Samsung Galaxy Book3 Ultra 16, i9-13900H RTX 4070 | |
| Schenker VISION 16 Pro (M23) | |
| Genomsnitt av klass Workstation (10 - 43, n=17, senaste 2 åren) | |
| Dell Precision 5000 5680 | |
| Blender / v3.3 Classroom CUDA | |
| HP ZBook Studio 16 G9 62U04EA | |
| Genomsnitt NVIDIA RTX 2000 Ada Generation Laptop (51 - 155, n=4) | |
| Lenovo ThinkPad X1 Extreme G5-21DE003RGE | |
| MSI CreatorPro Z16P B12UKST | |
| Lenovo ThinkPad P1 G6-21FV000DGE | |
| Samsung Galaxy Book3 Ultra 16, i9-13900H RTX 4070 | |
| Genomsnitt av klass Workstation (16 - 74, n=17, senaste 2 åren) | |
| Schenker VISION 16 Pro (M23) | |
| Dell Precision 5000 5680 | |
| Blender / v3.3 Classroom CPU | |
| Samsung Galaxy Book3 Ultra 16, i9-13900H RTX 4070 | |
| Schenker VISION 16 Pro (M23) | |
| Dell Precision 5000 5680 | |
| MSI CreatorPro Z16P B12UKST | |
| HP ZBook Studio 16 G9 62U04EA | |
| Lenovo ThinkPad P1 G6-21FV000DGE | |
| Lenovo ThinkPad X1 Extreme G5-21DE003RGE | |
| Genomsnitt NVIDIA RTX 2000 Ada Generation Laptop (291 - 347, n=4) | |
| Genomsnitt av klass Workstation (148 - 364, n=23, senaste 2 åren) | |
* ... mindre är bättre
Spelprestanda
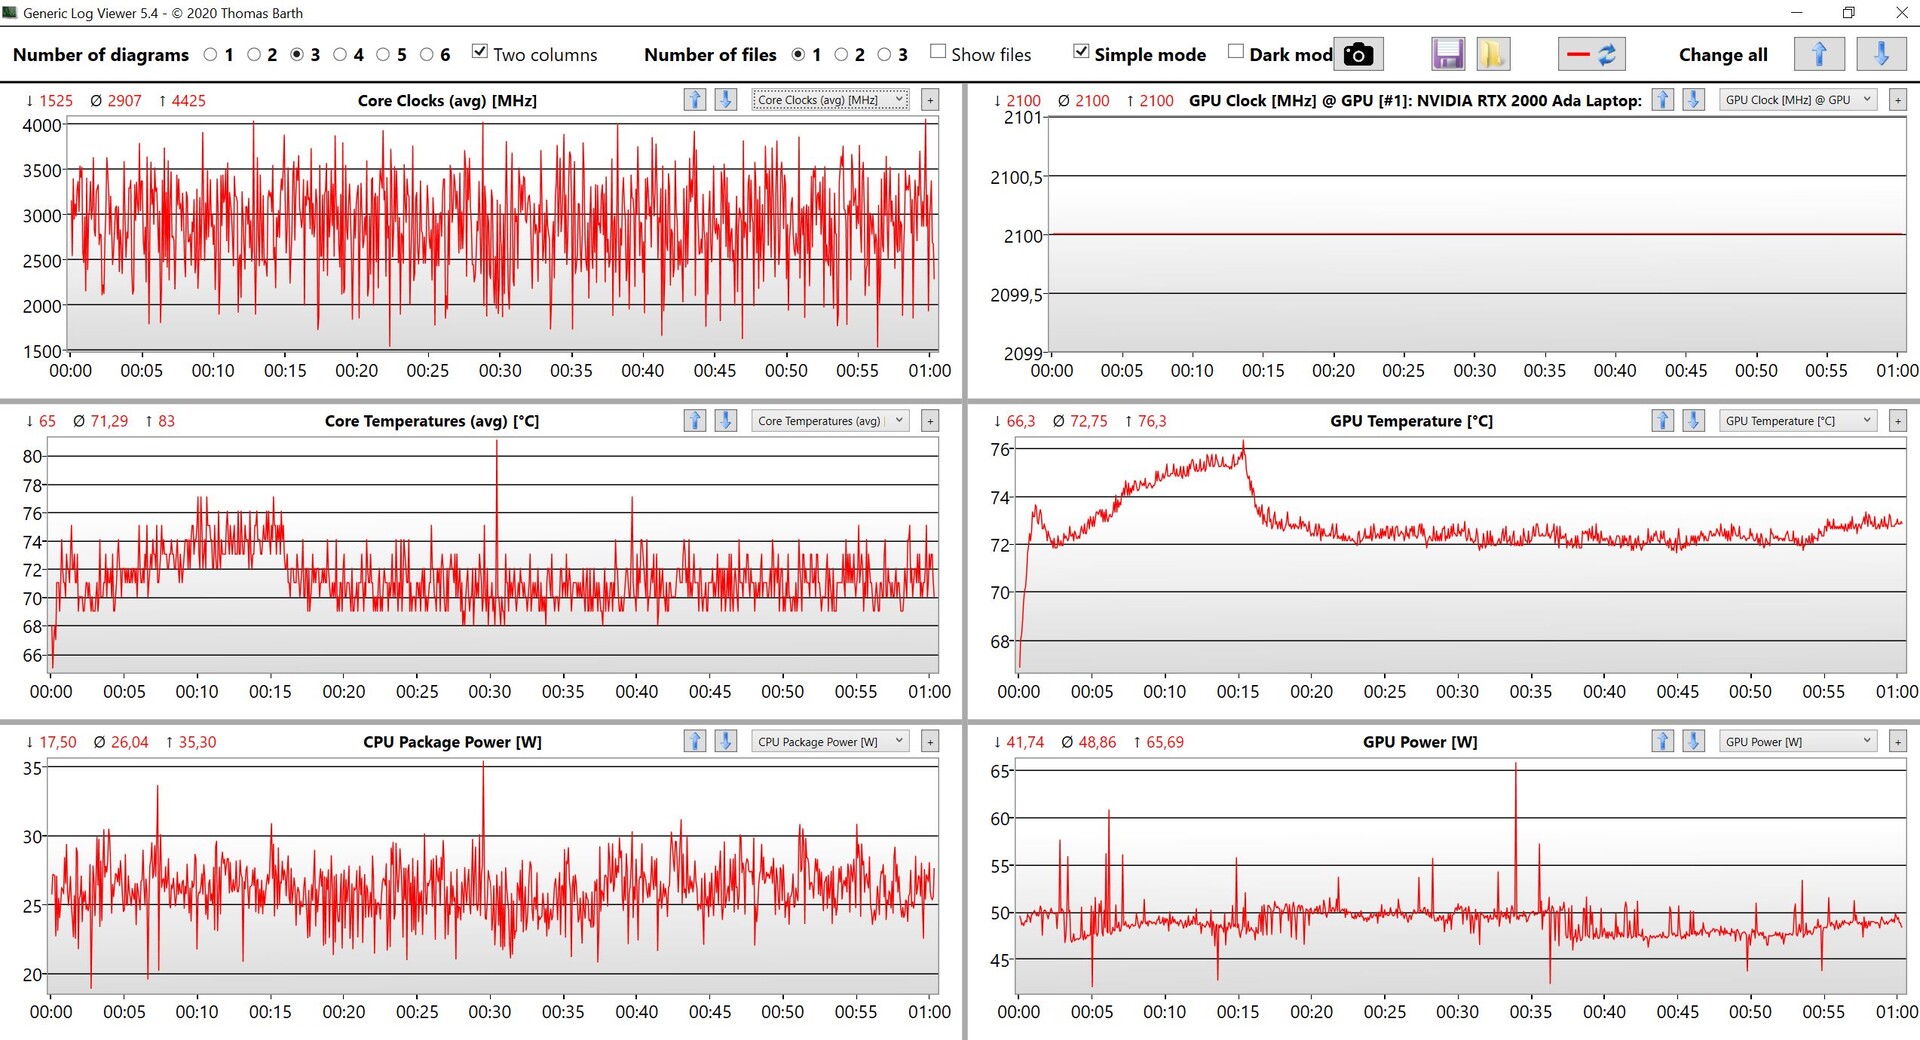
Vi stötte inte på några problem med den professionella drivrutinen under våra spelbenchmarks, och prestandan är i linje med den hos en GeForce RTX 4060 bärbar dator med jämförbara TGP-hastigheter. Följaktligen kan aktuella spel som Star Wars Jedi Survivor, Assassins' Creed Mirage eller Cyberpunk spelas smidigt med maximala inställningar och 1080p-upplösning. För inbyggd WQHD-upplösning kan användare behöva använda uppskalningsmetoder som Nvidias DLSS. Det är viktigt att notera att prestandan förblir stabil även under längre spelsessioner.
| Far Cry 6 | |
| 1920x1080 High Graphics Quality AA:T | |
| Lenovo ThinkPad P1 G6-21FV000DGE | |
| Genomsnitt NVIDIA RTX 2000 Ada Generation Laptop (n=1) | |
| 1920x1080 Ultra Graphics Quality + HD Textures AA:T | |
| Lenovo ThinkPad P1 G6-21FV000DGE | |
| Genomsnitt NVIDIA RTX 2000 Ada Generation Laptop (n=1) | |
| Star Wars Jedi Survivor | |
| 1920x1080 High Preset | |
| Schenker VISION 16 Pro (M23) | |
| Lenovo ThinkPad P1 G6-21FV000DGE | |
| Genomsnitt NVIDIA RTX 2000 Ada Generation Laptop (n=1) | |
| 1920x1080 Epic Preset | |
| Schenker VISION 16 Pro (M23) | |
| Lenovo ThinkPad P1 G6-21FV000DGE | |
| Genomsnitt NVIDIA RTX 2000 Ada Generation Laptop (n=1) | |
| Hogwarts Legacy | |
| 1920x1080 High Preset AA:High T | |
| Lenovo ThinkPad P1 G6-21FV000DGE | |
| Genomsnitt NVIDIA RTX 2000 Ada Generation Laptop (n=1) | |
| Samsung Galaxy Book3 Ultra 16, i9-13900H RTX 4070 | |
| 1920x1080 Ultra Preset AA:High T | |
| Lenovo ThinkPad P1 G6-21FV000DGE | |
| Genomsnitt NVIDIA RTX 2000 Ada Generation Laptop (n=1) | |
| Samsung Galaxy Book3 Ultra 16, i9-13900H RTX 4070 | |
| F1 23 | |
| 1920x1080 High Preset AA:T AF:16x | |
| Genomsnitt NVIDIA RTX 2000 Ada Generation Laptop (142.1 - 147, n=2) | |
| Lenovo ThinkPad P1 G6-21FV000DGE | |
| 1920x1080 Ultra High Preset AA:T AF:16x | |
| Genomsnitt NVIDIA RTX 2000 Ada Generation Laptop (44.4 - 49.2, n=2) | |
| Lenovo ThinkPad P1 G6-21FV000DGE | |
Witcher 3 FPS chart
| låg | med. | hög | ultra | QHD | |
|---|---|---|---|---|---|
| GTA V (2015) | 173 | 101.6 | 74.6 | ||
| The Witcher 3 (2015) | 390 | 261 | 164 | 79.6 | 65 |
| Dota 2 Reborn (2015) | 178.4 | 153.1 | 143.9 | 133.4 | |
| Final Fantasy XV Benchmark (2018) | 111.2 | 83.5 | 63.7 | ||
| X-Plane 11.11 (2018) | 149.2 | 131.6 | 108.9 | ||
| Far Cry 5 (2018) | 175 | 130 | 120 | 113 | 81 |
| Strange Brigade (2018) | 459 | 228 | 182.5 | 158.2 | 107.5 |
| F1 2021 (2021) | 353 | 230 | 186.6 | 99.2 | 74.9 |
| Far Cry 6 (2021) | 157 | 121 | 104 | 87 | 63 |
| Cyberpunk 2077 1.6 (2022) | 101 | 81 | 72 | 65 | 41 |
| F1 22 (2022) | 213 | 193.2 | 138.5 | 52.8 | 34.2 |
| Hogwarts Legacy (2023) | 101 | 80 | 64 | 53 | 38 |
| Star Wars Jedi Survivor (2023) | 49 | 45 | 42 | 40 | 27 |
| F1 23 (2023) | 202 | 192.1 | 142.1 | 44.4 | 27.6 |
| Assassin's Creed Mirage (2023) | 113 | 103 | 97 | 76 | 58 |
Utsläpp - ThinkPad är ofta tyst vid daglig användning
Buller från systemet
Under grundläggande uppgifter förblir ThinkPads två fläktar ofta helt inaktiva. De hörs bara när processorn eller det dedikerade grafikkortet är aktiverat. Det är värt att notera att när fläktarna aktiveras arbetar de med hög hastighet direkt utan någon gradvis uppbyggnad. I spelscenarier uppmätte vi ljudnivåer från cirka 41-48 dB(A), där 48 dB(A) representerar den maximala fläktvolymen under stresstestning. I de två mer effektiva prestandalägena når ljudnivån maximalt 40,7 dB(A). Noterbart är att inga andra elektroniska ljud upptäcktes i vår testenhet.
Ljudnivå
| Låg belastning |
| 24.5 / 24.5 / 24.5 dB(A) |
| Hög belastning |
| 48 / 48 dB(A) |
 | ||
30 dB tyst 40 dB(A) hörbar 50 dB(A) högt ljud |
||
min: | ||
| Lenovo ThinkPad P1 G6-21FV000DGE RTX 2000 Ada Generation Laptop, i9-13900H, SK Hynix PC711 1TB HFS001TDE9X084N | Dell Precision 5000 5680 RTX 5000 Ada Generation Laptop, i9-13900H, 2x SK hynix PC801 HFS512GEJ9X101N RAID 0 | Samsung Galaxy Book3 Ultra 16, i9-13900H RTX 4070 GeForce RTX 4070 Laptop GPU, i9-13900H, Samsung PM9A1 MZVL21T0HCLR | HP ZBook Studio 16 G9 62U04EA RTX A2000 Laptop GPU, i7-12800H, Micron 3400 1TB MTFDKBA1T0TFH | MSI CreatorPro Z16P B12UKST RTX A3000 Laptop GPU, i7-12700H, Samsung PM9A1 MZVL21T0HCLR | Schenker VISION 16 Pro (M23) GeForce RTX 4070 Laptop GPU, i7-13700H, Samsung 990 Pro 1 TB | Lenovo ThinkPad X1 Extreme G5-21DE003RGE GeForce RTX 3060 Laptop GPU, i7-12700H, Micron 3400 1TB MTFDKBA1T0TFH | |
|---|---|---|---|---|---|---|---|
| Noise | 2% | -4% | -2% | -4% | -13% | 3% | |
| av / miljö * (dB) | 24.5 | 22.8 7% | 25.2 -3% | 24 2% | 24.1 2% | 25.9 -6% | 23.2 5% |
| Idle Minimum * (dB) | 24.5 | 23 6% | 25.2 -3% | 24 2% | 27.1 -11% | 25.9 -6% | 23.2 5% |
| Idle Average * (dB) | 24.5 | 23 6% | 25.2 -3% | 27.7 -13% | 27.1 -11% | 25.9 -6% | 23.2 5% |
| Idle Maximum * (dB) | 24.5 | 23 6% | 31.3 -28% | 27.7 -13% | 27.1 -11% | 32 -31% | 23.2 5% |
| Load Average * (dB) | 48 | 37.2 22% | 38.8 19% | 39.8 17% | 42.9 11% | 47.2 2% | 45.5 5% |
| Witcher 3 ultra * (dB) | 40.7 | 51 -25% | 44.3 -9% | 44 -8% | 53.1 -30% | 45.5 -12% | |
| Load Maximum * (dB) | 48 | 51 -6% | 51.2 -7% | 47.7 1% | 47 2% | 53.1 -11% | 45.5 5% |
* ... mindre är bättre
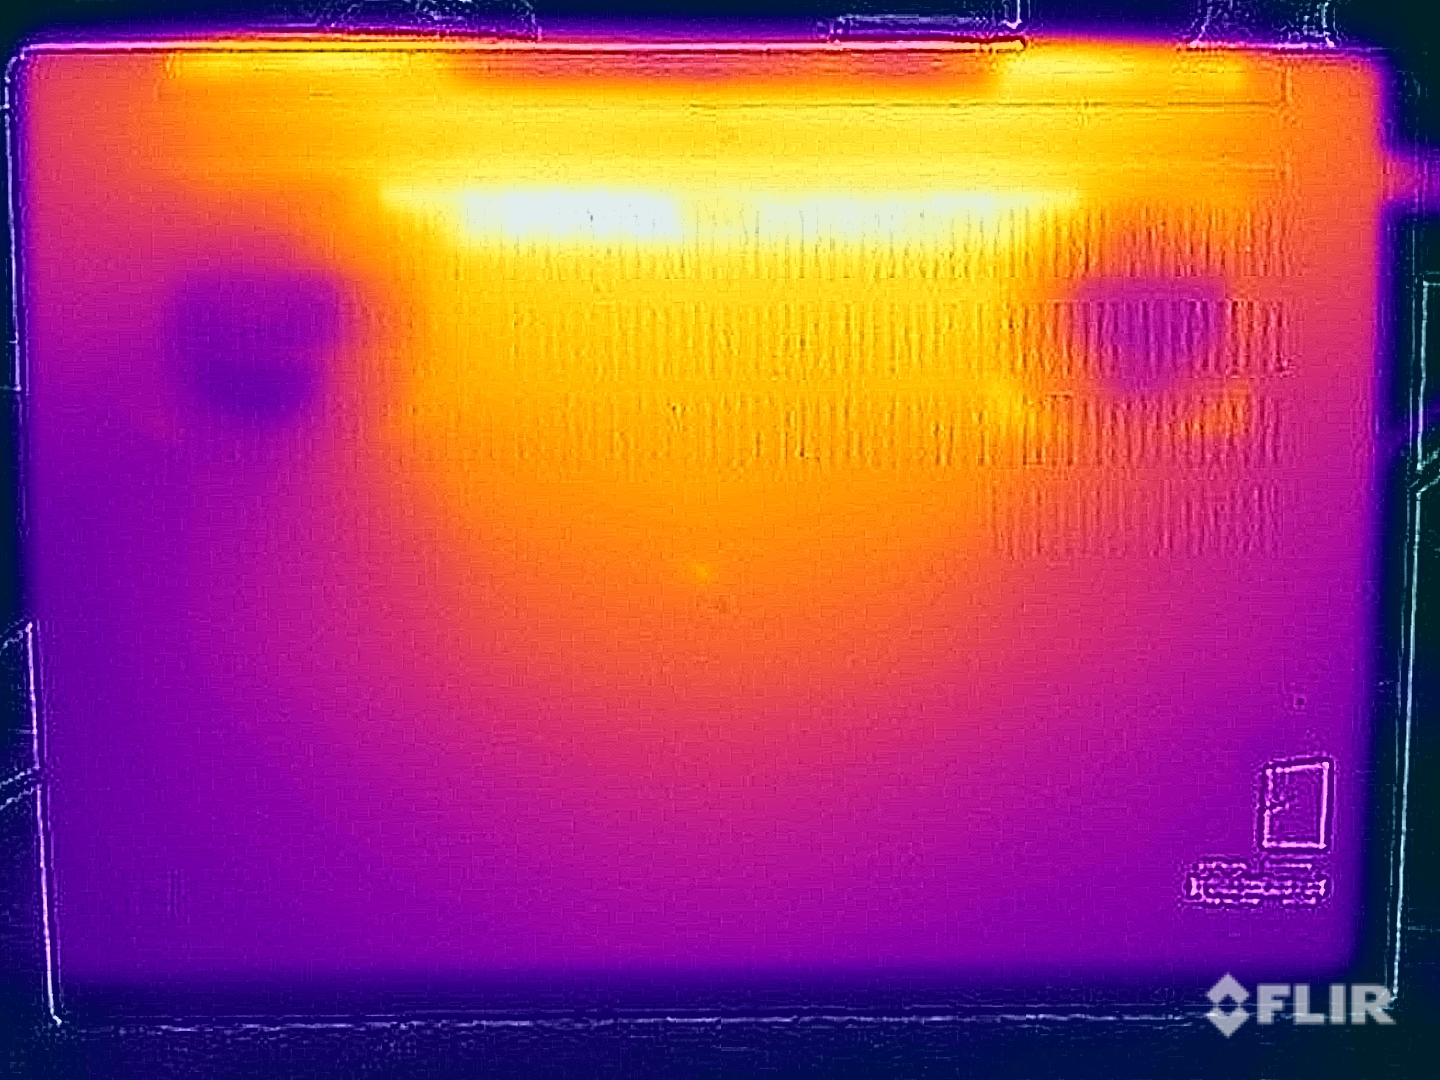
Temperatur
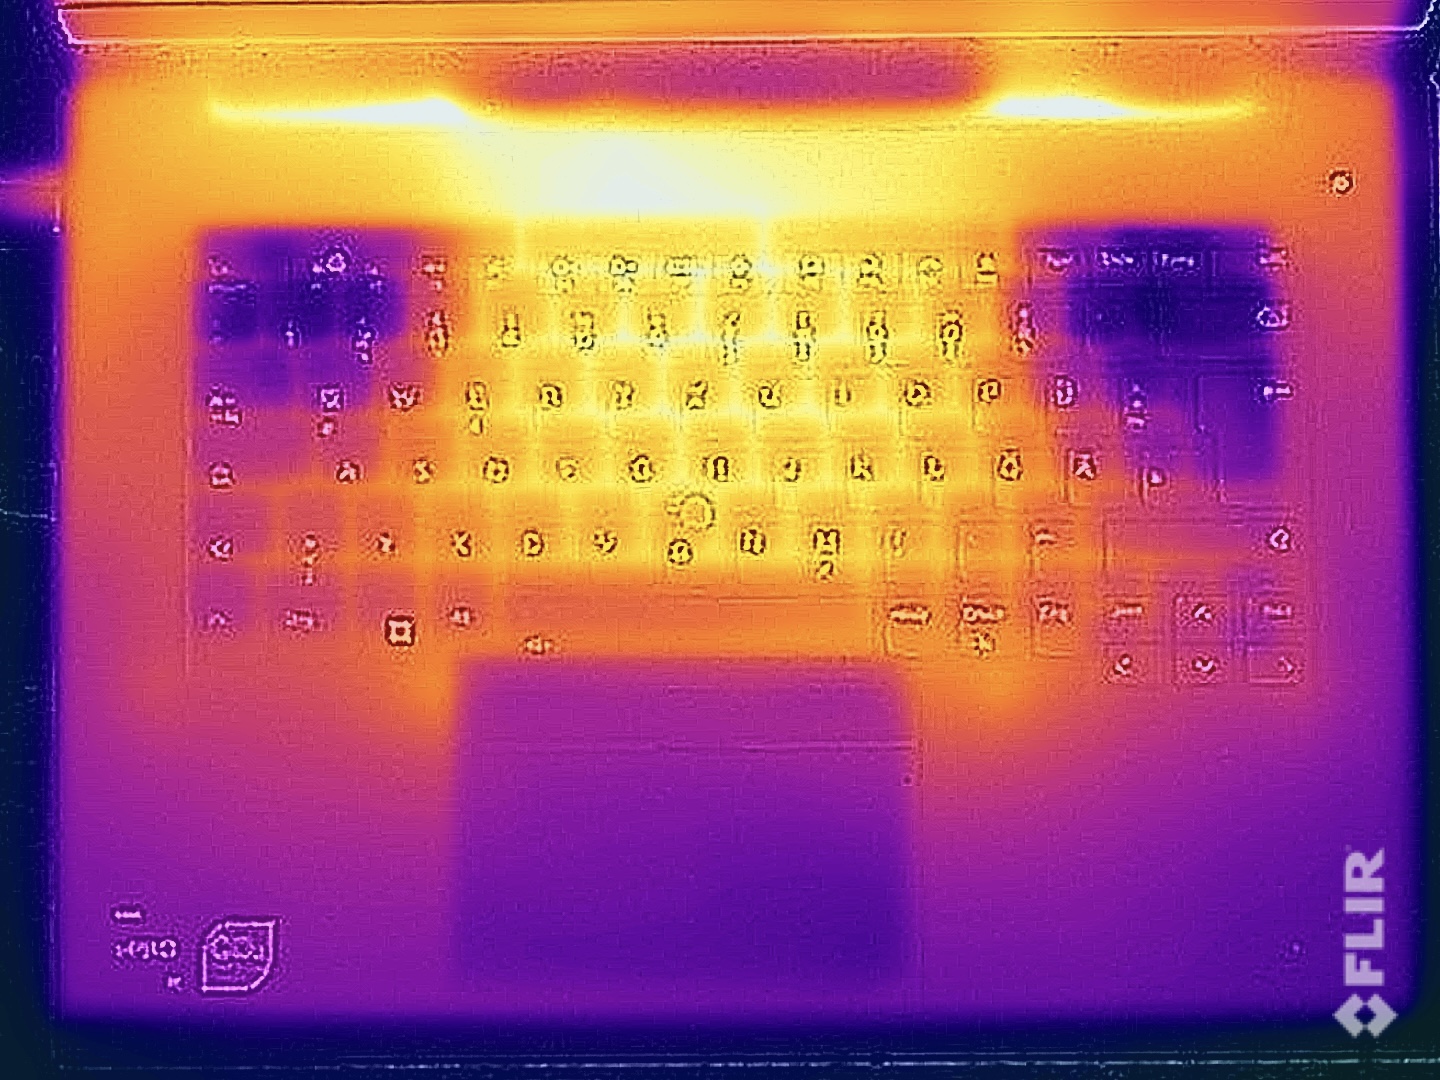
Yttemperaturerna förblir helt säkra under enkla uppgifter, och höljet värms knappt upp. I likhet med den tidigare modellenvid tung belastning överstiger temperaturen 50°C på undersidan. Det är tillrådligt att inte placera enheten på låren under sådana perioder, men med tanke på dess storlek är detta scenario osannolikt. Tangentbordsområdet kan också nå temperaturer på upp till 47 °C, även om vi registrerade ännu högre temperaturer i föregångaren. Att skriva under belastning (eller under spel) kan resultera i varma fingrar, men det finns inga betydande obehag.
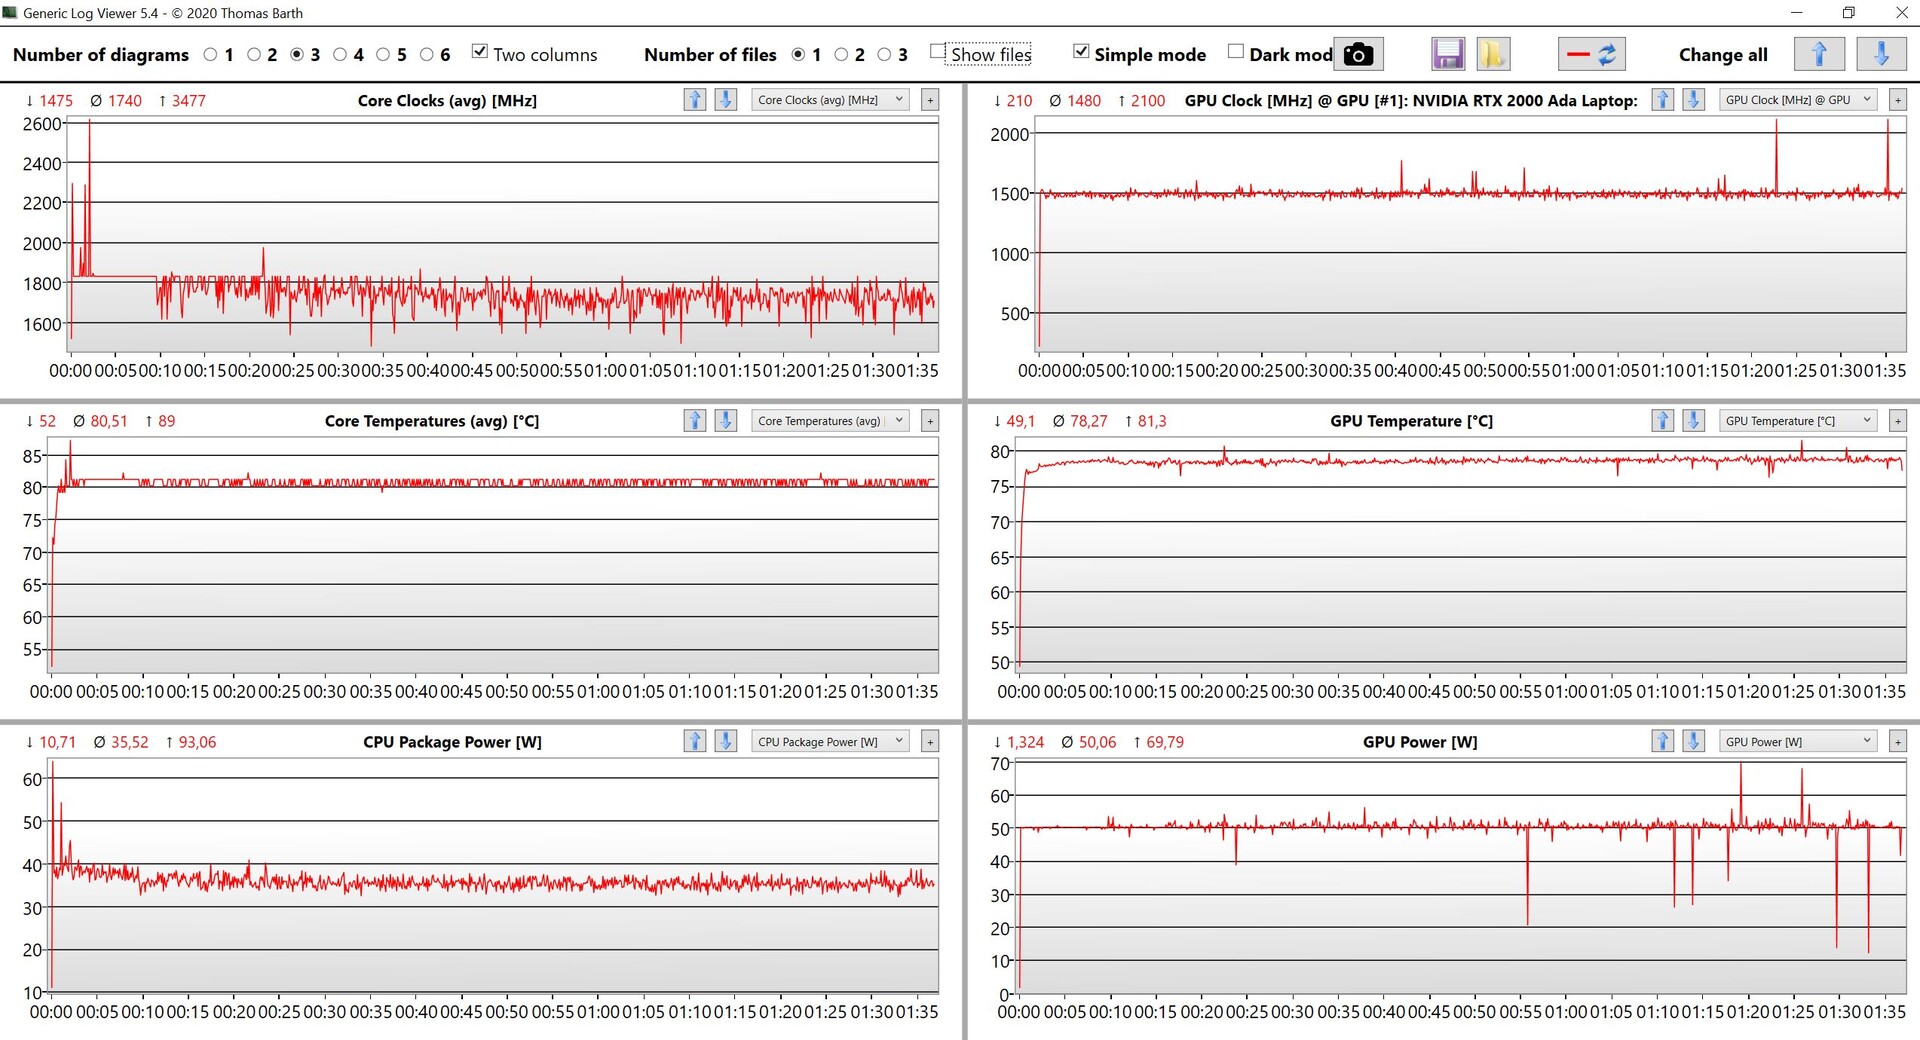
Under stresstestet körs det dedikerade grafikkortet på de angivna 50 watt, medan processorn stabiliseras på cirka 35 watt. Systemet kan hantera en total kylbelastning på 85 watt kontinuerligt. Som jämförelse kan nämnas att G5-generationen med ångkammare hanterade ca 100 watt totalt (60 watt för GPU och 40 watt för CPU).
(-) Den maximala temperaturen på ovansidan är 47.1 °C / 117 F, jämfört med genomsnittet av 38.2 °C / 101 F , allt från 22.2 till 69.8 °C för klassen Workstation.
(-) Botten värms upp till maximalt 56.5 °C / 134 F, jämfört med genomsnittet av 41.1 °C / 106 F
(+) Vid tomgångsbruk är medeltemperaturen för ovansidan 26.4 °C / 80 F, jämfört med enhetsgenomsnittet på 32 °C / ### class_avg_f### F.
(-) När du spelar The Witcher 3 är medeltemperaturen för ovansidan 39.1 °C / 102 F, jämfört med enhetsgenomsnittet på 32 °C / ## #class_avg_f### F.
(+) Handledsstöden och pekplattan når maximal hudtemperatur (35.1 °C / 95.2 F) och är därför inte varma.
(-) Medeltemperaturen för handledsstödsområdet på liknande enheter var 27.8 °C / 82 F (-7.3 °C / -13.2 F).
| Lenovo ThinkPad P1 G6-21FV000DGE Intel Core i9-13900H, NVIDIA RTX 2000 Ada Generation Laptop | Dell Precision 5000 5680 Intel Core i9-13900H, NVIDIA RTX 5000 Ada Generation Laptop | Samsung Galaxy Book3 Ultra 16, i9-13900H RTX 4070 Intel Core i9-13900H, NVIDIA GeForce RTX 4070 Laptop GPU | HP ZBook Studio 16 G9 62U04EA Intel Core i7-12800H, NVIDIA RTX A2000 Laptop GPU | MSI CreatorPro Z16P B12UKST Intel Core i7-12700H, NVIDIA RTX A3000 Laptop GPU | Schenker VISION 16 Pro (M23) Intel Core i7-13700H, NVIDIA GeForce RTX 4070 Laptop GPU | Lenovo ThinkPad X1 Extreme G5-21DE003RGE Intel Core i7-12700H, NVIDIA GeForce RTX 3060 Laptop GPU | |
|---|---|---|---|---|---|---|---|
| Heat | -3% | -6% | 3% | -6% | 4% | -1% | |
| Maximum Upper Side * (°C) | 47.1 | 50.2 -7% | 45.9 3% | 38.7 18% | 56.3 -20% | 46.7 1% | 52 -10% |
| Maximum Bottom * (°C) | 56.5 | 32 43% | 50.9 10% | 53.4 5% | 68.3 -21% | 54.1 4% | 56.4 -0% |
| Idle Upper Side * (°C) | 28.1 | 37.4 -33% | 31.6 -12% | 27.3 3% | 25.2 10% | 26.5 6% | 26.4 6% |
| Idle Bottom * (°C) | 27.6 | 31.2 -13% | 34.2 -24% | 31.6 -14% | 25.9 6% | 26.8 3% | 27.2 1% |
* ... mindre är bättre
Högtalare
Högtalaregenskaperna liknar den gamla modellen, och den maximala volymen på nästan 82 dB(A) är också jämförbar. Den nuvarande P1 G6 presterar något bättre i våra mätningar, möjligen på grund av mjukvaruoptimeringar. Vi rekommenderar starkt att du aktiverar den förinstallerade Dolby-appen för en förbättrad ljudupplevelse. Medan stereohögtalarna levererar bra övergripande prestanda, har rivaler med fler högtalare fortfarande en fördel i denna aspekt.
Lenovo ThinkPad P1 G6-21FV000DGE ljudanalys
(±) | högtalarljudstyrkan är genomsnittlig men bra (81.8 dB)
Bas 100 - 315 Hz
(±) | reducerad bas - i genomsnitt 8.9% lägre än medianen
(±) | linjäriteten för basen är genomsnittlig (12.3% delta till föregående frekvens)
Mellan 400 - 2000 Hz
(+) | balanserad mellan - endast 4.7% från medianen
(+) | mids är linjära (3.5% delta till föregående frekvens)
Högsta 2 - 16 kHz
(+) | balanserade toppar - endast 4.1% från medianen
(+) | toppar är linjära (6.1% delta till föregående frekvens)
Totalt 100 - 16 000 Hz
(+) | det totala ljudet är linjärt (12.2% skillnad mot median)
Jämfört med samma klass
» 18% av alla testade enheter i den här klassen var bättre, 3% liknande, 79% sämre
» Den bästa hade ett delta på 7%, genomsnittet var 17%, sämst var 35%
Jämfört med alla testade enheter
» 10% av alla testade enheter var bättre, 2% liknande, 88% sämre
» Den bästa hade ett delta på 4%, genomsnittet var 23%, sämst var 134%
MSI CreatorPro Z16P B12UKST ljudanalys
(+) | högtalare kan spela relativt högt (83.3 dB)
Bas 100 - 315 Hz
(-) | nästan ingen bas - i genomsnitt 18.7% lägre än medianen
(±) | linjäriteten för basen är genomsnittlig (7% delta till föregående frekvens)
Mellan 400 - 2000 Hz
(+) | balanserad mellan - endast 3% från medianen
(+) | mids är linjära (6.8% delta till föregående frekvens)
Högsta 2 - 16 kHz
(+) | balanserade toppar - endast 4.6% från medianen
(+) | toppar är linjära (6.4% delta till föregående frekvens)
Totalt 100 - 16 000 Hz
(±) | linjäriteten för det totala ljudet är genomsnittlig (15.2% skillnad mot median)
Jämfört med samma klass
» 33% av alla testade enheter i den här klassen var bättre, 10% liknande, 57% sämre
» Den bästa hade ett delta på 7%, genomsnittet var 17%, sämst var 35%
Jämfört med alla testade enheter
» 22% av alla testade enheter var bättre, 4% liknande, 74% sämre
» Den bästa hade ett delta på 4%, genomsnittet var 23%, sämst var 134%
Energy Management - Bra uthållighet med IPS-panelen
Strömförbrukning
ThinkPad P1 G6 med WQHD-panel har betydligt högre effektivitet jämfört med den gamla ThinkPad X1 Extreme med 4K-panel. Erfarenheten tyder på att tillvalet 4K OLED-skärm också kommer att kräva betydligt mer ström. Den maximala tomgångsförbrukningen vid 165 Hz är 15,3 watt, och du kan spara cirka 1,5 watt i 60 Hz-läge. Den bärbara datorn förblir ganska effektiv under belastning; under spel uppmätte vi strax över 100 watt. I föregångaren var det fortfarande cirka 130 watt trots lägre prestanda. Även om vi kort uppmätte ett maximum på 165 watt i början av stresstestet, lade det sig snabbt på cirka 110 watt. Det medföljande 170-watts nätaggregatet är mer än tillräckligt för dessa effektkrav.
| Av/Standby | |
| Låg belastning | |
| Hög belastning |
|
Förklaring:
min: | |
| Lenovo ThinkPad P1 G6-21FV000DGE i9-13900H, RTX 2000 Ada Generation Laptop, SK Hynix PC711 1TB HFS001TDE9X084N, IPS, 2560x1600, 16" | Dell Precision 5000 5680 i9-13900H, RTX 5000 Ada Generation Laptop, 2x SK hynix PC801 HFS512GEJ9X101N RAID 0, OLED, 3840x2400, 16" | Samsung Galaxy Book3 Ultra 16, i9-13900H RTX 4070 i9-13900H, GeForce RTX 4070 Laptop GPU, Samsung PM9A1 MZVL21T0HCLR, OLED / AMOLED, 2880x1800, 16" | HP ZBook Studio 16 G9 62U04EA i7-12800H, RTX A2000 Laptop GPU, Micron 3400 1TB MTFDKBA1T0TFH, IPS, 3840x2400, 16" | MSI CreatorPro Z16P B12UKST i7-12700H, RTX A3000 Laptop GPU, Samsung PM9A1 MZVL21T0HCLR, IPS, 2560x1600, 16" | Schenker VISION 16 Pro (M23) i7-13700H, GeForce RTX 4070 Laptop GPU, Samsung 990 Pro 1 TB, IPS, 2560x1600, 16" | Lenovo ThinkPad X1 Extreme G5-21DE003RGE i7-12700H, GeForce RTX 3060 Laptop GPU, Micron 3400 1TB MTFDKBA1T0TFH, IPS, 3840x2400, 16" | Genomsnitt NVIDIA RTX 2000 Ada Generation Laptop | Genomsnitt av klass Workstation | |
|---|---|---|---|---|---|---|---|---|---|
| Power Consumption | -14% | 29% | -12% | -21% | -0% | -43% | 9% | -7% | |
| Idle Minimum * (Watt) | 8.3 | 8 4% | 4.3 48% | 7.2 13% | 10.8 -30% | 8.6 -4% | 11.8 -42% | 6.88 ? 17% | 9.11 ? -10% |
| Idle Average * (Watt) | 14.5 | 10.4 28% | 4.6 68% | 18.1 -25% | 16.3 -12% | 12 17% | 22.4 -54% | 12.1 ? 17% | 13.8 ? 5% |
| Idle Maximum * (Watt) | 15.3 | 30.5 -99% | 11.4 25% | 18.5 -21% | 16.9 -10% | 12.4 19% | 23.1 -51% | 14.5 ? 5% | 17.9 ? -17% |
| Load Average * (Watt) | 91.8 | 75.4 18% | 97 -6% | 112.8 -23% | 111.7 -22% | 80 13% | 138 -50% | 86.9 ? 5% | 96 ? -5% |
| Witcher 3 ultra * (Watt) | 104.7 | 134 -28% | 100.9 4% | 106.7 -2% | 152.1 -45% | 147.7 -41% | 129.9 -24% | ||
| Load Maximum * (Watt) | 164.5 | 175 -6% | 107 35% | 186 -13% | 177.4 -8% | 173.1 -5% | 225.6 -37% | 161.1 ? 2% | 180.3 ? -10% |
* ... mindre är bättre
Power consumption Witcher 3 / stress test
Power consumption with external monitor
Batteritid
Batteriet behåller sin kapacitet på 90 wattimmar, vilket ger utmärkt batteritid, särskilt i 60 Hz-läget. Under vårt WLAN-test klarar ThinkPad P1 G6 cirka 9,5 timmar vid 150 cd/m² (motsvarande 63 % av den maximala ljusstyrkan i testenheten) och 6 timmar och 43 minuter vid full ljusstyrka. Med tanke på den stora skärmen och den höga ljusstyrkan på nästan 500 cd/m² är dessa resultat ganska imponerande. Den håller i nästan 11 timmar under videotestet (också vid 150 cd/m2), men drifttiderna är kortare i 165 Hz-läget, vilket framgår av tabellen nedan:
| Läge | WLAN-test (150 cd/m²) | WLAN-test max. ljusstyrka | Videotest (150 cd/m²) |
|---|---|---|---|
| 60 Hz | 567 minuter | 403 minuter | 674 minuter |
| 165 Hz | 500 minuter | 370 minuter | 548 minuter |
Vid intensiv användning kan batteriet laddas ur på drygt en timme, och det tar cirka 100 minuter att ladda upp det helt när enheten är påslagen. Omkring 45% laddning är tillgänglig efter knappt 20 minuter, och 80% uppnås efter 50 minuter.
| Lenovo ThinkPad P1 G6-21FV000DGE i9-13900H, RTX 2000 Ada Generation Laptop, 90 Wh | Dell Precision 5000 5680 i9-13900H, RTX 5000 Ada Generation Laptop, 98 Wh | Samsung Galaxy Book3 Ultra 16, i9-13900H RTX 4070 i9-13900H, GeForce RTX 4070 Laptop GPU, 76 Wh | HP ZBook Studio 16 G9 62U04EA i7-12800H, RTX A2000 Laptop GPU, 86 Wh | MSI CreatorPro Z16P B12UKST i7-12700H, RTX A3000 Laptop GPU, 90 Wh | Schenker VISION 16 Pro (M23) i7-13700H, GeForce RTX 4070 Laptop GPU, 80 Wh | Lenovo ThinkPad X1 Extreme G5-21DE003RGE i7-12700H, GeForce RTX 3060 Laptop GPU, 90 Wh | Genomsnitt av klass Workstation | |
|---|---|---|---|---|---|---|---|---|
| Batteridrifttid | 30% | -18% | -19% | -39% | -10% | -3% | 4% | |
| H.264 (h) | 11.2 | 9 -20% | 8.5 -24% | 7.8 -30% | 7.3 -35% | 10.1 ? -10% | ||
| WiFi v1.3 (h) | 9.5 | 9.9 4% | 8 -16% | 6.3 -34% | 5.8 -39% | 7.8 -18% | 6.7 -29% | 8.55 ? -10% |
| Load (h) | 1.1 | 1.7 55% | 0.9 -18% | 1.1 0% | 1.3 18% | 1.7 55% | 1.441 ? 31% |
För
Emot
Omdöme - Mycket bra mobil arbetsstation

Den nya ThinkPad P1 G6 uppfyller förväntningarna genom att behålla den oförändrade chassidesignen och erbjuda två olika typer av kylning (klassisk med värmerör eller ångkammare) beroende på det dedikerade grafikkortet. Avvecklingen av ThinkPad X1 Extreme är enbart ett marknadsföringsbeslut, eftersom båda modellerna var identiska. Vid sidan av professionella Nvidia GPU:er tillhandahåller Lenovo även konsumentvarianter, även om valen är något begränsade till RTX 4060 Bärbar dator, 4080 Bärbar datoroch 4090 bärbar dator.
När det gäller processorprestanda är den övergripande kraften utmärkt, med Core i9 som utmärker sig i single-core-tester. Dessutom misstänker man att de starkare modellerna med ångkammarkylning kan erbjuda något bättre CPU-prestanda. Den nya RTX 2000 Ada sticker ut som en betydande uppgradering och levererar överlägsen grafikprestanda trots sin relativt låga TGP-klassning på 65 watt. Den överträffar den gamla RTX A3000 och till och med GeForce RTX 3060 Laptop. Även om GPU:n liknar den i GeForce RTX 4060 laptop, körs den på 80 watt i ThinkPad P1 G6 med mer robust ångkammarkylning. Lenovos differentiering i detta avseende är inte helt tydlig.
ThinkPad P1 G6 utmärker sig som en mobil arbetsstation och prioriterar mobilitet framför rå prestanda. Nvidia Ada GPU:erna ger imponerande prestanda och den valfria IPS-skärmen med 500 nits ljusstyrka och en uppdateringsfrekvens på 165 Hz rekommenderas starkt, särskilt om du inte behöver en utökad färgrymd.
Även om skärmen presterar exceptionellt bra är dess svaga punkt färgrymdstäckningen, som är begränsad till den lilla sRGB-standarden. Alla andra aspekter av skärmen är utmärkta, vilket gör den till ett bättre val än OLED-modellen som finns som tillval. Det enda argumentet för OLED-skärmen är dess större färgrymdstäckning. Det är olyckligt att Lenovo inte längre erbjuder 4K IPS-skärmen med Adobe RGB-färgrymd.
ThinkPad P1 G6 är en välutvecklad enhet utan större brister. Förbättringar skulle kunna inkludera en snabbare kortläsare, återgång till de gamla tangentborden med 0,07-tums slaglängd och fördirigering av antenner för WWAN-moduler. Dessutom skulle en optimering av fläktbeteendet förbättra den övergripande användarupplevelsen. Enhetens ljudnivå är som högst 48 dB(A) under belastning, vilket gör den relativt högljudd. I jämförelse var föregångarens ångkammarkylning tystare.
Pris och tillgänglighet
Vårt testexemplar av ThinkPad P1 G6 kan beställas från Amazon för ~3 000 USD. P1 G6 kan också konfigureras i Lenovos onlinebutik.
Lenovo ThinkPad P1 G6-21FV000DGE
- 10/19/2023 v7 (old)
Andreas Osthoff
Genomskinlighet
Valet av enheter som ska granskas görs av vår redaktion. Testprovet gavs till författaren som ett lån av tillverkaren eller återförsäljaren för denna recension. Långivaren hade inget inflytande på denna recension och inte heller fick tillverkaren en kopia av denna recension innan publiceringen. Det fanns ingen skyldighet att publicera denna recension. Som ett oberoende medieföretag är Notebookcheck inte föremål för auktoritet från tillverkare, återförsäljare eller förlag.
This is how Notebookcheck is testingEvery year, Notebookcheck independently reviews hundreds of laptops and smartphones using standardized procedures to ensure that all results are comparable. We have continuously developed our test methods for around 20 years and set industry standards in the process. In our test labs, high-quality measuring equipment is utilized by experienced technicians and editors. These tests involve a multi-stage validation process. Our complex rating system is based on hundreds of well-founded measurements and benchmarks, which maintains objectivity.
Price comparison

