Lenovo ThinkPad E16 G1 Intel granskning: Core i5 är i klass med AMD Ryzen 7

ThinkPad E-serien består av prisvärda modeller för företagsanvändare i kontrast till den lyxigare ThinkPad T-serien eller den skarpare ThinkPad X-serien. I år introduceras 16-tums ThinkPad E16-familjen som kompletterar de befintliga 14-tums ThinkPad E14 och 15-tums ThinkPad E15 alternativen. Två versioner av ThinkPad E16 finns tillgängliga vid lanseringen med antingen Intel- eller AMD-processorer. Vi recenserade nyligen ThinkPad E16 AMD Ryzen 7-versionen och nu är det dags att kolla in ThinkPad E16 Intel Core i5-versionen för att se hur deras skillnader står sig mot varandra.
Vår specifika Intel-recension är en lägre konfiguration med Core i5-1335U och 1200p-pekskärm för cirka 800 till 900 USD. Andra konfigurationer kan gå upp till Core i7-1365U, Core i7-1360P eller till och med Core i7-13700H med diskret GeForce MX550-grafik och en 1600p-skärm med högre upplösning för mycket högre priser. Sådana alternativ är ännu inte tillgängliga vid tidpunkten för publiceringen.
Alternativ till ThinkPad E16 inkluderar andra 16-tums bärbara multimedia- eller affärsdatorer som Acer TravelMate P4, Samsung Galaxy Book3 Pro 16, eller LG Gram 16. Vi rekommenderar att du kollar in vår befintliga recension på ThinkPad E16 G1 AMD-version eftersom vår Intel-version delar samma chassidesign och fysiska funktioner.
Fler Lenovo recensioner:
Potentiella konkurrenter i jämförelse
Gradering | Datum | Modell | Vikt | Höjd | Storlek | Upplösning | Pris |
|---|---|---|---|---|---|---|---|
| 85.5 % v7 (old) | 11/2023 | Lenovo ThinkPad E16 G1 Core i5-1335U i5-1335U, Iris Xe G7 80EUs | 1.8 kg | 19.85 mm | 16.00" | 1920x1200 | |
| 88.1 % v7 (old) | 09/2023 | Lenovo ThinkPad E16 G1-21JUS08X00 R7 7730U, Vega 8 | 1.8 kg | 19.85 mm | 16.00" | 2560x1600 | |
| 84.6 % v7 (old) | 07/2023 | Dell Inspiron 16 7635 2-in-1 R5 7530U, Vega 7 | 2 kg | 18.99 mm | 16.00" | 1920x1200 | |
| 86 % v7 (old) | 04/2023 | Acer TravelMate P4 TMP416-51-55KN i5-1240P, Iris Xe G7 80EUs | 1.6 kg | 18.5 mm | 16.00" | 1920x1200 | |
| 85.6 % v7 (old) | 05/2023 | Samsung Galaxy Book3 Pro 16 i5-1340P, Iris Xe G7 80EUs | 1.6 kg | 12.5 mm | 16.00" | 2880x1800 | |
| 86.6 % v7 (old) | 01/2023 | LG Gram 16Z90Q i7-1260P, Iris Xe G7 96EUs | 1.2 kg | 16.8 mm | 16.00" | 2560x1600 |
Fall
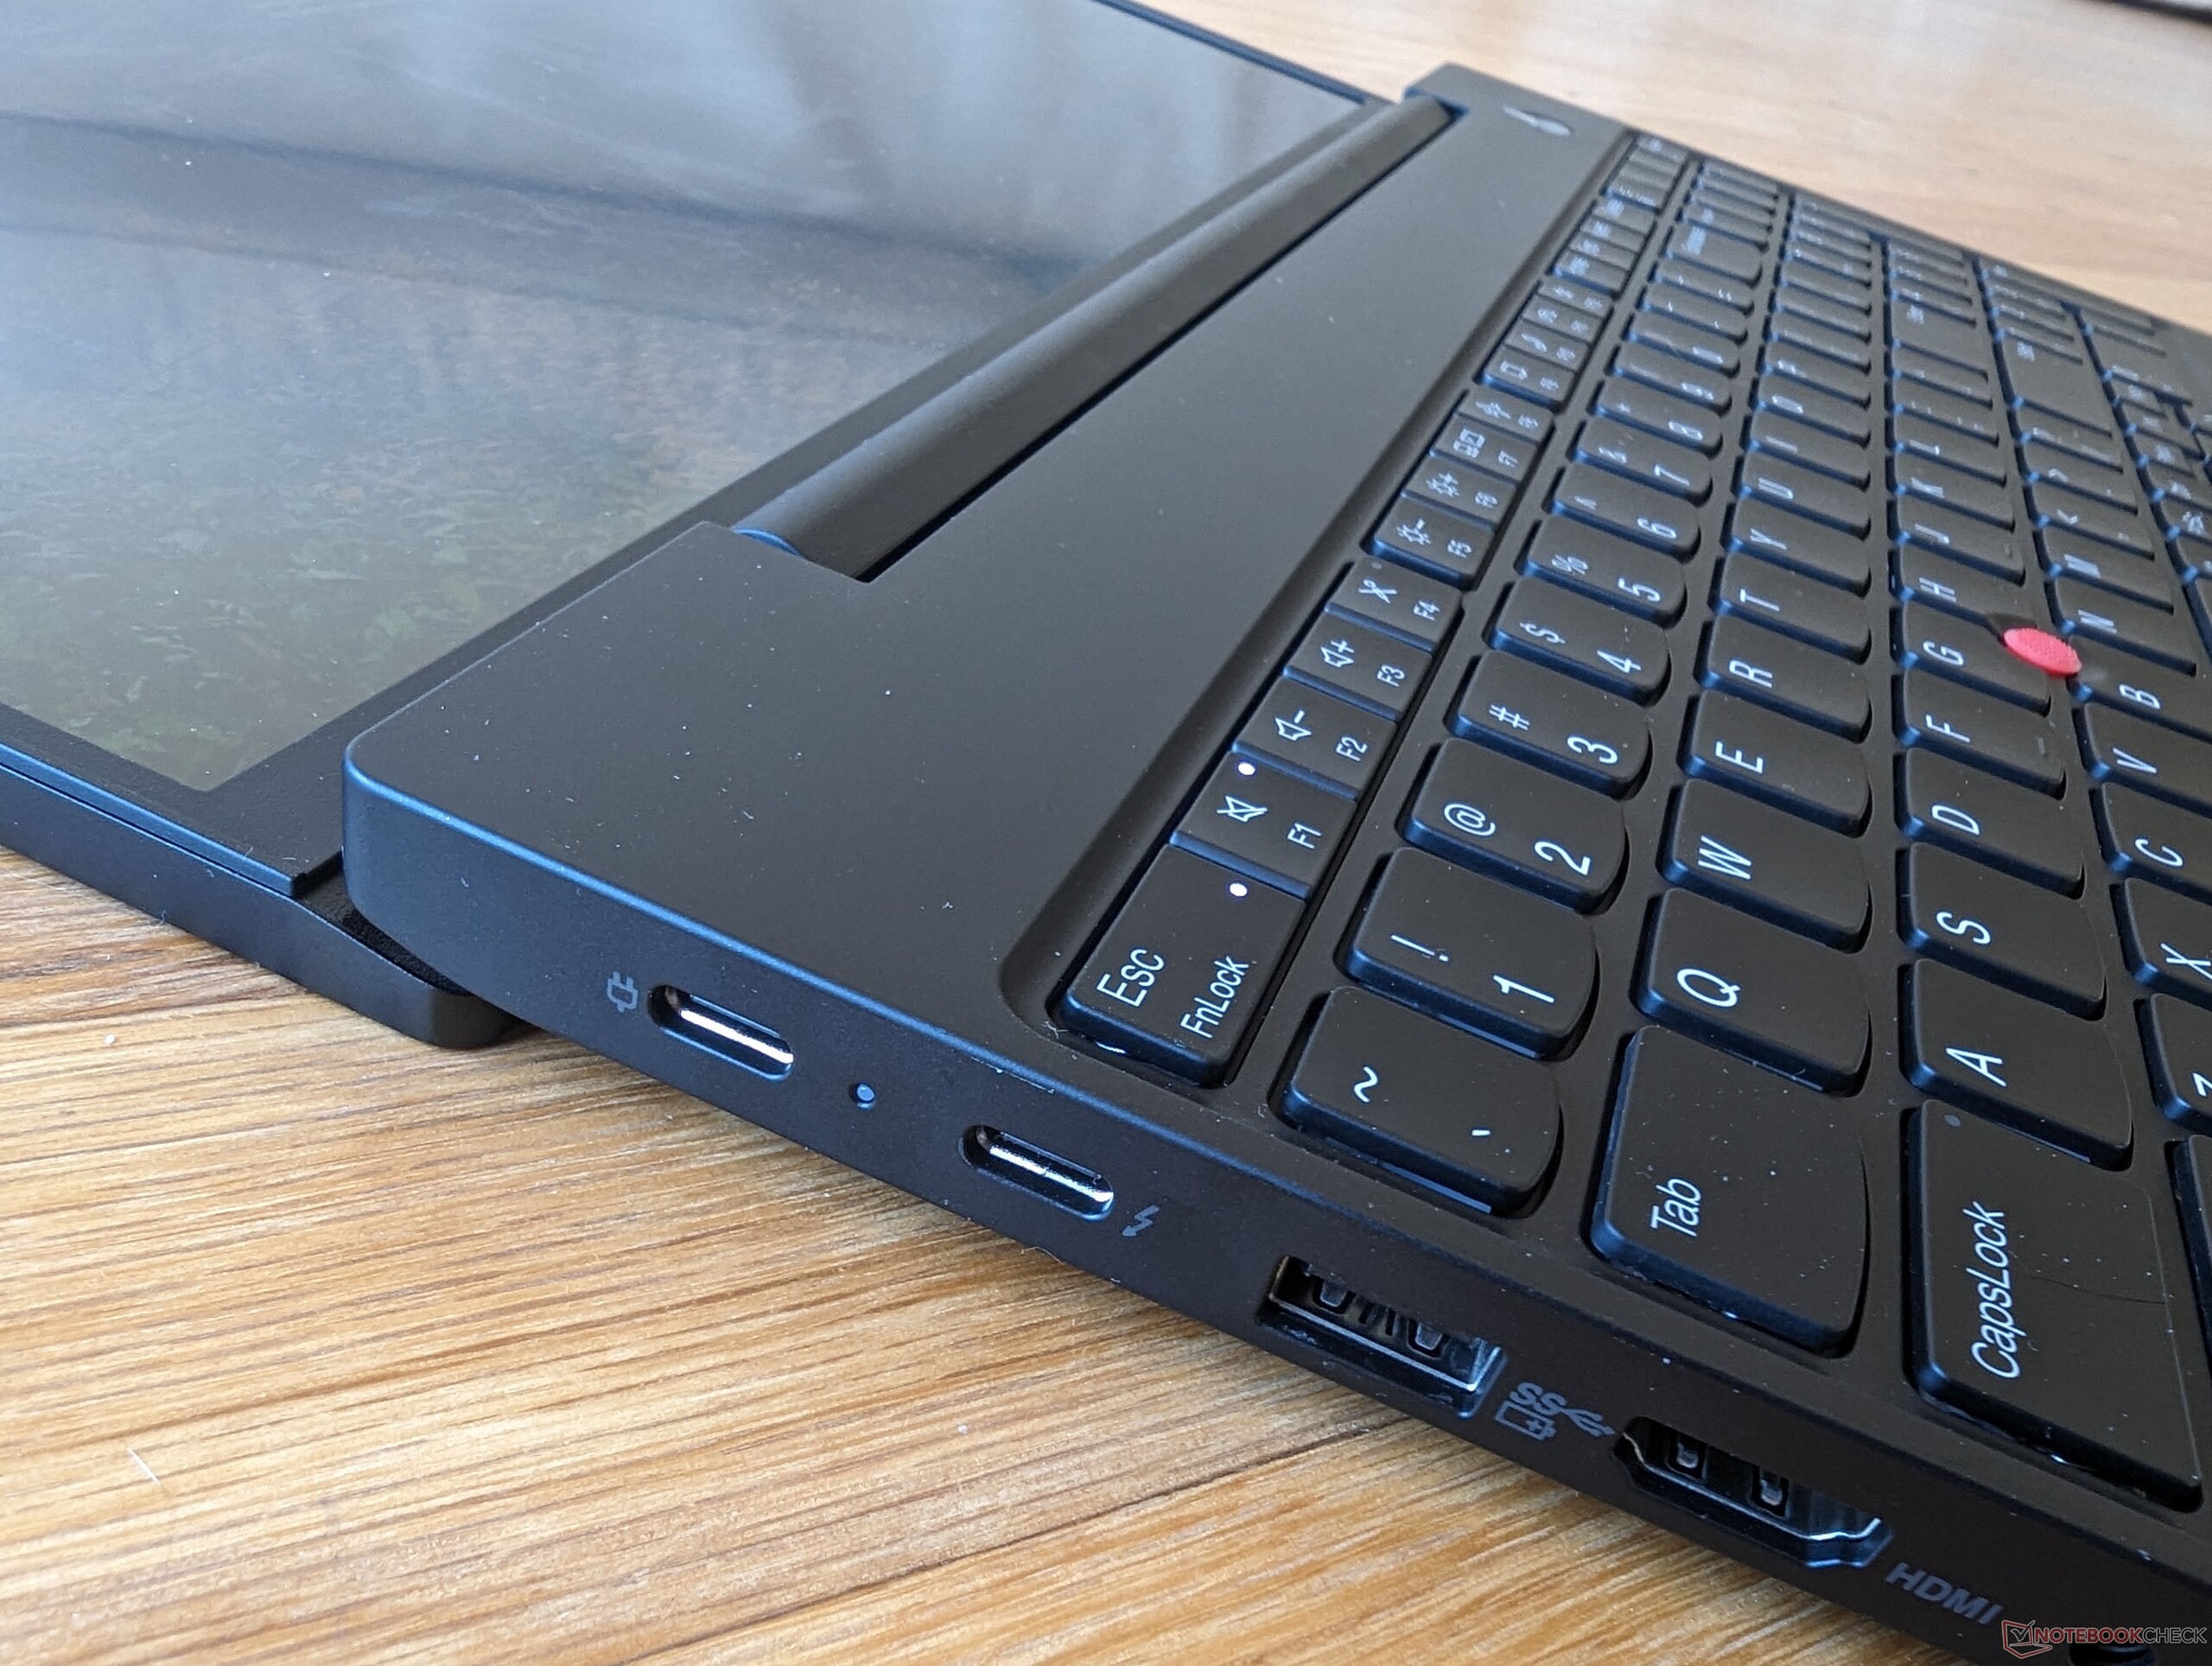
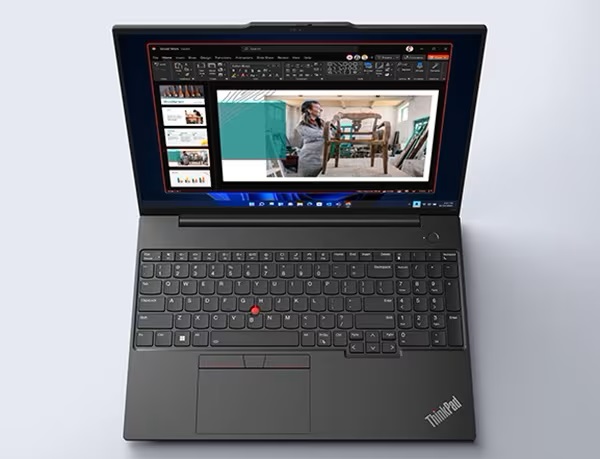
Det enklaste sättet att identifiera en Intel-version från en AMD-version är att leta efter Thunderbolt-logotypen längs den vänstra kanten. Thunderbolt stöds endast på Intel-versionerna eftersom de nuvarande AMD-versionerna inte levereras med USB4.
Kommunikation
Webbkamera


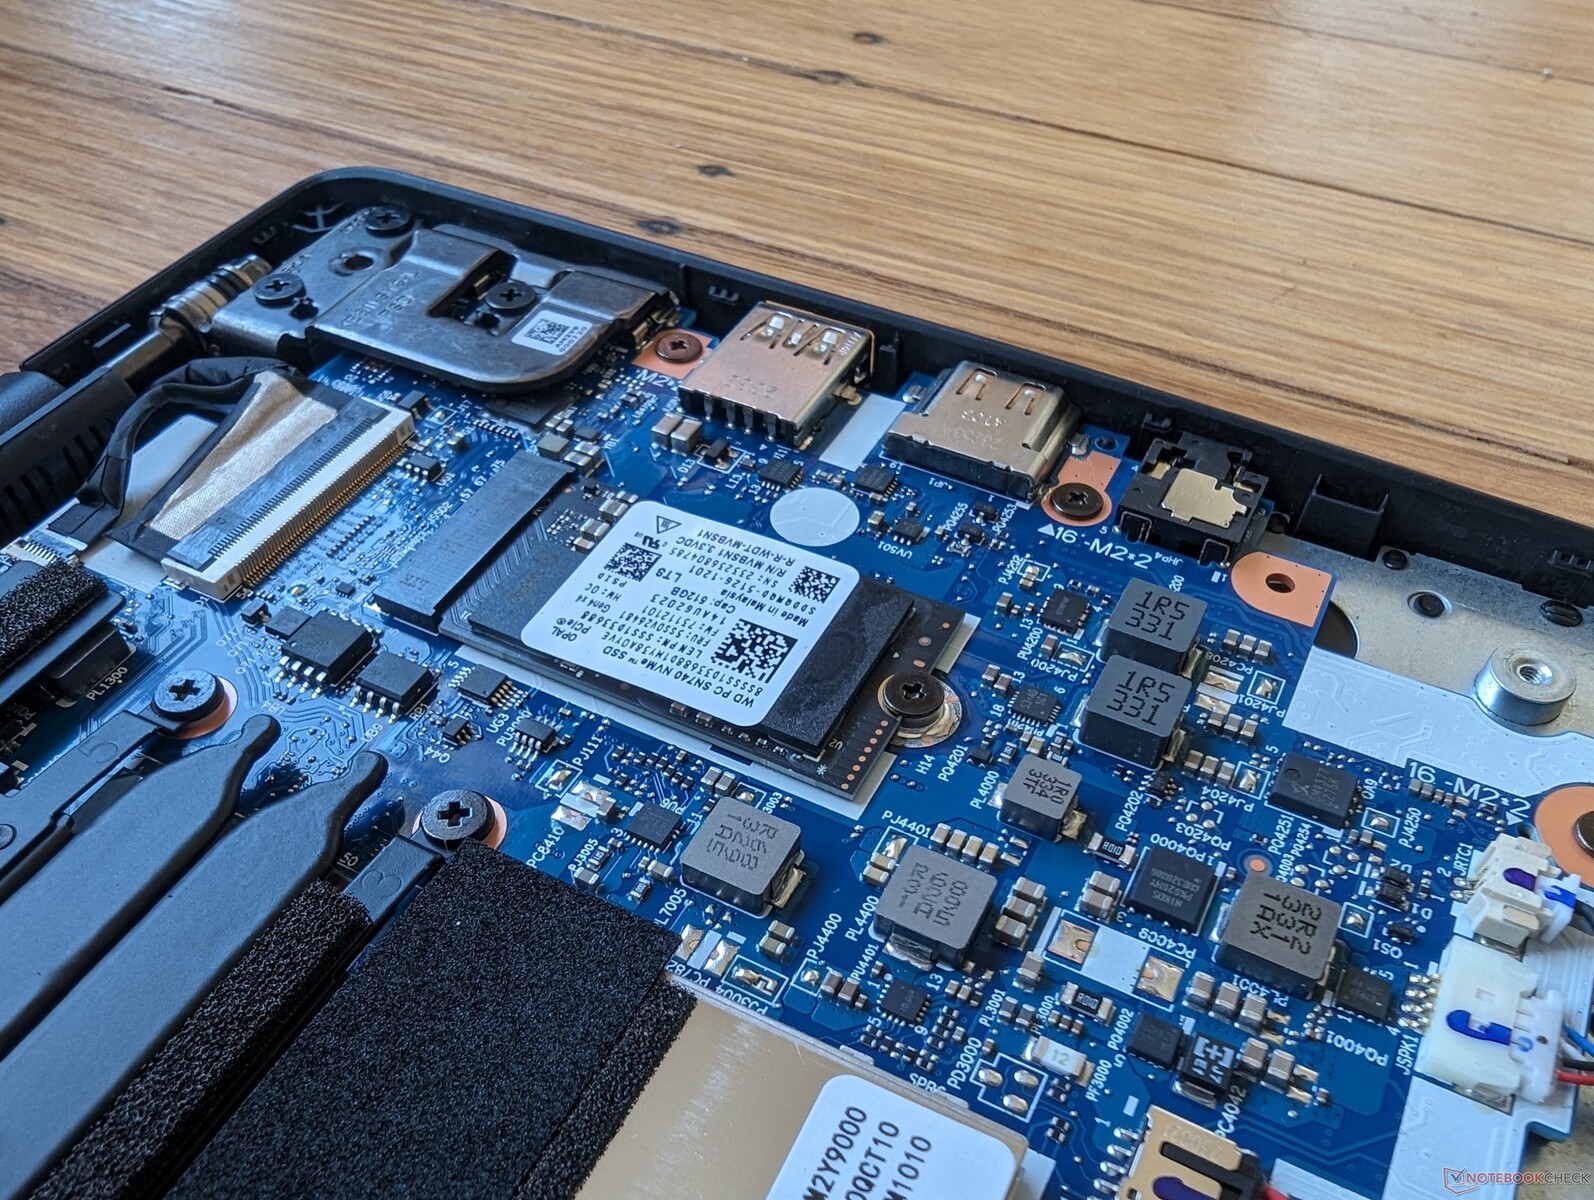
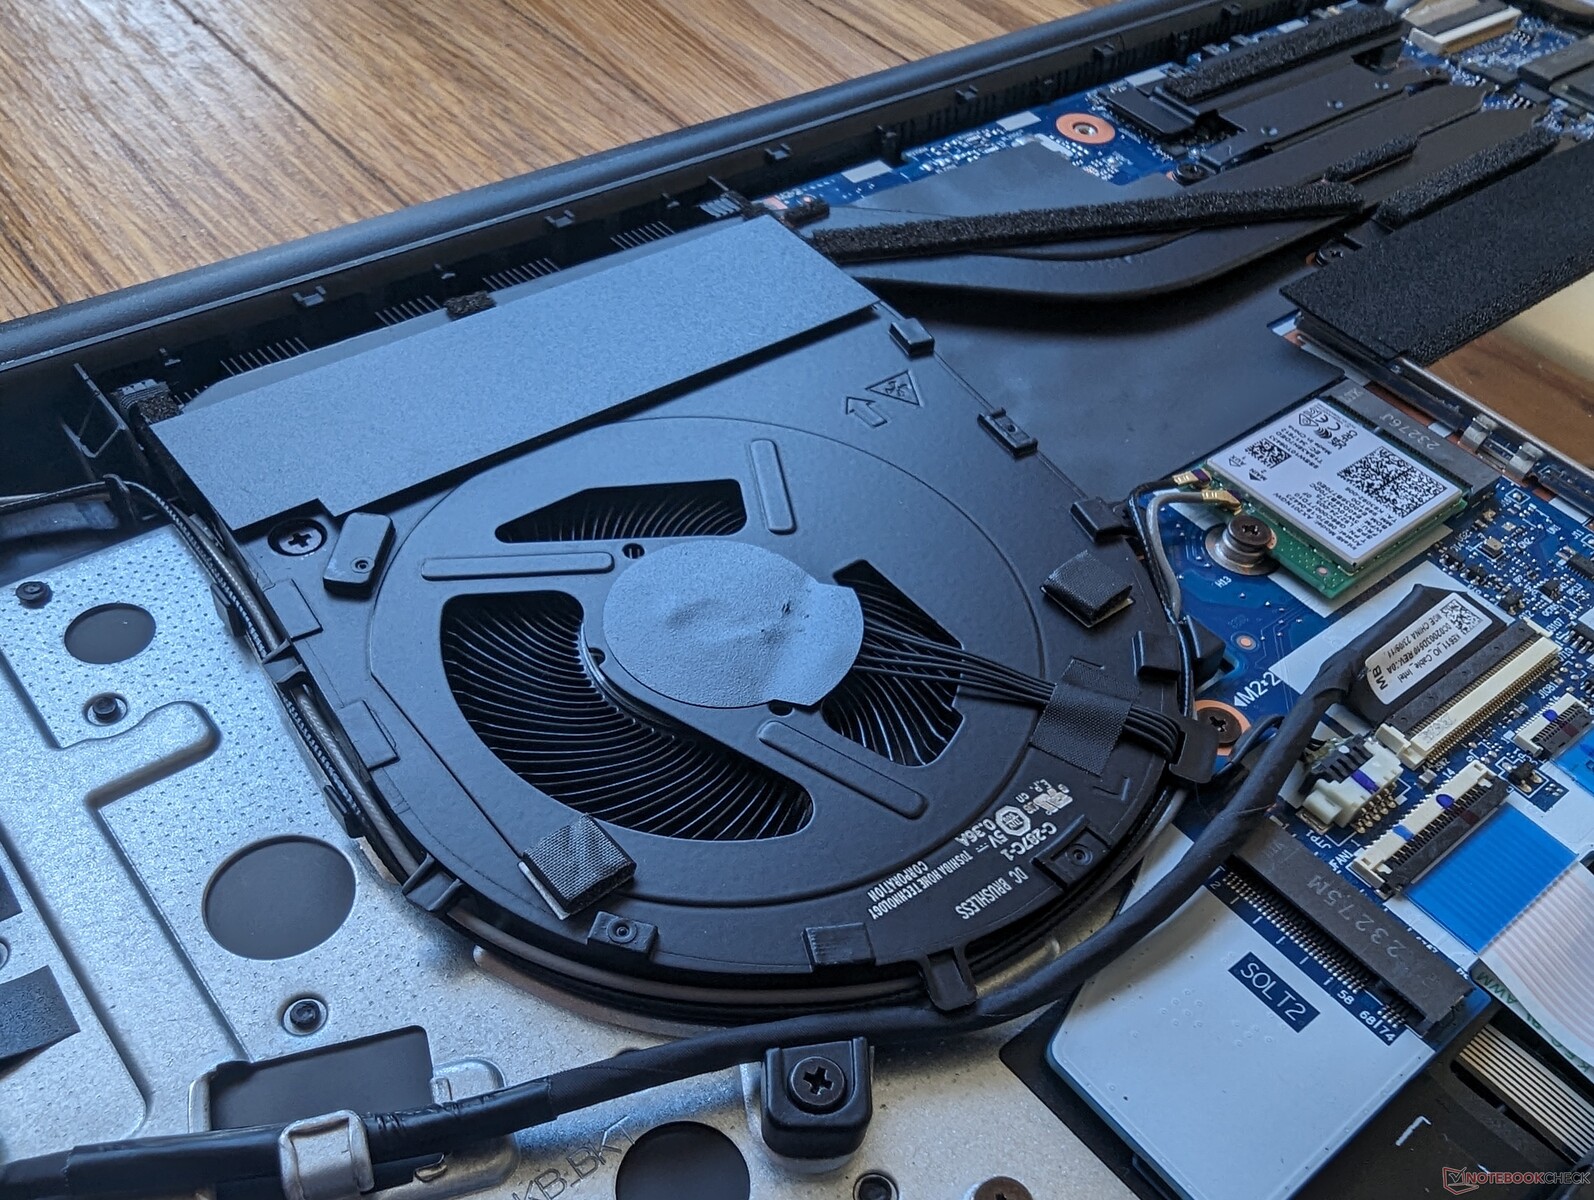
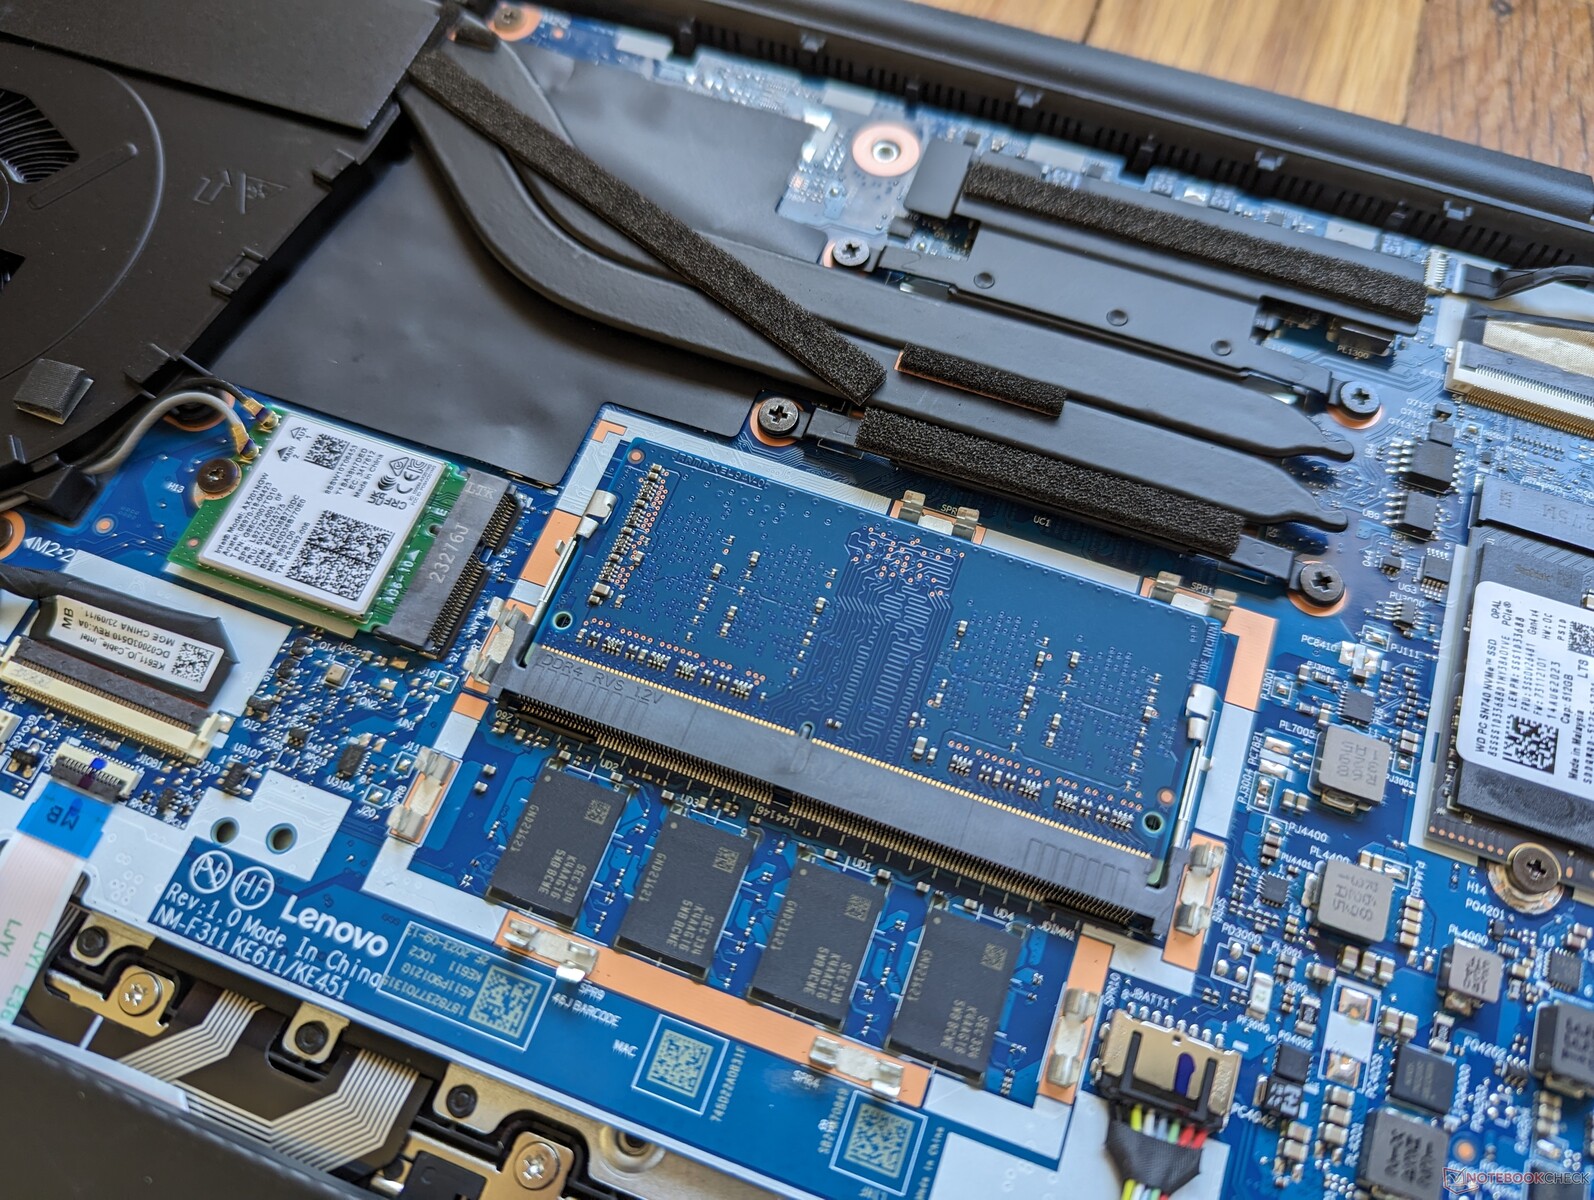
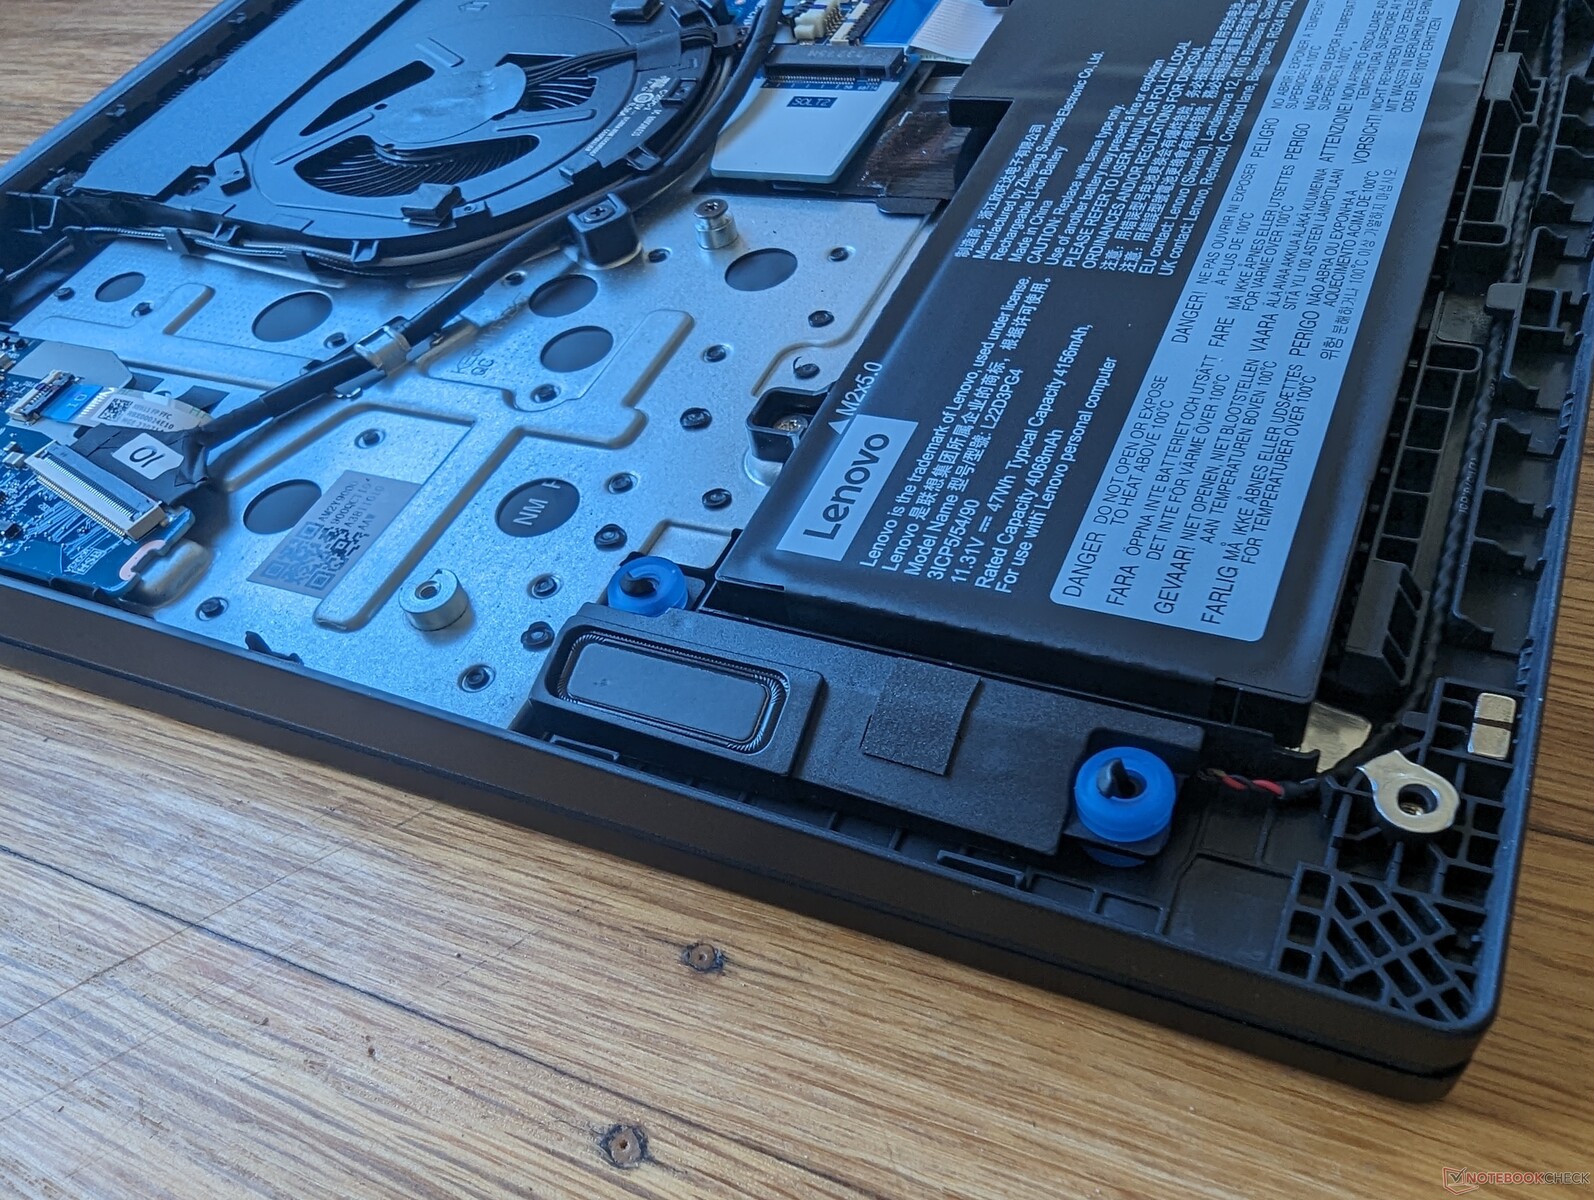
Underhåll
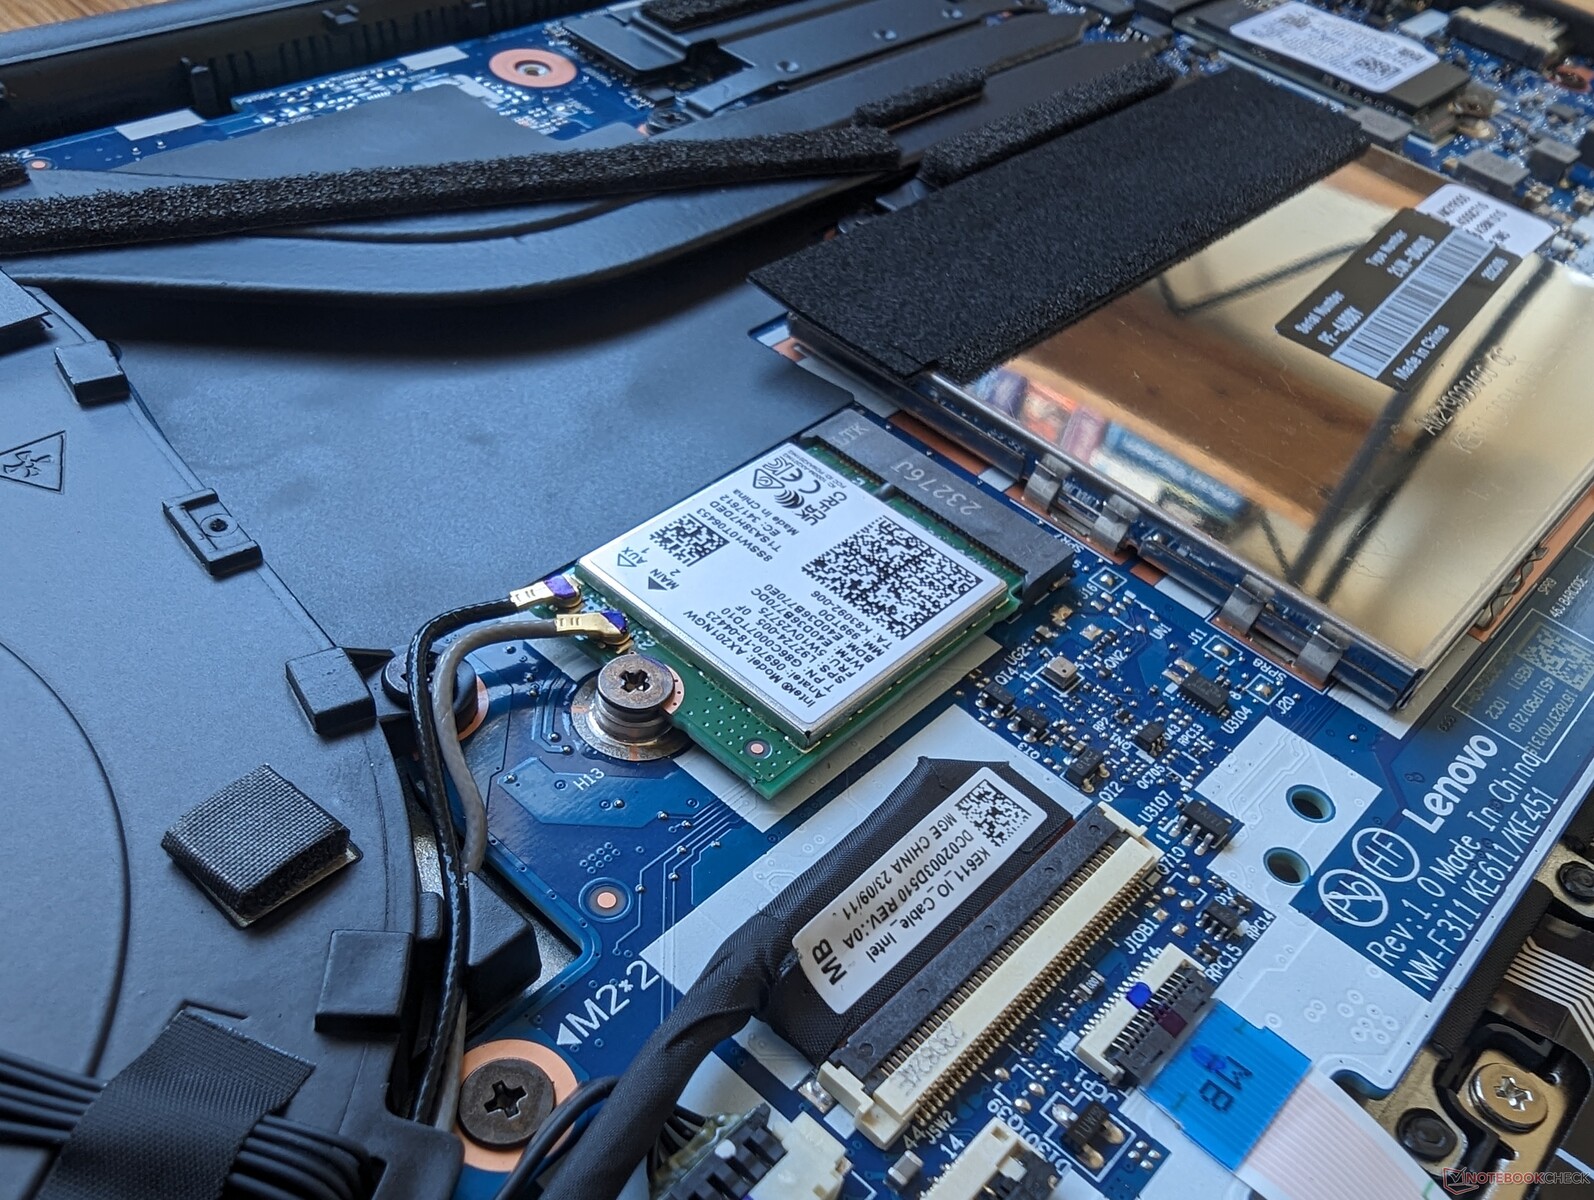
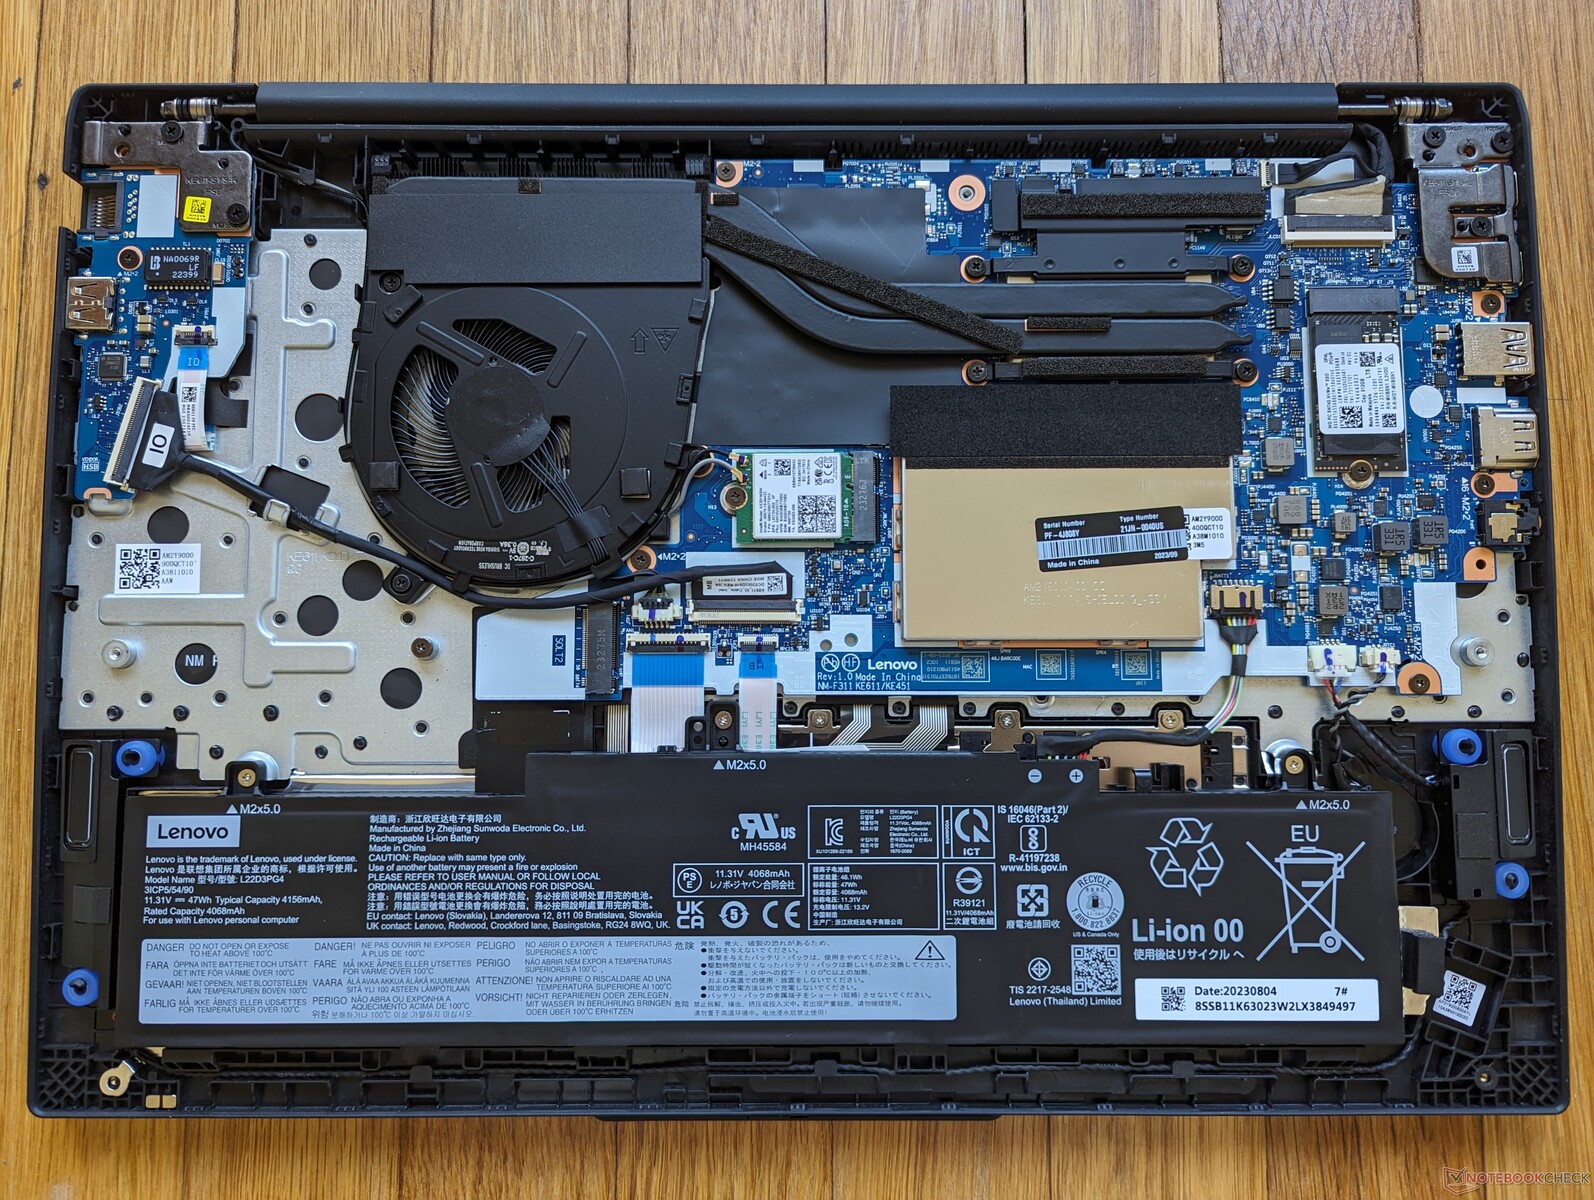
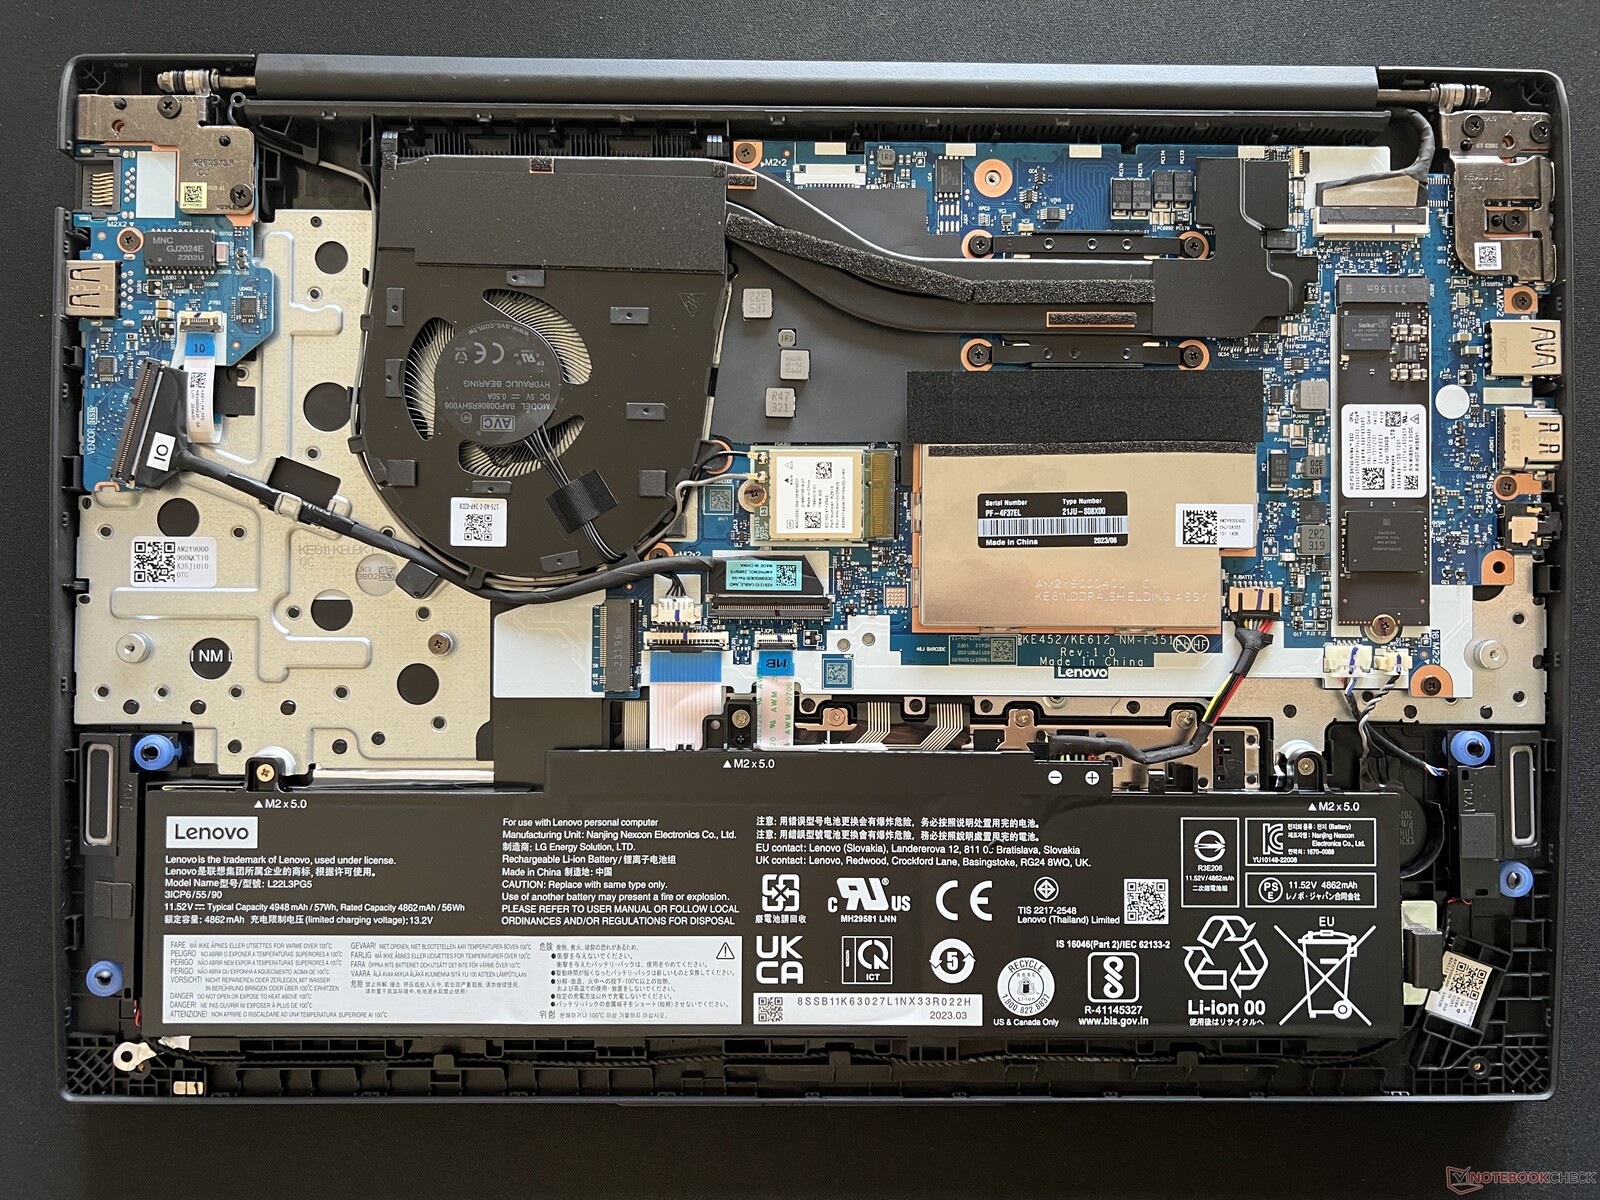
Både Intel- och AMD-versionerna stöder upp till två M.2 SSD-enheter vardera. Intel-versionen stöder dock endast enheter på upp till 42 mm i längd medan AMD-versionen kan stödja en enhet på upp till 80 mm. Detta liknar vad vi observerade mellan den mindre 14-tums ThinkPad E14 G5 Intel- och AMD-versionerna.
Garanti
En ettårig begränsad tillverkargaranti gäller vid köp i USA. Högkvalitativa ThinkPad-modeller från T-serien eller X-serien har vanligtvis tre års garanti som standard i jämförelse.
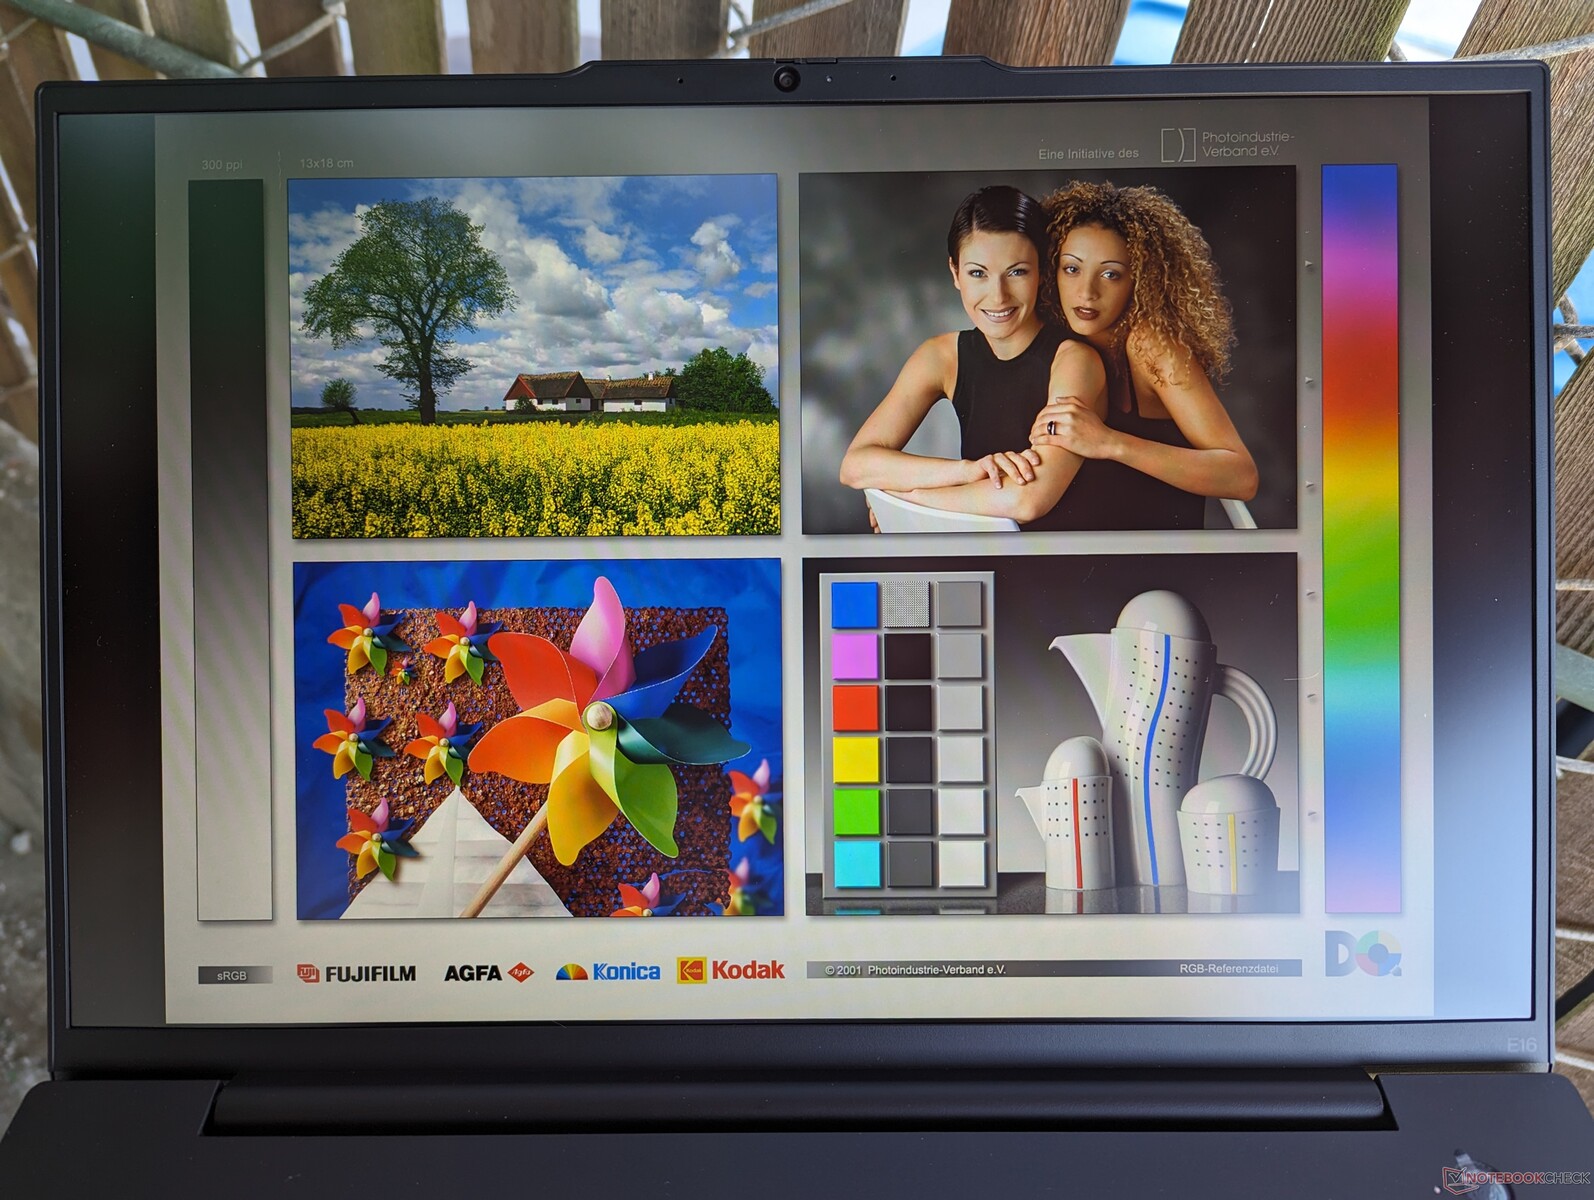
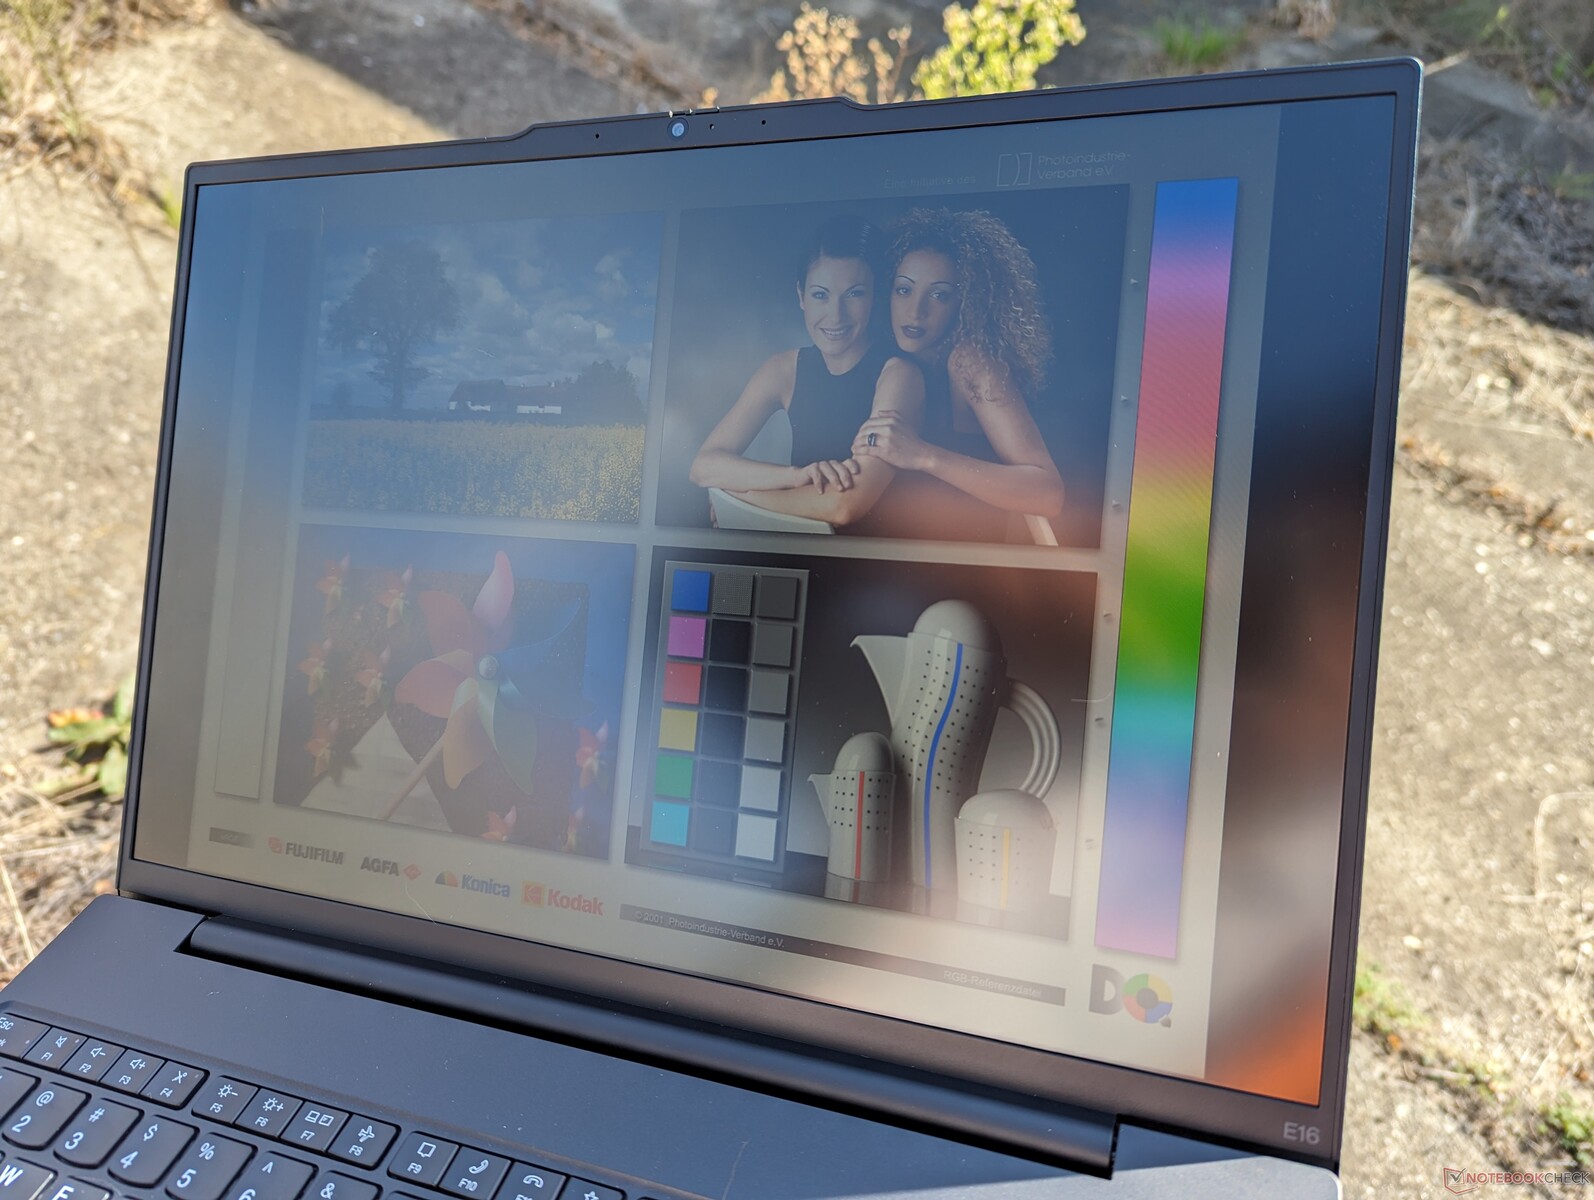
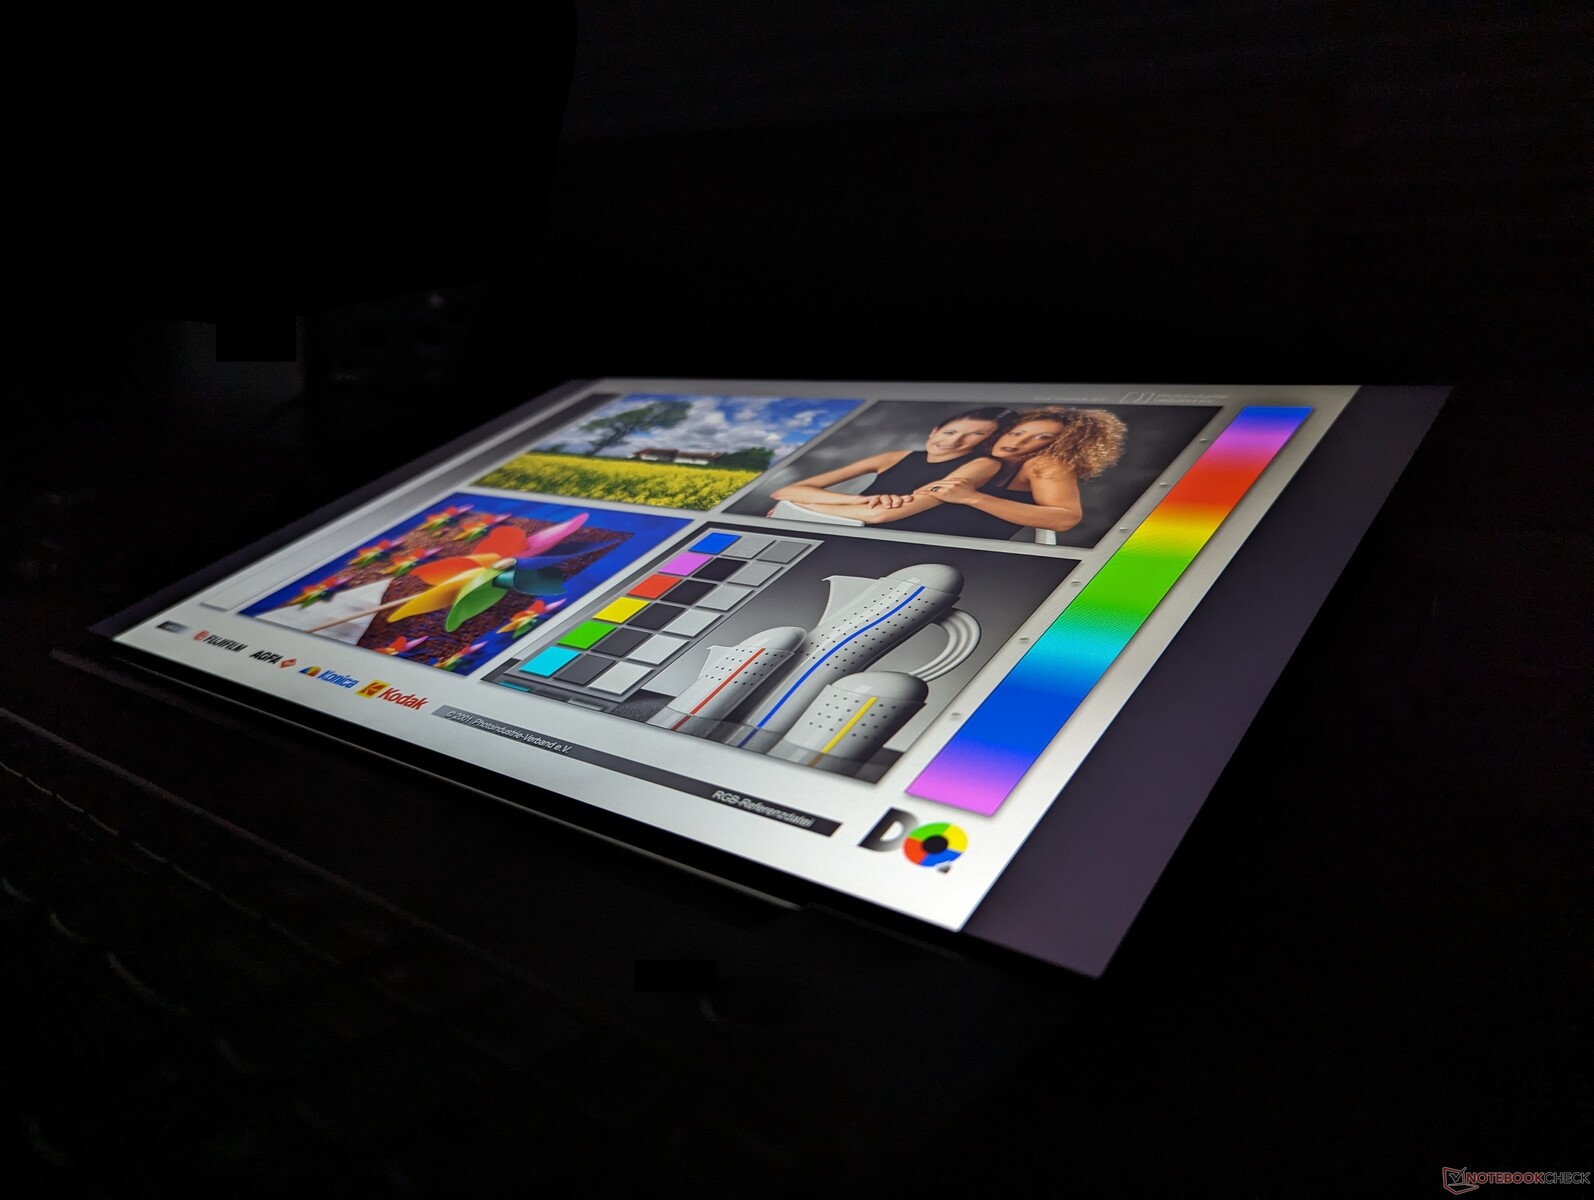
Display
Fyra IPS-mattalternativ är tillgängliga enligt följande:
- 1200p, 60% sRGB, 300 nit, 60 Hz, icke-touch
- 1200p, 60% sRGB, 300 nit, 60 Hz, pekskärm
- 1200p, 100% sRGB, 300 nit, 60 Hz, icke-touch
- 1600p, 100% sRGB, 400 nit, 60 Hz, icke-touch
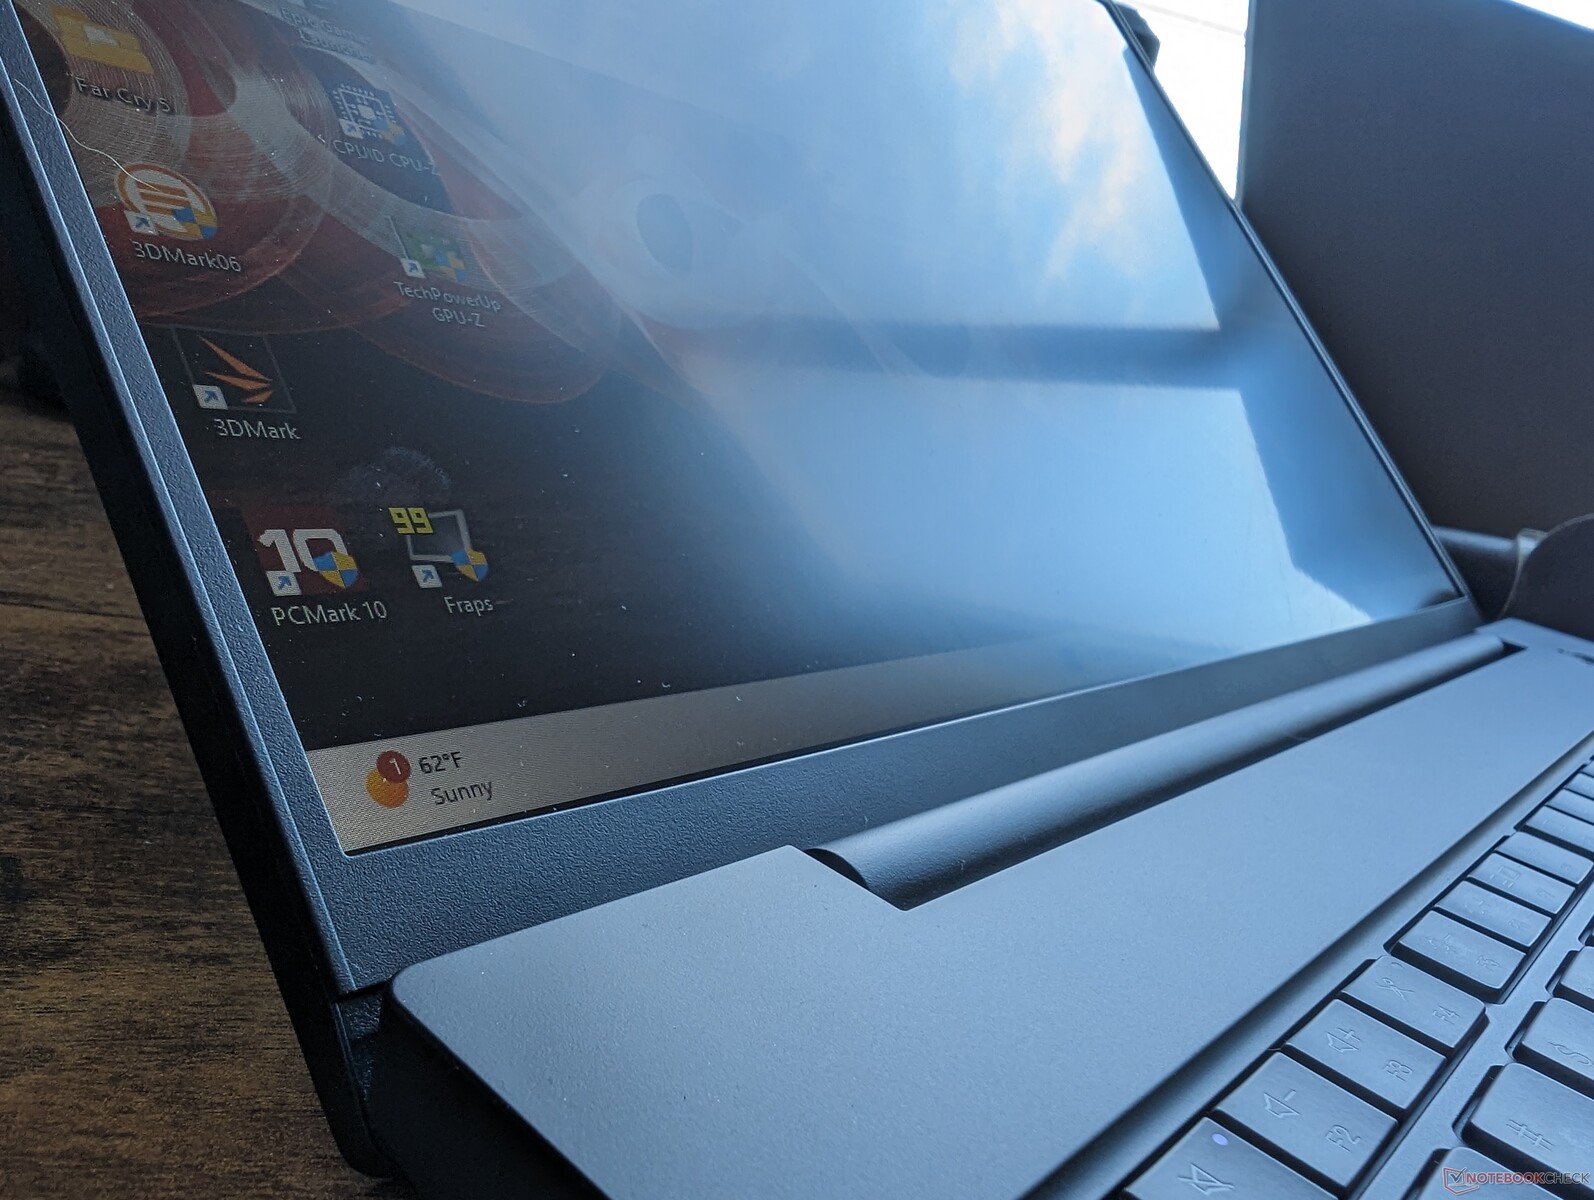
Vår specifika Intel-recensionsenhet levereras med det fetmarkerade alternativet ovan medan vår AMD-enhet levereras med 1600p-alternativet. Bildkvaliteten är som natt och dag mellan våra Intel- och AMD-enheter eftersom den senare är skarpare, mer levande och har snabbare svarstider för en märkbart bättre tittarupplevelse. Vi rekommenderar att du undviker vårt specifika panelalternativ om inte pekskärmsfunktionen är ett måste.
| |||||||||||||||||||||||||
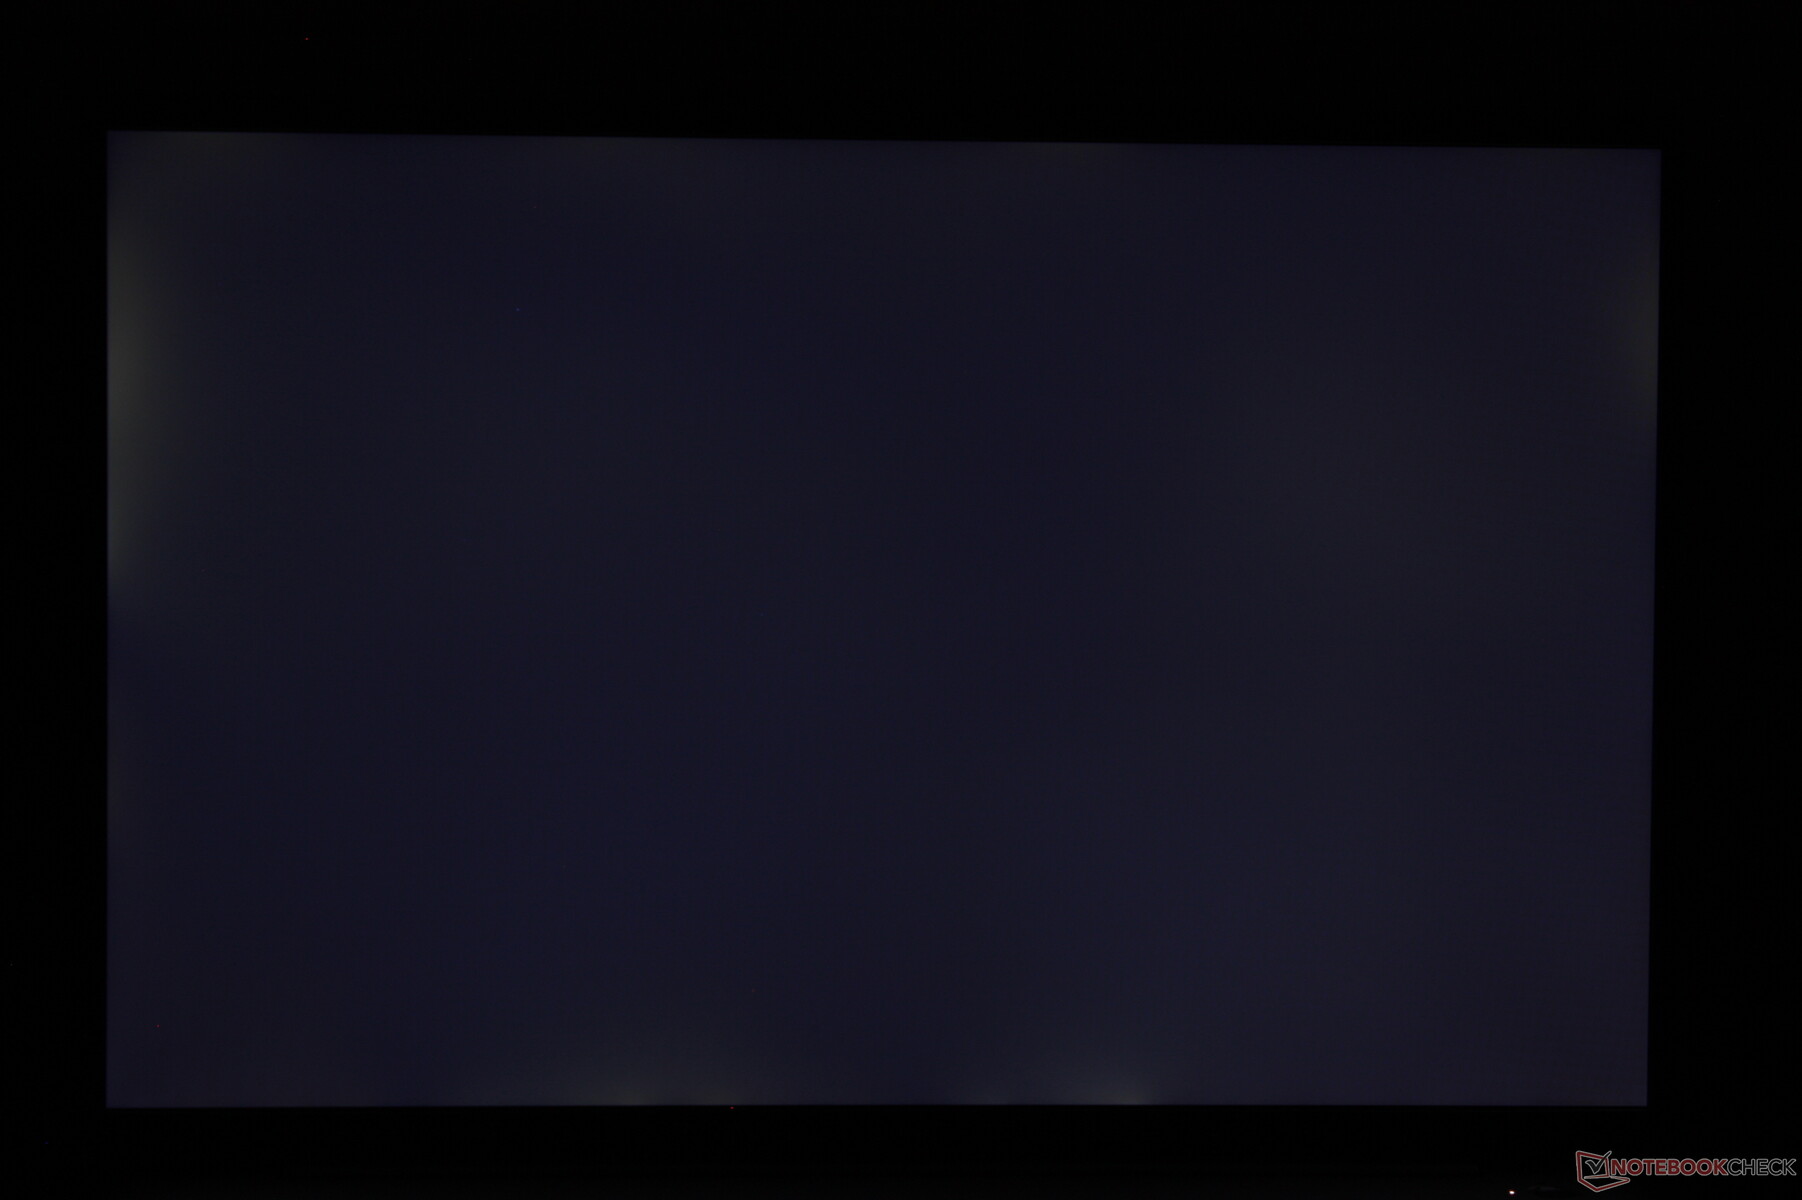
Distribution av ljusstyrkan: 91 %
Mitt på batteriet: 318.6 cd/m²
Kontrast: 1099:1 (Svärta: 0.29 cd/m²)
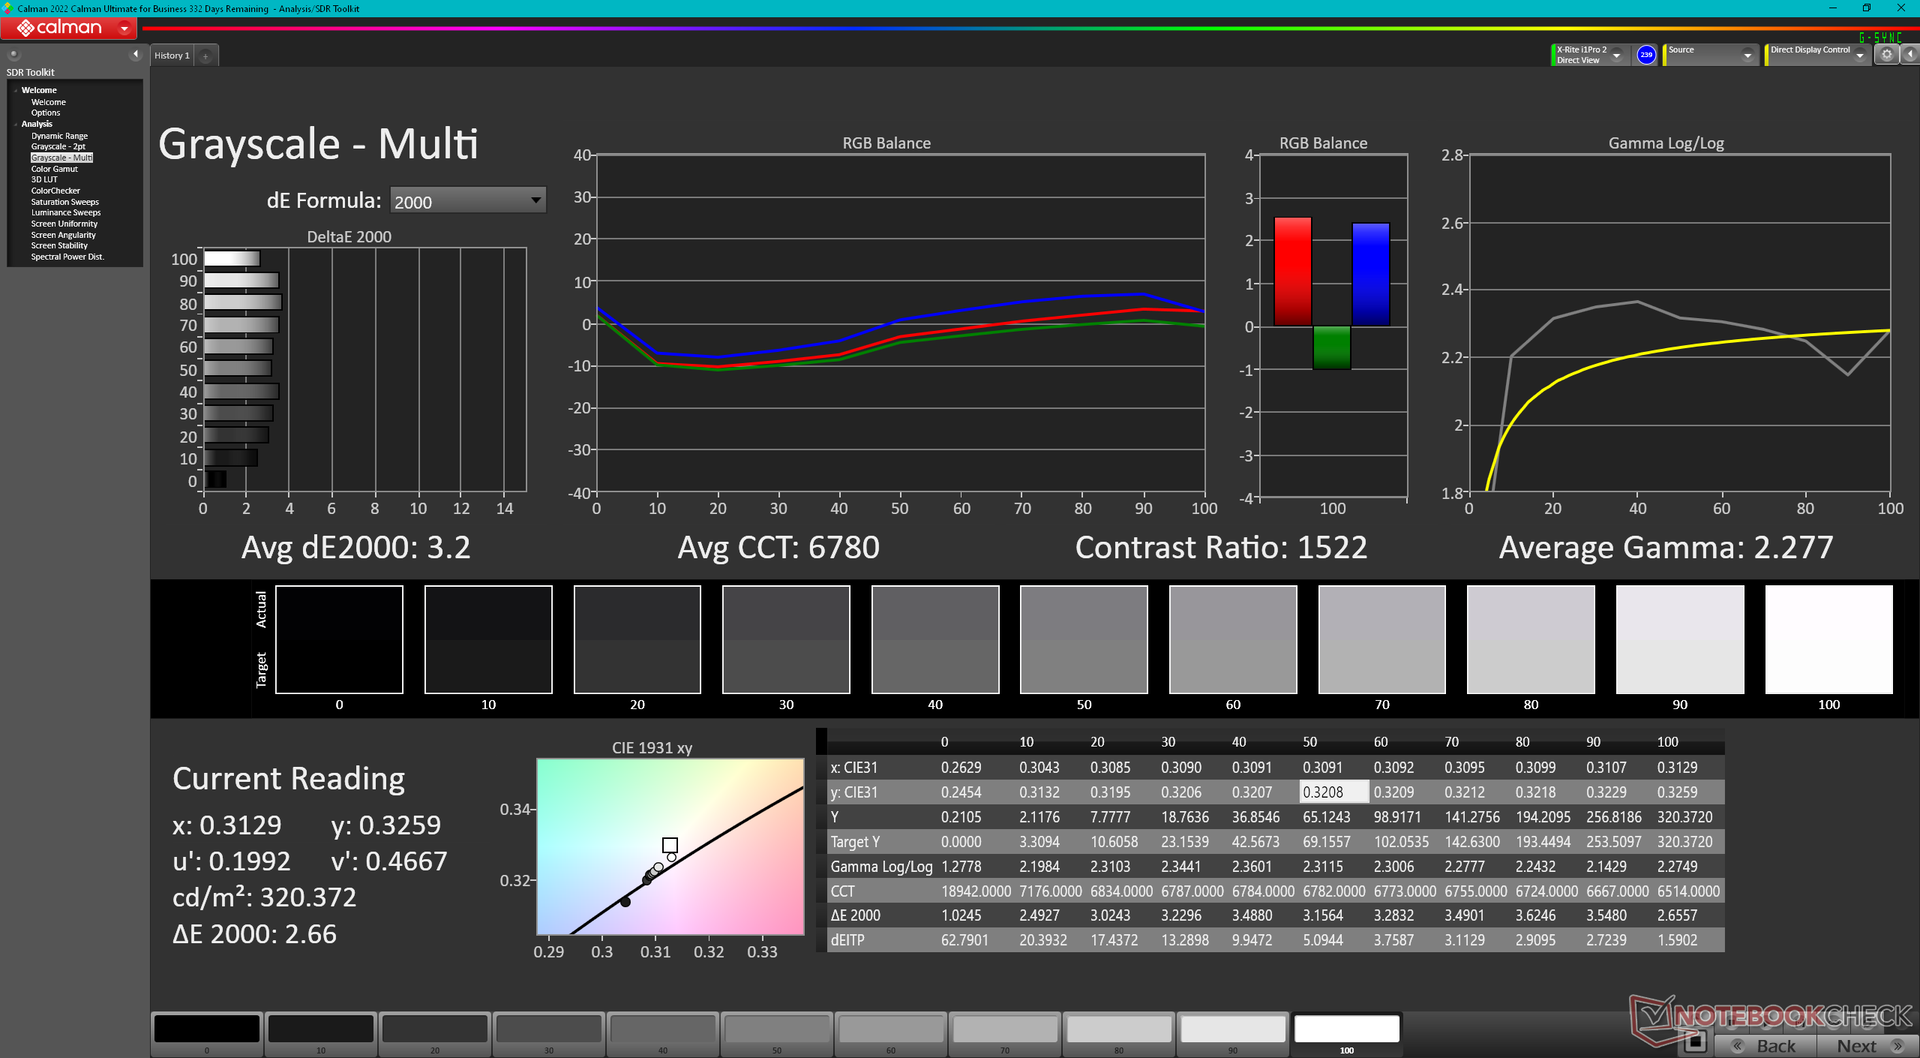
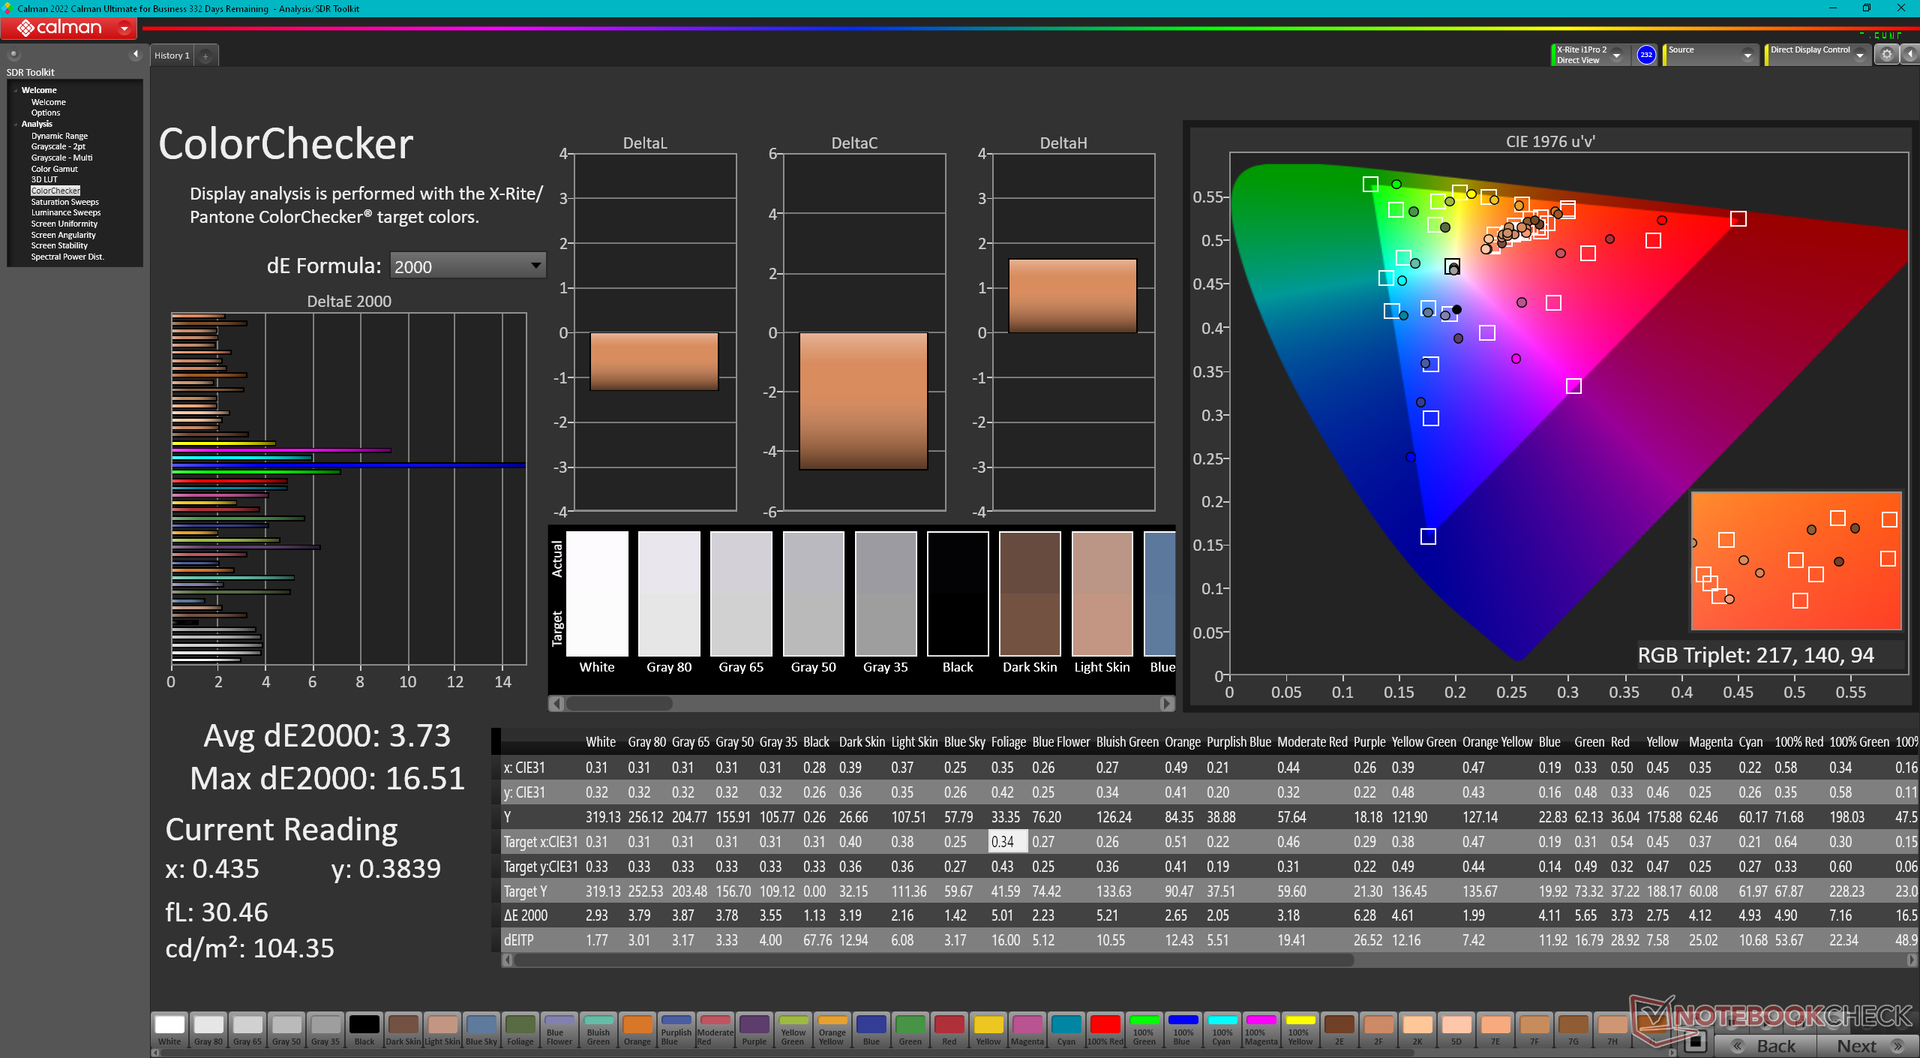
ΔE ColorChecker Calman: 3.73 | ∀{0.5-29.43 Ø4.73}
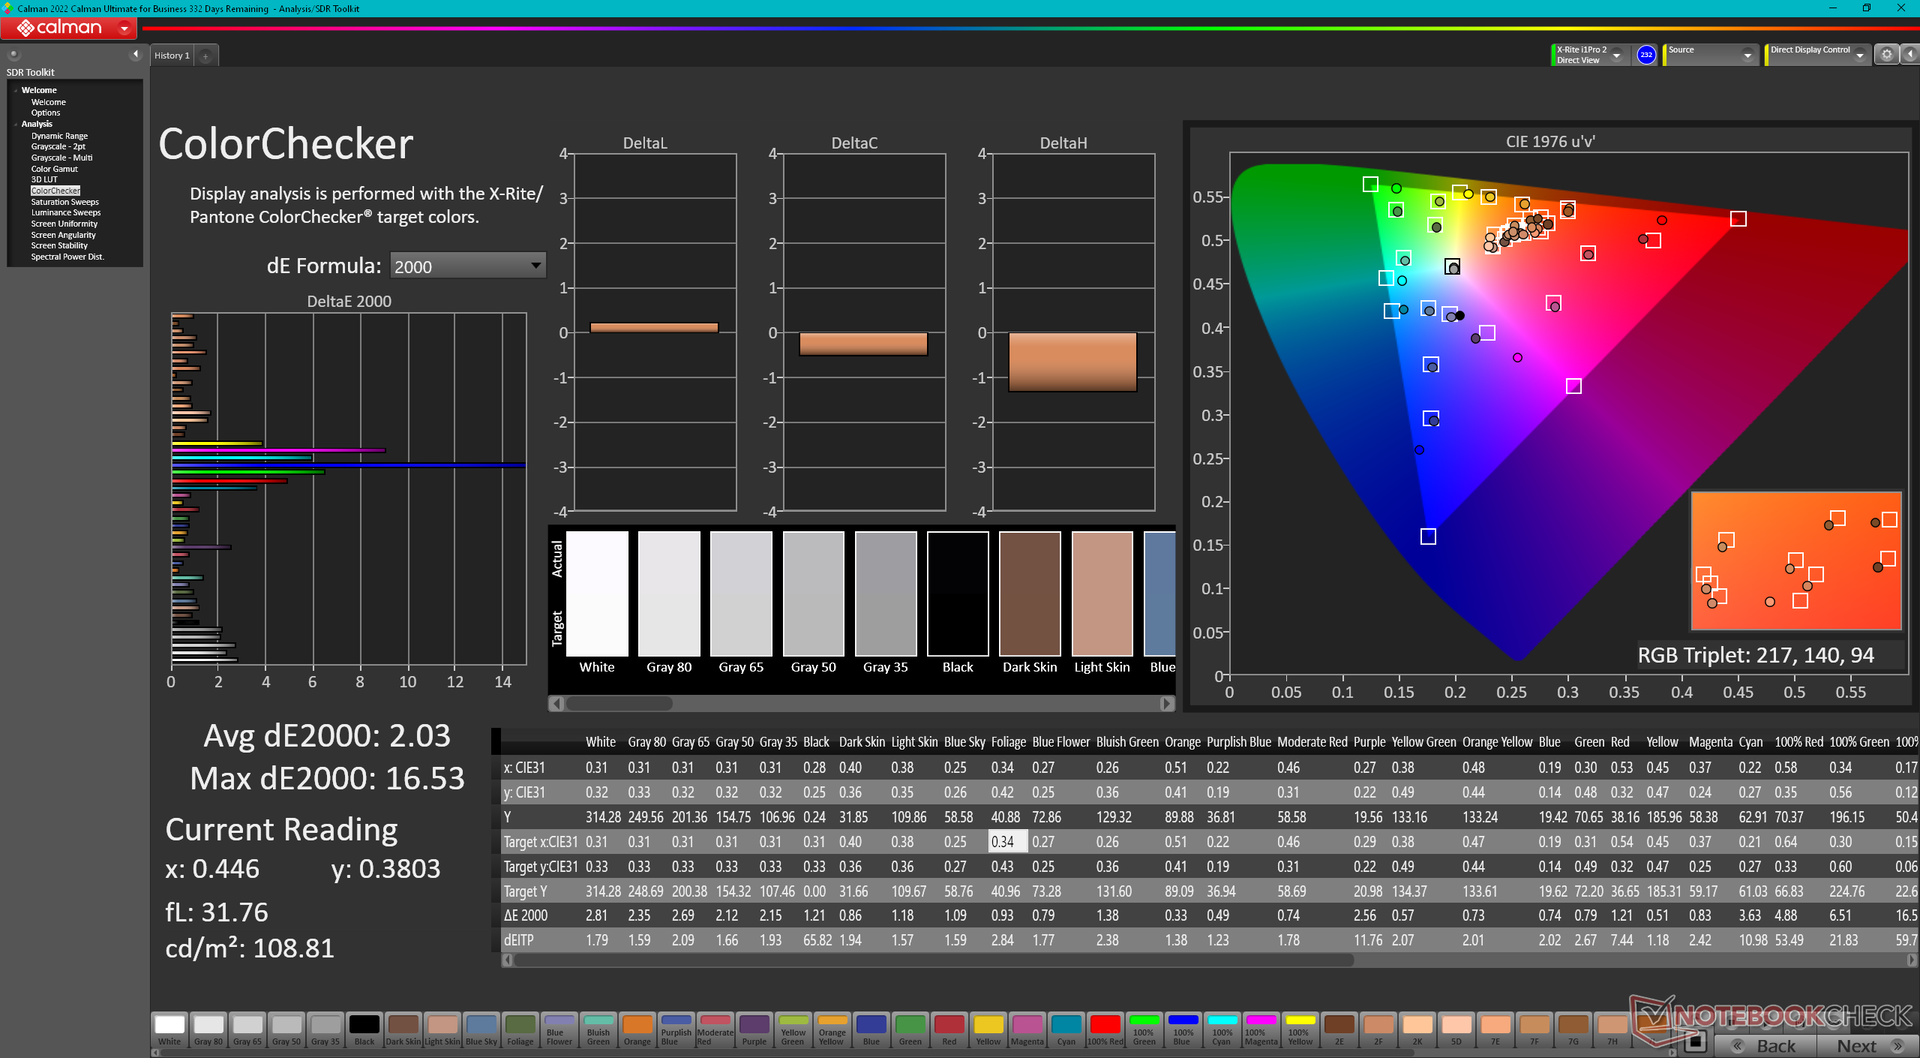
calibrated: 2.03
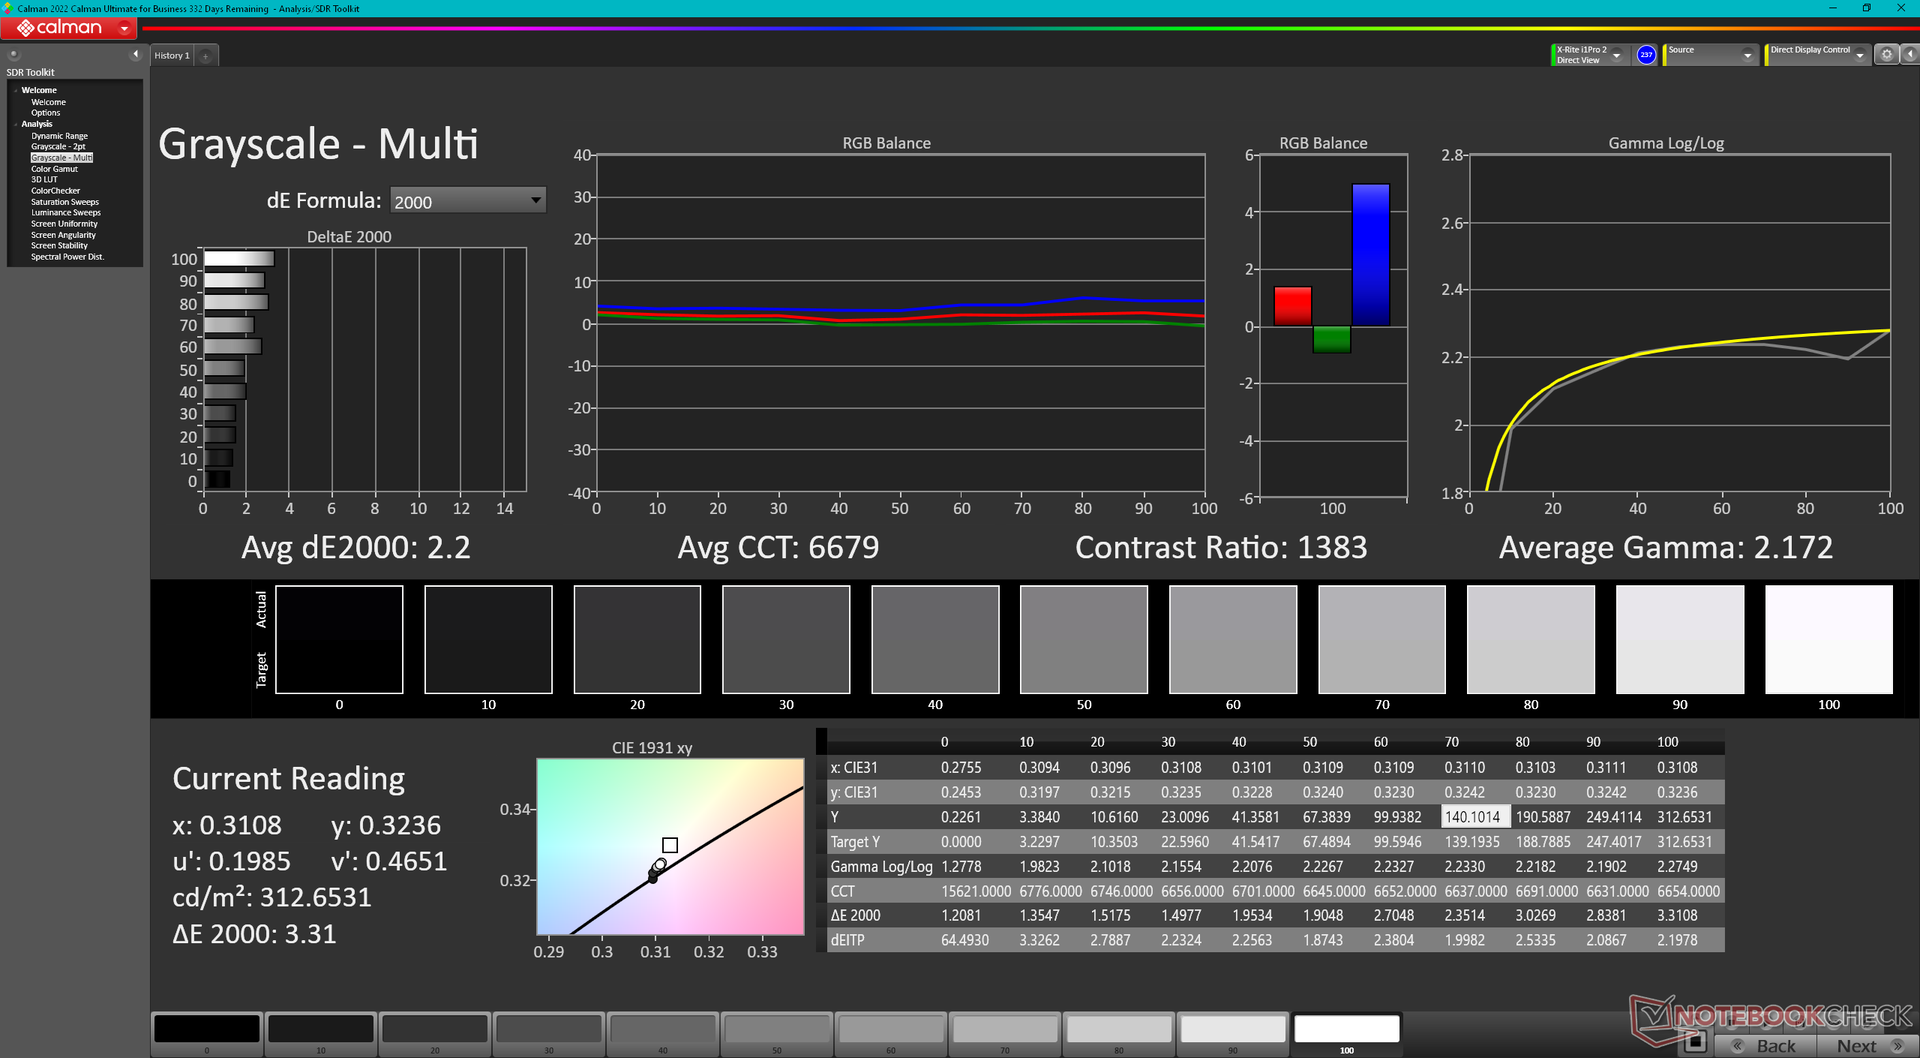
ΔE Greyscale Calman: 3.2 | ∀{0.09-98 Ø4.97}
43.3% AdobeRGB 1998 (Argyll 3D)
62.6% sRGB (Argyll 3D)
42% Display P3 (Argyll 3D)
Gamma: 2.28
CCT: 6780 K
| Lenovo ThinkPad E16 G1 Core i5-1335U R160NW41 R2, IPS, 1920x1200, 16" | Lenovo ThinkPad E16 G1-21JUS08X00 MNG007DA1-C, IPS, 2560x1600, 16" | Dell Inspiron 16 7635 2-in-1 Chi Mei 160JCA, IPS, 1920x1200, 16" | Acer TravelMate P4 TMP416-51-55KN BOE BOE0A32, IPS, 1920x1200, 16" | Samsung Galaxy Book3 Pro 16 Samsung ATNA60CL03-0, AMOLED, 2880x1800, 16" | LG Gram 16Z90Q LG LP160WQ1-SPB2 (LGD06EB), IPS, 2560x1600, 16" | |
|---|---|---|---|---|---|---|
| Display | 58% | 59% | -7% | 107% | 95% | |
| Display P3 Coverage (%) | 42 | 67.6 61% | 67.4 60% | 38.9 -7% | 99.7 137% | 96.8 130% |
| sRGB Coverage (%) | 62.6 | 95.3 52% | 98.2 57% | 58.1 -7% | 100 60% | 99.9 60% |
| AdobeRGB 1998 Coverage (%) | 43.3 | 70 62% | 69.5 61% | 40.2 -7% | 97 124% | 84.6 95% |
| Response Times | 30% | 38% | 62% | 95% | 16% | |
| Response Time Grey 50% / Grey 80% * (ms) | 46.4 ? | 32.4 ? 30% | 27.6 ? 41% | 20 ? 57% | 2 ? 96% | 45.7 ? 2% |
| Response Time Black / White * (ms) | 27.6 ? | 19.6 ? 29% | 18.2 ? 34% | 9 ? 67% | 2 ? 93% | 19.7 ? 29% |
| PWM Frequency (Hz) | ||||||
| Screen | 30% | 12% | -20% | 295% | 13% | |
| Brightness middle (cd/m²) | 318.6 | 404 27% | 301.3 -5% | 269 -16% | 412 29% | 366 15% |
| Brightness (cd/m²) | 302 | 389 29% | 269 -11% | 265 -12% | 412 36% | 347 15% |
| Brightness Distribution (%) | 91 | 91 0% | 79 -13% | 94 3% | 98 8% | 89 -2% |
| Black Level * (cd/m²) | 0.29 | 0.24 17% | 0.28 3% | 0.305 -5% | 0.015 95% | 0.32 -10% |
| Contrast (:1) | 1099 | 1683 53% | 1076 -2% | 882 -20% | 27467 2399% | 1144 4% |
| Colorchecker dE 2000 * | 3.73 | 2.1 44% | 3.1 17% | 4.89 -31% | 2.34 37% | 2.82 24% |
| Colorchecker dE 2000 max. * | 16.51 | 4.2 75% | 5.5 67% | 8.81 47% | 3.34 80% | 4.65 72% |
| Colorchecker dE 2000 calibrated * | 2.03 | 1.4 31% | 0.49 76% | 5.12 -152% | 2.95 -45% | 2.69 -33% |
| Greyscale dE 2000 * | 3.2 | 3.3 -3% | 3.9 -22% | 2.91 9% | 2.78 13% | 2.3 28% |
| Gamma | 2.28 96% | 2.24 98% | 2.19 100% | 2.28 96% | 2.5 88% | 1.971 112% |
| CCT | 6780 96% | 7038 92% | 6186 105% | 6920 94% | 6879 94% | 6796 96% |
| Totalt genomsnitt (program/inställningar) | 39% /
36% | 36% /
26% | 12% /
-5% | 166% /
226% | 41% /
31% |
* ... mindre är bättre
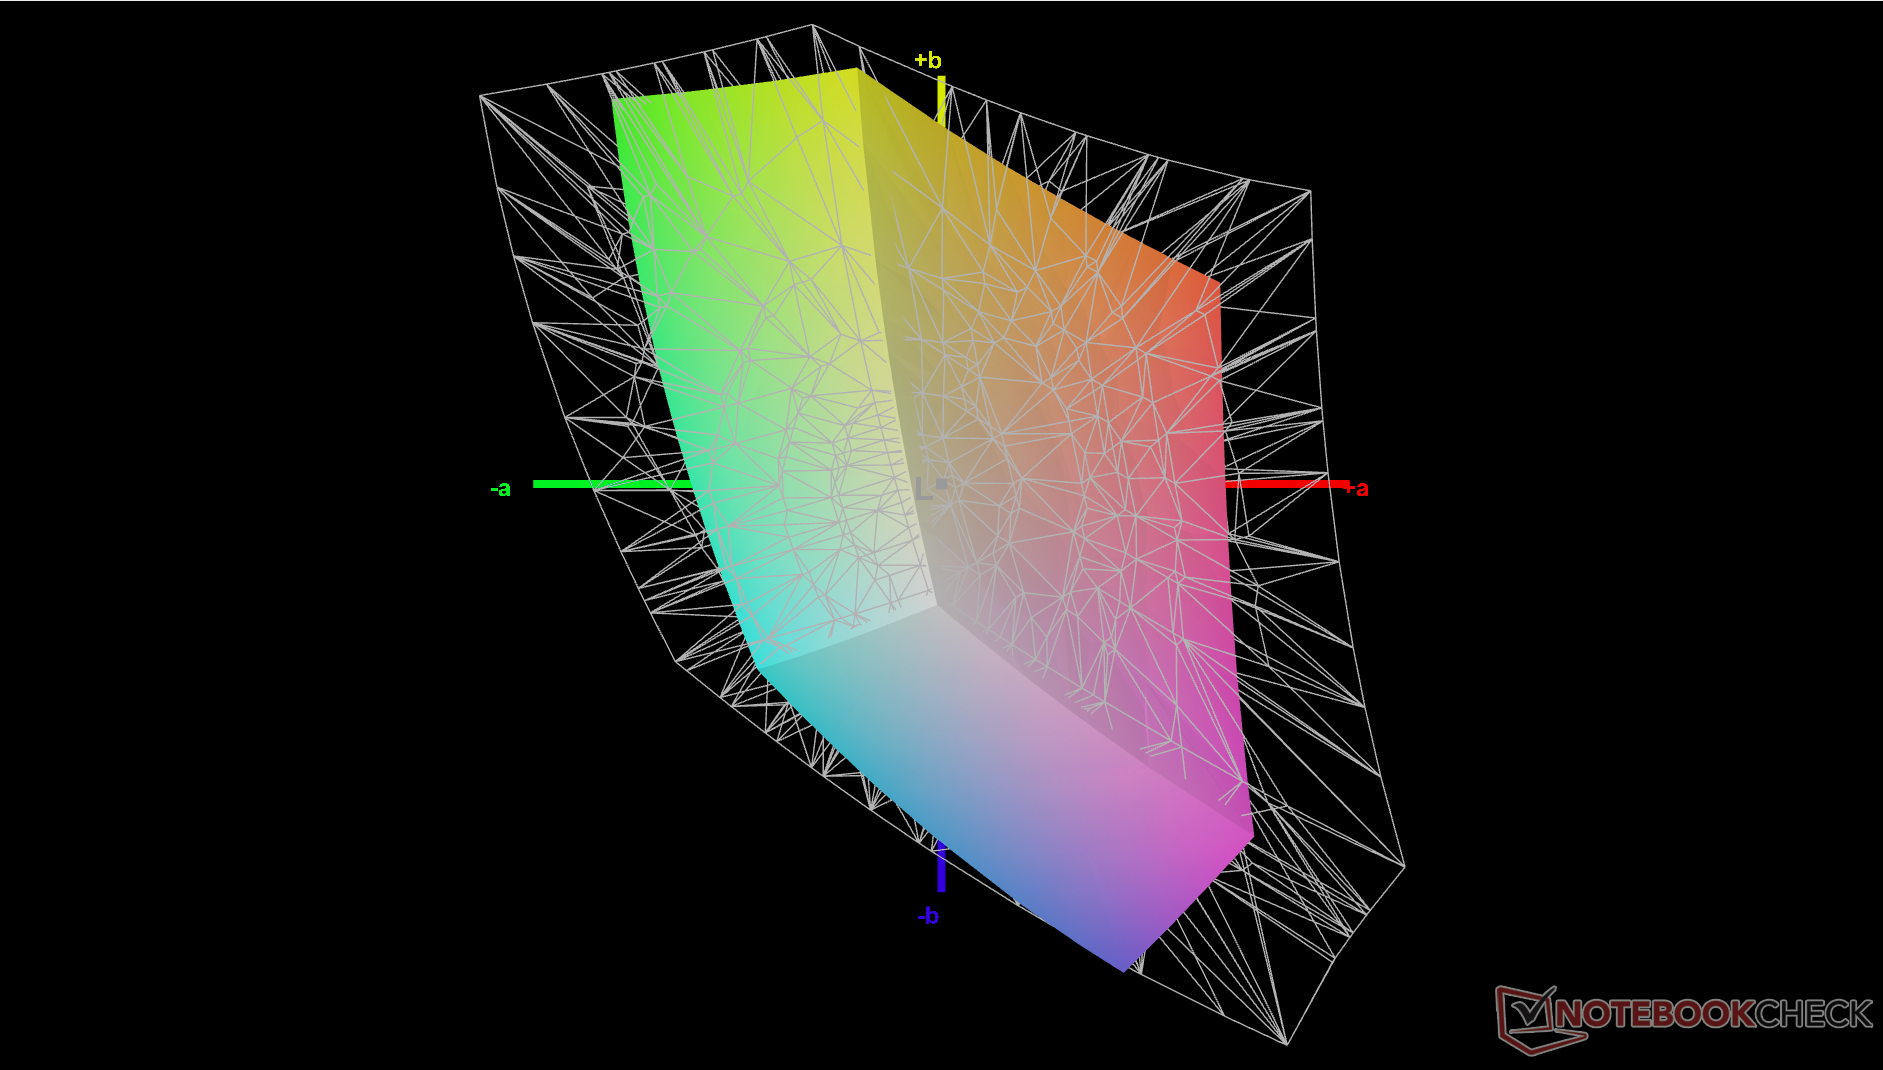
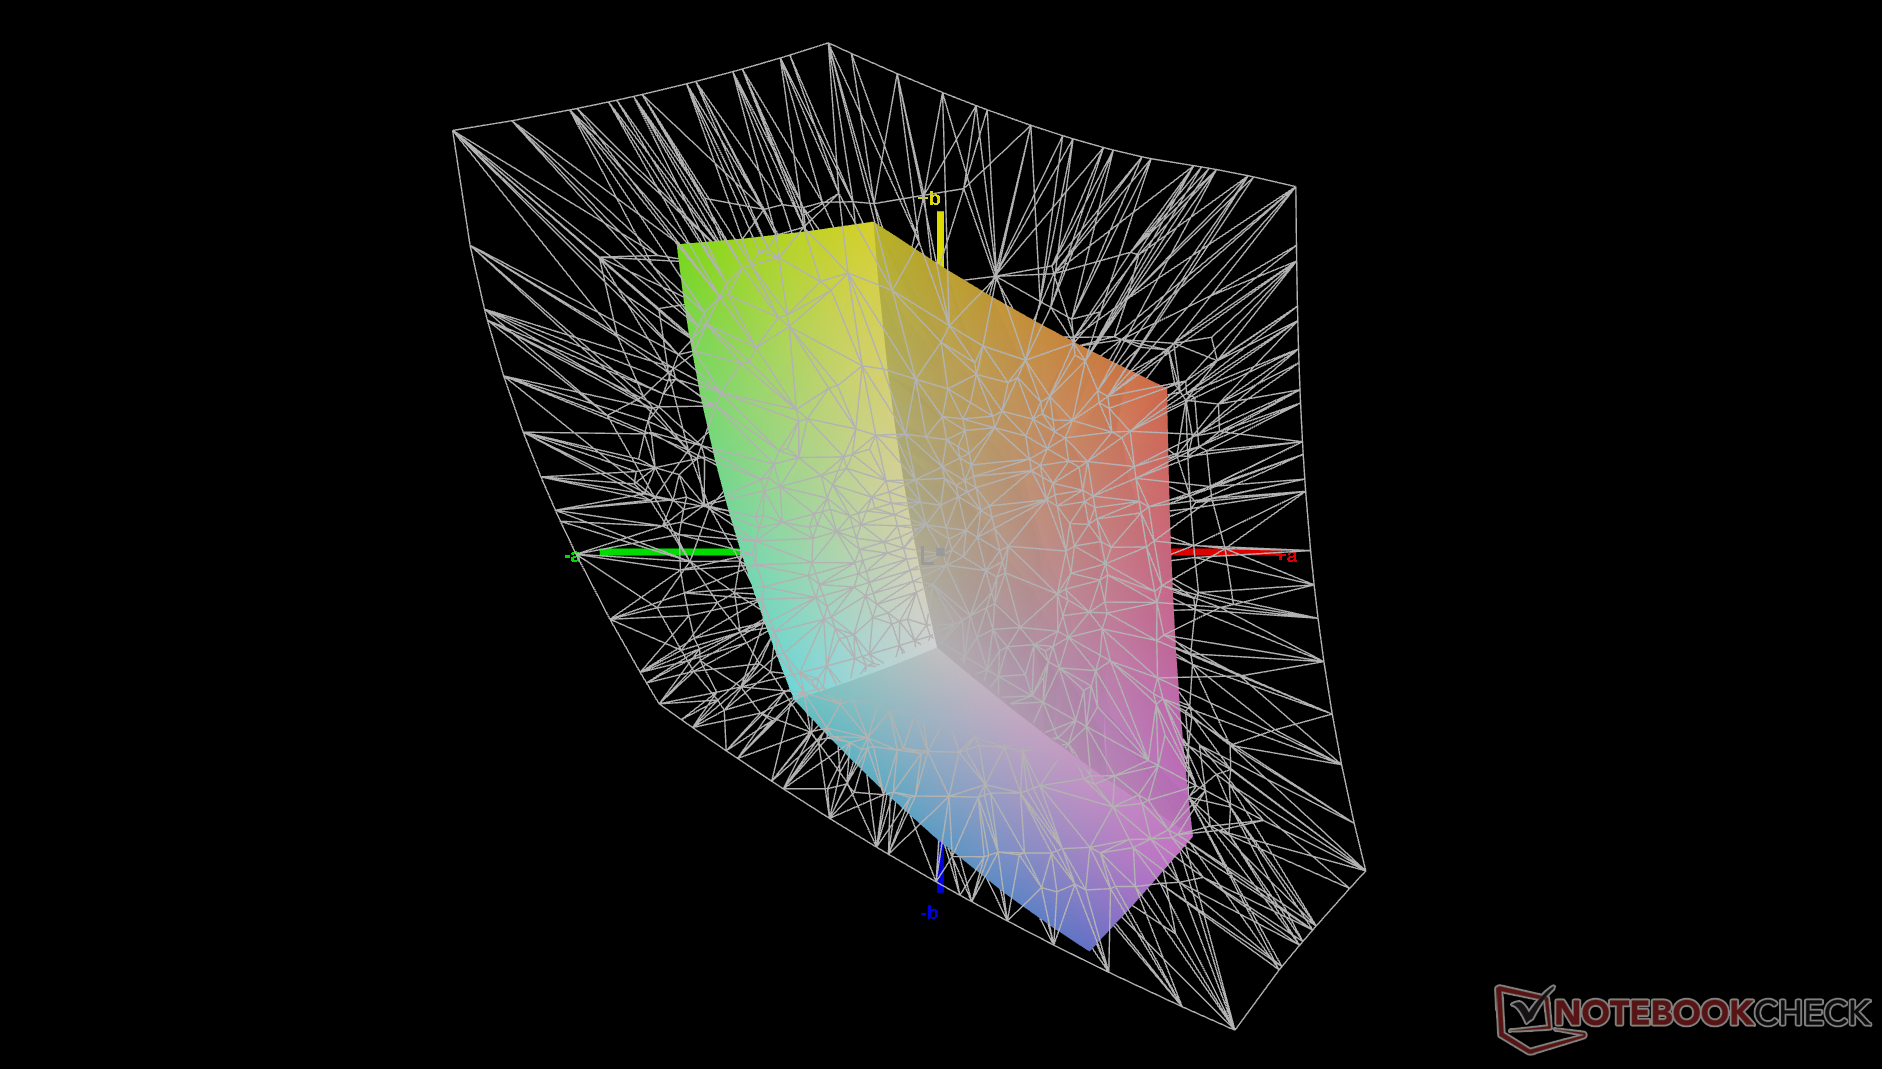
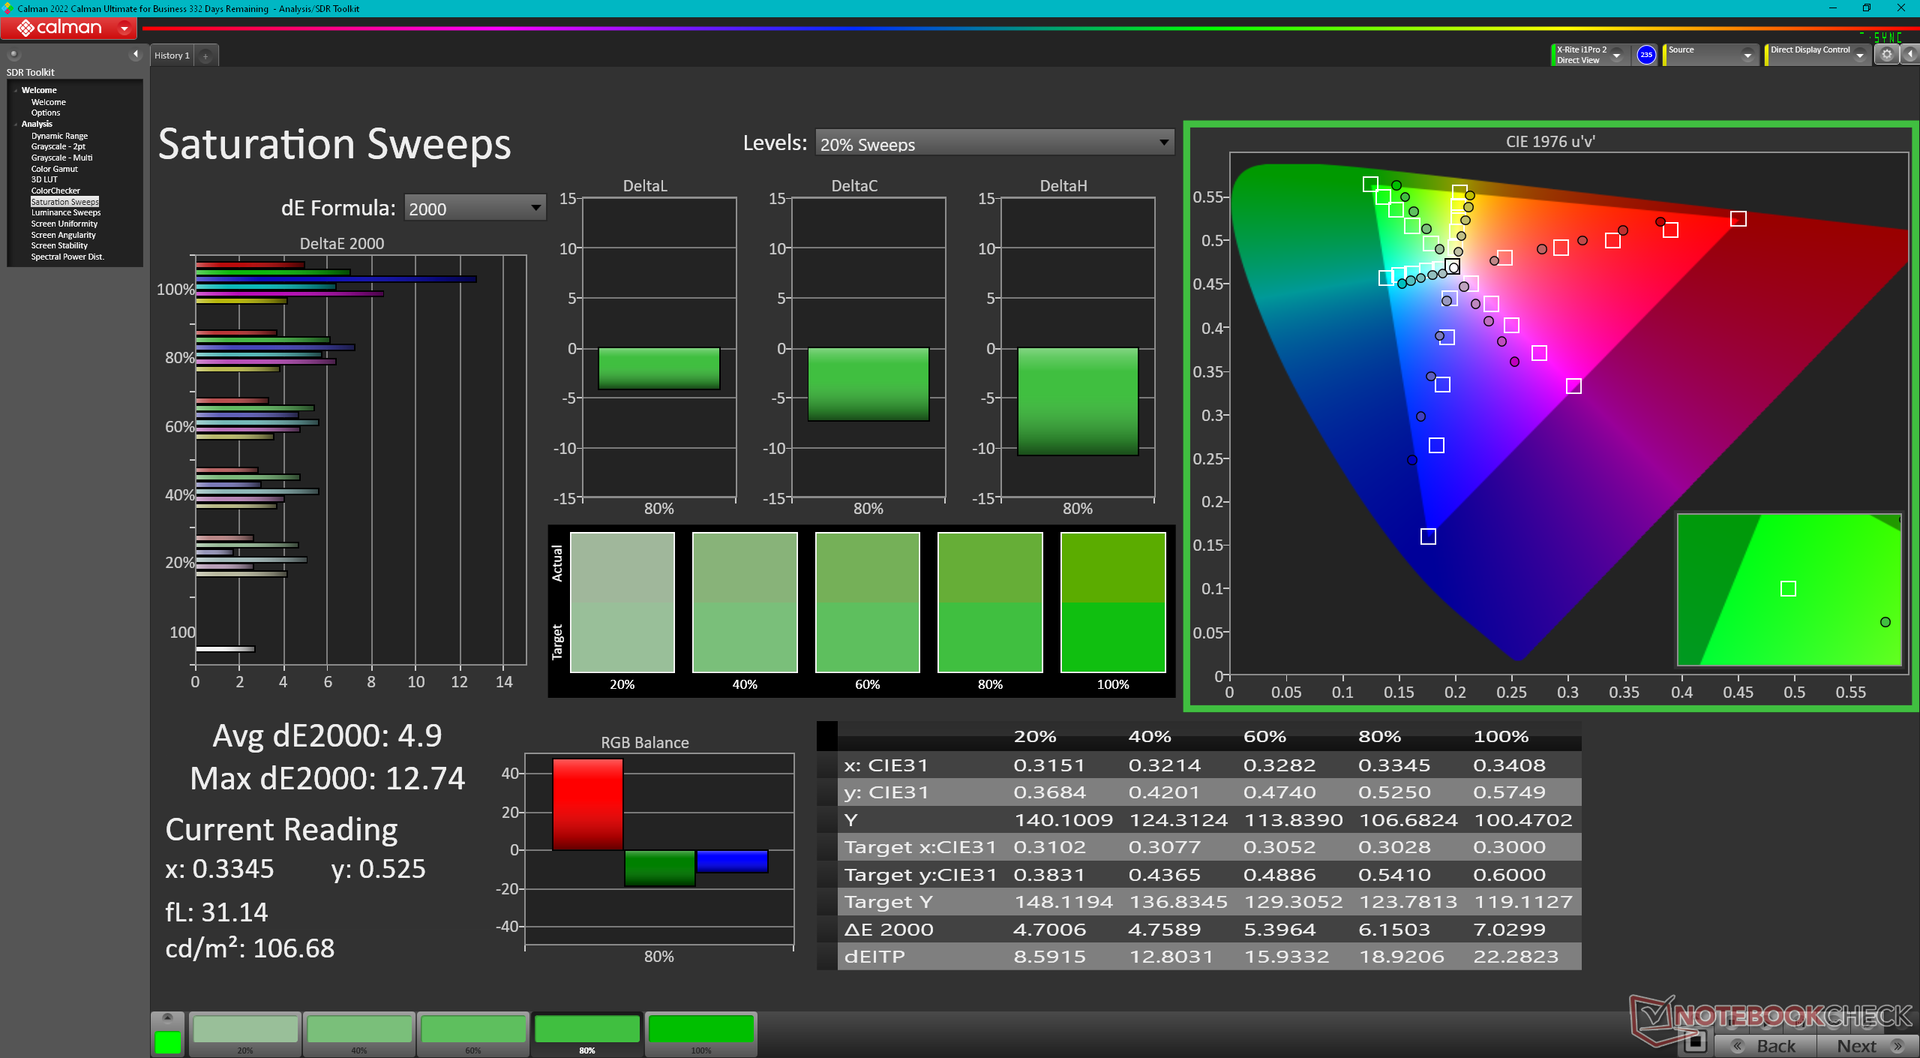
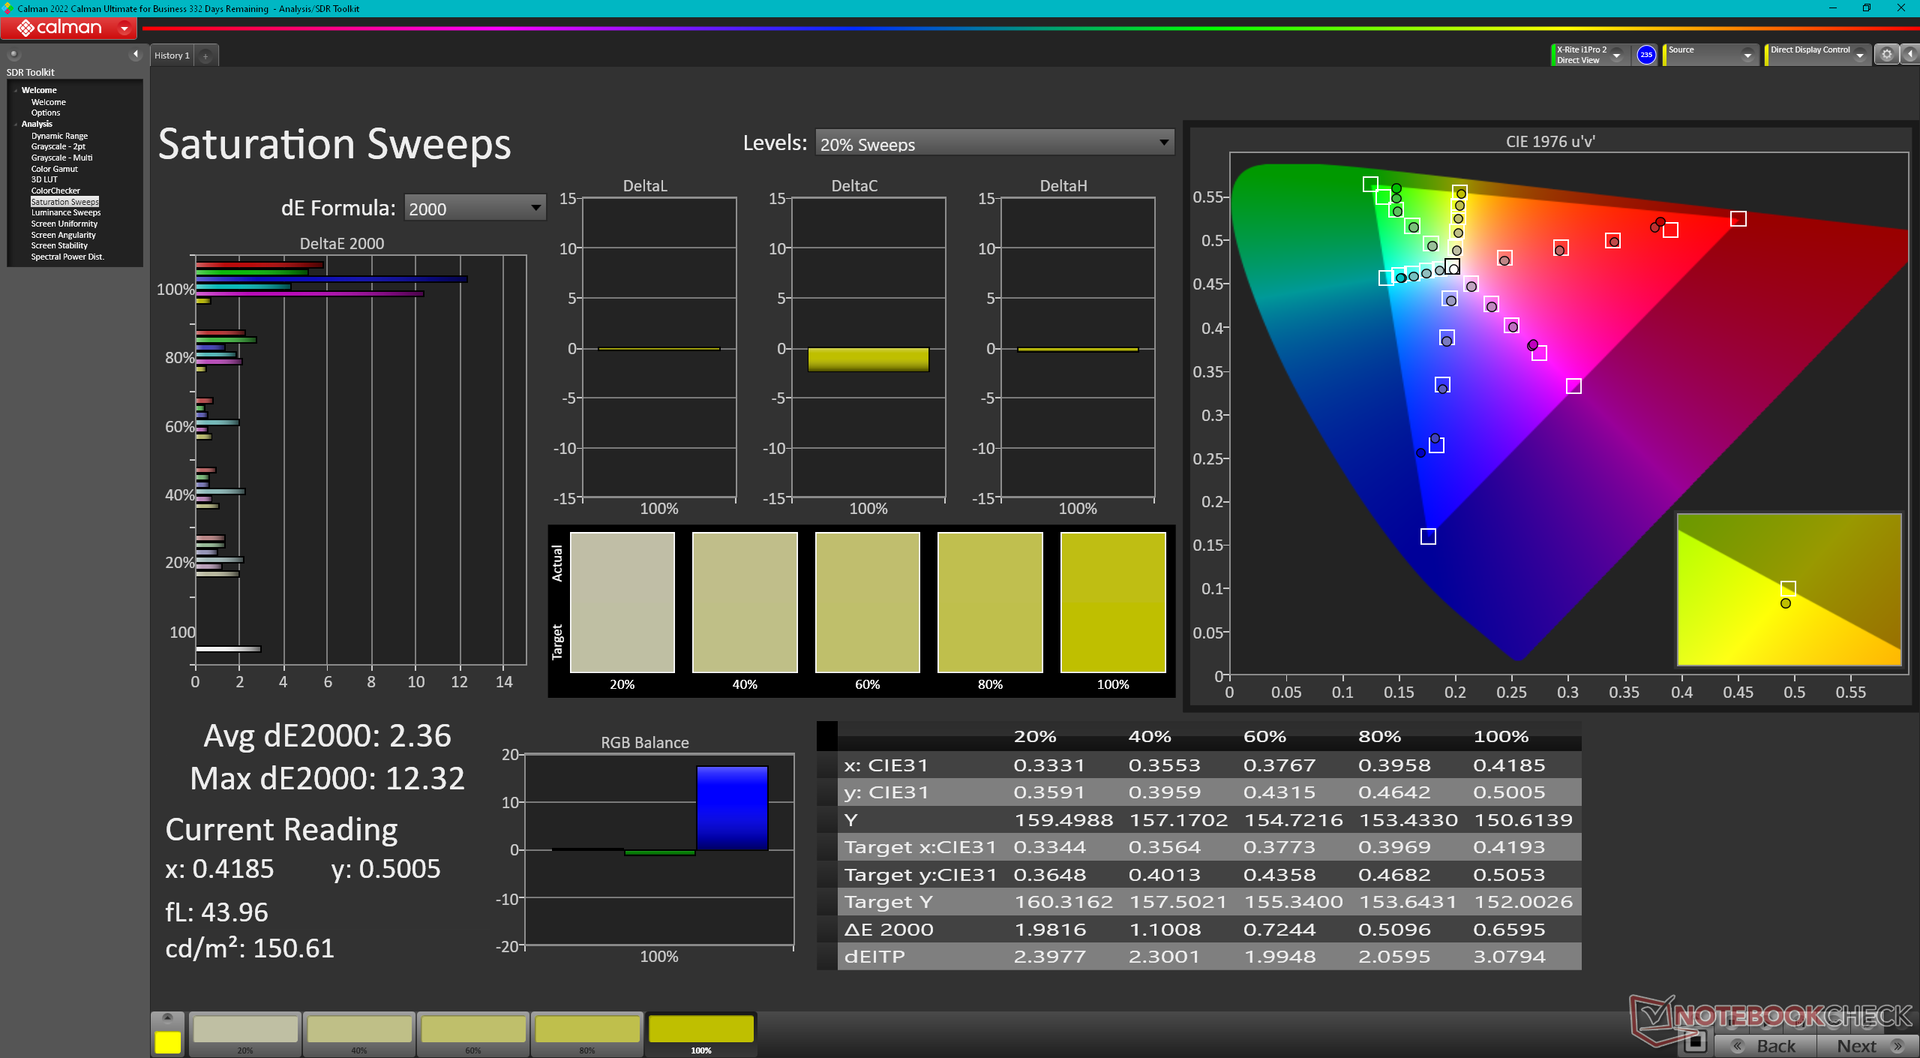
Kalibrering av skärmen med en X-Rite-kolorimeter skulle förbättra de genomsnittliga deltaE-värdena för gråskala och färg något från 3,2 och 3,73 till 2,2 respektive 2,03. Färgerna blir dock fortfarande alltmer felaktiga vid högre mättnadsnivåer på grund av den smala sRGB-färgtäckningen som nämndes ovan.
Visa svarstider
| ↔ Svarstid svart till vitt | ||
|---|---|---|
| 27.6 ms ... stiga ↗ och falla ↘ kombinerat | ↗ 12.9 ms stiga | 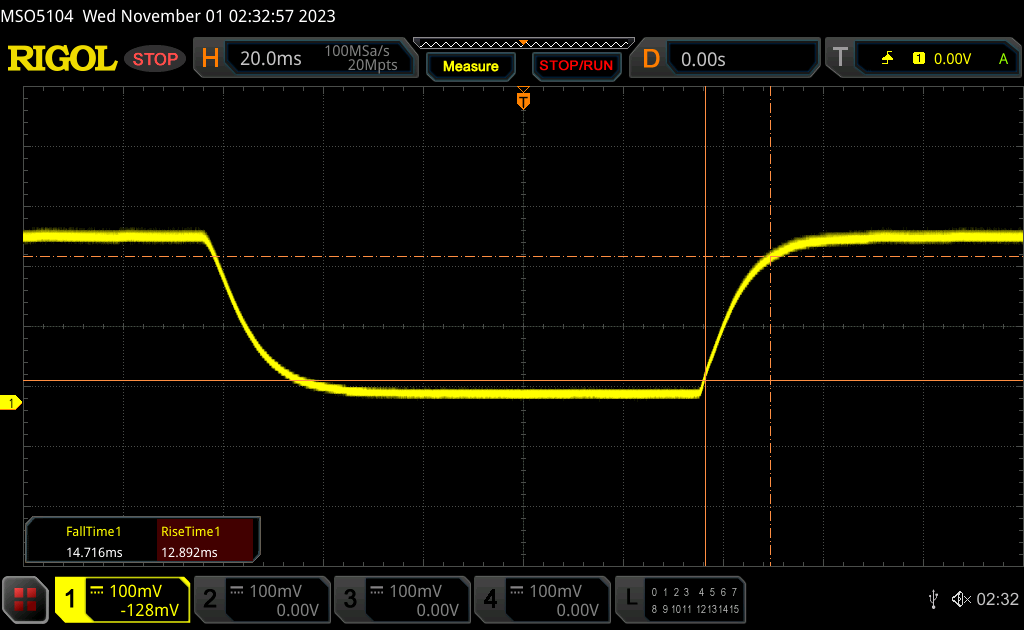 |
| ↘ 14.7 ms hösten | ||
| Skärmen visar relativt långsamma svarsfrekvenser i våra tester och kan vara för långsam för spelare. I jämförelse sträcker sig alla testade enheter från 0.1 (minst) till 240 (maximalt) ms. » 70 % av alla enheter är bättre. Detta innebär att den uppmätta svarstiden är sämre än genomsnittet av alla testade enheter (19.9 ms). | ||
| ↔ Svarstid 50 % grått till 80 % grått | ||
| 46.4 ms ... stiga ↗ och falla ↘ kombinerat | ↗ 19.5 ms stiga | 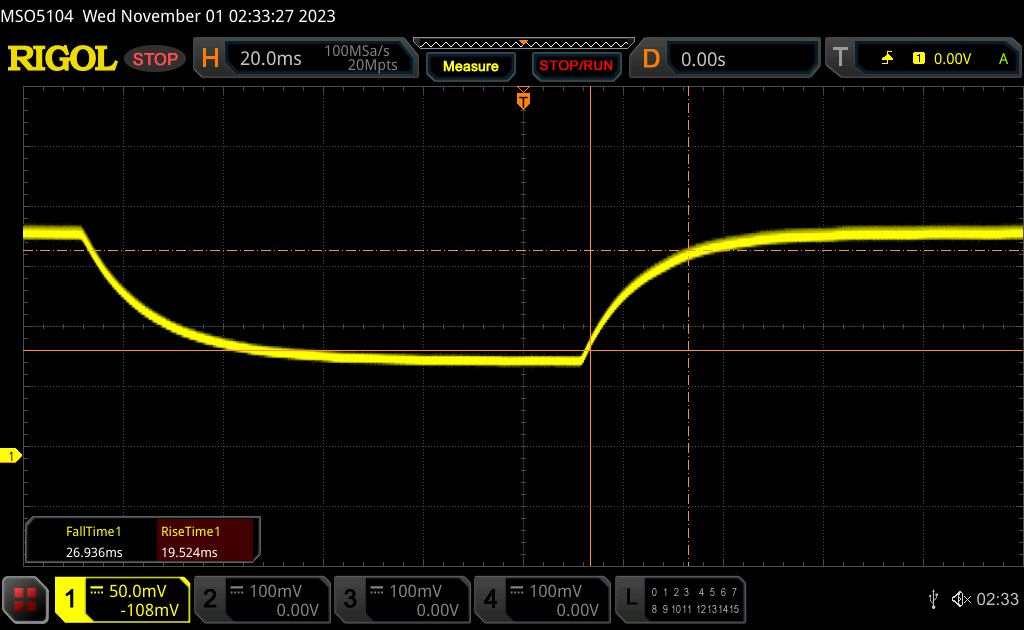 |
| ↘ 26.9 ms hösten | ||
| Skärmen visar långsamma svarsfrekvenser i våra tester och kommer att vara otillfredsställande för spelare. I jämförelse sträcker sig alla testade enheter från 0.165 (minst) till 636 (maximalt) ms. » 80 % av alla enheter är bättre. Detta innebär att den uppmätta svarstiden är sämre än genomsnittet av alla testade enheter (31.1 ms). | ||
Skärmflimmer / PWM (Puls-Width Modulation)
| Skärmflimmer / PWM upptäcktes inte | 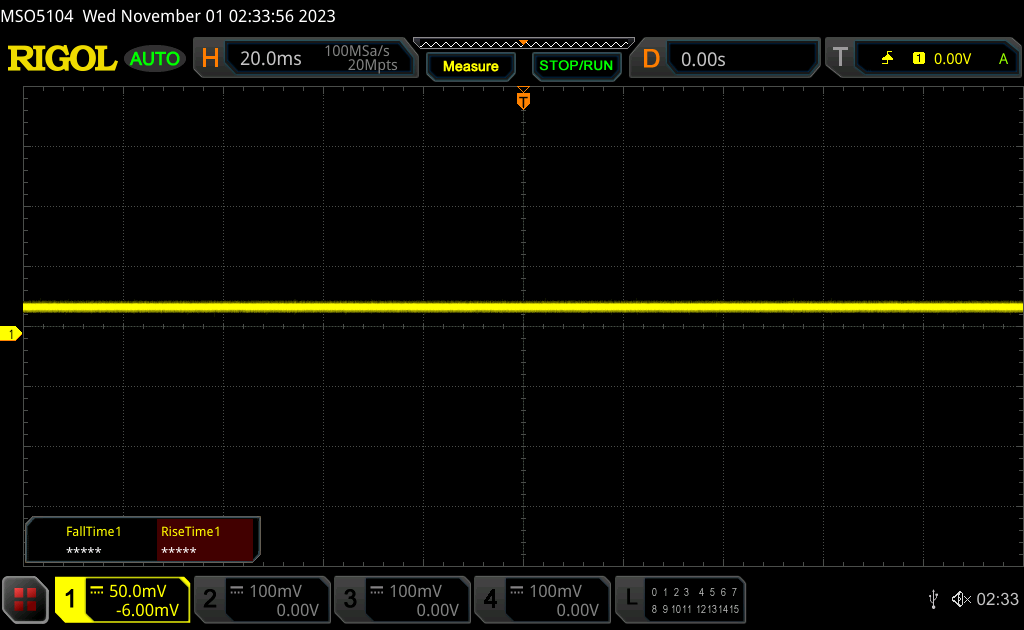 | ||
Som jämförelse: 52 % av alla testade enheter använder inte PWM för att dämpa skärmen. Om PWM upptäcktes mättes ett medelvärde av 7798 (minst: 5 - maximum: 343500) Hz. | |||
Prestanda
Villkor för testning
Vi ställde in Windows på prestandaläge innan vi körde riktmärkena nedan. Användare bör bekanta sig med den inbyggda Vantage-programvaran eftersom den är det centrala navet för Lenovo-specifika funktioner och BIOS-uppdateringar.


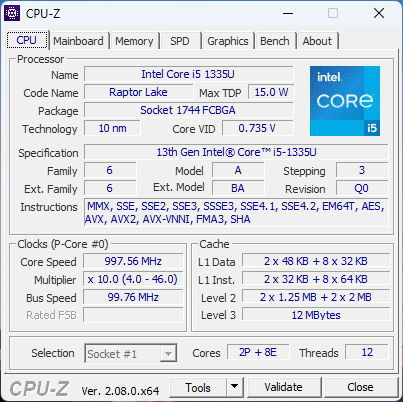
Processor
Till skillnad från de flesta andra Core i5- och Core i7-processorer Core i5-1335U mycket närmare den dyrare Core i7-1355U än vad man först skulle kunna tro. Benchmarks rankar vår Core i5-1335U bara 5 till 10 procent långsammare än Core i7-1355U, vilket innebär att du kan spara flera hundra dollar genom att välja Core i5-konfigurationen om du inte har något emot det mindre CPU-prestandaunderskottet. Den största anledningen till att välja Core i7-alternativet är istället relaterad till dess integrerade grafik, vilket framgår av avsnittet GPU-prestanda nedan.
Jämfört med Ryzen 7 7730U är vår Intel Core i5-version cirka 10 till 15 procent långsammare i flertrådsprestanda medan motsatsen är sant när det gäller enkeltrådsprestanda.
Cinebench R15 Multi Loop
Cinebench R23: Multi Core | Single Core
Cinebench R20: CPU (Multi Core) | CPU (Single Core)
Cinebench R15: CPU Multi 64Bit | CPU Single 64Bit
Blender: v2.79 BMW27 CPU
7-Zip 18.03: 7z b 4 | 7z b 4 -mmt1
Geekbench 5.5: Multi-Core | Single-Core
HWBOT x265 Benchmark v2.2: 4k Preset
LibreOffice : 20 Documents To PDF
R Benchmark 2.5: Overall mean
* ... mindre är bättre
AIDA64: FP32 Ray-Trace | FPU Julia | CPU SHA3 | CPU Queen | FPU SinJulia | FPU Mandel | CPU AES | CPU ZLib | FP64 Ray-Trace | CPU PhotoWorxx
| Performance rating | |
| Lenovo ThinkPad E16 G1-21JUS08X00 | |
| Samsung Galaxy Book3 Pro 16 | |
| Dell Inspiron 16 7635 2-in-1 | |
| Acer TravelMate P4 TMP416-51-55KN | |
| Lenovo ThinkPad E16 G1 Core i5-1335U | |
| Genomsnitt Intel Core i5-1335U | |
| LG Gram 16Z90Q | |
| AIDA64 / FP32 Ray-Trace | |
| Lenovo ThinkPad E16 G1-21JUS08X00 | |
| Dell Inspiron 16 7635 2-in-1 | |
| Acer TravelMate P4 TMP416-51-55KN | |
| Samsung Galaxy Book3 Pro 16 | |
| Lenovo ThinkPad E16 G1 Core i5-1335U | |
| Genomsnitt Intel Core i5-1335U (5661 - 7809, n=11) | |
| LG Gram 16Z90Q | |
| AIDA64 / FPU Julia | |
| Lenovo ThinkPad E16 G1-21JUS08X00 | |
| Dell Inspiron 16 7635 2-in-1 | |
| Samsung Galaxy Book3 Pro 16 | |
| Acer TravelMate P4 TMP416-51-55KN | |
| Lenovo ThinkPad E16 G1 Core i5-1335U | |
| Genomsnitt Intel Core i5-1335U (29483 - 43636, n=11) | |
| LG Gram 16Z90Q | |
| AIDA64 / CPU SHA3 | |
| Samsung Galaxy Book3 Pro 16 | |
| Lenovo ThinkPad E16 G1-21JUS08X00 | |
| Acer TravelMate P4 TMP416-51-55KN | |
| Lenovo ThinkPad E16 G1 Core i5-1335U | |
| Dell Inspiron 16 7635 2-in-1 | |
| Genomsnitt Intel Core i5-1335U (1515 - 2278, n=11) | |
| LG Gram 16Z90Q | |
| AIDA64 / CPU Queen | |
| Lenovo ThinkPad E16 G1-21JUS08X00 | |
| Samsung Galaxy Book3 Pro 16 | |
| Acer TravelMate P4 TMP416-51-55KN | |
| LG Gram 16Z90Q | |
| Dell Inspiron 16 7635 2-in-1 | |
| Lenovo ThinkPad E16 G1 Core i5-1335U | |
| Genomsnitt Intel Core i5-1335U (53839 - 60992, n=11) | |
| AIDA64 / FPU SinJulia | |
| Lenovo ThinkPad E16 G1-21JUS08X00 | |
| Dell Inspiron 16 7635 2-in-1 | |
| Samsung Galaxy Book3 Pro 16 | |
| Acer TravelMate P4 TMP416-51-55KN | |
| Lenovo ThinkPad E16 G1 Core i5-1335U | |
| LG Gram 16Z90Q | |
| Genomsnitt Intel Core i5-1335U (3873 - 5008, n=11) | |
| AIDA64 / FPU Mandel | |
| Lenovo ThinkPad E16 G1-21JUS08X00 | |
| Dell Inspiron 16 7635 2-in-1 | |
| Samsung Galaxy Book3 Pro 16 | |
| Acer TravelMate P4 TMP416-51-55KN | |
| Lenovo ThinkPad E16 G1 Core i5-1335U | |
| Genomsnitt Intel Core i5-1335U (14376 - 20553, n=11) | |
| LG Gram 16Z90Q | |
| AIDA64 / CPU AES | |
| Samsung Galaxy Book3 Pro 16 | |
| Acer TravelMate P4 TMP416-51-55KN | |
| Lenovo ThinkPad E16 G1 Core i5-1335U | |
| Lenovo ThinkPad E16 G1-21JUS08X00 | |
| Genomsnitt Intel Core i5-1335U (31154 - 65997, n=11) | |
| Dell Inspiron 16 7635 2-in-1 | |
| LG Gram 16Z90Q | |
| AIDA64 / CPU ZLib | |
| Samsung Galaxy Book3 Pro 16 | |
| Acer TravelMate P4 TMP416-51-55KN | |
| Lenovo ThinkPad E16 G1 Core i5-1335U | |
| Lenovo ThinkPad E16 G1-21JUS08X00 | |
| Dell Inspiron 16 7635 2-in-1 | |
| Genomsnitt Intel Core i5-1335U (378 - 676, n=11) | |
| LG Gram 16Z90Q | |
| AIDA64 / FP64 Ray-Trace | |
| Lenovo ThinkPad E16 G1-21JUS08X00 | |
| Dell Inspiron 16 7635 2-in-1 | |
| Acer TravelMate P4 TMP416-51-55KN | |
| Samsung Galaxy Book3 Pro 16 | |
| Lenovo ThinkPad E16 G1 Core i5-1335U | |
| LG Gram 16Z90Q | |
| Genomsnitt Intel Core i5-1335U (2878 - 4214, n=11) | |
| AIDA64 / CPU PhotoWorxx | |
| Samsung Galaxy Book3 Pro 16 | |
| LG Gram 16Z90Q | |
| Genomsnitt Intel Core i5-1335U (13584 - 41123, n=11) | |
| Acer TravelMate P4 TMP416-51-55KN | |
| Lenovo ThinkPad E16 G1 Core i5-1335U | |
| Dell Inspiron 16 7635 2-in-1 | |
| Lenovo ThinkPad E16 G1-21JUS08X00 | |
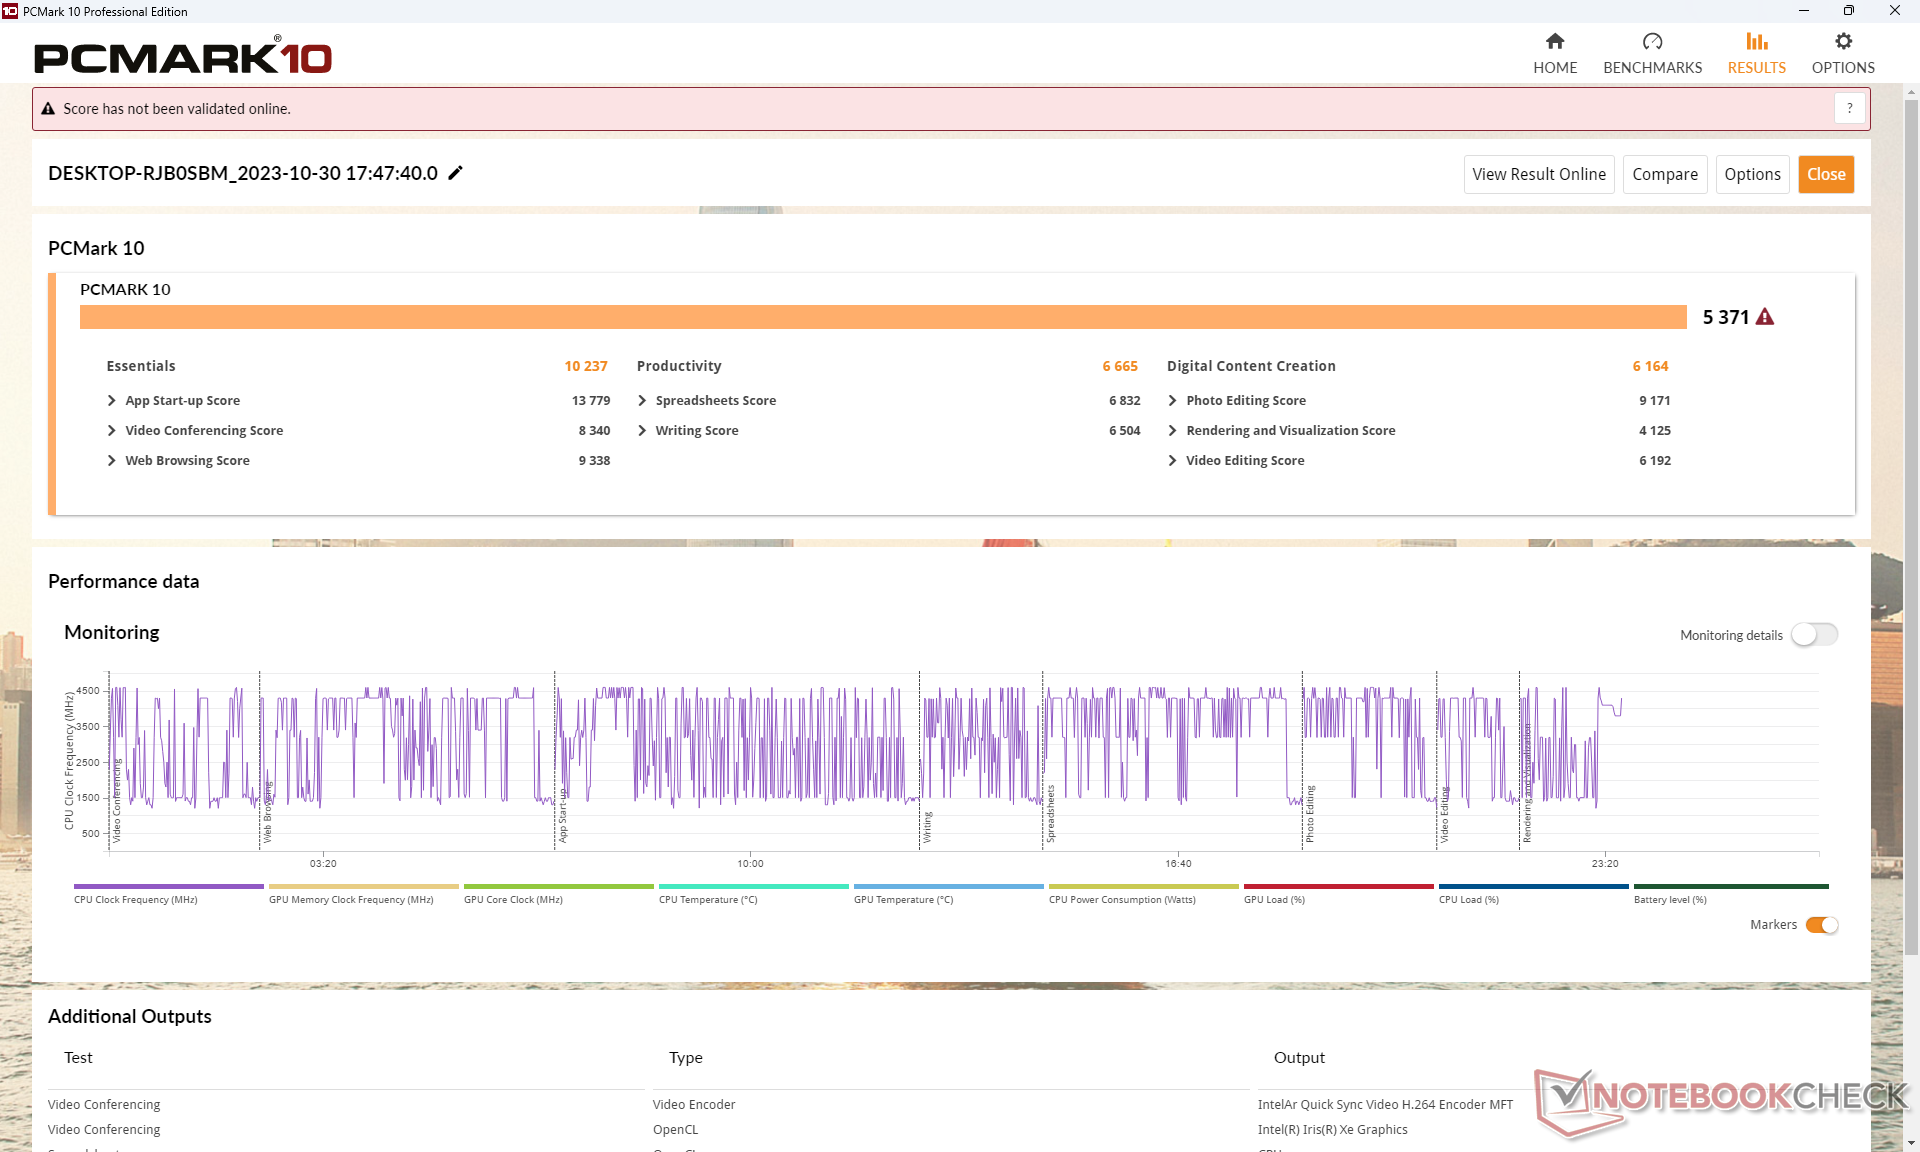
Systemets prestanda
PCMark-resultaten är lika med Ryzen 7 AMD-alternativet utom i deltestet Produktivitet på grund av den överlägsna flertrådsprestandan hos Ryzen 7 7730U jämfört med vår Core i5-1335U.
CrossMark: Overall | Productivity | Creativity | Responsiveness
| PCMark 10 / Score | |
| Dell Inspiron 16 7635 2-in-1 | |
| Lenovo ThinkPad E16 G1-21JUS08X00 | |
| Samsung Galaxy Book3 Pro 16 | |
| Lenovo ThinkPad E16 G1 Core i5-1335U | |
| Genomsnitt Intel Core i5-1335U, Intel Iris Xe Graphics G7 80EUs (5068 - 5600, n=11) | |
| Acer TravelMate P4 TMP416-51-55KN | |
| LG Gram 16Z90Q | |
| PCMark 10 / Essentials | |
| Dell Inspiron 16 7635 2-in-1 | |
| Samsung Galaxy Book3 Pro 16 | |
| Lenovo ThinkPad E16 G1-21JUS08X00 | |
| Genomsnitt Intel Core i5-1335U, Intel Iris Xe Graphics G7 80EUs (9828 - 11912, n=11) | |
| Lenovo ThinkPad E16 G1 Core i5-1335U | |
| LG Gram 16Z90Q | |
| Acer TravelMate P4 TMP416-51-55KN | |
| PCMark 10 / Productivity | |
| Dell Inspiron 16 7635 2-in-1 | |
| Lenovo ThinkPad E16 G1-21JUS08X00 | |
| Genomsnitt Intel Core i5-1335U, Intel Iris Xe Graphics G7 80EUs (6196 - 7261, n=11) | |
| Acer TravelMate P4 TMP416-51-55KN | |
| Samsung Galaxy Book3 Pro 16 | |
| Lenovo ThinkPad E16 G1 Core i5-1335U | |
| LG Gram 16Z90Q | |
| PCMark 10 / Digital Content Creation | |
| Samsung Galaxy Book3 Pro 16 | |
| Acer TravelMate P4 TMP416-51-55KN | |
| Lenovo ThinkPad E16 G1 Core i5-1335U | |
| Lenovo ThinkPad E16 G1-21JUS08X00 | |
| LG Gram 16Z90Q | |
| Dell Inspiron 16 7635 2-in-1 | |
| Genomsnitt Intel Core i5-1335U, Intel Iris Xe Graphics G7 80EUs (5361 - 6164, n=11) | |
| CrossMark / Overall | |
| Samsung Galaxy Book3 Pro 16 | |
| Acer TravelMate P4 TMP416-51-55KN | |
| Genomsnitt Intel Core i5-1335U, Intel Iris Xe Graphics G7 80EUs (1339 - 1599, n=11) | |
| Lenovo ThinkPad E16 G1 Core i5-1335U | |
| Lenovo ThinkPad E16 G1-21JUS08X00 | |
| Dell Inspiron 16 7635 2-in-1 | |
| CrossMark / Productivity | |
| Samsung Galaxy Book3 Pro 16 | |
| Acer TravelMate P4 TMP416-51-55KN | |
| Genomsnitt Intel Core i5-1335U, Intel Iris Xe Graphics G7 80EUs (1337 - 1638, n=11) | |
| Lenovo ThinkPad E16 G1 Core i5-1335U | |
| Lenovo ThinkPad E16 G1-21JUS08X00 | |
| Dell Inspiron 16 7635 2-in-1 | |
| CrossMark / Creativity | |
| Samsung Galaxy Book3 Pro 16 | |
| Acer TravelMate P4 TMP416-51-55KN | |
| Genomsnitt Intel Core i5-1335U, Intel Iris Xe Graphics G7 80EUs (1315 - 1620, n=11) | |
| Lenovo ThinkPad E16 G1 Core i5-1335U | |
| Lenovo ThinkPad E16 G1-21JUS08X00 | |
| Dell Inspiron 16 7635 2-in-1 | |
| CrossMark / Responsiveness | |
| Acer TravelMate P4 TMP416-51-55KN | |
| Samsung Galaxy Book3 Pro 16 | |
| Genomsnitt Intel Core i5-1335U, Intel Iris Xe Graphics G7 80EUs (1023 - 1868, n=11) | |
| Lenovo ThinkPad E16 G1 Core i5-1335U | |
| Lenovo ThinkPad E16 G1-21JUS08X00 | |
| Dell Inspiron 16 7635 2-in-1 | |
| PCMark 10 Score | 5371 poäng | |
Hjälp | ||
| AIDA64 / Memory Copy | |
| LG Gram 16Z90Q | |
| Samsung Galaxy Book3 Pro 16 | |
| Genomsnitt Intel Core i5-1335U (22417 - 60884, n=11) | |
| Acer TravelMate P4 TMP416-51-55KN | |
| Dell Inspiron 16 7635 2-in-1 | |
| Lenovo ThinkPad E16 G1 Core i5-1335U | |
| Lenovo ThinkPad E16 G1-21JUS08X00 | |
| AIDA64 / Memory Read | |
| LG Gram 16Z90Q | |
| Samsung Galaxy Book3 Pro 16 | |
| Acer TravelMate P4 TMP416-51-55KN | |
| Genomsnitt Intel Core i5-1335U (23104 - 61555, n=11) | |
| Dell Inspiron 16 7635 2-in-1 | |
| Lenovo ThinkPad E16 G1-21JUS08X00 | |
| Lenovo ThinkPad E16 G1 Core i5-1335U | |
| AIDA64 / Memory Write | |
| Samsung Galaxy Book3 Pro 16 | |
| LG Gram 16Z90Q | |
| Genomsnitt Intel Core i5-1335U (22936 - 72584, n=11) | |
| Acer TravelMate P4 TMP416-51-55KN | |
| Lenovo ThinkPad E16 G1 Core i5-1335U | |
| Dell Inspiron 16 7635 2-in-1 | |
| Lenovo ThinkPad E16 G1-21JUS08X00 | |
| AIDA64 / Memory Latency | |
| Dell Inspiron 16 7635 2-in-1 | |
| LG Gram 16Z90Q | |
| Genomsnitt Intel Core i5-1335U (78.6 - 112.8, n=11) | |
| Samsung Galaxy Book3 Pro 16 | |
| Lenovo ThinkPad E16 G1-21JUS08X00 | |
| Lenovo ThinkPad E16 G1 Core i5-1335U | |
| Acer TravelMate P4 TMP416-51-55KN | |
* ... mindre är bättre
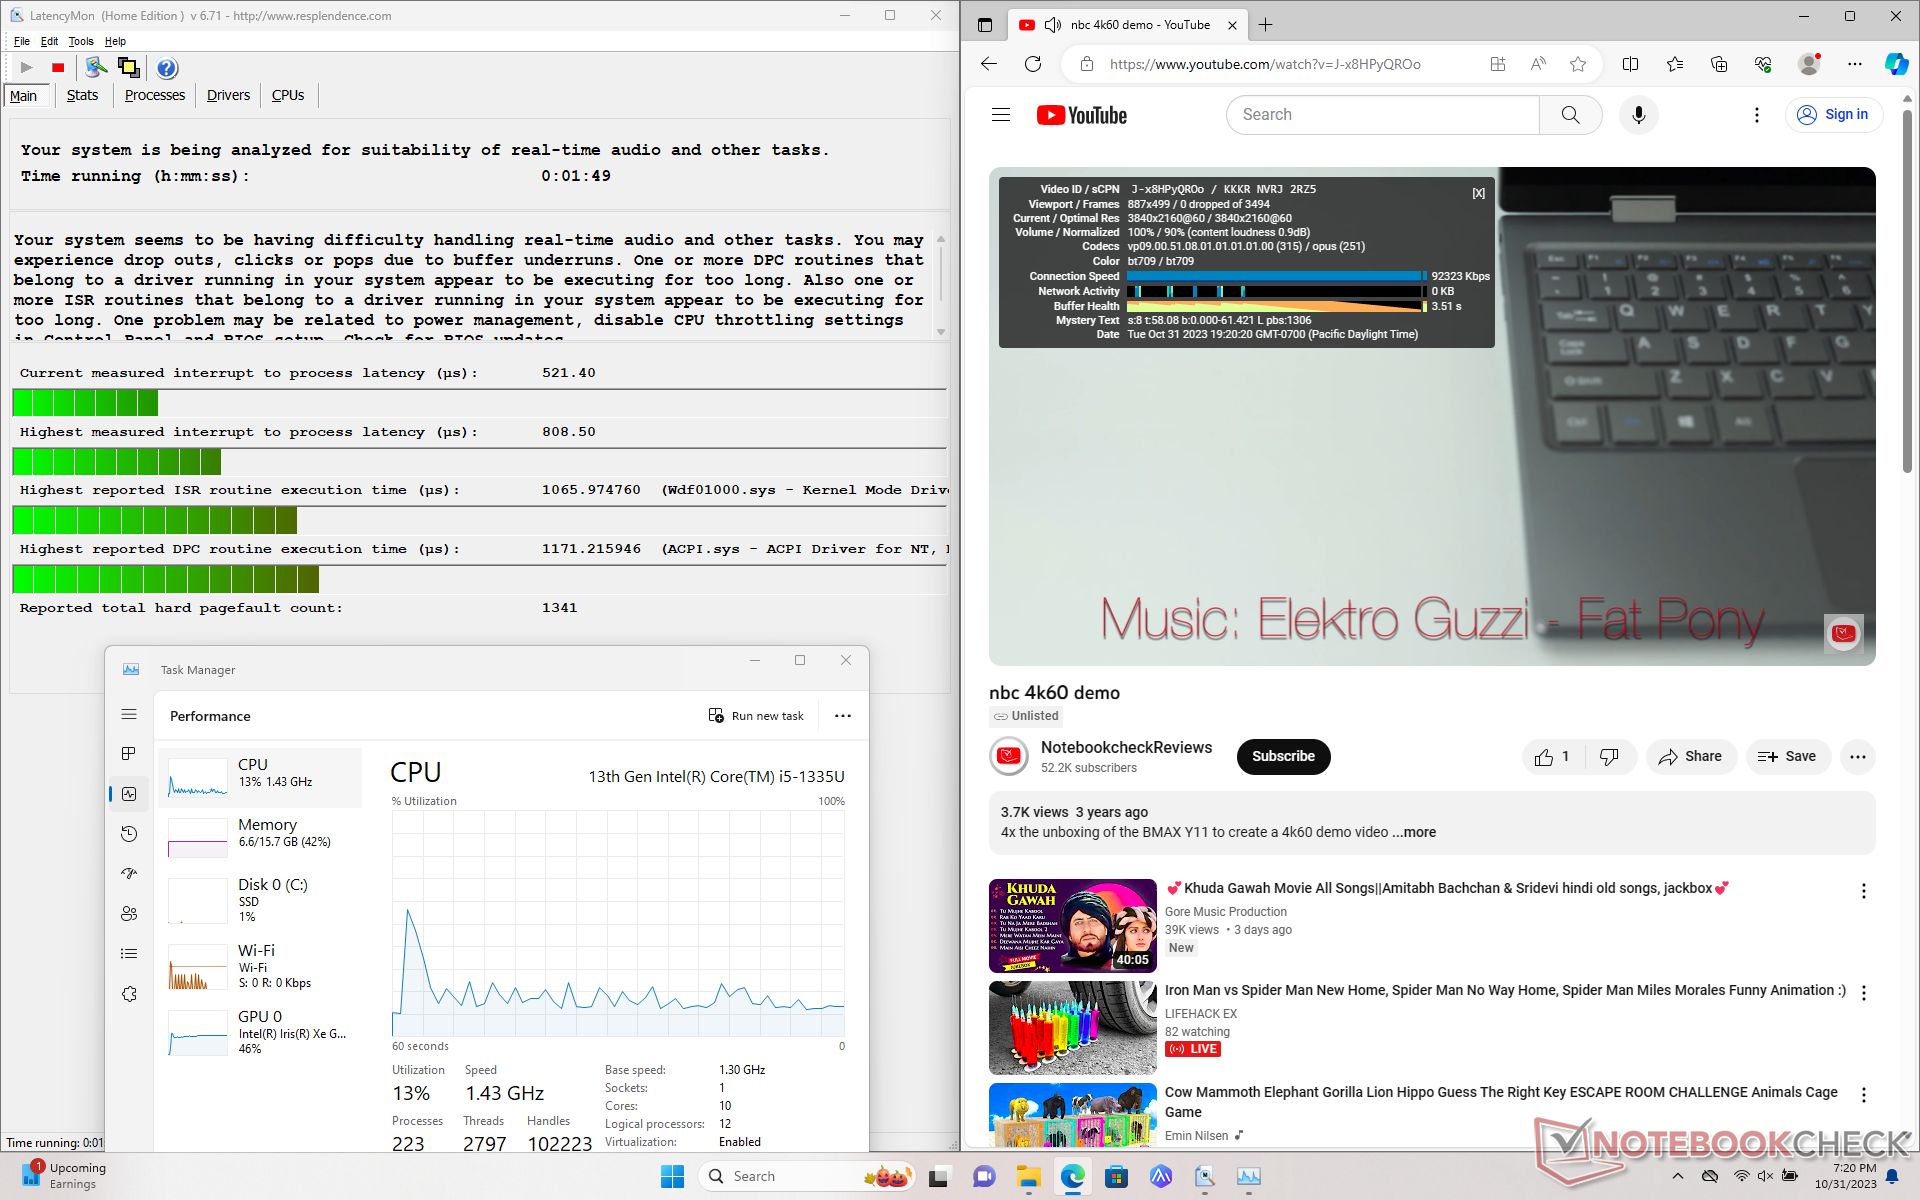
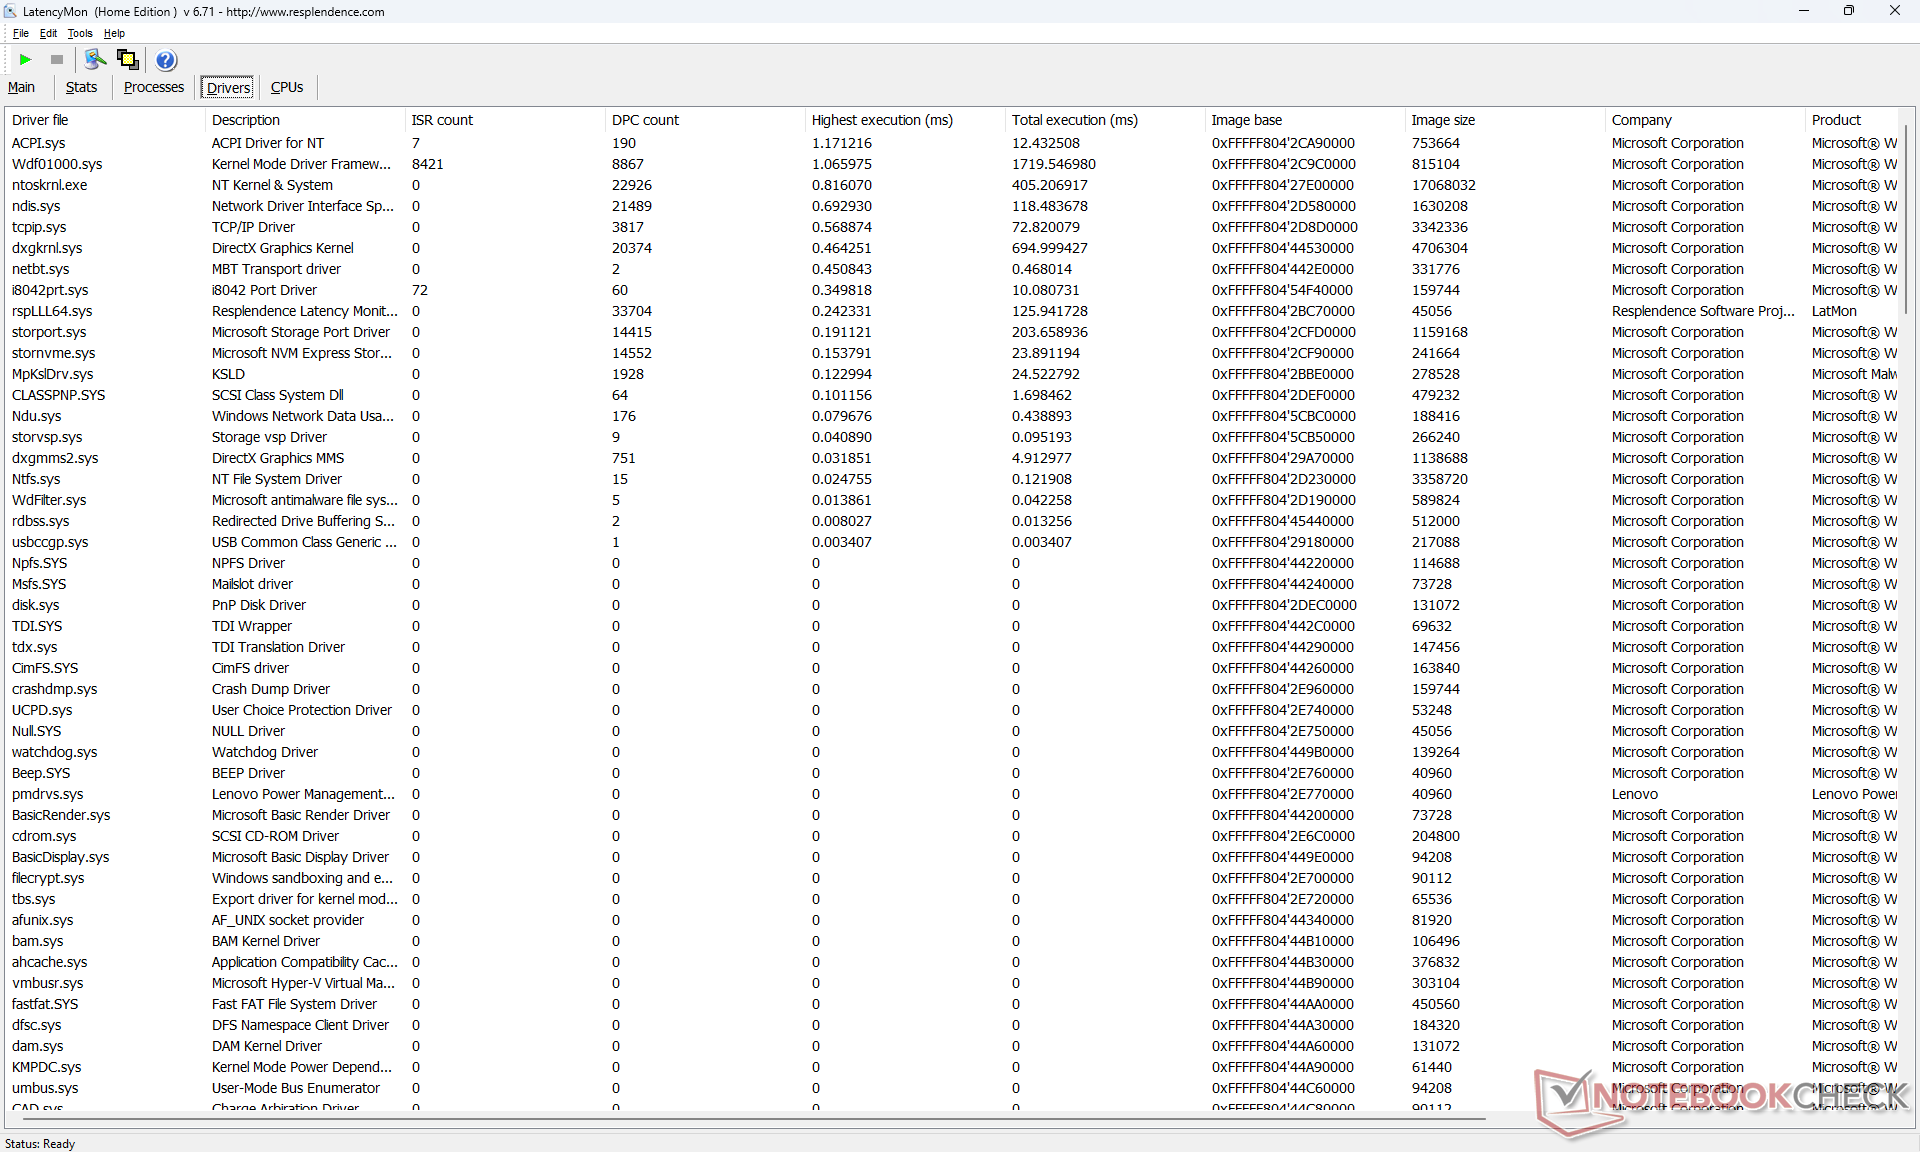
DPC-fördröjning
LatencyMon avslöjar endast mindre DPC-problem när flera webbläsarflikar öppnas på vår hemsida. 4K-videouppspelning vid 60 FPS är i övrigt helt jämn och inga tappade bildrutor registreras.
| DPC Latencies / LatencyMon - interrupt to process latency (max), Web, Youtube, Prime95 | |
| Acer TravelMate P4 TMP416-51-55KN | |
| LG Gram 16Z90Q | |
| Lenovo ThinkPad E16 G1-21JUS08X00 | |
| Lenovo ThinkPad E16 G1 Core i5-1335U | |
| Dell Inspiron 16 7635 2-in-1 | |
| Samsung Galaxy Book3 Pro 16 | |
* ... mindre är bättre
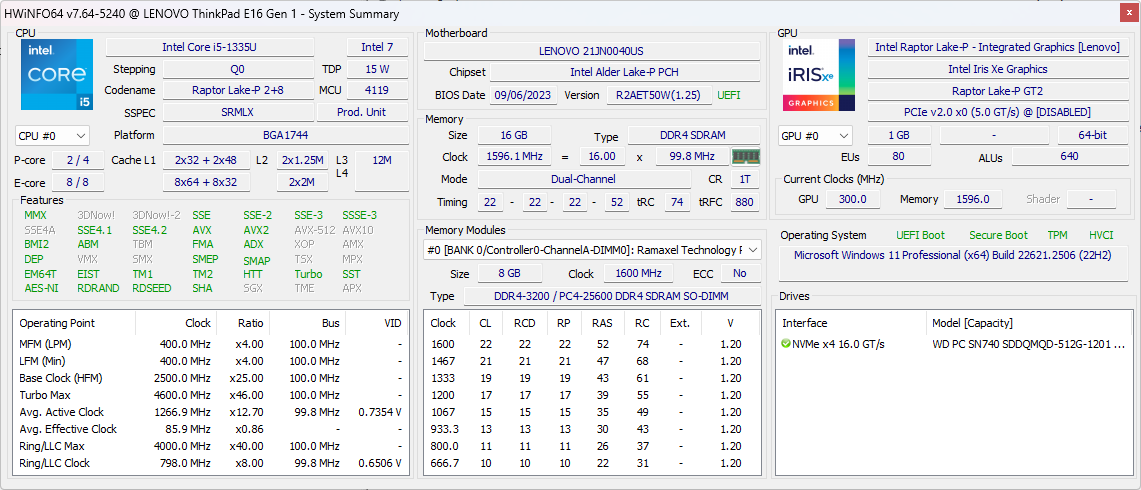
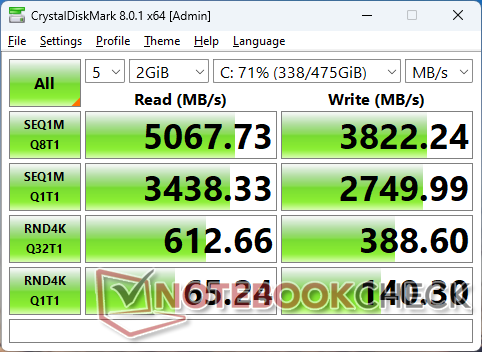
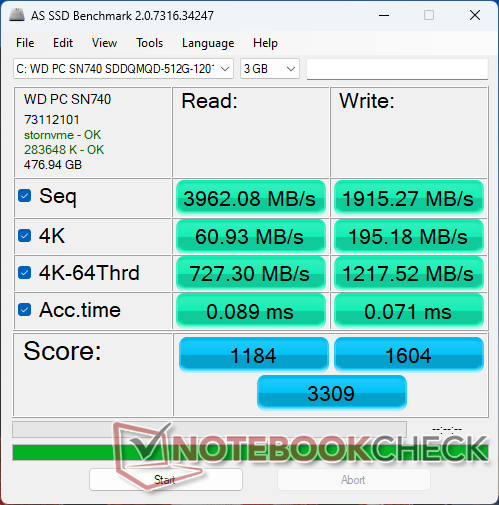
Lagringsenheter
Vår testenhet inkluderar Western Digital SN740 som är en PCIe4 x4 NVMe SSD i mellanklassen med sekventiella läs- och skrivhastigheter på upp till 5100 MB/s respektive 3900 MB/s. 2242-enheten skulle inte ha några problem med att upprätthålla dessa maximala hastigheter trots avsaknaden av termiska kuddar eller kylhjälpmedel.

* ... mindre är bättre
Disk Throttling: DiskSpd Read Loop, Queue Depth 8
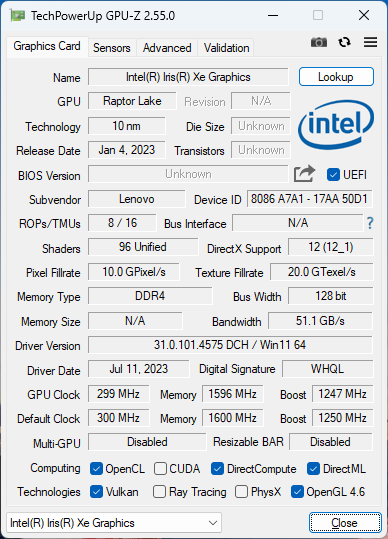
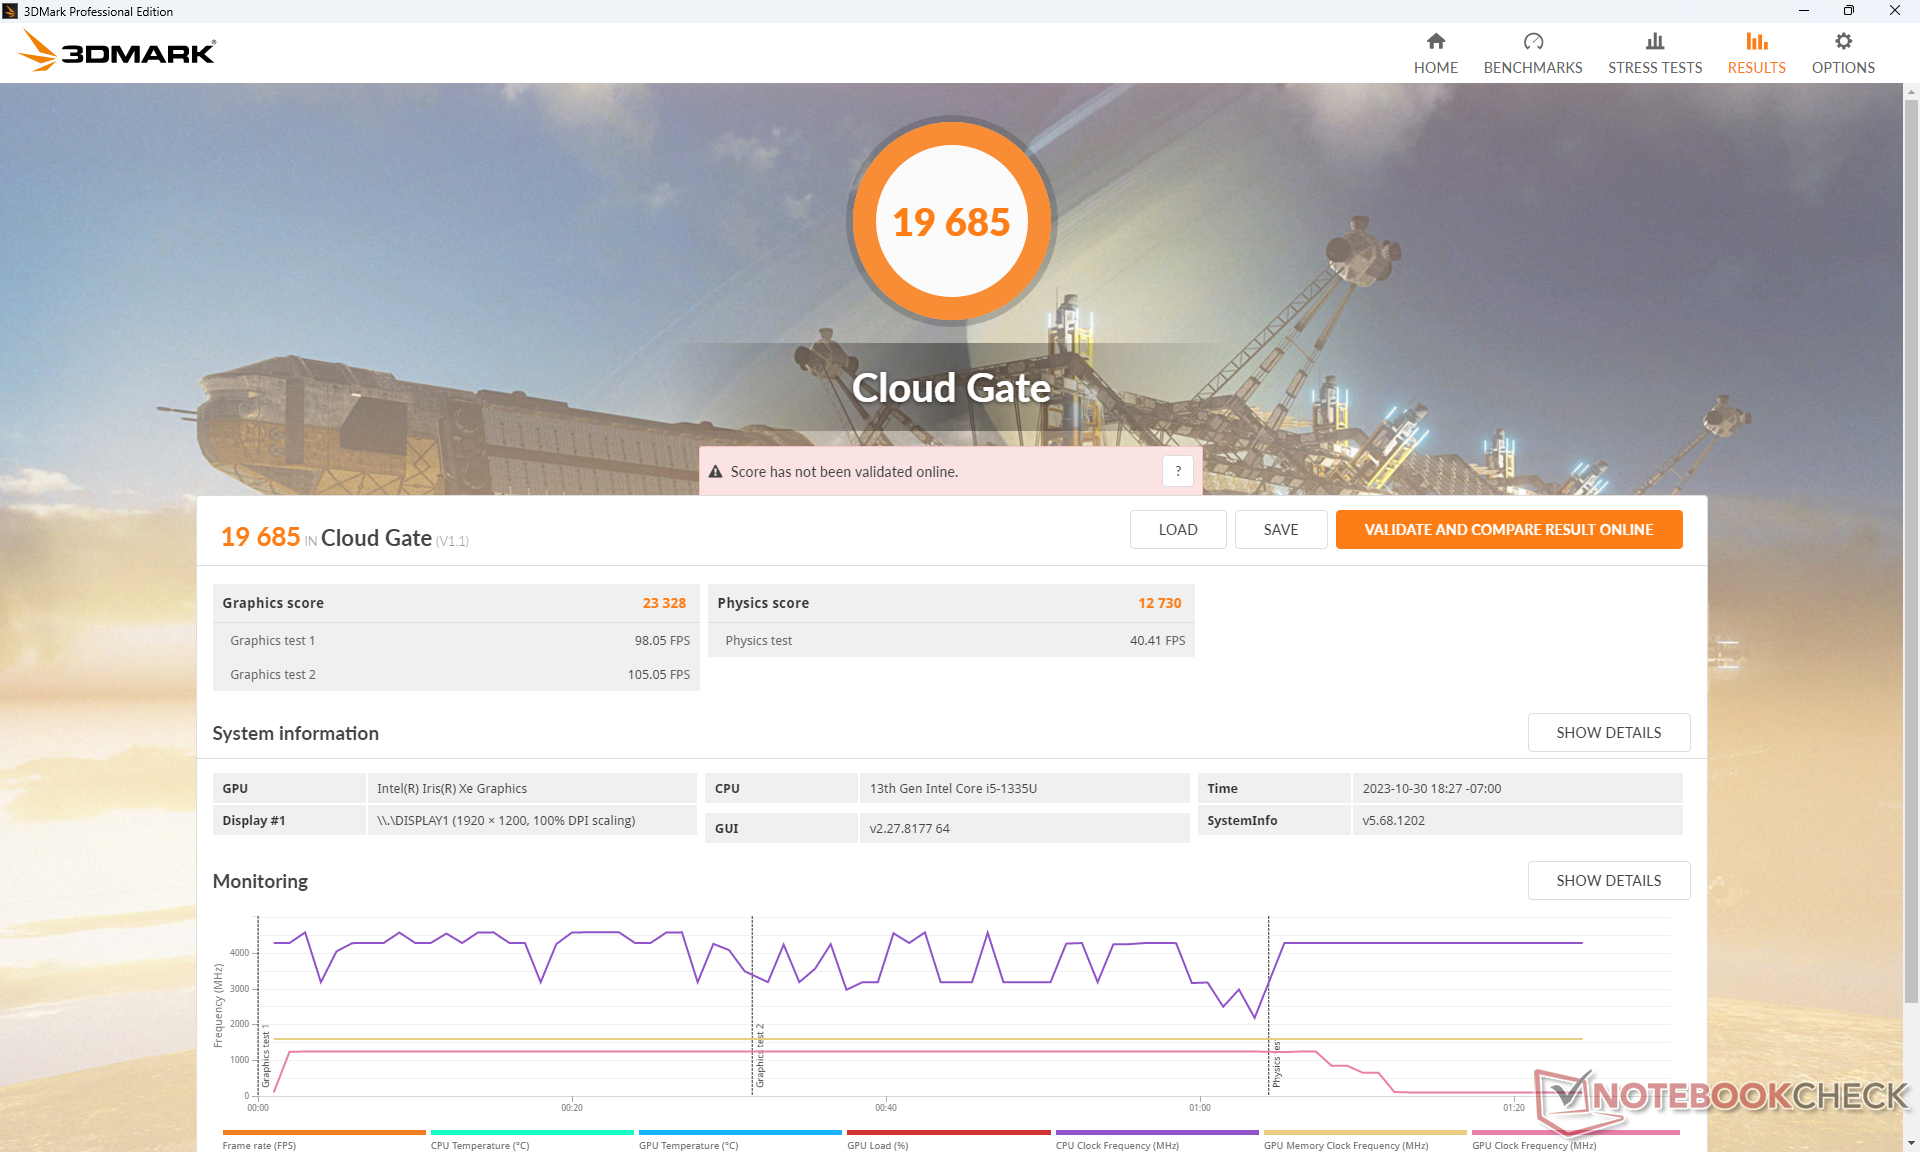
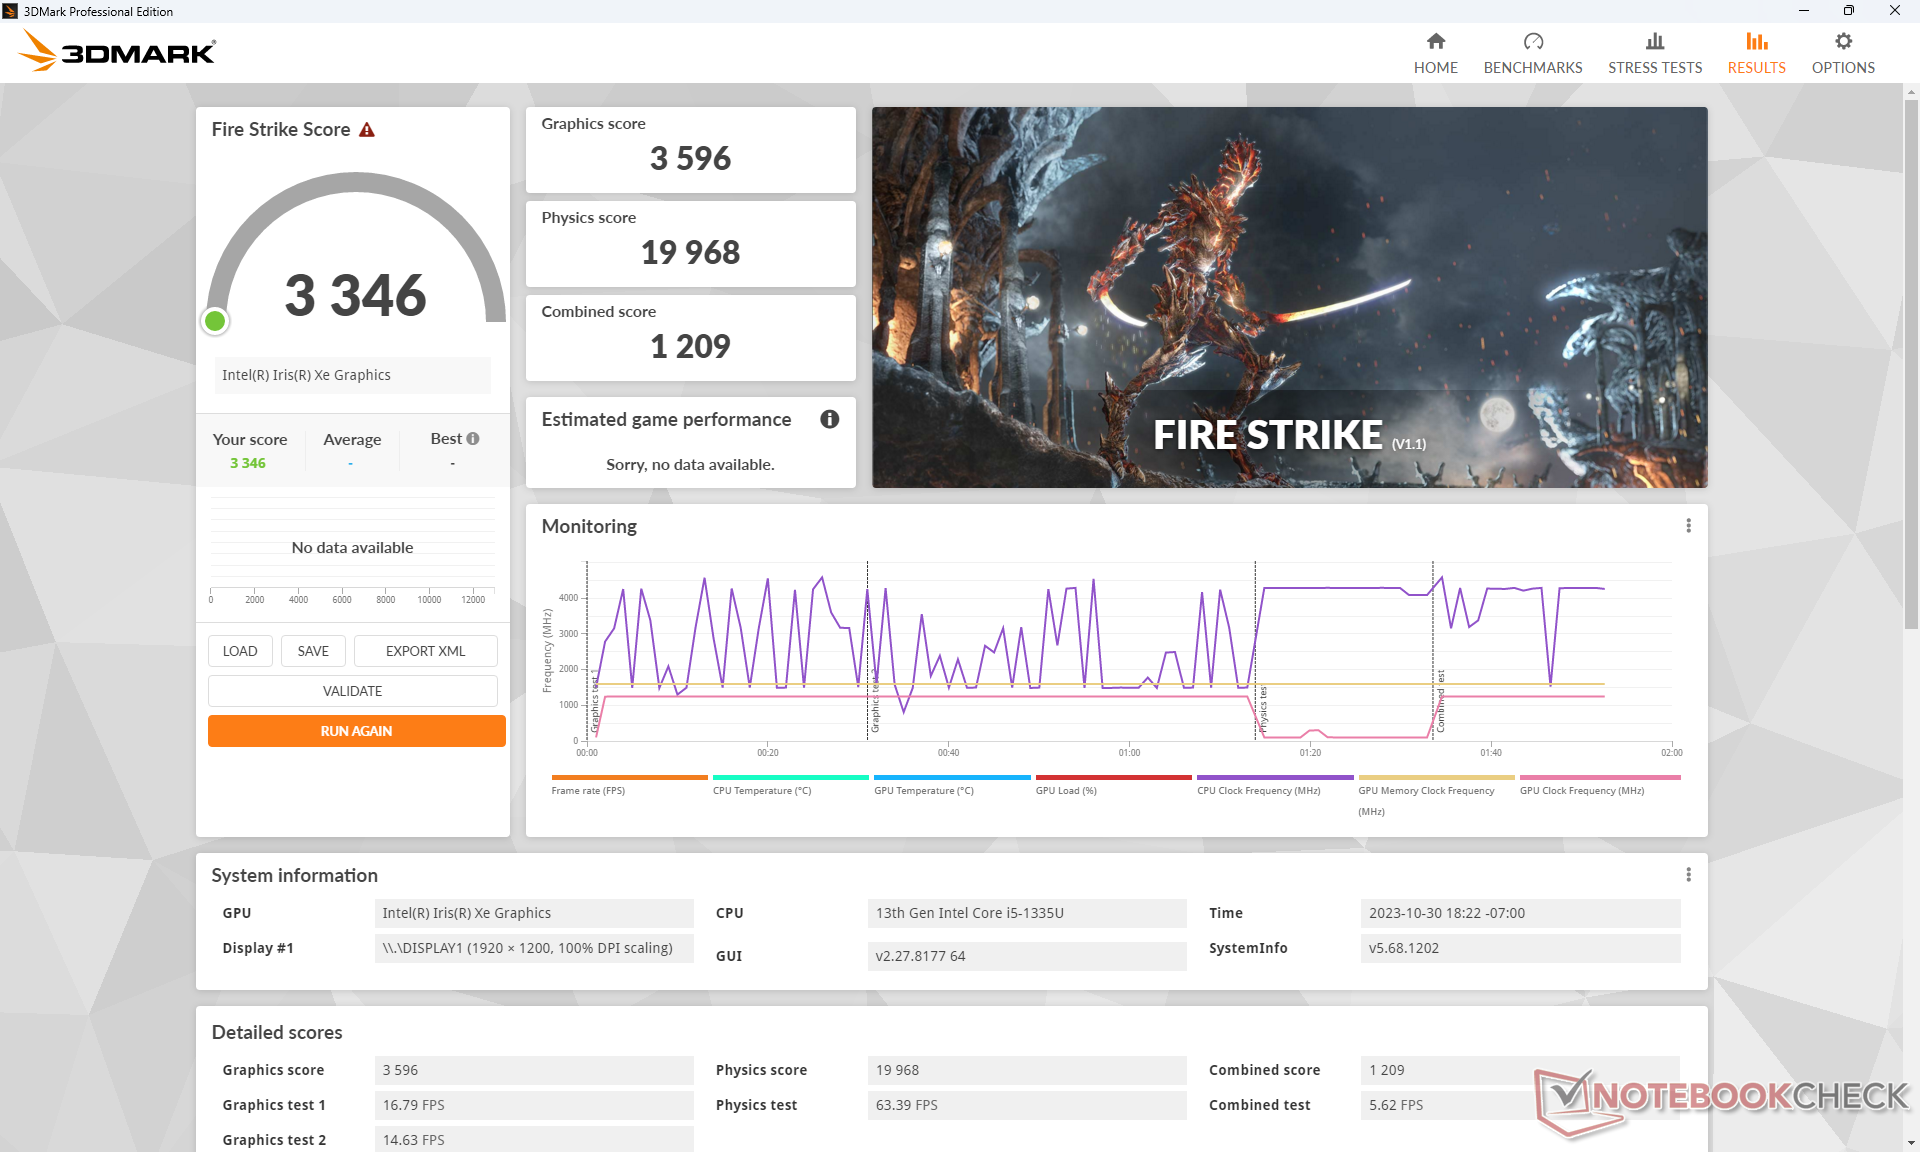
GPU-prestanda
Vår integrerade Iris Xe 80 EUs presterar där vi förväntar oss att den ska vara i förhållande till andra bärbara datorer med samma GPU, om inte något långsammare. Uppgradering till Core i7-konfigurationen med Iris Xe 96 EUs eller GeForce MX550 skulle öka prestandan med cirka 25 till 30 procent respektive 70 till 100 procent.
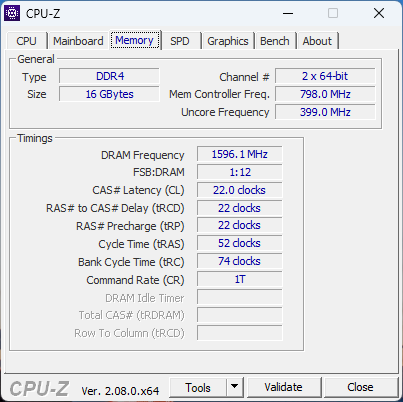
Var noga med att konfigurera med dual-channel RAM-minne, annars försämras iGPU-prestandan avsevärt.
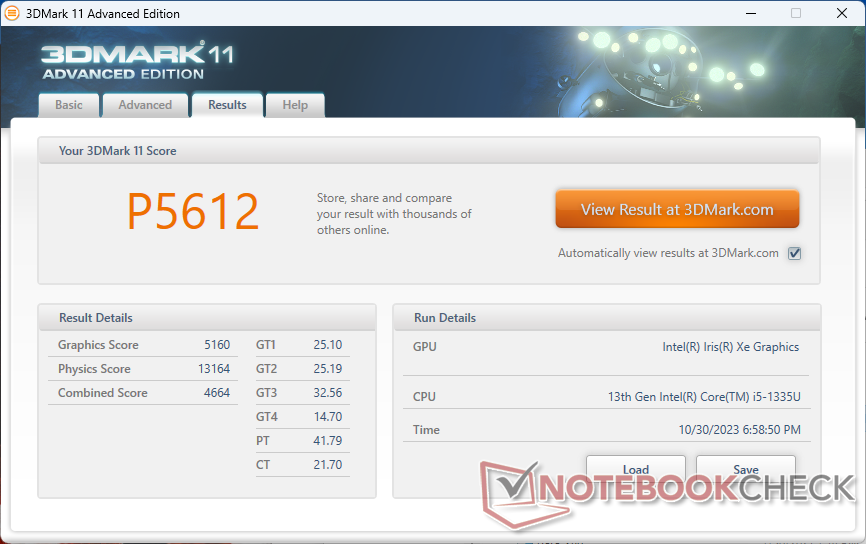
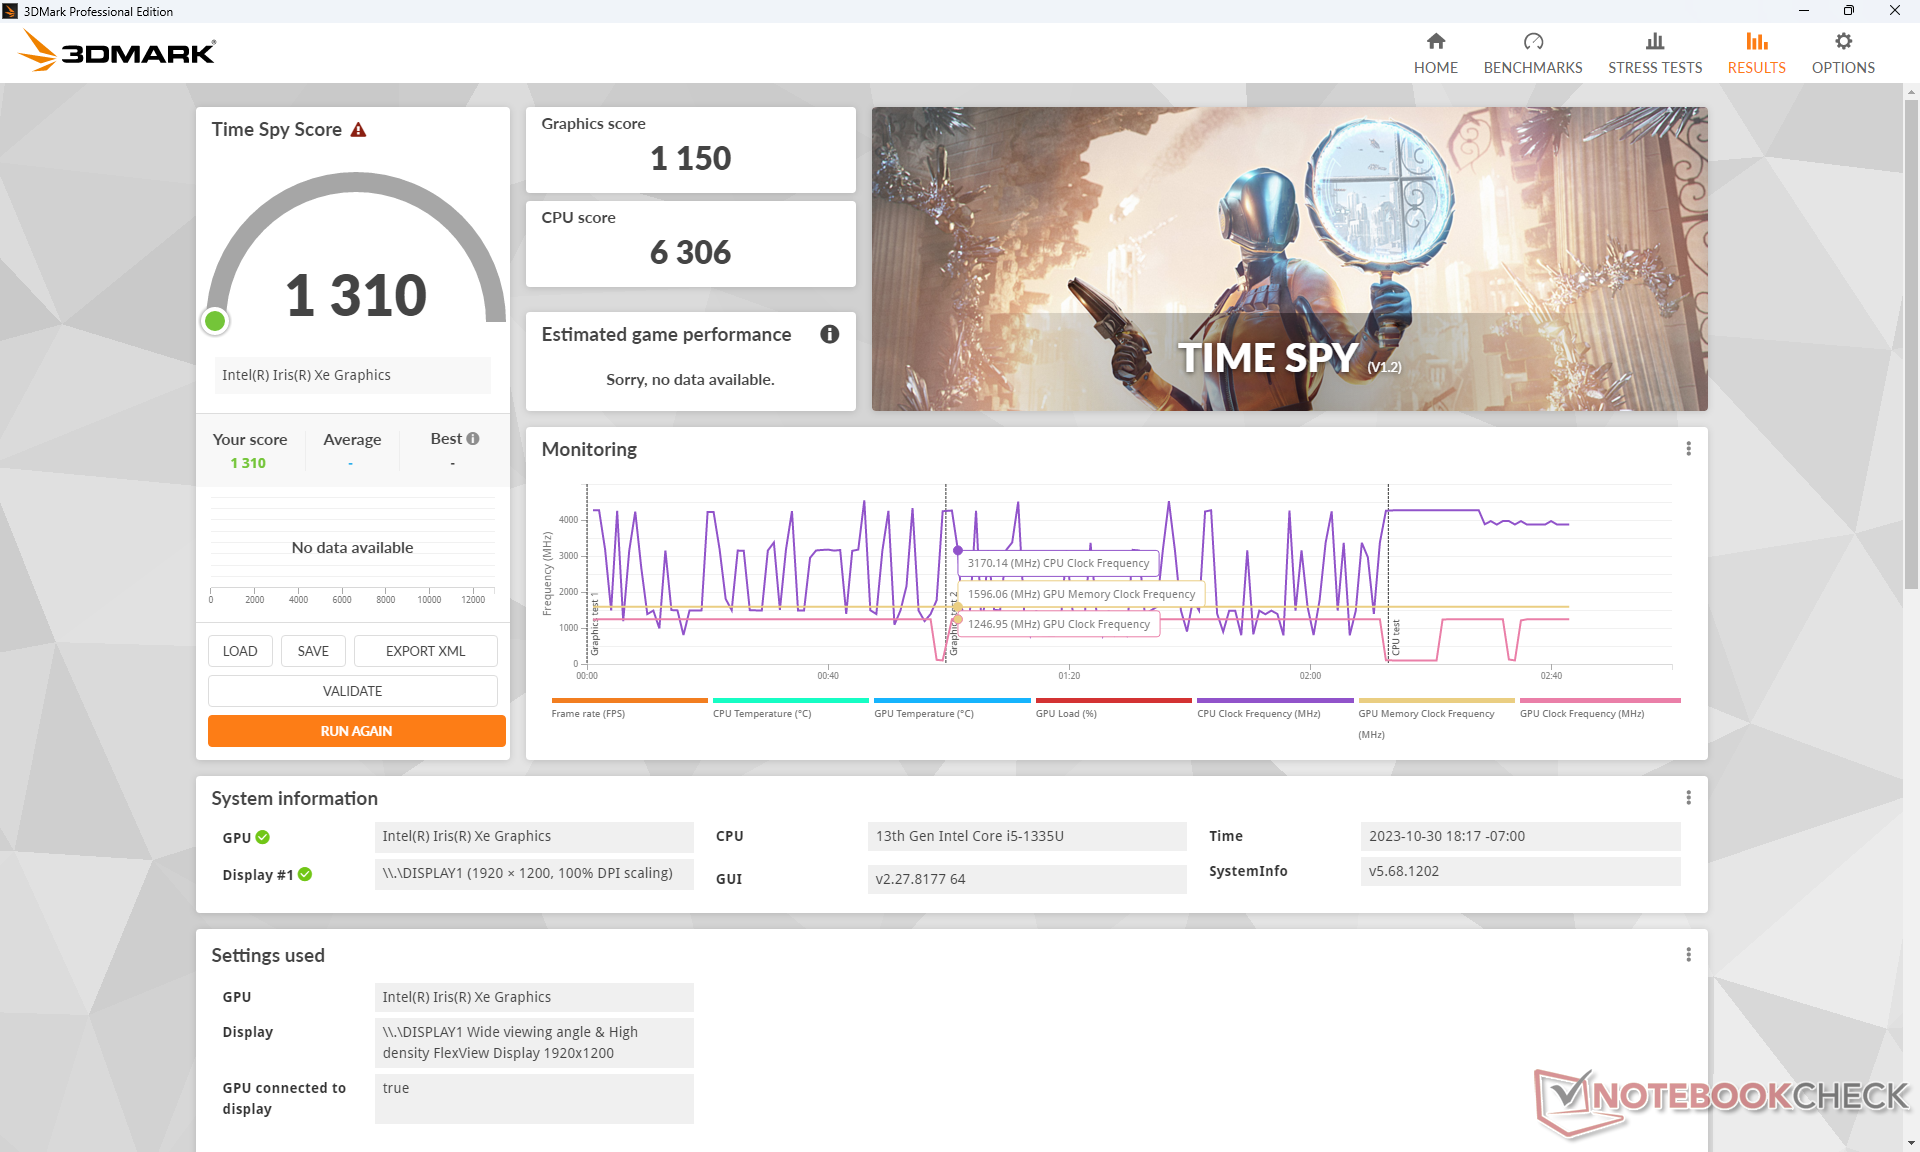
| 3DMark 11 Performance | 5612 poäng | |
| 3DMark Cloud Gate Standard Score | 19685 poäng | |
| 3DMark Fire Strike Score | 3346 poäng | |
| 3DMark Time Spy Score | 1310 poäng | |
Hjälp | ||
* ... mindre är bättre
Bildfrekvensen vid tomgång på Witcher 3 sjönk ganska kraftigt under början av testet för att antyda någon avbrytande bakgrundsaktivitet. Detta inträffade lyckligtvis inte igen under resten av testet.
Witcher 3 FPS Chart
| låg | med. | hög | ultra | |
|---|---|---|---|---|
| GTA V (2015) | 84.5 | 68.8 | 13.2 | 5.41 |
| The Witcher 3 (2015) | 73.6 | 45.1 | 22.1 | 11.1 |
| Dota 2 Reborn (2015) | 100.7 | 75.2 | 49.2 | 45 |
| Final Fantasy XV Benchmark (2018) | 31 | 16.9 | 12.1 | |
| X-Plane 11.11 (2018) | 28.6 | 22.5 | 21 | |
| Far Cry 5 (2018) | 40 | 19 | 18 | 17 |
| Strange Brigade (2018) | 70.3 | 27.3 | 22.4 | 18.3 |
| Cyberpunk 2077 1.6 (2022) | 14.1 | |||
| Tiny Tina's Wonderlands (2022) | 20.6 | 15.3 | 10.4 | 8.1 |
| F1 22 (2022) | 32.8 | 29.1 | 21.3 | 16.5 |
Utsläpp
Buller från systemet
Fläktljudet är generellt högre än vad vi upplevde på Ryzen 7-versionen, vilket sannolikt beror på de högre strömkraven för vår Intel-version. AMD-versionen kan förbli tystare under längre perioder när stress introduceras. När vi körde 3DMark 06, till exempel, skulle fläktljudet förbli relativt tyst vid knappt 25 dB (A) jämfört med nästan 33 dB (A) på vår Intel-version.
Ljudnivå
| Låg belastning |
| 24.6 / 24.6 / 24.6 dB(A) |
| Hög belastning |
| 32.7 / 39.2 dB(A) |
 | ||
30 dB tyst 40 dB(A) hörbar 50 dB(A) högt ljud |
||
min: | ||
| Lenovo ThinkPad E16 G1 Core i5-1335U Iris Xe G7 80EUs, i5-1335U | Lenovo ThinkPad E16 G1-21JUS08X00 Vega 8, R7 7730U, WD PC SN740 SDDPNQD-1T00 | Dell Inspiron 16 7635 2-in-1 Vega 7, R5 7530U, Kioxia BG5 KBG50ZNS512G | Acer TravelMate P4 TMP416-51-55KN Iris Xe G7 80EUs, i5-1240P, Micron 2450 512GB MTFDKBA512TFK | Samsung Galaxy Book3 Pro 16 Iris Xe G7 80EUs, i5-1340P, WD PC SN740 256GB SDDPNQD-256G | LG Gram 16Z90Q Iris Xe G7 96EUs, i7-1260P, Samsung PM9A1 MZVL21T0HCLR | |
|---|---|---|---|---|---|---|
| Noise | 11% | -7% | -10% | -14% | -7% | |
| av / miljö * (dB) | 24.6 | 22.4 9% | 23.6 4% | 25.4 -3% | 25.2 -2% | 25 -2% |
| Idle Minimum * (dB) | 24.6 | 22.4 9% | 23.6 4% | 25.4 -3% | 25.2 -2% | 26 -6% |
| Idle Average * (dB) | 24.6 | 22.4 9% | 23.6 4% | 25.4 -3% | 25.2 -2% | 27 -10% |
| Idle Maximum * (dB) | 24.6 | 23.7 4% | 23.6 4% | 25.4 -3% | 29.3 -19% | 28 -14% |
| Load Average * (dB) | 32.7 | 24.8 24% | 40.3 -23% | 43.9 -34% | 46.4 -42% | 38 -16% |
| Witcher 3 ultra * (dB) | 34.7 | 29.8 14% | 44.2 -27% | 37 -7% | ||
| Load Maximum * (dB) | 39.2 | 36.1 8% | 44.2 -13% | 43.7 -11% | 46.4 -18% | 38 3% |
* ... mindre är bättre
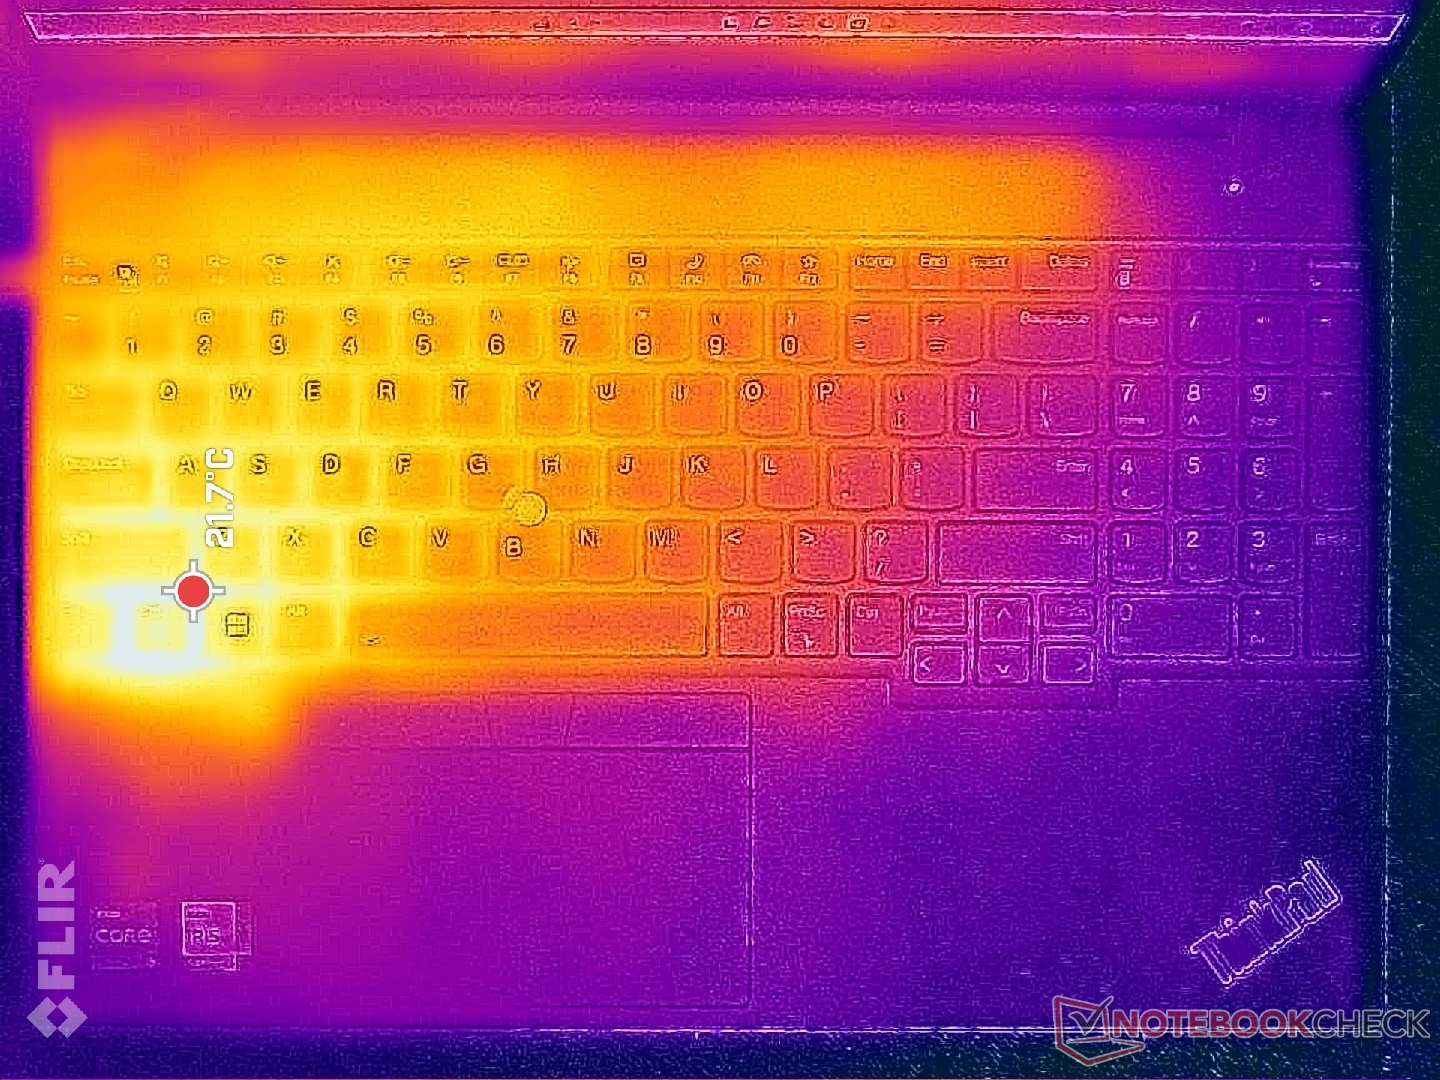
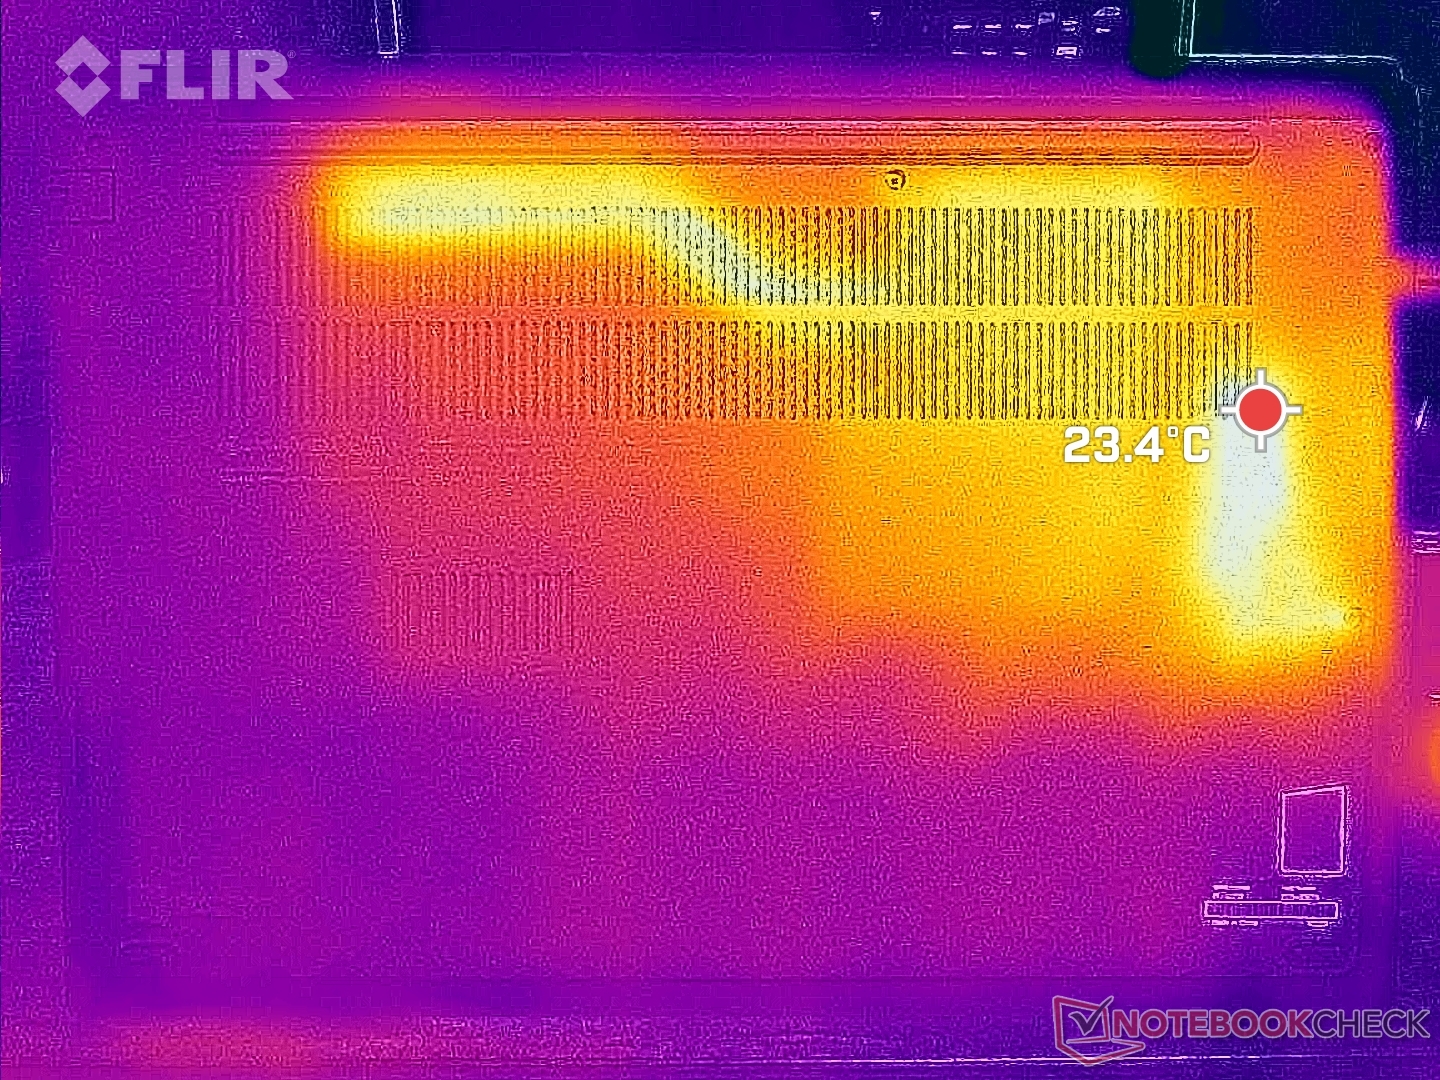
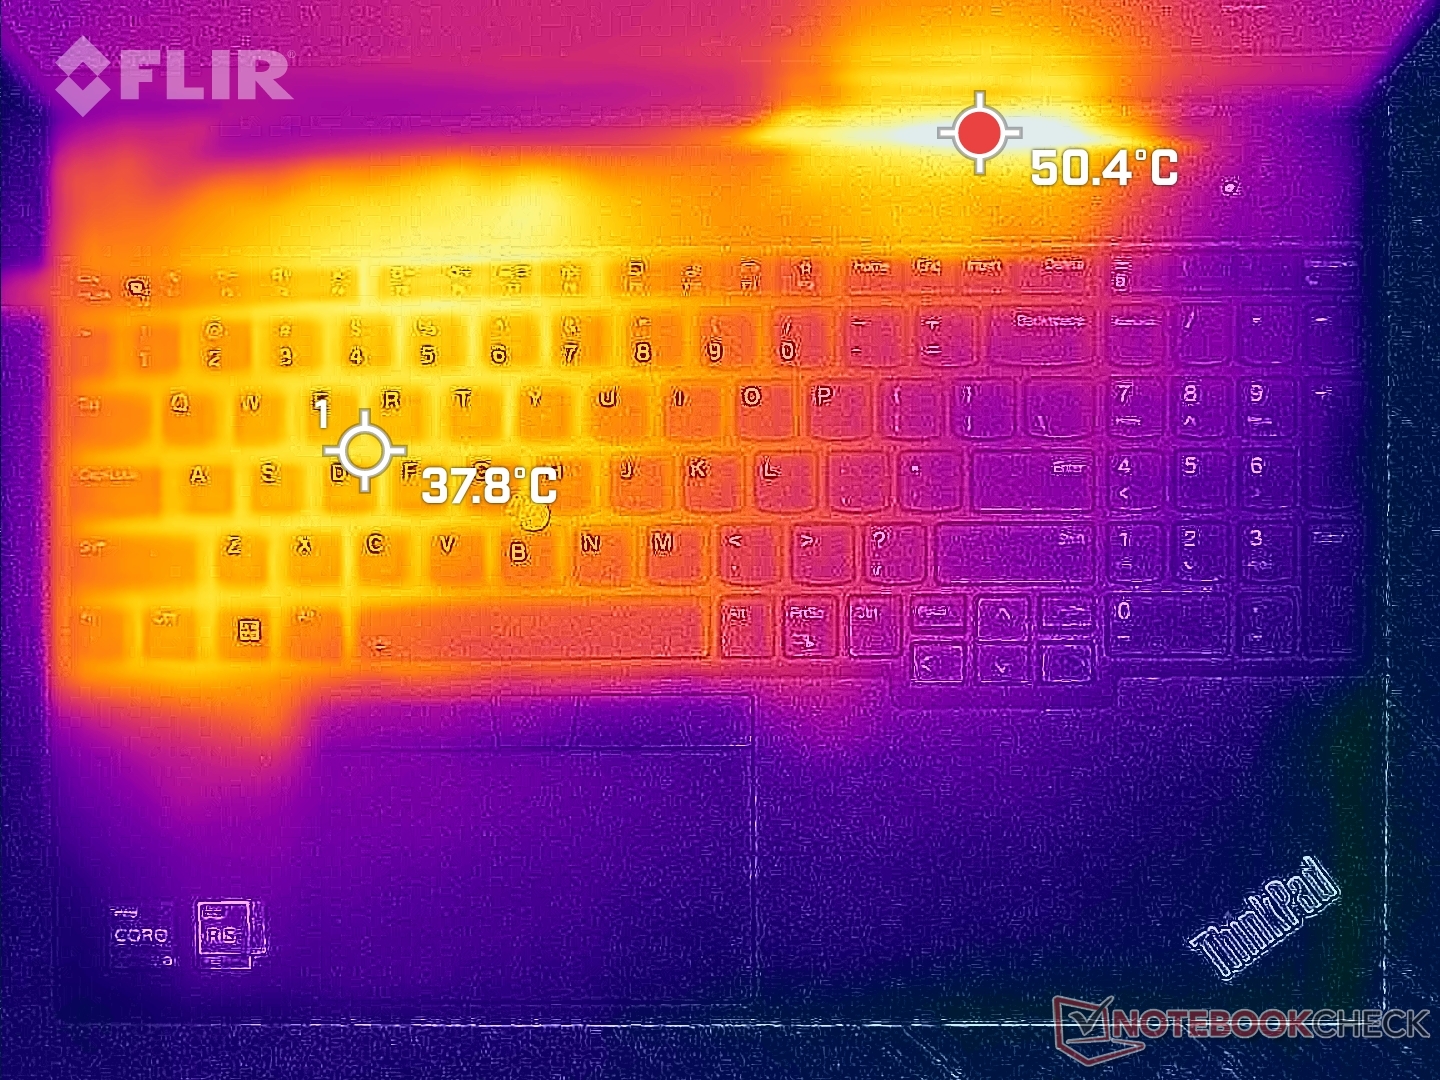
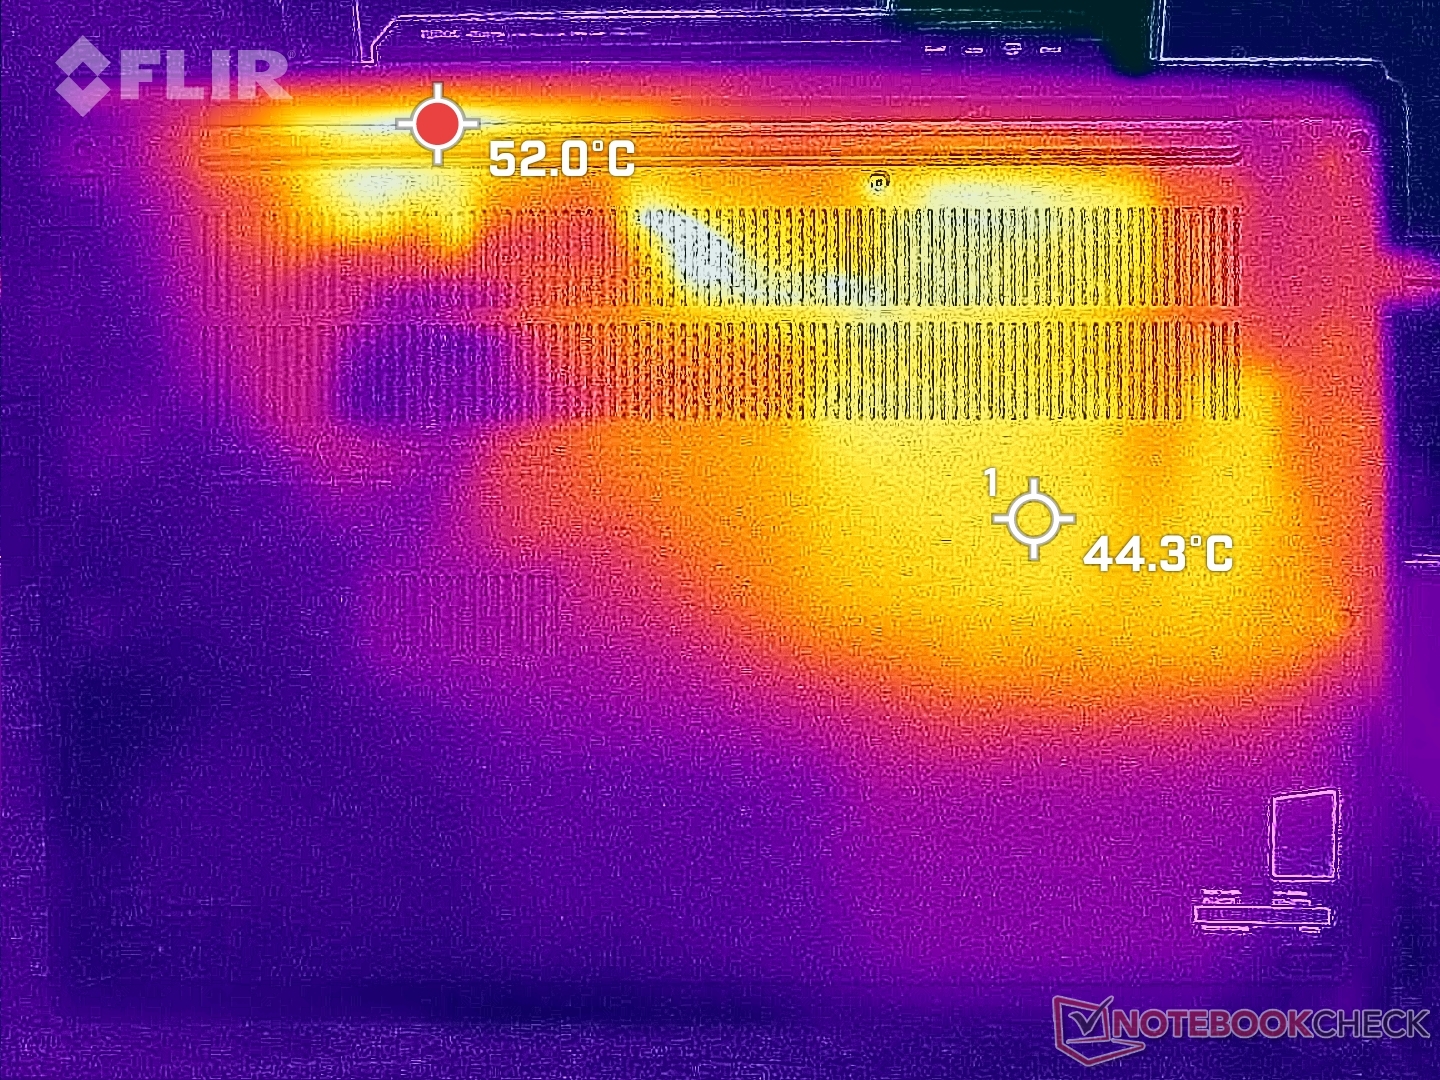
Temperatur
Yttemperaturen är högre på den vänstra halvan av datorn än på den högra, helt enkelt på grund av placeringen av processorn och kyllösningen inuti. Hot spots vid krävande belastning kan nå upp till 38 C och 45 C på över- respektive undersidan, vilket framgår av temperaturkartorna nedan. Resultaten är faktiskt några grader kallare än vad vi registrerade på AMD-konfigurationen, kanske på grund av den högre fläkten som nämndes ovan. Även om temperaturskillnaderna mellan de varmare och kallare kvadranterna är märkbara vid beröring, är de inte obekväma eller distraherande under användning.
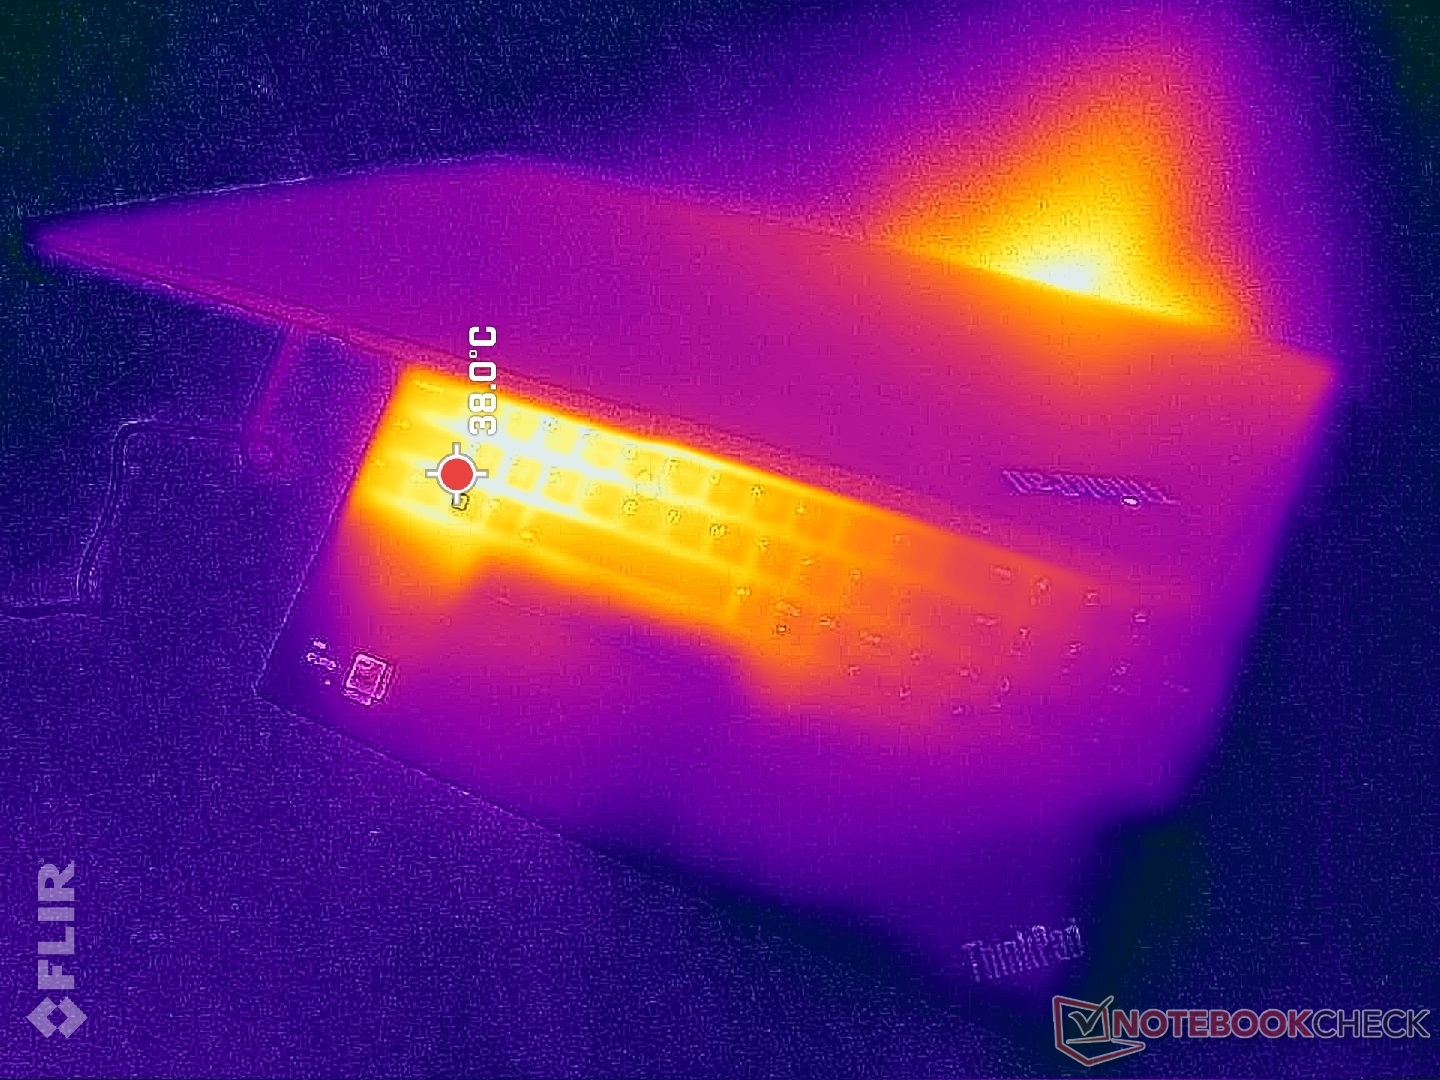
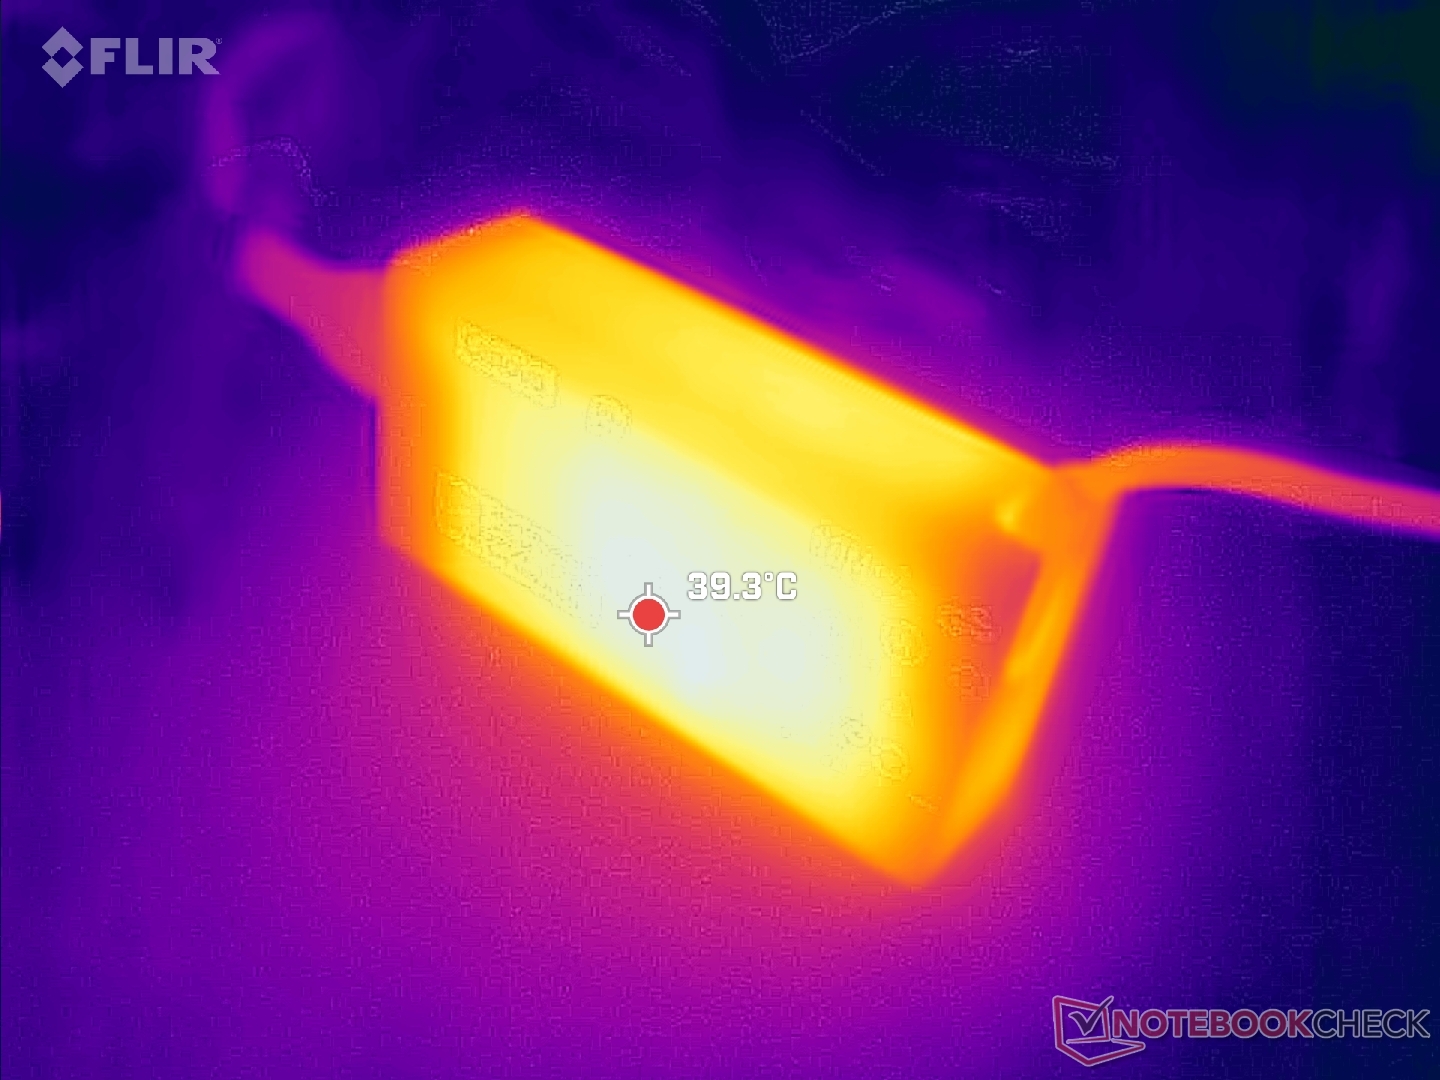
(±) Den maximala temperaturen på ovansidan är 44 °C / 111 F, jämfört med genomsnittet av 34.3 °C / 94 F , allt från 21.2 till 62.5 °C för klassen Office.
(-) Botten värms upp till maximalt 50.4 °C / 123 F, jämfört med genomsnittet av 36.8 °C / 98 F
(+) Vid tomgångsbruk är medeltemperaturen för ovansidan 24.3 °C / 76 F, jämfört med enhetsgenomsnittet på 29.5 °C / ### class_avg_f### F.
(+) Handledsstöden och pekplattan är kallare än hudtemperaturen med maximalt 27 °C / 80.6 F och är därför svala att ta på.
(±) Medeltemperaturen för handledsstödsområdet på liknande enheter var 27.5 °C / 81.5 F (+0.5 °C / 0.9 F).
| Lenovo ThinkPad E16 G1 Core i5-1335U Intel Core i5-1335U, Intel Iris Xe Graphics G7 80EUs | Lenovo ThinkPad E16 G1-21JUS08X00 AMD Ryzen 7 7730U, AMD Radeon RX Vega 8 (Ryzen 4000/5000) | Dell Inspiron 16 7635 2-in-1 AMD Ryzen 5 7530U, AMD Radeon RX Vega 7 | Acer TravelMate P4 TMP416-51-55KN Intel Core i5-1240P, Intel Iris Xe Graphics G7 80EUs | Samsung Galaxy Book3 Pro 16 Intel Core i5-1340P, Intel Iris Xe Graphics G7 80EUs | LG Gram 16Z90Q Intel Core i7-1260P, Intel Iris Xe Graphics G7 96EUs | |
|---|---|---|---|---|---|---|
| Heat | 0% | 4% | -1% | -5% | 6% | |
| Maximum Upper Side * (°C) | 44 | 46.1 -5% | 41.6 5% | 38.6 12% | 41.6 5% | 45 -2% |
| Maximum Bottom * (°C) | 50.4 | 52.2 -4% | 39 23% | 44.4 12% | 45 11% | 43 15% |
| Idle Upper Side * (°C) | 27.2 | 25.7 6% | 29.4 -8% | 28.9 -6% | 31 -14% | 26 4% |
| Idle Bottom * (°C) | 27.8 | 26.7 4% | 28.6 -3% | 34 -22% | 33.6 -21% | 26 6% |
* ... mindre är bättre
Stresstest
När Prime95 kördes ökade CPU:n till 4 GHz, 50 W och 94 C under de första sekunderna innan den stadigt sjönk och stabiliserades på 2,4 GHz, 86 C och 28 W när Turbo Boost inte längre räcker till. Det höga 80 C-intervallet är ganska varmt för en 16-tums bärbar dator i Core U-serien. Vi körde samma test påAcer Swift Edge 16 med Ryzen 7 7840U, till exempel, skulle få processorn att stabilisera sig på bara 64 C i jämförelse.
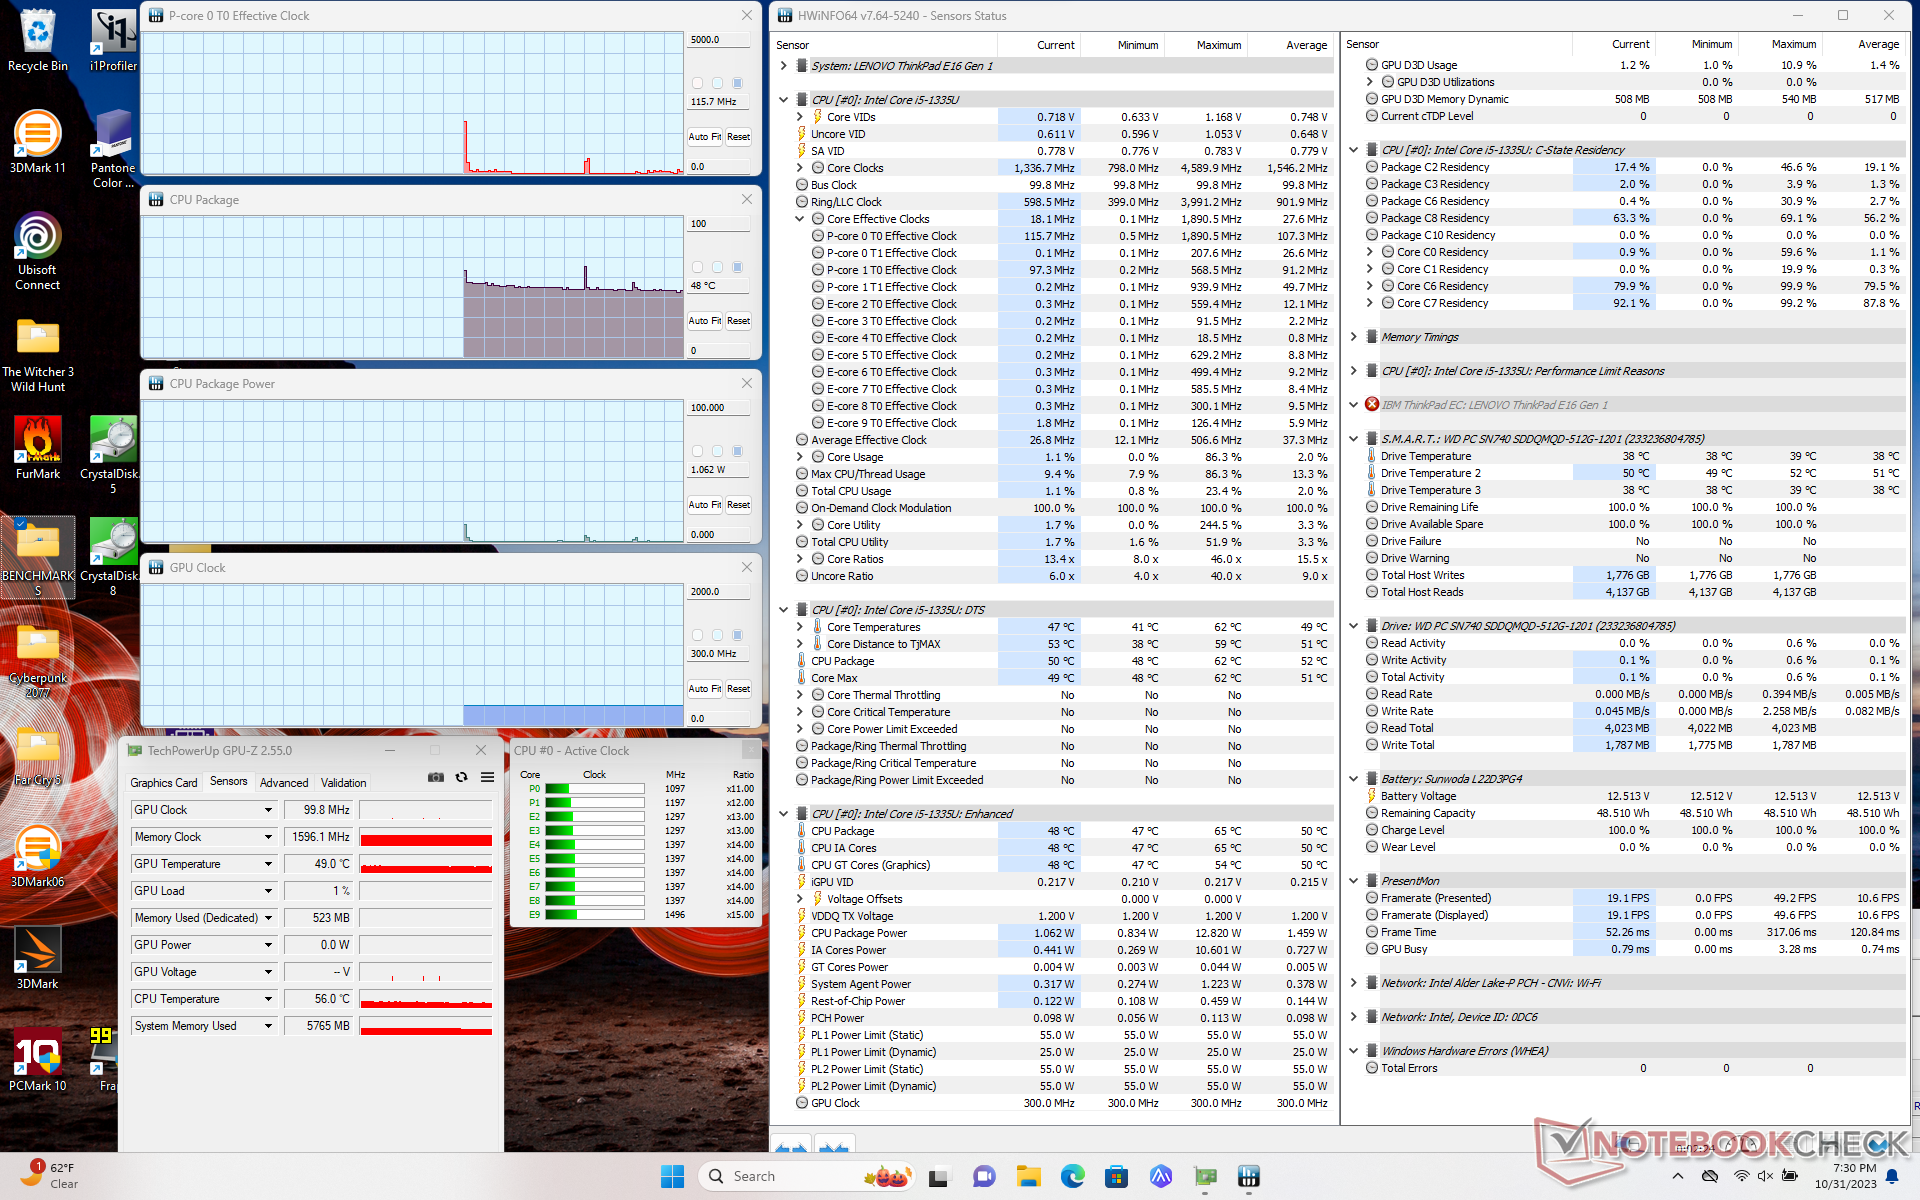
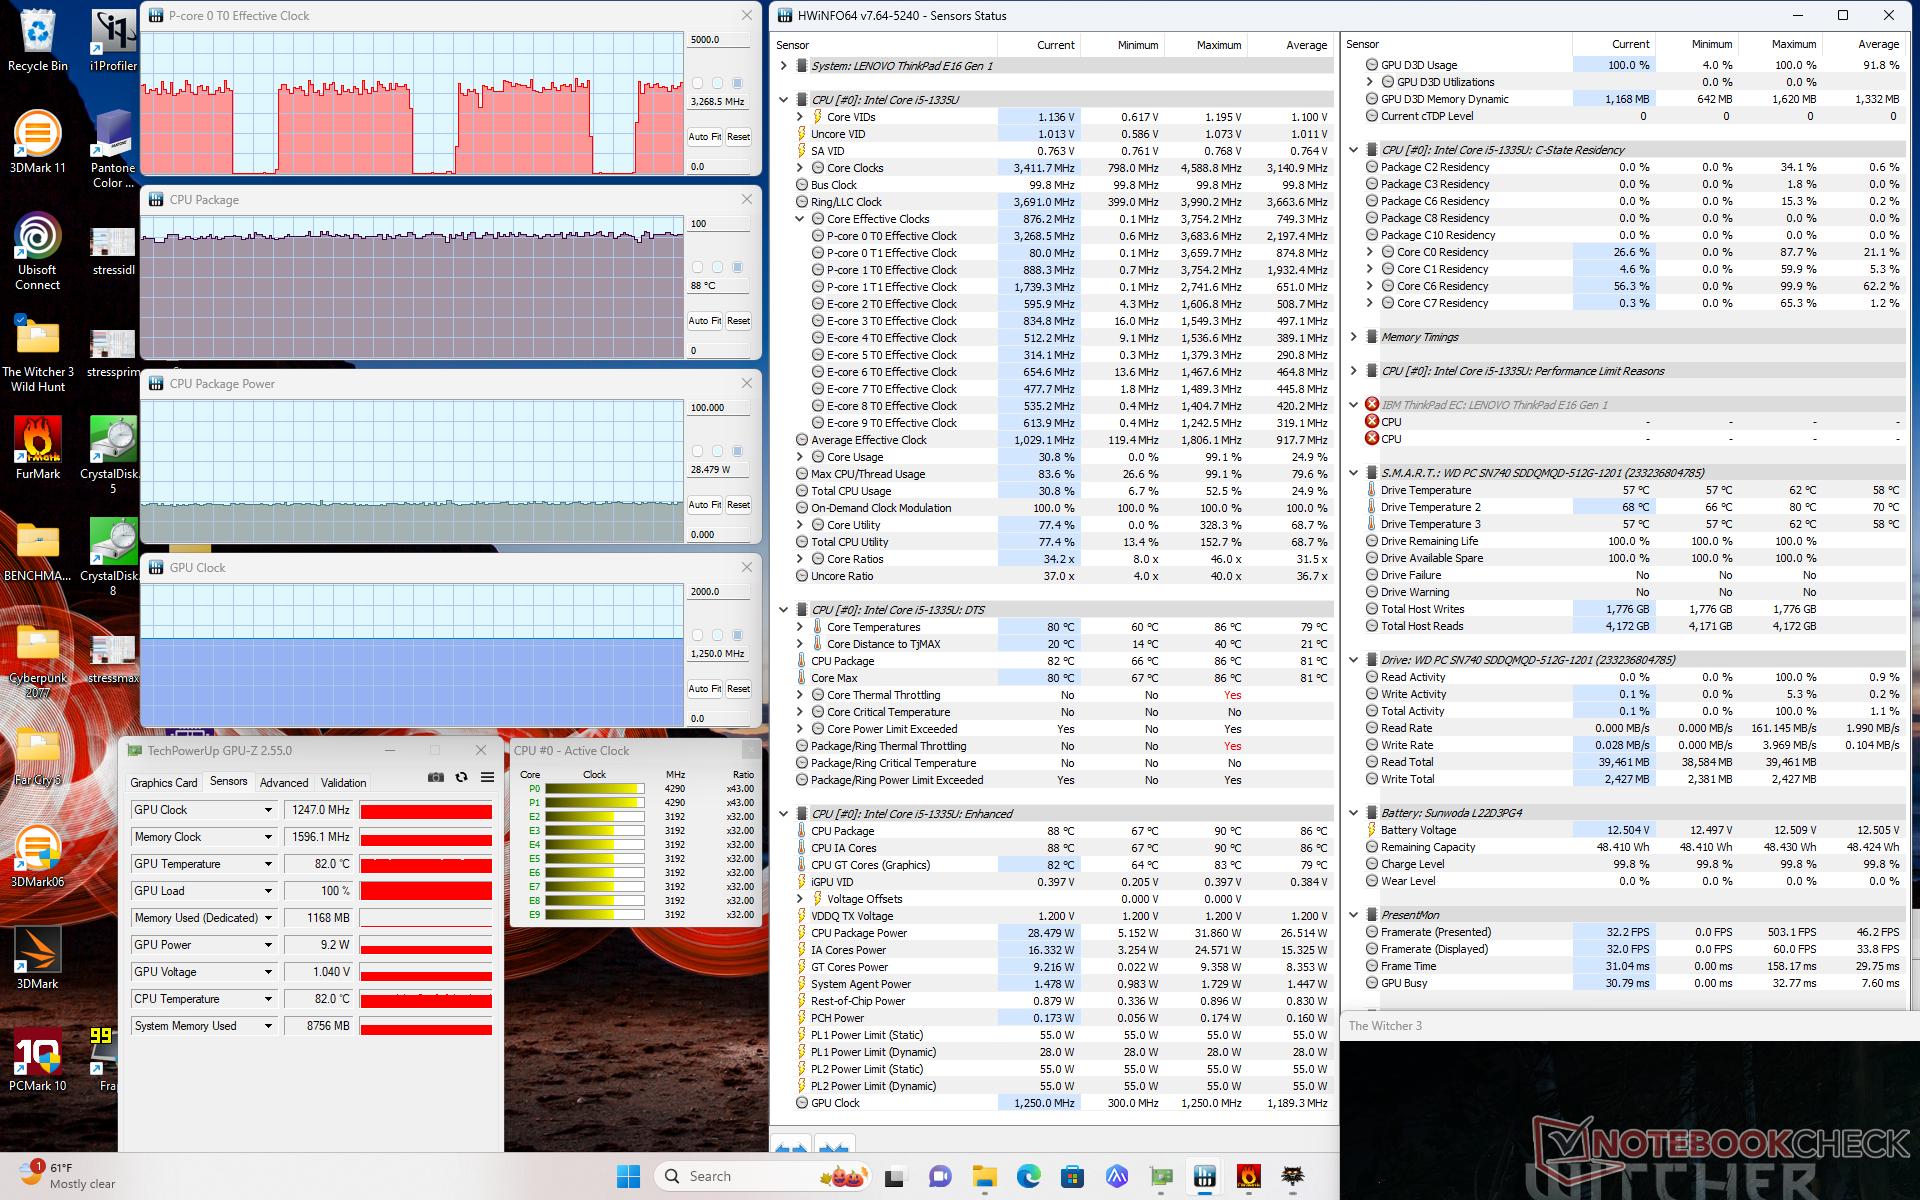
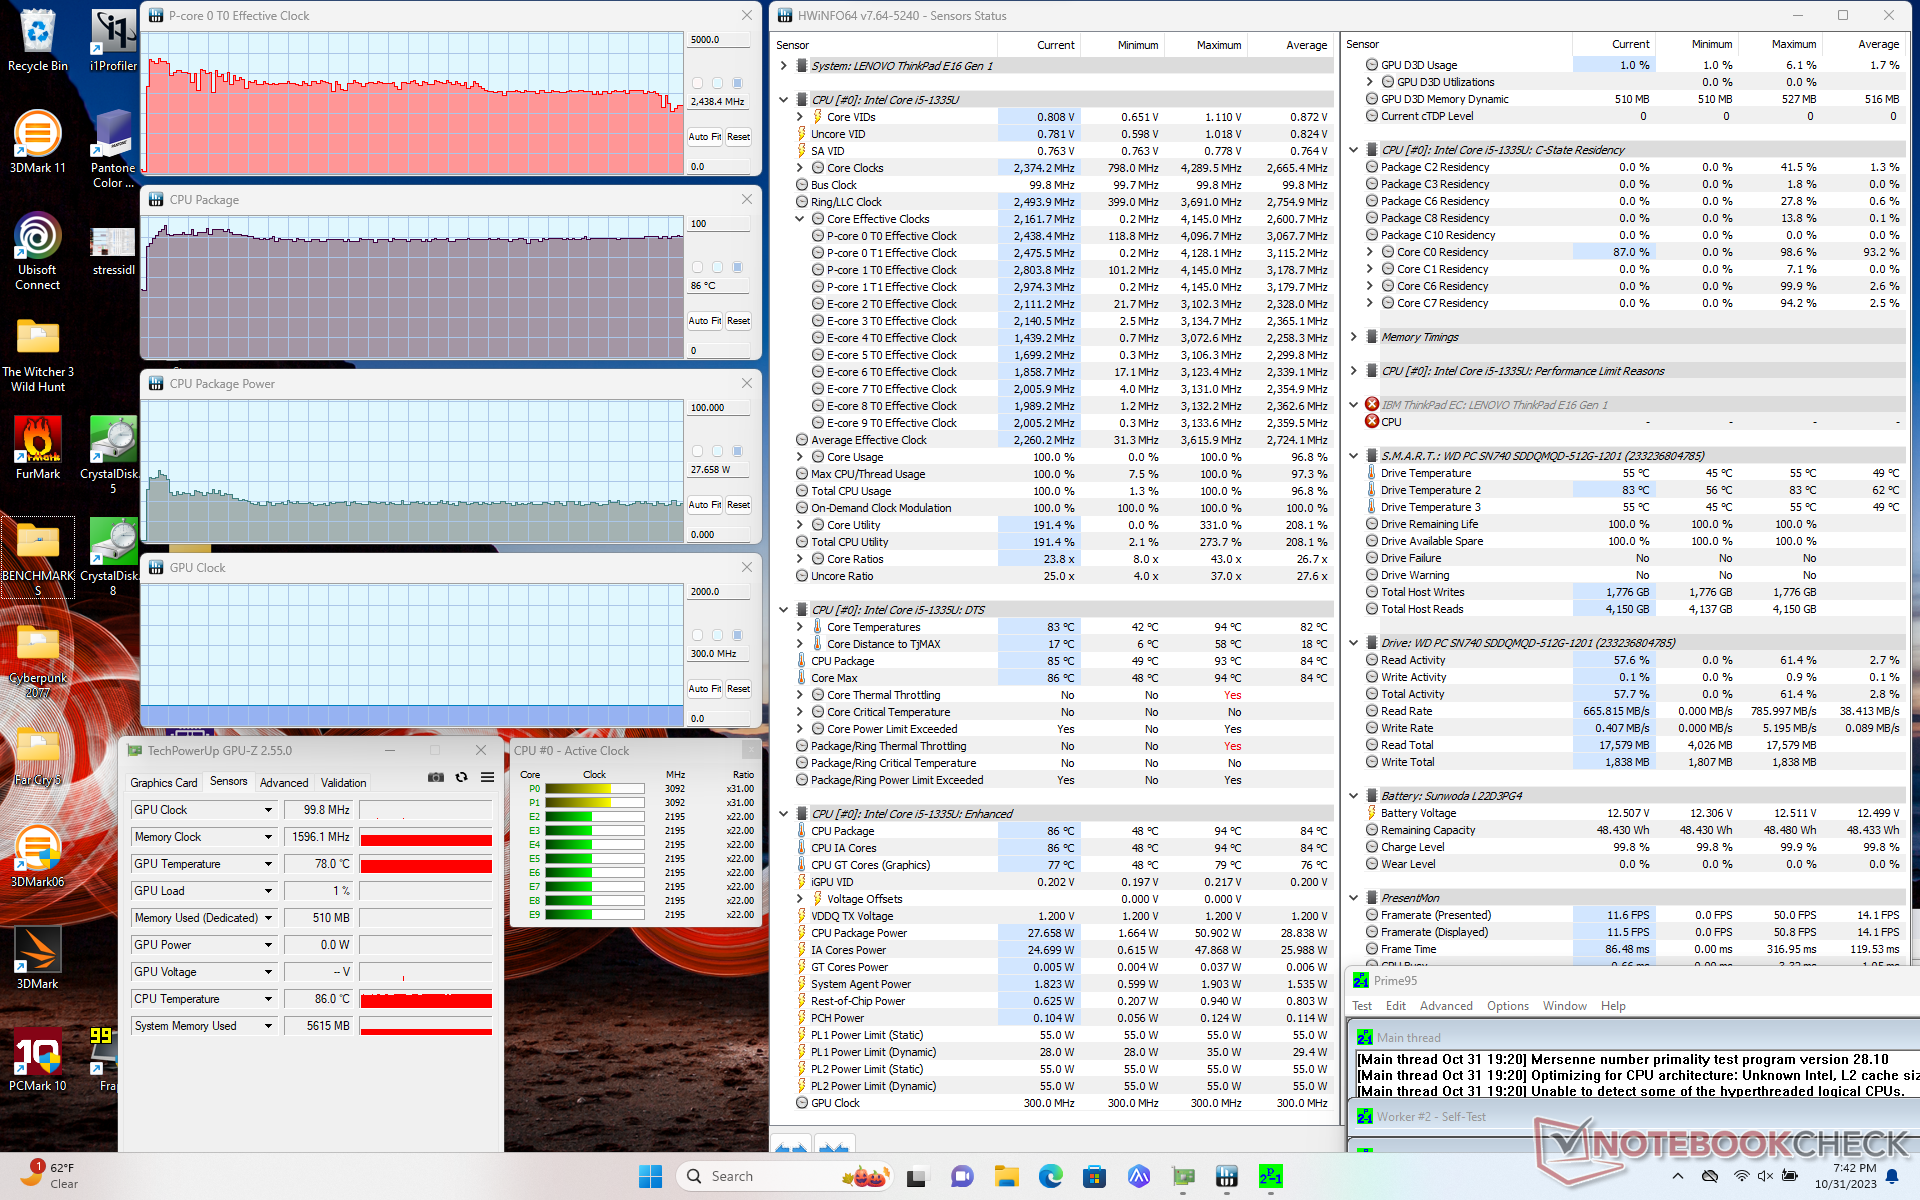
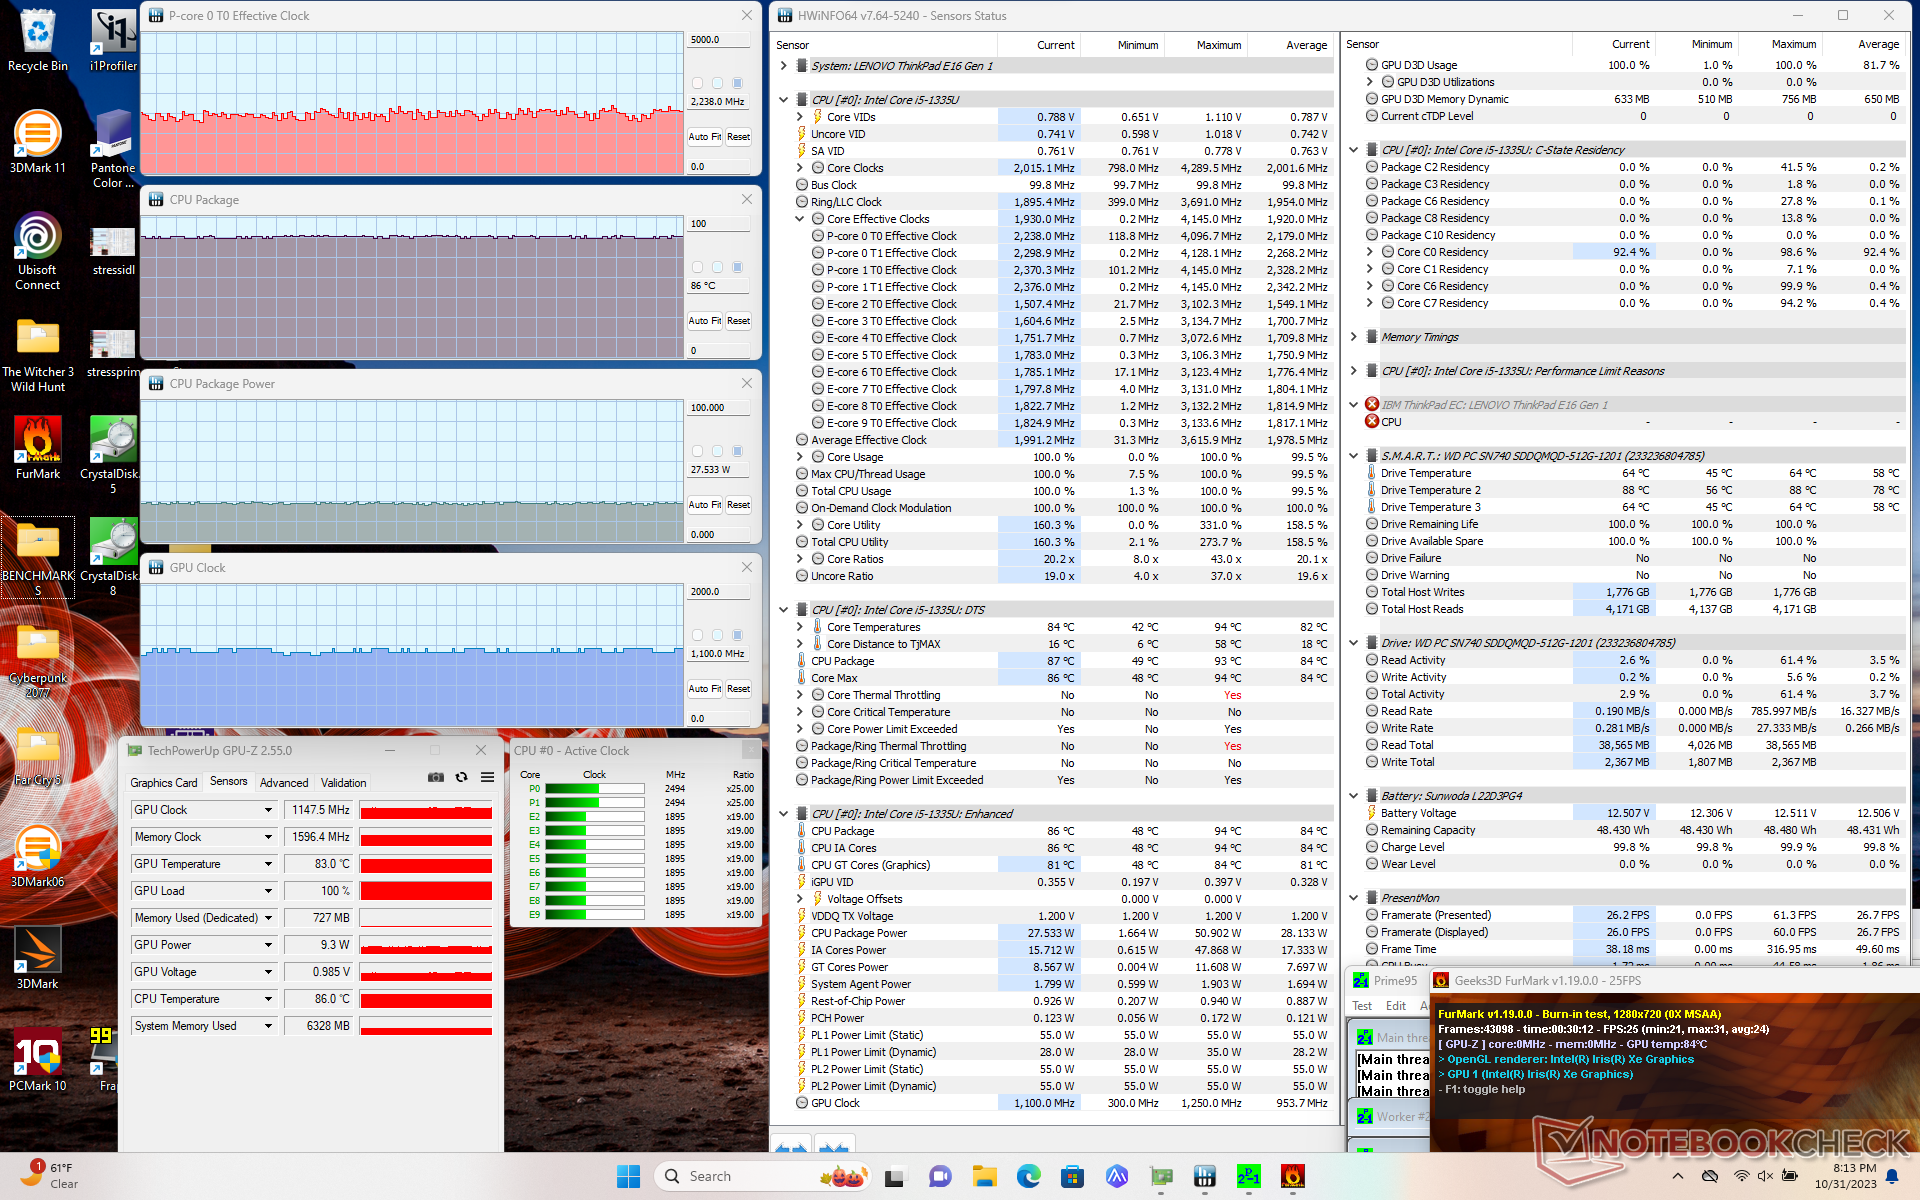
| CPU-klocka (GHz) | GPU-klocka (MHz) | Genomsnittlig CPU-temperatur (°C) | |
| System i viloläge | -- | -- | 48 |
| Prime95 Stress | 2.4 | -- | 86 |
| Prime95 + FurMark Stress | ~2.2 | 1100 | 86 |
| Witcher 3 Stress | ~3.2 | 1250 | 88 |
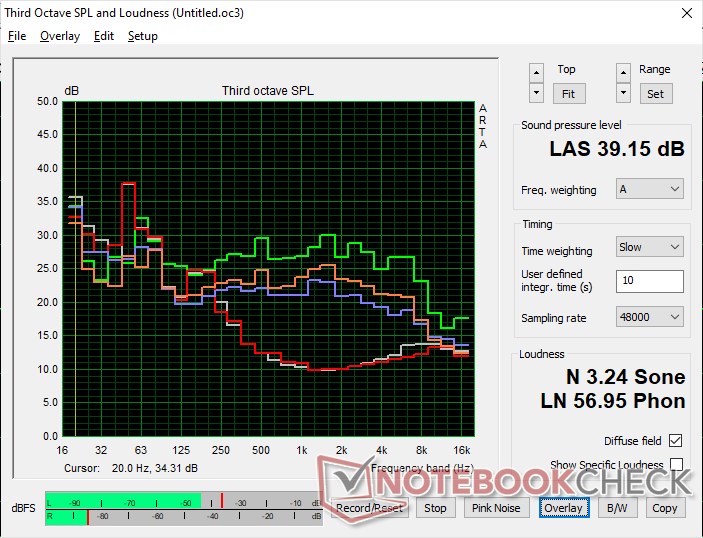
Högtalare
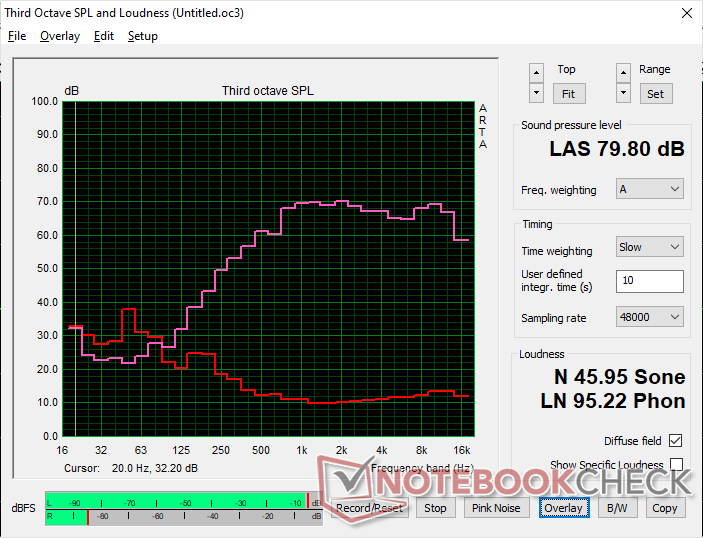
Lenovo ThinkPad E16 G1 Core i5-1335U ljudanalys
(±) | högtalarljudstyrkan är genomsnittlig men bra (79.8 dB)
Bas 100 - 315 Hz
(-) | nästan ingen bas - i genomsnitt 24.7% lägre än medianen
(±) | linjäriteten för basen är genomsnittlig (8.8% delta till föregående frekvens)
Mellan 400 - 2000 Hz
(+) | balanserad mellan - endast 4.8% från medianen
(+) | mids är linjära (4.8% delta till föregående frekvens)
Högsta 2 - 16 kHz
(+) | balanserade toppar - endast 2.1% från medianen
(+) | toppar är linjära (2.7% delta till föregående frekvens)
Totalt 100 - 16 000 Hz
(±) | linjäriteten för det totala ljudet är genomsnittlig (18.4% skillnad mot median)
Jämfört med samma klass
» 33% av alla testade enheter i den här klassen var bättre, 7% liknande, 60% sämre
» Den bästa hade ett delta på 7%, genomsnittet var 21%, sämst var 53%
Jämfört med alla testade enheter
» 41% av alla testade enheter var bättre, 8% liknande, 52% sämre
» Den bästa hade ett delta på 4%, genomsnittet var 24%, sämst var 134%
Apple MacBook Pro 16 2021 M1 Pro ljudanalys
(+) | högtalare kan spela relativt högt (84.7 dB)
Bas 100 - 315 Hz
(+) | bra bas - bara 3.8% från medianen
(+) | basen är linjär (5.2% delta till föregående frekvens)
Mellan 400 - 2000 Hz
(+) | balanserad mellan - endast 1.3% från medianen
(+) | mids är linjära (2.1% delta till föregående frekvens)
Högsta 2 - 16 kHz
(+) | balanserade toppar - endast 1.9% från medianen
(+) | toppar är linjära (2.7% delta till föregående frekvens)
Totalt 100 - 16 000 Hz
(+) | det totala ljudet är linjärt (4.6% skillnad mot median)
Jämfört med samma klass
» 0% av alla testade enheter i den här klassen var bättre, 0% liknande, 100% sämre
» Den bästa hade ett delta på 5%, genomsnittet var 17%, sämst var 45%
Jämfört med alla testade enheter
» 0% av alla testade enheter var bättre, 0% liknande, 100% sämre
» Den bästa hade ett delta på 4%, genomsnittet var 24%, sämst var 134%
Energiförvaltning
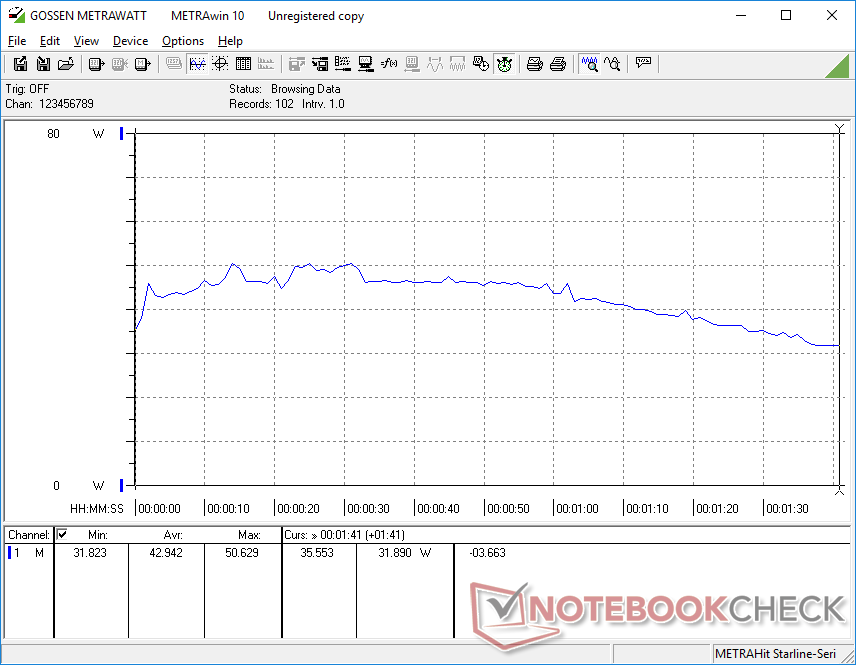
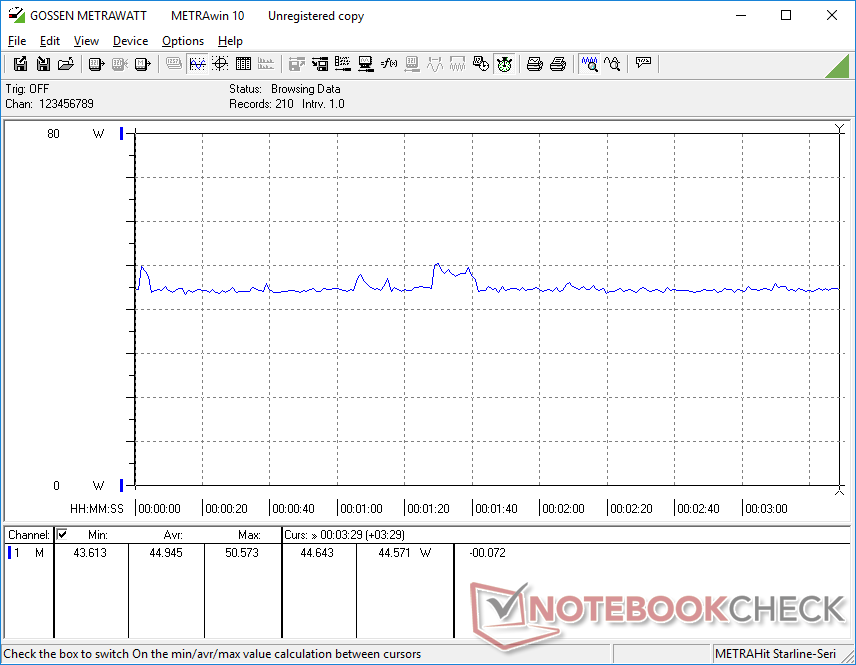
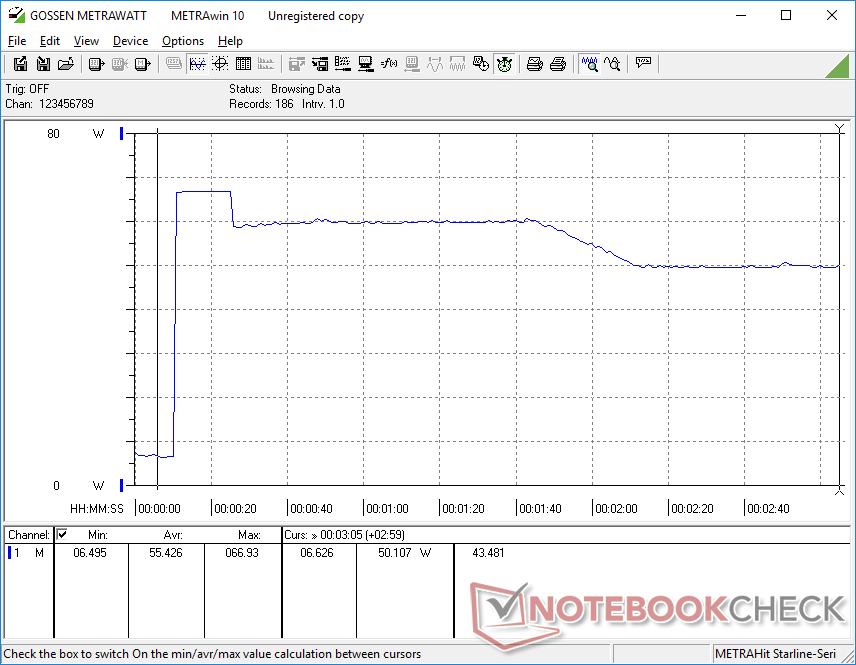
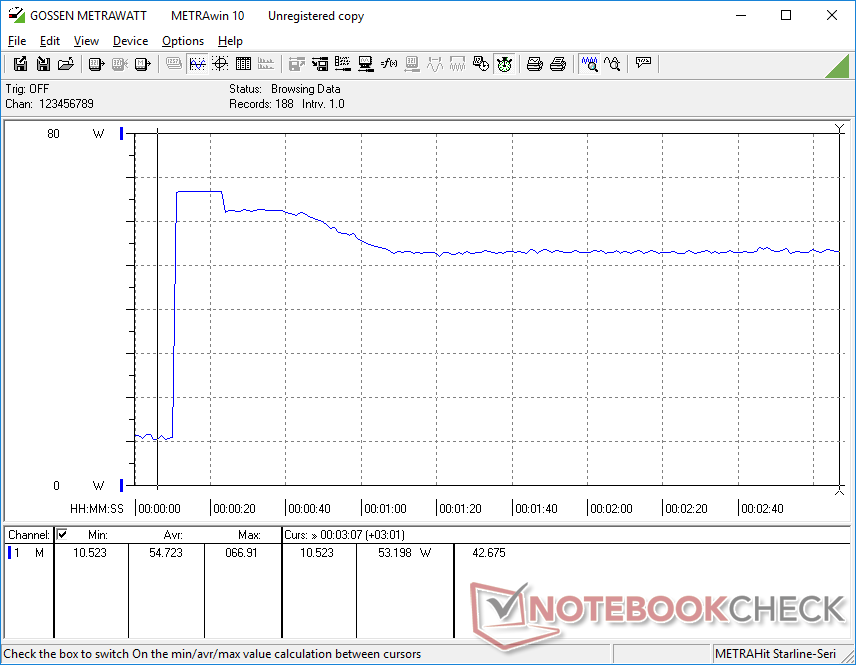
Strömförbrukning
Intel-systemet är generellt mer krävande än AMD-versionen när man kör CPU-intensiva uppgifter, även om AMD-processorn generellt är snabbare än Intel när det gäller flertrådade belastningar. När vi till exempel startade CineBench R15 xT kunde förbrukningen vara så hög som 68 W på vår Intel-enhet jämfört med bara 45 W på AMD-enheten. Liknande resultat kan också observeras när Prime95 körs. Den totala förbrukningen vid tomgångskörning på skrivbordet eller när man kör GPU-intensiva uppgifter som Witcher 3 är annars ungefär densamma mellan Intel- och AMD-versionerna.
| Av/Standby | |
| Låg belastning | |
| Hög belastning |
|
Förklaring:
min: | |
| Lenovo ThinkPad E16 G1 Core i5-1335U i5-1335U, Iris Xe G7 80EUs, , IPS, 1920x1200, 16" | Lenovo ThinkPad E16 G1-21JUS08X00 R7 7730U, Vega 8, WD PC SN740 SDDPNQD-1T00, IPS, 2560x1600, 16" | Dell Inspiron 16 7635 2-in-1 R5 7530U, Vega 7, Kioxia BG5 KBG50ZNS512G, IPS, 1920x1200, 16" | Acer TravelMate P4 TMP416-51-55KN i5-1240P, Iris Xe G7 80EUs, Micron 2450 512GB MTFDKBA512TFK, IPS, 1920x1200, 16" | Samsung Galaxy Book3 Pro 16 i5-1340P, Iris Xe G7 80EUs, WD PC SN740 256GB SDDPNQD-256G, AMOLED, 2880x1800, 16" | LG Gram 16Z90Q i7-1260P, Iris Xe G7 96EUs, Samsung PM9A1 MZVL21T0HCLR, IPS, 2560x1600, 16" | |
|---|---|---|---|---|---|---|
| Power Consumption | -3% | 2% | 1% | 9% | -7% | |
| Idle Minimum * (Watt) | 4.9 | 4.1 16% | 4.8 2% | 5.2 -6% | 3.9 20% | 5 -2% |
| Idle Average * (Watt) | 8.3 | 9.6 -16% | 7.6 8% | 7.1 14% | 4.8 42% | 8 4% |
| Idle Maximum * (Watt) | 8.6 | 10.2 -19% | 8.7 -1% | 9.6 -12% | 10 -16% | 14 -63% |
| Load Average * (Watt) | 42.9 | 47.3 -10% | 47.1 -10% | 47 -10% | 44 -3% | 47 -10% |
| Witcher 3 ultra * (Watt) | 44.9 | 46.7 -4% | 46.6 -4% | 43.3 4% | 42.3 6% | 37.8 16% |
| Load Maximum * (Watt) | 67 | 55.7 17% | 56.4 16% | 56 16% | 63 6% | 56 16% |
* ... mindre är bättre
Power Consumption Witcher 3 / Stresstest
Power Consumption external Monitor
Batteritid
Modellen levereras med två alternativ för batterikapacitet: 47 Wh och 57 Wh. Vår Intel-enhet levereras med det mindre alternativet medan vår AMD-enhet levereras med det större. Batteritiden är bara ungefär hälften så lång som på vår AMD-enhet för endast 5 timmars verklig surfanvändning. För en 16-tums bärbar dator är 47 Wh-alternativet mycket mindre än förväntat och ett definitivt hörn.
Laddning från tom till full kapacitet går lyckligtvis ganska snabbt på drygt en timme.
| Lenovo ThinkPad E16 G1 Core i5-1335U i5-1335U, Iris Xe G7 80EUs, 47 Wh | Lenovo ThinkPad E16 G1-21JUS08X00 R7 7730U, Vega 8, 57 Wh | Dell Inspiron 16 7635 2-in-1 R5 7530U, Vega 7, 64 Wh | Acer TravelMate P4 TMP416-51-55KN i5-1240P, Iris Xe G7 80EUs, 56 Wh | Samsung Galaxy Book3 Pro 16 i5-1340P, Iris Xe G7 80EUs, 76 Wh | LG Gram 16Z90Q i7-1260P, Iris Xe G7 96EUs, 80 Wh | |
|---|---|---|---|---|---|---|
| Batteridrifttid | 117% | 179% | 81% | 96% | 94% | |
| WiFi v1.3 (h) | 5.2 | 11.3 117% | 14.5 179% | 9.4 81% | 10.2 96% | 10.1 94% |
| H.264 (h) | 11.7 | 14.4 | ||||
| Load (h) | 1.3 | 1.9 | 2 | 2.6 | ||
| Reader / Idle (h) | 26 | 30.4 | 18.1 |
För
Emot
Dom - AMD vinner stort på batteritid
Om du väljer Intel ThinkPad E16 G1 istället för AMD får du Thunderbolt-stöd, snabbare single-thread-prestanda och snabbare integrerad grafikprestanda förutsatt att du väljer Core i7-1355U. Dessa fördelar kan dock sägas vara bleka i jämförelse med vad AMD-versionen erbjuder: märkbart längre batteritid, högre prestanda per watt, snabbare multi-thread-prestanda och stöd för M.2 2280 SSD-enheter. Således måste du verkligen värdesätta de överlägsna dockningsfunktionerna i Intel-versionen om du bestämmer dig för att hoppa över AMD-alternativen.
Om du inte planerar att ansluta Thunderbolt-skärmar eller eGPU:er till din ThinkPad E16 G1, kan AMD-versionerna erbjuda både längre batteritid och snabbare flertrådsprestanda än Intel-alternativen till ungefär samma pris.
Oavsett vilken version man föredrar bör man ändå vara försiktig med skärm- och batteristorleken innan man köper. Tyvärr är det inte alla återförsäljare som listar färgtäckning eller batterikapacitet, så det är lätt att av misstag köpa en konfiguration med den sämre skärmen eller det mindre 47 Wh-batteripaketet. Vi rekommenderar att du siktar på full sRGB-täckning och det större 57 Wh-batteripaketet om möjligt, eftersom det är betydande förbättringar jämfört med baskonfigurationen.
Pris och tillgänglighet
Lenovo levererar nu ThinkPad E16 G1 från 638 USD för Core i3-konfigurationen eller 724 USD för Core i5-konfigurationen.
Lenovo ThinkPad E16 G1 Core i5-1335U
- 11/02/2023 v7 (old)
Allen Ngo
Genomskinlighet
Valet av enheter som ska granskas görs av vår redaktion. Testprovet gavs till författaren som ett lån av tillverkaren eller återförsäljaren för denna recension. Långivaren hade inget inflytande på denna recension och inte heller fick tillverkaren en kopia av denna recension innan publiceringen. Det fanns ingen skyldighet att publicera denna recension. Som ett oberoende medieföretag är Notebookcheck inte föremål för auktoritet från tillverkare, återförsäljare eller förlag.
This is how Notebookcheck is testingEvery year, Notebookcheck independently reviews hundreds of laptops and smartphones using standardized procedures to ensure that all results are comparable. We have continuously developed our test methods for around 20 years and set industry standards in the process. In our test labs, high-quality measuring equipment is utilized by experienced technicians and editors. These tests involve a multi-stage validation process. Our complex rating system is based on hundreds of well-founded measurements and benchmarks, which maintains objectivity.
Price comparison

