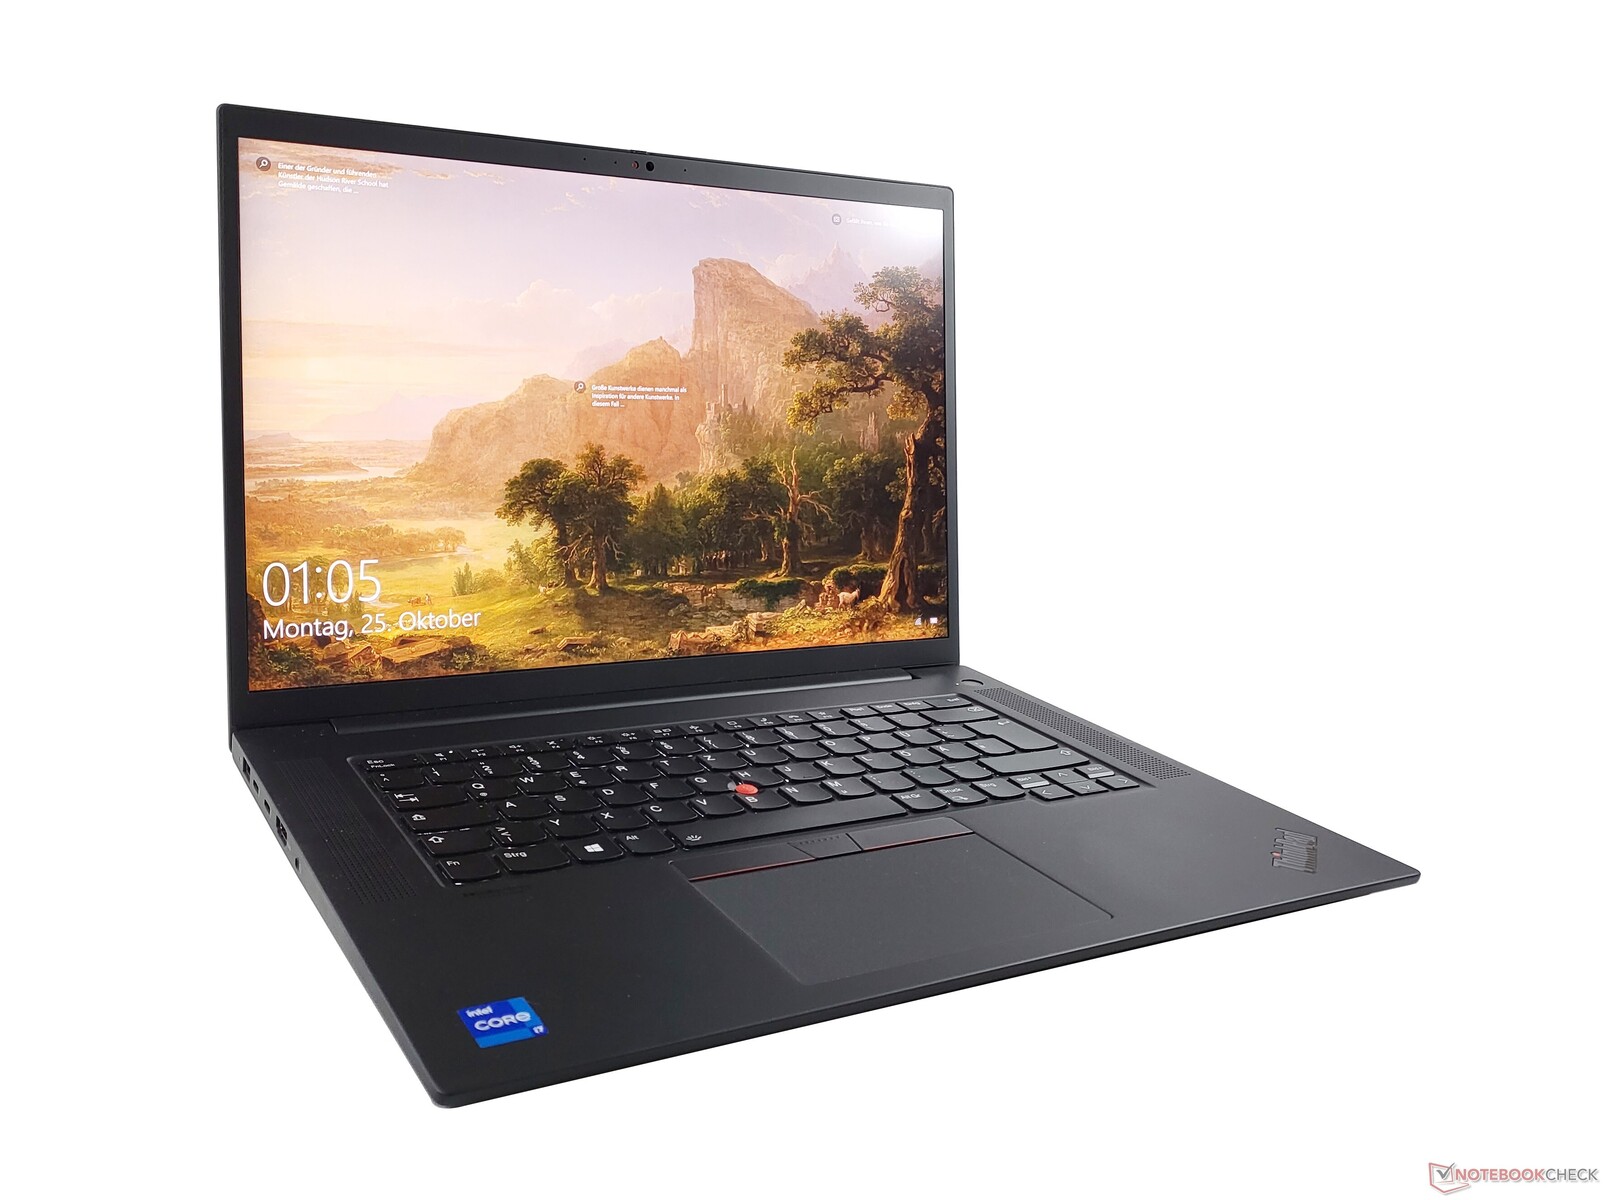
Recension: Lenovo ThinkPad P1 G4 - Framgång med ångkammare och GeForce RTX 3070
När Lenovo lanserade ThinkPad P1 2018 var rollfördelningen i arbetsstationsutbudet tydlig: Den nya premiummodellen skulle ta upp köpare som behövde en särskilt tunn och lätt mobil arbetsstation och som kunde offra lite prestanda för det. Den klassiska arbetsstationsmodellen Lenovo ThinkPad P52 erbjöd å andra sidan mer prestanda med mindre rörlighet.
Den nya Lenovo ThinkPad P1 G4 har fortfarande sin mobilitetsfördel jämfört med den ThinkPad P15 G2, den nuvarande ThinkPad-arbetsstationen med fullmatning. Kunderna behöver dock inte nödvändigtvis offra prestanda längre - åtminstone på pappret. Lenovo har uppgraderat ThinkPad P1 avsevärt och utrustat vår testmodell med en Nvidia GeForce RTX 3070 och 4K UHD+-upplösning som motsvarar en av de starkaste konfigurationsvarianterna. Eftersom vi nyligen testade ThinkPad P1 2021 i en lägre konfiguration hänvisar vi till recensionen avThinkPad P1 Gen 4 med Nvidia T1200 för detaljer om konfiguration, inmatningsenheter och design
Testgrupp
Gradering | Datum | Modell | Vikt | Höjd | Storlek | Upplösning | Pris |
|---|---|---|---|---|---|---|---|
| 89.8 % v7 (old) | 11/2021 | Lenovo ThinkPad P1 G4-20Y4S0KS00 i7-11850H, GeForce RTX 3070 Laptop GPU | 2 kg | 17.7 mm | 16.00" | 3840x2400 | |
| 89.4 % v7 (old) | Lenovo ThinkPad P1 G4-20Y30017GE i7-11800H, T1200 Laptop GPU | 1.8 kg | 17.7 mm | 16.00" | 2560x1600 | ||
| 88.3 % v7 (old) | 12/2021 | Dell Precision 5000 5560 i7-11850H, RTX A2000 Laptop GPU | 2 kg | 18 mm | 15.60" | 3840x2400 | |
| 89.7 % v7 (old) | 12/2019 | Apple MacBook Pro 16 2019 i9 5500M i9-9880H, Radeon Pro 5500M | 2 kg | 16.2 mm | 16.00" | 3072x1920 | |
| 87.8 % v7 (old) | 09/2021 | HP ZBook Studio 15 G8 i9-11950H, GeForce RTX 3070 Laptop GPU | 1.9 kg | 18 mm | 15.60" | 3840x2160 | |
| 90.1 % v7 (old) | Lenovo ThinkPad X1 Extreme Gen3-20TLS0UV00 i7-10750H, GeForce GTX 1650 Ti Max-Q | 1.7 kg | 18.7 mm | 15.60" | 1920x1080 |
| SD Card Reader | |
| average JPG Copy Test (av. of 3 runs) | |
| Lenovo ThinkPad P1 G4-20Y30017GE (AV PRO V60) | |
| Dell Precision 5000 5560 (AV Pro V60) | |
| Genomsnitt av klass Workstation (49.6 - 681, n=14, senaste 2 åren) | |
| Lenovo ThinkPad X1 Extreme Gen3-20TLS0UV00 (Toshiba Exceria Pro SDXC 64 GB UHS-II) | |
| HP ZBook Studio 15 G8 (AV Pro V60) | |
| maximum AS SSD Seq Read Test (1GB) | |
| Genomsnitt av klass Workstation (87.6 - 1455, n=14, senaste 2 åren) | |
| Lenovo ThinkPad X1 Extreme Gen3-20TLS0UV00 (Toshiba Exceria Pro SDXC 64 GB UHS-II) | |
| Dell Precision 5000 5560 (AV Pro V60) | |
| Lenovo ThinkPad P1 G4-20Y30017GE (AV PRO V60) | |
| HP ZBook Studio 15 G8 (AV Pro V60) | |
| Networking | |
| iperf3 transmit AX12 | |
| HP ZBook Studio 15 G8 | |
| Lenovo ThinkPad P1 G4-20Y30017GE | |
| Lenovo ThinkPad X1 Extreme Gen3-20TLS0UV00 | |
| Genomsnitt Intel Wi-Fi 6E AX210 (675 - 1602, n=27) | |
| Dell Precision 5000 5560 | |
| Apple MacBook Pro 16 2019 i9 5500M | |
| iperf3 receive AX12 | |
| Lenovo ThinkPad P1 G4-20Y30017GE | |
| Lenovo ThinkPad X1 Extreme Gen3-20TLS0UV00 | |
| Dell Precision 5000 5560 | |
| HP ZBook Studio 15 G8 | |
| Genomsnitt Intel Wi-Fi 6E AX210 (914 - 1716, n=27) | |
| Apple MacBook Pro 16 2019 i9 5500M | |


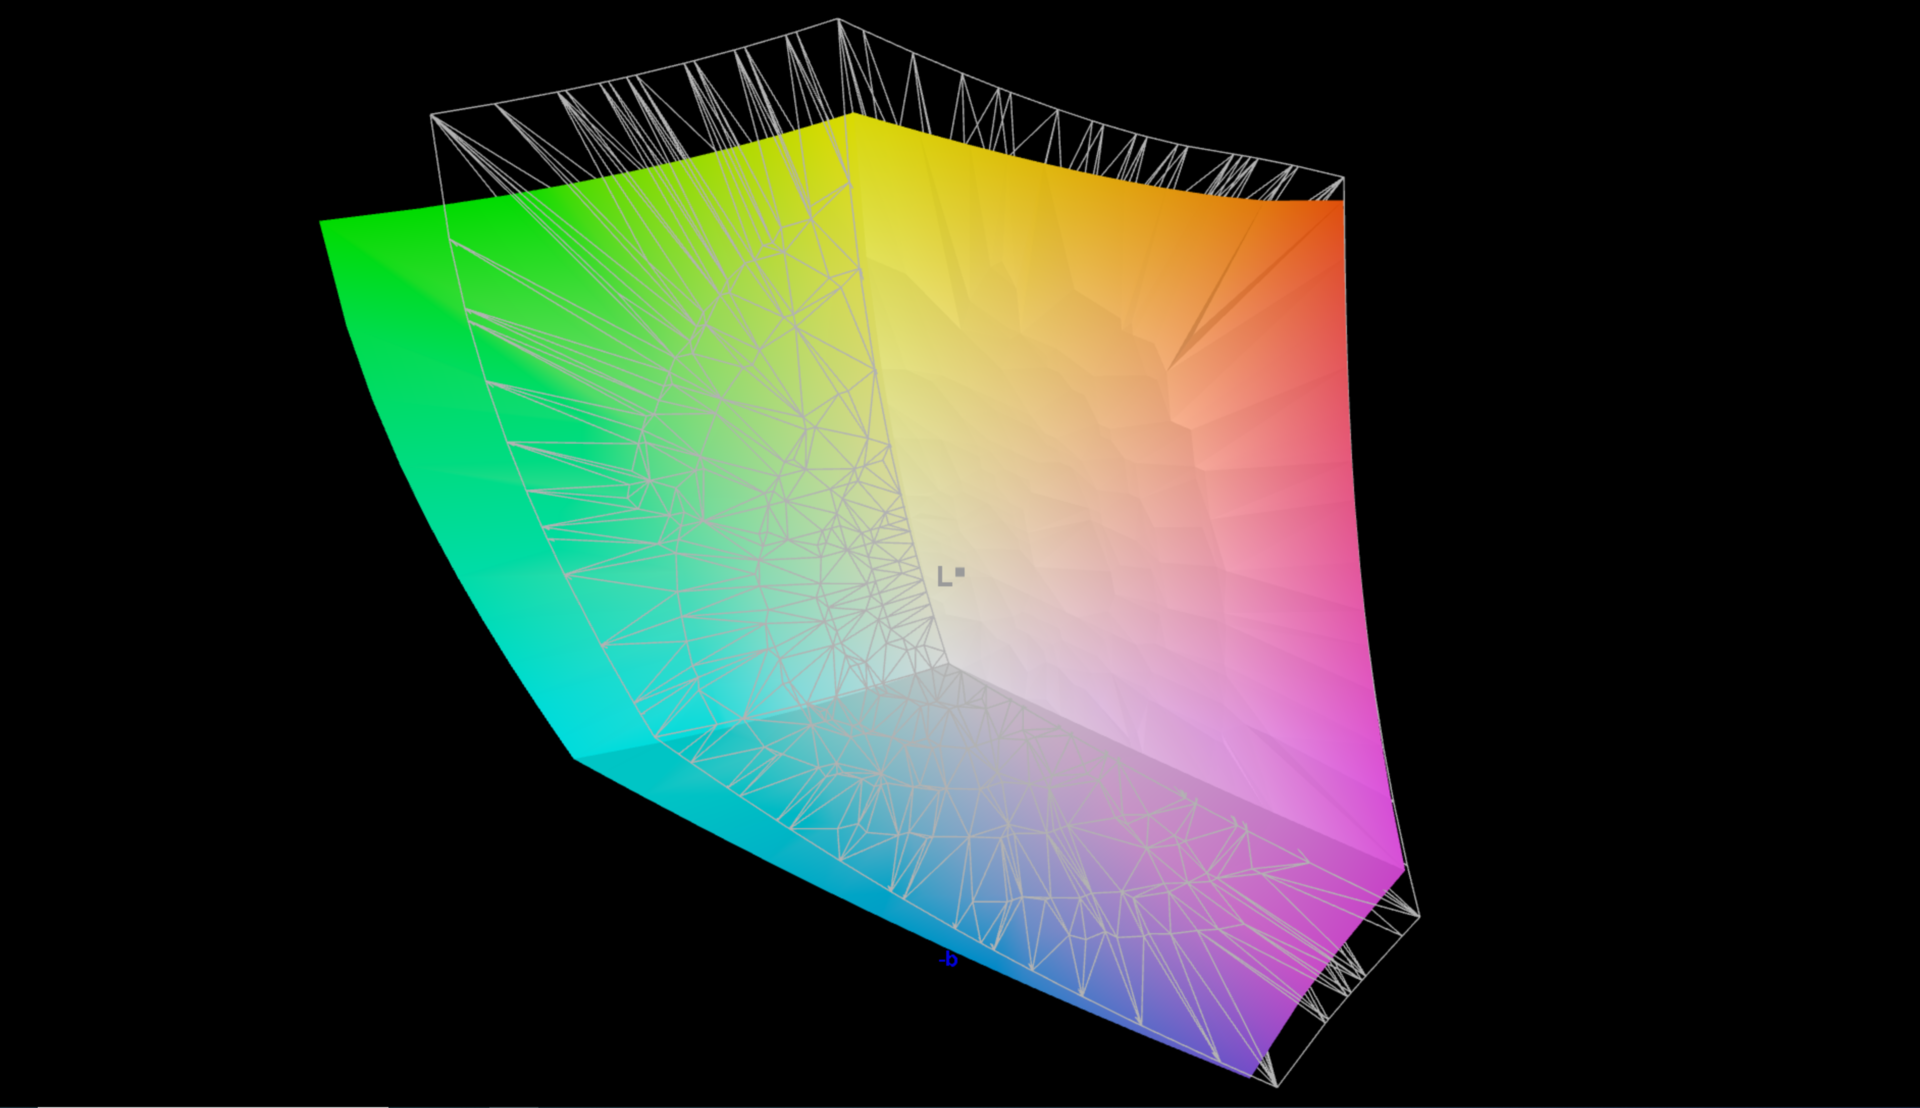
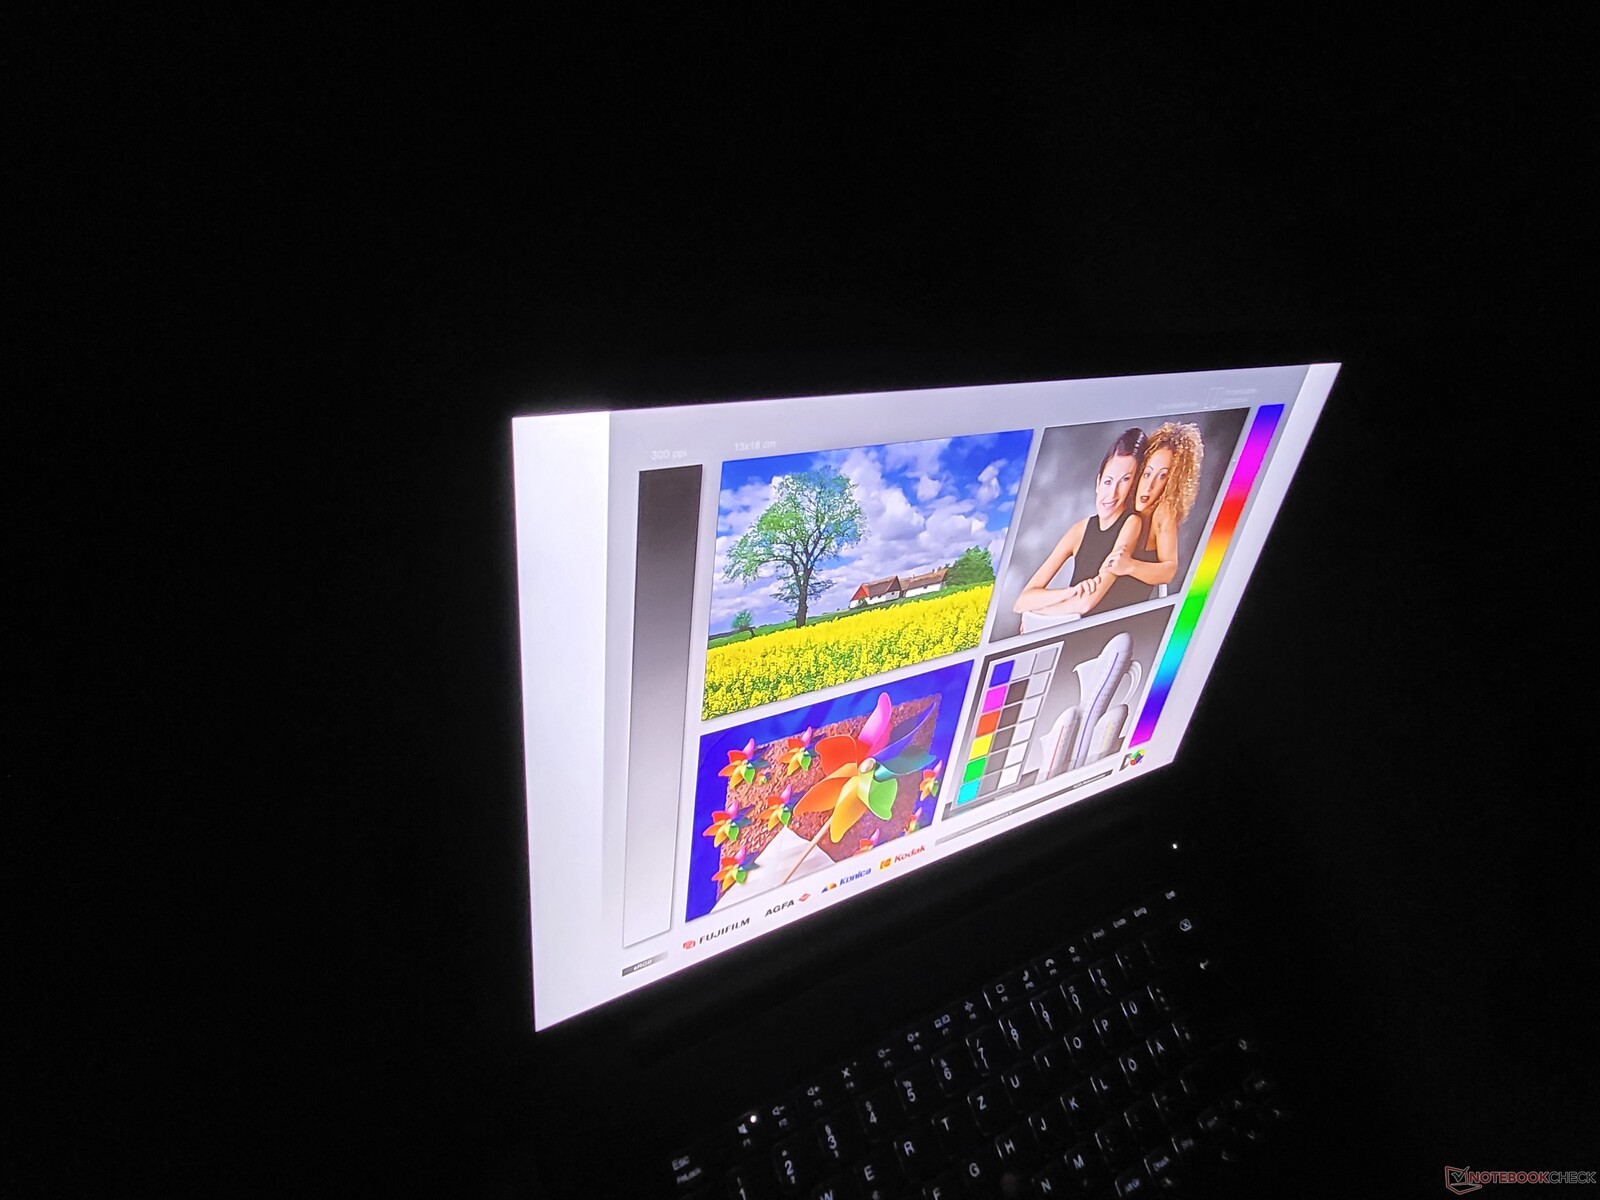
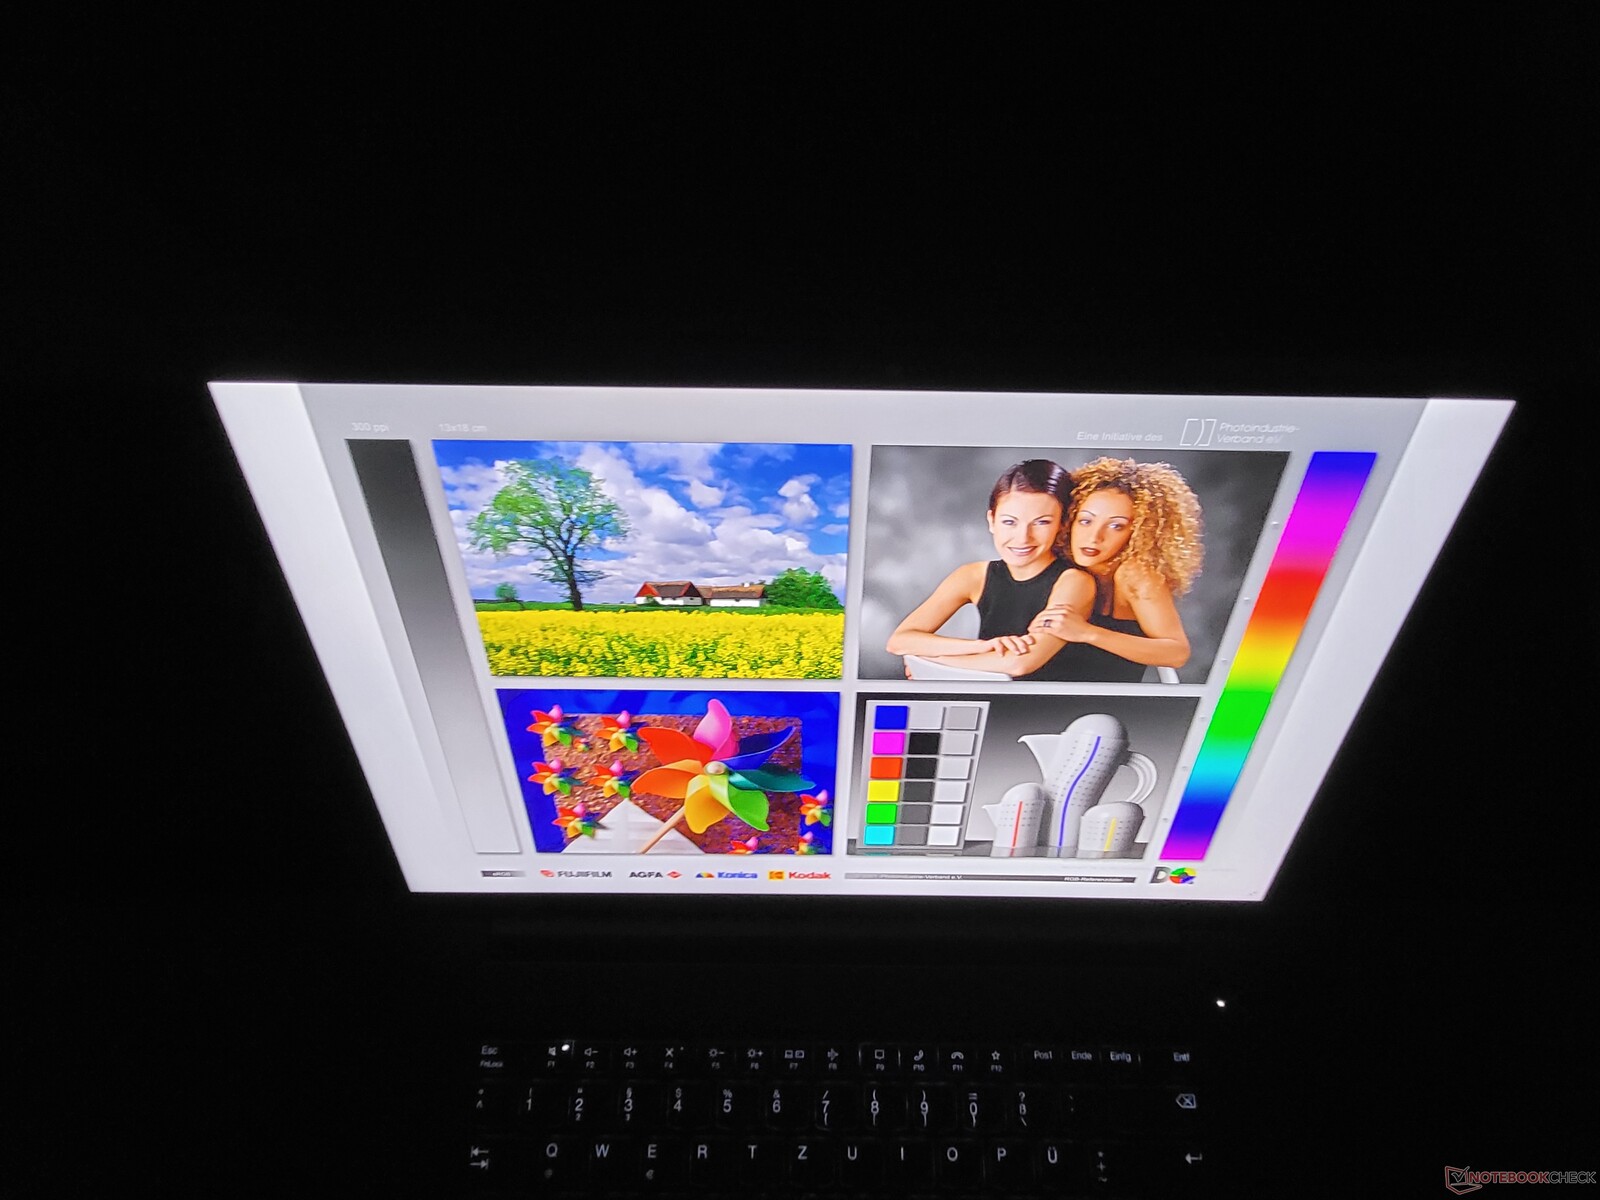
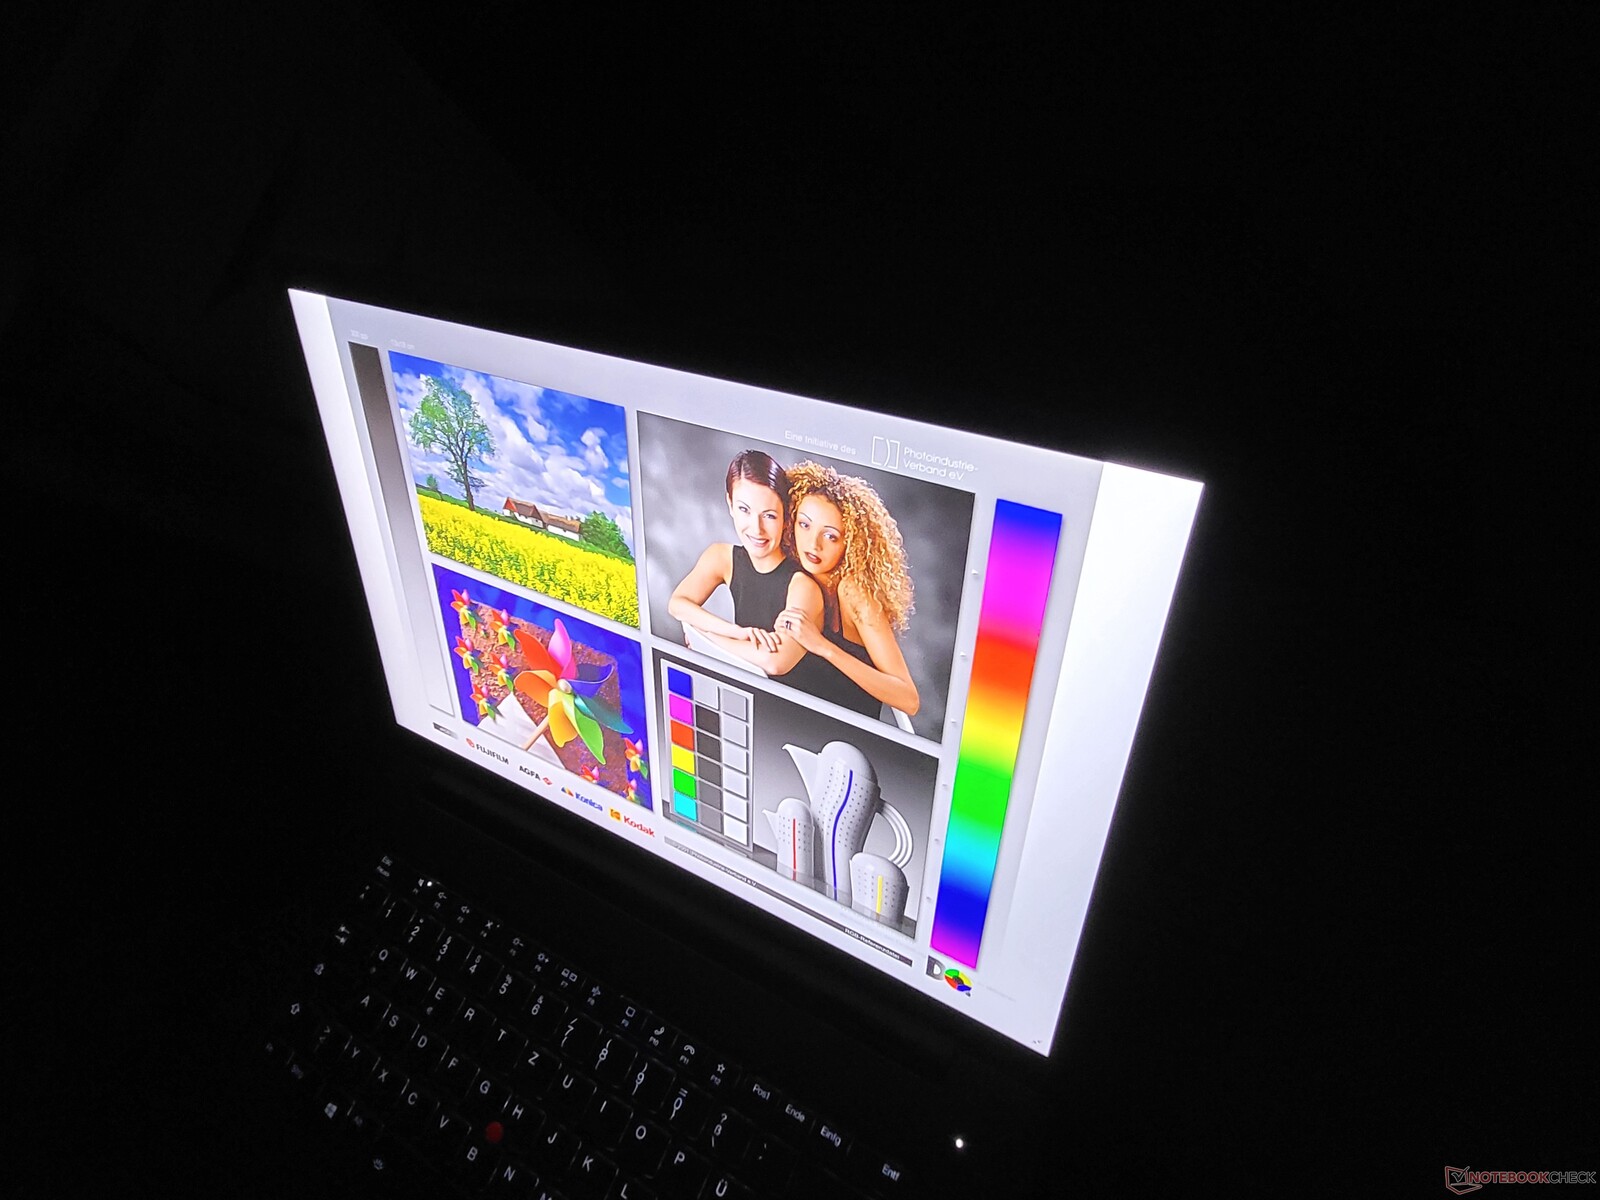
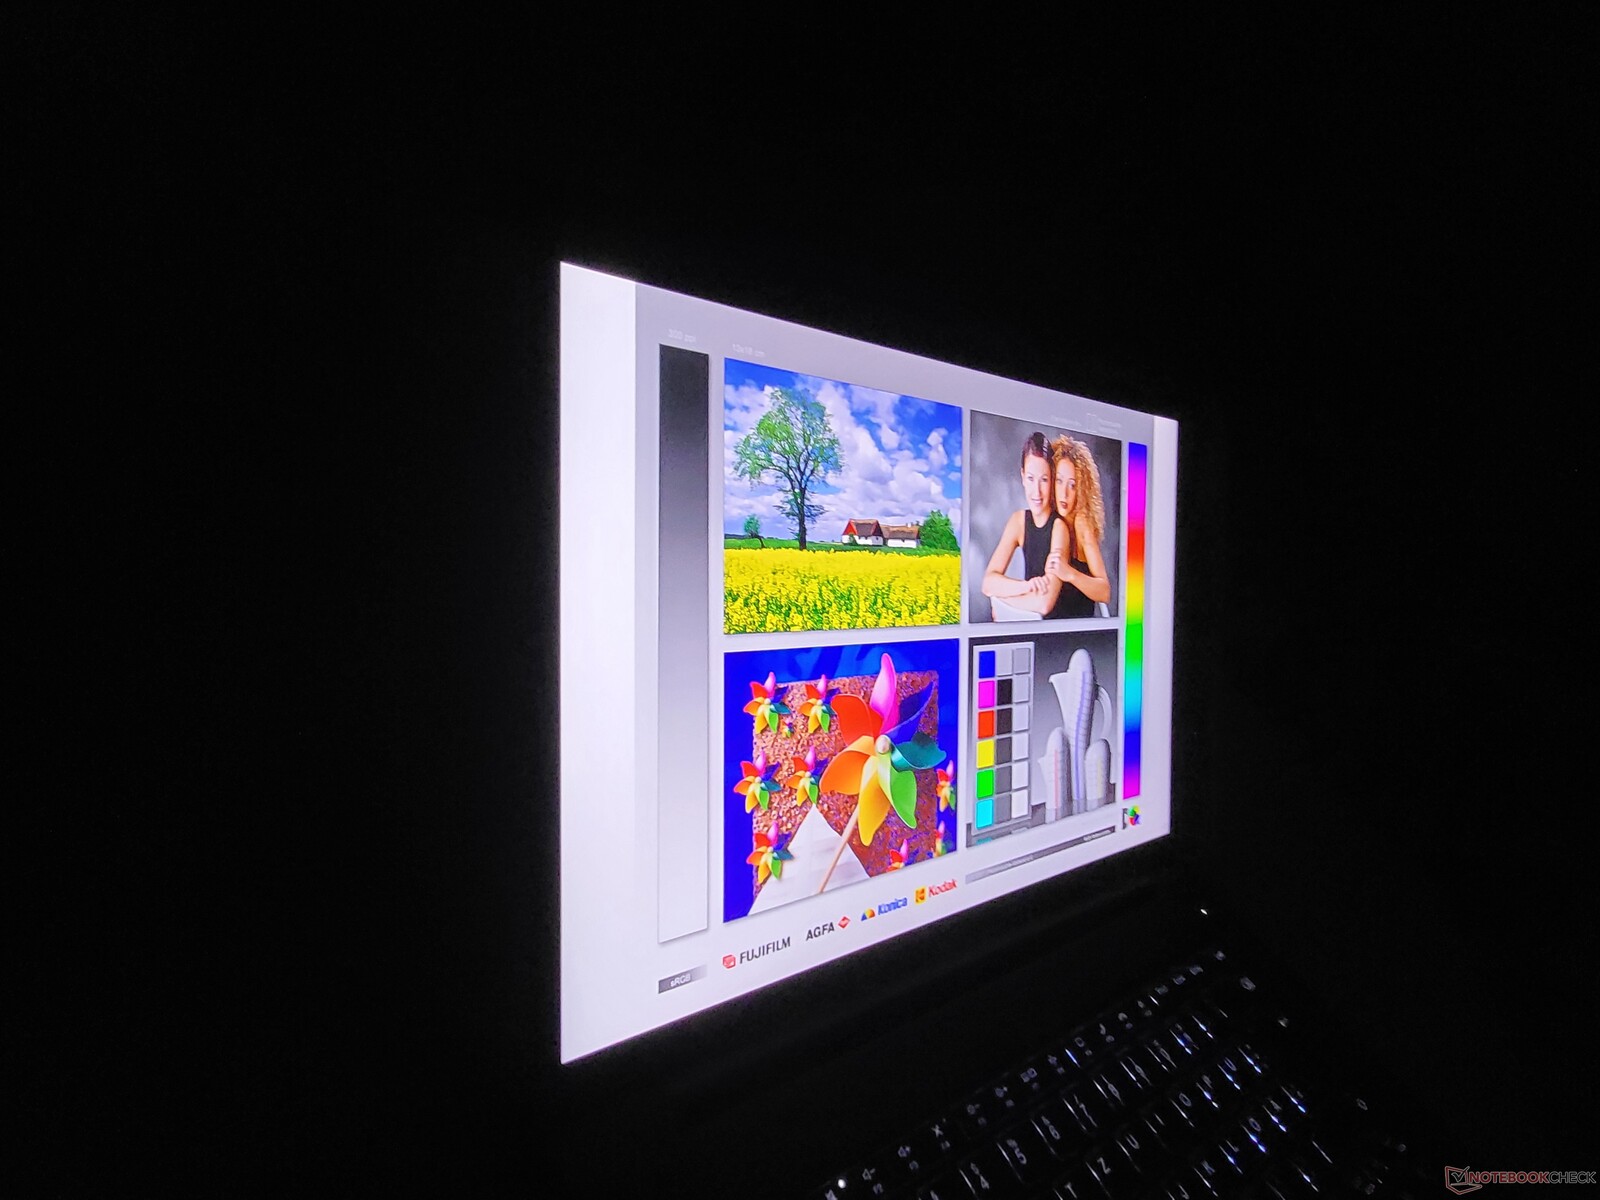
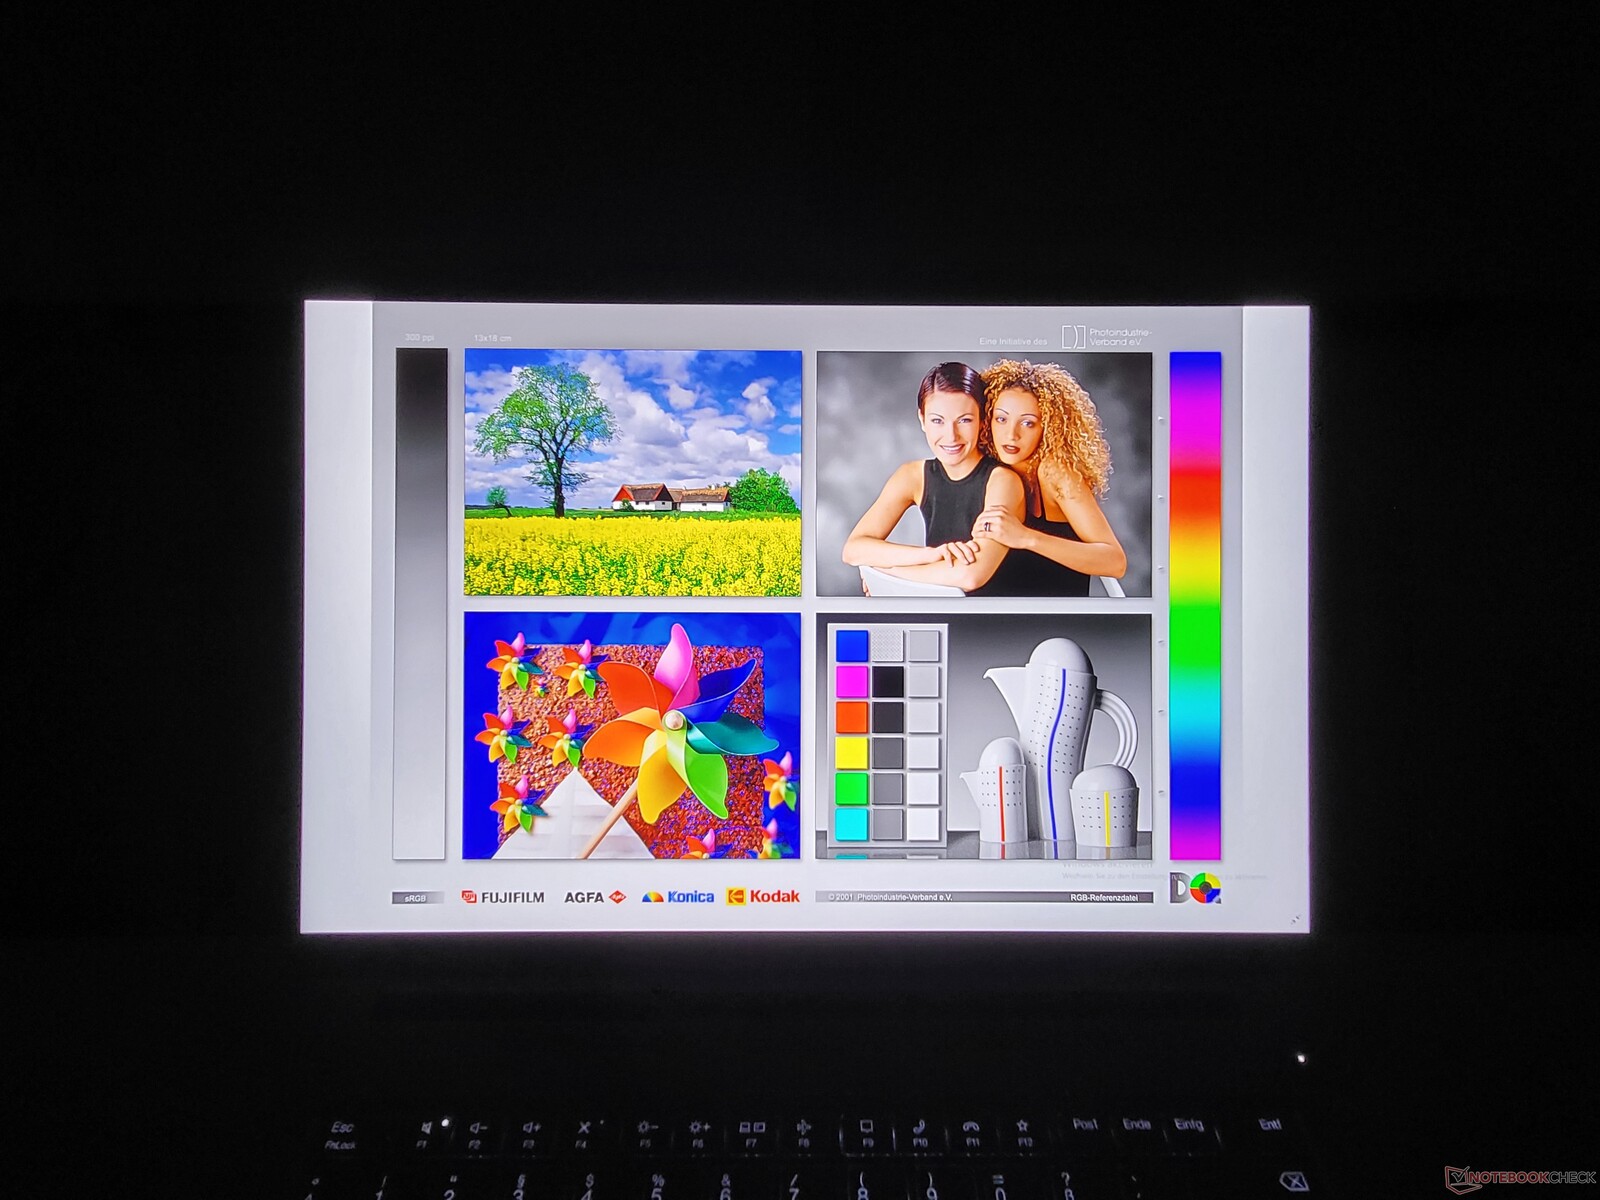
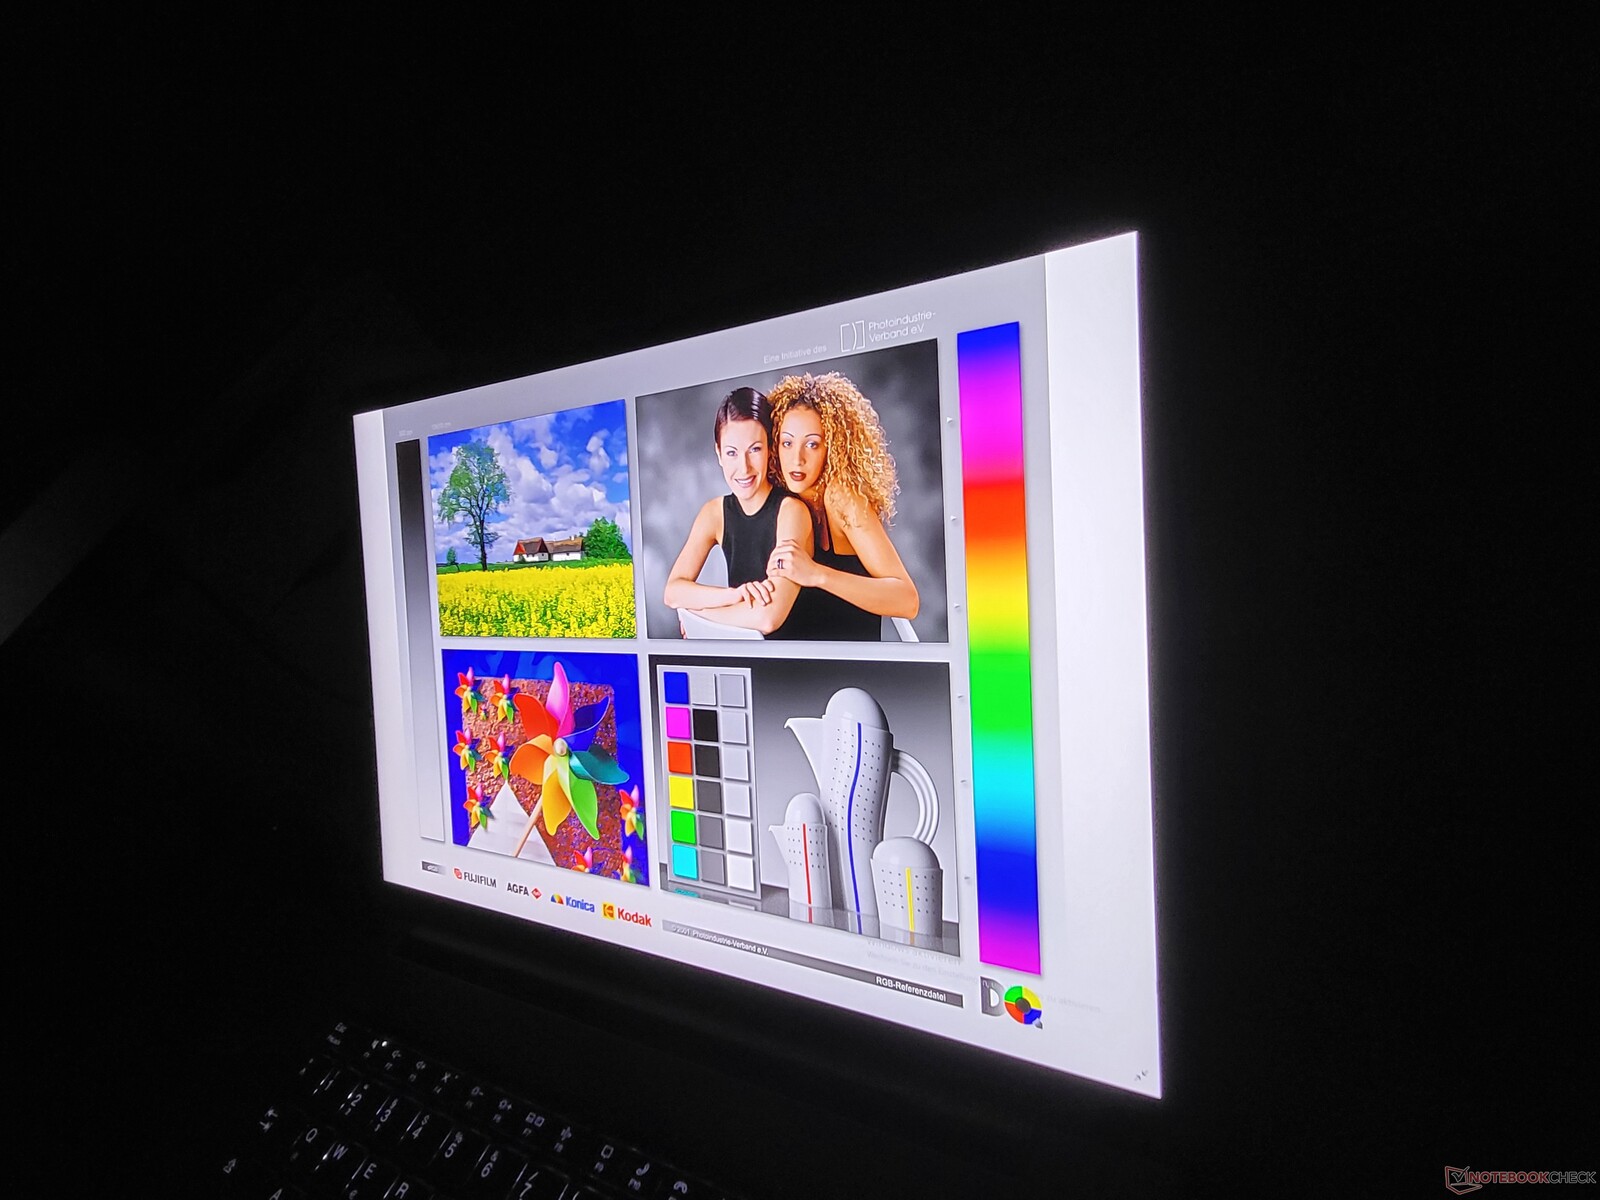
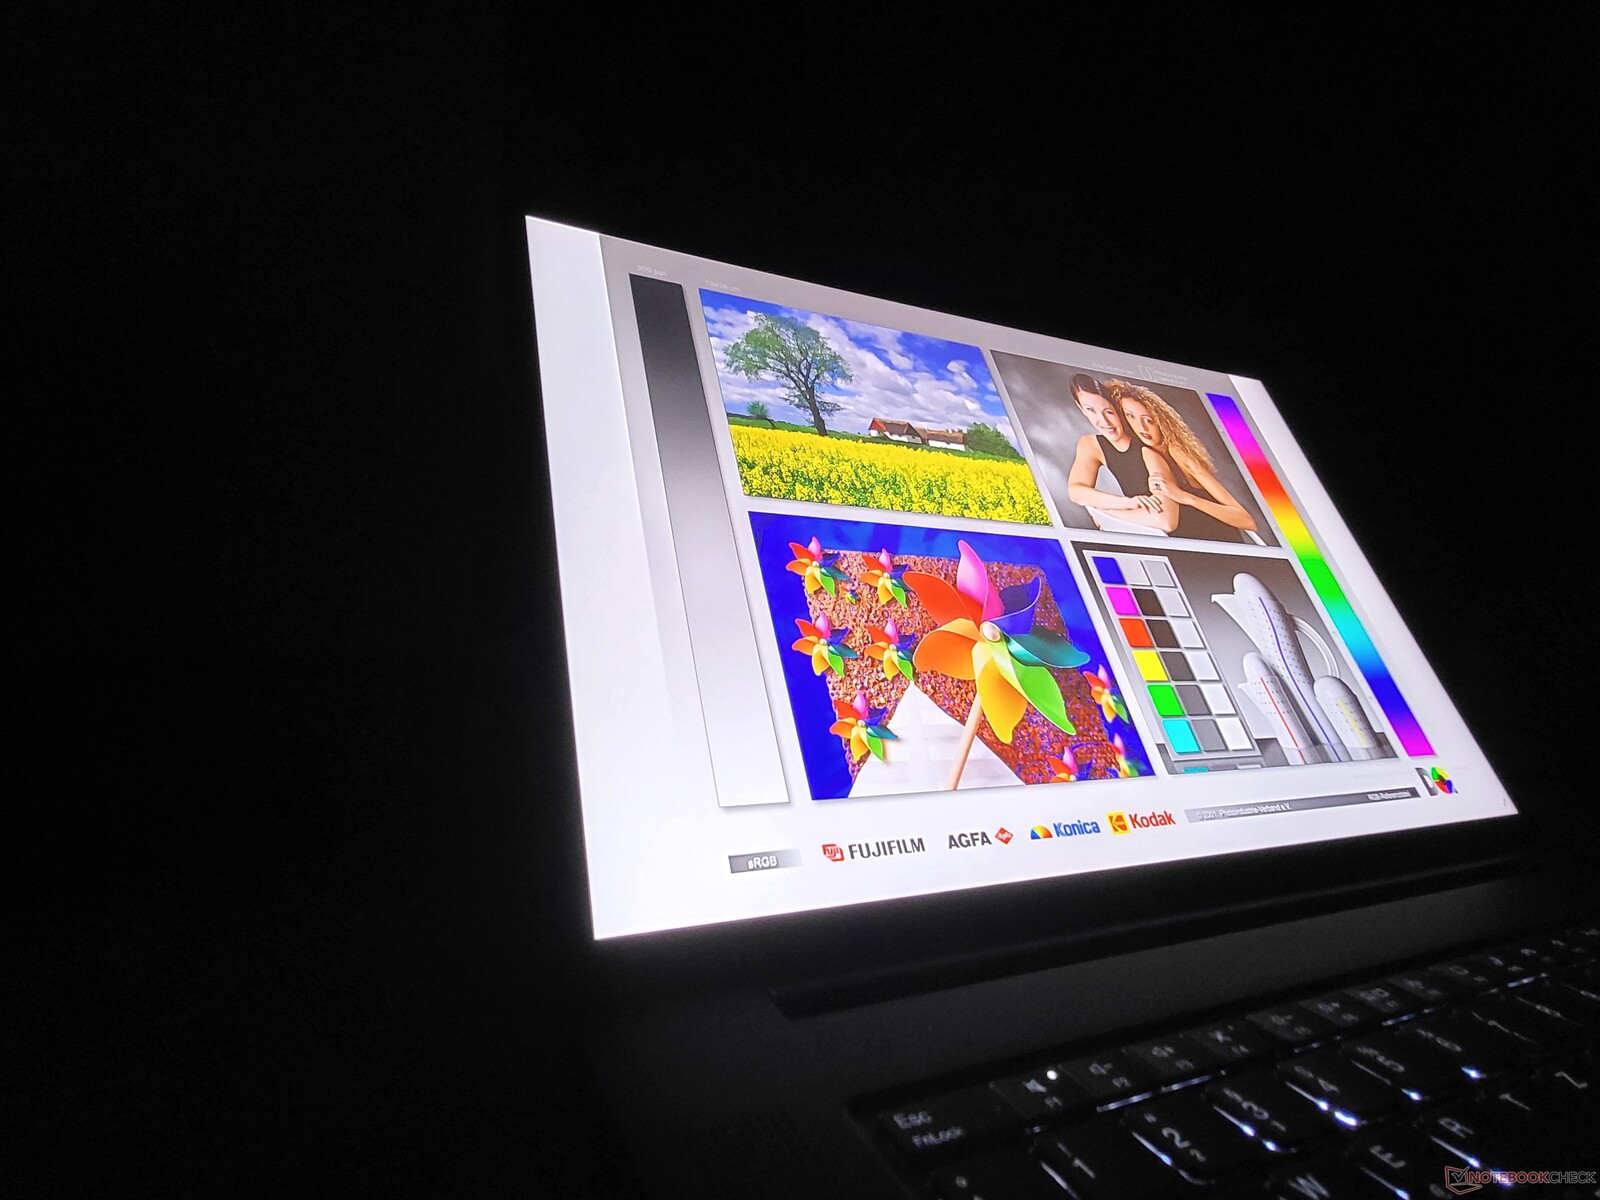
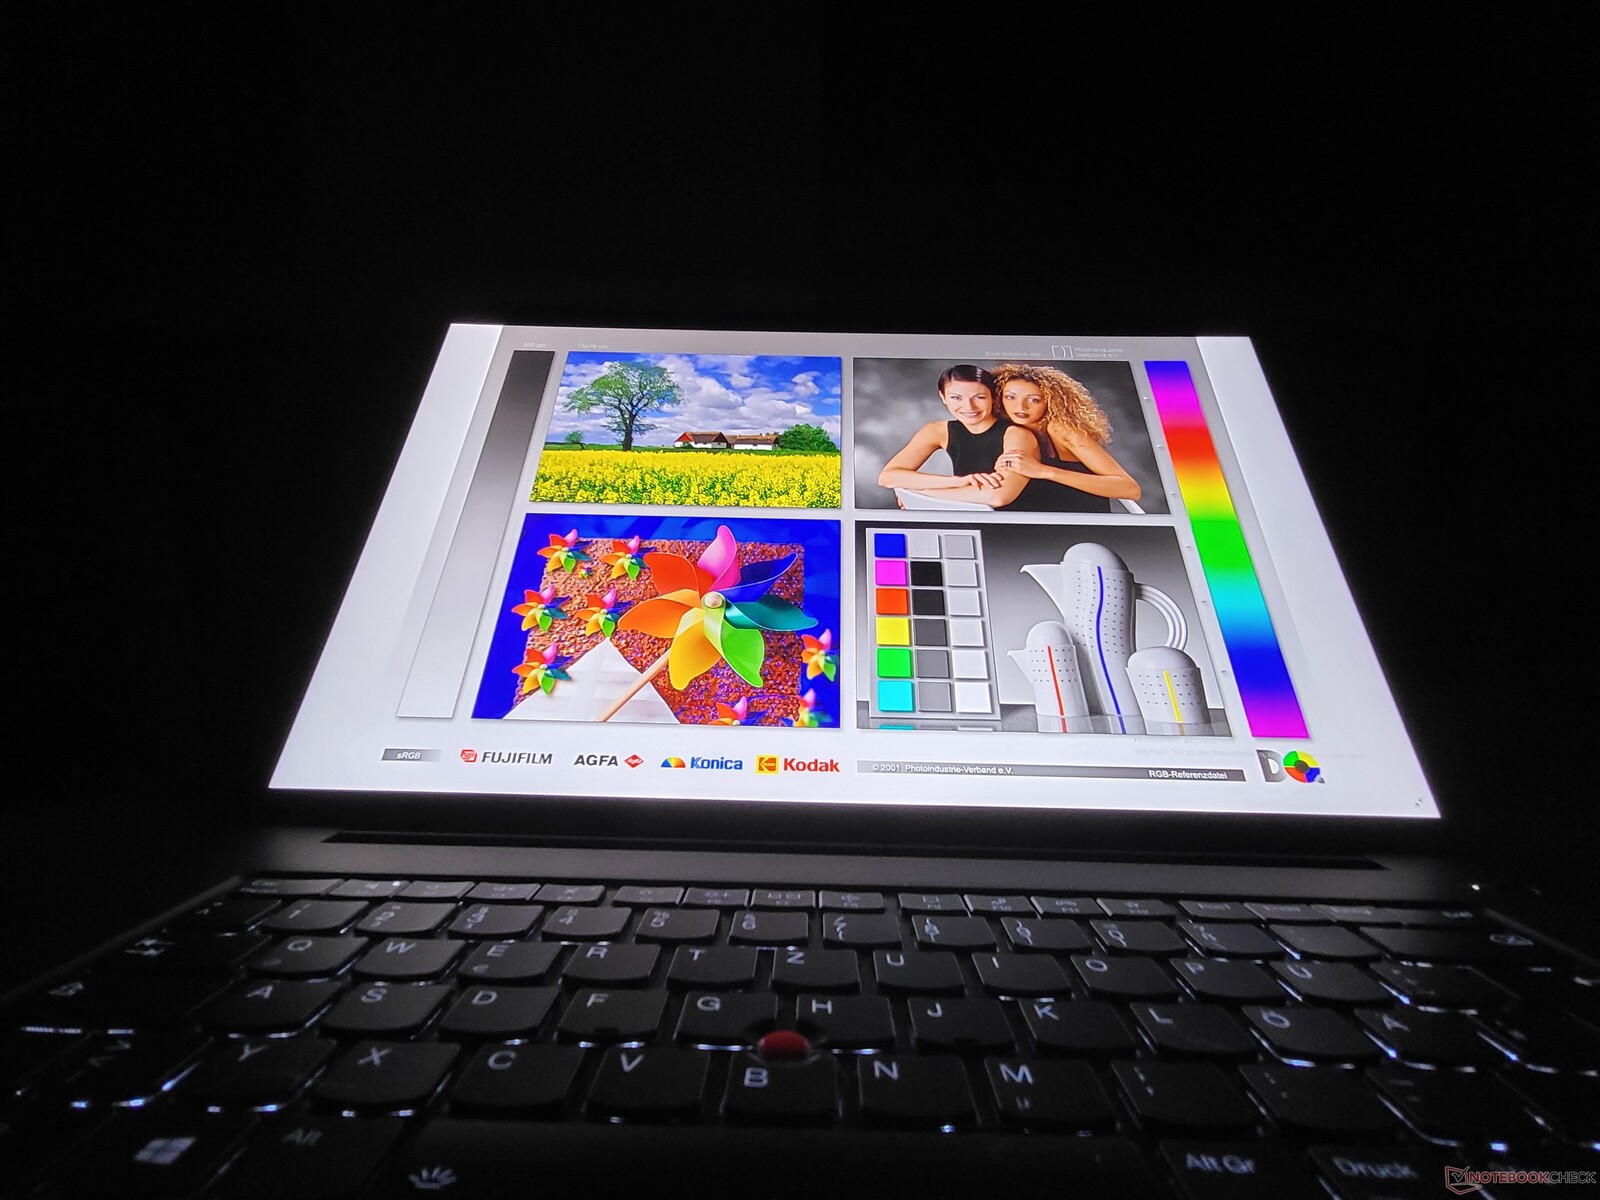
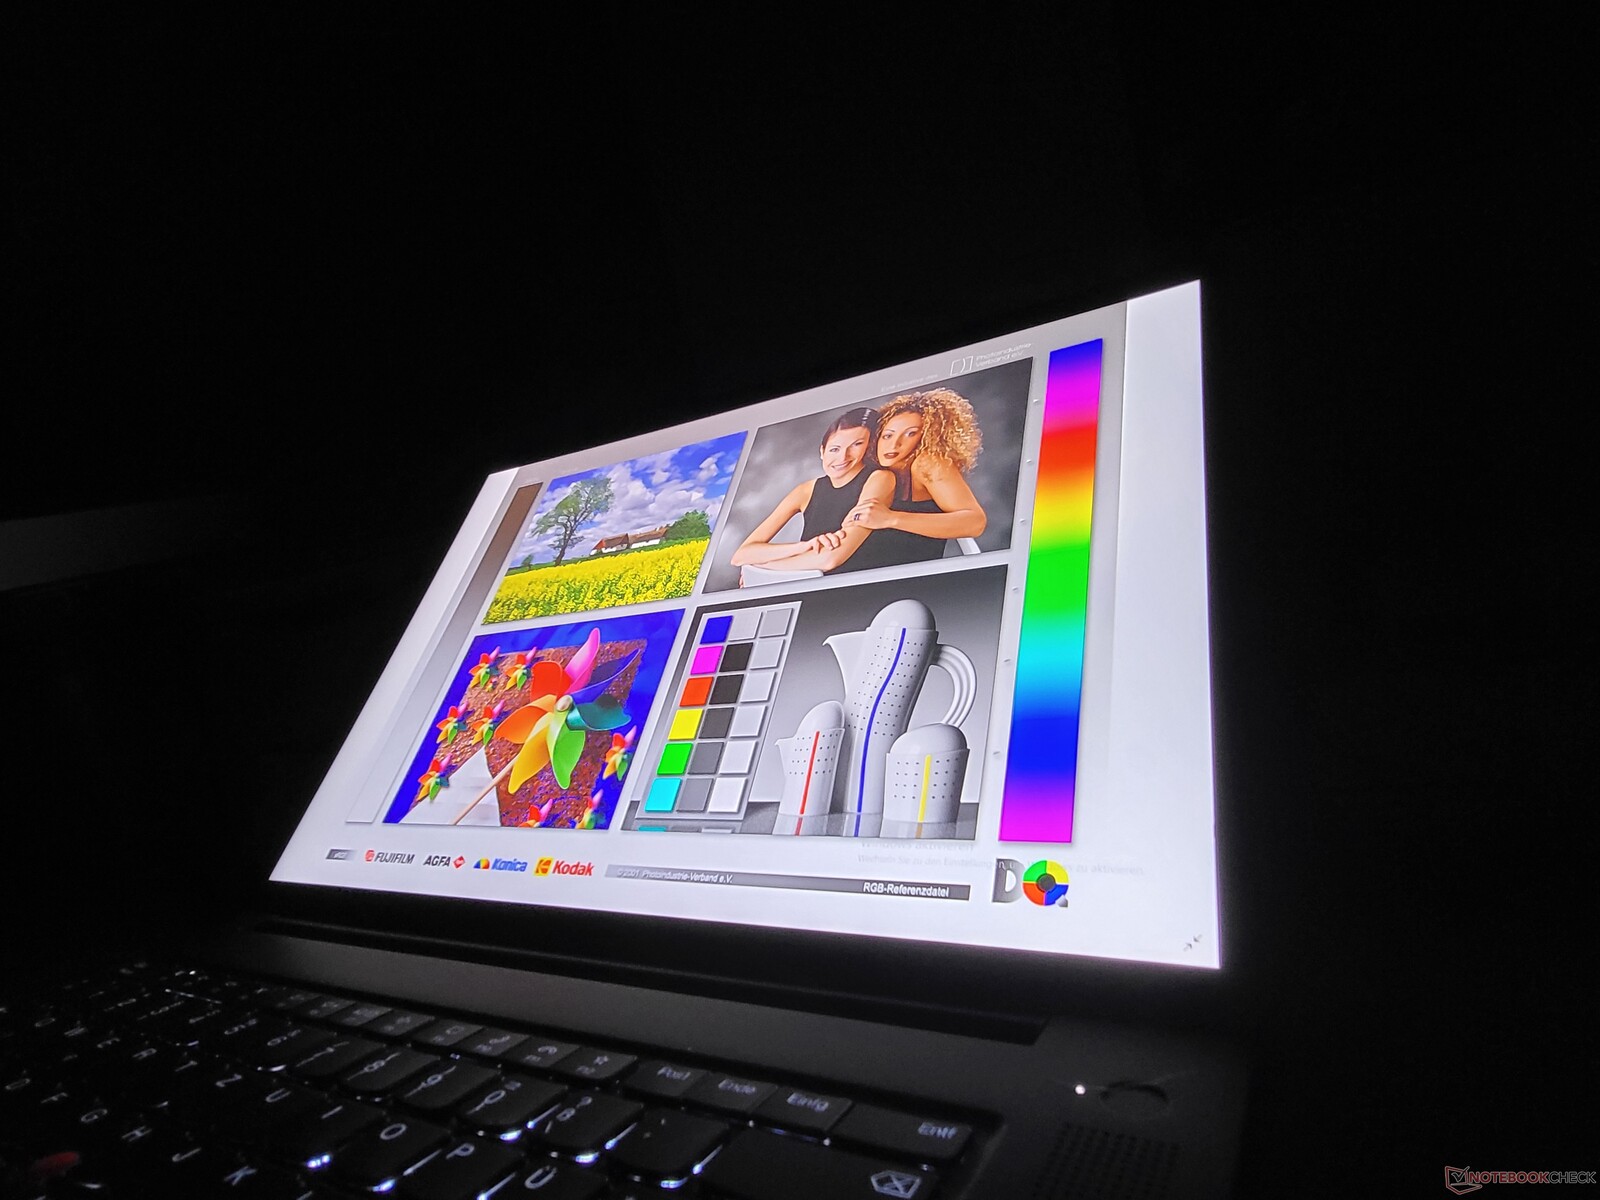
Lenovo ThinkPad P1 G4:s 4K UHD+-skärm med matt yta är utmärkt

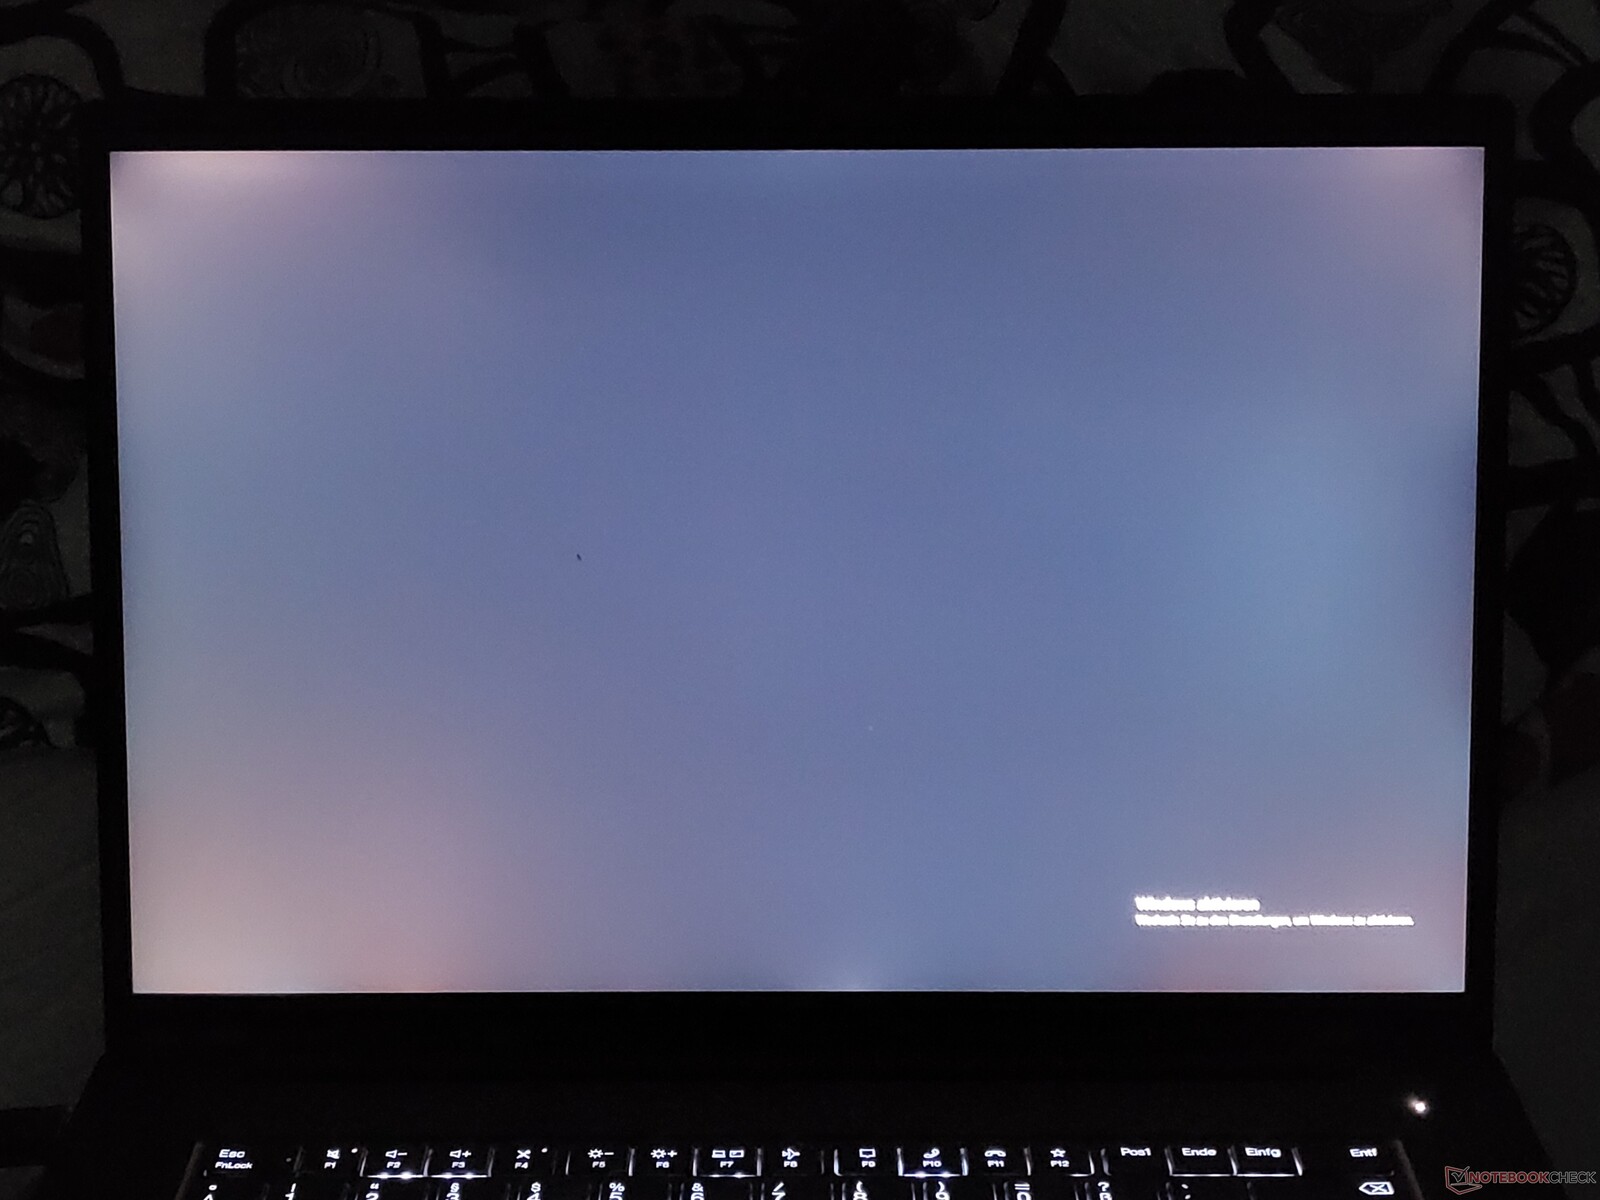
Lenovo ThinkPad P1 Gen 4 finns med tre olika 16-tumsskärmar i 16:10-format. Grundalternativet, en WQXGA LCD-skärm (2 560 x 1 600),har vi redan testat. Vår recensionsenhet innehåller den matta 4K UHD+/WQUXGA-skärmen utan touch - det tredje alternativet är samma skärm, i glansigt utförande, med touch och Wacom-digitizer.
Det ljusstyrka på 600 cd/m² som Lenovo anger överträffas av LG-panelen med ett genomsnitt på 610 cd/m². I testfältet av bärbara datorer i premiumformatet 15-16 tum är skärmen på Lenovos ThinkPad P1 G4 klart ljusstarkast.
Svarstiderna är inte särskilt bra - WQXGA-alternativet är bättre i detta avseende. Skillnaden är särskilt påtaglig jämfört med OLED-skärmen i HP ZBook Studio 15 G8; OLED-varianten av ThinkPad P1 G3 är tyvärr inte längre tillgänglig i ThinkPad P1 2021.
| |||||||||||||||||||||||||
Distribution av ljusstyrkan: 90 %
Mitt på batteriet: 629 cd/m²
Kontrast: 1537:1 (Svärta: 0.41 cd/m²)
ΔE ColorChecker Calman: 2.2 | ∀{0.5-29.43 Ø4.73}
calibrated: 1
ΔE Greyscale Calman: 2.7 | ∀{0.09-98 Ø4.97}
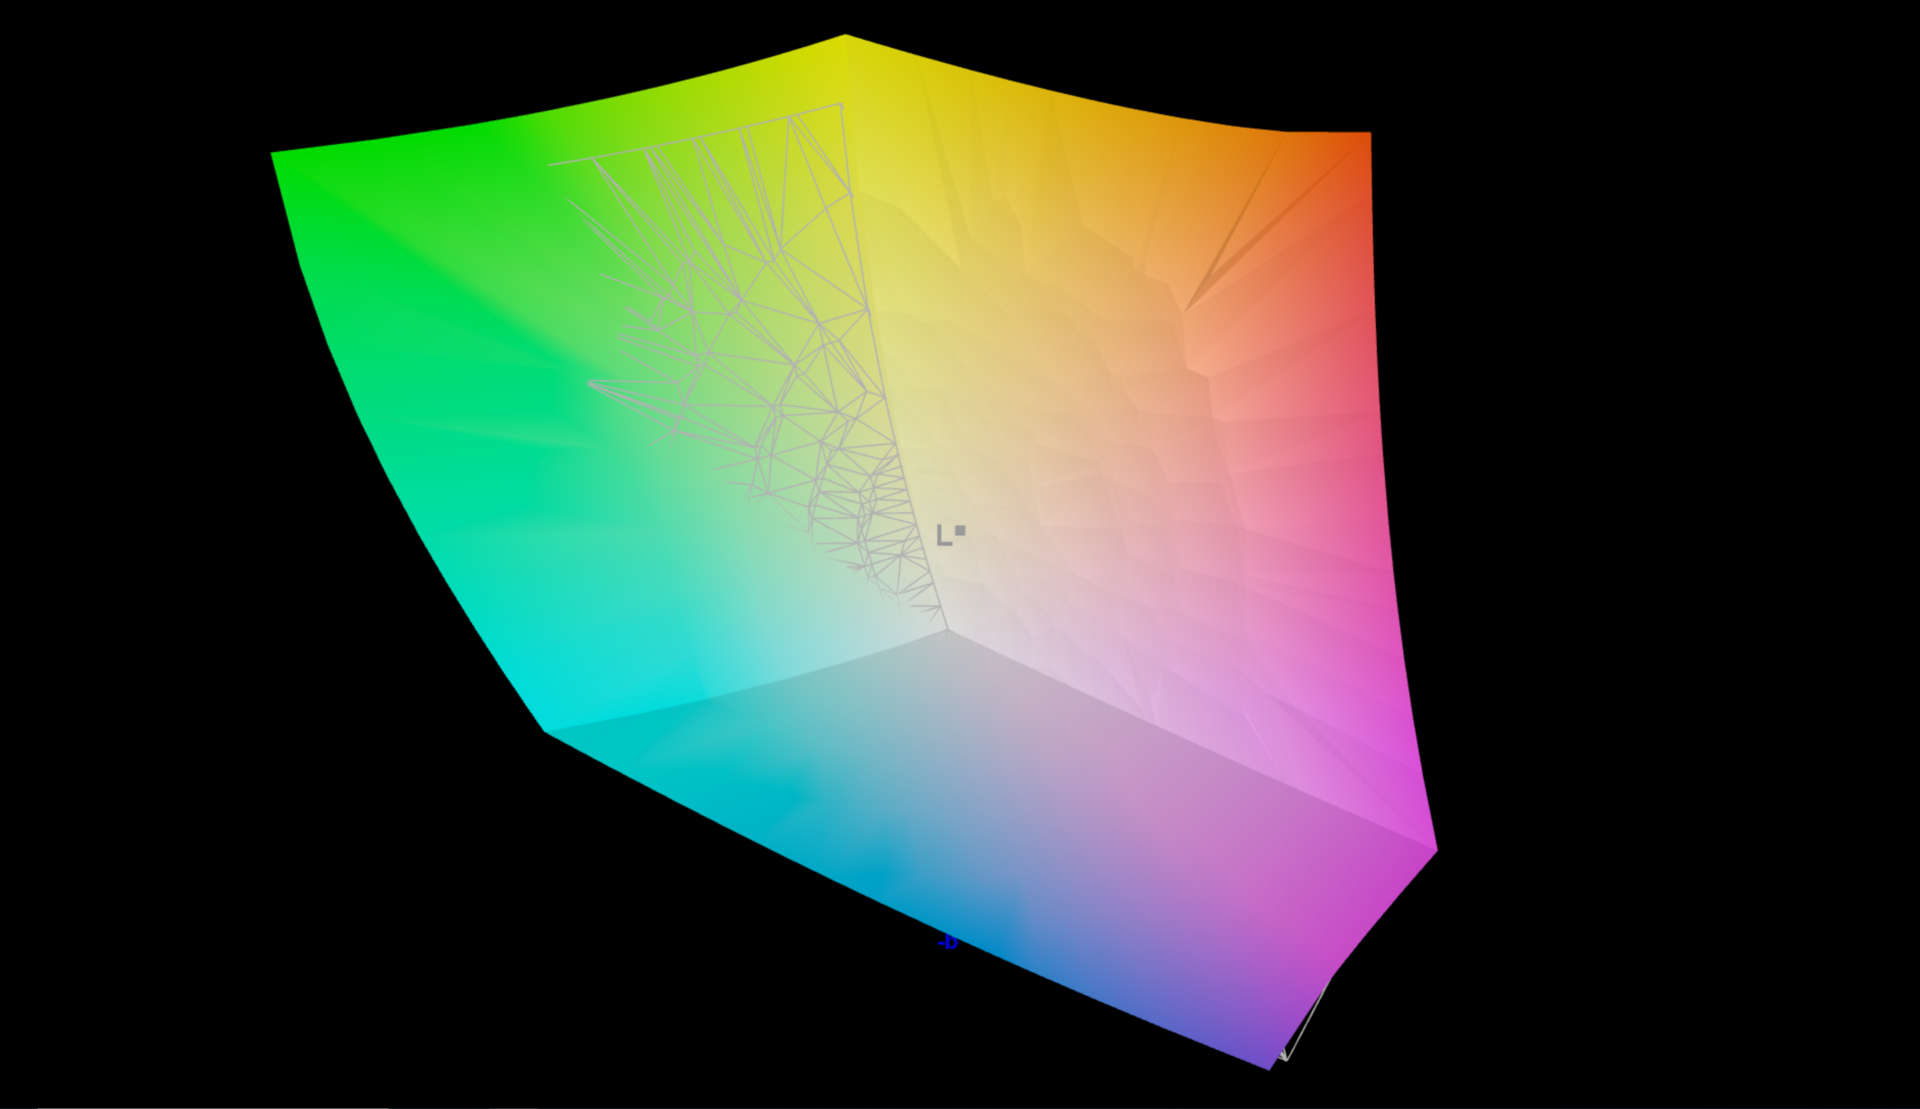
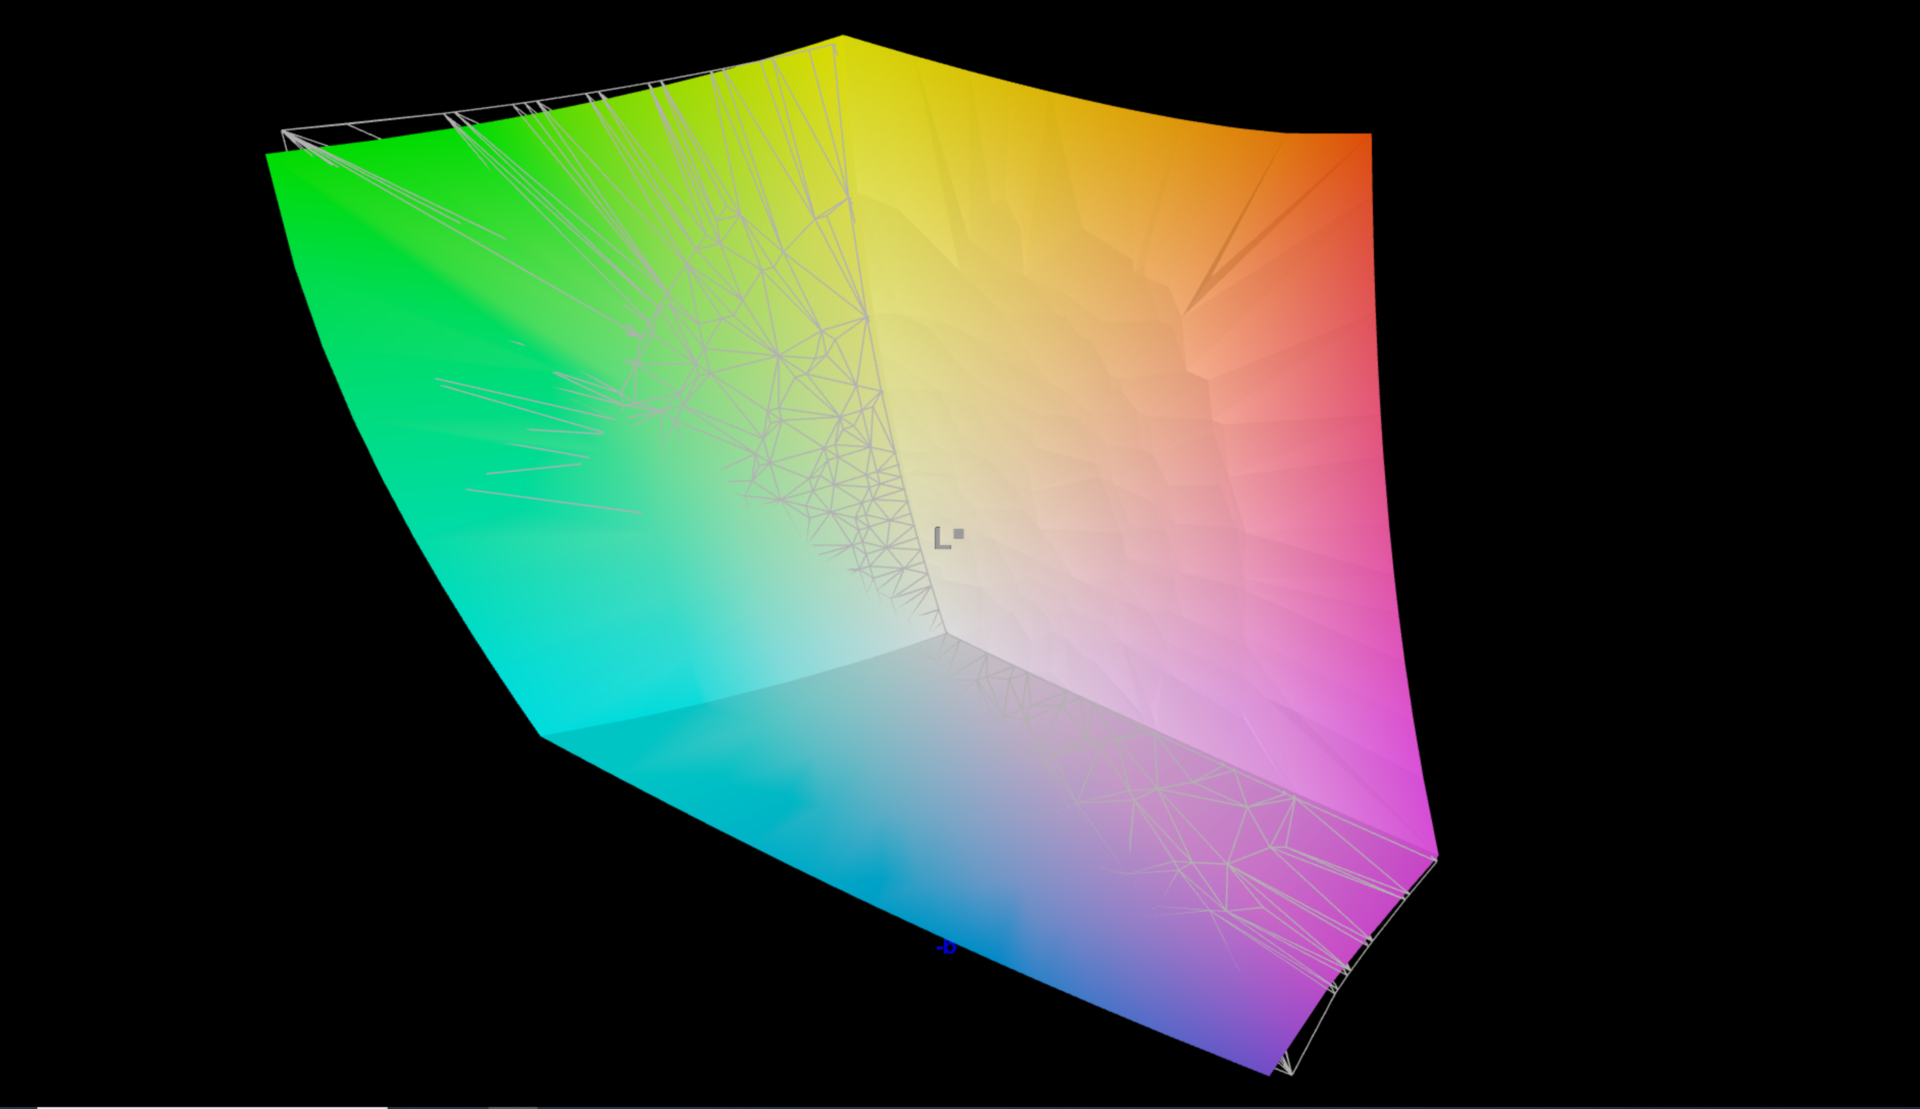
98.9% AdobeRGB 1998 (Argyll 3D)
99.4% sRGB (Argyll 3D)
85.7% Display P3 (Argyll 3D)
Gamma: 2.26
CCT: 6886 K
| Lenovo ThinkPad P1 G4-20Y4S0KS00 LP160UQ1-SPB1, IPS LED, 3840x2400, 16" | Lenovo ThinkPad P1 G4-20Y30017GE B160QAN02.M, IPS, 2560x1600, 16" | Dell Precision 5000 5560 Sharp LQ156R1, IPS, 3840x2400, 15.6" | Apple MacBook Pro 16 2019 i9 5500M APPA044, IPS, 3072x1920, 16" | HP ZBook Studio 15 G8 SDC4145, OLED, 3840x2160, 15.6" | Lenovo ThinkPad X1 Extreme Gen3-20TLS0UV00 N156HCE-GN1, IPS, 1920x1080, 15.6" | |
|---|---|---|---|---|---|---|
| Display | -10% | 4% | 5% | -25% | ||
| Display P3 Coverage (%) | 85.7 | 77.3 -10% | 94.9 11% | 99.9 17% | 61 -29% | |
| sRGB Coverage (%) | 99.4 | 99.9 1% | 100 1% | 100 1% | 89.9 -10% | |
| AdobeRGB 1998 Coverage (%) | 98.9 | 78.1 -21% | 100 1% | 95.3 -4% | 62.2 -37% | |
| Response Times | 21% | 9% | -4% | 94% | 34% | |
| Response Time Grey 50% / Grey 80% * (ms) | 55.2 ? | 40.8 ? 26% | 47.2 ? 14% | 52.4 ? 5% | 2.4 ? 96% | 33.6 ? 39% |
| Response Time Black / White * (ms) | 31.2 ? | 26.4 ? 15% | 30.4 ? 3% | 34.9 ? -12% | 2.4 ? 92% | 22.4 ? 28% |
| PWM Frequency (Hz) | 131700 | 240.4 ? | 26040 ? | |||
| Screen | -17% | -28% | -1% | -67% | -6% | |
| Brightness middle (cd/m²) | 630 | 420 -33% | 501.5 -20% | 519 -18% | 379.6 -40% | 518 -18% |
| Brightness (cd/m²) | 622 | 401 -36% | 467 -25% | 477 -23% | 380 -39% | 513 -18% |
| Brightness Distribution (%) | 90 | 90 0% | 83 -8% | 86 -4% | 95 6% | 88 -2% |
| Black Level * (cd/m²) | 0.41 | 0.3 27% | 0.44 -7% | 0.39 5% | 0.38 7% | |
| Contrast (:1) | 1537 | 1400 -9% | 1140 -26% | 1331 -13% | 1363 -11% | |
| Colorchecker dE 2000 * | 2.2 | 2.5 -14% | 4.73 -115% | 2.28 -4% | 5.15 -134% | 2.1 5% |
| Colorchecker dE 2000 max. * | 5 | 4.9 2% | 8.45 -69% | 6.54 -31% | 7.79 -56% | 4.5 10% |
| Colorchecker dE 2000 calibrated * | 1 | 1.6 -60% | 0.51 49% | 0.86 14% | 3.1 -210% | 1.3 -30% |
| Greyscale dE 2000 * | 2.7 | 3.4 -26% | 3.6 -33% | 0.9 67% | 2.6 4% | 2.7 -0% |
| Gamma | 2.26 97% | 2.24 98% | 2.08 106% | 2145 0% | 1.99 111% | 2.35 94% |
| CCT | 6886 94% | 6479 100% | 6447 101% | 6572 99% | 6166 105% | 7042 92% |
| Color Space (Percent of AdobeRGB 1998) (%) | 78 | 57.7 | ||||
| Color Space (Percent of sRGB) (%) | 90.4 | |||||
| Totalt genomsnitt (program/inställningar) | -2% /
-10% | -5% /
-16% | -3% /
-1% | 11% /
-22% | 1% /
-5% |
* ... mindre är bättre
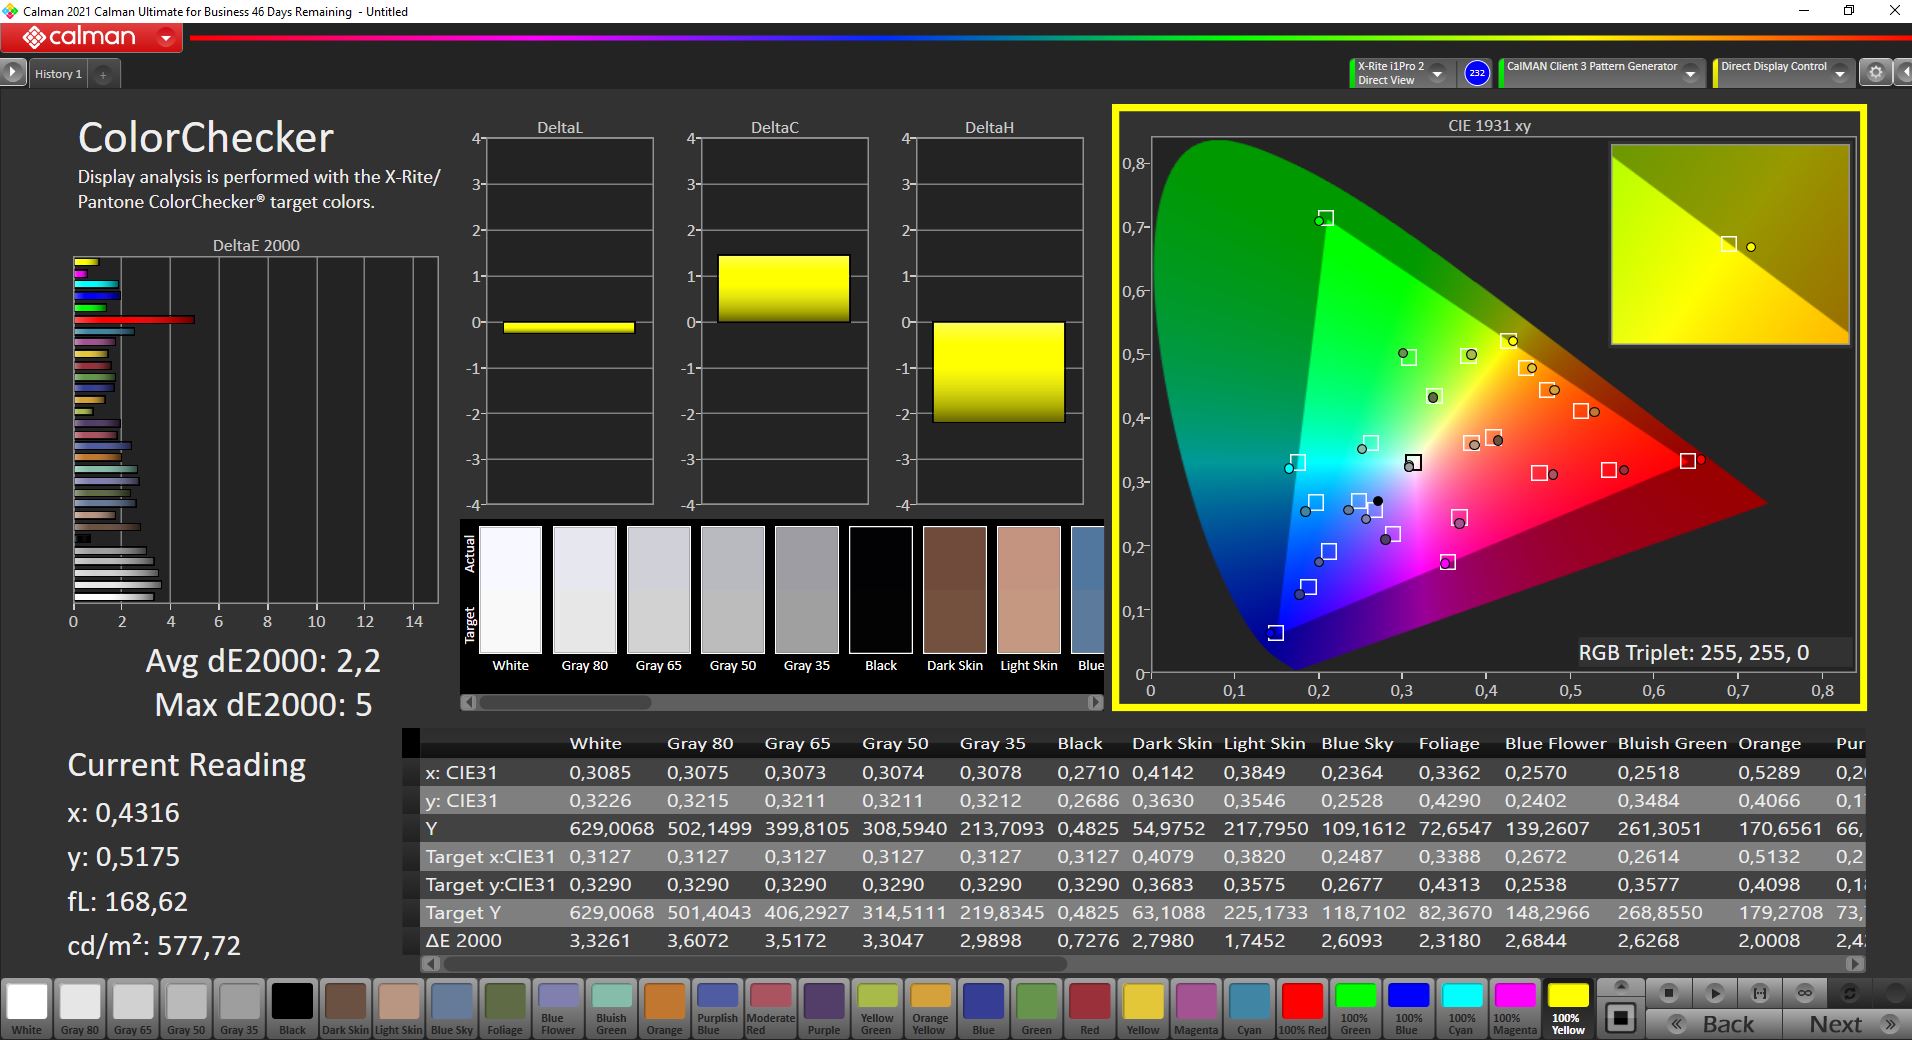
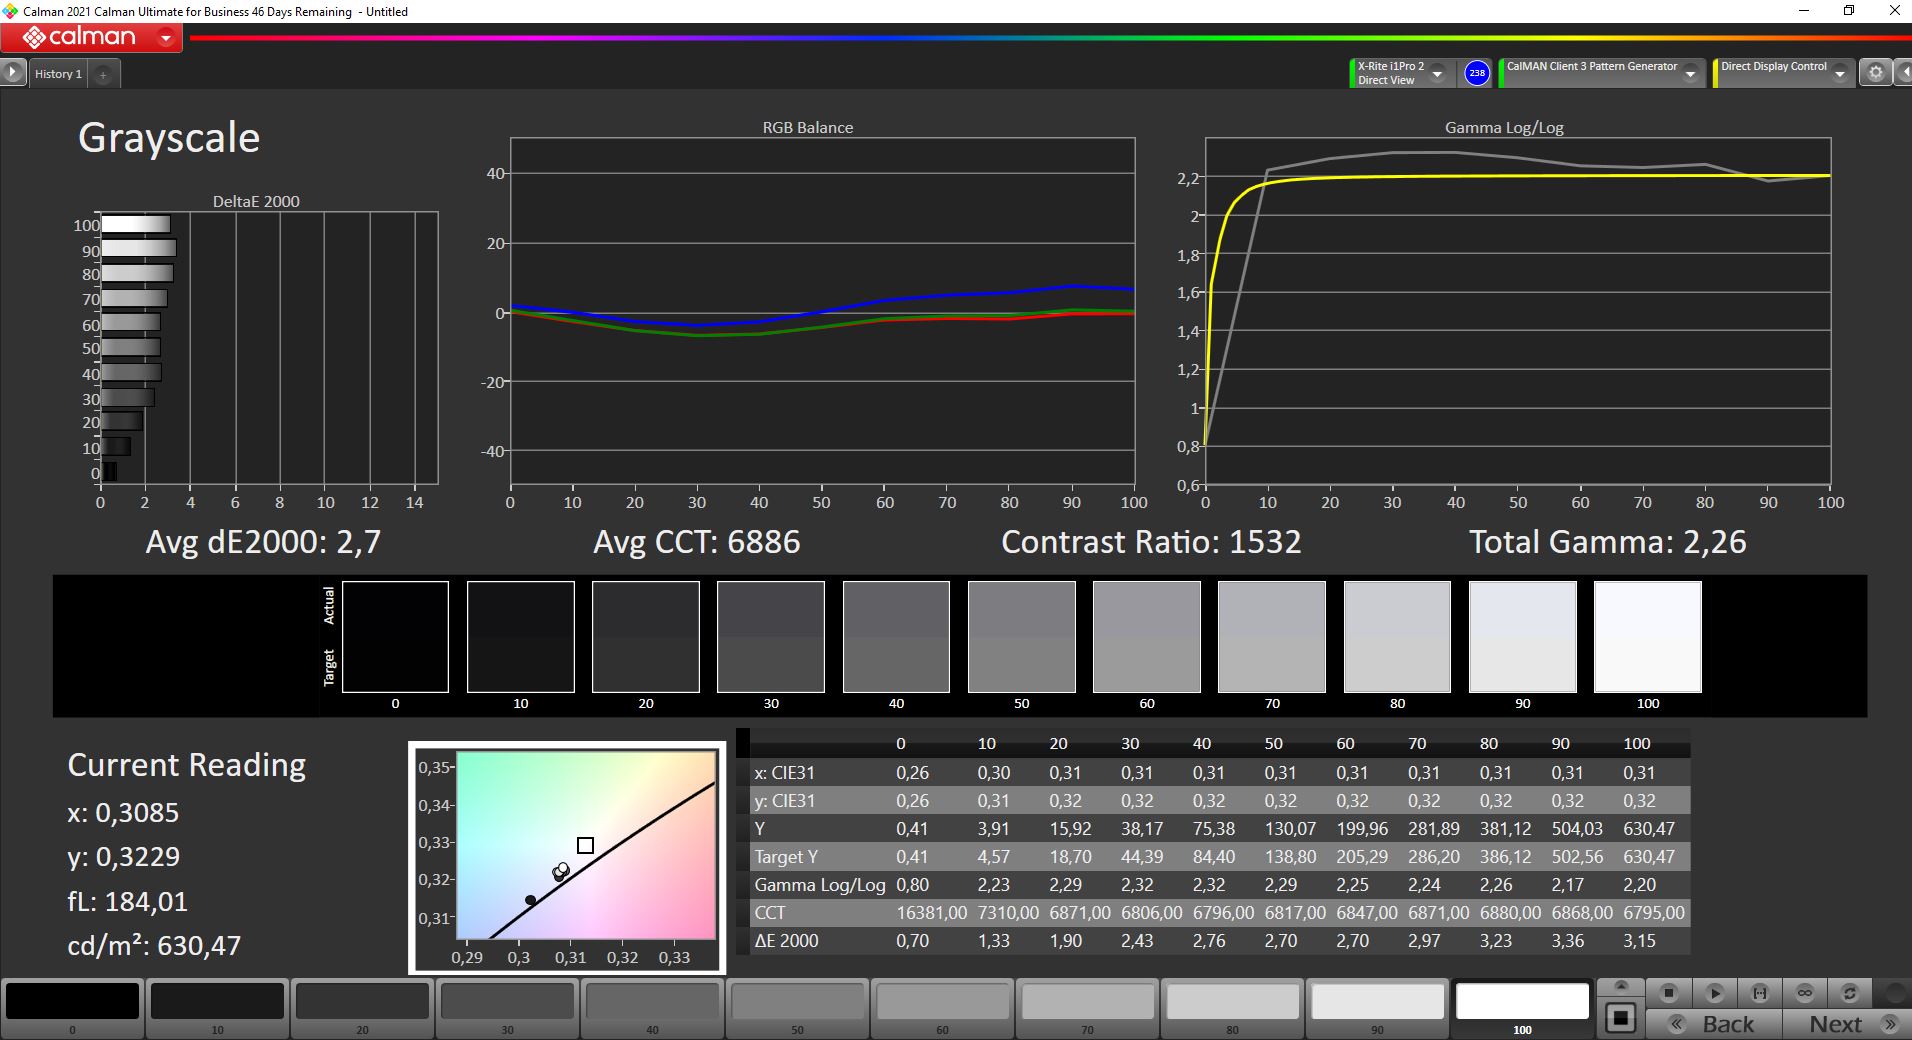

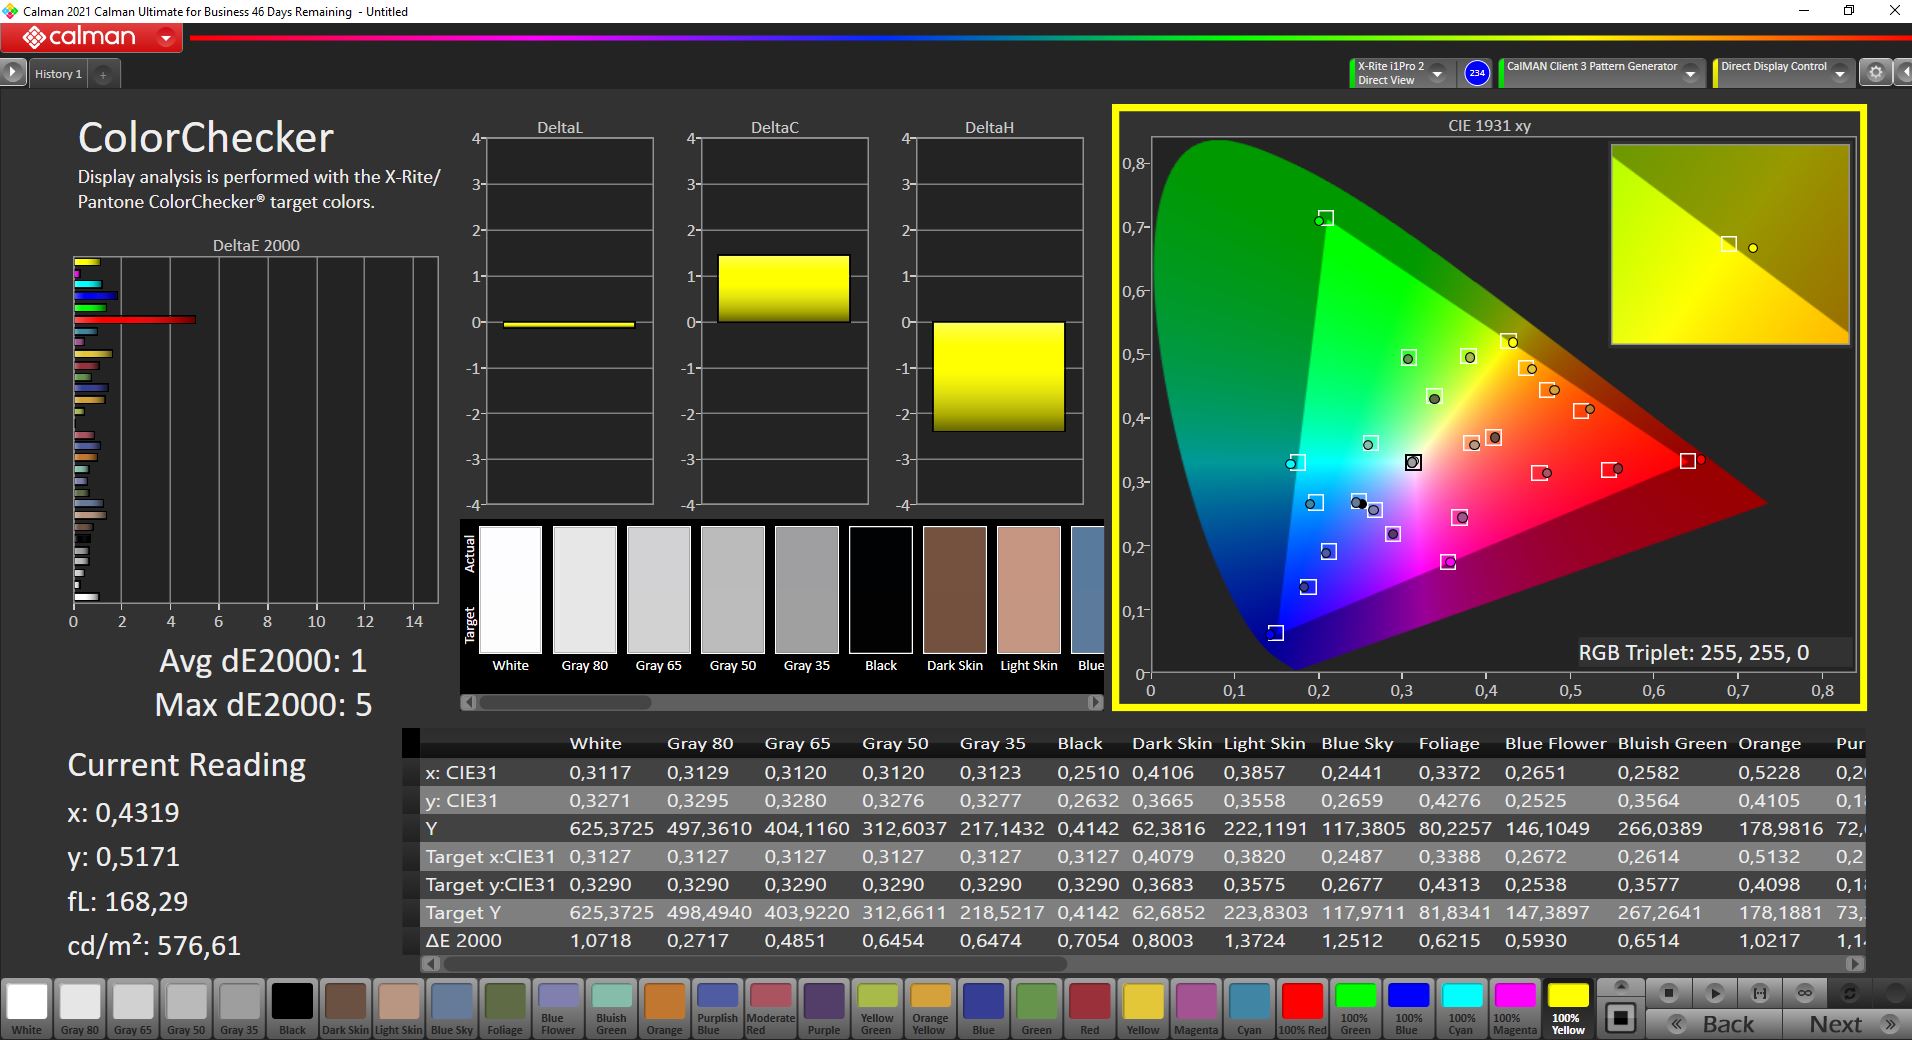
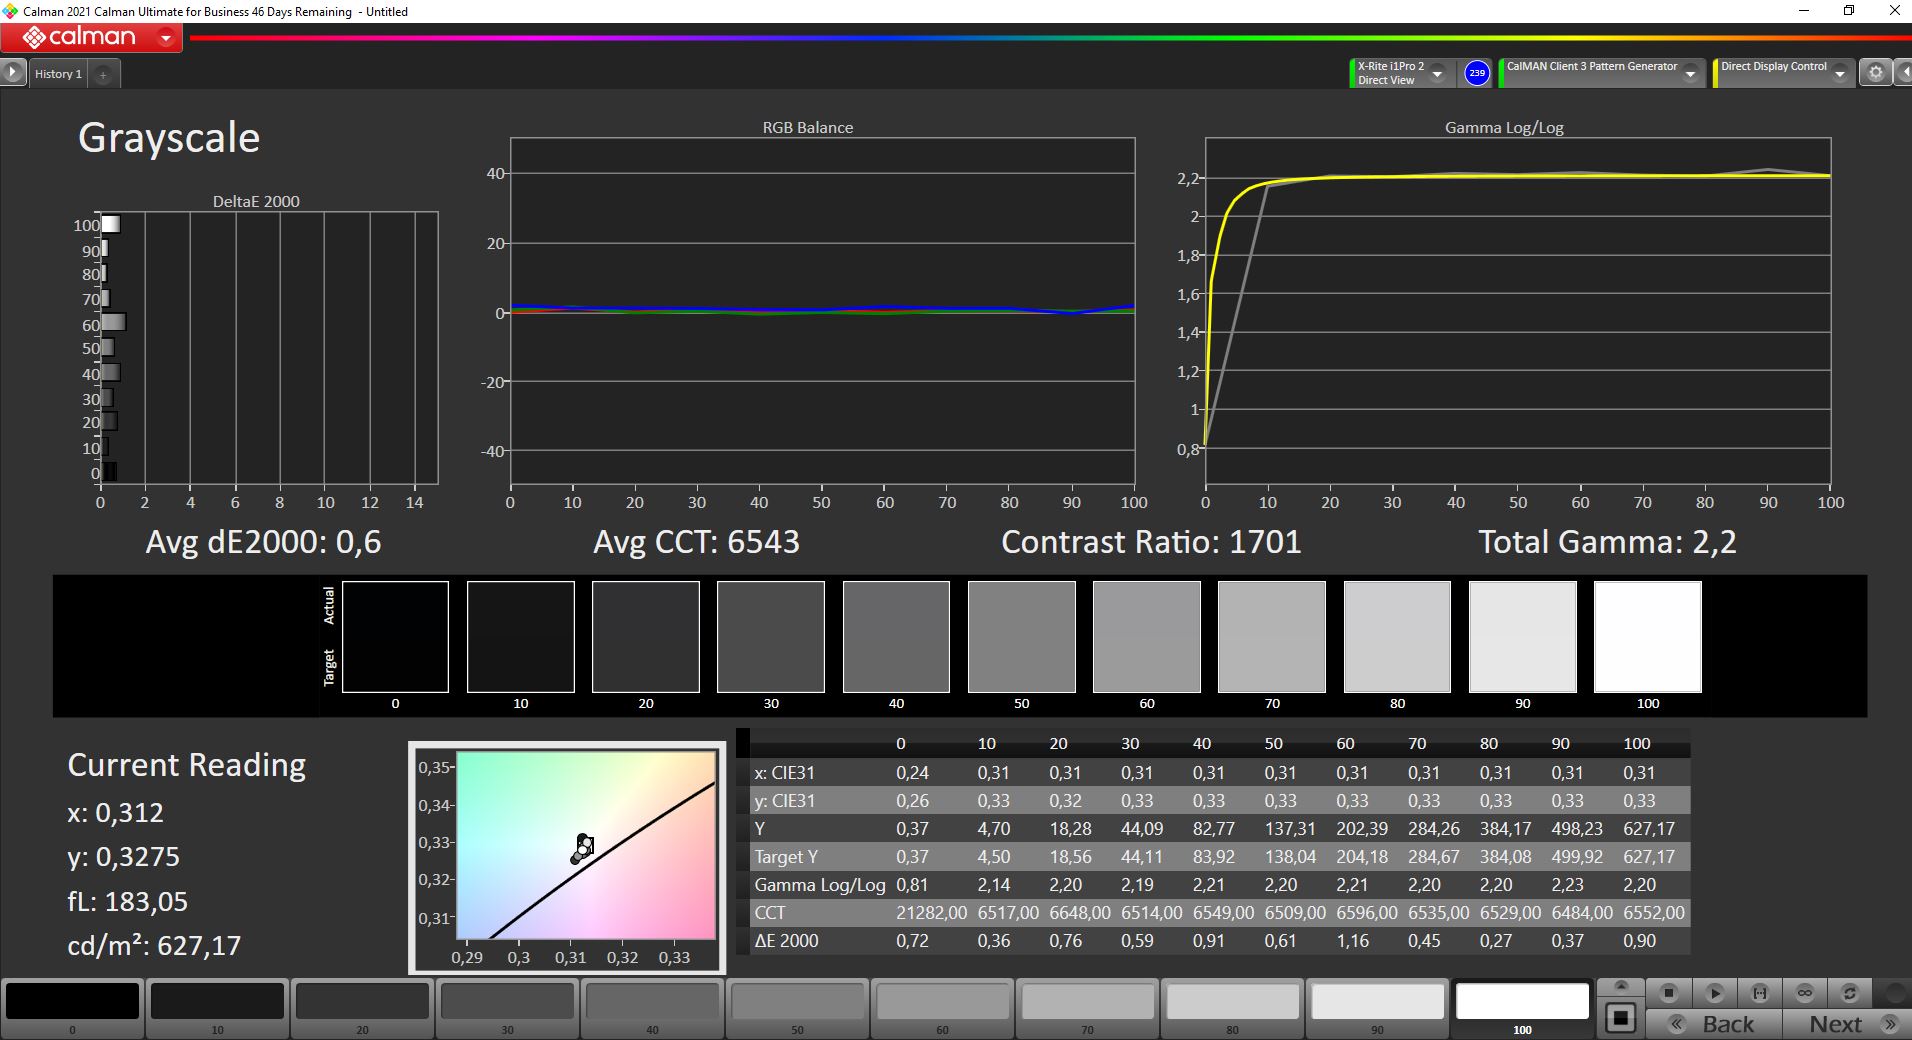
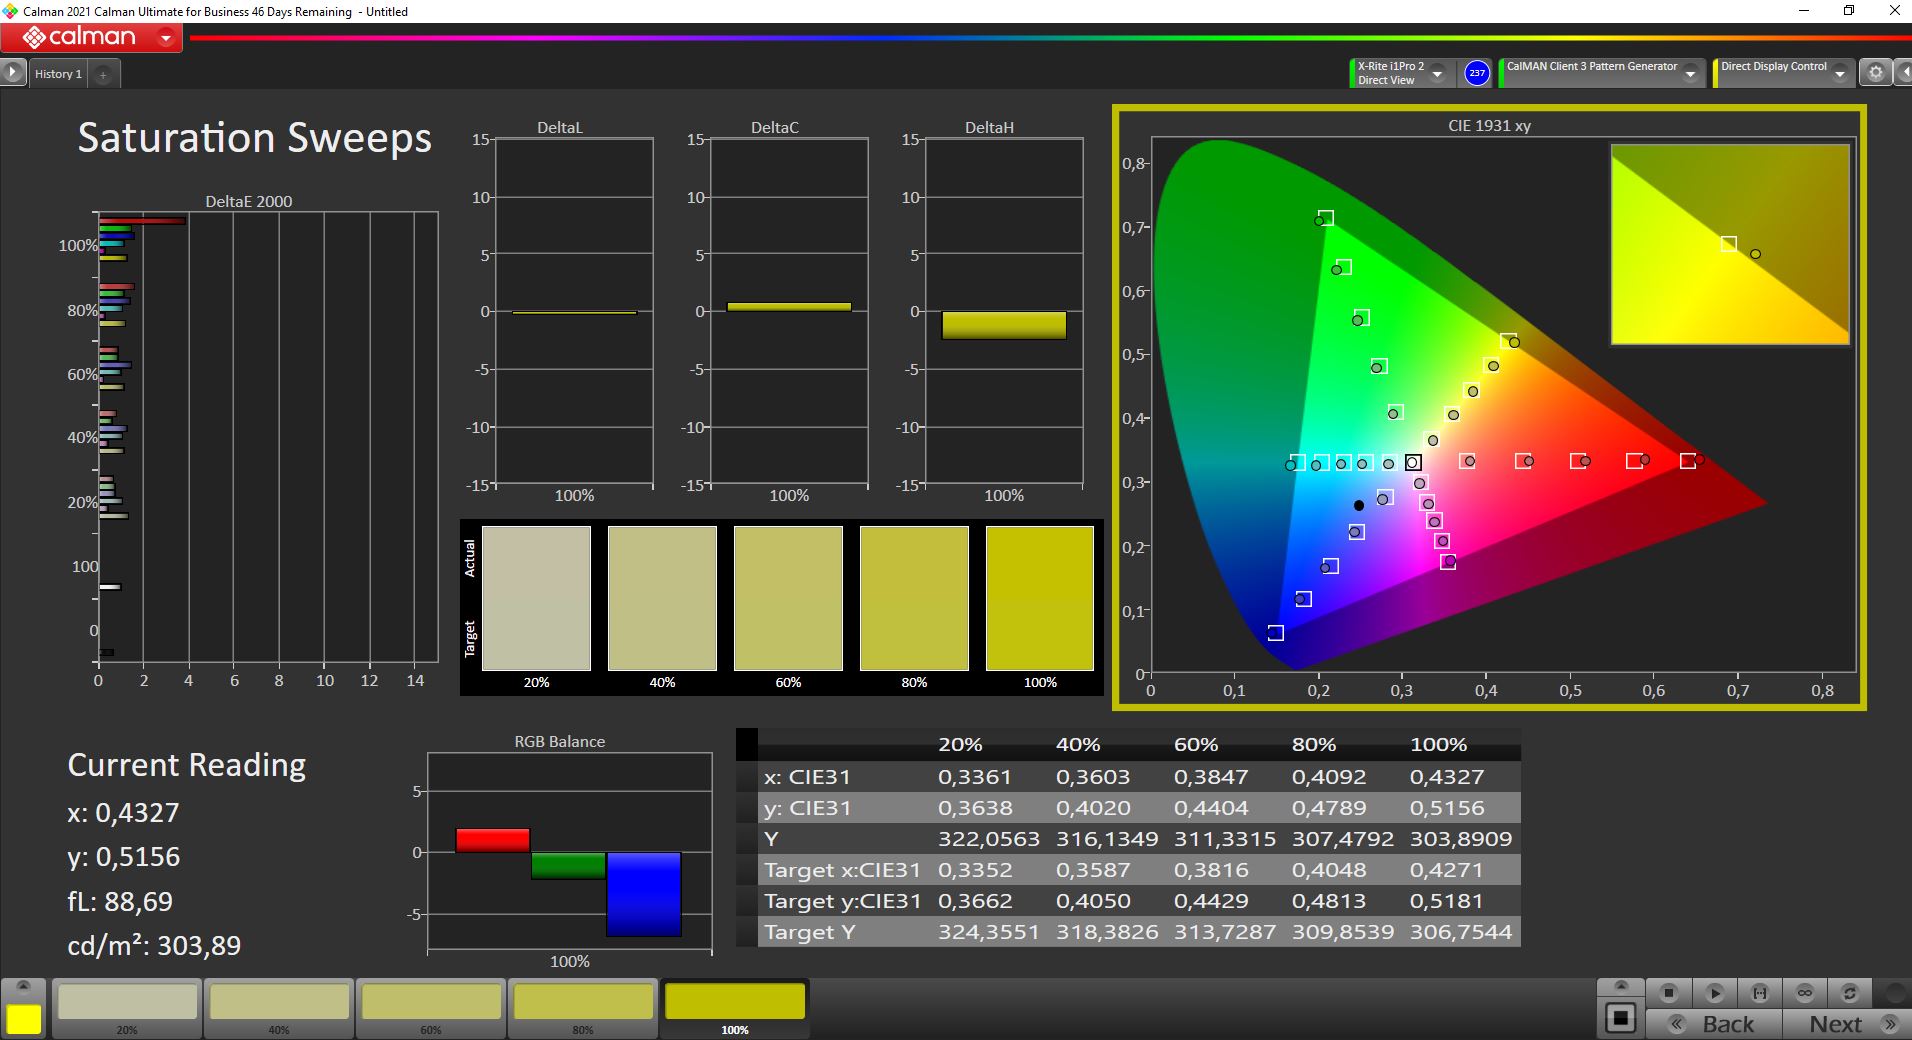
Lenovo annonserar WQUXGA-skärmen som installeras här med en fabrikskalibrering. Faktum är att vi mäter ganska bra värden fritt fabrik med Calman och X-Rite i1Pro 2. Ett DeltaE-värde på 2,2 för färgvärdena innebär att avvikelserna är små. Det fanns dock fortfarande utrymme för förbättringar. Efter kalibrering med X-Rite i1Profiler sjönk DeltaE-värdet till 1,0. Som alltid tillhandahåller vi motsvarande färgprofil för gratis nedladdning.
Svartvärdet på 0,41 cd/m² är inte särskilt enastående för en IPS LED-skärm, men den höga ljusstyrkan garanterar ändå en bra kontrast på 1537:1. Tillsammans med den höga färgrymdstäckningen på 98,9 % av det breda AdobeRGB-färgrymden (Lenovo annonserar 100 % AdobeRGB) är bildkvaliteten på Lenovo ThinkPad P1 Gen 4 utmärkt, och 8-bitarspanelen är väl lämpad för bildredigering
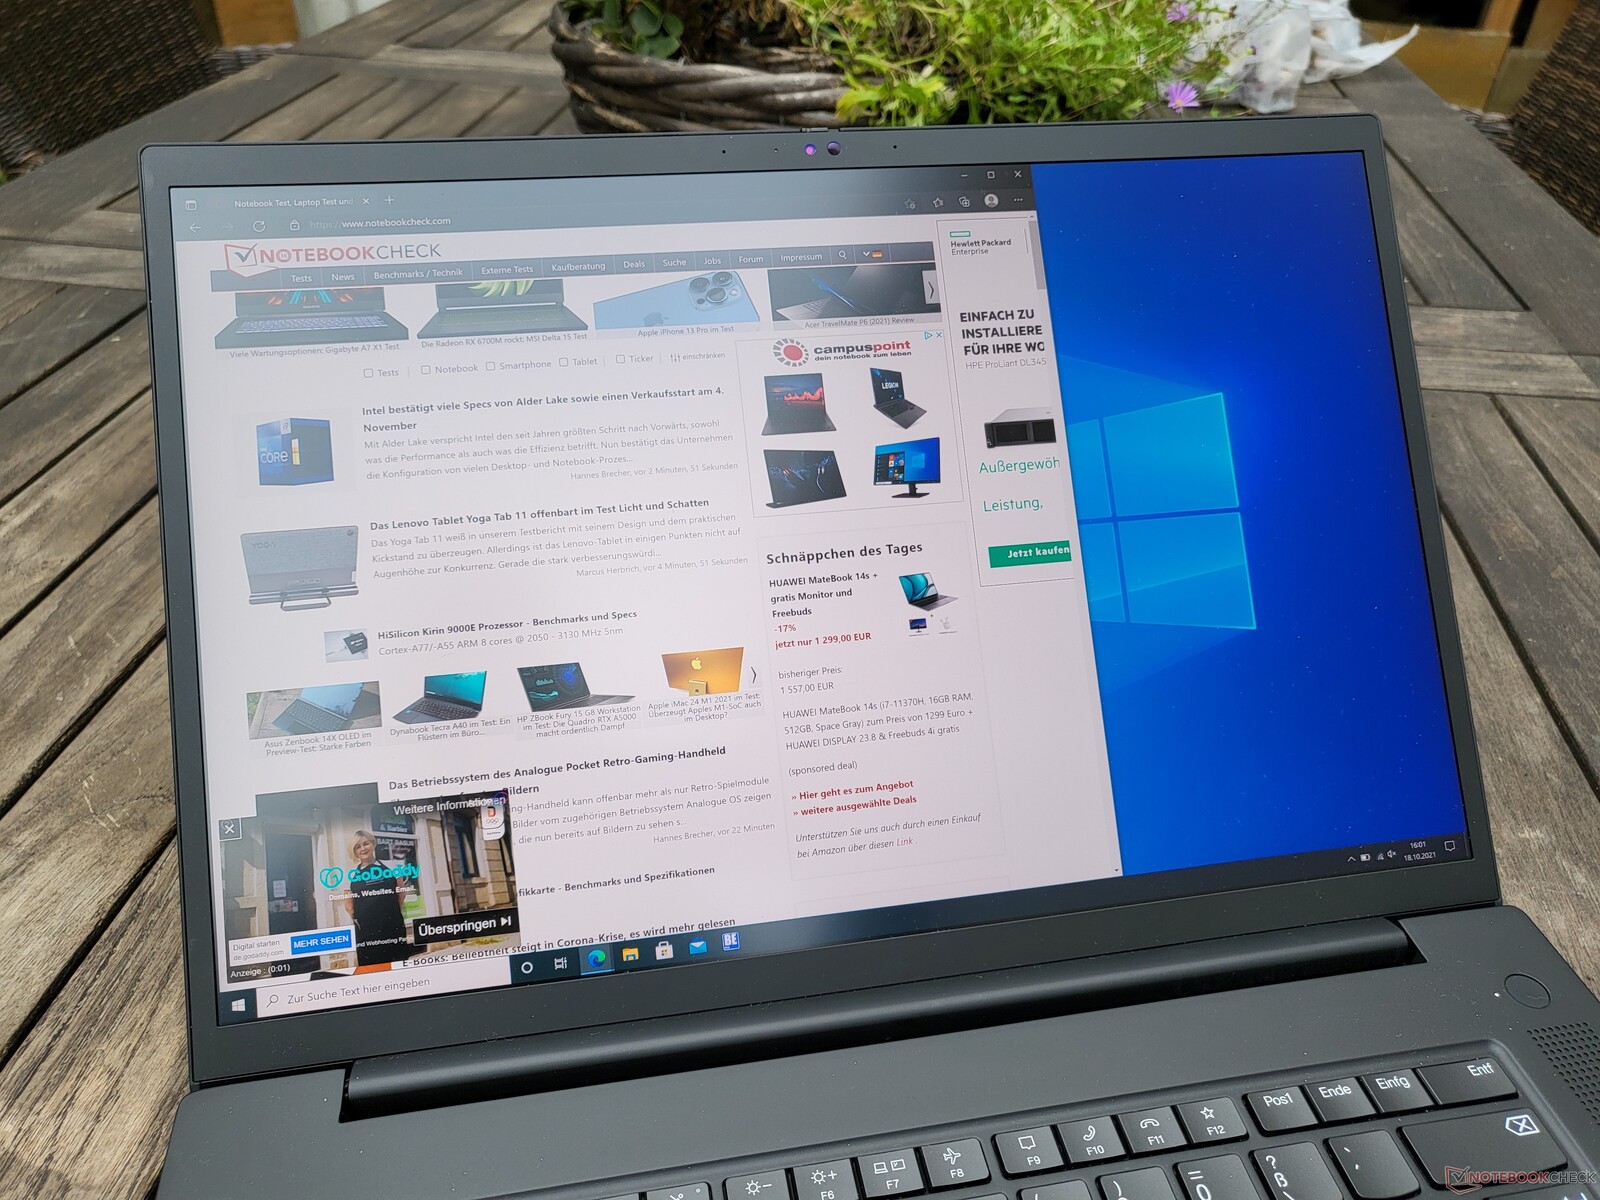
Lenovo ThinkPad P1 2021 klarar lätt av att användas utomhus. Den matta ytan hjälper den ljusstarka 4K UHD+-skärmen att enkelt överglänsa dagsljuset på molniga dagar. Direkt solljus kan dock fortfarande vara en utmaning även vid 600 cd/m²
Visa svarstider
| ↔ Svarstid svart till vitt | ||
|---|---|---|
| 31.2 ms ... stiga ↗ och falla ↘ kombinerat | ↗ 16.4 ms stiga | 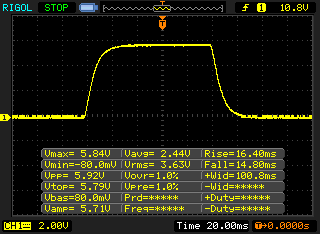 |
| ↘ 14.8 ms hösten | ||
| Skärmen visar långsamma svarsfrekvenser i våra tester och kommer att vara otillfredsställande för spelare. I jämförelse sträcker sig alla testade enheter från 0.1 (minst) till 240 (maximalt) ms. » 84 % av alla enheter är bättre. Detta innebär att den uppmätta svarstiden är sämre än genomsnittet av alla testade enheter (19.9 ms). | ||
| ↔ Svarstid 50 % grått till 80 % grått | ||
| 55.2 ms ... stiga ↗ och falla ↘ kombinerat | ↗ 26.8 ms stiga | 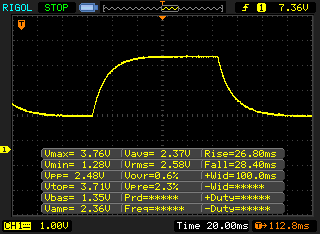 |
| ↘ 28.4 ms hösten | ||
| Skärmen visar långsamma svarsfrekvenser i våra tester och kommer att vara otillfredsställande för spelare. I jämförelse sträcker sig alla testade enheter från 0.165 (minst) till 636 (maximalt) ms. » 92 % av alla enheter är bättre. Detta innebär att den uppmätta svarstiden är sämre än genomsnittet av alla testade enheter (31.1 ms). | ||
Skärmflimmer / PWM (Puls-Width Modulation)
| Skärmflimmer / PWM upptäcktes inte |  | ||
Som jämförelse: 52 % av alla testade enheter använder inte PWM för att dämpa skärmen. Om PWM upptäcktes mättes ett medelvärde av 7798 (minst: 5 - maximum: 343500) Hz. | |||
Kvaliteten på IPS-tekniken återspeglas i den utmärkta stabiliteten i betraktningsvinkeln, som även Lenovos ThinkPad P1 2021 har utan fel.
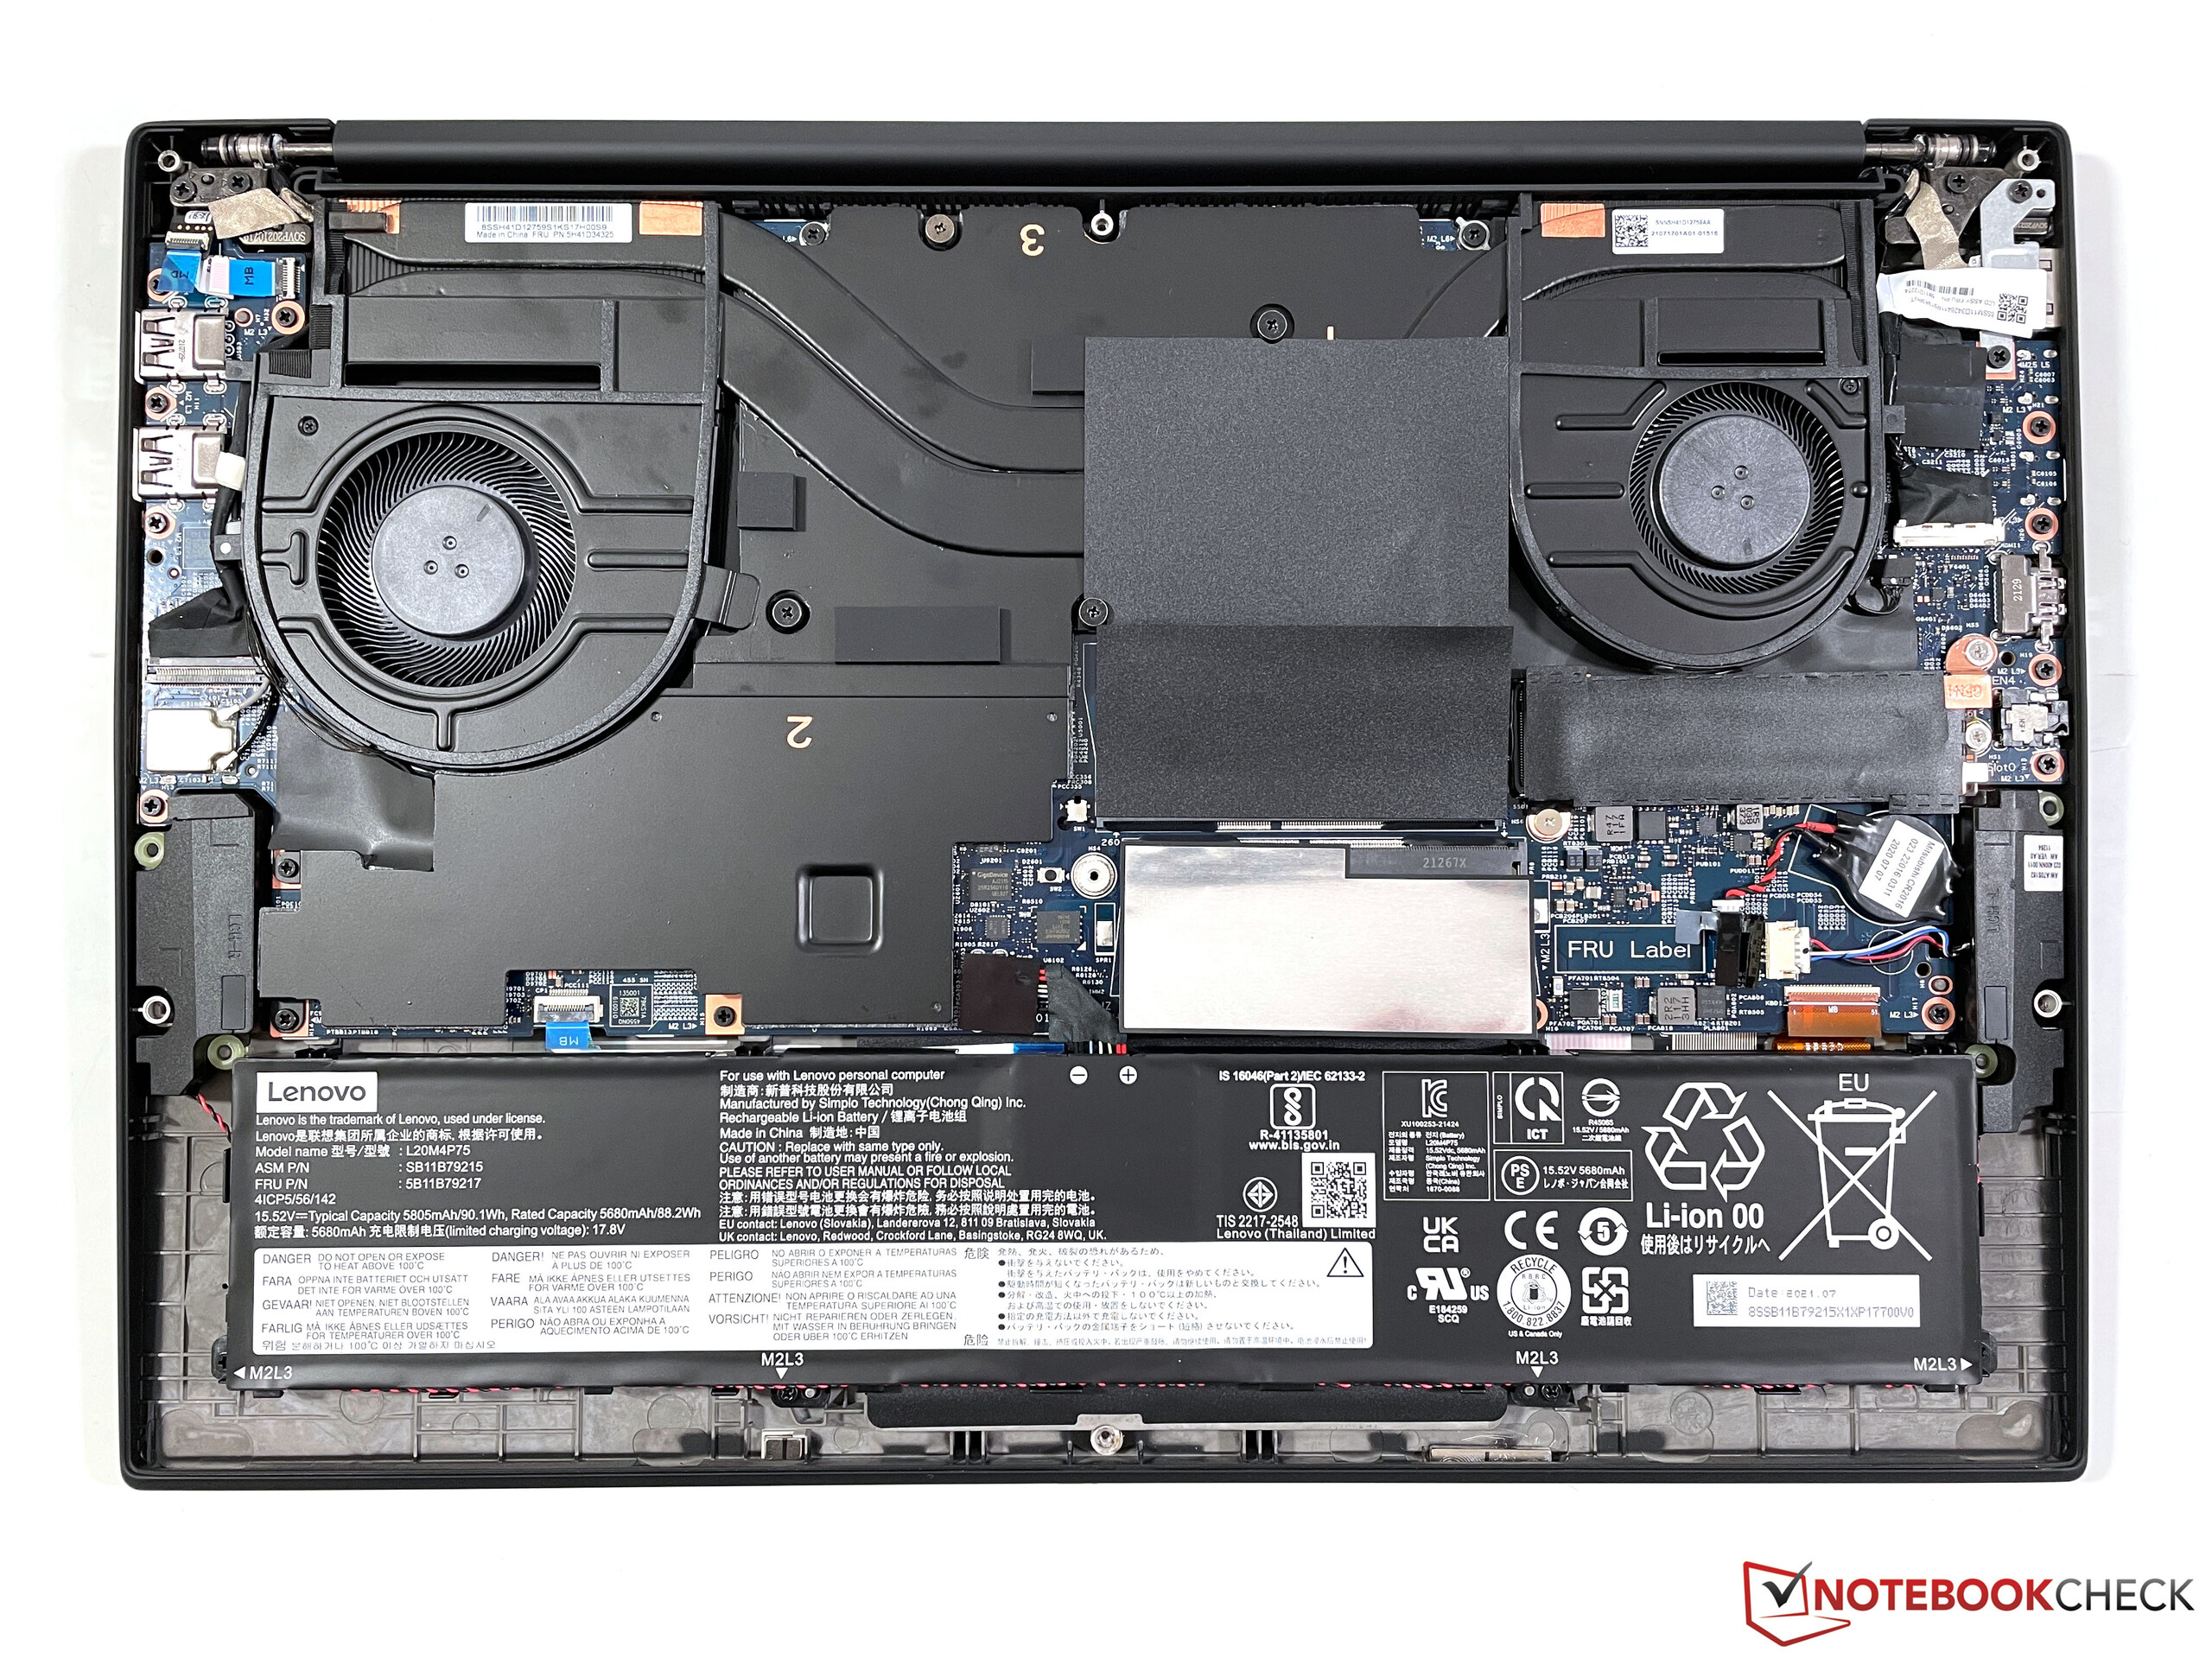
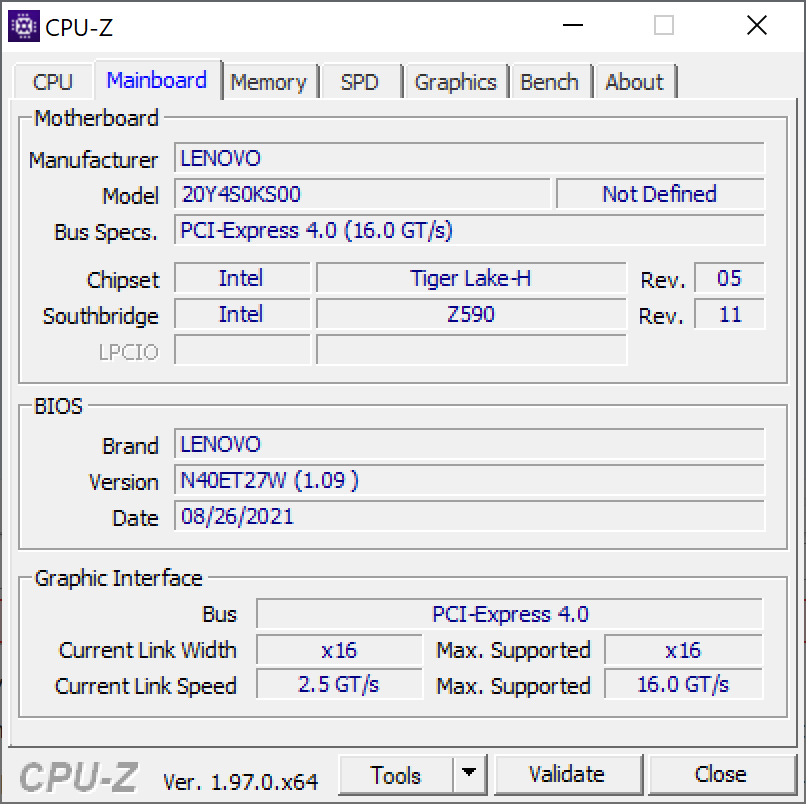
Lenovos arbetsstationer presterar betydligt bättre med VaporChamber
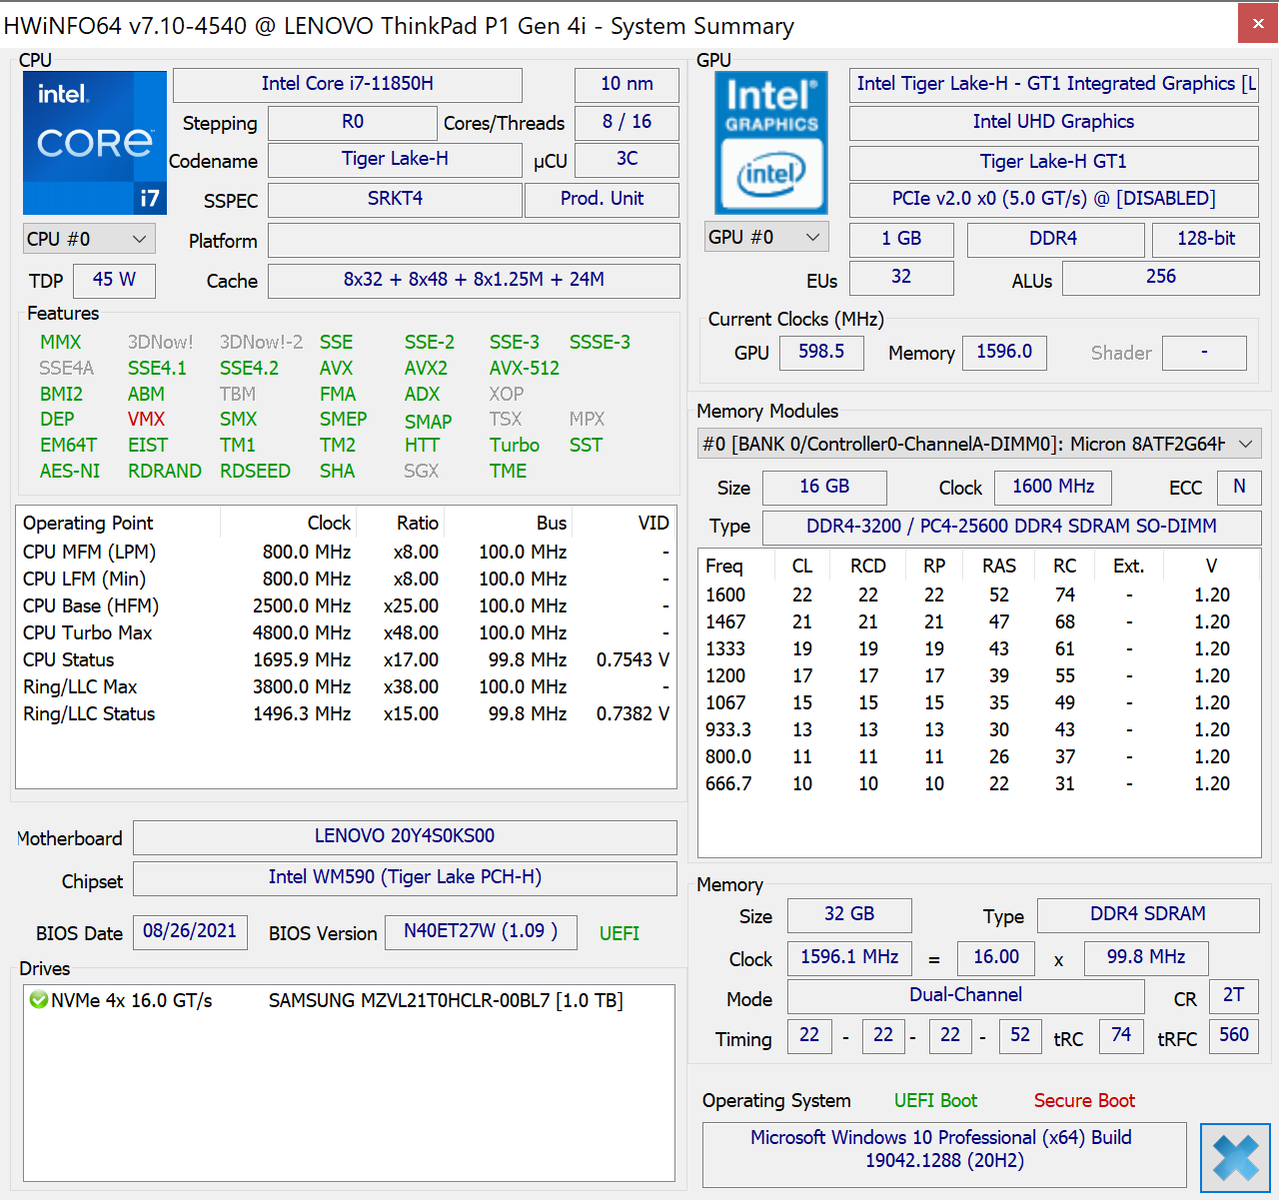
Lenovo förlitar sig på de senaste och mest kraftfulla komponenterna som Intel och Nvidia för närvarande erbjuder. I Intels fall innebär detta processorer från Tiger-Lake H-serien. De tre Core CPU:erna (i7-11800H, i7-11850H, i9-11950H) har åtta kärnor, medan Xeon W-11855M är en sexkärnig.
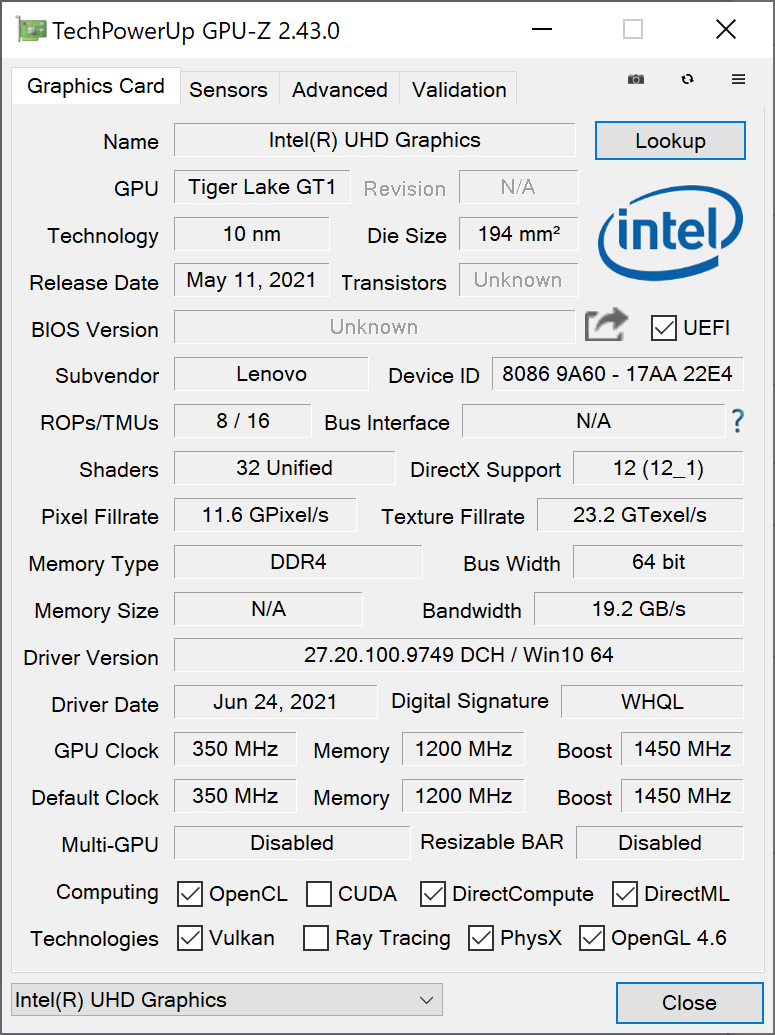
Urvalet av tillgängliga grafikkretsar är mycket större. Som ett absolut grundalternativ finns P1 G4 utan en dedikerad grafikprocessor, dvs. endast med integrerad Intel-grafik. Det finns sju dedikerade grafikkretsar;Nvidia T1200, RTX A2000, RTX A3000, RTX A4000, RTX 5000 och för första gången i P1 GeForce RTX 3070 och RTX 3080.
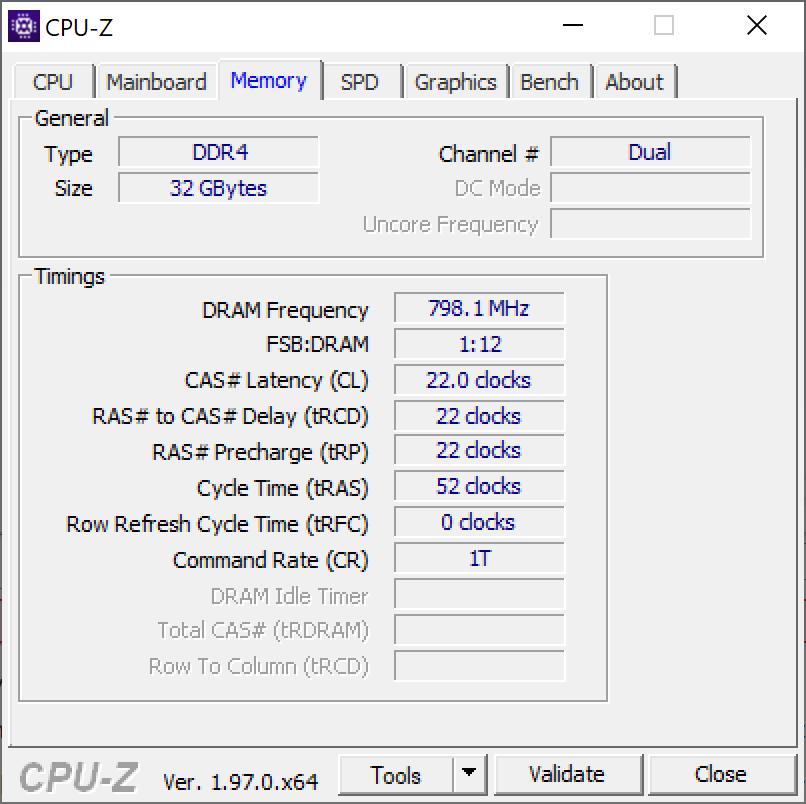
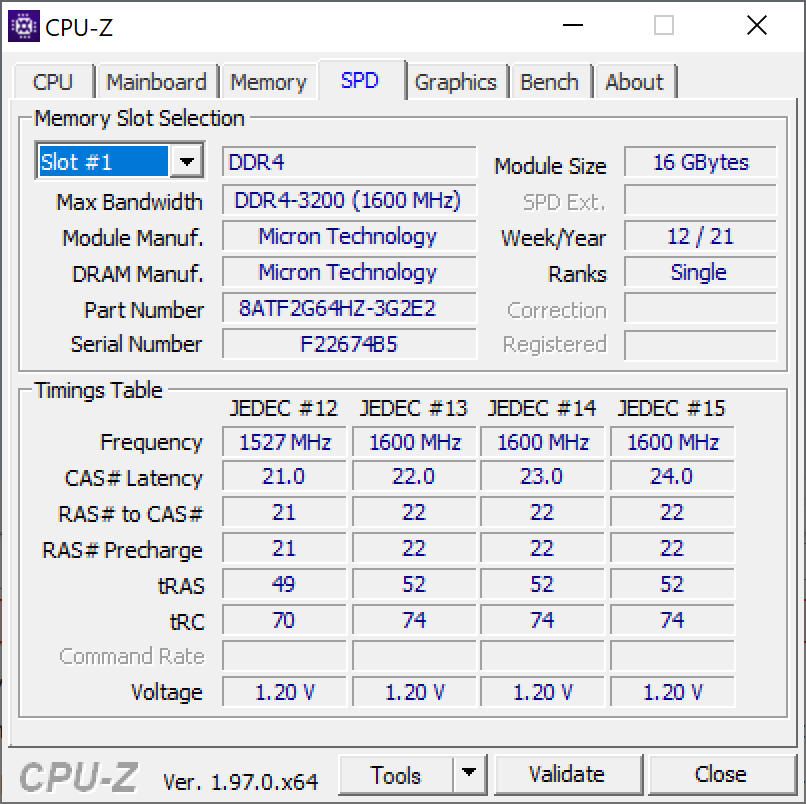
Lenovo ThinkPad P1 Gen 4 har i alla fall två SO-DIMM-fack för maximalt 64 GB minne. Detta kan också vara ECC RAM när den bärbara ThinkPad-datorn är konfigurerad med Xeon. Beroende på modellvariant har Lenovos bärbara dator en eller två M.2 2280-portar - modellvarianter med Intel GPU, T1200 eller RTX A2000 har två, alla andra endast en masslagringsfackplats
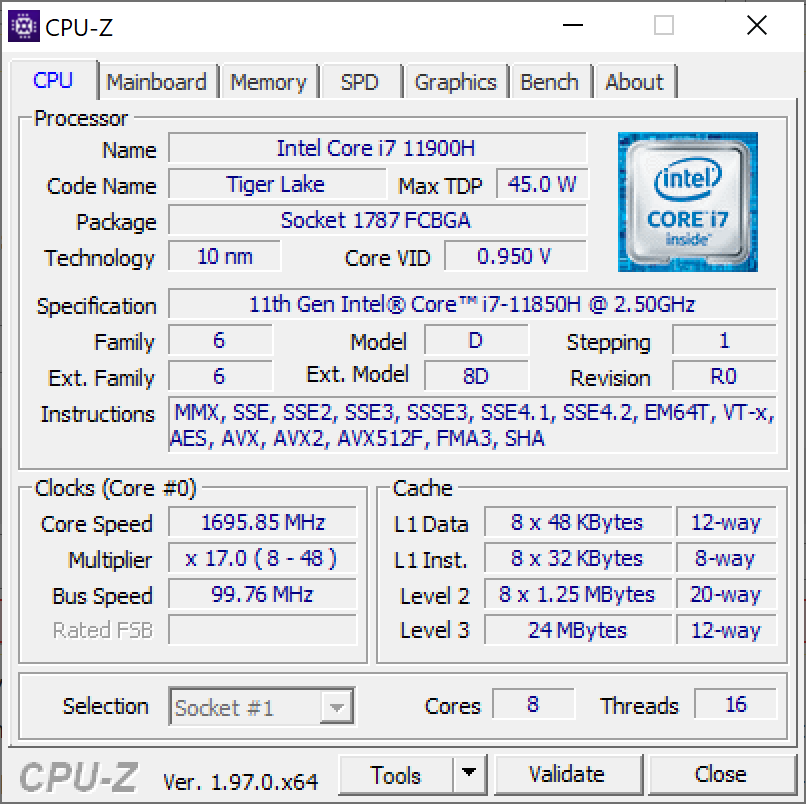
Processor
Intel Core i7-11850H är en aktuell processor från "Tiger-Lake"-serien med åtta kärnor och 16 trådar. Nominellt är TDP för denna CPU 45 watt, men denna förbrukning är inte tillräcklig för att nå den maximala klockfrekvensen på 4,8 GHz på alla kärnor. Med vår CPU-lista kan Intel-processorn jämföras med andra processorer.
Egentligen är i7-11850H praktiskt taget lika snabb som i7-11800H, skillnaden beror främst på vPro-stödet i 11850H - men i ThinkPad P1 G4 är skillnaden mellan de två stor. Orsaken är inte processorn utan kylsystemet: Modellen med GeForce RTX 3070 som testats här innehåller ångkammarkylning. Därför kan processorn permanent förbruka cirka 60 watt vid ren CPU-belastning här, medan CPU:n i den mindre utrustade ThinkPad P1 Gen 4 med Nvidia T1200 var begränsad till cirka 40 watt. I flerkärnighetstestet Cinebench R23 är Vapor-Chamber P1 27 % snabbare än den billigare modellen, den ligger ungefär på samma nivå som den HP ZBook Studio 15 G8.
Vi kunde inte fastställa någon begränsning av CPU-prestanda i batteriläge
Cinebench R15 Multi Endurance test
Cinebench R23: Multi Core | Single Core
Cinebench R20: CPU (Multi Core) | CPU (Single Core)
Cinebench R15: CPU Multi 64Bit | CPU Single 64Bit
Blender: v2.79 BMW27 CPU
7-Zip 18.03: 7z b 4 | 7z b 4 -mmt1
Geekbench 5.5: Multi-Core | Single-Core
HWBOT x265 Benchmark v2.2: 4k Preset
LibreOffice : 20 Documents To PDF
R Benchmark 2.5: Overall mean
| CPU Performance rating | |
| Genomsnitt av klass Workstation | |
| Lenovo ThinkPad P1 G4-20Y4S0KS00 | |
| HP ZBook Studio 15 G8 | |
| Genomsnitt Intel Core i7-11850H | |
| Huawei MateBook 16 R7 5800H | |
| Apple MacBook Pro 13 Late 2020 M1 Entry (8 / 256 GB) -6! | |
| Dell Precision 5000 5560 -2! | |
| Lenovo ThinkPad P1 G4-20Y30017GE | |
| Apple MacBook Pro 16 2019 i9 5500M | |
| Lenovo ThinkPad X1 Extreme Gen3-20TLS0UV00 | |
| Cinebench R23 / Multi Core | |
| Genomsnitt av klass Workstation (14055 - 38520, n=25, senaste 2 åren) | |
| HP ZBook Studio 15 G8 | |
| Lenovo ThinkPad P1 G4-20Y4S0KS00 | |
| Genomsnitt Intel Core i7-11850H (9779 - 11935, n=2) | |
| Huawei MateBook 16 R7 5800H | |
| Dell Precision 5000 5560 | |
| Lenovo ThinkPad P1 G4-20Y30017GE | |
| Apple MacBook Pro 16 2019 i9 5500M | |
| Apple MacBook Pro 16 2019 i9 5500M | |
| Apple MacBook Pro 13 Late 2020 M1 Entry (8 / 256 GB) | |
| Lenovo ThinkPad X1 Extreme Gen3-20TLS0UV00 | |
| Cinebench R23 / Single Core | |
| Genomsnitt av klass Workstation (1712 - 2228, n=25, senaste 2 åren) | |
| HP ZBook Studio 15 G8 | |
| Lenovo ThinkPad P1 G4-20Y4S0KS00 | |
| Genomsnitt Intel Core i7-11850H (1513 - 1552, n=2) | |
| Apple MacBook Pro 13 Late 2020 M1 Entry (8 / 256 GB) | |
| Dell Precision 5000 5560 | |
| Lenovo ThinkPad P1 G4-20Y30017GE | |
| Huawei MateBook 16 R7 5800H | |
| Lenovo ThinkPad X1 Extreme Gen3-20TLS0UV00 | |
| Apple MacBook Pro 16 2019 i9 5500M | |
| Cinebench R20 / CPU (Multi Core) | |
| Genomsnitt av klass Workstation (5471 - 15043, n=25, senaste 2 åren) | |
| Lenovo ThinkPad P1 G4-20Y4S0KS00 | |
| HP ZBook Studio 15 G8 | |
| Genomsnitt Intel Core i7-11850H (3826 - 4663, n=2) | |
| Huawei MateBook 16 R7 5800H | |
| Dell Precision 5000 5560 | |
| Lenovo ThinkPad P1 G4-20Y30017GE | |
| Apple MacBook Pro 16 2019 i9 5500M | |
| Apple MacBook Pro 16 2019 i9 5500M | |
| Lenovo ThinkPad X1 Extreme Gen3-20TLS0UV00 | |
| Apple MacBook Pro 13 Late 2020 M1 Entry (8 / 256 GB) | |
| Cinebench R20 / CPU (Single Core) | |
| Genomsnitt av klass Workstation (671 - 857, n=25, senaste 2 åren) | |
| HP ZBook Studio 15 G8 | |
| Lenovo ThinkPad P1 G4-20Y4S0KS00 | |
| Genomsnitt Intel Core i7-11850H (583 - 607, n=2) | |
| Dell Precision 5000 5560 | |
| Lenovo ThinkPad P1 G4-20Y30017GE | |
| Huawei MateBook 16 R7 5800H | |
| Lenovo ThinkPad X1 Extreme Gen3-20TLS0UV00 | |
| Apple MacBook Pro 16 2019 i9 5500M | |
| Apple MacBook Pro 16 2019 i9 5500M | |
| Apple MacBook Pro 13 Late 2020 M1 Entry (8 / 256 GB) | |
| Cinebench R15 / CPU Multi 64Bit | |
| Genomsnitt av klass Workstation (2489 - 5810, n=25, senaste 2 åren) | |
| Huawei MateBook 16 R7 5800H | |
| Lenovo ThinkPad P1 G4-20Y4S0KS00 | |
| HP ZBook Studio 15 G8 | |
| Genomsnitt Intel Core i7-11850H (1547 - 1988, n=2) | |
| Lenovo ThinkPad P1 G4-20Y30017GE | |
| Dell Precision 5000 5560 | |
| Apple MacBook Pro 16 2019 i9 5500M | |
| Apple MacBook Pro 16 2019 i9 5500M | |
| Lenovo ThinkPad X1 Extreme Gen3-20TLS0UV00 | |
| Apple MacBook Pro 13 Late 2020 M1 Entry (8 / 256 GB) | |
| Cinebench R15 / CPU Single 64Bit | |
| Genomsnitt av klass Workstation (191.4 - 328, n=25, senaste 2 åren) | |
| HP ZBook Studio 15 G8 | |
| Lenovo ThinkPad P1 G4-20Y4S0KS00 | |
| Genomsnitt Intel Core i7-11850H (232 - 233, n=2) | |
| Huawei MateBook 16 R7 5800H | |
| Dell Precision 5000 5560 | |
| Lenovo ThinkPad P1 G4-20Y30017GE | |
| Apple MacBook Pro 13 Late 2020 M1 Entry (8 / 256 GB) | |
| Lenovo ThinkPad X1 Extreme Gen3-20TLS0UV00 | |
| Apple MacBook Pro 16 2019 i9 5500M | |
| Apple MacBook Pro 16 2019 i9 5500M | |
| Blender / v2.79 BMW27 CPU | |
| Lenovo ThinkPad X1 Extreme Gen3-20TLS0UV00 | |
| Apple MacBook Pro 16 2019 i9 5500M | |
| Lenovo ThinkPad P1 G4-20Y30017GE | |
| Dell Precision 5000 5560 | |
| Genomsnitt Intel Core i7-11850H (257 - 313, n=2) | |
| Lenovo ThinkPad P1 G4-20Y4S0KS00 | |
| HP ZBook Studio 15 G8 | |
| Huawei MateBook 16 R7 5800H | |
| Genomsnitt av klass Workstation (91 - 261, n=25, senaste 2 åren) | |
| 7-Zip 18.03 / 7z b 4 | |
| Genomsnitt av klass Workstation (54741 - 116969, n=25, senaste 2 åren) | |
| Huawei MateBook 16 R7 5800H | |
| Lenovo ThinkPad P1 G4-20Y4S0KS00 | |
| HP ZBook Studio 15 G8 | |
| Genomsnitt Intel Core i7-11850H (44890 - 50552, n=2) | |
| Dell Precision 5000 5560 | |
| Apple MacBook Pro 16 2019 i9 5500M | |
| Lenovo ThinkPad P1 G4-20Y30017GE | |
| Lenovo ThinkPad X1 Extreme Gen3-20TLS0UV00 | |
| 7-Zip 18.03 / 7z b 4 -mmt1 | |
| Genomsnitt av klass Workstation (5126 - 6960, n=25, senaste 2 åren) | |
| HP ZBook Studio 15 G8 | |
| Lenovo ThinkPad P1 G4-20Y4S0KS00 | |
| Genomsnitt Intel Core i7-11850H (5727 - 5762, n=2) | |
| Dell Precision 5000 5560 | |
| Huawei MateBook 16 R7 5800H | |
| Lenovo ThinkPad P1 G4-20Y30017GE | |
| Lenovo ThinkPad X1 Extreme Gen3-20TLS0UV00 | |
| Apple MacBook Pro 16 2019 i9 5500M | |
| Geekbench 5.5 / Multi-Core | |
| Genomsnitt av klass Workstation (11542 - 25554, n=25, senaste 2 åren) | |
| Lenovo ThinkPad P1 G4-20Y4S0KS00 | |
| Genomsnitt Intel Core i7-11850H (9049 - 9451, n=2) | |
| Huawei MateBook 16 R7 5800H | |
| Apple MacBook Pro 13 Late 2020 M1 Entry (8 / 256 GB) | |
| HP ZBook Studio 15 G8 | |
| Apple MacBook Pro 16 2019 i9 5500M | |
| Lenovo ThinkPad P1 G4-20Y30017GE | |
| Lenovo ThinkPad X1 Extreme Gen3-20TLS0UV00 | |
| Geekbench 5.5 / Single-Core | |
| Genomsnitt av klass Workstation (1781 - 2183, n=25, senaste 2 åren) | |
| Apple MacBook Pro 13 Late 2020 M1 Entry (8 / 256 GB) | |
| HP ZBook Studio 15 G8 | |
| Genomsnitt Intel Core i7-11850H (1659 - 1686, n=2) | |
| Lenovo ThinkPad P1 G4-20Y4S0KS00 | |
| Lenovo ThinkPad P1 G4-20Y30017GE | |
| Huawei MateBook 16 R7 5800H | |
| Lenovo ThinkPad X1 Extreme Gen3-20TLS0UV00 | |
| Apple MacBook Pro 16 2019 i9 5500M | |
| HWBOT x265 Benchmark v2.2 / 4k Preset | |
| Genomsnitt av klass Workstation (14.4 - 40.5, n=25, senaste 2 åren) | |
| HP ZBook Studio 15 G8 | |
| Huawei MateBook 16 R7 5800H | |
| Lenovo ThinkPad P1 G4-20Y4S0KS00 | |
| Genomsnitt Intel Core i7-11850H (12.6 - 14.4, n=2) | |
| Dell Precision 5000 5560 | |
| Lenovo ThinkPad P1 G4-20Y30017GE | |
| Apple MacBook Pro 16 2019 i9 5500M | |
| Lenovo ThinkPad X1 Extreme Gen3-20TLS0UV00 | |
| LibreOffice / 20 Documents To PDF | |
| Apple MacBook Pro 16 2019 i9 5500M | |
| Apple MacBook Pro 16 2019 i9 5500M | |
| Huawei MateBook 16 R7 5800H | |
| Lenovo ThinkPad X1 Extreme Gen3-20TLS0UV00 | |
| Lenovo ThinkPad P1 G4-20Y30017GE | |
| HP ZBook Studio 15 G8 | |
| Dell Precision 5000 5560 | |
| Genomsnitt av klass Workstation (37.1 - 74.7, n=25, senaste 2 åren) | |
| Genomsnitt Intel Core i7-11850H (45.8 - 48, n=2) | |
| Lenovo ThinkPad P1 G4-20Y4S0KS00 | |
| R Benchmark 2.5 / Overall mean | |
| Apple MacBook Pro 16 2019 i9 5500M | |
| Apple MacBook Pro 16 2019 i9 5500M | |
| Lenovo ThinkPad X1 Extreme Gen3-20TLS0UV00 | |
| Lenovo ThinkPad P1 G4-20Y30017GE | |
| HP ZBook Studio 15 G8 | |
| Dell Precision 5000 5560 | |
| Genomsnitt Intel Core i7-11850H (0.541 - 0.543, n=2) | |
| Lenovo ThinkPad P1 G4-20Y4S0KS00 | |
| Huawei MateBook 16 R7 5800H | |
| Genomsnitt av klass Workstation (0.3825 - 0.603, n=25, senaste 2 åren) | |
* ... mindre är bättre
Systemprestanda
Lenovo ThinkPad P1 G4 är mycket snabb i vardagen. I PCMark10 ligger den överlag i topp i jämförelsefältet, vilket också talar för den mycket goda systemprestandan.
Så bra som prestandan är: Vi var tvungna att starta om den bärbara ThinkPad-datorn väldigt ofta. Orsaken var grafikfel som ibland uppstod efter standby; hela bilden täcktes då av svarta och vita ränder. Eftersom det här felet inte uppstod i den första testmodellen antar vi att det är ett singulärt problem för den här testenheten
| PCMark 10 / Score | |
| Genomsnitt av klass Workstation (6436 - 10409, n=21, senaste 2 åren) | |
| Lenovo ThinkPad P1 G4-20Y4S0KS00 | |
| Genomsnitt Intel Core i7-11850H, NVIDIA GeForce RTX 3070 Laptop GPU (n=1) | |
| HP ZBook Studio 15 G8 | |
| Dell Precision 5000 5560 | |
| Lenovo ThinkPad P1 G4-20Y30017GE | |
| Apple MacBook Pro 16 2019 i9 5500M | |
| Lenovo ThinkPad X1 Extreme Gen3-20TLS0UV00 | |
| PCMark 10 / Essentials | |
| Lenovo ThinkPad P1 G4-20Y4S0KS00 | |
| Genomsnitt Intel Core i7-11850H, NVIDIA GeForce RTX 3070 Laptop GPU (n=1) | |
| Dell Precision 5000 5560 | |
| Genomsnitt av klass Workstation (9622 - 11157, n=21, senaste 2 åren) | |
| HP ZBook Studio 15 G8 | |
| Lenovo ThinkPad P1 G4-20Y30017GE | |
| Lenovo ThinkPad X1 Extreme Gen3-20TLS0UV00 | |
| PCMark 10 / Productivity | |
| Genomsnitt av klass Workstation (8789 - 20616, n=21, senaste 2 åren) | |
| Dell Precision 5000 5560 | |
| Lenovo ThinkPad P1 G4-20Y4S0KS00 | |
| Genomsnitt Intel Core i7-11850H, NVIDIA GeForce RTX 3070 Laptop GPU (n=1) | |
| HP ZBook Studio 15 G8 | |
| Lenovo ThinkPad P1 G4-20Y30017GE | |
| Lenovo ThinkPad X1 Extreme Gen3-20TLS0UV00 | |
| PCMark 10 / Digital Content Creation | |
| Genomsnitt av klass Workstation (7744 - 15631, n=21, senaste 2 åren) | |
| Lenovo ThinkPad P1 G4-20Y4S0KS00 | |
| Genomsnitt Intel Core i7-11850H, NVIDIA GeForce RTX 3070 Laptop GPU (n=1) | |
| HP ZBook Studio 15 G8 | |
| Dell Precision 5000 5560 | |
| Lenovo ThinkPad P1 G4-20Y30017GE | |
| Lenovo ThinkPad X1 Extreme Gen3-20TLS0UV00 | |
| PCMark 10 Score | 7156 poäng | |
Hjälp | ||
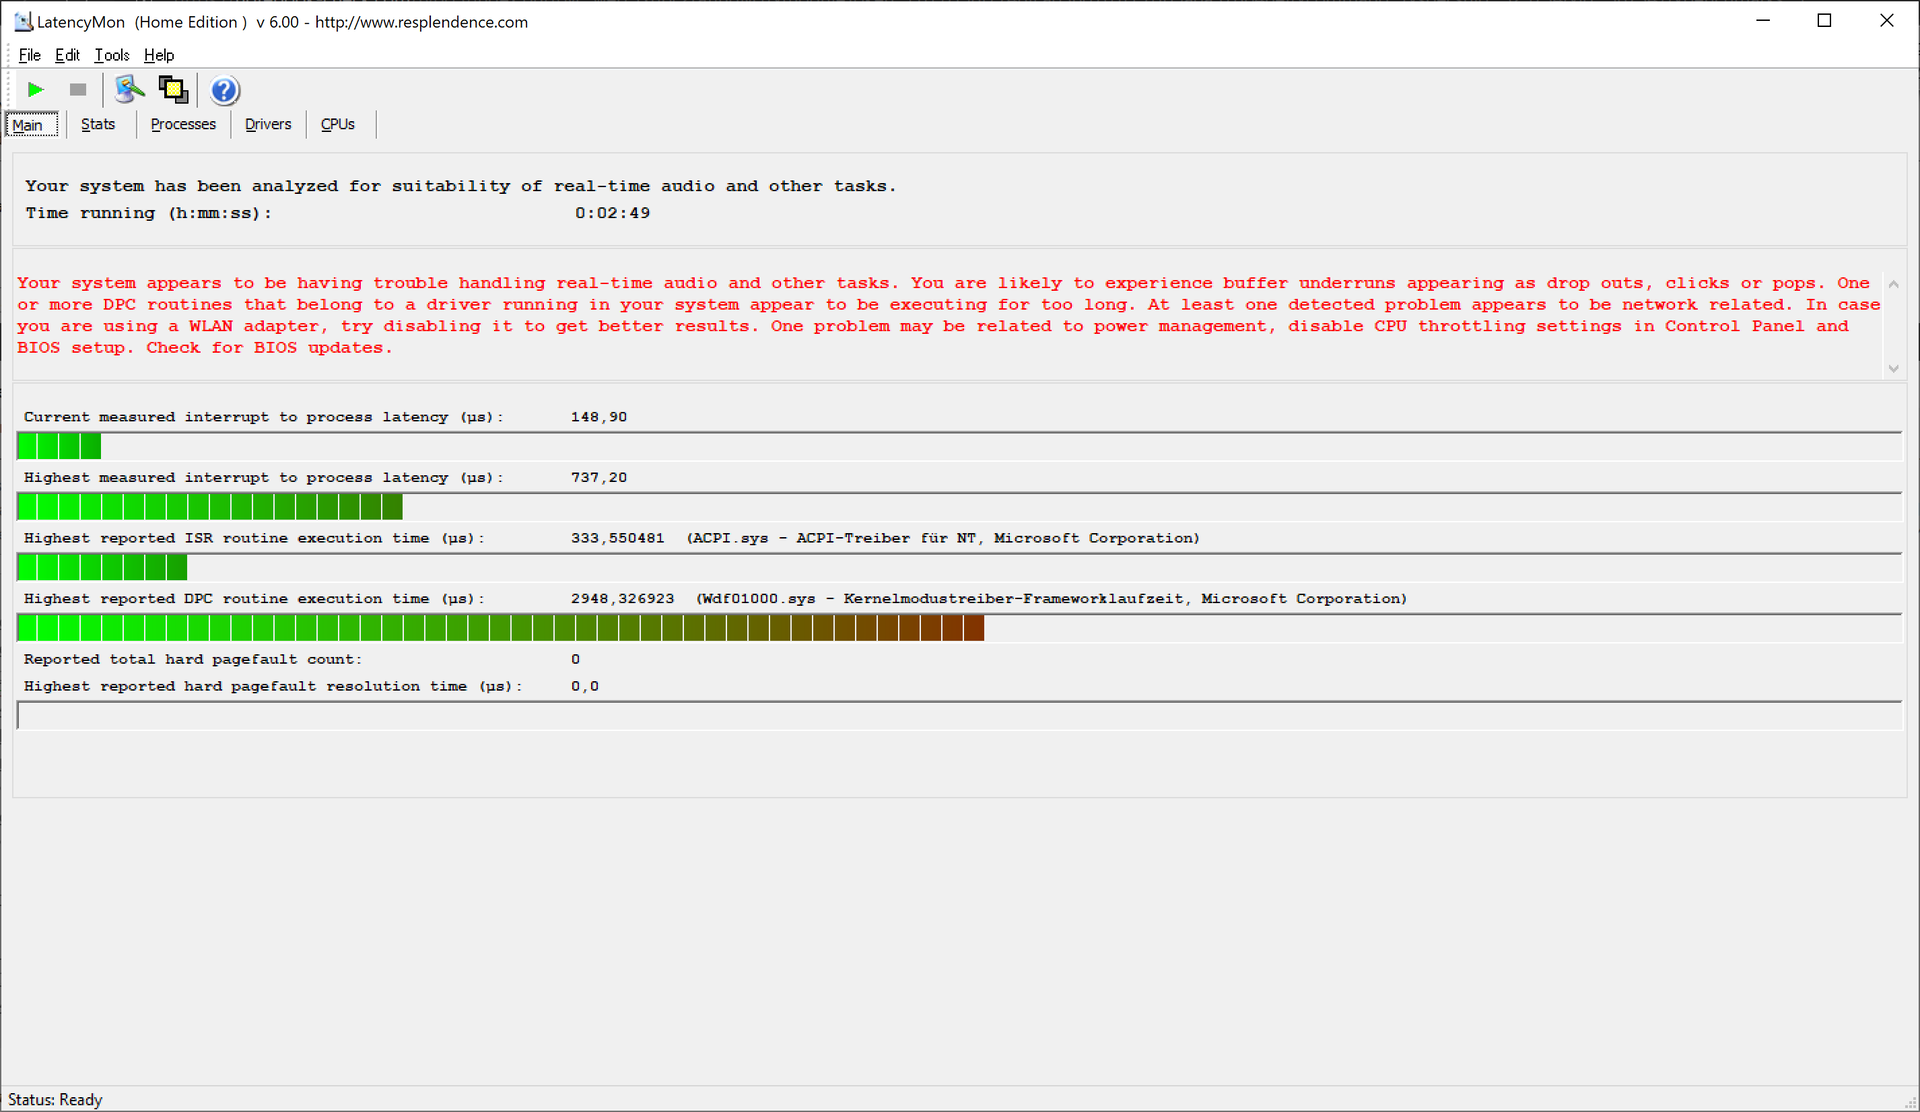
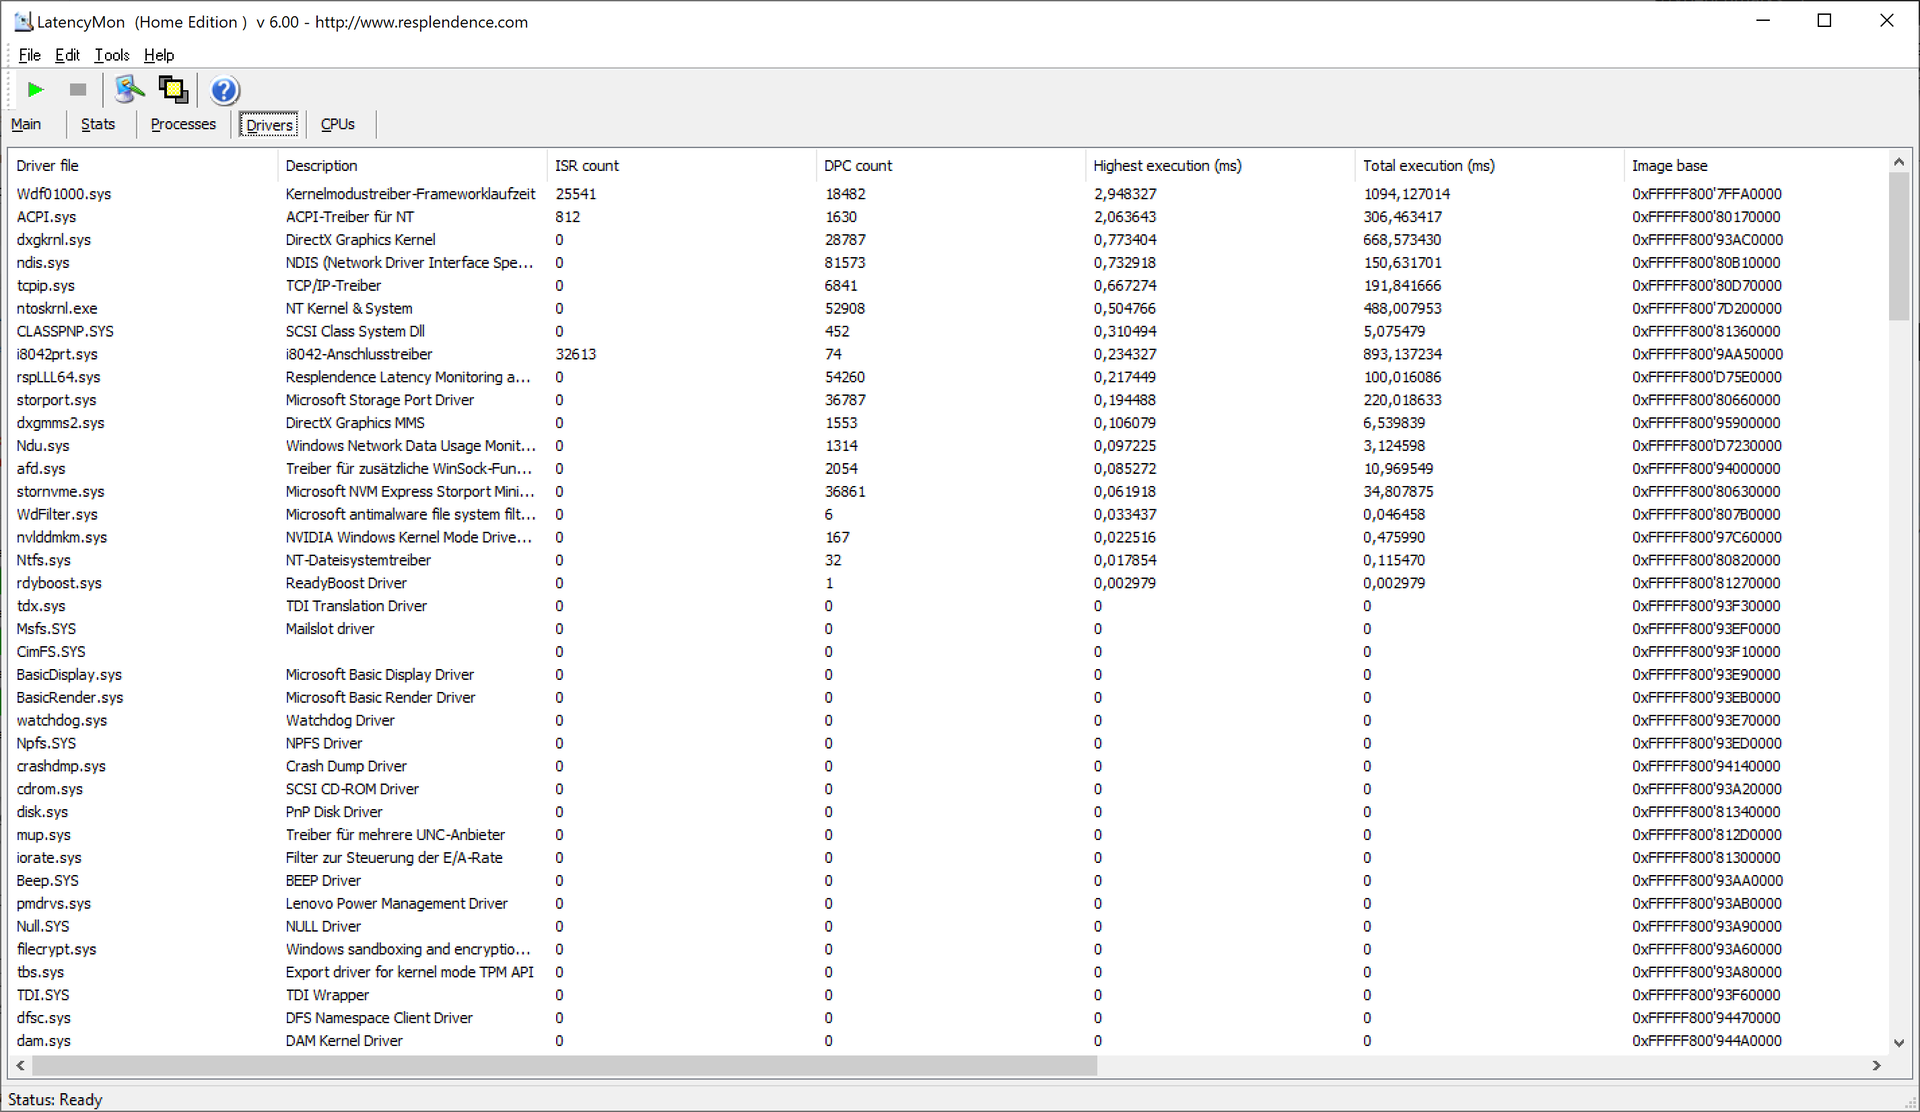
DPC-fördröjningar
Att arbeta med ljud- och videofiler är en av de möjliga användningsområdena för en bärbar dator som ThinkPad P1 Gen 4. Här kan DPC-latenserna orsaka problem eftersom de höga hastigheterna också ledde till bortfall i vårt YouTube-videotest
| DPC Latencies / LatencyMon - interrupt to process latency (max), Web, Youtube, Prime95 | |
| Lenovo ThinkPad P1 G4-20Y30017GE | |
| HP ZBook Studio 15 G8 | |
| Dell Precision 5000 5560 | |
| Lenovo ThinkPad P1 G4-20Y4S0KS00 | |
| Lenovo ThinkPad X1 Extreme Gen3-20TLS0UV00 | |
* ... mindre är bättre
Masslagring
I den här konfigurationen har Lenovo ThinkPad P1 G4 endast ett M.2-2280-fack. Den här är åtminstone mycket välutrustad med en 1 TB Samsung PM9A1. Denna NMVe PCIe 4.0 SSD presterar extremt bra i våra benchmarks
| Drive Performance rating - Percent | |
| Lenovo ThinkPad P1 G4-20Y4S0KS00 | |
| Lenovo ThinkPad P1 G4-20Y30017GE | |
| Genomsnitt av klass Workstation | |
| Genomsnitt Samsung PM9A1 MZVL21T0HCLR | |
| Dell Precision 5000 5560 | |
| Lenovo ThinkPad X1 Extreme Gen3-20TLS0UV00 | |
| HP ZBook Studio 15 G8 | |
| Apple MacBook Pro 16 2019 i9 5500M | |
* ... mindre är bättre

Continuous load read: DiskSpd Read Loop, Queue Depth 8
GPU-prestanda
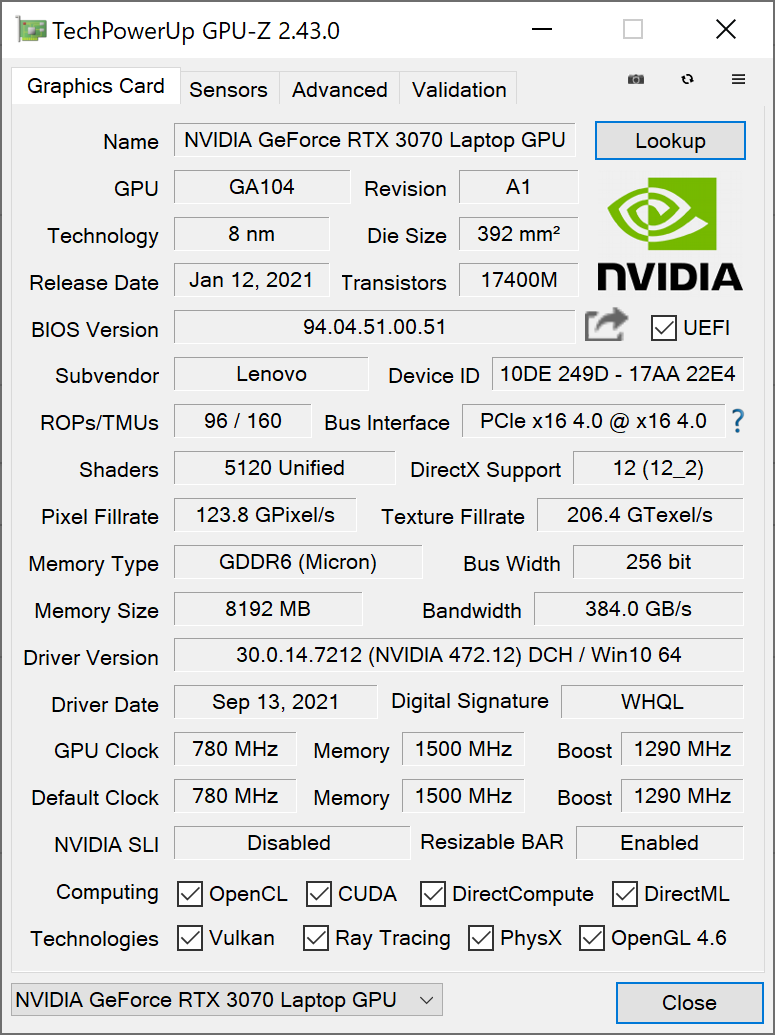
Nvidia GeForce RTX 3070 är en av de mest kraftfulla mobila grafikprocessorerna i Nvidias nuvarande "Ampere"-generation. I fallet med Lenovos ThinkPad P1 G4 är dock de 5120 shader-enheterna långt ifrån sin maximala prestanda eftersom Lenovo ställer in GPU:n på en TGP på 80 watt - tidigare skulle den här varianten ha kallats "Max-Q".
Därför är det inte konstigt att RTX 3070 är cirka 10 % snabbare i genomsnitt i alla bärbara datorer än här i Lenovo ThinkPad P1 2021. Trots detta är gapet till ThinkPad X1 Extreme G3 med GeForce GTX 1650 Ti Max-Q enormt (+148 %), till och med jämfört med Nvidias T1200-variant i P1 är GeForce RTX 3070 mer än dubbelt så snabb i 3DMark-benchmarks (+118 %). I det här fallet är GeForce verkligen värt det. Slutsatsen för den professionella benchmarksviten SPECviewperf är mer blandad: Här uppnår GeForce-P1 delvis bra, men också delvis dåliga resultat. En ThinkPad P1 med en ISV-certifierad Nvidia GPU bör väljas för CAD.
GPU-prestandan är klart begränsad i batteriläge. 3DMark 11-resultatet är ca 56 % lägre utan strömförsörjning (13 508 poäng i 3DMark 11 GPU-poäng)
| 3DMark Performance rating - Percent | |
| Genomsnitt av klass Workstation -1! | |
| Genomsnitt NVIDIA GeForce RTX 3070 Laptop GPU | |
| Lenovo ThinkPad P1 G4-20Y4S0KS00 | |
| HP ZBook Studio 15 G8 -16! | |
| Dell Precision 5000 5560 | |
| Lenovo ThinkPad P1 G4-20Y30017GE -8! | |
| Apple MacBook Pro 16 2019 i9 5500M -16! | |
| Lenovo ThinkPad X1 Extreme Gen3-20TLS0UV00 -25! | |
| 3DMark 11 - 1280x720 Performance GPU | |
| Genomsnitt av klass Workstation (10888 - 69594, n=25, senaste 2 åren) | |
| Genomsnitt NVIDIA GeForce RTX 3070 Laptop GPU (12535 - 38275, n=54) | |
| Lenovo ThinkPad P1 G4-20Y4S0KS00 | |
| HP ZBook Studio 15 G8 | |
| Dell Precision 5000 5560 | |
| Apple MacBook Pro 16 2019 i9 5500M | |
| Lenovo ThinkPad P1 G4-20Y30017GE | |
| Lenovo ThinkPad X1 Extreme Gen3-20TLS0UV00 | |
| 3DMark | |
| 1920x1080 Fire Strike Graphics | |
| Genomsnitt av klass Workstation (7578 - 52560, n=25, senaste 2 åren) | |
| Genomsnitt NVIDIA GeForce RTX 3070 Laptop GPU (7178 - 29128, n=52) | |
| Lenovo ThinkPad P1 G4-20Y4S0KS00 | |
| HP ZBook Studio 15 G8 | |
| Dell Precision 5000 5560 | |
| Apple MacBook Pro 16 2019 i9 5500M | |
| Lenovo ThinkPad P1 G4-20Y30017GE | |
| Lenovo ThinkPad X1 Extreme Gen3-20TLS0UV00 | |
| 2560x1440 Time Spy Graphics | |
| Genomsnitt av klass Workstation (2725 - 24806, n=25, senaste 2 åren) | |
| Genomsnitt NVIDIA GeForce RTX 3070 Laptop GPU (2644 - 11019, n=53) | |
| Lenovo ThinkPad P1 G4-20Y4S0KS00 | |
| HP ZBook Studio 15 G8 | |
| Dell Precision 5000 5560 | |
| Lenovo ThinkPad P1 G4-20Y30017GE | |
| Apple MacBook Pro 16 2019 i9 5500M | |
| Lenovo ThinkPad X1 Extreme Gen3-20TLS0UV00 | |
| 3DMark 11 Performance | 24753 poäng | |
| 3DMark Fire Strike Score | 17860 poäng | |
| 3DMark Time Spy Score | 8430 poäng | |
Hjälp | ||
Spelprestanda
Lenovo ThinkPad P1 G4 är uttryckligen inte en bärbar dator för spel. Samtidigt gör Nvidia GeForce 3070 att den bärbara datorn från Lenovo kan användas för spel. Till och med för spel i 4K kan GPU:n vara tillräckligt snabb, beroende på titeln. I vår Witcher 3 test kan ThinkPad P1 2021 också konsekvent ringa in sin prestanda - med mindre fluktuationer
| The Witcher 3 - 1920x1080 Ultra Graphics & Postprocessing (HBAO+) | |
| Genomsnitt NVIDIA GeForce RTX 3070 Laptop GPU (34.9 - 109, n=52) | |
| Lenovo ThinkPad P1 G4-20Y4S0KS00 | |
| HP ZBook Studio 15 G8 | |
| Genomsnitt av klass Workstation (26.3 - 91.7, n=3, senaste 2 åren) | |
| Dell Precision 5000 5560 | |
| Apple MacBook Pro 16 2019 i9 5500M | |
| Lenovo ThinkPad P1 G4-20Y30017GE | |
| Lenovo ThinkPad X1 Extreme Gen3-20TLS0UV00 | |
Witcher 3 FPS-Diagram
| låg | med. | hög | ultra | QHD | 4K | |
|---|---|---|---|---|---|---|
| GTA V (2015) | 185 | 179 | 164 | 88.1 | 74.5 | 74.3 |
| The Witcher 3 (2015) | 345 | 243 | 158 | 86.8 | 56.5 | |
| Dota 2 Reborn (2015) | 171 | 148 | 124 | 106 | 109 | |
| X-Plane 11.11 (2018) | 105 | 102 | 76.8 | 52.4 | ||
| Strange Brigade (2018) | 408 | 206 | 171 | 151 | 113 | 61.1 |
Utsläpp: Starka komponenter gör ThinkPad P1 G4 varm
Fläktljud
Lenovo är traditionellt återhållsamma när det gäller fläktvolymen på ThinkPads. Detta gäller dock inte för arbetsstationsmodellen ThinkPad P1. De två fläktarna körs med en maximal ljudvolym på 47,4 dB(a), vilket är tydligt hörbart. Åtminstone är detta inte alltid fallet, det finns även en lägre nivå på 38,6 dB(a) och den aktiva kylningen förblir ofta inaktiverad i tomgång.
Spolkurran är tyvärr fortfarande ett problem alldeles för ofta, men Lenovo ThinkPad P1 Gen 4 är inte drabbad av detta
| Lenovo ThinkPad P1 G4-20Y4S0KS00 GeForce RTX 3070 Laptop GPU, i7-11850H, Samsung PM9A1 MZVL21T0HCLR | Lenovo ThinkPad P1 G4-20Y30017GE T1200 Laptop GPU, i7-11800H, Samsung PM9A1 MZVL2512HCJQ | Dell Precision 5000 5560 RTX A2000 Laptop GPU, i7-11850H, Samsung PM9A1 MZVL22T0HBLB | Apple MacBook Pro 16 2019 i9 5500M Radeon Pro 5500M, i9-9880H, Apple SSD AP1024 7171 | HP ZBook Studio 15 G8 GeForce RTX 3070 Laptop GPU, i9-11950H, Samsung PM981a MZVLB2T0HALB | Lenovo ThinkPad X1 Extreme Gen3-20TLS0UV00 GeForce GTX 1650 Ti Max-Q, i7-10750H, Toshiba XG6 KXG6AZNV1T02 | |
|---|---|---|---|---|---|---|
| Noise | -3% | 12% | -12% | -2% | -9% | |
| av / miljö * (dB) | 23.8 | 24.3 -2% | 23.4 2% | 29.8 -25% | 23.5 1% | 29.5 -24% |
| Idle Minimum * (dB) | 23.8 | 24.3 -2% | 23.6 1% | 29.9 -26% | 25.3 -6% | 29.5 -24% |
| Idle Average * (dB) | 23.8 | 24.3 -2% | 23.6 1% | 29.9 -26% | 25.3 -6% | 29.5 -24% |
| Idle Maximum * (dB) | 28.3 | 26.6 6% | 23.6 17% | 29.9 -6% | 25.3 11% | 29.9 -6% |
| Load Average * (dB) | 38.6 | 46.8 -21% | 25.8 33% | 43 -11% | 41.2 -7% | 44.2 -15% |
| Witcher 3 ultra * (dB) | 47.4 | 46.8 1% | 40.1 15% | 45.4 4% | 49.4 -4% | 36.1 24% |
| Load Maximum * (dB) | 47.4 | 46.8 1% | 41.4 13% | 46.1 3% | 49.4 -4% | 44.2 7% |
* ... mindre är bättre
Ljudnivå
| Låg belastning |
| 23.8 / 23.8 / 28.3 dB(A) |
| Hög belastning |
| 38.6 / 47.4 dB(A) |
 | ||
30 dB tyst 40 dB(A) hörbar 50 dB(A) högt ljud |
||
min: | ||
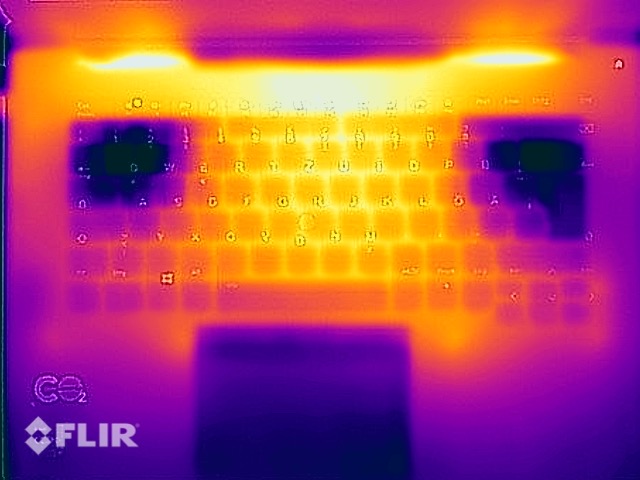
Temperatur
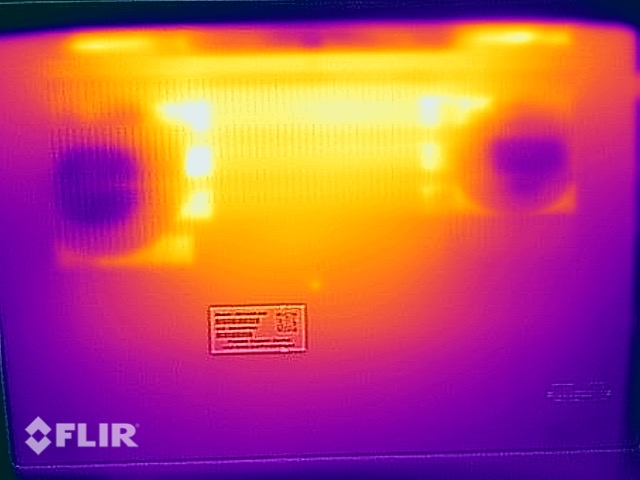
Lenovo har konstruerat ThinkPad P1 Gen 4 på den termiska gränsen. Som väntat förblir Lenovos bärbara dator sval i tomgångsläge, men uppvärmningen under belastning syns tydligt: Gränserna för vad som är möjligt med de nuvarande Intel CPU:erna och Nvidia GPU:erna är uttömda. Med 53,8 grader Celsius (~129 grader Fahrenheit) på undersidan är det inte så mycket maxtemperaturen som den jämna uppvärmningen av höljet som visar detta. Till och med handflatsstödet värms upp märkbart till 40 grader Celsius (104grader Fahrenheit), och temperaturerna är bara något lägre i Witcher 3 testet
(-) Den maximala temperaturen på ovansidan är 51 °C / 124 F, jämfört med genomsnittet av 38.2 °C / 101 F , allt från 22.2 till 69.8 °C för klassen Workstation.
(-) Botten värms upp till maximalt 53.5 °C / 128 F, jämfört med genomsnittet av 41.1 °C / 106 F
(+) Vid tomgångsbruk är medeltemperaturen för ovansidan 26.7 °C / 80 F, jämfört med enhetsgenomsnittet på 32 °C / ### class_avg_f### F.
(-) När du spelar The Witcher 3 är medeltemperaturen för ovansidan 43 °C / 109 F, jämfört med enhetsgenomsnittet på 32 °C / ## #class_avg_f### F.
(-) Handledsstöden och pekplattan kan bli väldigt varma vid beröring med maximalt 40 °C / 104 F.
(-) Medeltemperaturen för handledsstödsområdet på liknande enheter var 27.8 °C / 82 F (-12.2 °C / -22 F).
Stresstest
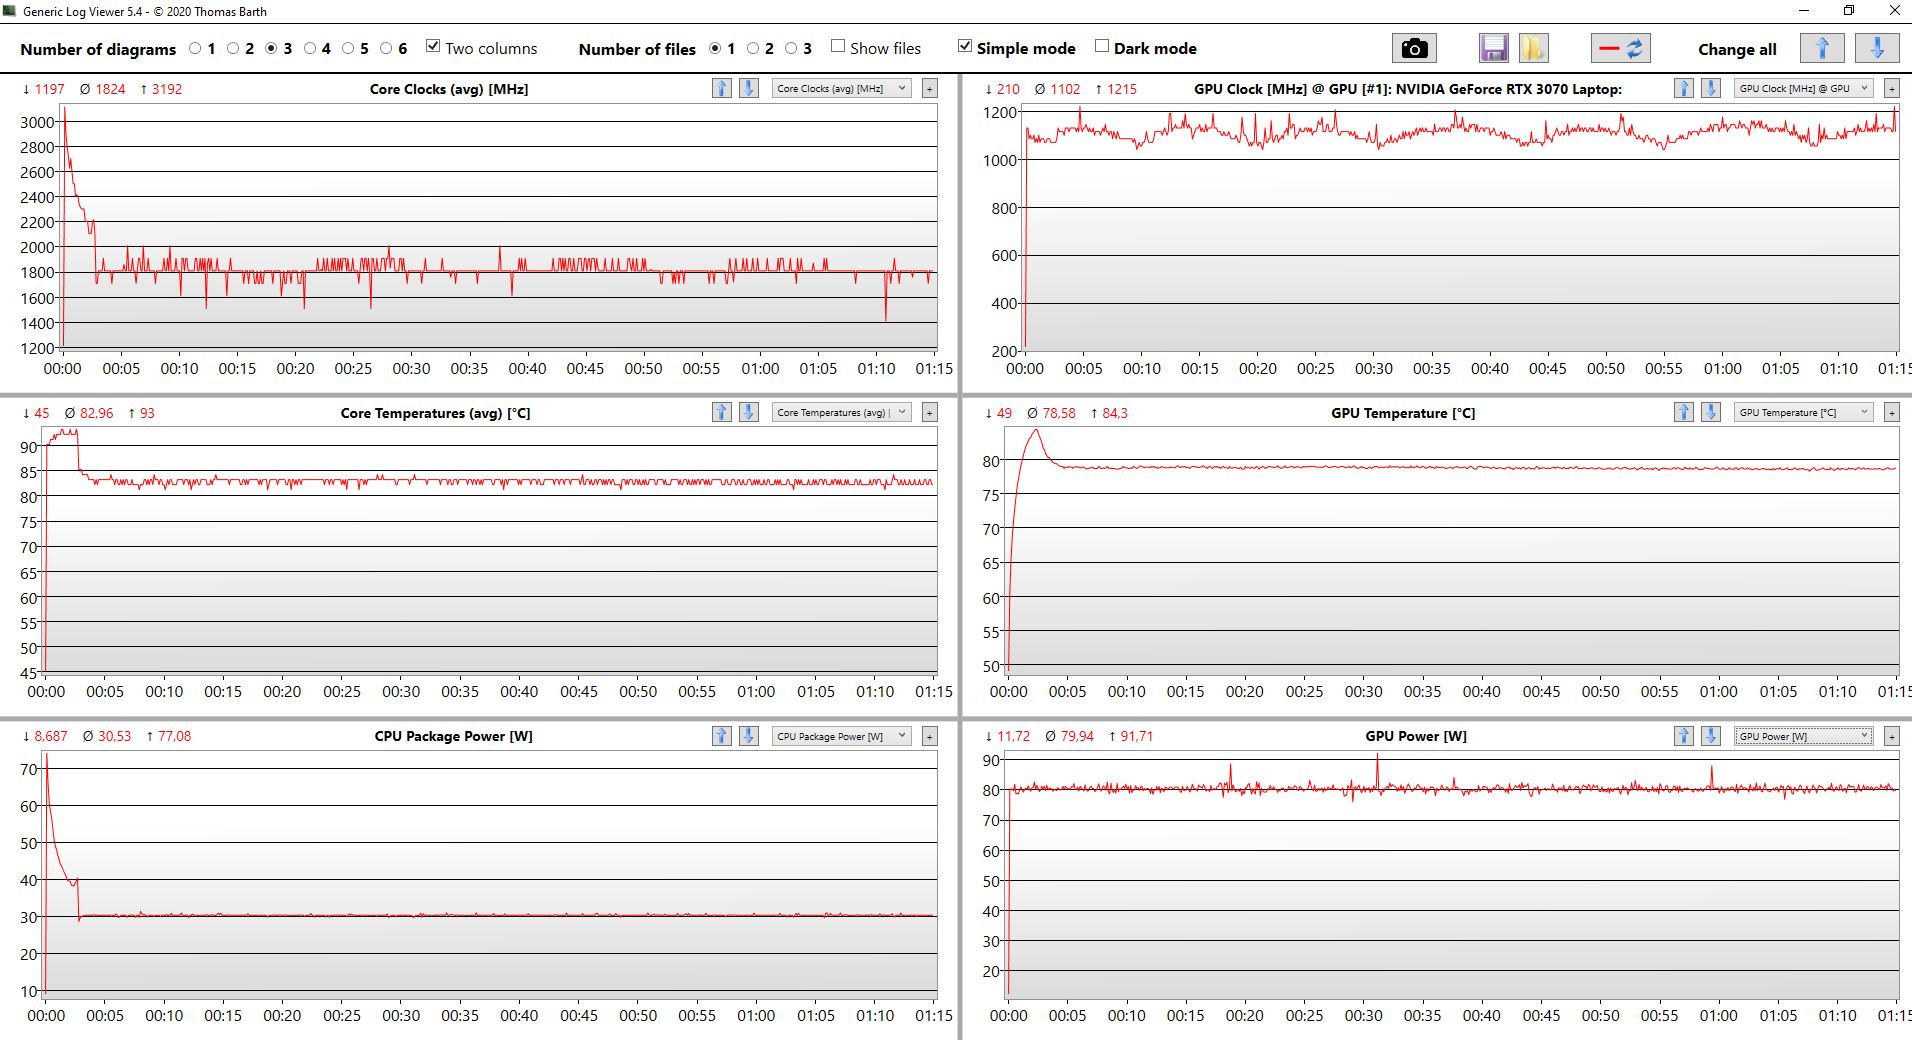
Med temperaturmätningarna stod det redan klart att Lenovo inte kan köra sin ThinkPad med obegränsad prestanda i stresstestet. Faktum är att processorn snabbt begränsas till 30 watt när GPU:n och CPU:n är fullt belastade samtidigt, medan GPU:ns prestanda förblir stabil vid 80 watt.
Den tydliga strypningen i stresstestet för extrema scenarier bör dock inte återspeglas i daglig användning, eftersom 3DMark 11 efter stresstestet gav ett normalt resultat.
Högtalare
En analys av högtalarkvaliteten finns i granskningen av QHD-modellen av Lenovo ThinkPad P1 Gen 4.
Lenovo ThinkPad P1 G4-20Y30017GE ljudanalys
(+) | högtalare kan spela relativt högt (84.3 dB)
Bas 100 - 315 Hz
(±) | reducerad bas - i genomsnitt 12.2% lägre än medianen
(±) | linjäriteten för basen är genomsnittlig (9.8% delta till föregående frekvens)
Mellan 400 - 2000 Hz
(+) | balanserad mellan - endast 3.4% från medianen
(+) | mids är linjära (3.4% delta till föregående frekvens)
Högsta 2 - 16 kHz
(+) | balanserade toppar - endast 2.9% från medianen
(+) | toppar är linjära (5% delta till föregående frekvens)
Totalt 100 - 16 000 Hz
(+) | det totala ljudet är linjärt (11.8% skillnad mot median)
Jämfört med samma klass
» 16% av alla testade enheter i den här klassen var bättre, 3% liknande, 81% sämre
» Den bästa hade ett delta på 7%, genomsnittet var 17%, sämst var 35%
Jämfört med alla testade enheter
» 8% av alla testade enheter var bättre, 3% liknande, 89% sämre
» Den bästa hade ett delta på 4%, genomsnittet var 24%, sämst var 134%
Apple MacBook Pro 16 2019 i9 5500M ljudanalys
(+) | högtalare kan spela relativt högt (82.3 dB)
Bas 100 - 315 Hz
(+) | bra bas - bara 2.3% från medianen
(+) | basen är linjär (5% delta till föregående frekvens)
Mellan 400 - 2000 Hz
(+) | balanserad mellan - endast 2.7% från medianen
(+) | mids är linjära (3.4% delta till föregående frekvens)
Högsta 2 - 16 kHz
(+) | balanserade toppar - endast 2.1% från medianen
(+) | toppar är linjära (2.6% delta till föregående frekvens)
Totalt 100 - 16 000 Hz
(+) | det totala ljudet är linjärt (6.9% skillnad mot median)
Jämfört med samma klass
» 5% av alla testade enheter i den här klassen var bättre, 1% liknande, 94% sämre
» Den bästa hade ett delta på 5%, genomsnittet var 17%, sämst var 45%
Jämfört med alla testade enheter
» 1% av alla testade enheter var bättre, 0% liknande, 99% sämre
» Den bästa hade ett delta på 4%, genomsnittet var 24%, sämst var 134%
Energiförbrukning: WQUXGA LCD äter upp batteriet i Lenovos bärbara dator
Intressant nog är minimiförbrukningen för den här versionen av ThinkPad P1 Gen 4 knappast märkbart högre än den redan testade versionen med QHD LCD. Skillnaden är skarp i tomgångsmedianen med maximerad LCD-styrka: Förbrukningen på 20,2 watt är extremt hög här. Ingen av de andra bärbara datorerna för arbetsstationer eller multimedier har en jämförbar förbrukning vid denna hastighet.
Den här varianten av Lenovos ThinkPad P1 2021 levereras med ett nätaggregat på 230 watt. Detta skulle inte ens vara nödvändigt; ett 170-watts nätaggregat skulle också räcka för den maximala förbrukningen
| Av/Standby | |
| Låg belastning | |
| Hög belastning |
|
Förklaring:
min: | |
| Lenovo ThinkPad P1 G4-20Y4S0KS00 i7-11850H, GeForce RTX 3070 Laptop GPU, Samsung PM9A1 MZVL21T0HCLR, IPS LED, 3840x2400, 16" | Lenovo ThinkPad P1 G4-20Y30017GE i7-11800H, T1200 Laptop GPU, Samsung PM9A1 MZVL2512HCJQ, IPS, 2560x1600, 16" | Dell Precision 5000 5560 i7-11850H, RTX A2000 Laptop GPU, Samsung PM9A1 MZVL22T0HBLB, IPS, 3840x2400, 15.6" | Apple MacBook Pro 16 2019 i9 5500M i9-9880H, Radeon Pro 5500M, Apple SSD AP1024 7171, IPS, 3072x1920, 16" | HP ZBook Studio 15 G8 i9-11950H, GeForce RTX 3070 Laptop GPU, Samsung PM981a MZVLB2T0HALB, OLED, 3840x2160, 15.6" | Lenovo ThinkPad X1 Extreme Gen3-20TLS0UV00 i7-10750H, GeForce GTX 1650 Ti Max-Q, Toshiba XG6 KXG6AZNV1T02, IPS, 1920x1080, 15.6" | Genomsnitt NVIDIA GeForce RTX 3070 Laptop GPU | Genomsnitt av klass Workstation | |
|---|---|---|---|---|---|---|---|---|
| Power Consumption | 23% | 17% | 31% | -16% | 32% | -36% | 6% | |
| Idle Minimum * (Watt) | 8.1 | 7.7 5% | 6.2 23% | 3.7 54% | 11 -36% | 5 38% | 15.6 ? -93% | 8.94 ? -10% |
| Idle Average * (Watt) | 20.2 | 11.8 42% | 13.9 31% | 12.1 40% | 18.8 7% | 9 55% | 20.1 ? -0% | 13.8 ? 32% |
| Idle Maximum * (Watt) | 21.9 | 12.4 43% | 23.8 -9% | 17 22% | 31.7 -45% | 12.2 44% | 29.4 ? -34% | 17.5 ? 20% |
| Load Average * (Watt) | 88.2 | 94.6 -7% | 95.7 -9% | 91.5 -4% | 105.2 -19% | 94.4 -7% | 110.8 ? -26% | 95 ? -8% |
| Witcher 3 ultra * (Watt) | 149 | 99.6 33% | 87 42% | 103 31% | 148 1% | 89 40% | ||
| Load Maximum * (Watt) | 170.6 | 134 21% | 132.6 22% | 102.3 40% | 171.8 -1% | 133.9 22% | 214 ? -25% | 175.2 ? -3% |
* ... mindre är bättre
Energiförbrukning: Witcher 3 / Stress-test
Batteriets livslängd
Det större batteriet, jämfört med föregångargenerationen, med en kapacitet på 90 watttimmar töms ganska snabbt av 4K-skärmens förbrukning. Lenovo ThinkPad P1 G4 håller i cirka sju timmar i Wi-Fi-testet när skärmen är inställd på 150 cd/m². Vid maximal ljusstyrka minskar batteritiden till fyra timmar. Modellen med en QHD-skärm är klart bättre lämpad för mobil användning - 4K ThinkPad lyckas trots allt slå de direkta arbetsstationsrivalerna Dell Precision 5560 och HP ZBook Studio 15 G8
| Lenovo ThinkPad P1 G4-20Y4S0KS00 i7-11850H, GeForce RTX 3070 Laptop GPU, 90 Wh | Lenovo ThinkPad P1 G4-20Y30017GE i7-11800H, T1200 Laptop GPU, 90 Wh | Dell Precision 5000 5560 i7-11850H, RTX A2000 Laptop GPU, 86 Wh | Apple MacBook Pro 16 2019 i9 5500M i9-9880H, Radeon Pro 5500M, 99.8 Wh | HP ZBook Studio 15 G8 i9-11950H, GeForce RTX 3070 Laptop GPU, 83 Wh | Lenovo ThinkPad X1 Extreme Gen3-20TLS0UV00 i7-10750H, GeForce GTX 1650 Ti Max-Q, 80 Wh | Genomsnitt av klass Workstation | |
|---|---|---|---|---|---|---|---|
| Batteridrifttid | 26% | 20% | 30% | 20% | 51% | 24% | |
| H.264 (h) | 7.2 | 9 25% | 9.7 35% | 12.2 69% | 9.51 ? 32% | ||
| WiFi v1.3 (h) | 7 | 9 29% | 6.3 -10% | 12 71% | 6.2 -11% | 11.6 66% | 8.53 ? 22% |
| Load (h) | 1.2 | 1.5 25% | 1.8 50% | 1 -17% | 1.8 50% | 1.4 17% | 1.429 ? 19% |
| Witcher 3 ultra (h) | 0.9 |
För
Emot
Omdöme: ThinkPad P1 Gen 4 - Bättre med starkare kylsystem

En gång med ångkammare, en gång utan (ThinkPad P1 med T1200): Lenovo ThinkPad P1 G4 har gått igenom vår testbana två gånger. Det stod snabbt klart vilken av de två versionerna som är bäst: den med ångkammare.
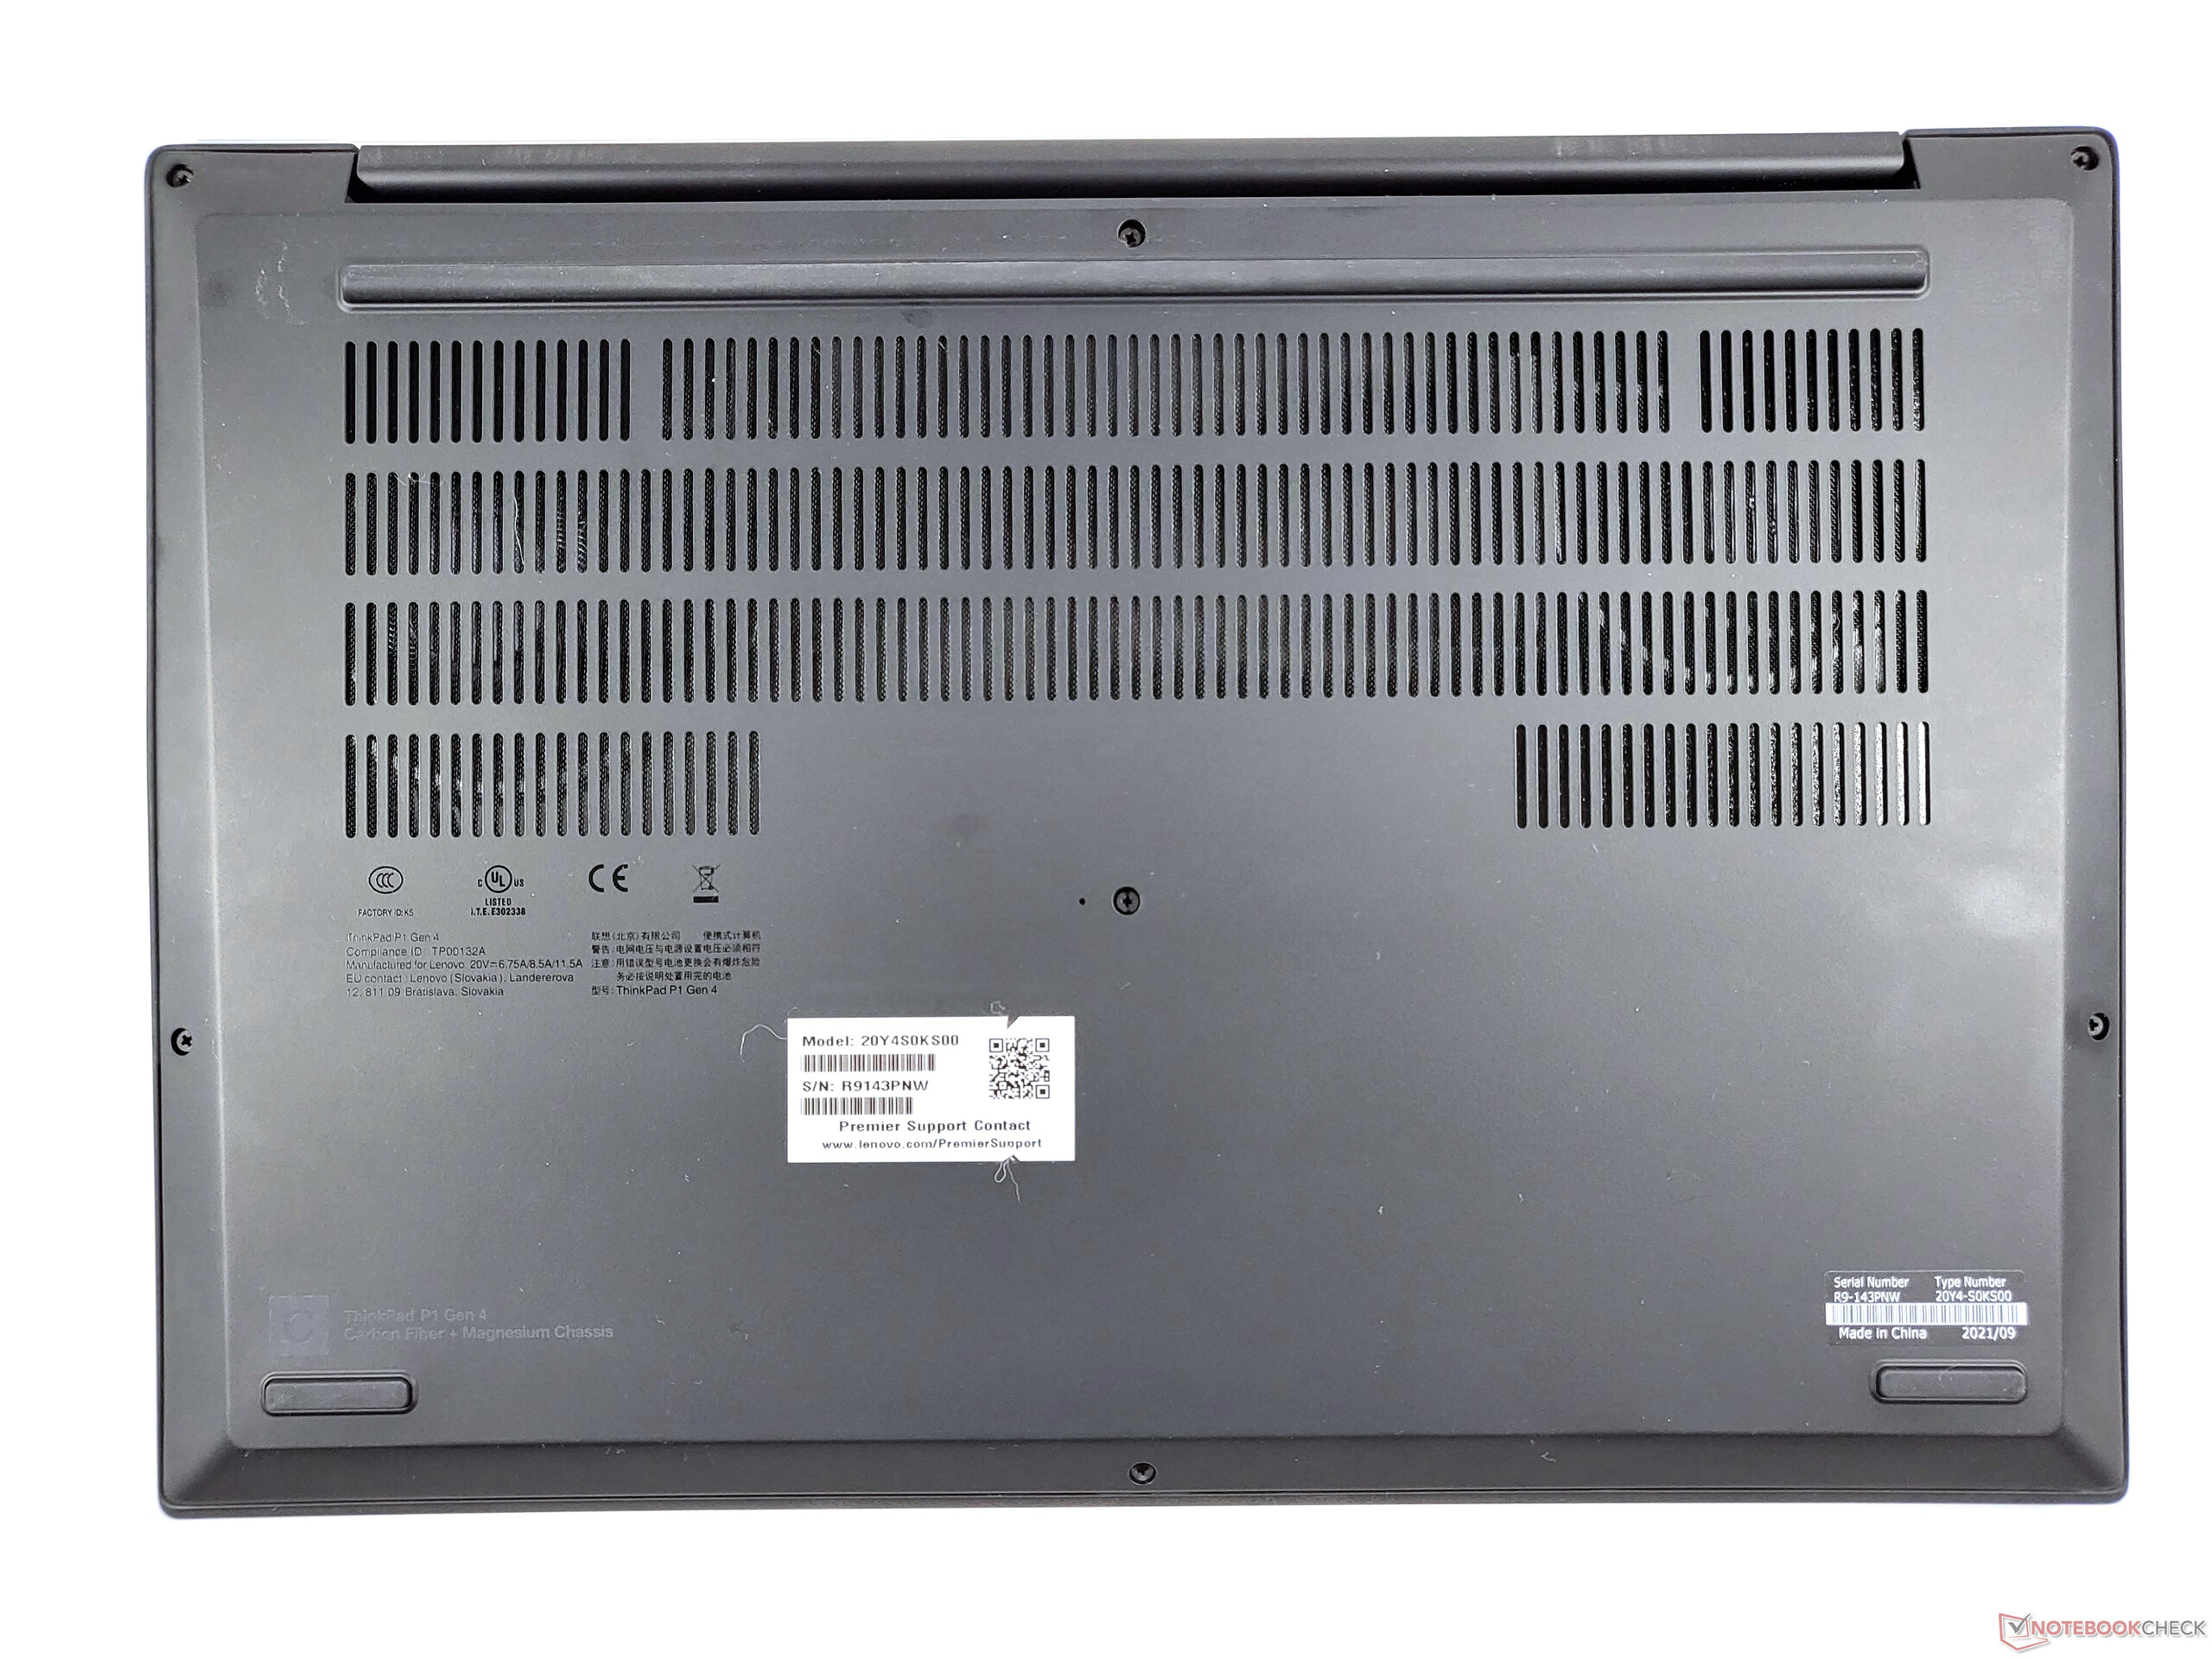
I dag är bra kylning förmodligen den viktigaste egenskapen för bärbara datorer med processorer från Intels H-serie. Den modell med ångkammare som testats här ger processorn en betydligt högre förbrukning än systermodellen med konventionell kylning. Prestandaskillnaden är betydande, varför slutsatsen måste baseras enbart på denna enda skillnad: Om du är intresserad av Lenovo ThinkPad P1 Gen 4, ta den med ångkammare - även om alternativen med en andra M.2-2280 SSD eller ett WWAN-modem går förlorade. Endast varianterna med GeForce RTX 3070, RTX 3080 samt Nvidia RTX A3000, A4000 och A5000 innehåller det bättre kylsystemet.
Vår slutsats är mindre tydlig när det gäller den testade enhetens andra stora skillnad: Detta är en av de bästa LCD-skärmarna som finns på något bärbar dator nu - men detta på bekostnad av batteritiden. Beroende på användarens prioriteringar kan QHD-skärmen mycket väl vara det bättre valet om man önskar uthållig drift utan ansluten strömförsörjning.
Ångkammare, ja tack: Kylsystemet i den här varianten av Lenovo ThinkPad P1 G4 är mycket bättre än kylsystemet på heatpipe-varianten.
Sammantaget förtjänar Lenovo ThinkPad P1 G4 helt klart vår rekommendation som en bärbar 16-tummare i toppklass. Priset är motsvarande högt, och är man villig att spendera så mycket pengar bör det definitivt vara på ångkammar-modellen.
De omedelbara arbetsstationsrivalerna är framför allt Dell Precision 5560 och HP ZBook Studio 15 G8, som båda har svagheter - den mer kompakta Precision har färre portar och levererar mindre prestanda, medan 16:9 och fastlött RAM inte nödvändigtvis talar för ZBook. Utanför Windows-sfären bör Apple MacBook Pro 16 nämnas; en jämförelse med den nya modellen med M1 Max kommer att vara av särskilt intresse här.
Pris och tillgänglighet
Den testade Lenovo ThinkPad P1 2021 kostar 2 850 euro (~3 266 dollar)på Campuspoint. Det är en specialmodell som är exklusivt tillgänglig i Lenovos Campusprogram för studenter, praktikanter och andra berättigade personer. Samma konfiguration kostar 3 982 euro (~4 564 dollar) i Lenovo Store
Lenovo ThinkPad P1 G4-20Y4S0KS00
- 10/25/2021 v7 (old)
Benjamin Herzig
Price comparison
