Recension av Dell Precision 5470 - Debut för Nvidia RTX A1000
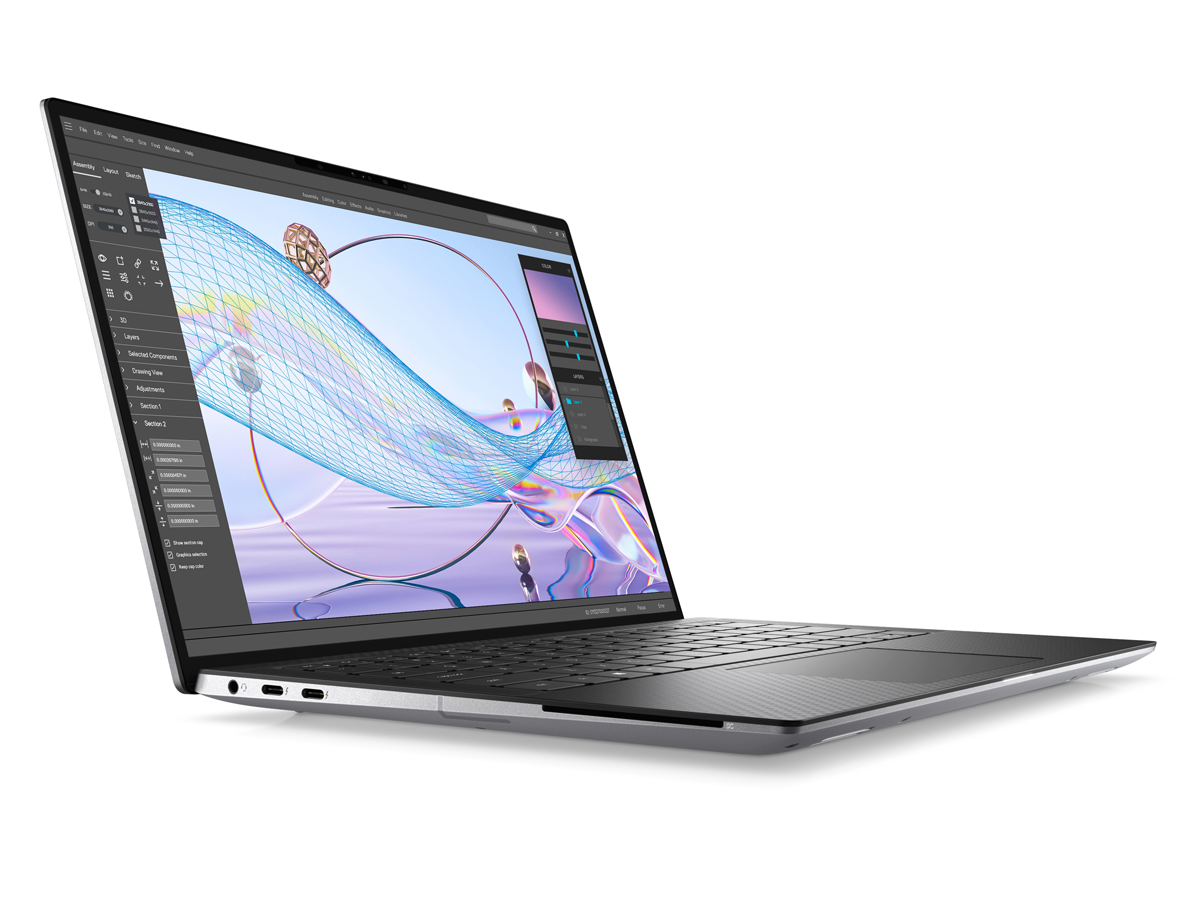
Precision 5470 är Dells minsta mobila arbetsstation hittills. I likhet med den XPS 17-inspirerade Precision 5750 och XPS 15-inspirerade Precision 5560är 14-tums Precision 5470 inspirerad av XPS 13 9300/9310 när det gäller utseende och design. Om du har lekt med ett XPS-system tidigare bör Precision 5470 se ut och kännas väldigt bekant.
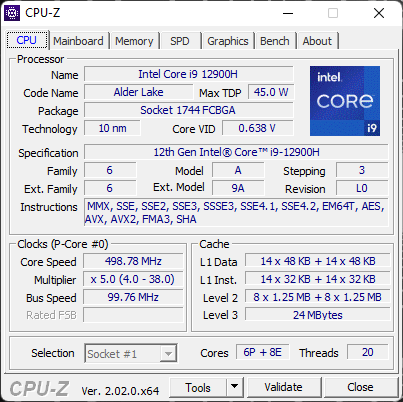
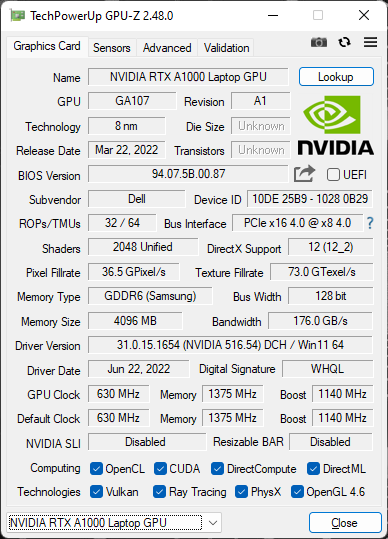
De två utmärkande faktorerna för Precision 5470 är den 12:e generationens Core H-series CPU och den valfria Nvidia RTX A1000 GPU:n som ger en enorm processorkraft med tanke på den 14-tums formfaktorn. Vår särskilda recensionsenhet kommer med Core i9-12900H CPU, A1000 GPU och 1600p glansig pekskärm för cirka 3000 USD i detaljhandelspris. Andra SKU:er med i5-12500H till i7-12800H, endast integrerad Iris Xe-grafik och matt 1200p-skärm finns också tillgängliga för lägre utgångspriser.
Bland de direkta konkurrenterna finns andra mobila 14-tums arbetsstationer av hög kvalitet som t.ex HP ZBook Firefly 14 eller Lenovo ThinkPad P14. Denna storlekskategori är fortfarande ny när det gäller arbetsstationer och därför kommer vi också att jämföra Precision 5470 med några större modeller som t.ex ThinkPad P15 G2 eller Dells egen Precision 5560.
Fler recensioner av Dell:
Potentiella konkurrenter i jämförelse
Gradering | Datum | Modell | Vikt | Höjd | Storlek | Upplösning | Pris |
|---|---|---|---|---|---|---|---|
| 87.6 % v7 (old) | 09/2022 | Dell Precision 5000 5470 i9-12900H, RTX A1000 Laptop GPU | 1.6 kg | 18.95 mm | 14.00" | 2560x1600 | |
| 86.2 % v7 (old) | 06/2022 | Lenovo ThinkPad P15v G2 21A9000XGE i7-11800H, T1200 Laptop GPU | 2.3 kg | 22.7 mm | 15.60" | 1920x1080 | |
| 88.3 % v7 (old) | 12/2021 | Dell Precision 5000 5560 i7-11850H, RTX A2000 Laptop GPU | 2 kg | 18 mm | 15.60" | 3840x2400 | |
| 85.2 % v7 (old) | 09/2021 | Lenovo ThinkPad P14s G2 AMD R7 PRO 5850U, Vega 8 | 1.5 kg | 17.9 mm | 14.00" | 3840x2160 | |
| 85.2 % v7 (old) | 09/2021 | HP ZBook Firefly 14 G8 2C9Q2EA i7-1165G7, T500 Laptop GPU | 1.4 kg | 17.9 mm | 14.00" | 1920x1080 | |
| 82.4 % v7 (old) | HP ZBook Firefly 14 G7 i7-10610U, Quadro P520 | 1.4 kg | 17.9 mm | 14.00" | 1920x1080 |
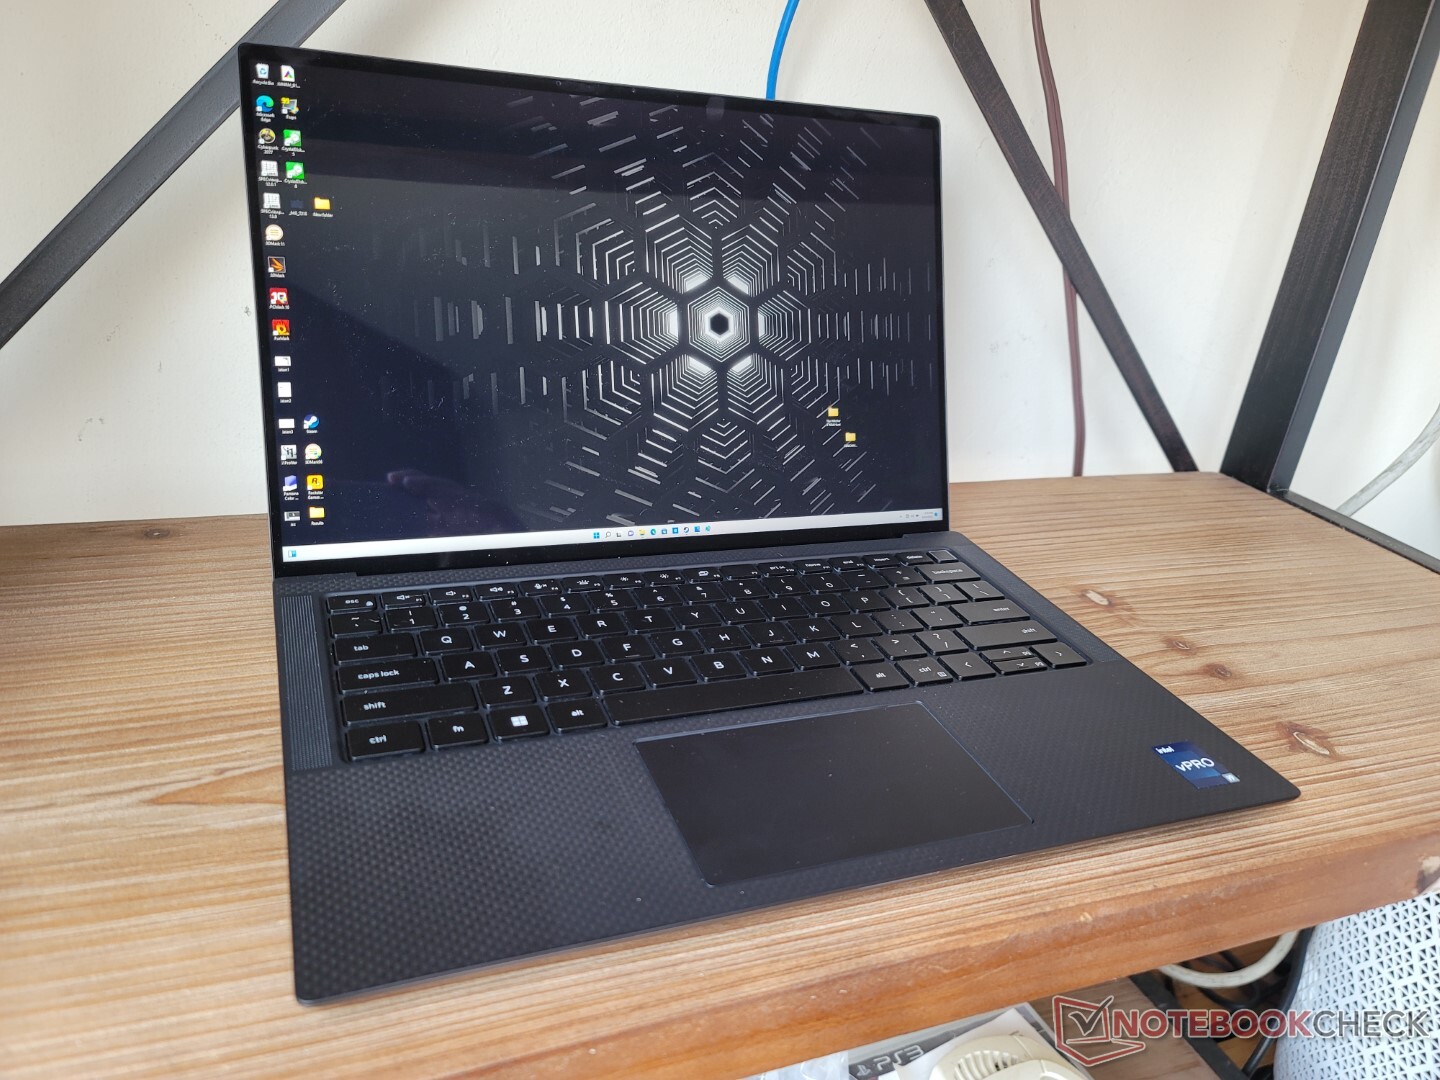
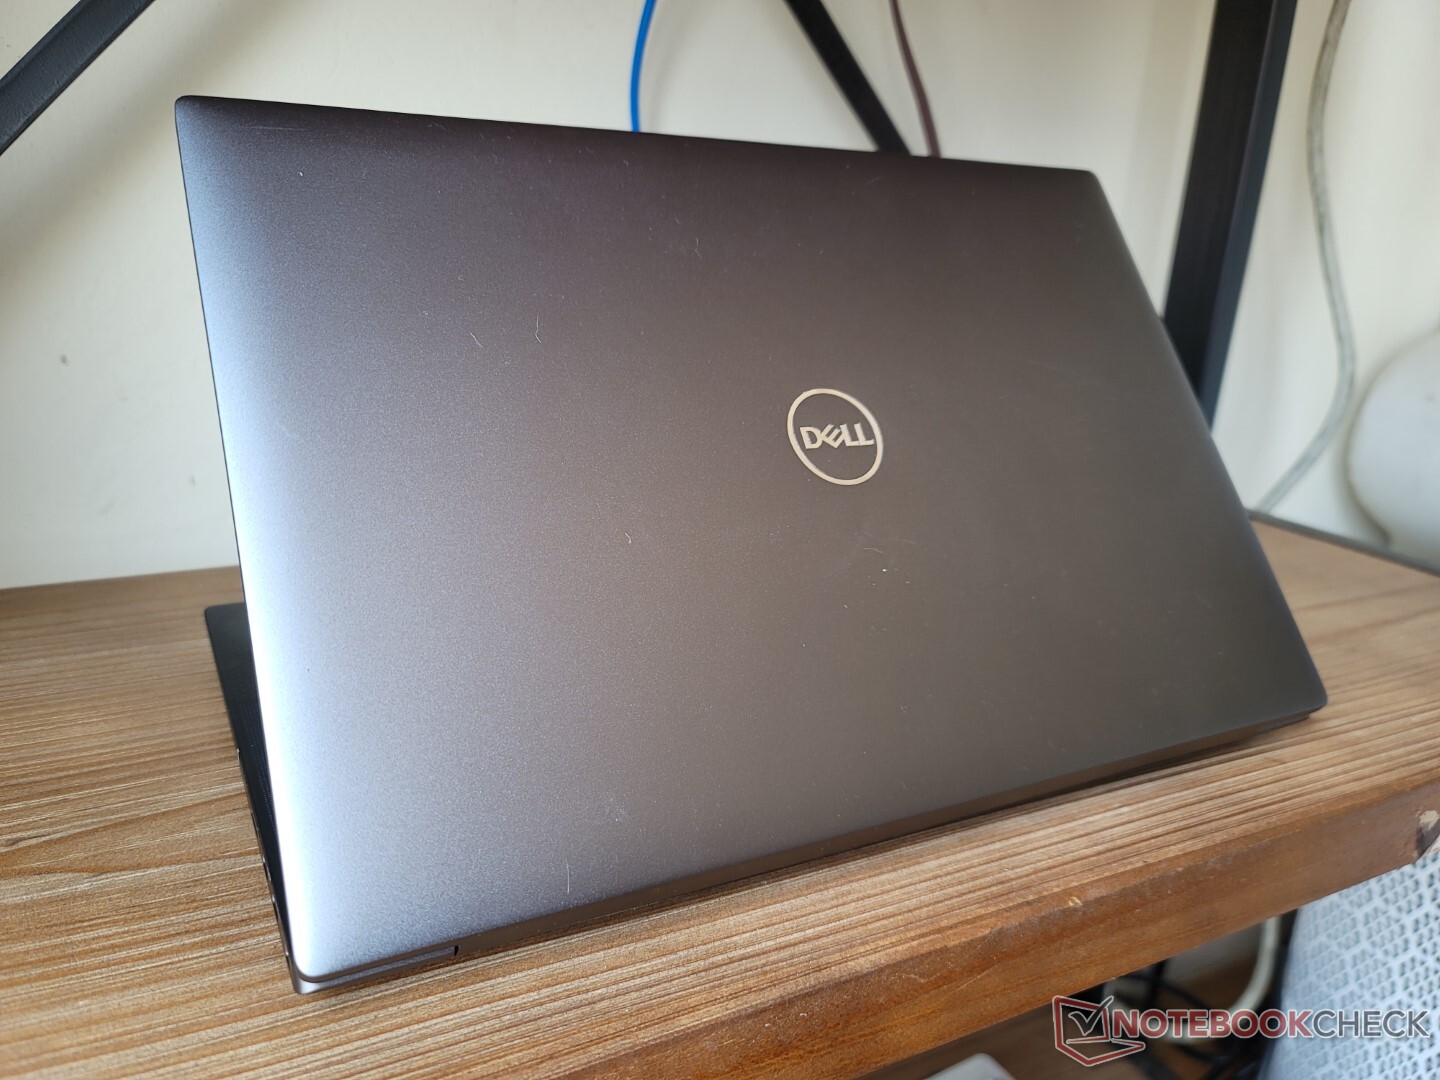
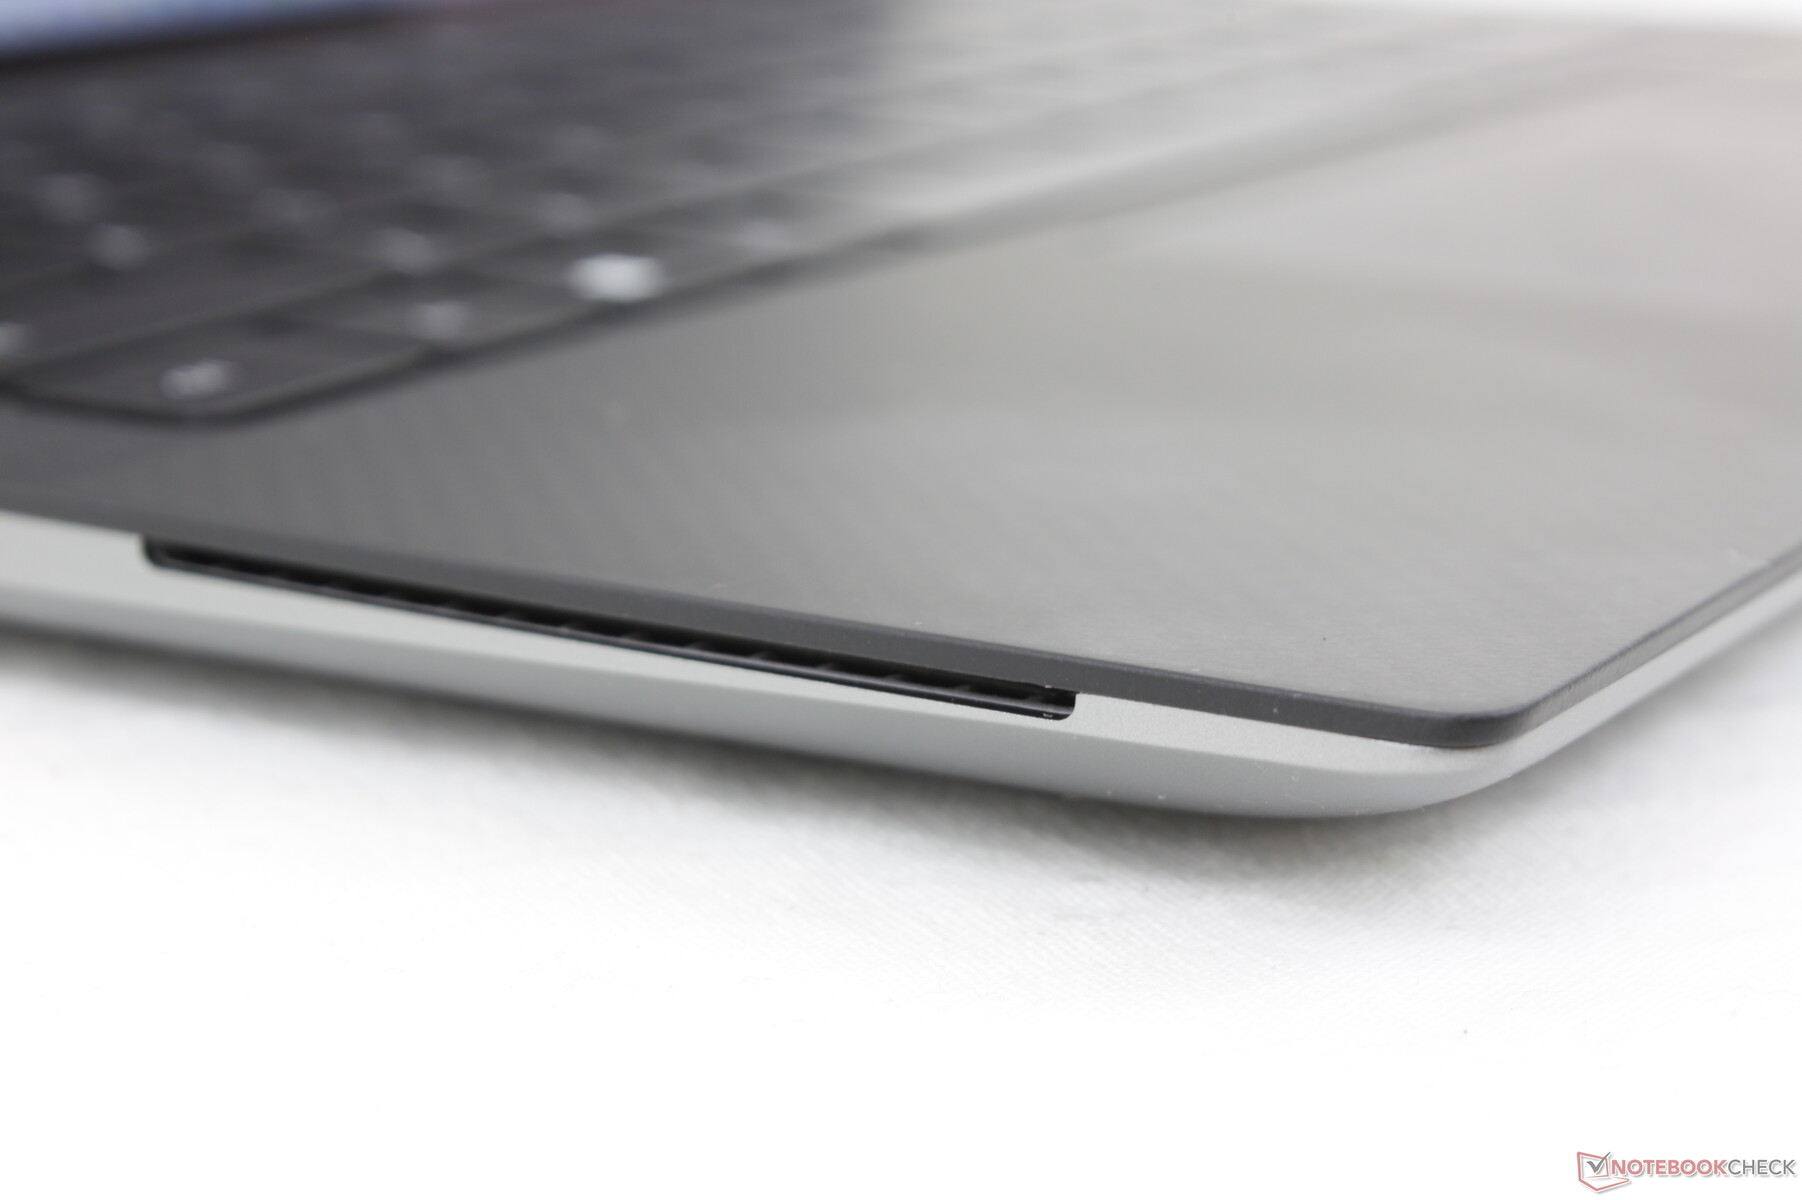
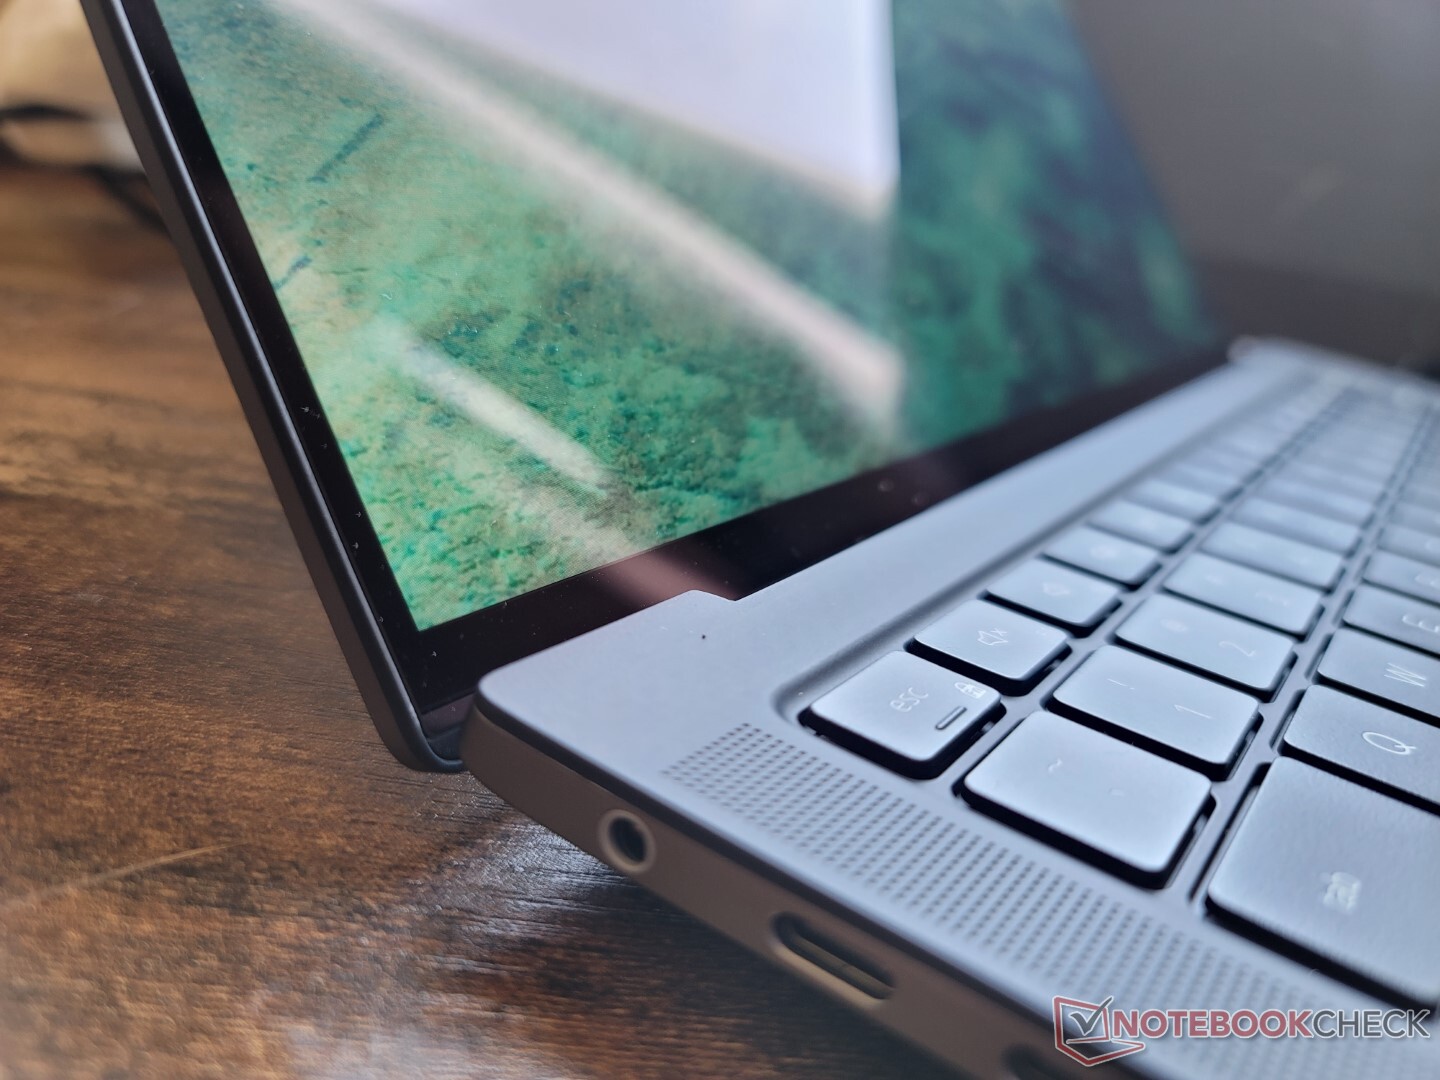
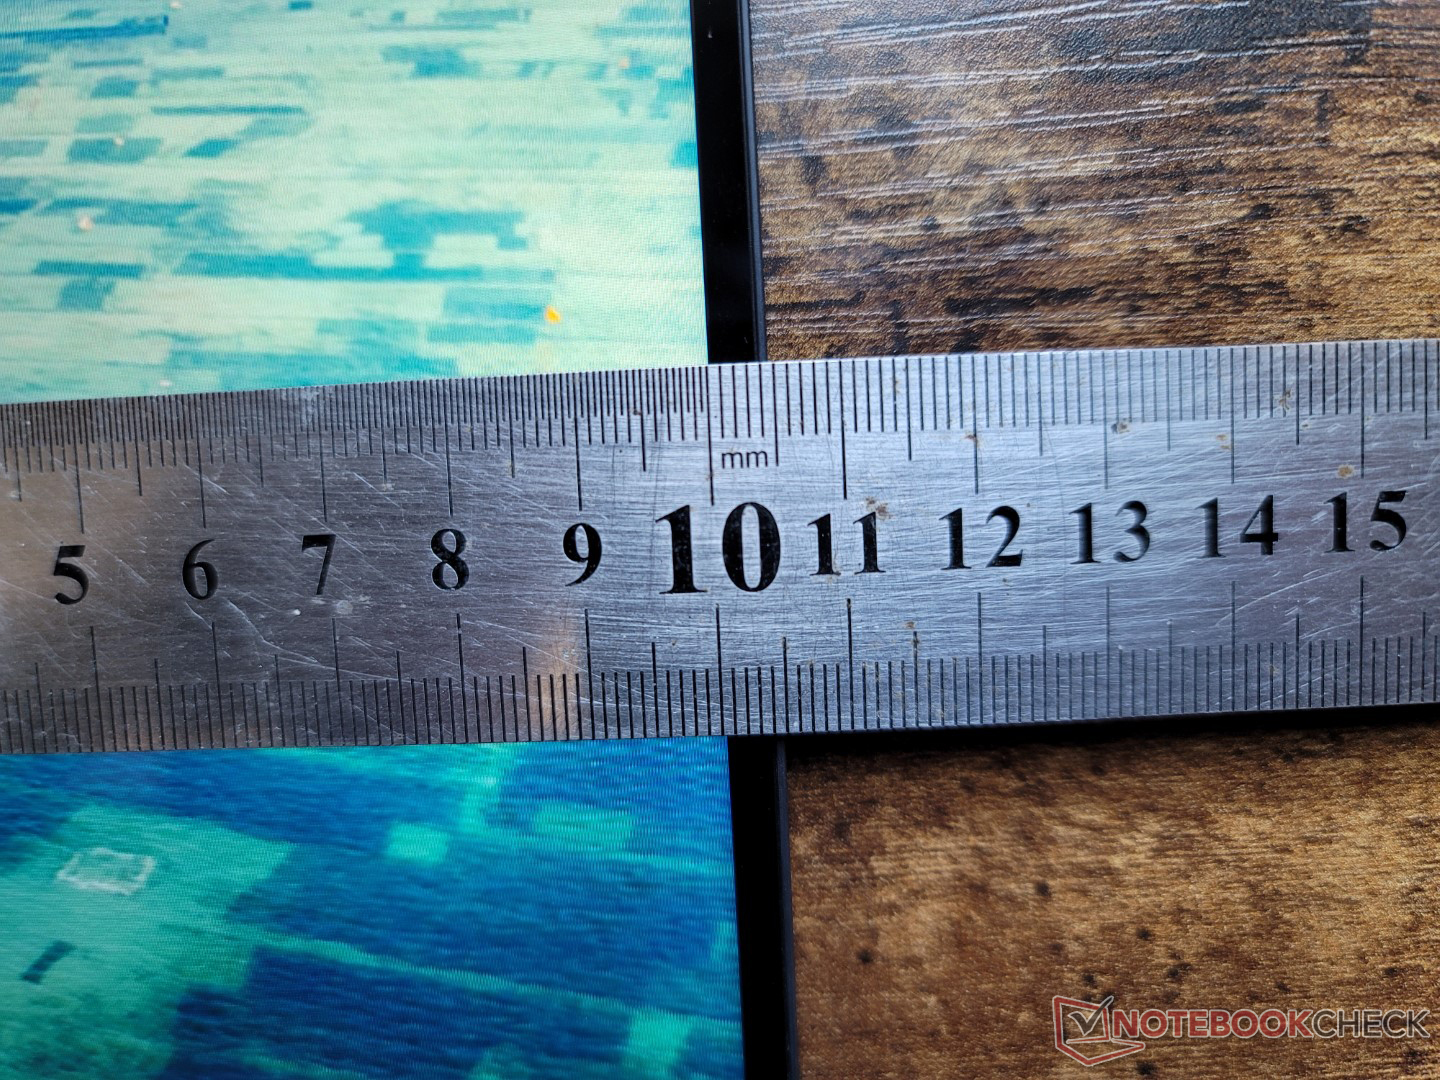
Hölje - XPS-utseende och känsla
I skrivande stund finns det ingen XPS 14, men Precision 5470 är i princip föregångaren till en sådan. Den sitter bekvämt mellan den klassiska 13-tums XPS 13 och 15-tums XPS 13 XPS 15 samtidigt som den använder sig av samma gråa skal av magnesiumlegering och kolfiberdäck som har blivit standard på XPS-modellerna.
Chassiskvaliteten är utmärkt med endast mindre knarrande eller skevhet när man försöker vrida eller böja dess ytor. Det känns definitivt starkare och mer professionellt än nya XPS 13 9320 design. Trots detta kunde gångjärnen ha varit styvare eller mer styva för en bättre känsla av livslängd.
Den 14-tums Precision 5470 är större och tyngre än den 13-tums XPS 13 9300 med märkbara marginaler. Den är till och med lite tjockare än XPS 15 samtidigt som den i vikt ligger närmare XPS 15 än XPS 13. Den är ändå mycket kompakt för sin klass ändå, särskilt när det gäller fotavtrycket jämfört med HP Firefly 14 G8 eller ThinkPad P14s.
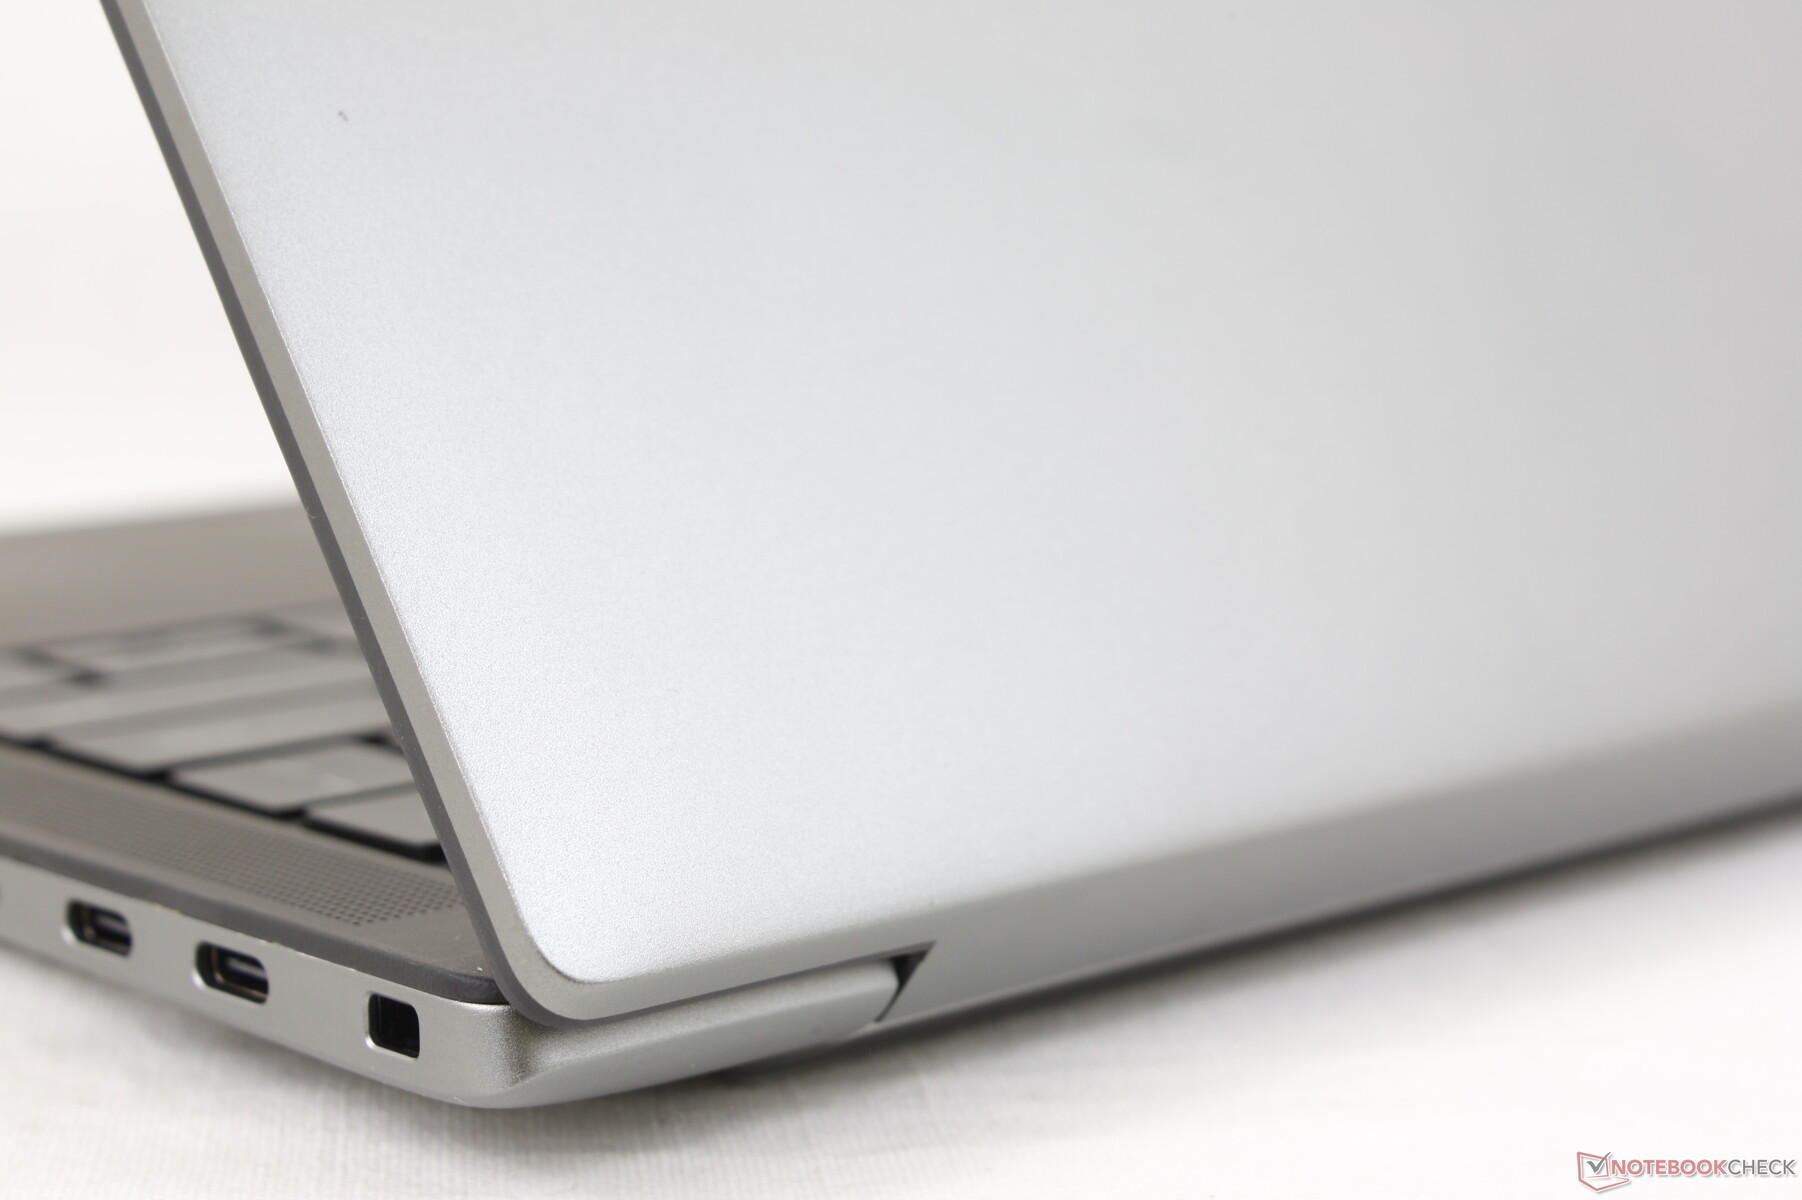
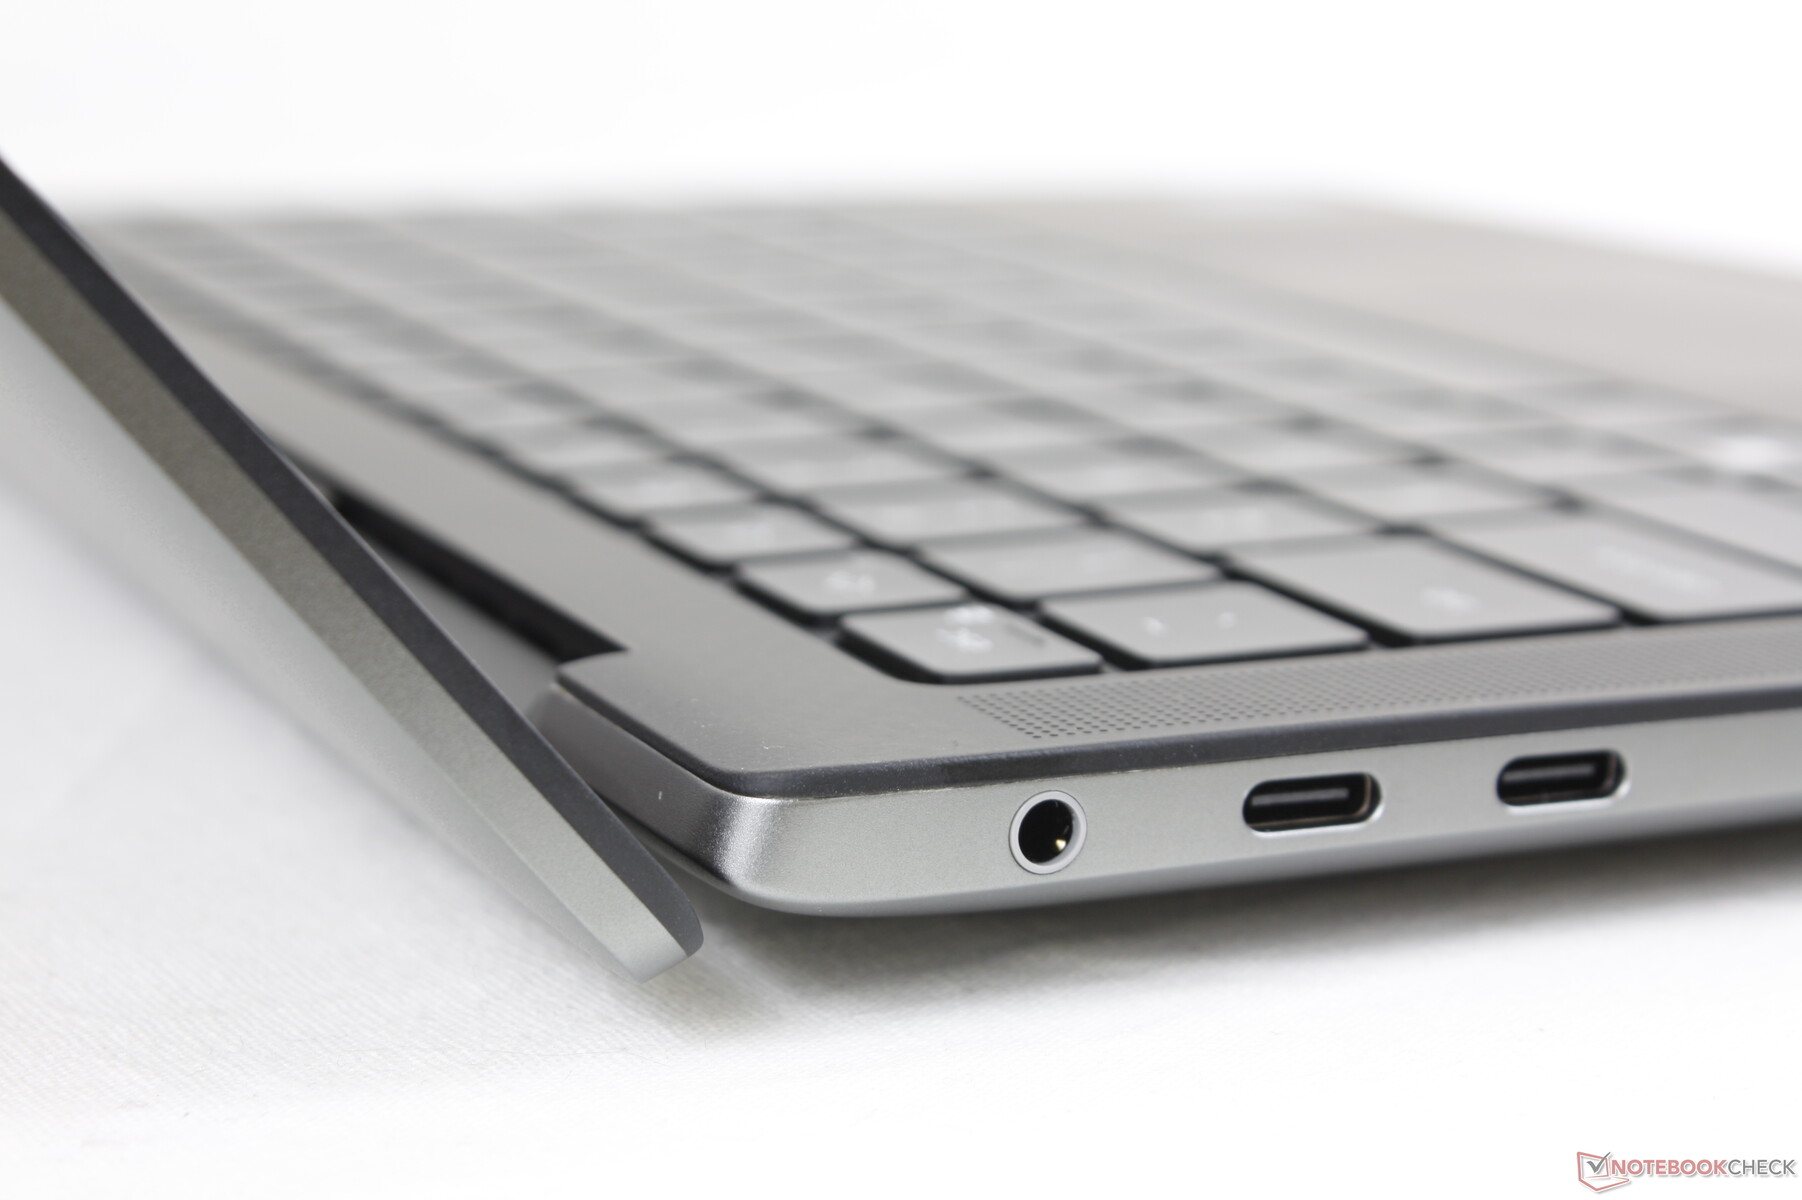
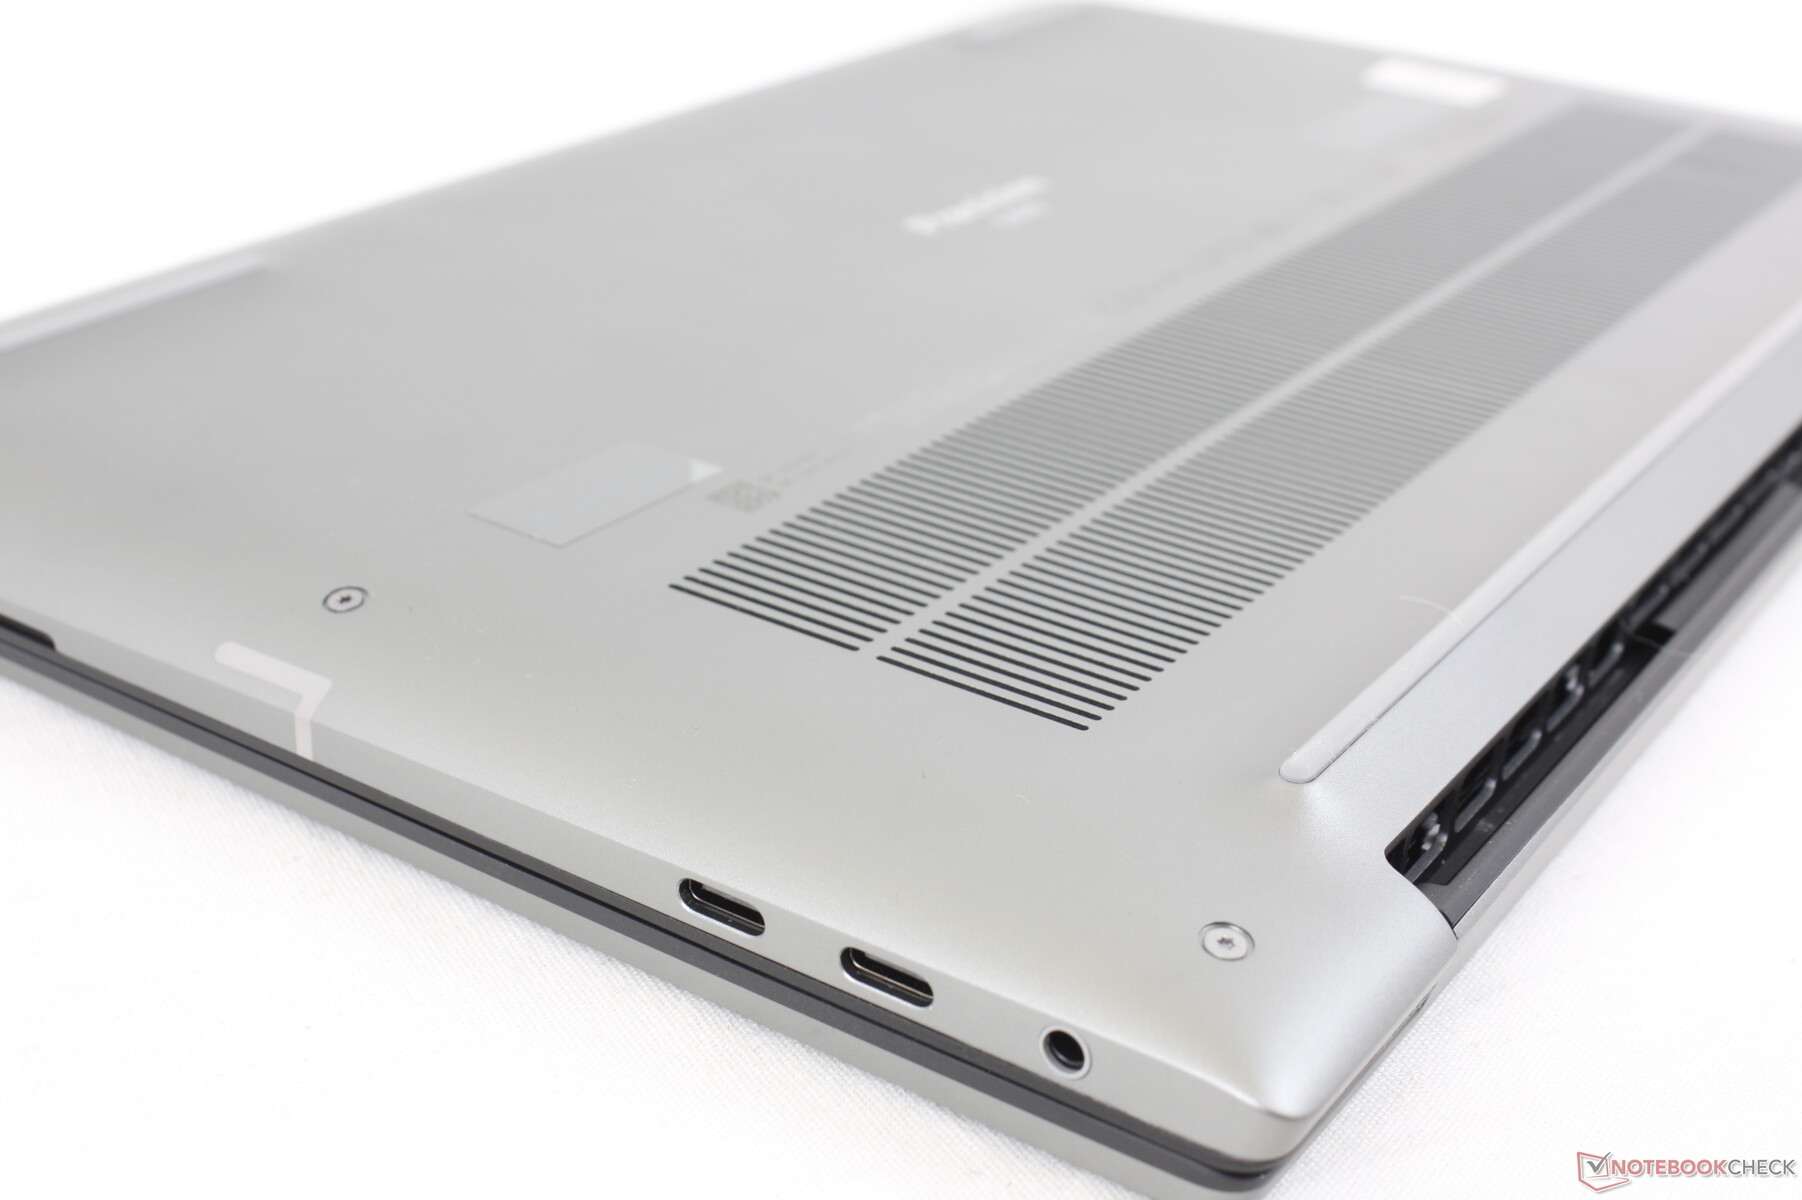
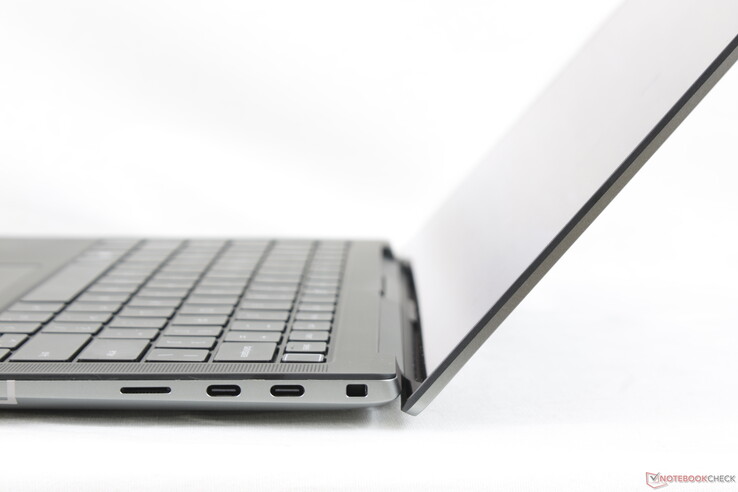
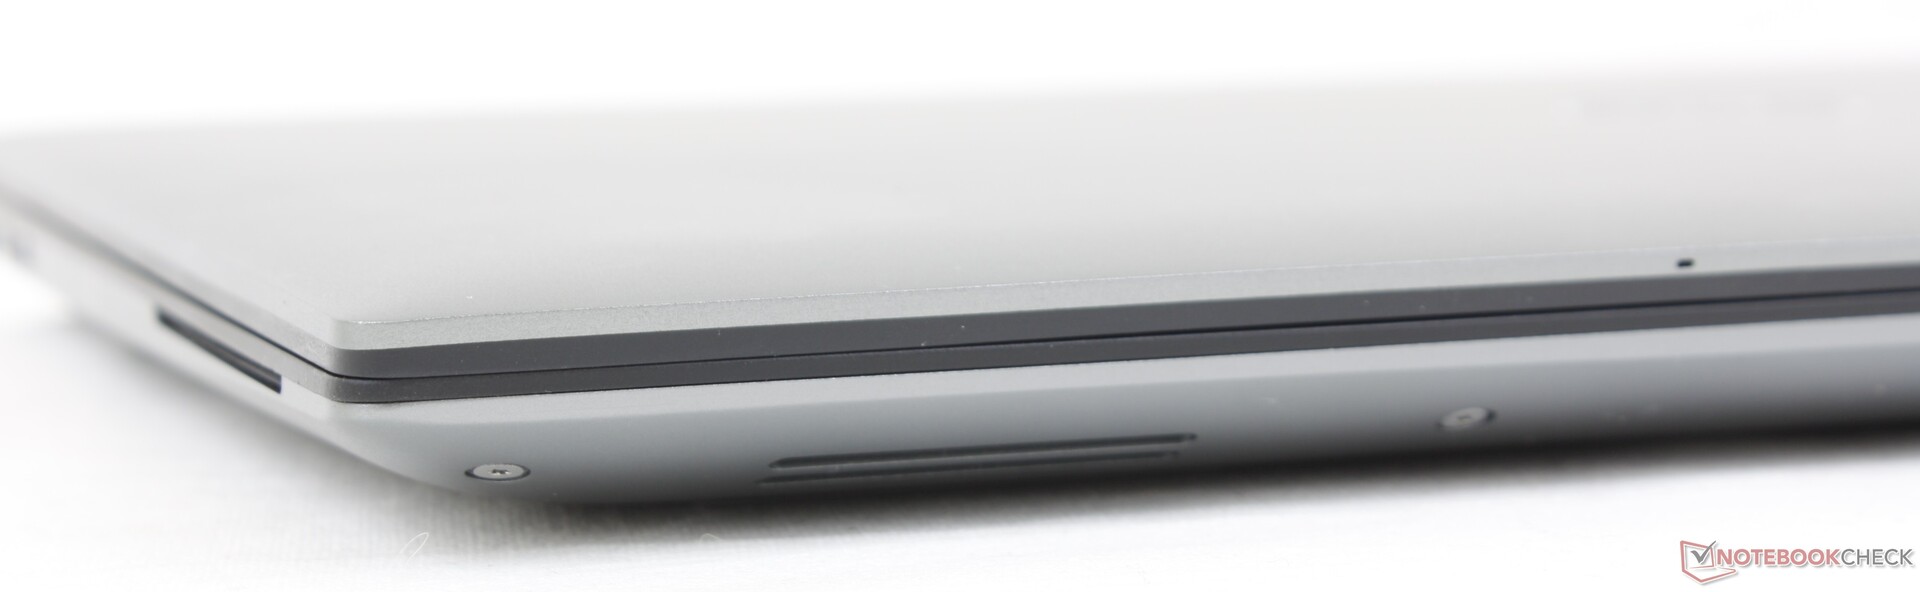
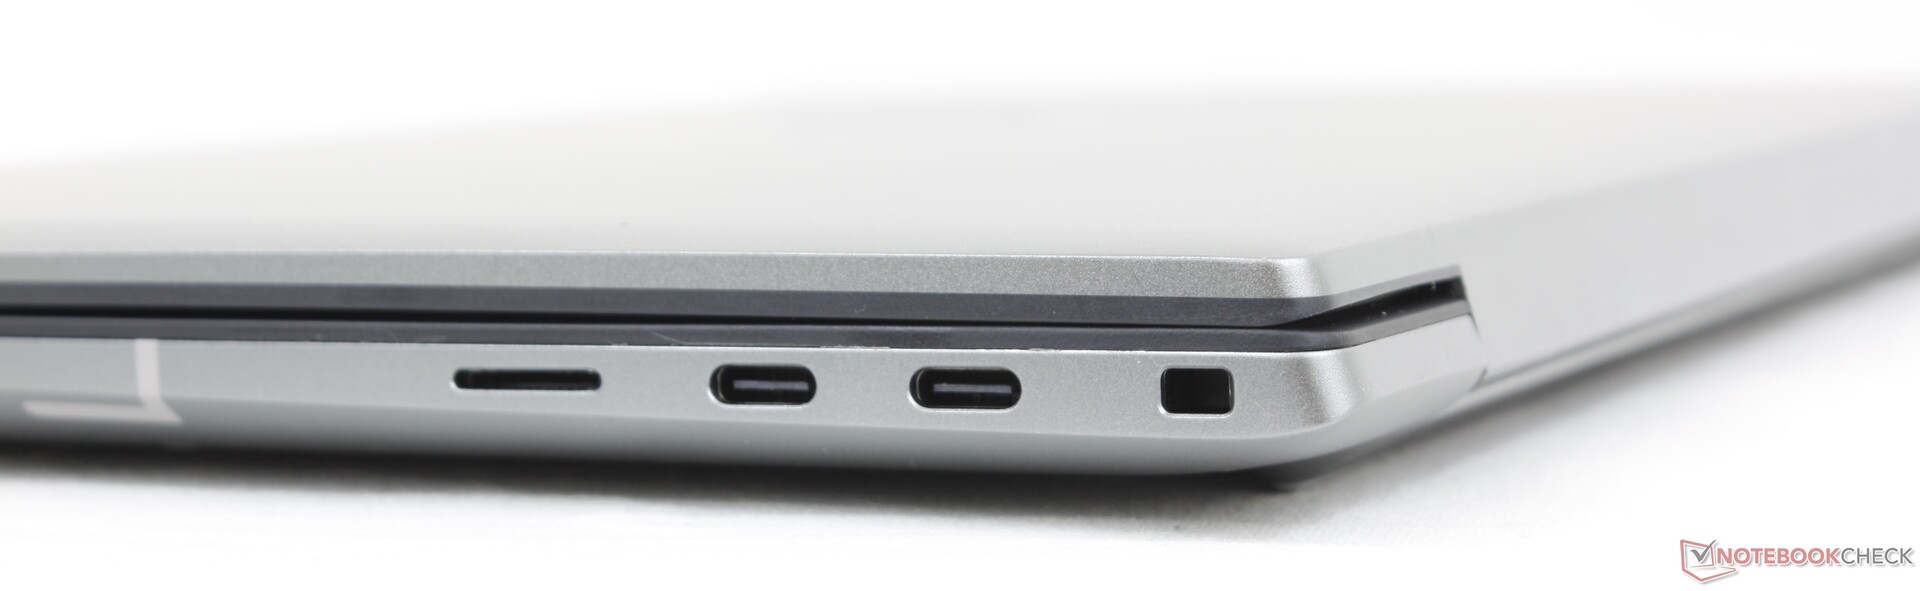
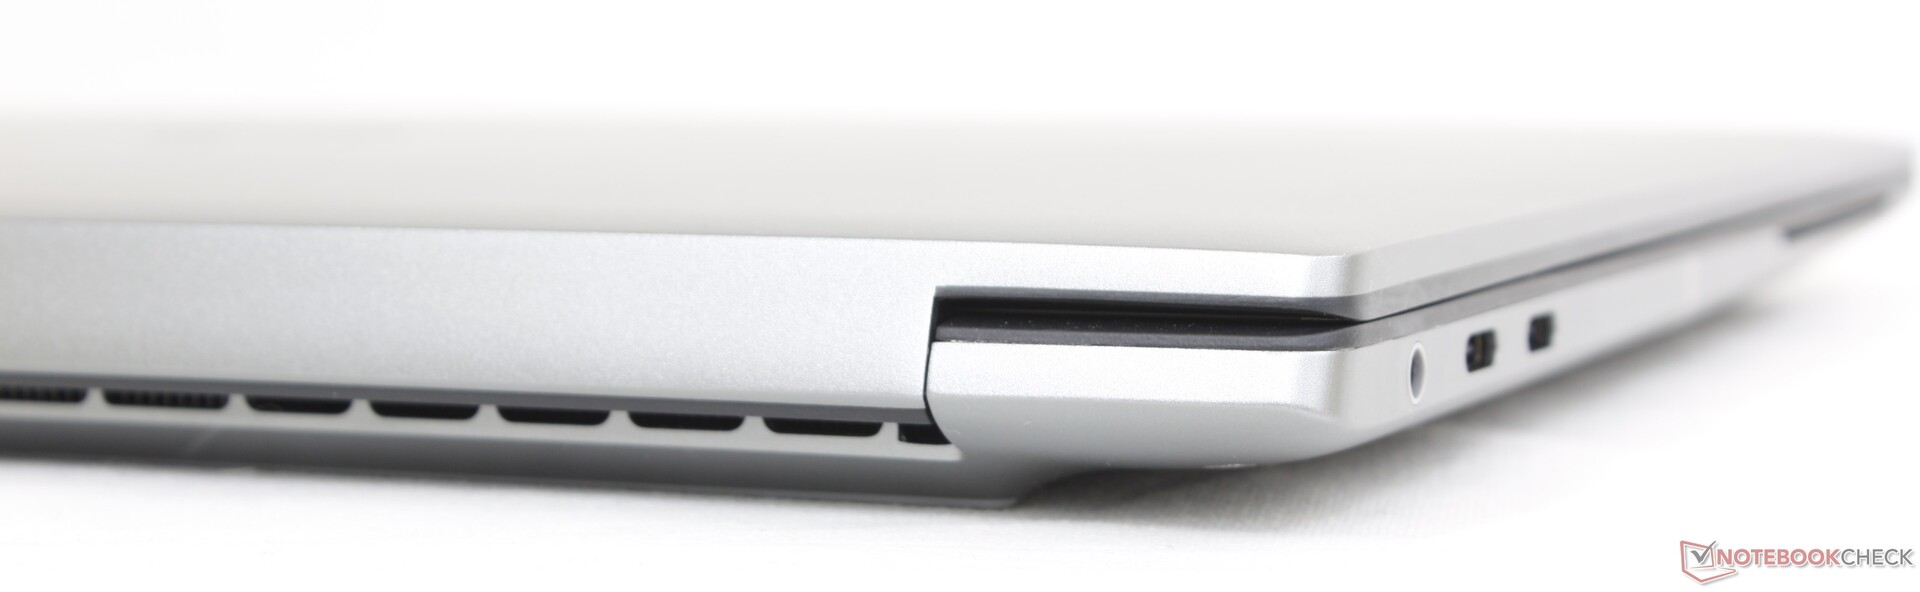
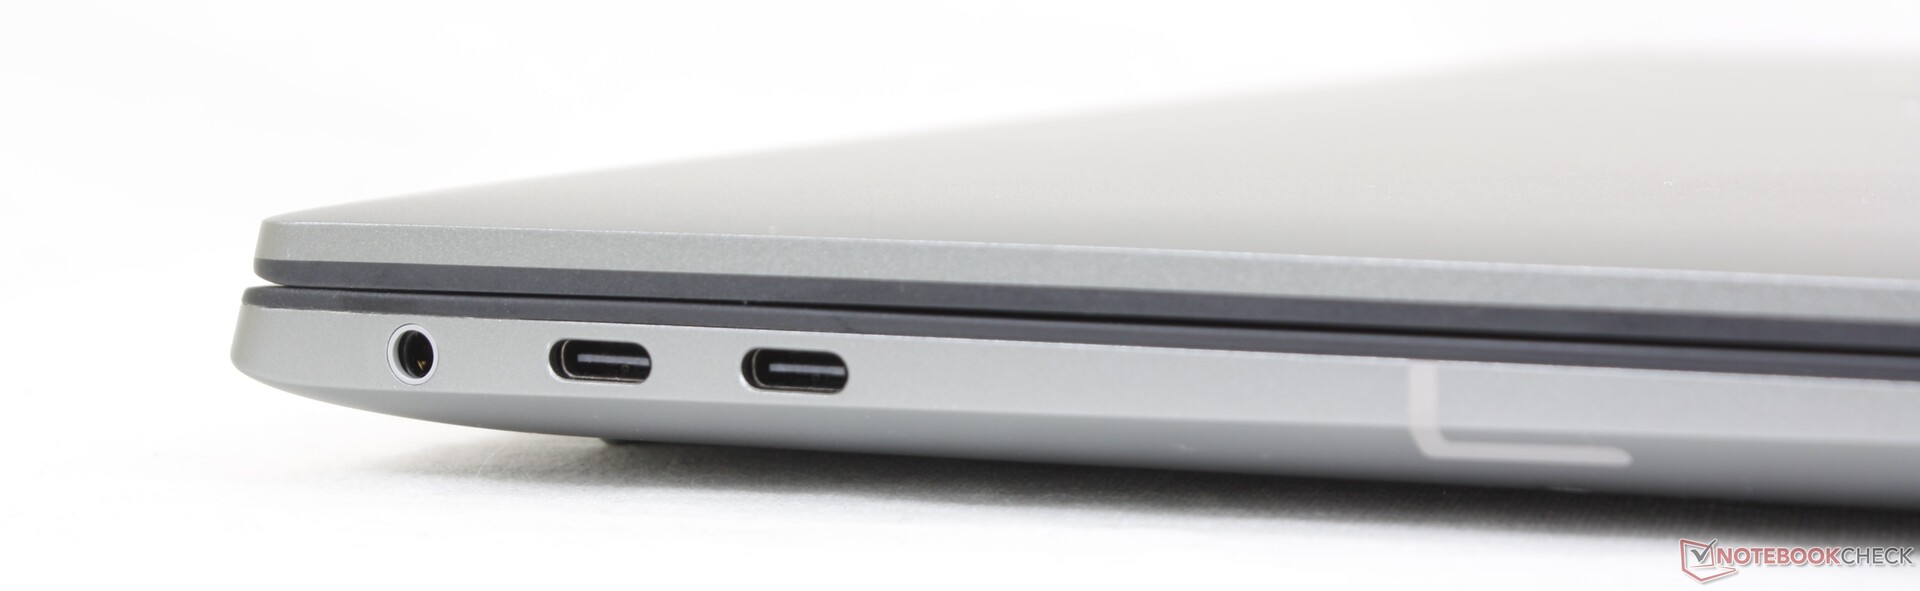
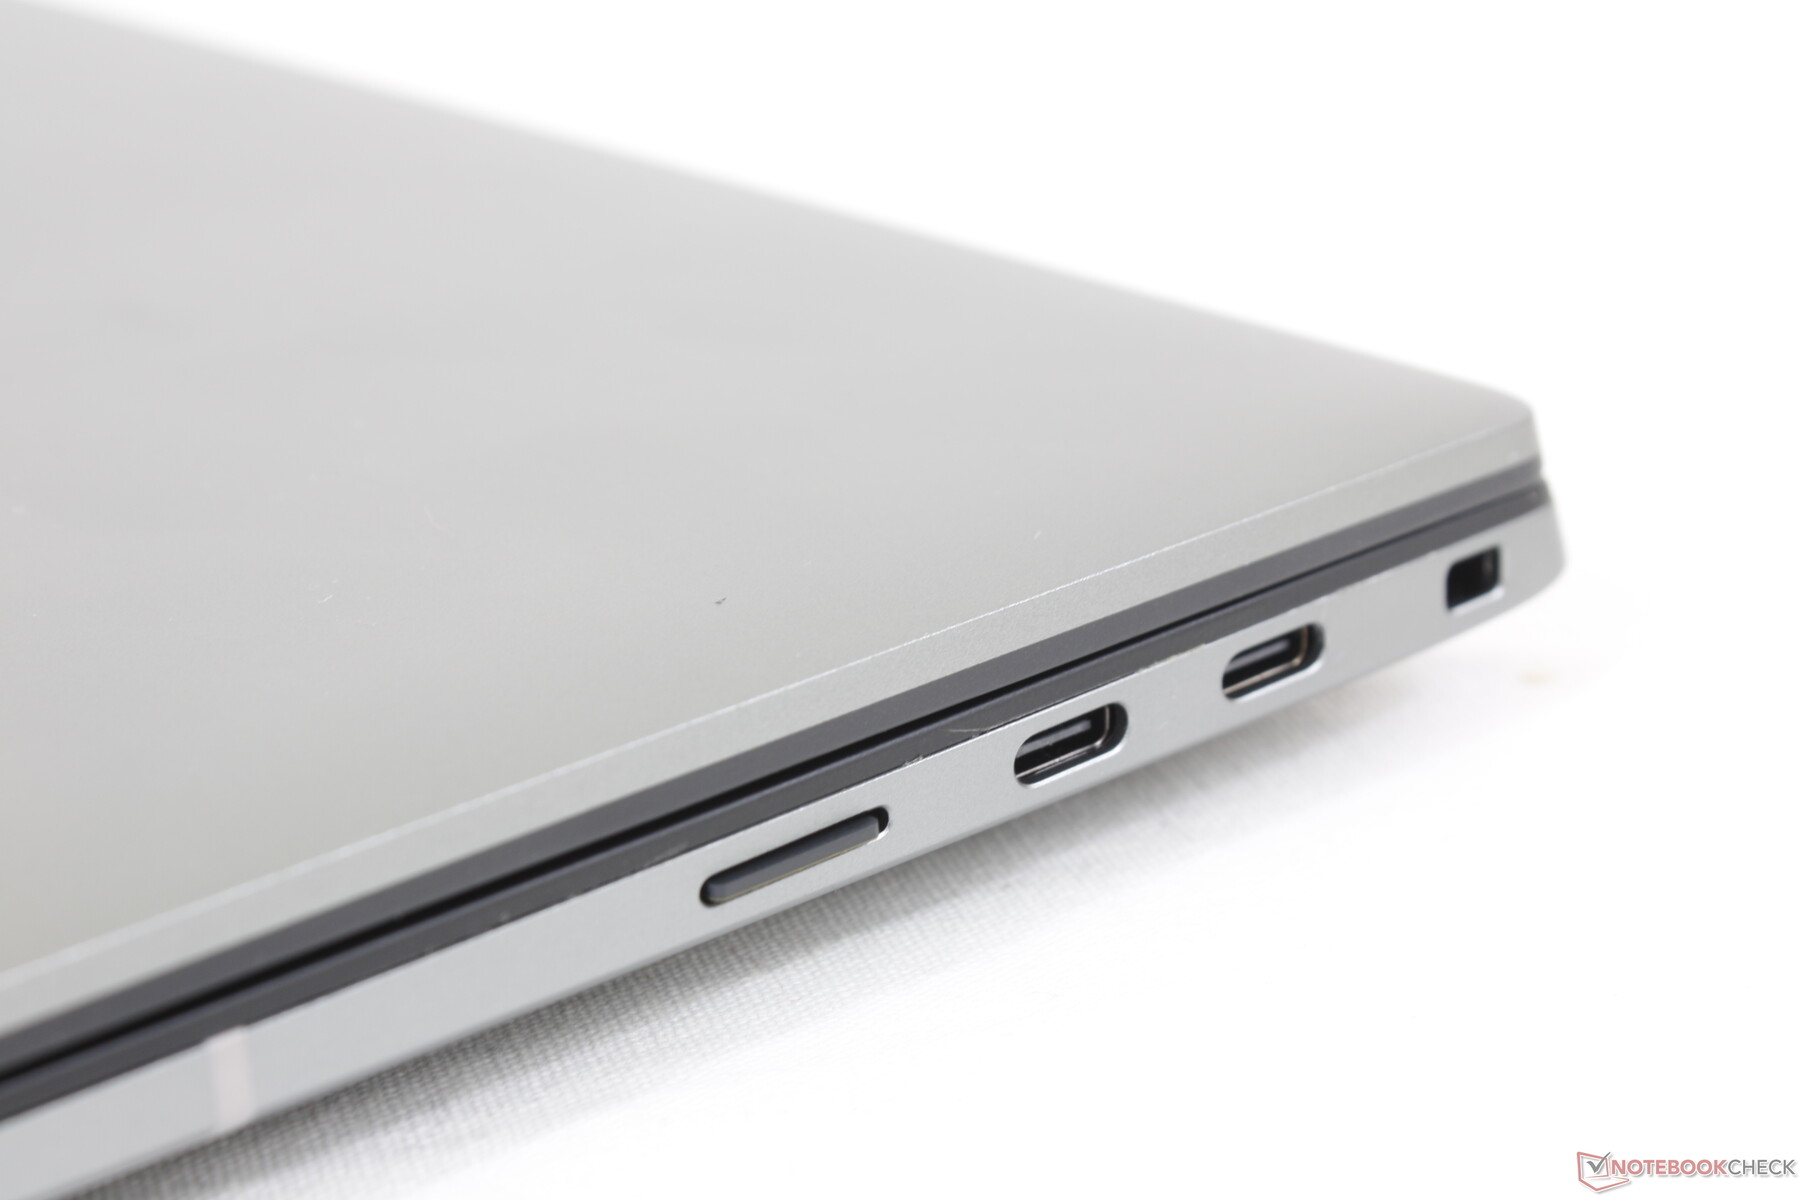
Anslutningar - Endast USB-C
Portalternativen är begränsade till endast USB-C, medan de flesta arbetsstationer har ett mycket större utbud. Precision 5470-ägare förväntas därför förlita sig på adaptrar eller dockningsstationer för att ansluta de flesta enheter.
SD-kortläsare
Överföringshastigheten från den integrerade kortläsaren är mycket snabb med nästan 230 MB/s från vårt UHS-II-testkort. Beroende på filstorleken kan dock den faktiska överföringshastigheten vara lägre. Att flytta 1 GB bilder (~4 MB vardera) är långsammare och tar cirka 13 sekunder.
| SD Card Reader | |
| average JPG Copy Test (av. of 3 runs) | |
| Dell Precision 5000 5560 (AV Pro V60) | |
| Lenovo ThinkPad P15v G2 21A9000XGE | |
| Dell Precision 5000 5470 (AV Pro V60) | |
| Lenovo ThinkPad P14s G2 AMD (AV PRO V60) | |
| maximum AS SSD Seq Read Test (1GB) | |
| Lenovo ThinkPad P15v G2 21A9000XGE | |
| Dell Precision 5000 5470 (AV Pro V60) | |
| Dell Precision 5000 5560 (AV Pro V60) | |
| Lenovo ThinkPad P14s G2 AMD (AV PRO V60) | |
Kommunikation
En Intel AX211 är standard för Wi-Fi 6E och Bluetooth 5.2. Vi upplevde inga märkbara problem, men överföringshastigheterna var långsammare och mer varierande än väntat.
| Networking | |
| iperf3 transmit AX12 | |
| Lenovo ThinkPad P15v G2 21A9000XGE | |
| HP ZBook Firefly 14 G8 2C9Q2EA | |
| HP ZBook Firefly 14 G7 | |
| Dell Precision 5000 5560 | |
| Lenovo ThinkPad P14s G2 AMD | |
| iperf3 receive AX12 | |
| HP ZBook Firefly 14 G8 2C9Q2EA | |
| Lenovo ThinkPad P15v G2 21A9000XGE | |
| Dell Precision 5000 5560 | |
| HP ZBook Firefly 14 G7 | |
| Lenovo ThinkPad P14s G2 AMD | |
| iperf3 receive AXE11000 6GHz | |
| Dell Precision 5000 5470 | |
| iperf3 transmit AXE11000 6GHz | |
| Dell Precision 5000 5470 | |
Webbkamera
Webbkameran är begränsad till endast 1 MP eller 720p, medan de flesta andra bärbara datorer redan har gått över till 2 MP eller till och med 5 MP, vilket är fallet med många bärbara HP-datorer i den övre prisklassen. Bildkvaliteten är slamrig, precis som på webbkameran på XPS 13-serien
IR finns med för stöd för Hello, men det finns ingen stängare för webbkameran för att skydda privatlivet.


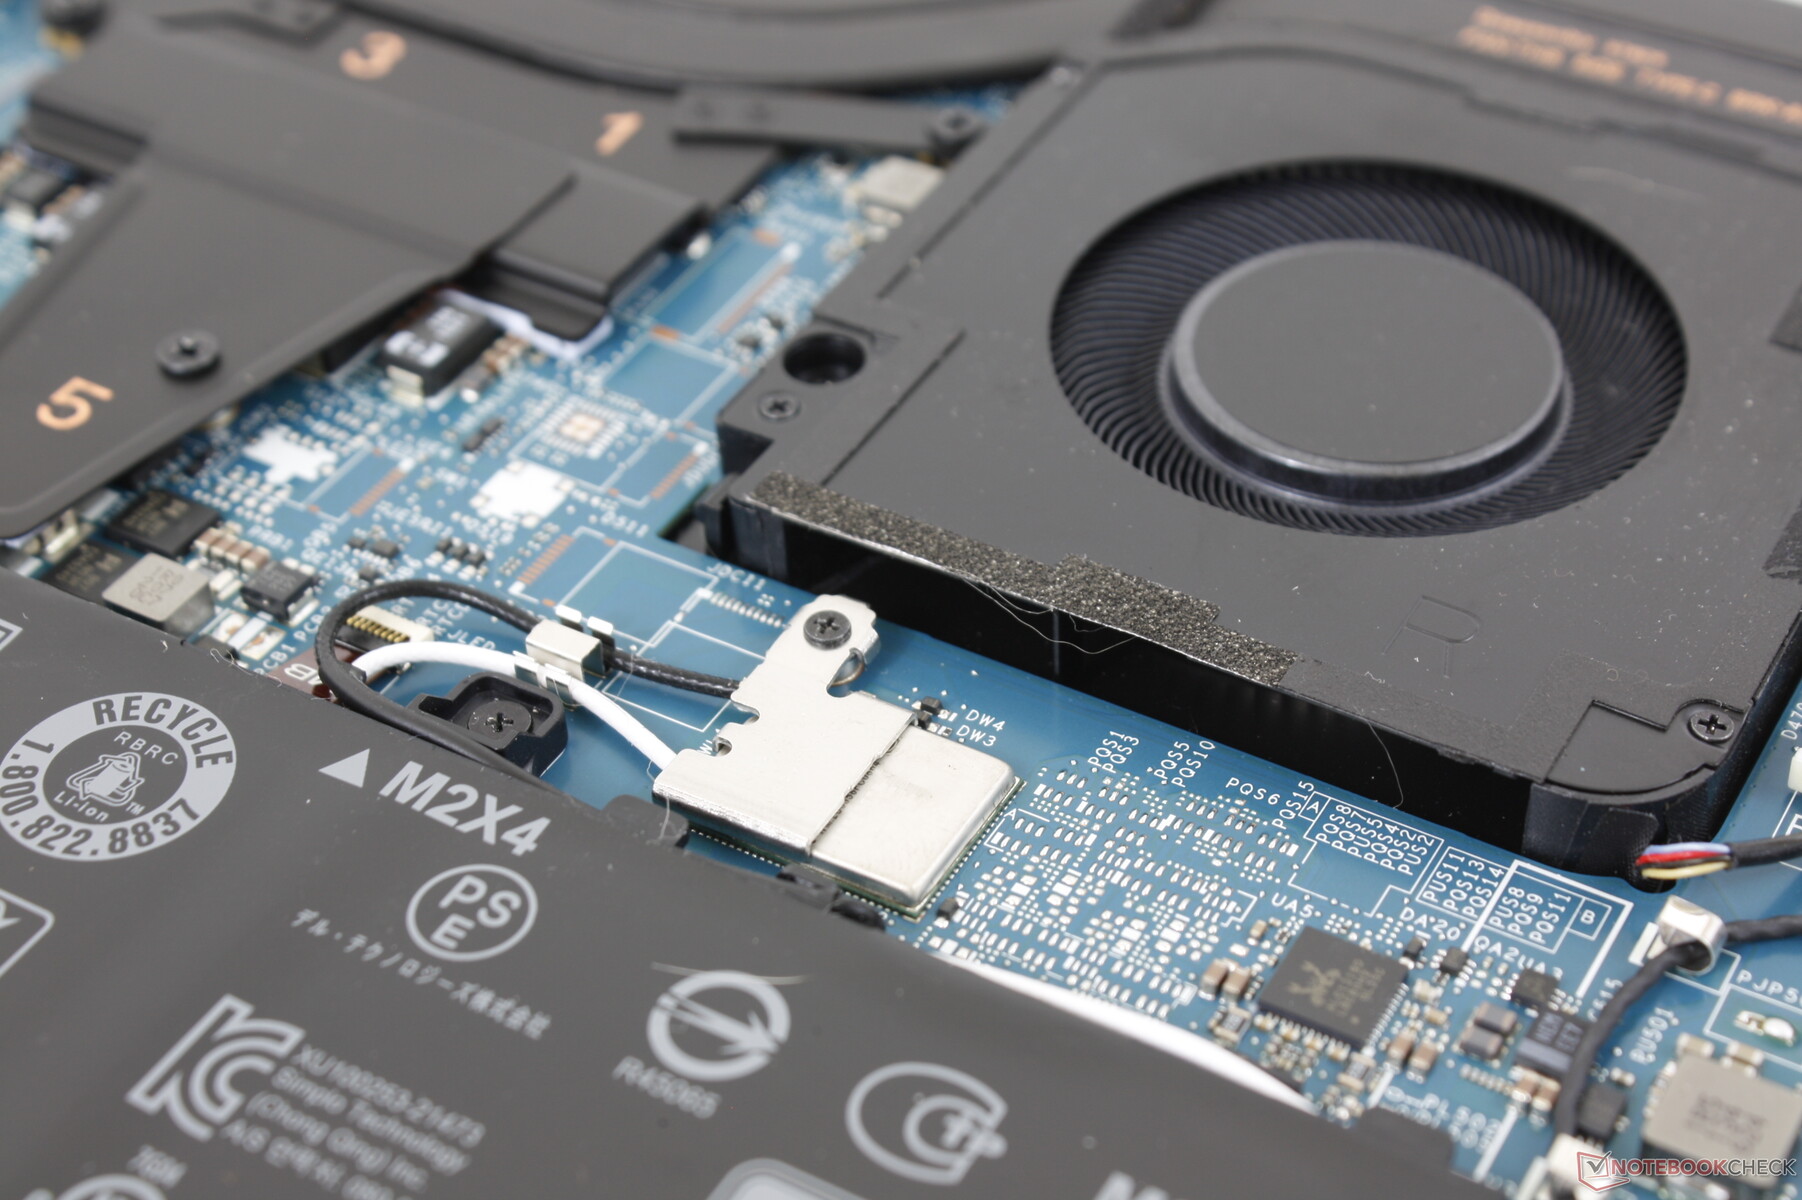
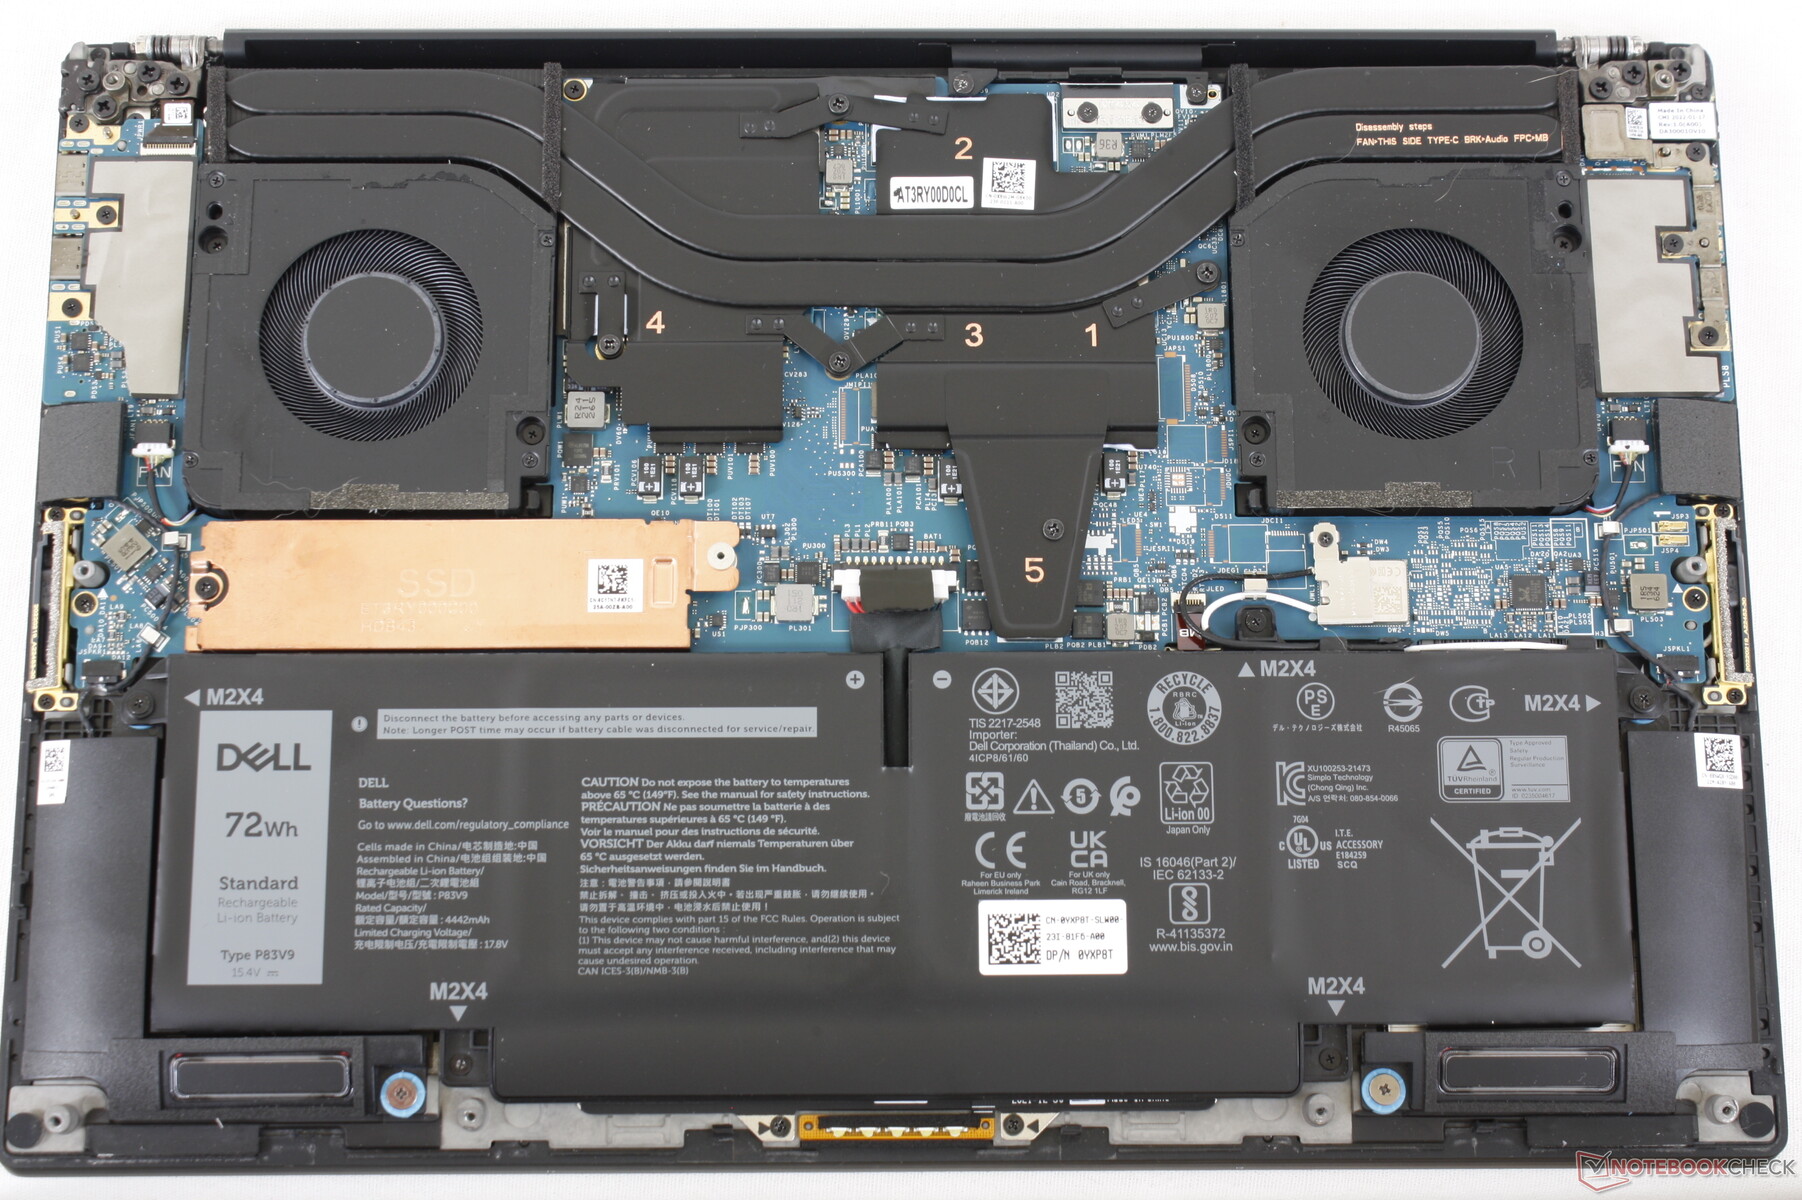
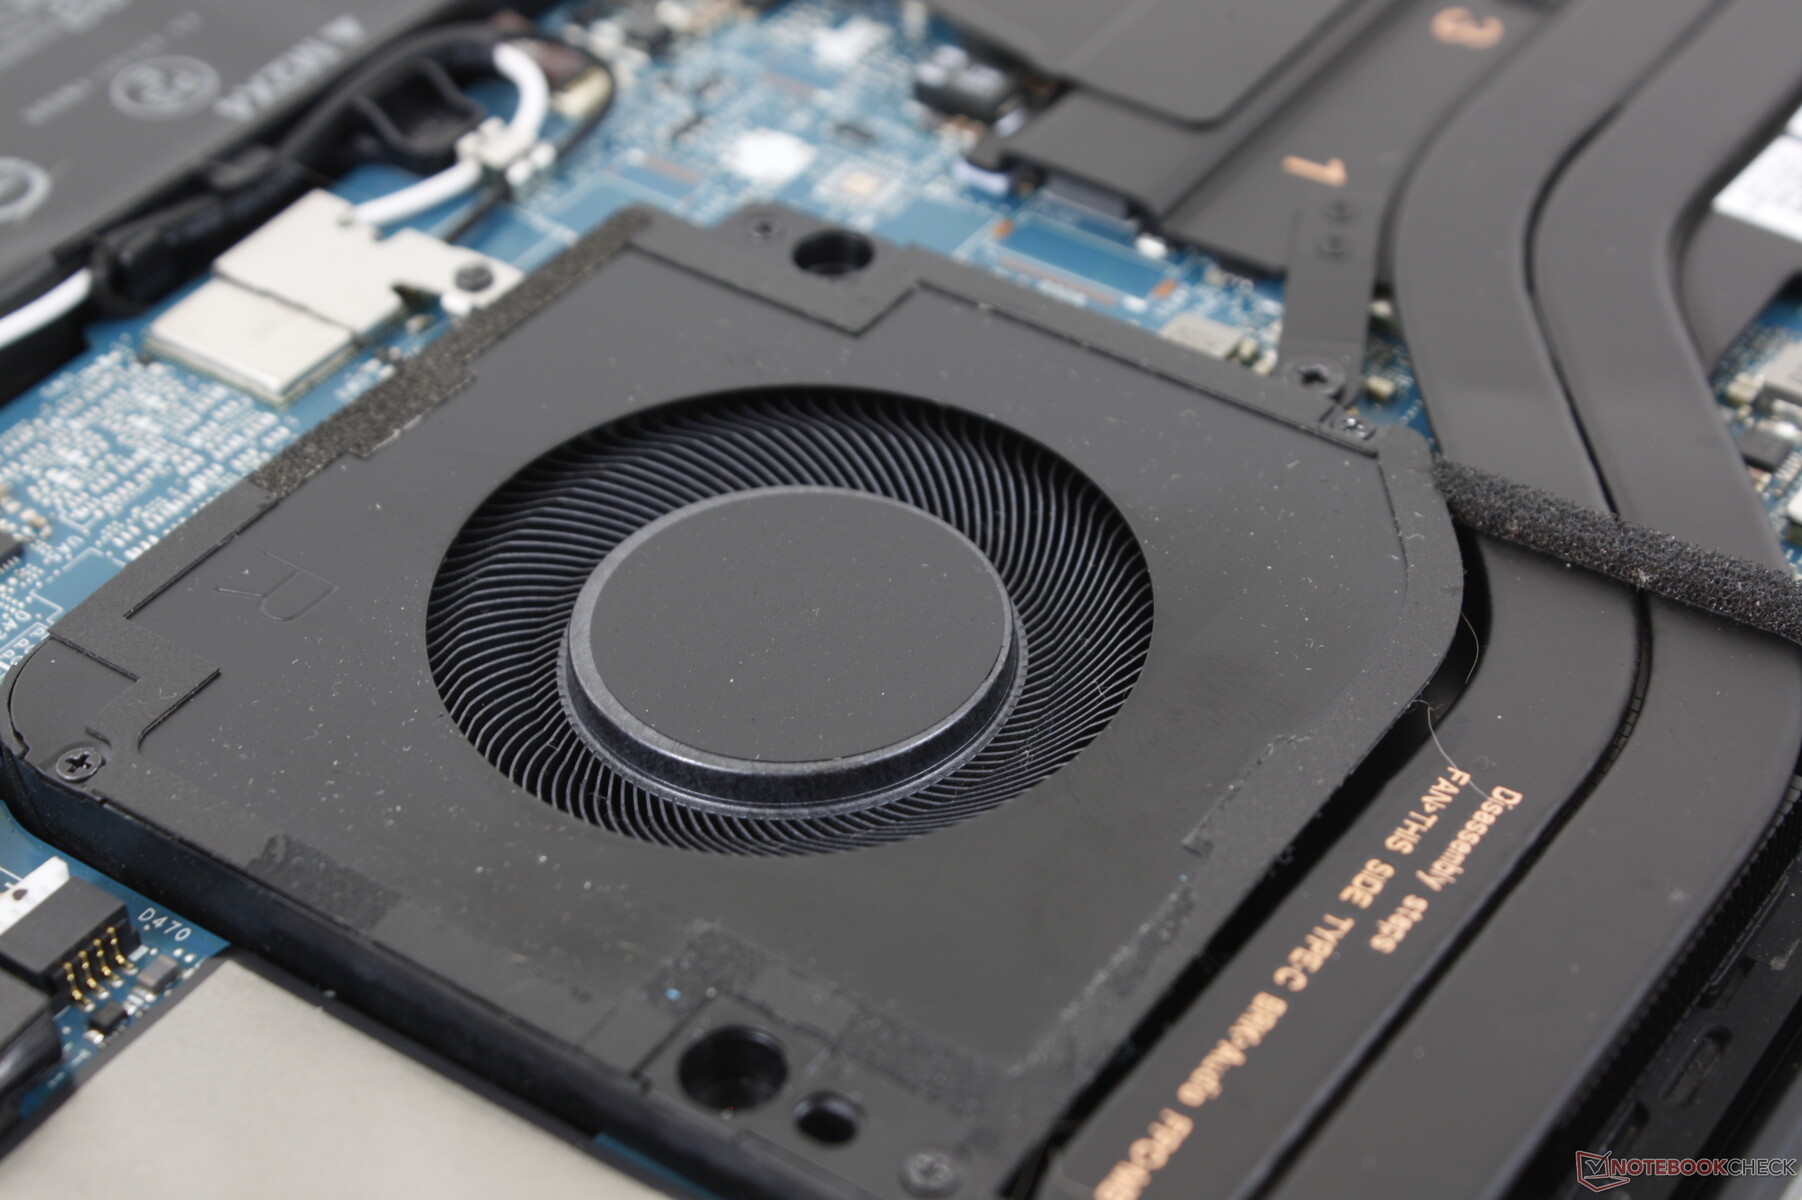
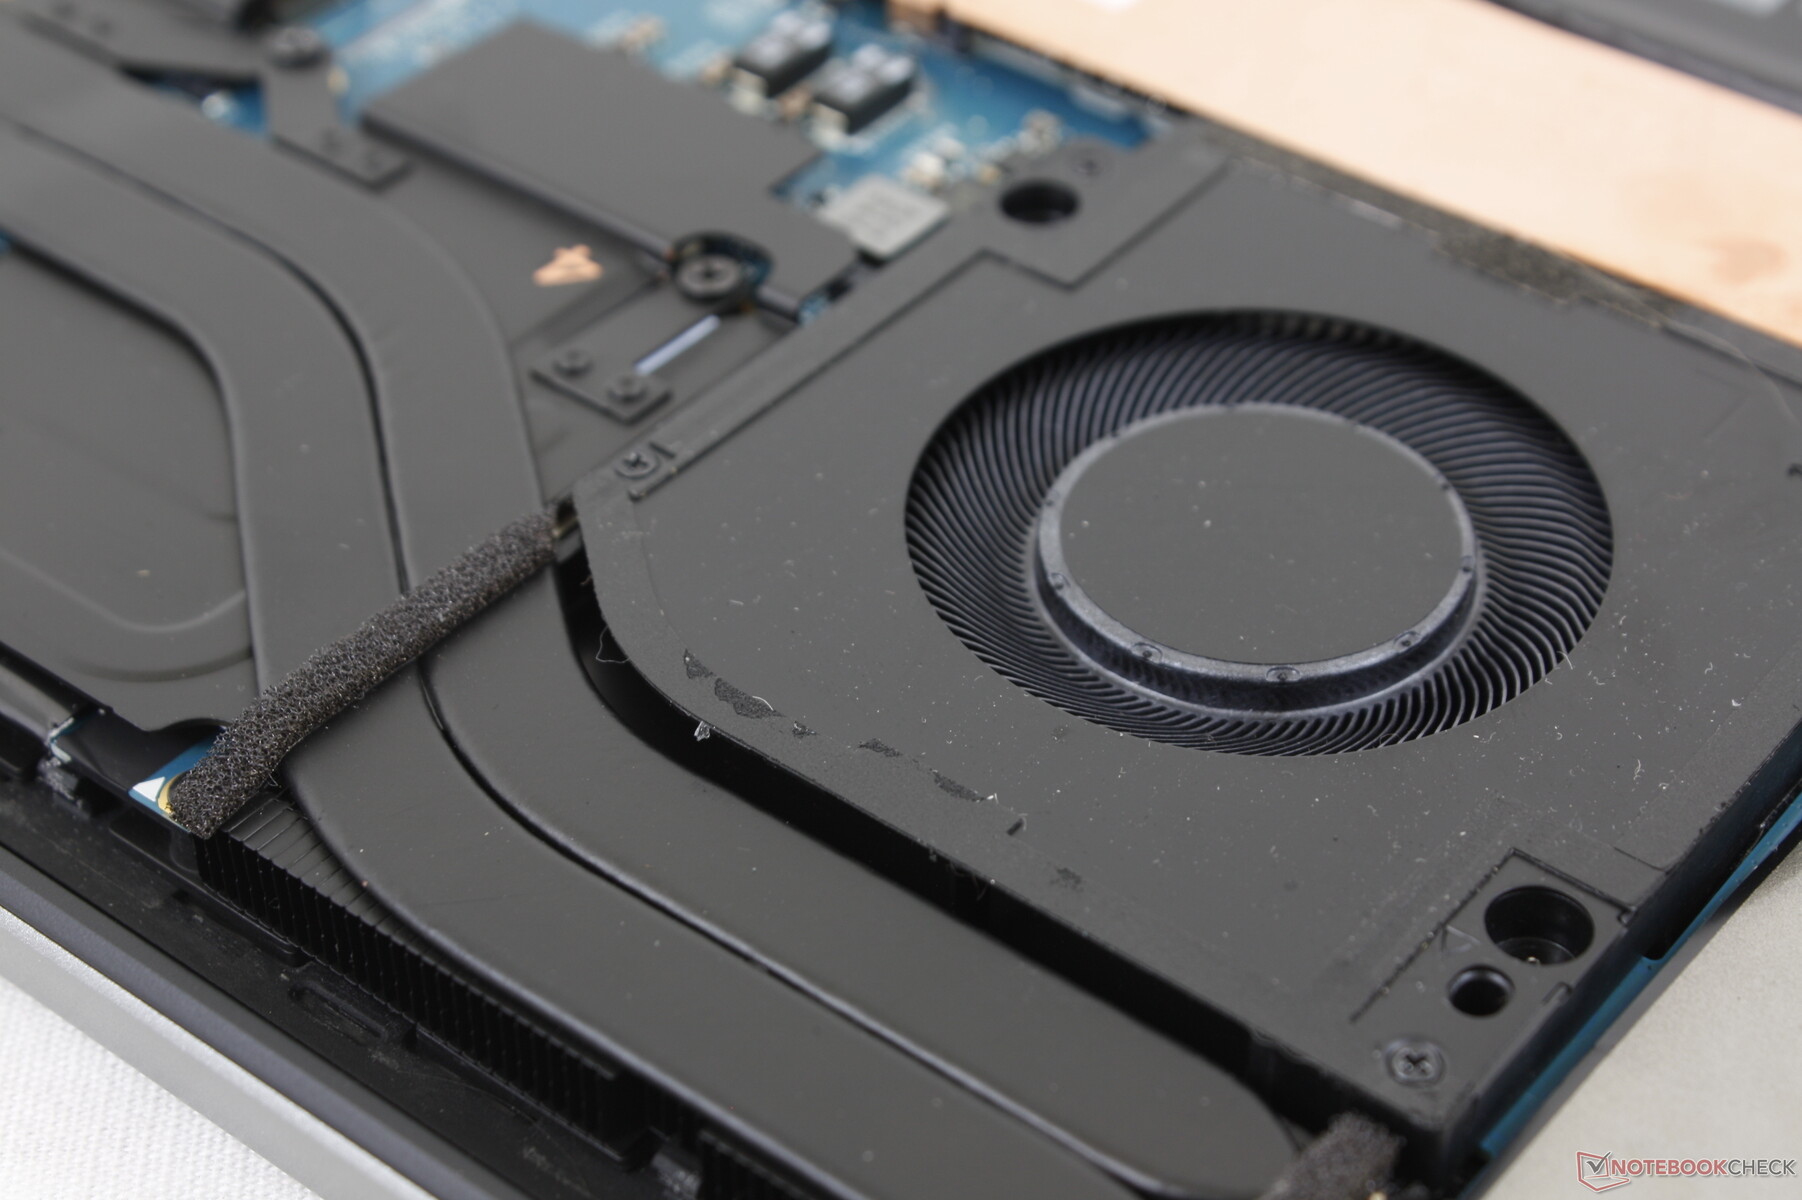
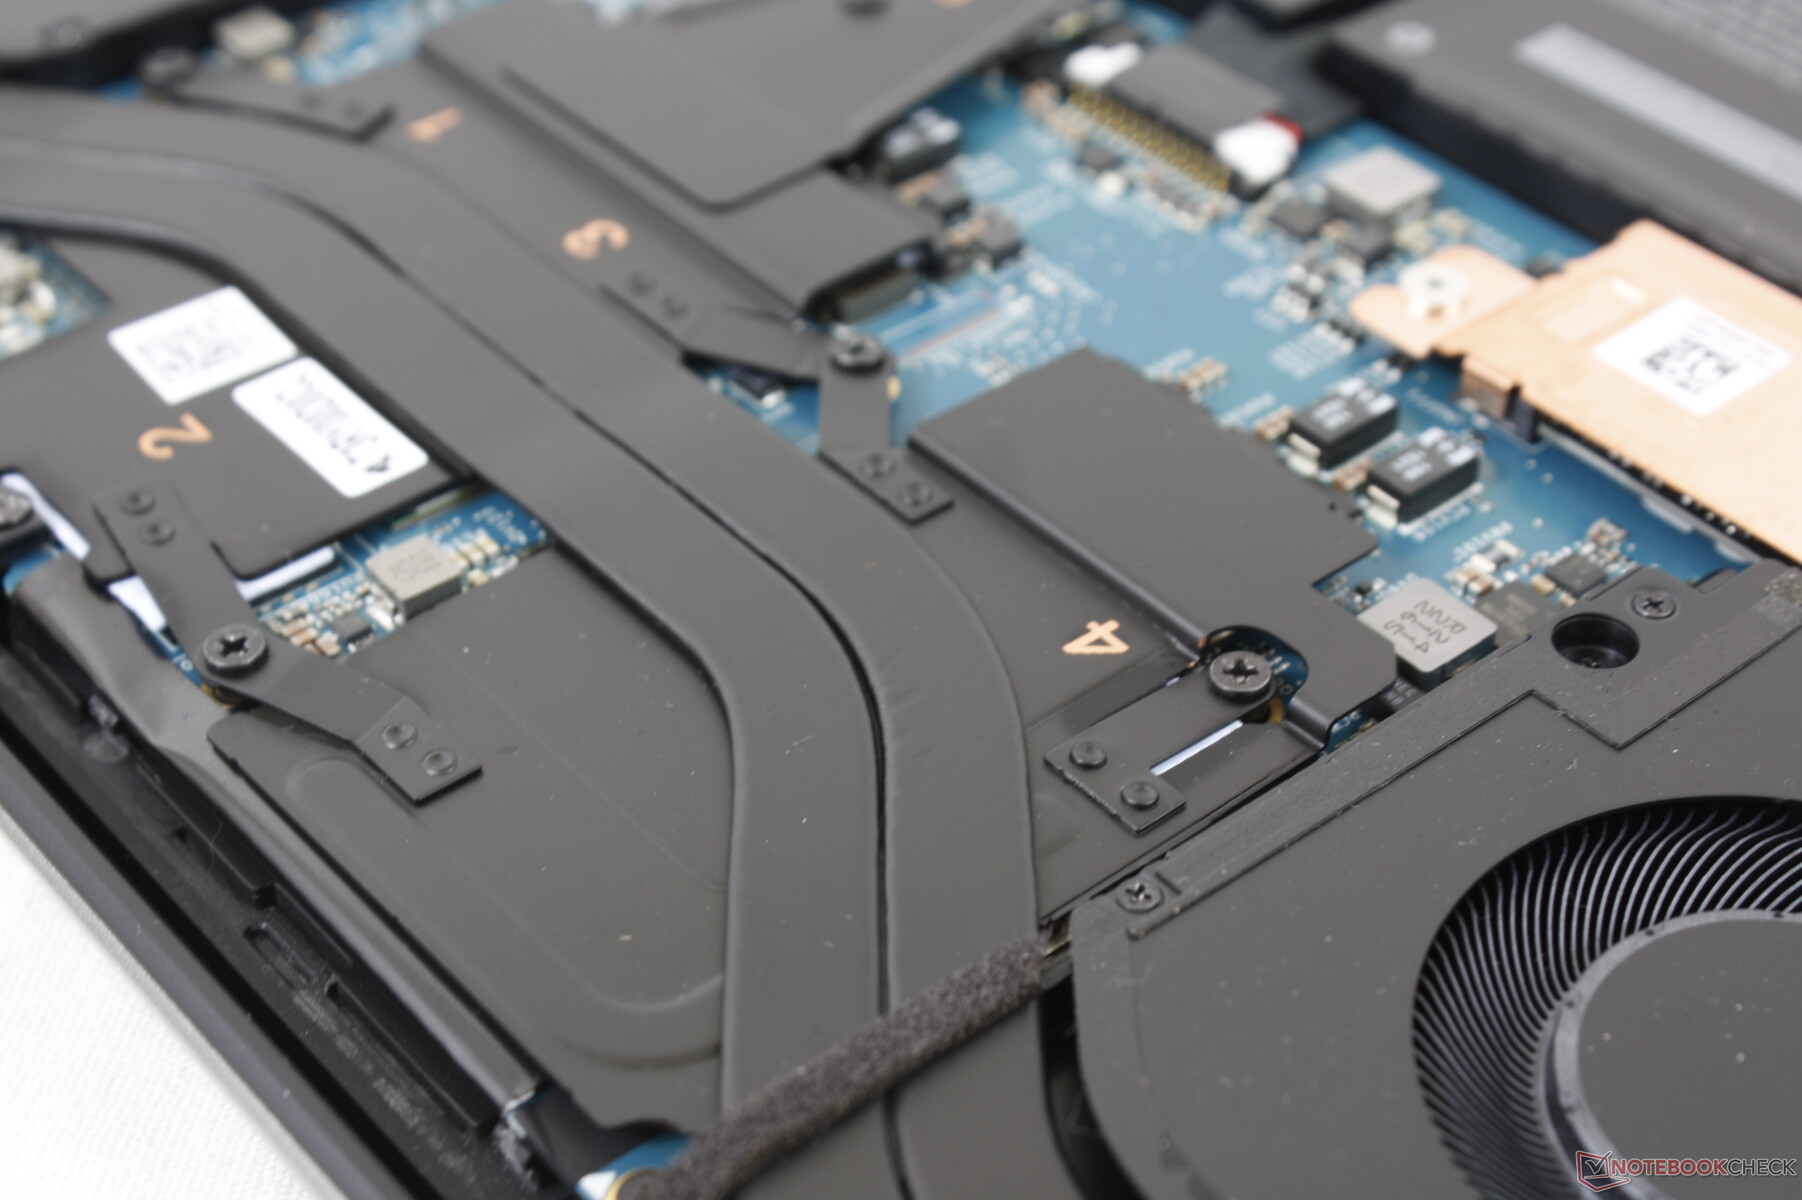
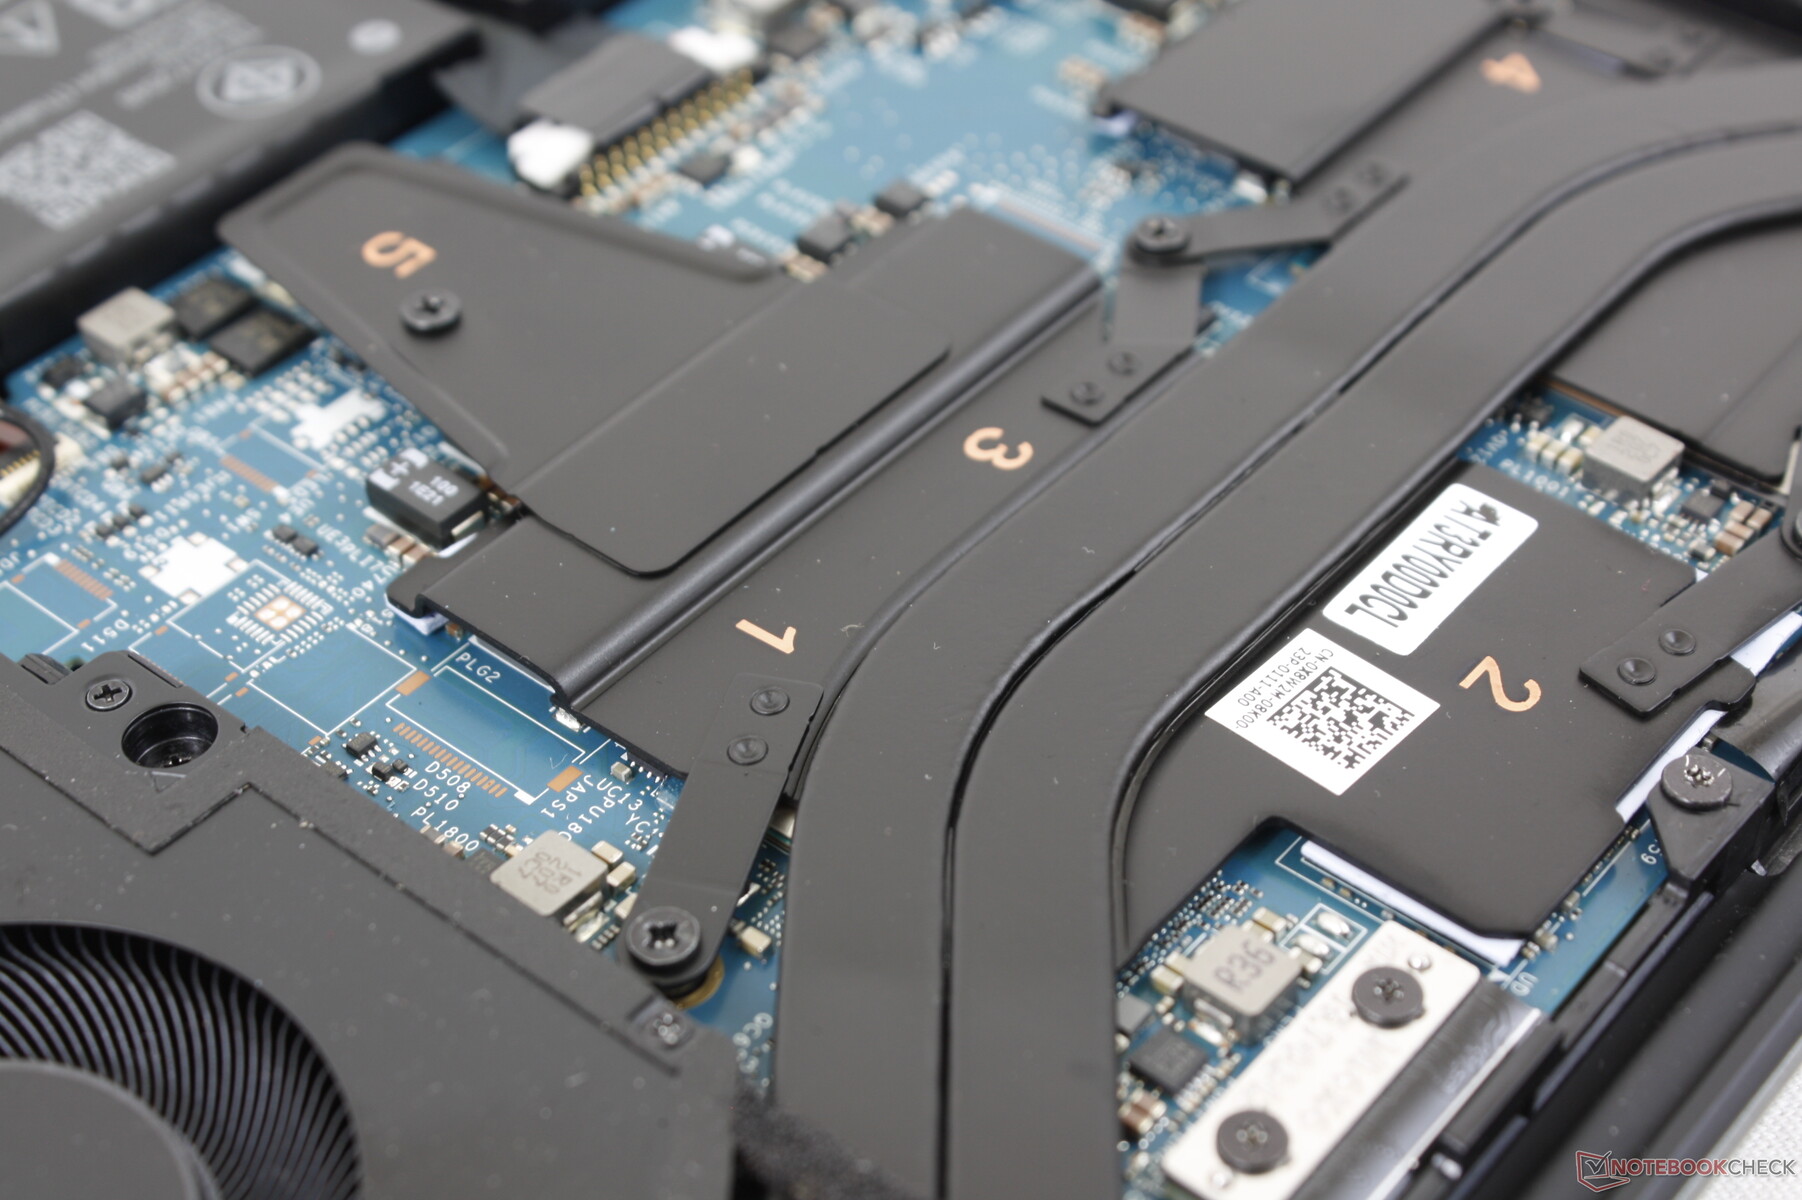
Underhåll
Bottenpanelen är säkrad med åtta T5 Torx-skruvar för enkel borttagning. Det finns dock inte mycket att uppgradera eftersom RAM- och WLAN-modulerna är lödda.
Garanti
Grundgarantin är endast 12 månader i USA i stället för 36 månader som vi har kommit att förvänta oss av de flesta mobila arbetsstationer och bärbara datorer för yrkesbruk i toppklass.
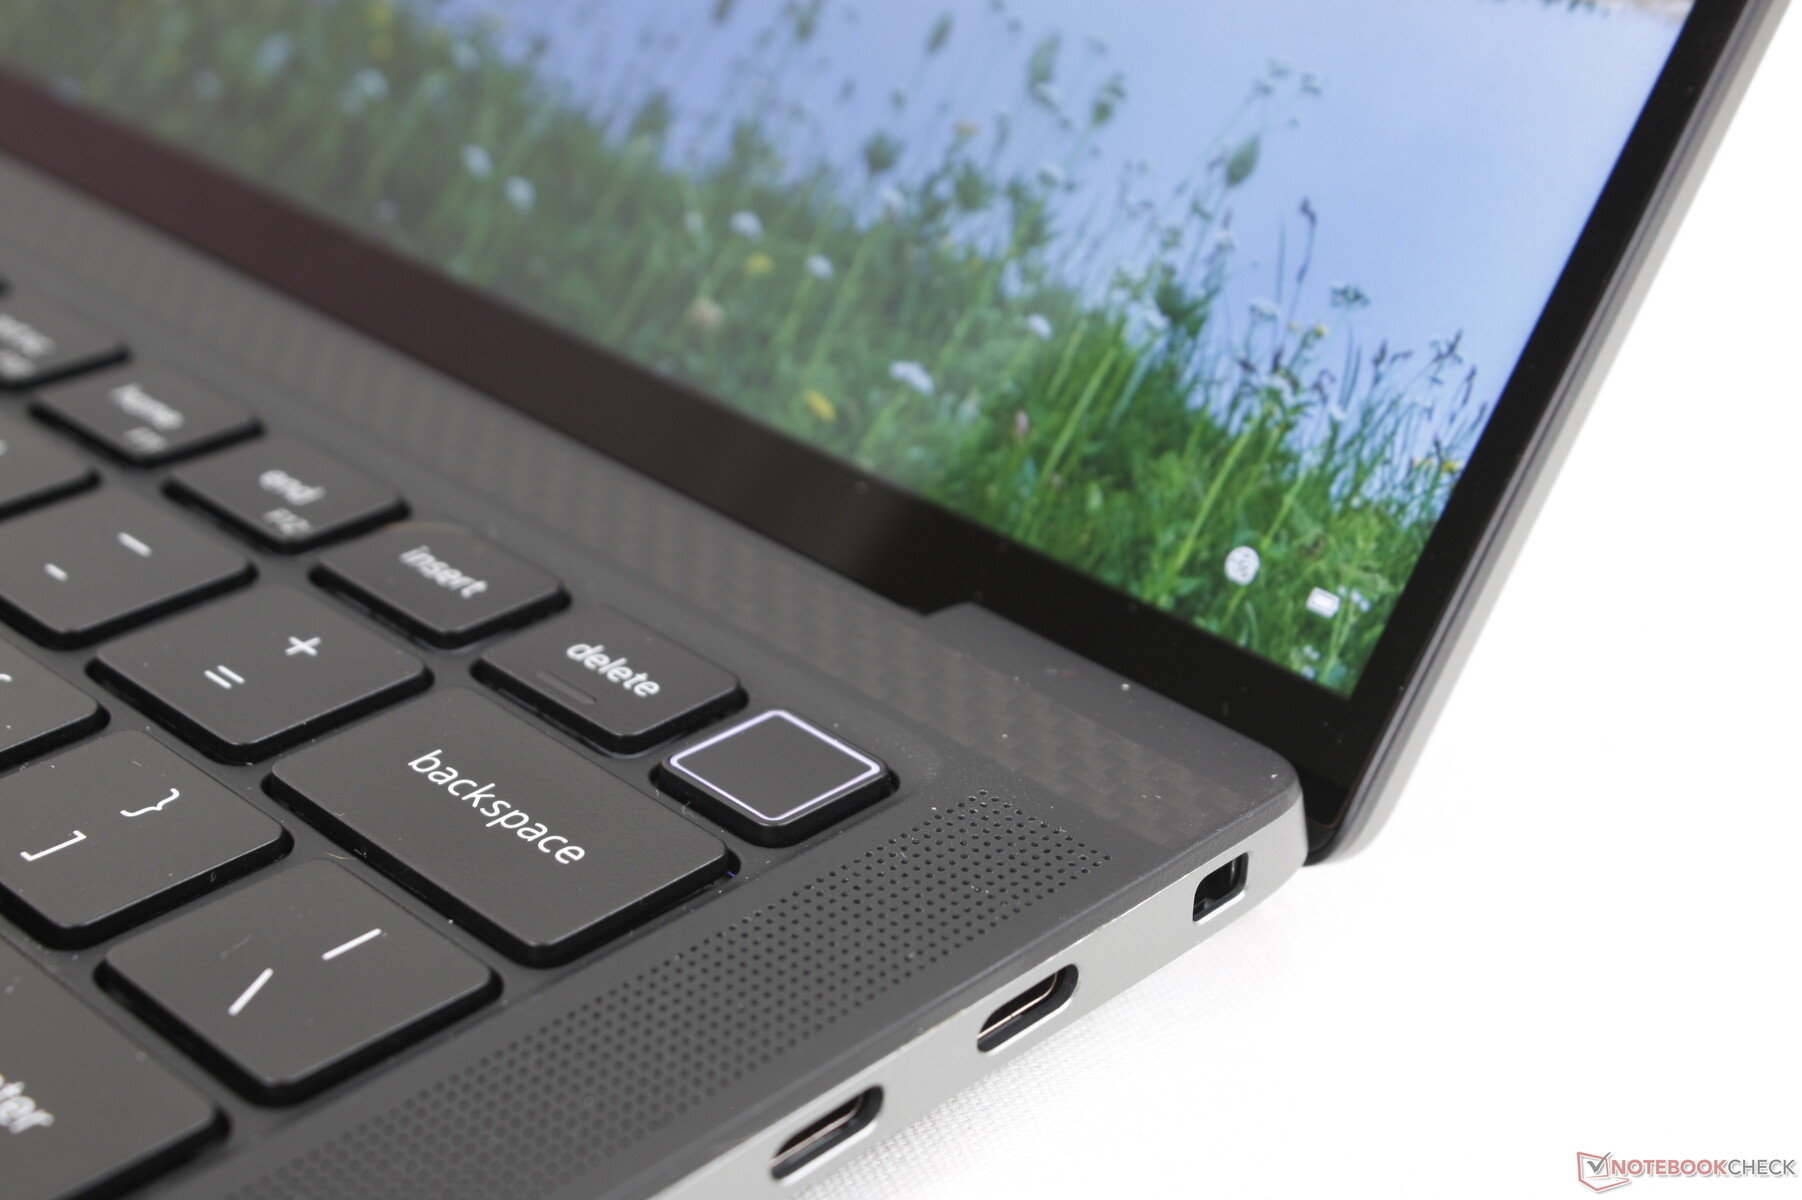
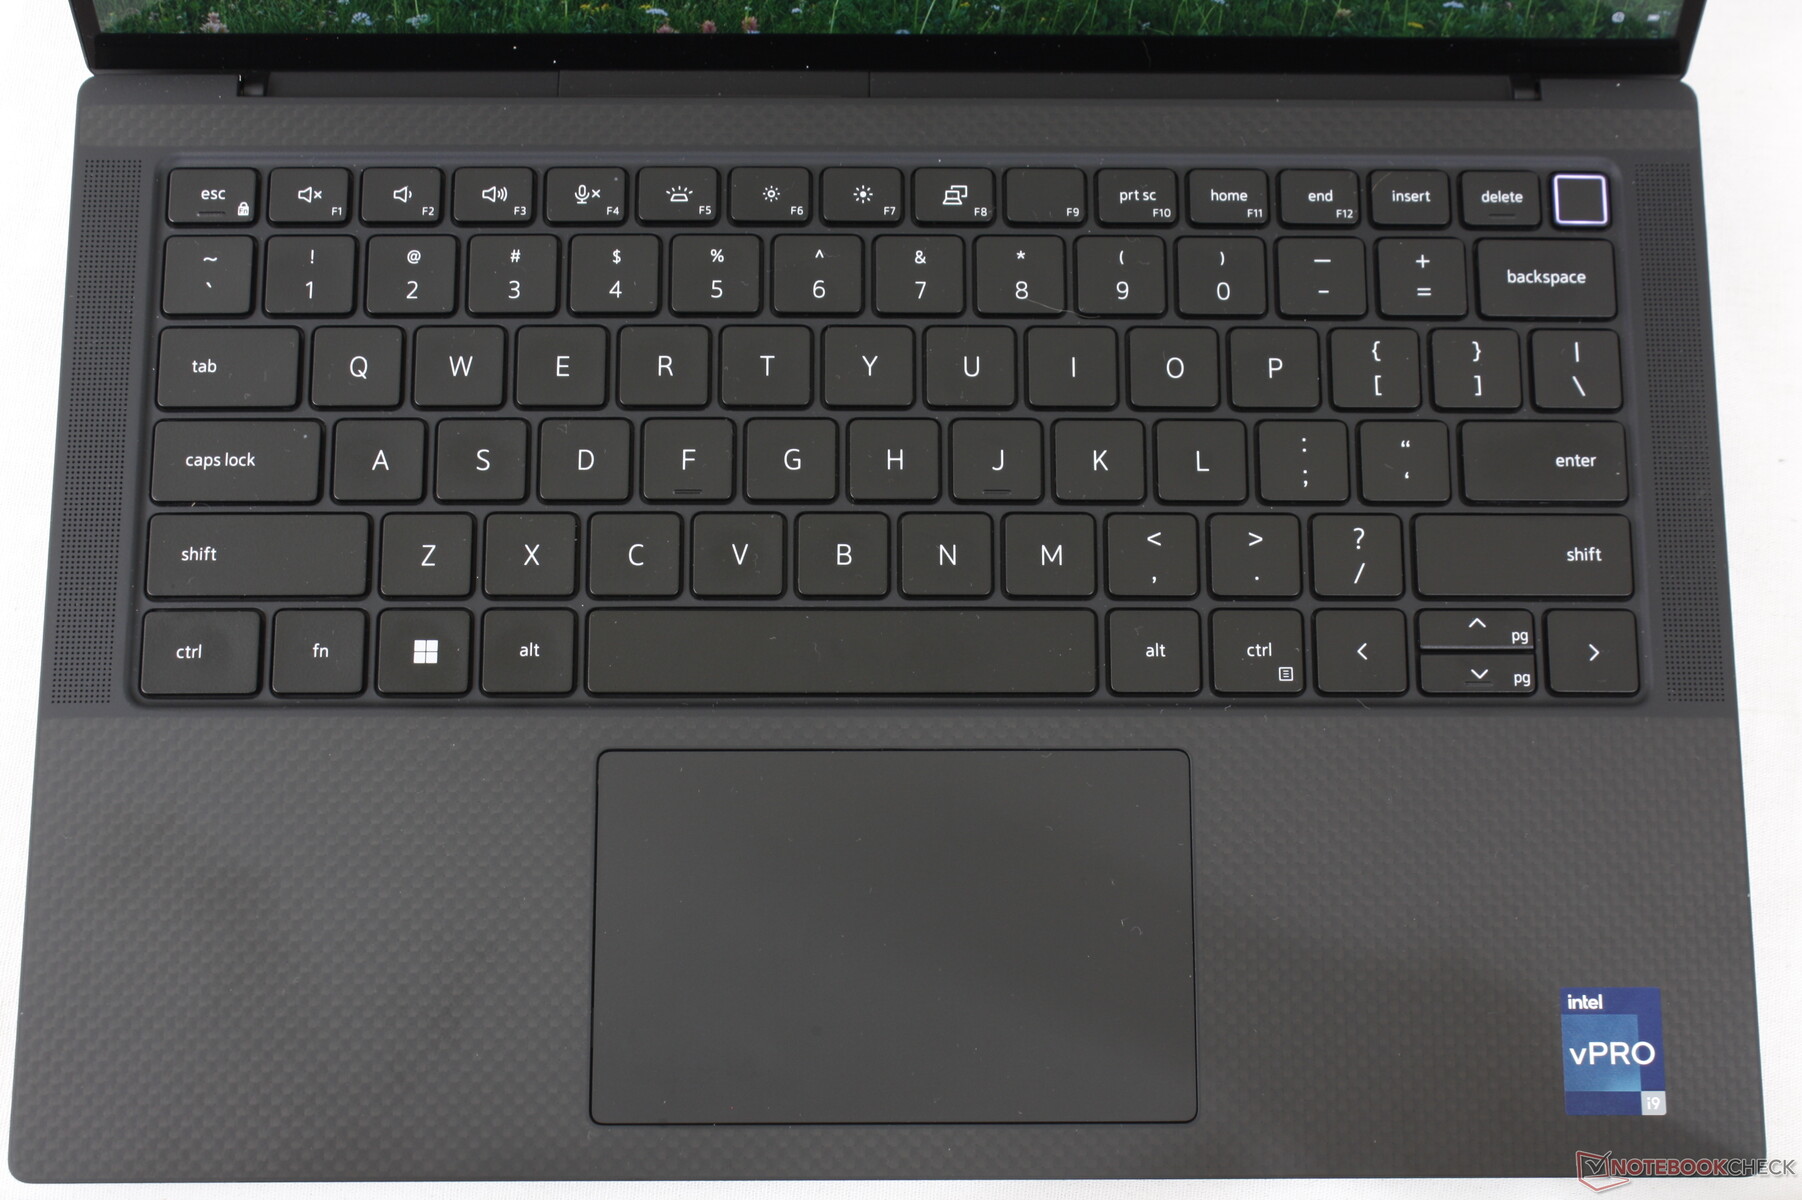
Inmatningsenheter
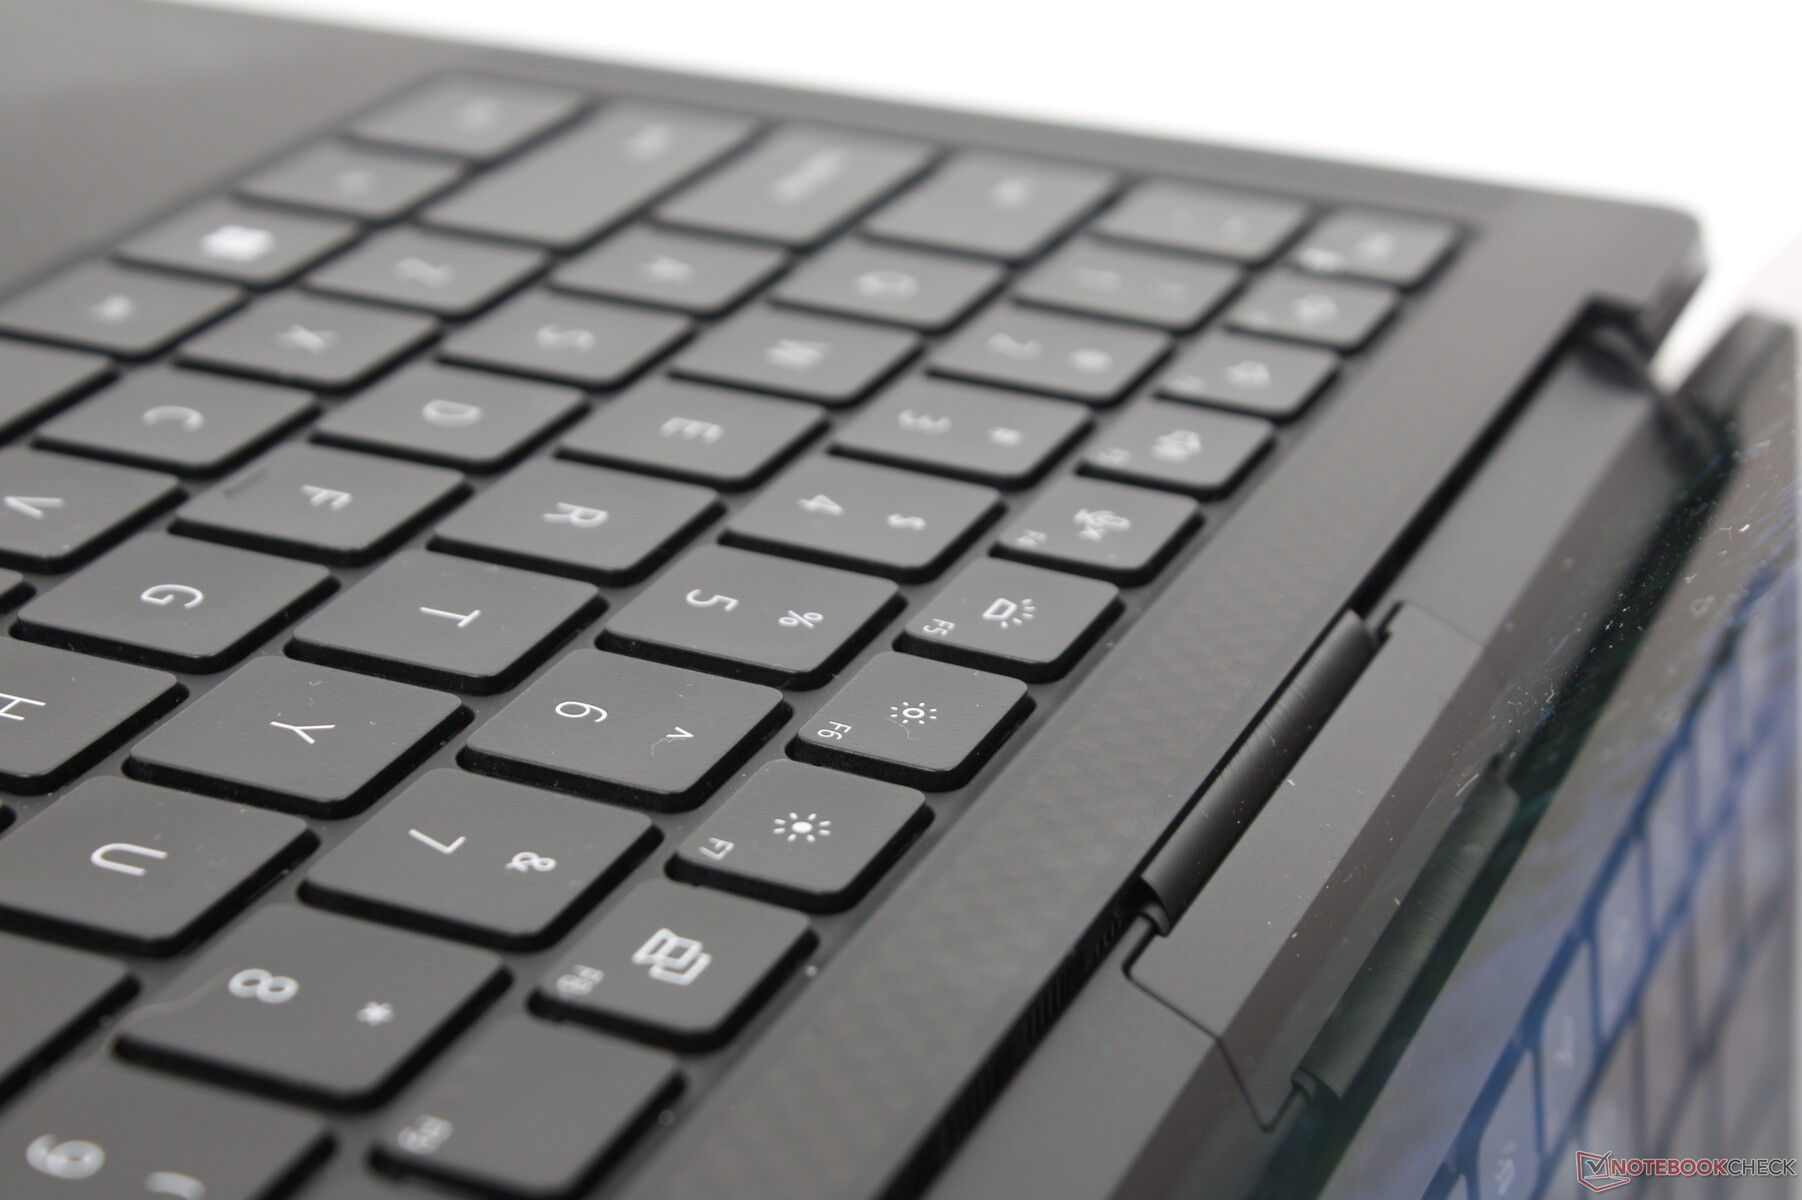
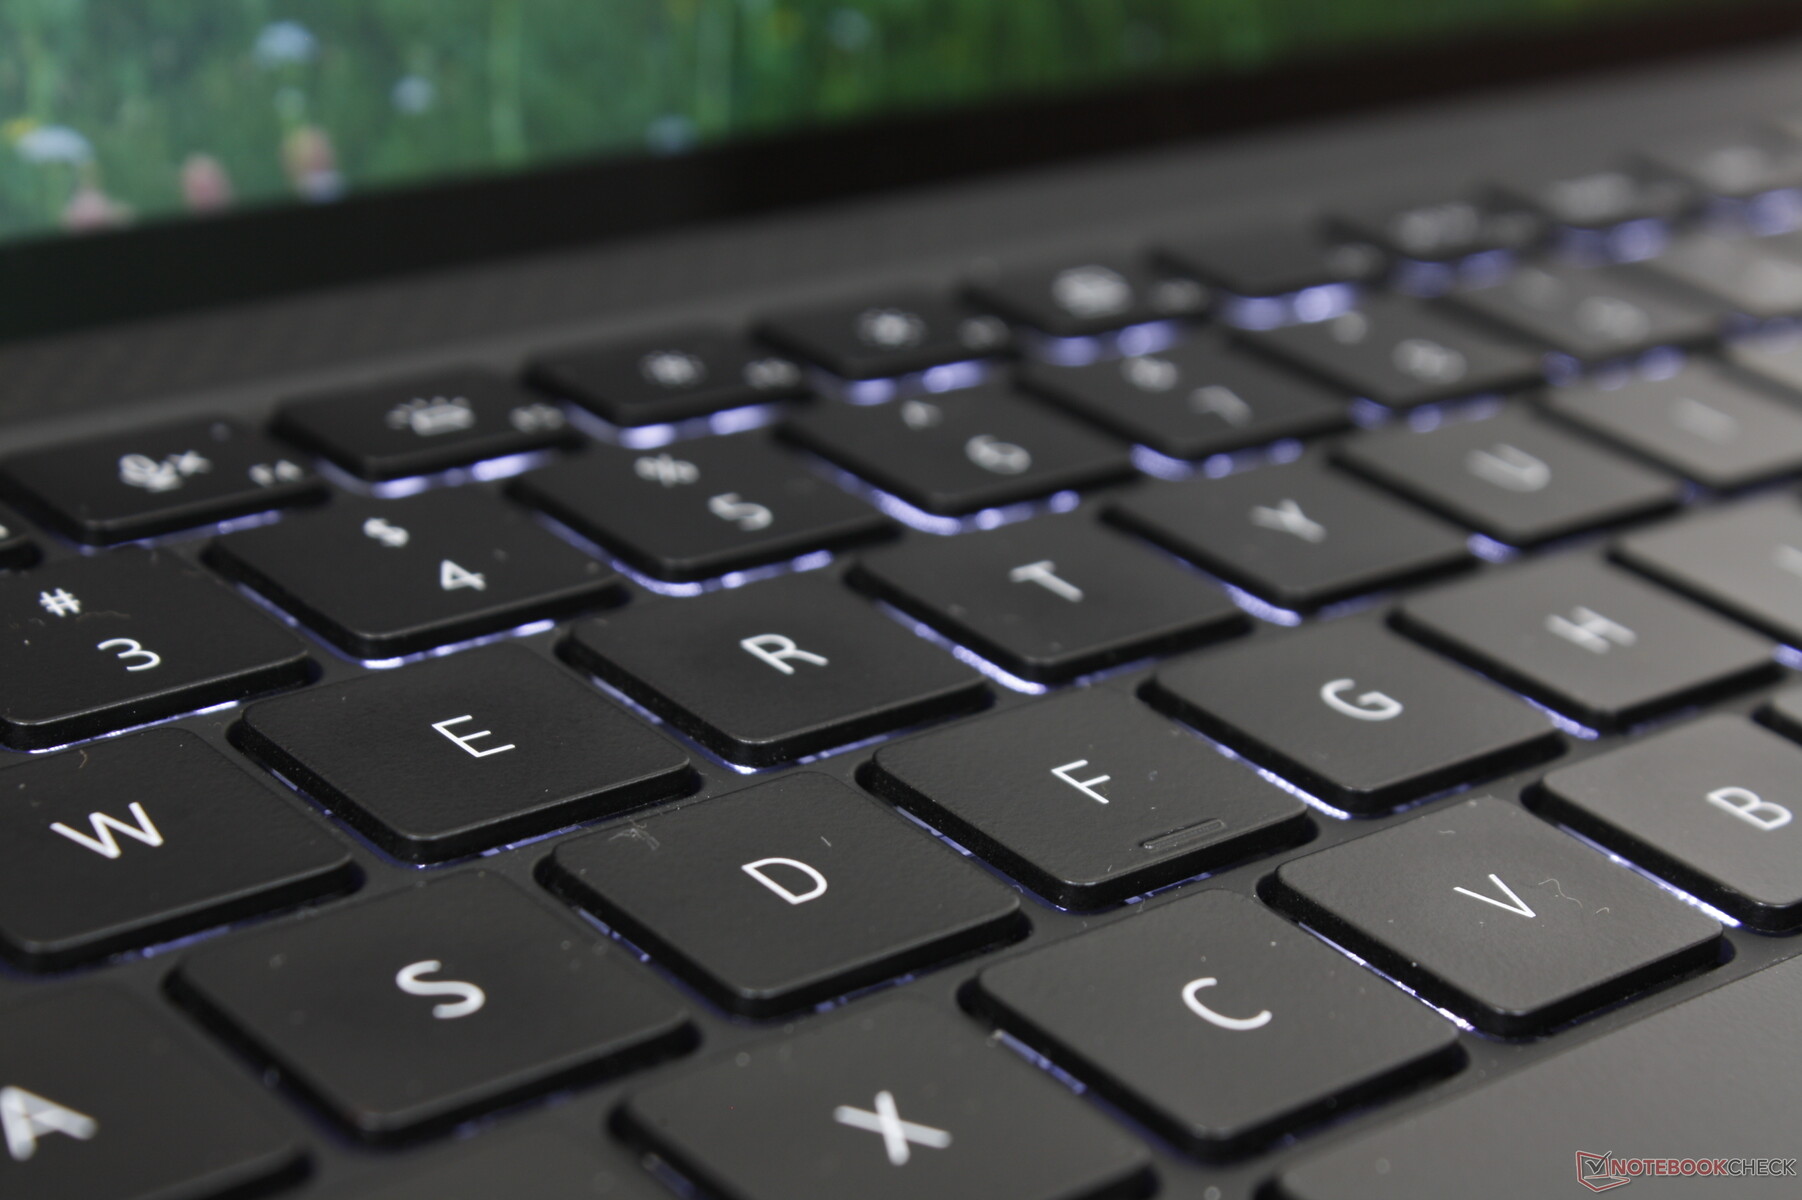
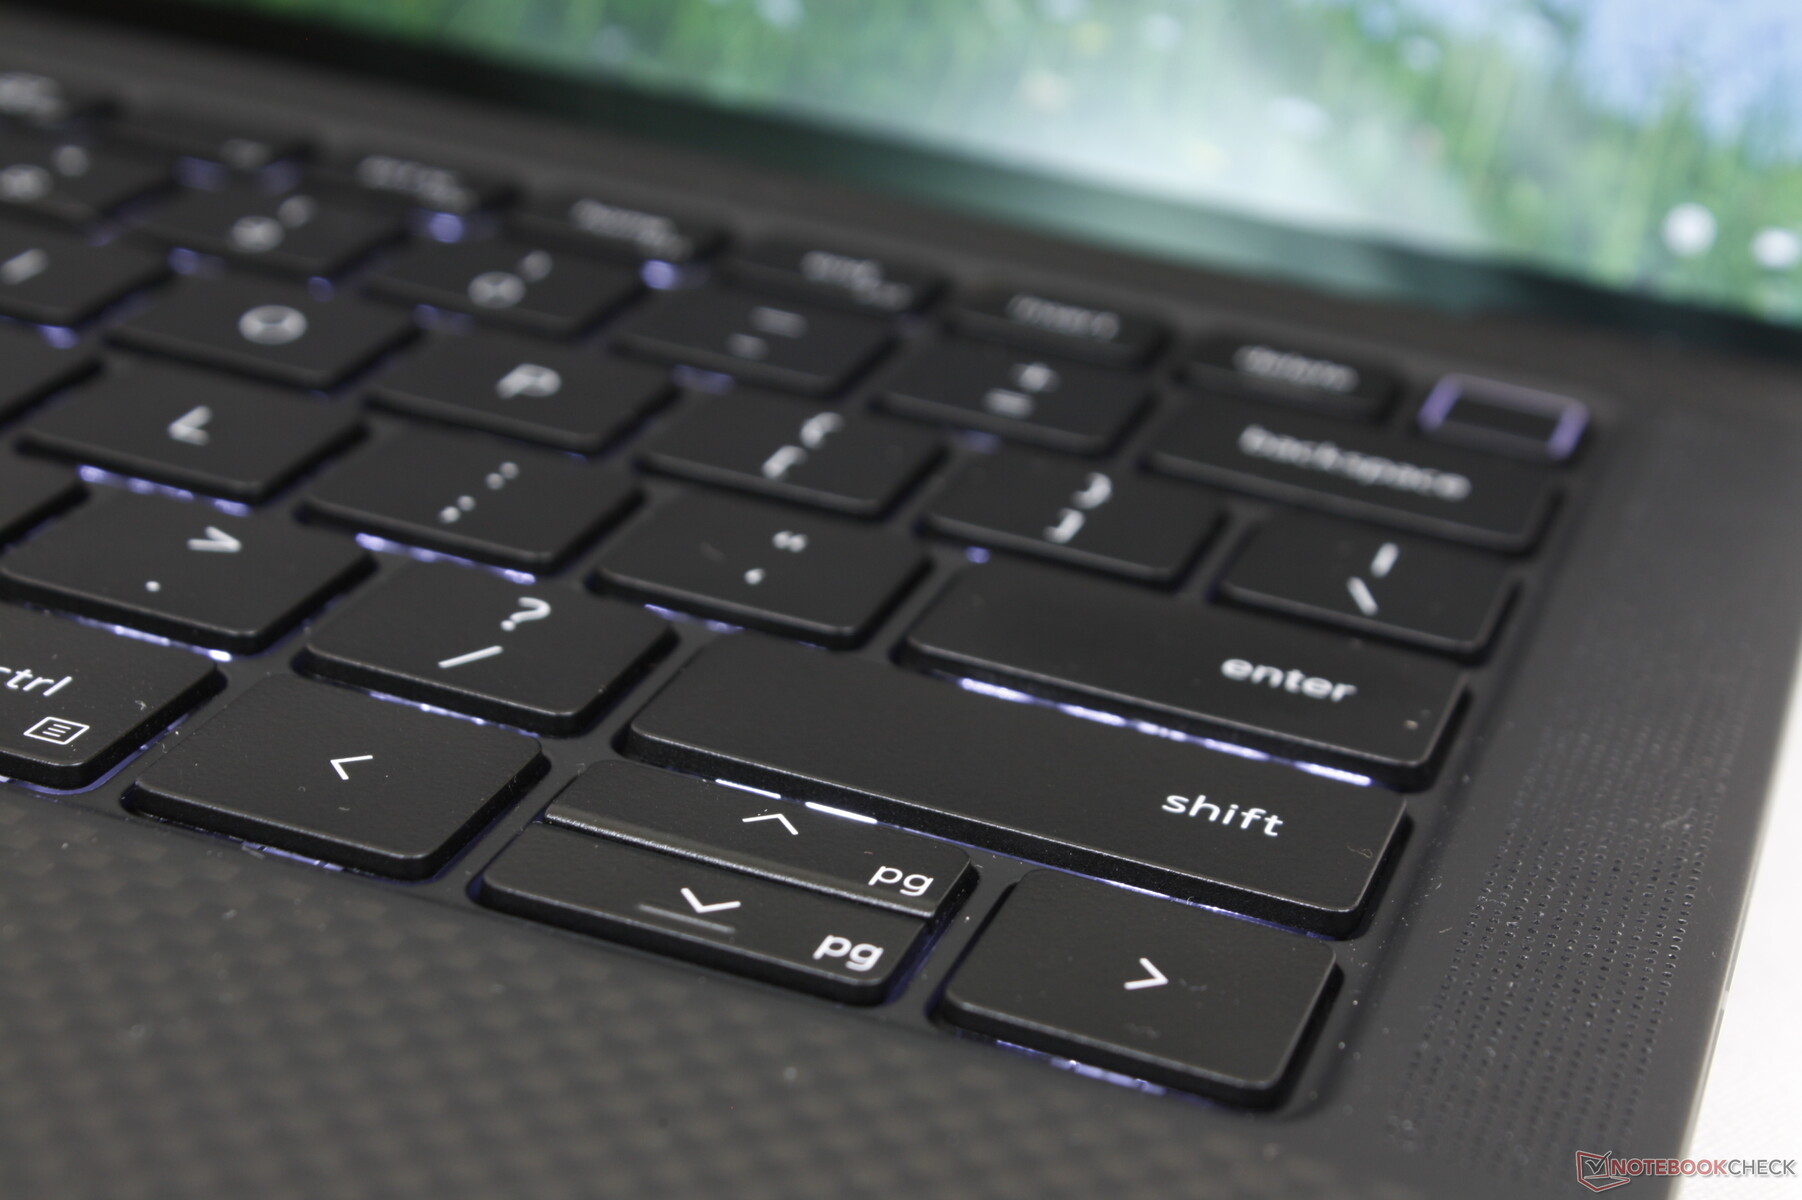
Tangentbord
Modellen ärver tangentbordet som finns på de äldre XPS 13 9300 eller 9310. Om du har skrivit på en XPS 13 tidigare vet du vad du kan förvänta dig på Precision 5470. Tangentåterkopplingen är jämn med måttlig rörlighet, men tangenterna på HP EliteBook- eller Firefly-serien tenderar att vara skarpare eller skarpare när man trycker på dem.
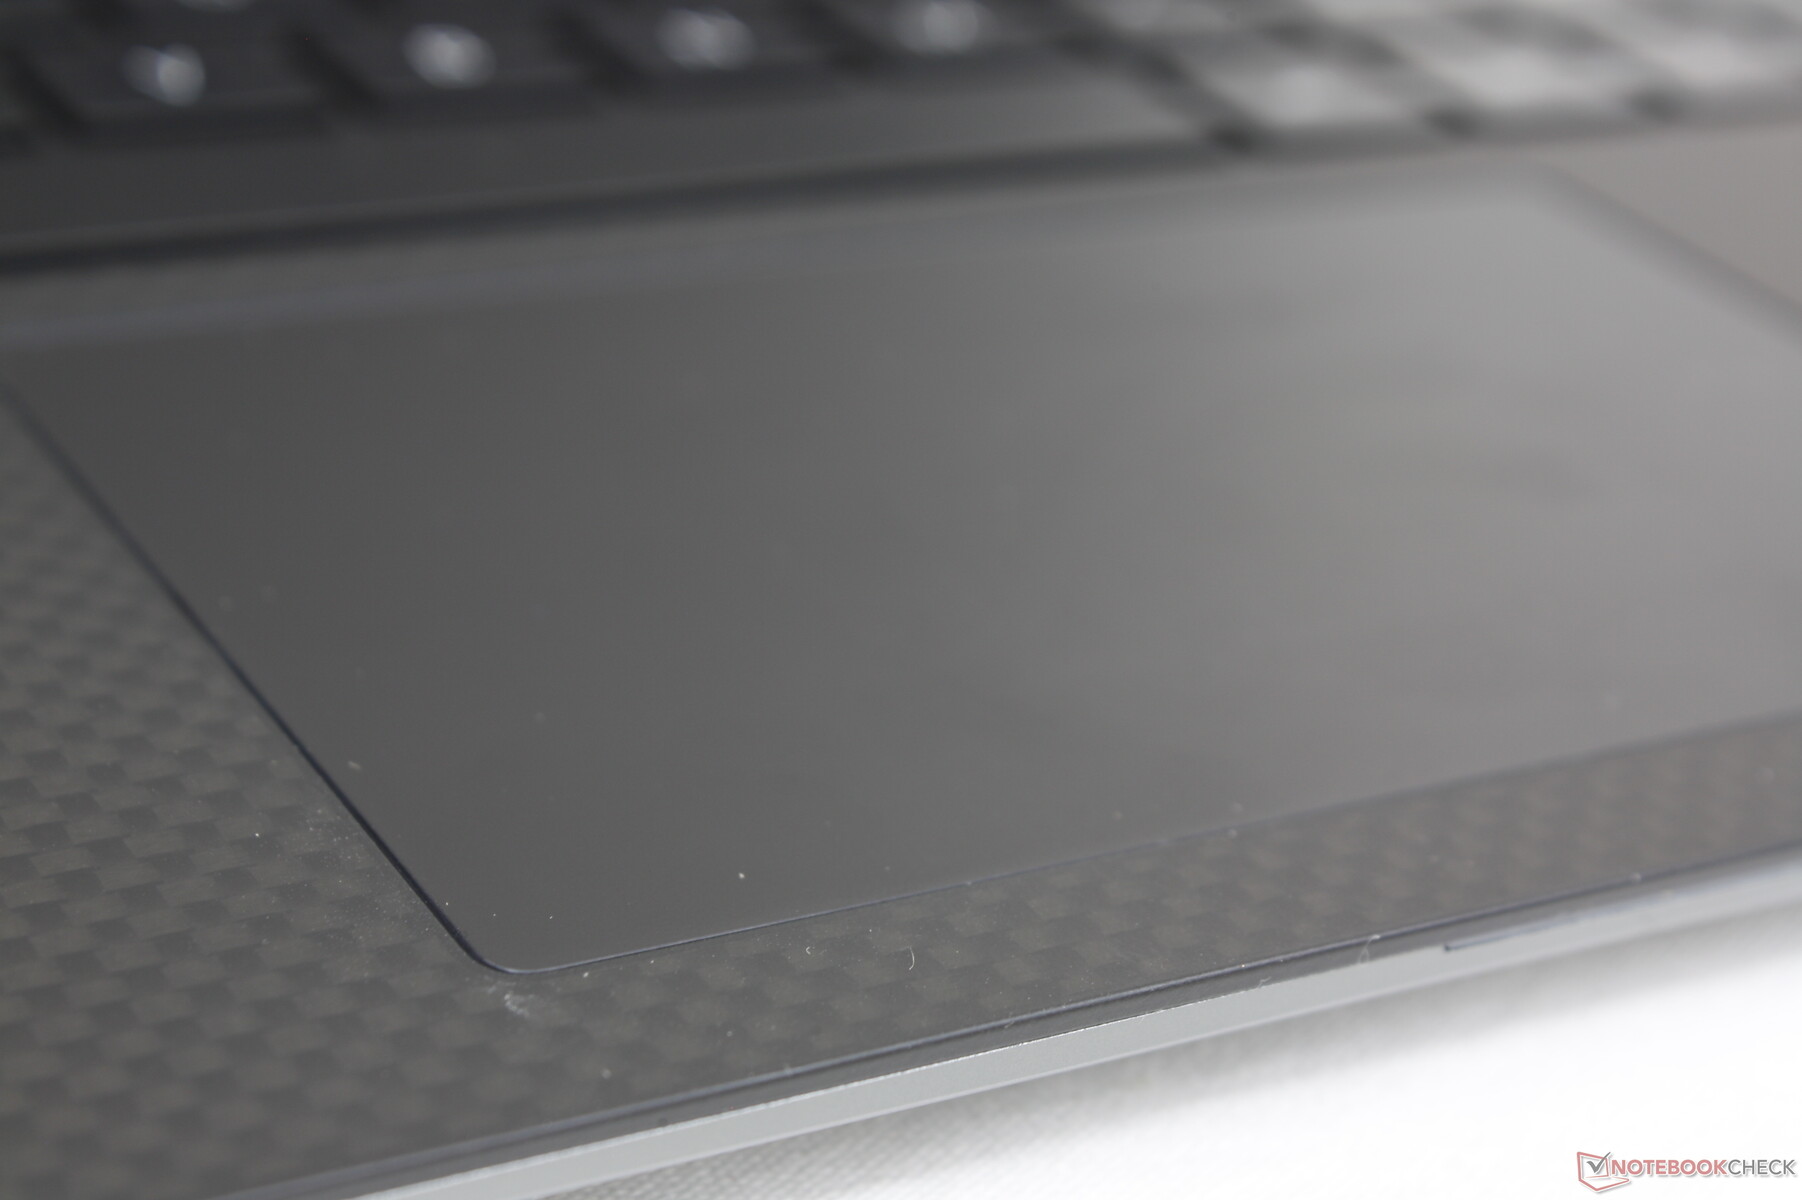
Pekplatta
Ytan på klickplattan är ungefär lika stor som på XPS 13 9300 (10,8 x 6,7 cm jämfört med 11,2 x 6,5 cm). Dragförmågan är jämn och endast något klibbig vid lägre hastigheter för bättre precision när det behövs. Återkopplingen när du klickar på klickplattan är relativt mjuk och ytlig men med ett mycket tystare skrammel när du klickar på de flesta andra bärbara datorer.
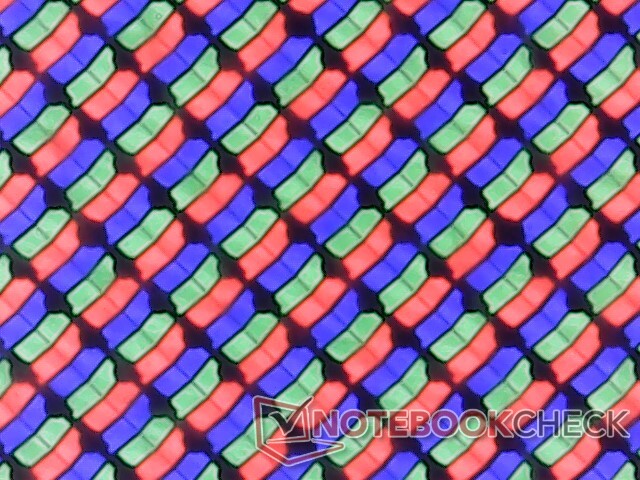
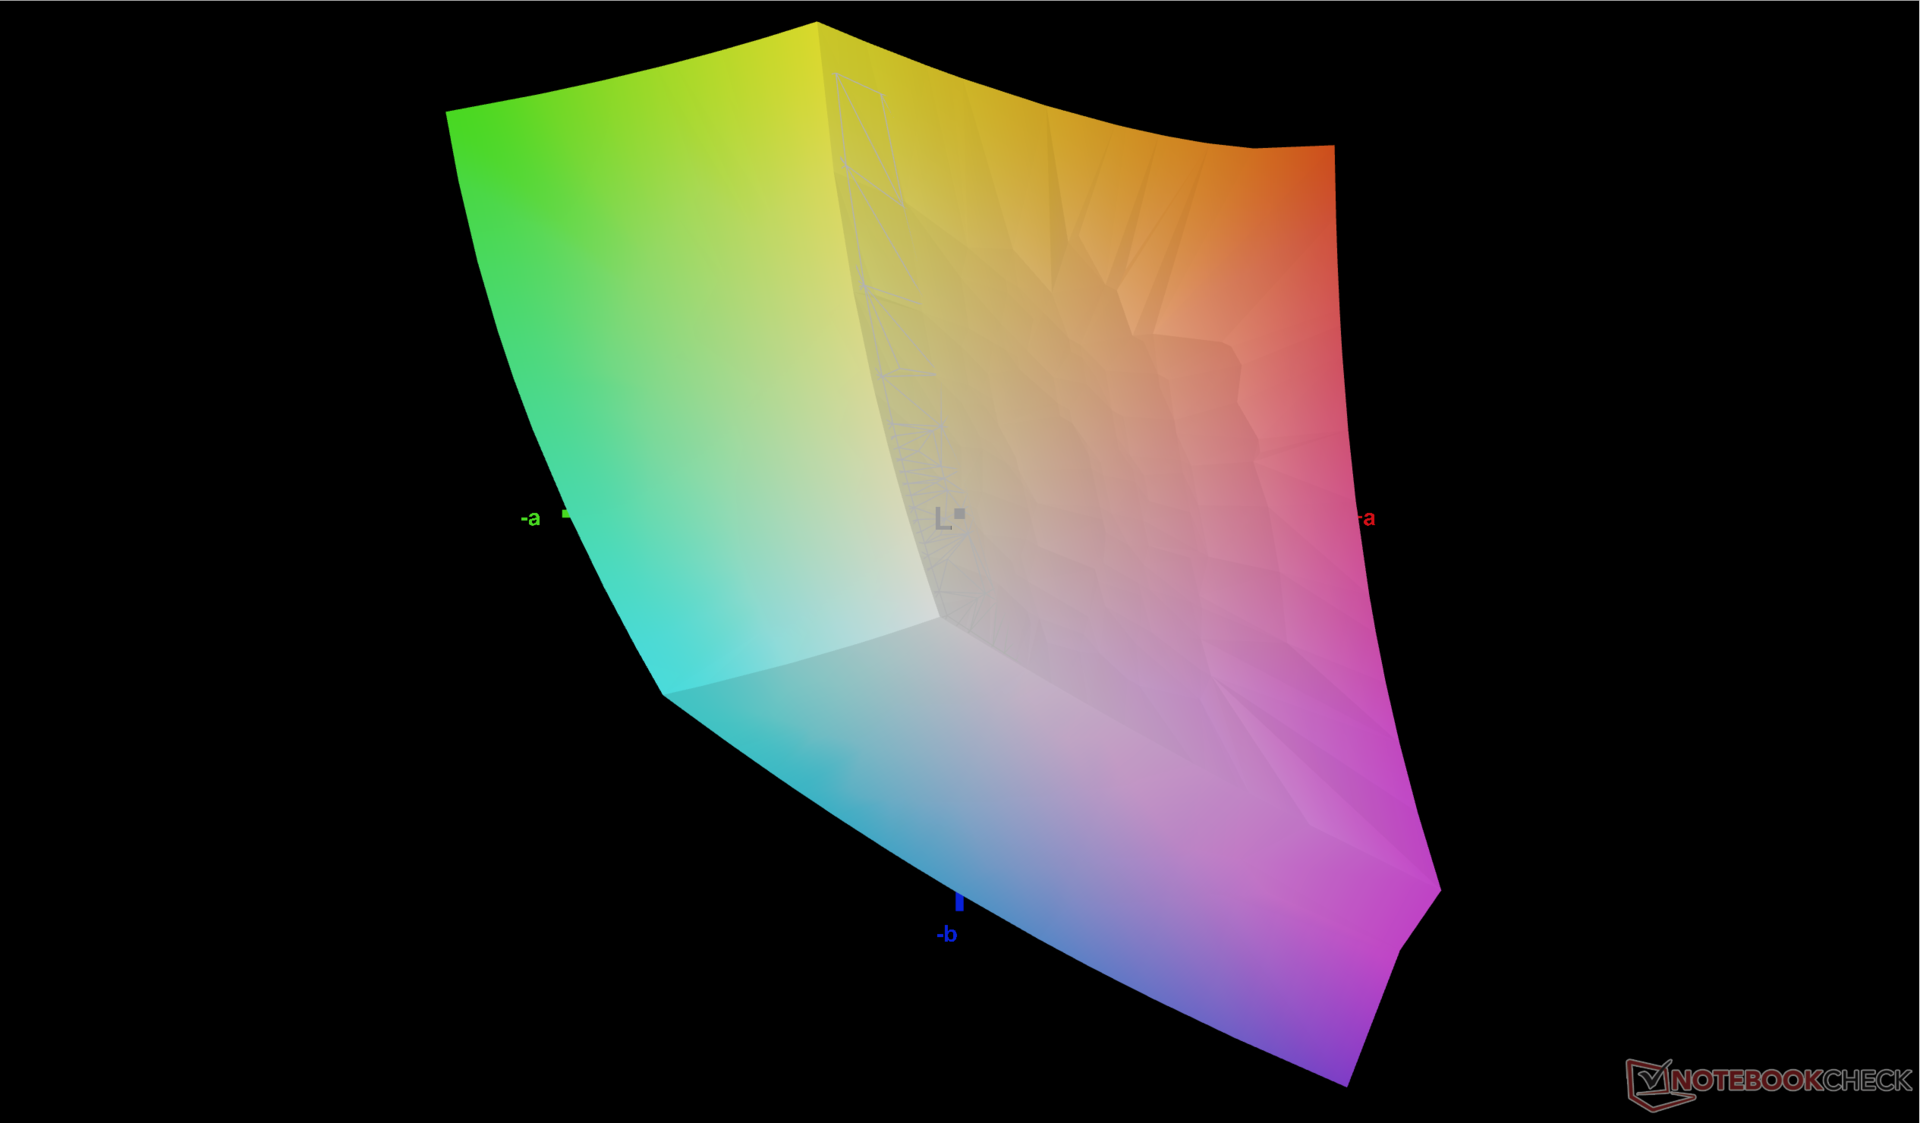
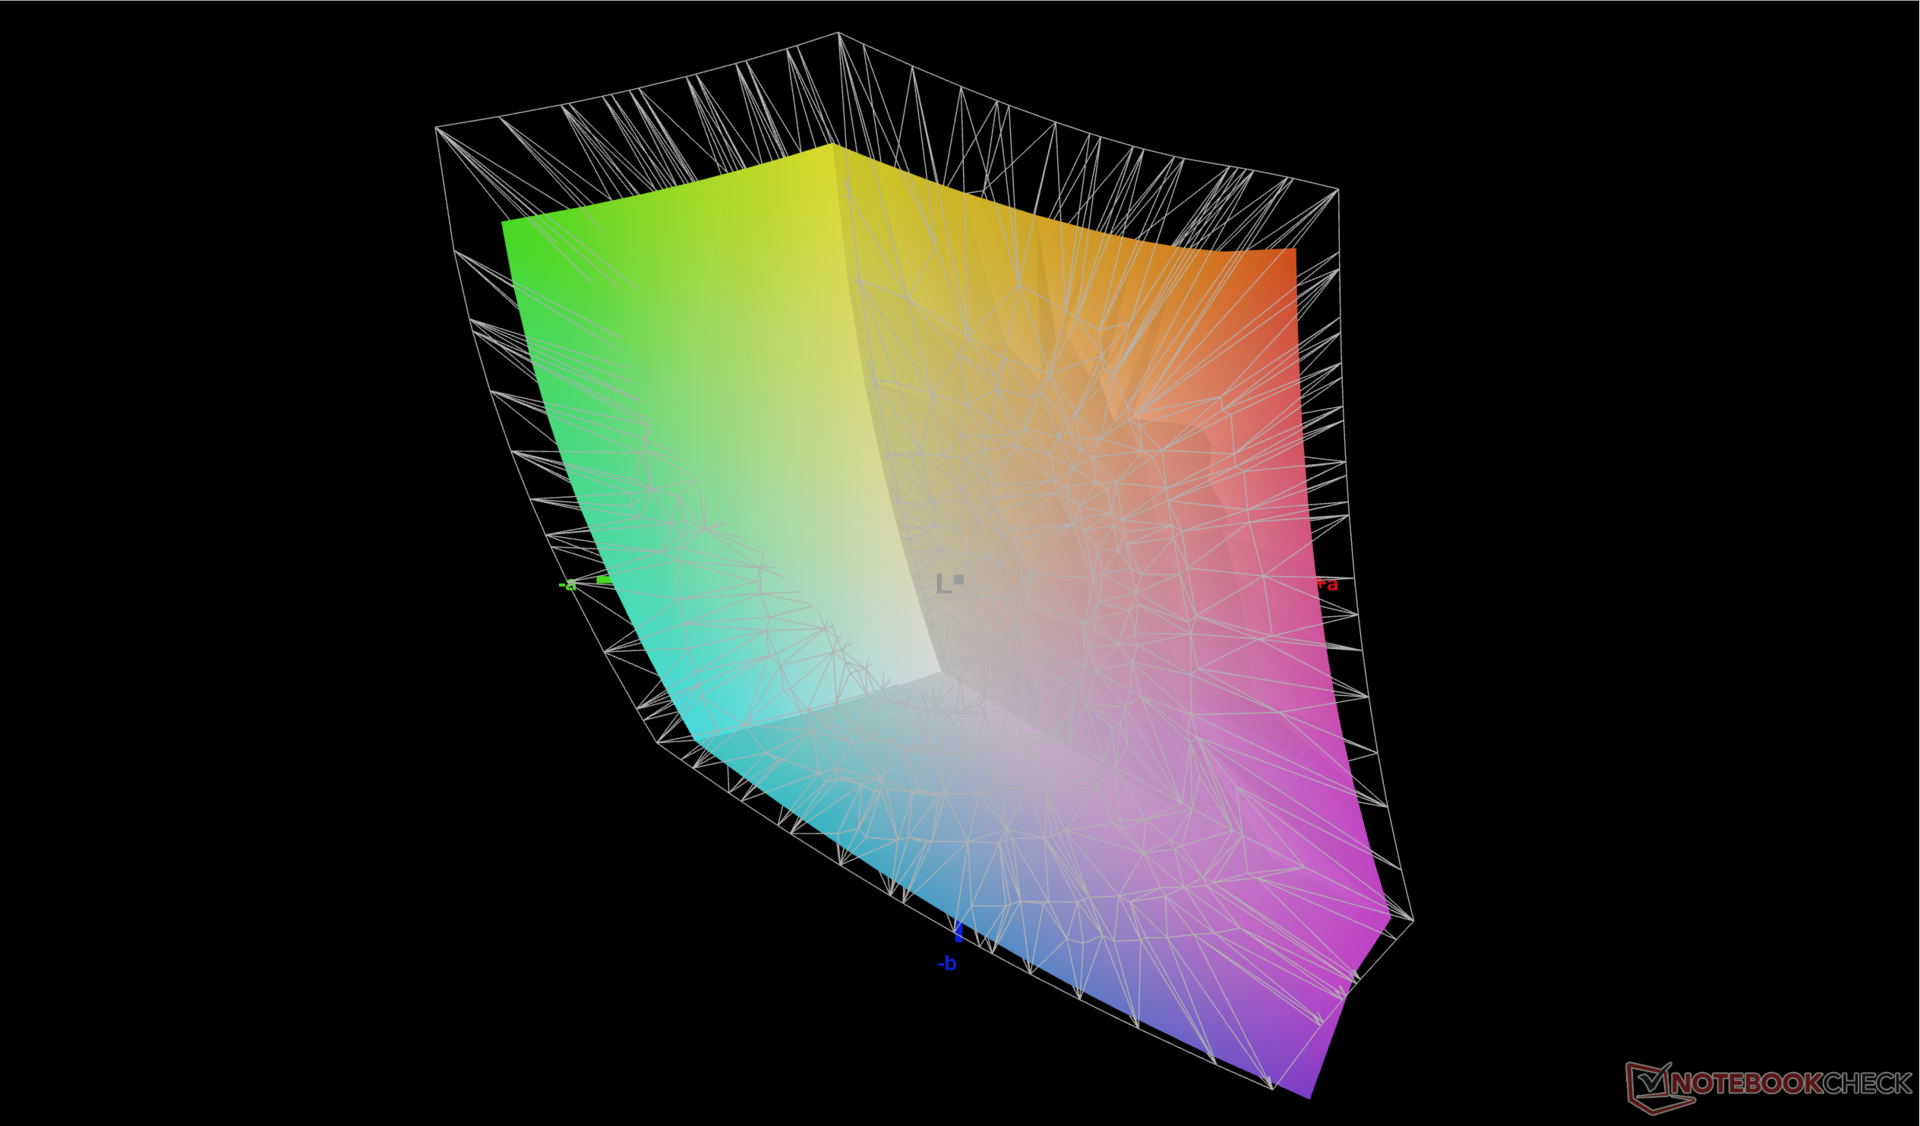
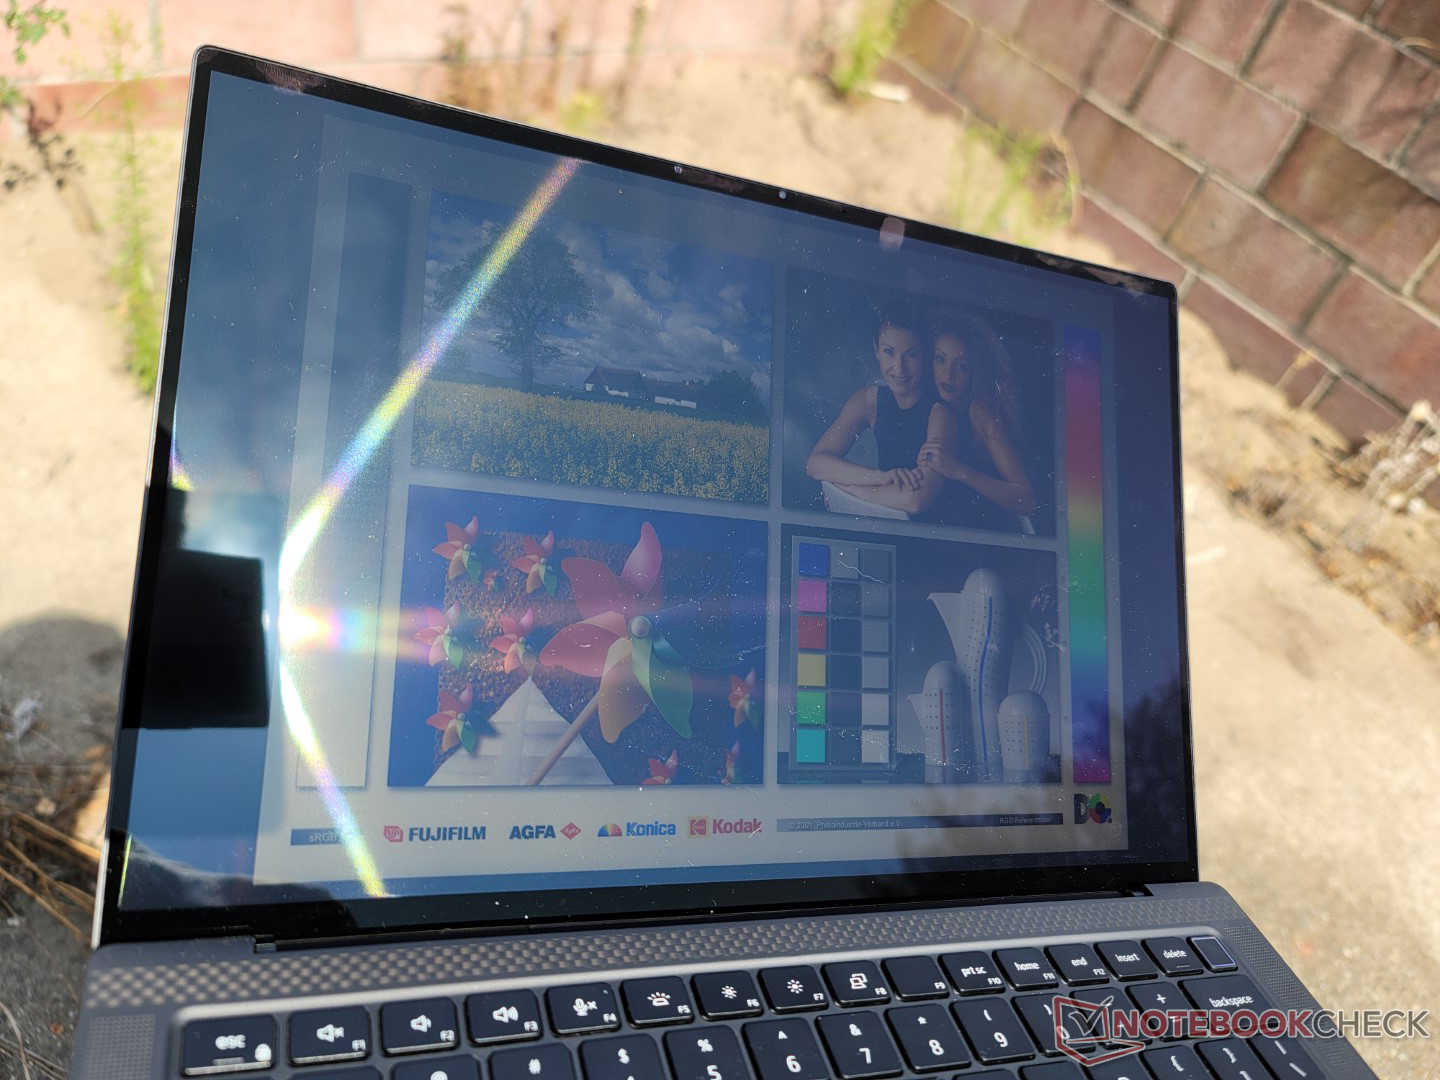
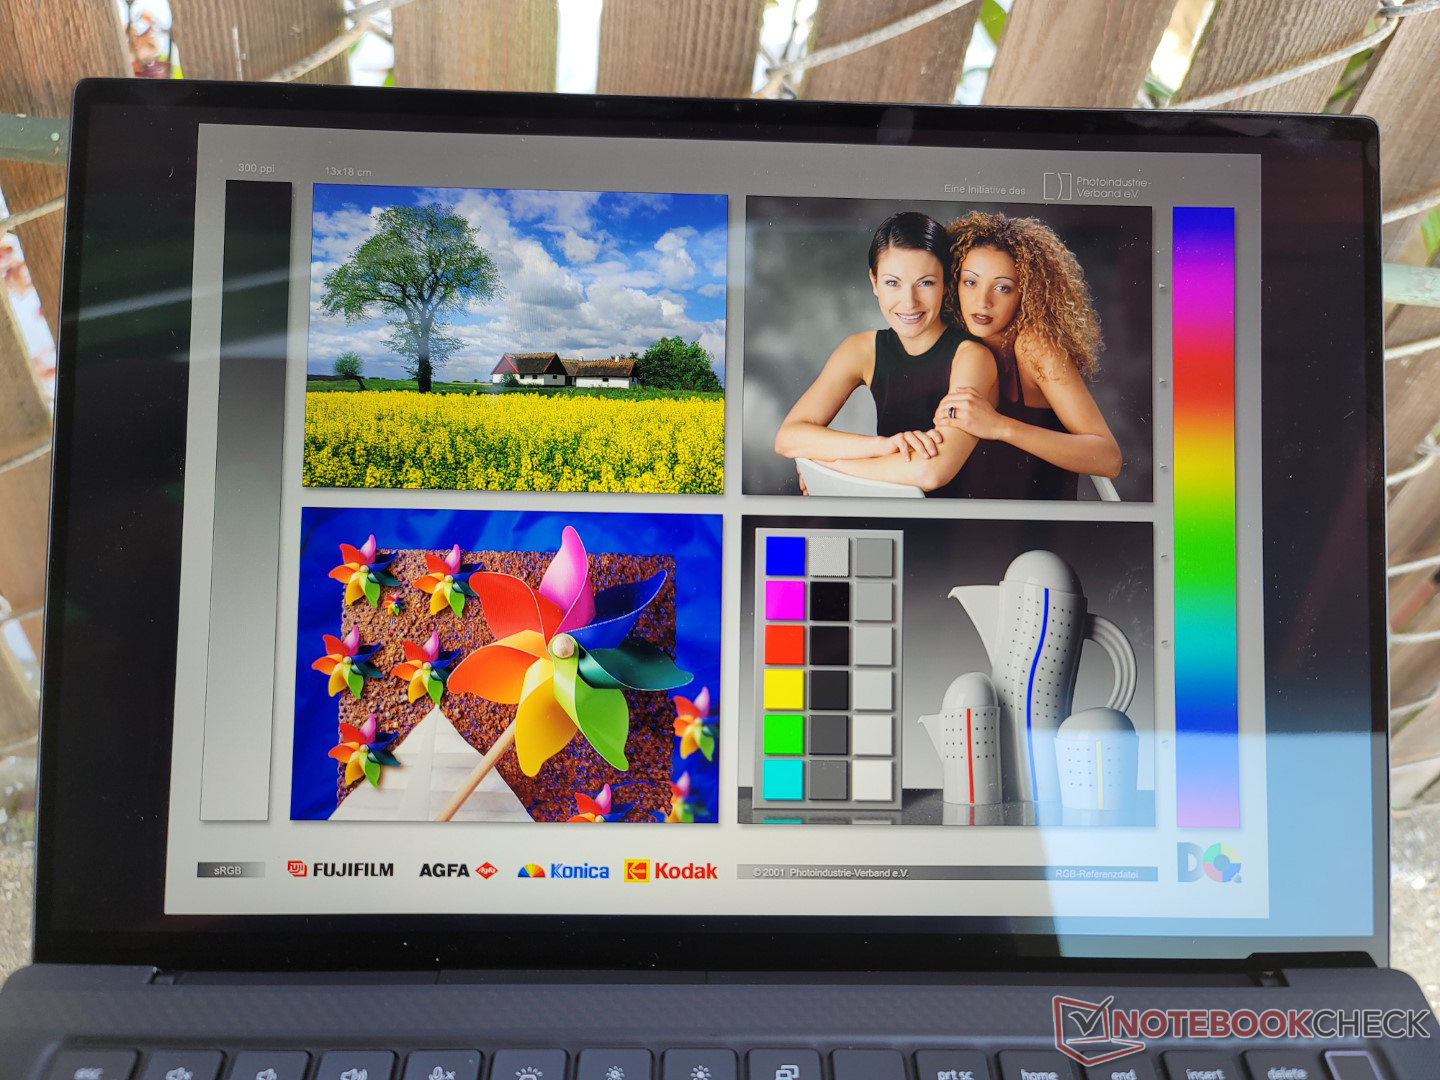
Skärm - Identisk med Latitude 9430 2-in-1
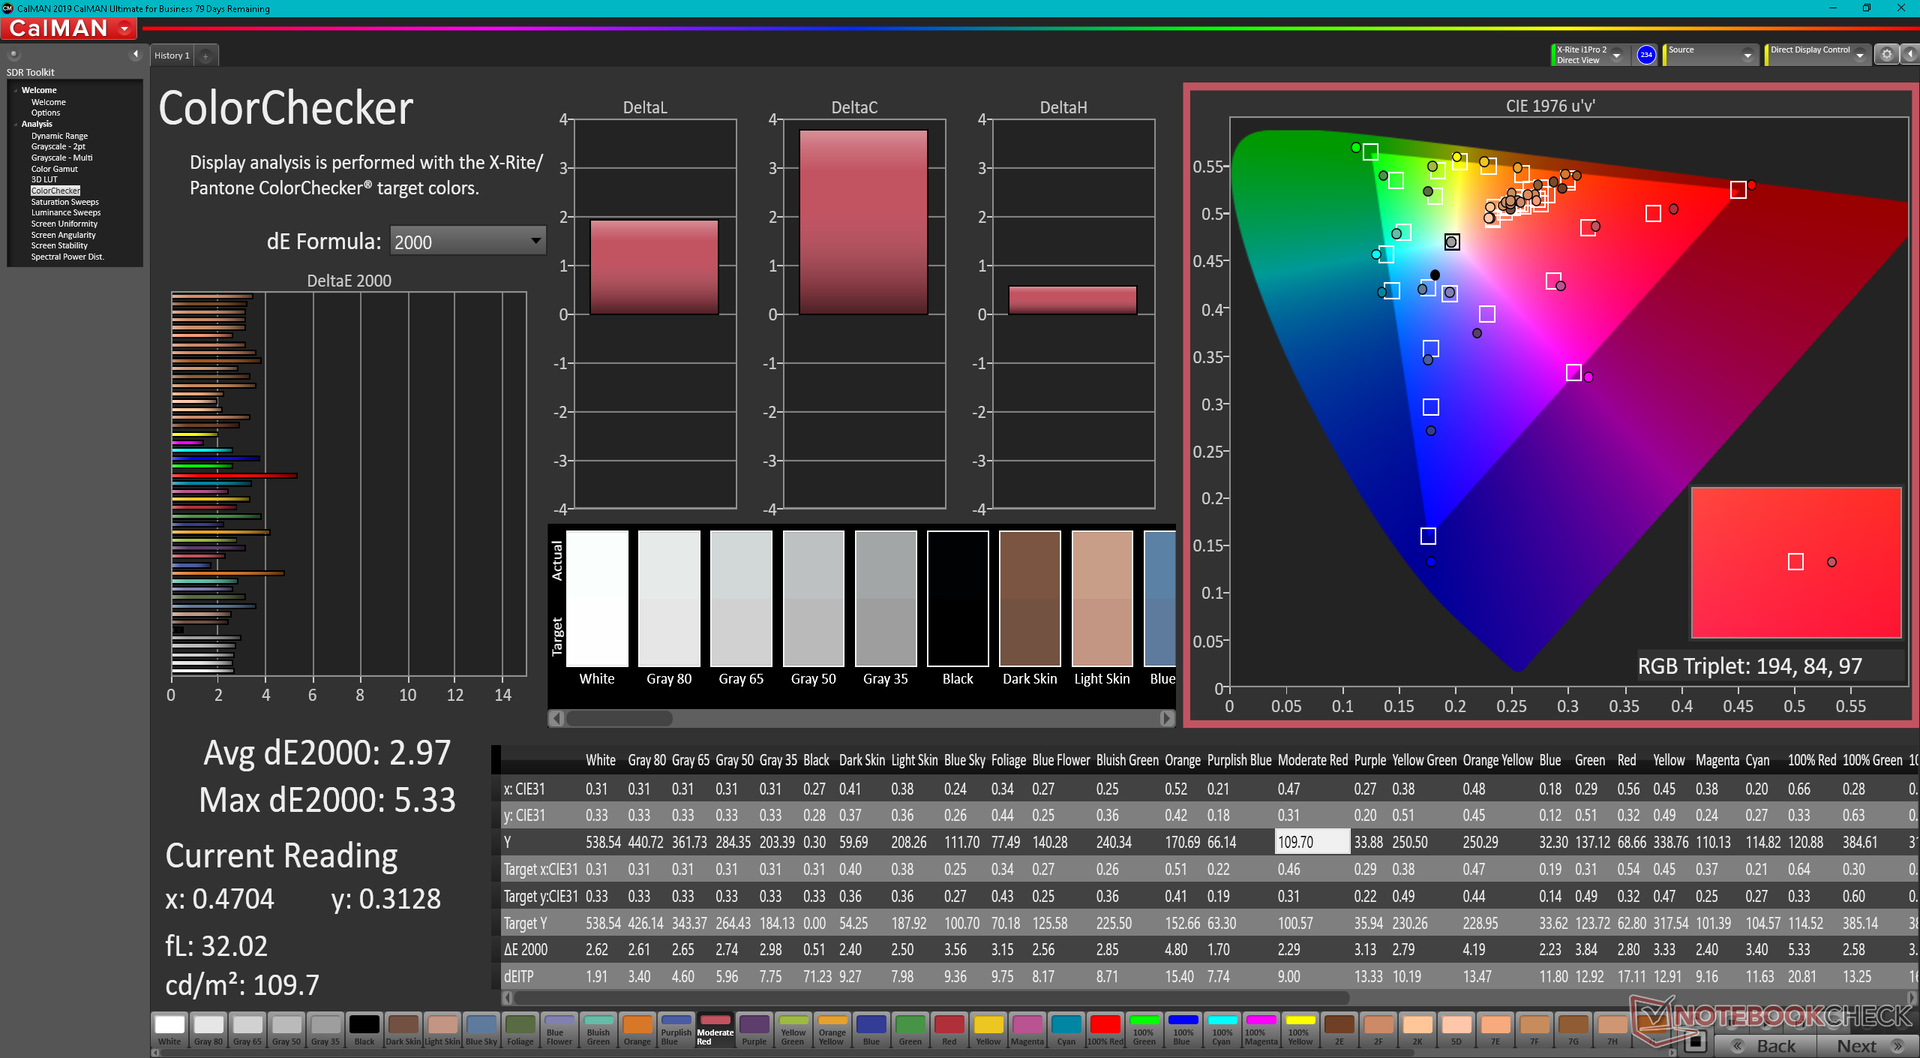
Precision 5470 har samma högkvalitativa AU Optronics B140QAN IPS-pekskärm som finns på Latitude 9430 2-i-1. Båda modellerna har alltså liknande svarstider för svart-vitt, gamut, kontrastförhållande och till och med total ljusstyrka. Den här skärmen är utmärkt för användare som vill ha full sRGB-täckning och relativt djupa svartnivåer, men den lider tyvärr av märkbar ghosting, vilket kan vara ett problem om man arbetar med tillämpningar som involverar snabb grafik eller video.
Det finns inga alternativ för OLED, AdobeRGB- eller P3-färger eller högre uppdateringsfrekvens att välja mellan, vilket innebär att användarna är begränsade till IPS och 60 Hz på alla nuvarande konfigurationer.
| |||||||||||||||||||||||||
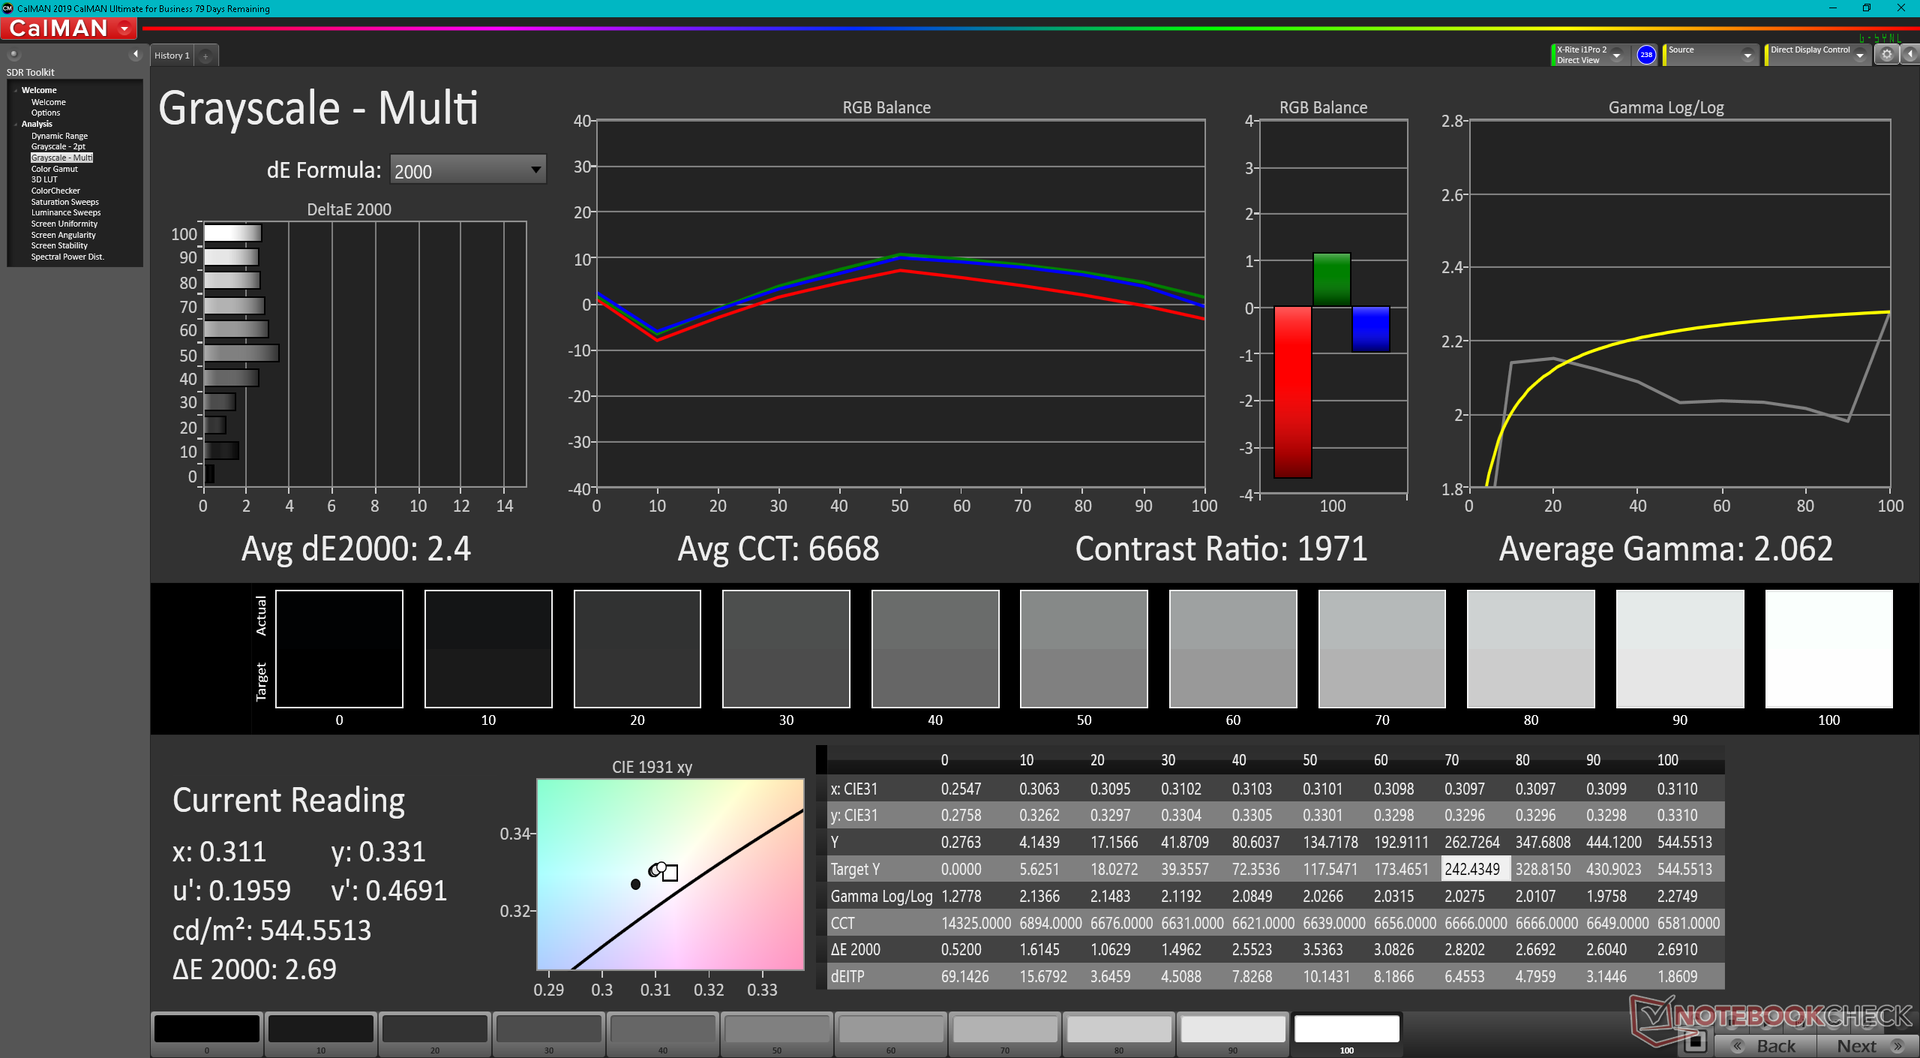
Distribution av ljusstyrkan: 94 %
Mitt på batteriet: 537 cd/m²
Kontrast: 1627:1 (Svärta: 0.33 cd/m²)
ΔE ColorChecker Calman: 2.97 | ∀{0.5-29.43 Ø4.75}
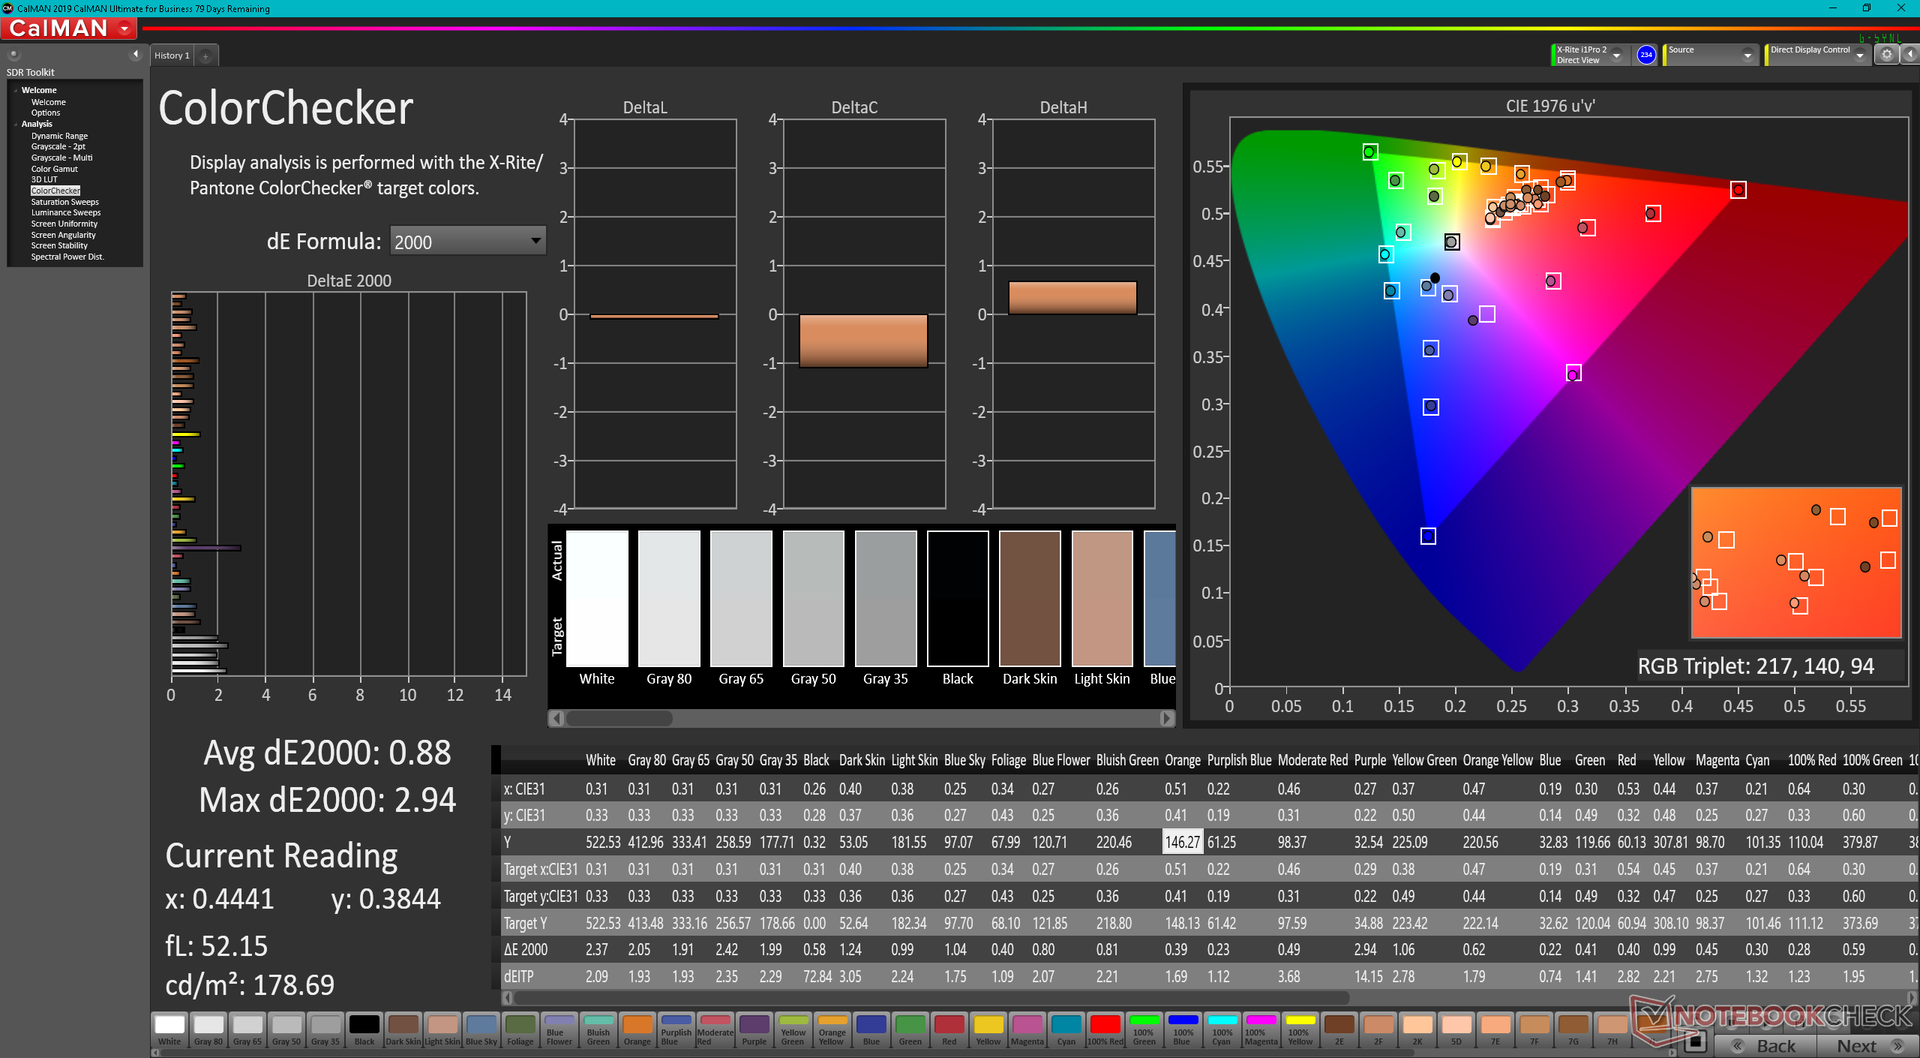
calibrated: 0.88
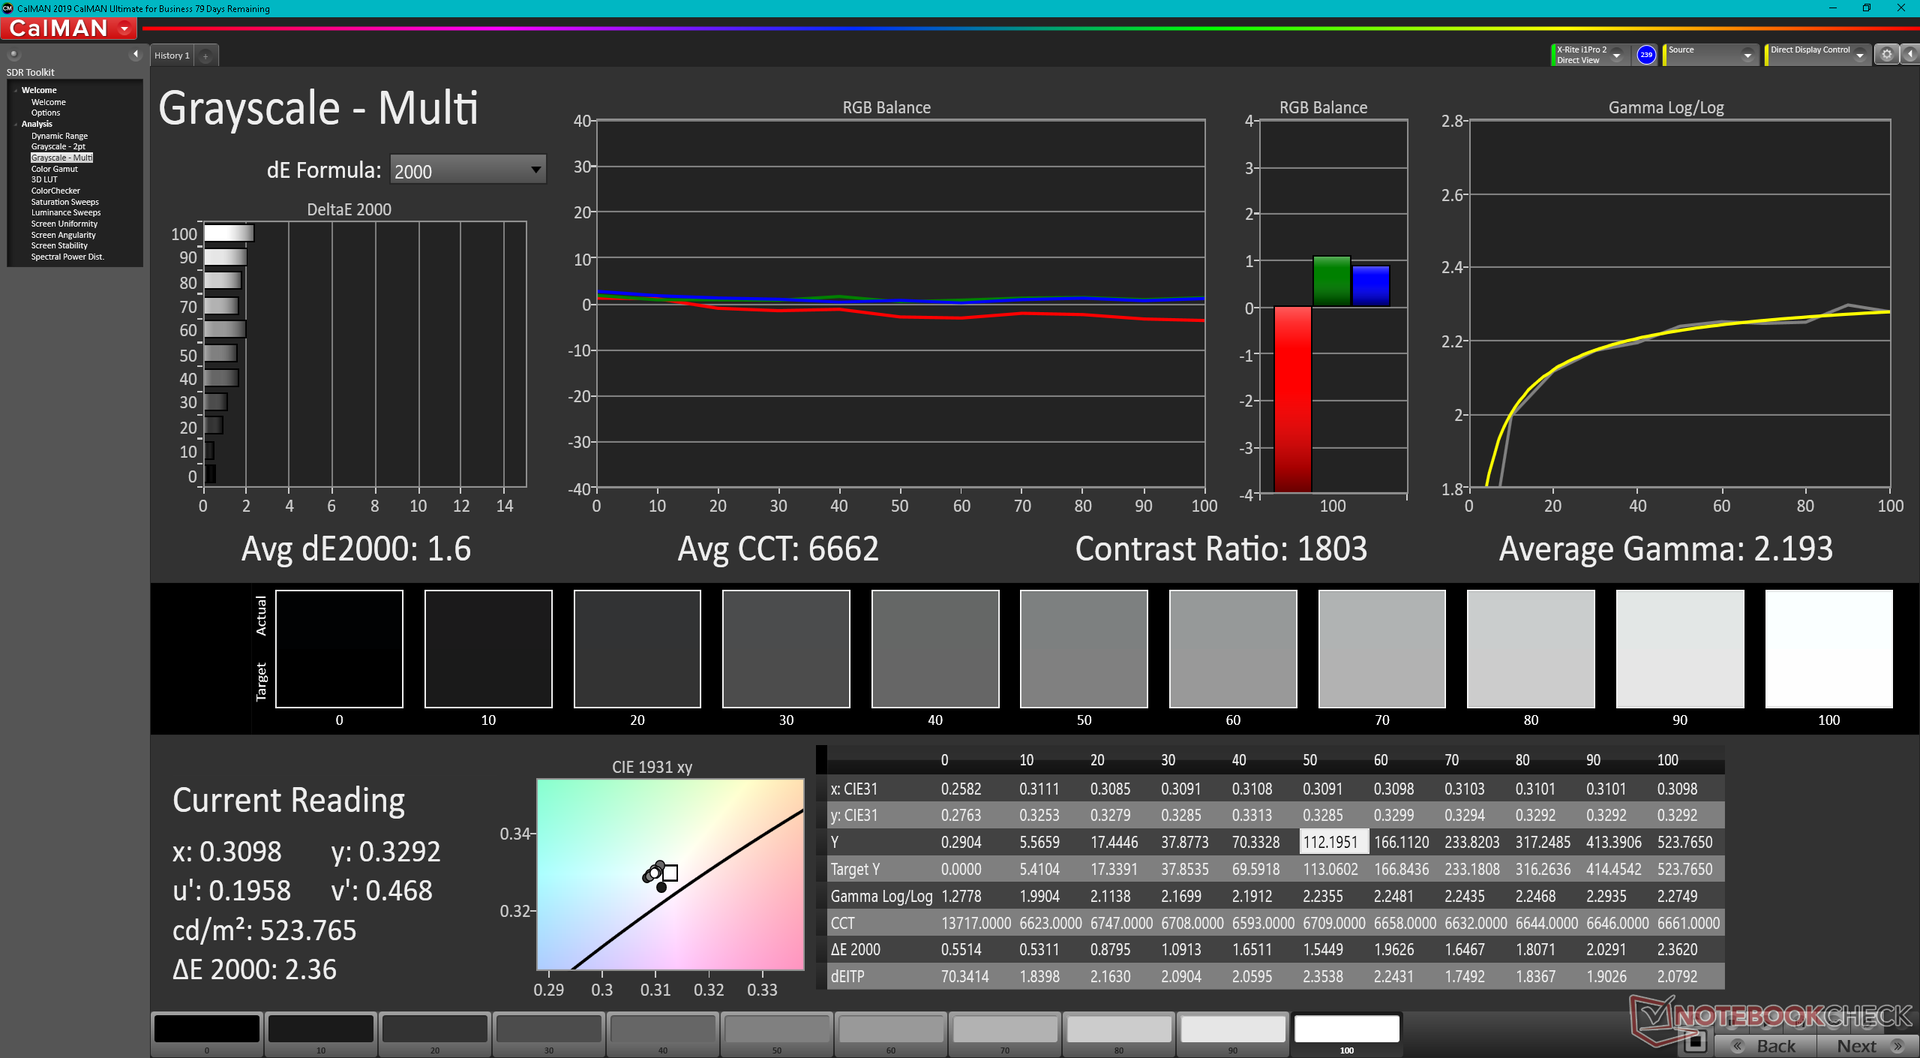
ΔE Greyscale Calman: 2.4 | ∀{0.09-98 Ø4.99}
78.7% AdobeRGB 1998 (Argyll 3D)
100% sRGB (Argyll 3D)
79.3% Display P3 (Argyll 3D)
Gamma: 2.06
CCT: 6668 K
| Dell Precision 5000 5470 AU Optronics B140QAN, IPS, 2560x1600, 14" | Lenovo ThinkPad P15v G2 21A9000XGE N156HCA-EAC, IPS LED, 1920x1080, 15.6" | Dell Precision 5000 5560 Sharp LQ156R1, IPS, 3840x2400, 15.6" | Lenovo ThinkPad P14s G2 AMD MNE001EA1-5, IPS LED, 3840x2160, 14" | HP ZBook Firefly 14 G8 2C9Q2EA AU Optronics AUO068B, IPS, 1920x1080, 14" | HP ZBook Firefly 14 G7 InfoVision IVO8C78 (X140NVFC R0), IPS, 1920x1080, 14" | |
|---|---|---|---|---|---|---|
| Display | -41% | 16% | 10% | -7% | -4% | |
| Display P3 Coverage (%) | 79.3 | 43.7 -45% | 94.9 20% | 96.8 22% | 70 -12% | 73.8 -7% |
| sRGB Coverage (%) | 100 | 65.1 -35% | 100 0% | 99.9 0% | 99.5 0% | 99 -1% |
| AdobeRGB 1998 Coverage (%) | 78.7 | 45.3 -42% | 100 27% | 85.8 9% | 71.4 -9% | 75.5 -4% |
| Response Times | 11% | 8% | 8% | -7% | -19% | |
| Response Time Grey 50% / Grey 80% * (ms) | 52.4 ? | 48 ? 8% | 47.2 ? 10% | 52 ? 1% | 64.4 ? -23% | 54.8 ? -5% |
| Response Time Black / White * (ms) | 32.4 ? | 28 ? 14% | 30.4 ? 6% | 28 ? 14% | 29.2 ? 10% | 43.2 ? -33% |
| PWM Frequency (Hz) | 284.1 ? | |||||
| Screen | -116% | -24% | -19% | -10% | -27% | |
| Brightness middle (cd/m²) | 537 | 305 -43% | 501.5 -7% | 512 -5% | 461 -14% | 934 74% |
| Brightness (cd/m²) | 518 | 281 -46% | 467 -10% | 487 -6% | 439 -15% | 937 81% |
| Brightness Distribution (%) | 94 | 88 -6% | 83 -12% | 90 -4% | 89 -5% | 87 -7% |
| Black Level * (cd/m²) | 0.33 | 0.32 3% | 0.44 -33% | 0.35 -6% | 0.24 27% | 0.37 -12% |
| Contrast (:1) | 1627 | 953 -41% | 1140 -30% | 1463 -10% | 1921 18% | 2524 55% |
| Colorchecker dE 2000 * | 2.97 | 5.9 -99% | 4.73 -59% | 3.1 -4% | 2.6 12% | 4.7 -58% |
| Colorchecker dE 2000 max. * | 5.33 | 20.1 -277% | 8.45 -59% | 8.4 -58% | 5.8 -9% | 10.5 -97% |
| Colorchecker dE 2000 calibrated * | 0.88 | 4.5 -411% | 0.51 42% | 0.4 55% | 1.1 -25% | 1.6 -82% |
| Greyscale dE 2000 * | 2.4 | 5.3 -121% | 3.6 -50% | 5.5 -129% | 4.4 -83% | 7.1 -196% |
| Gamma | 2.06 107% | 2.1 105% | 2.08 106% | 2.22 99% | 2.29 96% | 2.31 95% |
| CCT | 6668 97% | 6307 103% | 6447 101% | 6373 102% | 6478 100% | 6348 102% |
| Color Space (Percent of AdobeRGB 1998) (%) | 65.2 | 68.5 | ||||
| Color Space (Percent of sRGB) (%) | 99.4 | 98.9 | ||||
| Totalt genomsnitt (program/inställningar) | -49% /
-82% | 0% /
-11% | -0% /
-9% | -8% /
-9% | -17% /
-21% |
* ... mindre är bättre
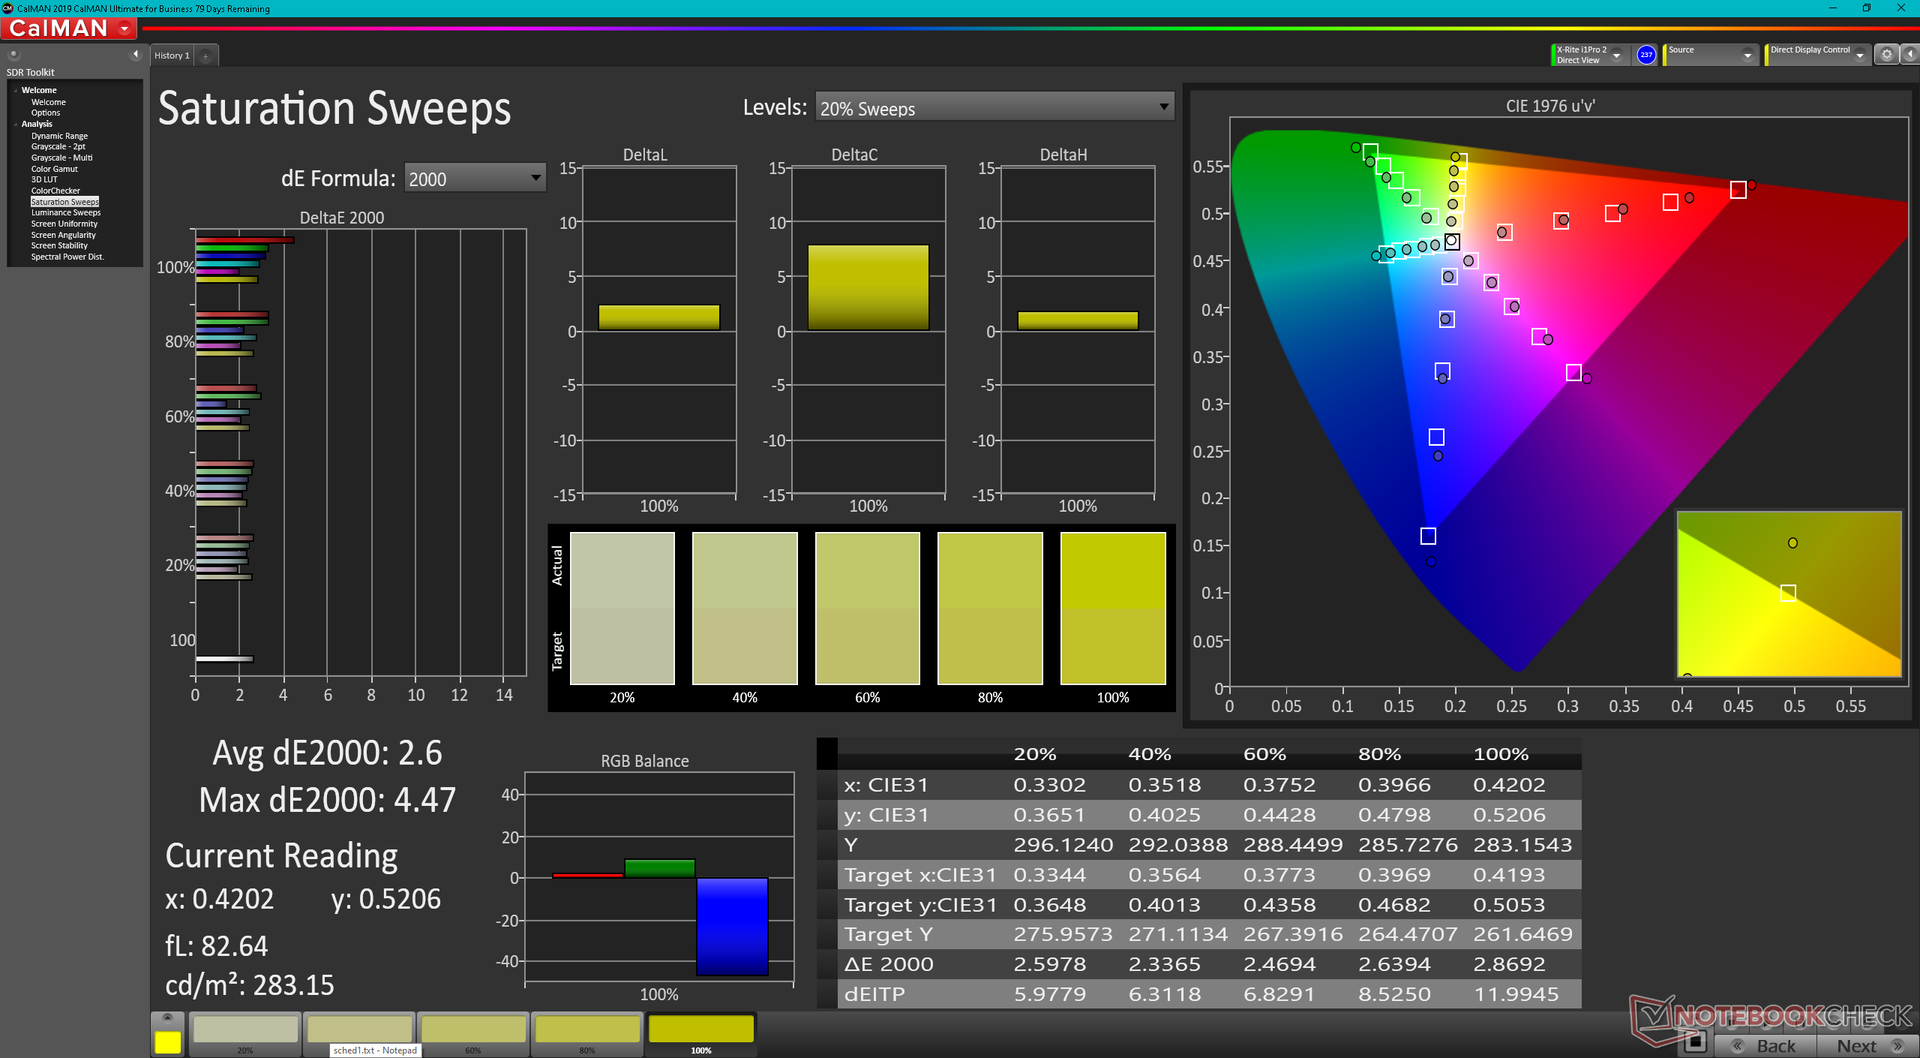
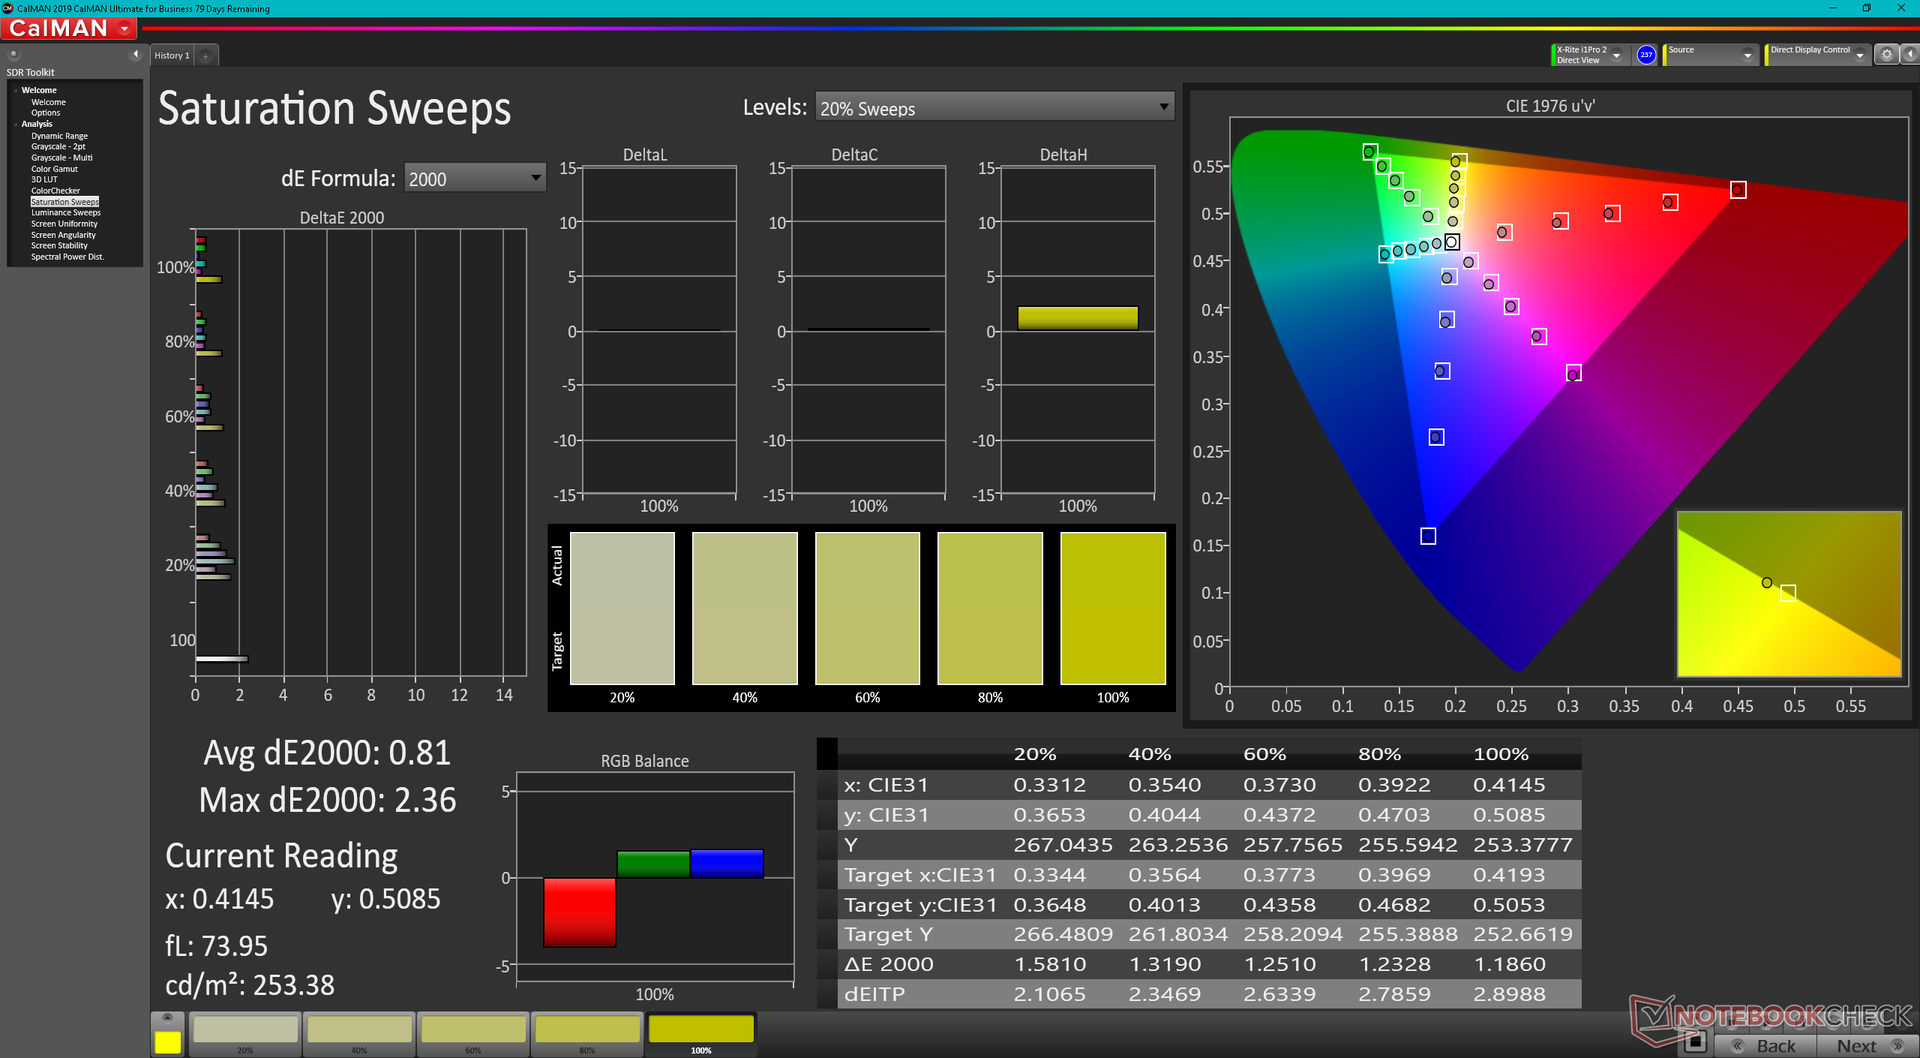
Skärmen är väl kalibrerad mot sRGB-standarden med genomsnittliga DeltaE-värden för gråskala och färg på bara 2,4 respektive 2,97. Vi kan förbättra dessa värden ytterligare med vår X-Rite-kolorimeter till <2 vardera, vilket framgår av våra CalMan-resultat nedan.
Visa svarstider
| ↔ Svarstid svart till vitt | ||
|---|---|---|
| 32.4 ms ... stiga ↗ och falla ↘ kombinerat | ↗ 15.6 ms stiga | 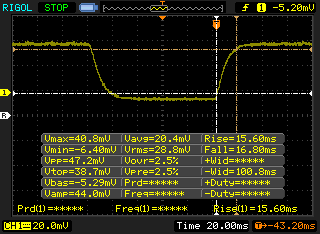 |
| ↘ 16.8 ms hösten | ||
| Skärmen visar långsamma svarsfrekvenser i våra tester och kommer att vara otillfredsställande för spelare. I jämförelse sträcker sig alla testade enheter från 0.1 (minst) till 240 (maximalt) ms. » 88 % av alla enheter är bättre. Detta innebär att den uppmätta svarstiden är sämre än genomsnittet av alla testade enheter (20 ms). | ||
| ↔ Svarstid 50 % grått till 80 % grått | ||
| 52.4 ms ... stiga ↗ och falla ↘ kombinerat | ↗ 24.4 ms stiga | 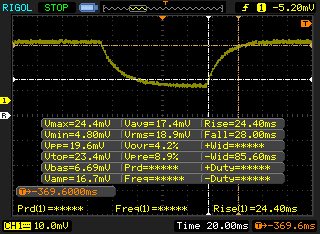 |
| ↘ 28 ms hösten | ||
| Skärmen visar långsamma svarsfrekvenser i våra tester och kommer att vara otillfredsställande för spelare. I jämförelse sträcker sig alla testade enheter från 0.165 (minst) till 636 (maximalt) ms. » 89 % av alla enheter är bättre. Detta innebär att den uppmätta svarstiden är sämre än genomsnittet av alla testade enheter (31.3 ms). | ||
Skärmflimmer / PWM (Puls-Width Modulation)
| Skärmflimmer / PWM upptäcktes inte | 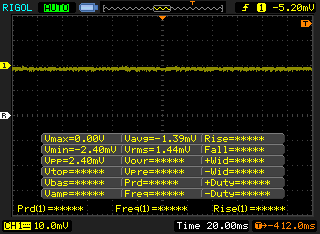 | ||
Som jämförelse: 53 % av alla testade enheter använder inte PWM för att dämpa skärmen. Om PWM upptäcktes mättes ett medelvärde av 7940 (minst: 5 - maximum: 343500) Hz. | |||
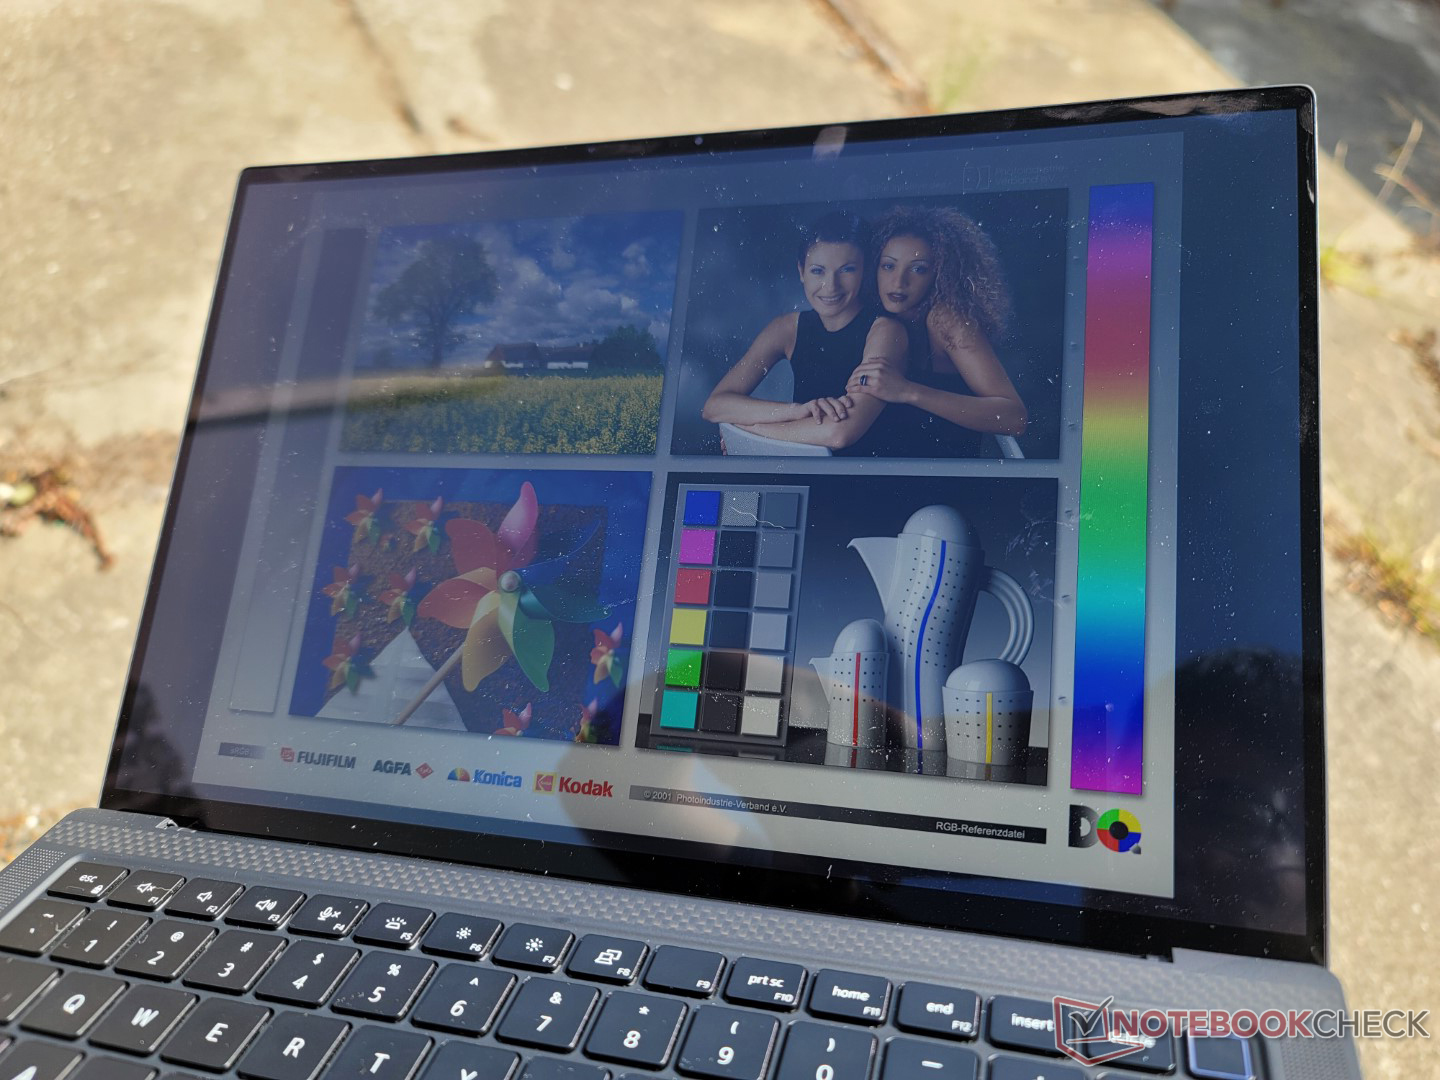
Skärmen är ljusare än på de flesta konsumentbaserade Ultrabooks för bättre synlighet utomhus. Trots detta är många HP EliteBook- eller ZBook-modeller erbjuder 1000-nit-panelalternativ för en betydligt lättare tid utomhus. Dell har ännu inte erbjudit liknande alternativ för ljusstyrka för sin Precision -serie.
Prestanda - Core i9 H-series CPU och diskret GPU
Provningsförhållanden
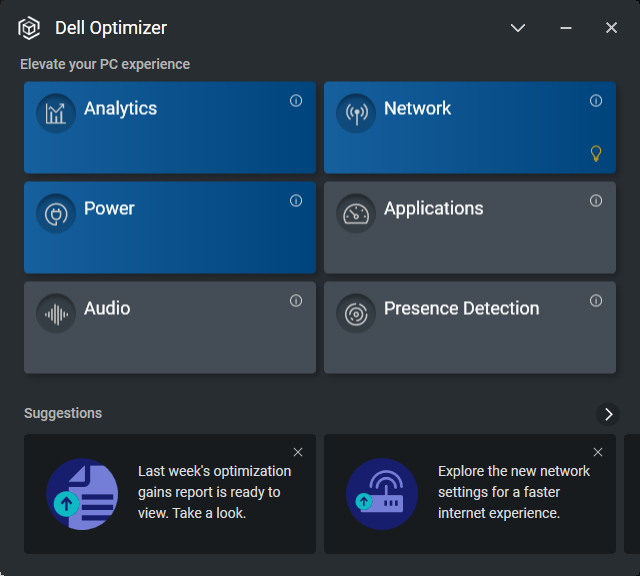
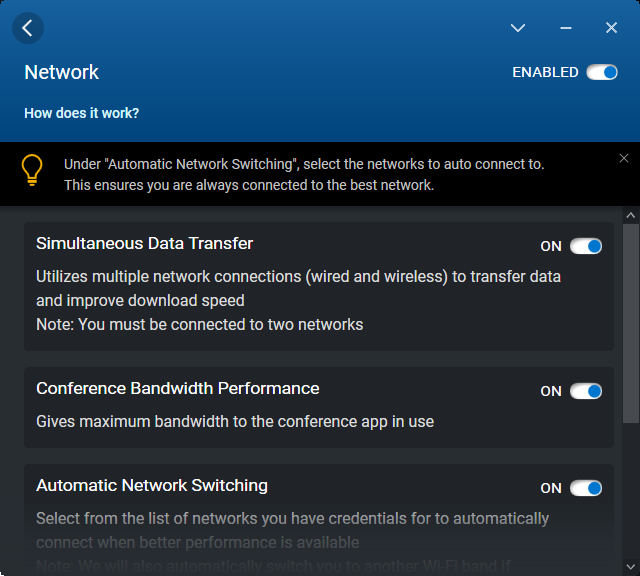
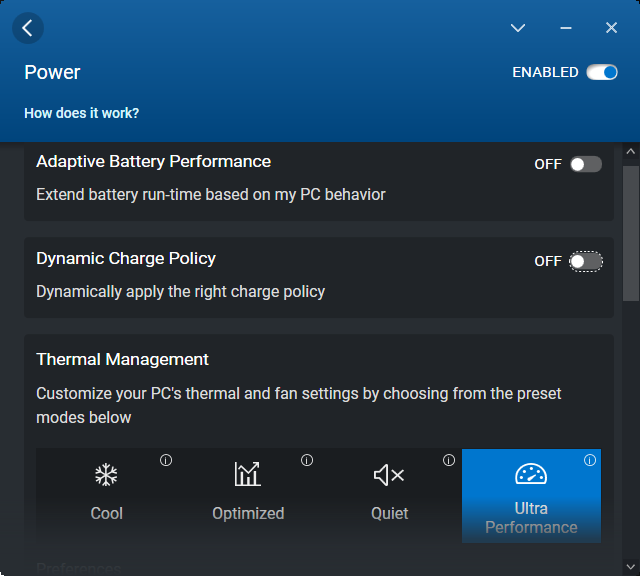
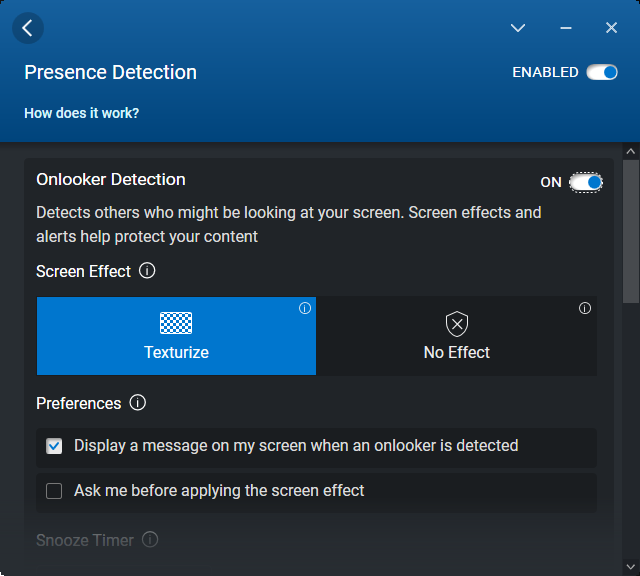
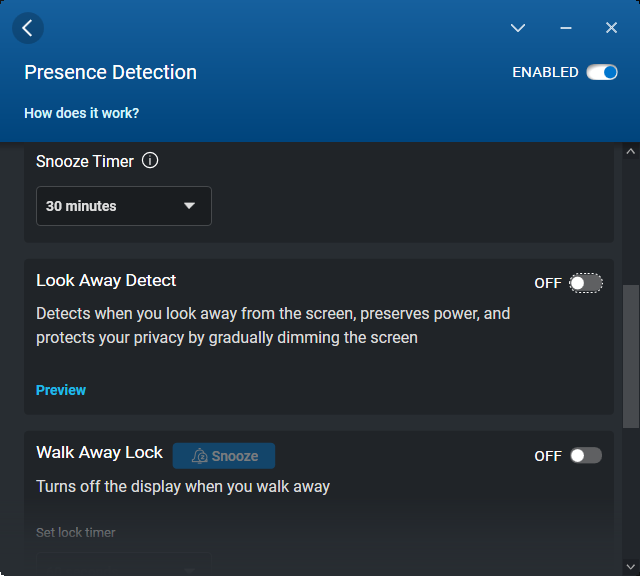
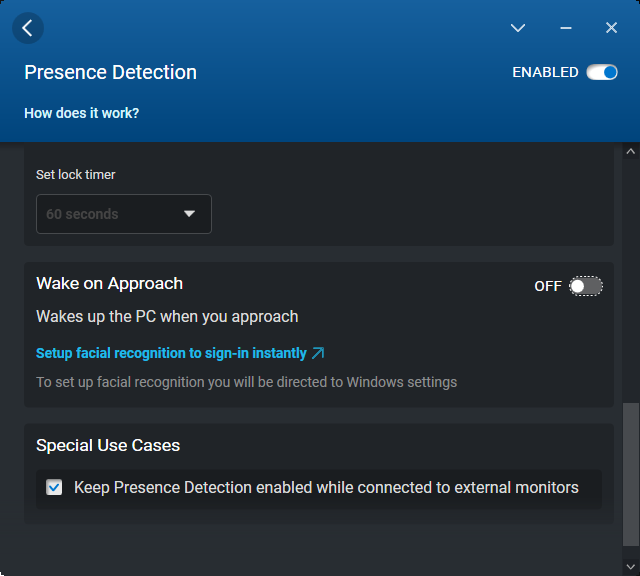
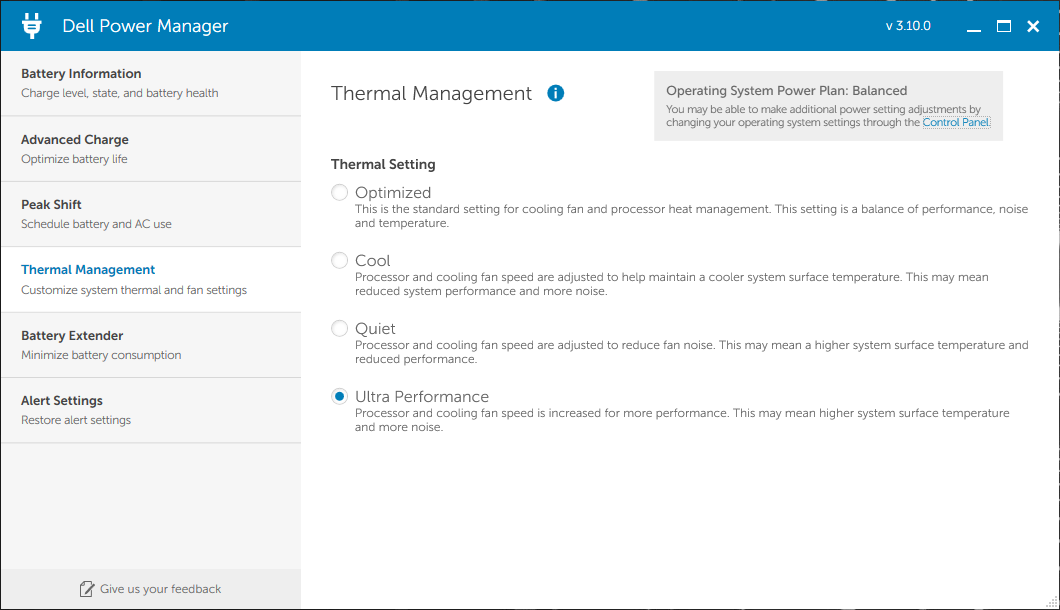
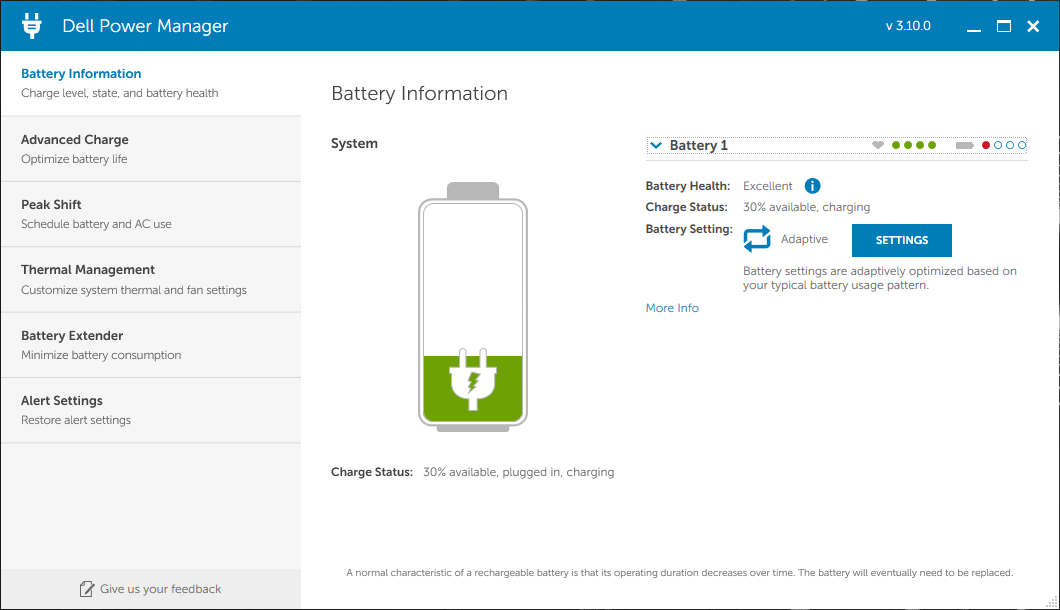
Vi ställde in vår enhet till Ultra Performance-läge via Dell Optimizer-programvaran innan vi körde alla benchmarks nedan. Vi aktiverade också den diskreta Nvidia GPU:n via Nvidias kontrollpanel. Observera att samma ströminställningar kan konfigureras via Dell Power Manager eller Dell Optimizer. Tack och lov kommer ändringar av strömprofilen i det ena programmet automatiskt att ändra inställningarna i det andra.
Processor
CPU-prestanda är en blandad kompott. Jämfört med andra bärbara 14-tums datorer eller arbetsstationer för företag erbjuder Precision 5470 betydligt snabbare prestanda för att vara i nivå med även större arbetsstationer som t.ex MSI WE76 eller HP ZBook Fury 17 G8. Detta är i huvudsak en CPU som är utformad för tjockare bärbara datorer som pressas in i en 14-tums formfaktor. Jämfört med andra bärbara datorer med samma Core i9-12900H CPU är processorn i vår Precision dock långsammare med i genomsnitt 15-20 procent.
En annan nackdel med processorn är dess instabila klockfrekvens. När du kör CineBench R15 xT i en slinga, till exempel, varierar resultaten mellan 1 500 och 2 100 poäng, vilket visas i diagrammet nedan, vilket tyder på att klockfrekvensen varierar. I jämförelse skulle inga sådana fluktuationer uppstå när man körde samma test på HP ZBook Fury 17 G8 eller MSI Creator Z17, båda med CPU:er i Core i9-klassen.
Cinebench R15 Multi Loop
Cinebench R23: Multi Core | Single Core
Cinebench R15: CPU Multi 64Bit | CPU Single 64Bit
Blender: v2.79 BMW27 CPU
7-Zip 18.03: 7z b 4 | 7z b 4 -mmt1
Geekbench 5.5: Multi-Core | Single-Core
HWBOT x265 Benchmark v2.2: 4k Preset
LibreOffice : 20 Documents To PDF
R Benchmark 2.5: Overall mean
| Cinebench R20 / CPU (Multi Core) | |
| Genomsnitt Intel Core i9-12900H (2681 - 7471, n=28) | |
| HP ZBook Fury 17 G8-4A6A9EA | |
| Dell Precision 5000 5470 | |
| MSI WE76 11UM-456 | |
| HP ZBook Power 15 G8 313S5EA | |
| Asus ProArt StudioBook 16 W7600H5A-2BL2 | |
| Dell Precision 5000 5560 | |
| HP ZBook Fury 17 G7 119W5EA | |
| Lenovo ThinkPad P15v G2 21A9000XGE | |
| Lenovo ThinkPad P14s G2 AMD | |
| Acer ConceptD 9 Pro | |
| Lenovo ThinkPad P14s Gen2-20VX000GGE | |
| HP ZBook Firefly 14 G8 2C9Q2EA | |
| HP ZBook Firefly 14 G7 | |
| Cinebench R20 / CPU (Single Core) | |
| Genomsnitt Intel Core i9-12900H (624 - 738, n=28) | |
| Dell Precision 5000 5470 | |
| HP ZBook Fury 17 G8-4A6A9EA | |
| MSI WE76 11UM-456 | |
| HP ZBook Power 15 G8 313S5EA | |
| Dell Precision 5000 5560 | |
| HP ZBook Firefly 14 G8 2C9Q2EA | |
| Lenovo ThinkPad P15v G2 21A9000XGE | |
| Asus ProArt StudioBook 16 W7600H5A-2BL2 | |
| Lenovo ThinkPad P14s G2 AMD | |
| Lenovo ThinkPad P14s Gen2-20VX000GGE | |
| Acer ConceptD 9 Pro | |
| HP ZBook Fury 17 G7 119W5EA | |
| HP ZBook Firefly 14 G7 | |
| Cinebench R23 / Multi Core | |
| Genomsnitt Intel Core i9-12900H (7359 - 19648, n=28) | |
| MSI WE76 11UM-456 | |
| HP ZBook Fury 17 G8-4A6A9EA | |
| Dell Precision 5000 5470 | |
| HP ZBook Power 15 G8 313S5EA | |
| Asus ProArt StudioBook 16 W7600H5A-2BL2 | |
| Lenovo ThinkPad P15v G2 21A9000XGE | |
| Dell Precision 5000 5560 | |
| Lenovo ThinkPad P14s G2 AMD | |
| HP ZBook Fury 17 G7 119W5EA | |
| Lenovo ThinkPad P14s Gen2-20VX000GGE | |
| HP ZBook Firefly 14 G7 | |
| Cinebench R23 / Single Core | |
| Genomsnitt Intel Core i9-12900H (1634 - 1930, n=28) | |
| Dell Precision 5000 5470 | |
| HP ZBook Fury 17 G8-4A6A9EA | |
| MSI WE76 11UM-456 | |
| HP ZBook Power 15 G8 313S5EA | |
| Dell Precision 5000 5560 | |
| Lenovo ThinkPad P14s Gen2-20VX000GGE | |
| Asus ProArt StudioBook 16 W7600H5A-2BL2 | |
| Lenovo ThinkPad P14s G2 AMD | |
| HP ZBook Fury 17 G7 119W5EA | |
| HP ZBook Firefly 14 G7 | |
| Cinebench R15 / CPU Multi 64Bit | |
| Genomsnitt Intel Core i9-12900H (1395 - 3077, n=28) | |
| Dell Precision 5000 5470 | |
| MSI WE76 11UM-456 | |
| HP ZBook Fury 17 G8-4A6A9EA | |
| HP ZBook Power 15 G8 313S5EA | |
| HP ZBook Power 15 G8 313S5EA | |
| Asus ProArt StudioBook 16 W7600H5A-2BL2 | |
| Lenovo ThinkPad P15v G2 21A9000XGE | |
| Acer ConceptD 9 Pro | |
| Dell Precision 5000 5560 | |
| Lenovo ThinkPad P14s G2 AMD | |
| HP ZBook Fury 17 G7 119W5EA | |
| Lenovo ThinkPad P14s Gen2-20VX000GGE | |
| HP ZBook Firefly 14 G8 2C9Q2EA | |
| HP ZBook Firefly 14 G7 | |
| Cinebench R15 / CPU Single 64Bit | |
| Genomsnitt Intel Core i9-12900H (235 - 277, n=29) | |
| HP ZBook Fury 17 G8-4A6A9EA | |
| Dell Precision 5000 5470 | |
| MSI WE76 11UM-456 | |
| Dell Precision 5000 5560 | |
| HP ZBook Power 15 G8 313S5EA | |
| Asus ProArt StudioBook 16 W7600H5A-2BL2 | |
| HP ZBook Firefly 14 G8 2C9Q2EA | |
| Lenovo ThinkPad P14s G2 AMD | |
| Lenovo ThinkPad P15v G2 21A9000XGE | |
| Lenovo ThinkPad P14s Gen2-20VX000GGE | |
| HP ZBook Fury 17 G7 119W5EA | |
| Acer ConceptD 9 Pro | |
| HP ZBook Firefly 14 G7 | |
| Blender / v2.79 BMW27 CPU | |
| HP ZBook Firefly 14 G7 | |
| Lenovo ThinkPad P14s Gen2-20VX000GGE | |
| HP ZBook Firefly 14 G8 2C9Q2EA | |
| Lenovo ThinkPad P14s G2 AMD | |
| Lenovo ThinkPad P15v G2 21A9000XGE | |
| Dell Precision 5000 5560 | |
| HP ZBook Fury 17 G7 119W5EA | |
| Asus ProArt StudioBook 16 W7600H5A-2BL2 | |
| HP ZBook Power 15 G8 313S5EA | |
| Dell Precision 5000 5470 | |
| HP ZBook Fury 17 G8-4A6A9EA | |
| Genomsnitt Intel Core i9-12900H (160 - 451, n=28) | |
| 7-Zip 18.03 / 7z b 4 | |
| Genomsnitt Intel Core i9-12900H (34684 - 76677, n=28) | |
| MSI WE76 11UM-456 | |
| Dell Precision 5000 5470 | |
| HP ZBook Fury 17 G8-4A6A9EA | |
| HP ZBook Power 15 G8 313S5EA | |
| Asus ProArt StudioBook 16 W7600H5A-2BL2 | |
| Lenovo ThinkPad P14s G2 AMD | |
| Dell Precision 5000 5560 | |
| HP ZBook Fury 17 G7 119W5EA | |
| Acer ConceptD 9 Pro | |
| Lenovo ThinkPad P15v G2 21A9000XGE | |
| HP ZBook Firefly 14 G8 2C9Q2EA | |
| Lenovo ThinkPad P14s Gen2-20VX000GGE | |
| HP ZBook Firefly 14 G7 | |
| 7-Zip 18.03 / 7z b 4 -mmt1 | |
| HP ZBook Fury 17 G8-4A6A9EA | |
| Genomsnitt Intel Core i9-12900H (5302 - 6289, n=28) | |
| Dell Precision 5000 5560 | |
| MSI WE76 11UM-456 | |
| HP ZBook Power 15 G8 313S5EA | |
| HP ZBook Fury 17 G7 119W5EA | |
| Lenovo ThinkPad P14s Gen2-20VX000GGE | |
| Dell Precision 5000 5470 | |
| Acer ConceptD 9 Pro | |
| HP ZBook Firefly 14 G8 2C9Q2EA | |
| Lenovo ThinkPad P14s G2 AMD | |
| Lenovo ThinkPad P15v G2 21A9000XGE | |
| Asus ProArt StudioBook 16 W7600H5A-2BL2 | |
| HP ZBook Firefly 14 G7 | |
| Geekbench 5.5 / Multi-Core | |
| Dell Precision 5000 5470 | |
| Genomsnitt Intel Core i9-12900H (8519 - 14376, n=31) | |
| MSI WE76 11UM-456 | |
| Asus ProArt StudioBook 16 W7600H5A-2BL2 | |
| HP ZBook Fury 17 G8-4A6A9EA | |
| HP ZBook Power 15 G8 313S5EA | |
| Acer ConceptD 9 Pro | |
| Lenovo ThinkPad P14s G2 AMD | |
| HP ZBook Fury 17 G7 119W5EA | |
| Lenovo ThinkPad P15v G2 21A9000XGE | |
| Lenovo ThinkPad P14s Gen2-20VX000GGE | |
| HP ZBook Firefly 14 G8 2C9Q2EA | |
| HP ZBook Firefly 14 G7 | |
| Geekbench 5.5 / Single-Core | |
| Dell Precision 5000 5470 | |
| Genomsnitt Intel Core i9-12900H (1631 - 1897, n=31) | |
| MSI WE76 11UM-456 | |
| Lenovo ThinkPad P14s Gen2-20VX000GGE | |
| HP ZBook Fury 17 G8-4A6A9EA | |
| HP ZBook Firefly 14 G8 2C9Q2EA | |
| HP ZBook Power 15 G8 313S5EA | |
| Asus ProArt StudioBook 16 W7600H5A-2BL2 | |
| Lenovo ThinkPad P15v G2 21A9000XGE | |
| Lenovo ThinkPad P14s G2 AMD | |
| HP ZBook Fury 17 G7 119W5EA | |
| Acer ConceptD 9 Pro | |
| HP ZBook Firefly 14 G7 | |
| HWBOT x265 Benchmark v2.2 / 4k Preset | |
| Genomsnitt Intel Core i9-12900H (8.05 - 22.5, n=28) | |
| MSI WE76 11UM-456 | |
| HP ZBook Fury 17 G8-4A6A9EA | |
| HP ZBook Power 15 G8 313S5EA | |
| Asus ProArt StudioBook 16 W7600H5A-2BL2 | |
| Dell Precision 5000 5470 | |
| Dell Precision 5000 5560 | |
| Lenovo ThinkPad P14s G2 AMD | |
| Lenovo ThinkPad P15v G2 21A9000XGE | |
| HP ZBook Fury 17 G7 119W5EA | |
| Lenovo ThinkPad P14s Gen2-20VX000GGE | |
| HP ZBook Firefly 14 G8 2C9Q2EA | |
| HP ZBook Firefly 14 G7 | |
| LibreOffice / 20 Documents To PDF | |
| HP ZBook Firefly 14 G7 | |
| Acer ConceptD 9 Pro | |
| HP ZBook Fury 17 G7 119W5EA | |
| Lenovo ThinkPad P15v G2 21A9000XGE | |
| HP ZBook Fury 17 G8-4A6A9EA | |
| HP ZBook Firefly 14 G8 2C9Q2EA | |
| Lenovo ThinkPad P14s G2 AMD | |
| Dell Precision 5000 5560 | |
| MSI WE76 11UM-456 | |
| Dell Precision 5000 5470 | |
| HP ZBook Power 15 G8 313S5EA | |
| Genomsnitt Intel Core i9-12900H (36.8 - 59.8, n=28) | |
| Lenovo ThinkPad P14s Gen2-20VX000GGE | |
| Asus ProArt StudioBook 16 W7600H5A-2BL2 | |
| R Benchmark 2.5 / Overall mean | |
| HP ZBook Firefly 14 G7 | |
| HP ZBook Power 15 G8 313S5EA | |
| Lenovo ThinkPad P15v G2 21A9000XGE | |
| HP ZBook Fury 17 G7 119W5EA | |
| Asus ProArt StudioBook 16 W7600H5A-2BL2 | |
| HP ZBook Firefly 14 G8 2C9Q2EA | |
| Lenovo ThinkPad P14s Gen2-20VX000GGE | |
| MSI WE76 11UM-456 | |
| Lenovo ThinkPad P14s G2 AMD | |
| Dell Precision 5000 5560 | |
| HP ZBook Fury 17 G8-4A6A9EA | |
| Dell Precision 5000 5470 | |
| Genomsnitt Intel Core i9-12900H (0.4218 - 0.506, n=28) | |
Cinebench R23: Multi Core | Single Core
Cinebench R15: CPU Multi 64Bit | CPU Single 64Bit
Blender: v2.79 BMW27 CPU
7-Zip 18.03: 7z b 4 | 7z b 4 -mmt1
Geekbench 5.5: Multi-Core | Single-Core
HWBOT x265 Benchmark v2.2: 4k Preset
LibreOffice : 20 Documents To PDF
R Benchmark 2.5: Overall mean
* ... mindre är bättre
AIDA64: FP32 Ray-Trace | FPU Julia | CPU SHA3 | CPU Queen | FPU SinJulia | FPU Mandel | CPU AES | CPU ZLib | FP64 Ray-Trace | CPU PhotoWorxx
| Performance rating | |
| Genomsnitt Intel Core i9-12900H | |
| Dell Precision 5000 5470 | |
| Lenovo ThinkPad P14s G2 AMD | |
| Lenovo ThinkPad P15v G2 21A9000XGE | |
| HP ZBook Firefly 14 G8 2C9Q2EA | |
| HP ZBook Firefly 14 G7 | |
| AIDA64 / FP32 Ray-Trace | |
| Dell Precision 5000 5470 | |
| Lenovo ThinkPad P15v G2 21A9000XGE | |
| Genomsnitt Intel Core i9-12900H (4074 - 18289, n=29) | |
| Lenovo ThinkPad P14s G2 AMD | |
| HP ZBook Firefly 14 G8 2C9Q2EA | |
| HP ZBook Firefly 14 G7 | |
| AIDA64 / FPU Julia | |
| Lenovo ThinkPad P14s G2 AMD | |
| Dell Precision 5000 5470 | |
| Genomsnitt Intel Core i9-12900H (22307 - 93236, n=29) | |
| Lenovo ThinkPad P15v G2 21A9000XGE | |
| HP ZBook Firefly 14 G8 2C9Q2EA | |
| HP ZBook Firefly 14 G7 | |
| AIDA64 / CPU SHA3 | |
| Lenovo ThinkPad P15v G2 21A9000XGE | |
| Genomsnitt Intel Core i9-12900H (1378 - 4215, n=29) | |
| Dell Precision 5000 5470 | |
| Lenovo ThinkPad P14s G2 AMD | |
| HP ZBook Firefly 14 G8 2C9Q2EA | |
| HP ZBook Firefly 14 G7 | |
| AIDA64 / CPU Queen | |
| Dell Precision 5000 5470 | |
| Genomsnitt Intel Core i9-12900H (78172 - 111241, n=28) | |
| Lenovo ThinkPad P15v G2 21A9000XGE | |
| Lenovo ThinkPad P14s G2 AMD | |
| HP ZBook Firefly 14 G7 | |
| HP ZBook Firefly 14 G8 2C9Q2EA | |
| AIDA64 / FPU SinJulia | |
| Lenovo ThinkPad P14s G2 AMD | |
| Genomsnitt Intel Core i9-12900H (5709 - 10410, n=29) | |
| Lenovo ThinkPad P15v G2 21A9000XGE | |
| Dell Precision 5000 5470 | |
| HP ZBook Firefly 14 G8 2C9Q2EA | |
| HP ZBook Firefly 14 G7 | |
| AIDA64 / FPU Mandel | |
| Lenovo ThinkPad P14s G2 AMD | |
| Dell Precision 5000 5470 | |
| Lenovo ThinkPad P15v G2 21A9000XGE | |
| Genomsnitt Intel Core i9-12900H (11257 - 45581, n=29) | |
| HP ZBook Firefly 14 G8 2C9Q2EA | |
| HP ZBook Firefly 14 G7 | |
| AIDA64 / CPU AES | |
| Lenovo ThinkPad P14s G2 AMD | |
| Genomsnitt Intel Core i9-12900H (31935 - 151546, n=29) | |
| Lenovo ThinkPad P15v G2 21A9000XGE | |
| HP ZBook Firefly 14 G8 2C9Q2EA | |
| Dell Precision 5000 5470 | |
| HP ZBook Firefly 14 G7 | |
| AIDA64 / CPU ZLib | |
| Genomsnitt Intel Core i9-12900H (449 - 1193, n=29) | |
| Lenovo ThinkPad P15v G2 21A9000XGE | |
| Lenovo ThinkPad P14s G2 AMD | |
| Dell Precision 5000 5470 | |
| HP ZBook Firefly 14 G8 2C9Q2EA | |
| HP ZBook Firefly 14 G7 | |
| AIDA64 / FP64 Ray-Trace | |
| Dell Precision 5000 5470 | |
| Lenovo ThinkPad P15v G2 21A9000XGE | |
| Genomsnitt Intel Core i9-12900H (2235 - 10511, n=29) | |
| Lenovo ThinkPad P14s G2 AMD | |
| HP ZBook Firefly 14 G8 2C9Q2EA | |
| HP ZBook Firefly 14 G7 | |
| AIDA64 / CPU PhotoWorxx | |
| Dell Precision 5000 5470 | |
| Genomsnitt Intel Core i9-12900H (20960 - 48269, n=30) | |
| HP ZBook Firefly 14 G8 2C9Q2EA | |
| HP ZBook Firefly 14 G7 | |
| Lenovo ThinkPad P14s G2 AMD | |
| Lenovo ThinkPad P15v G2 21A9000XGE | |
Systemets prestanda
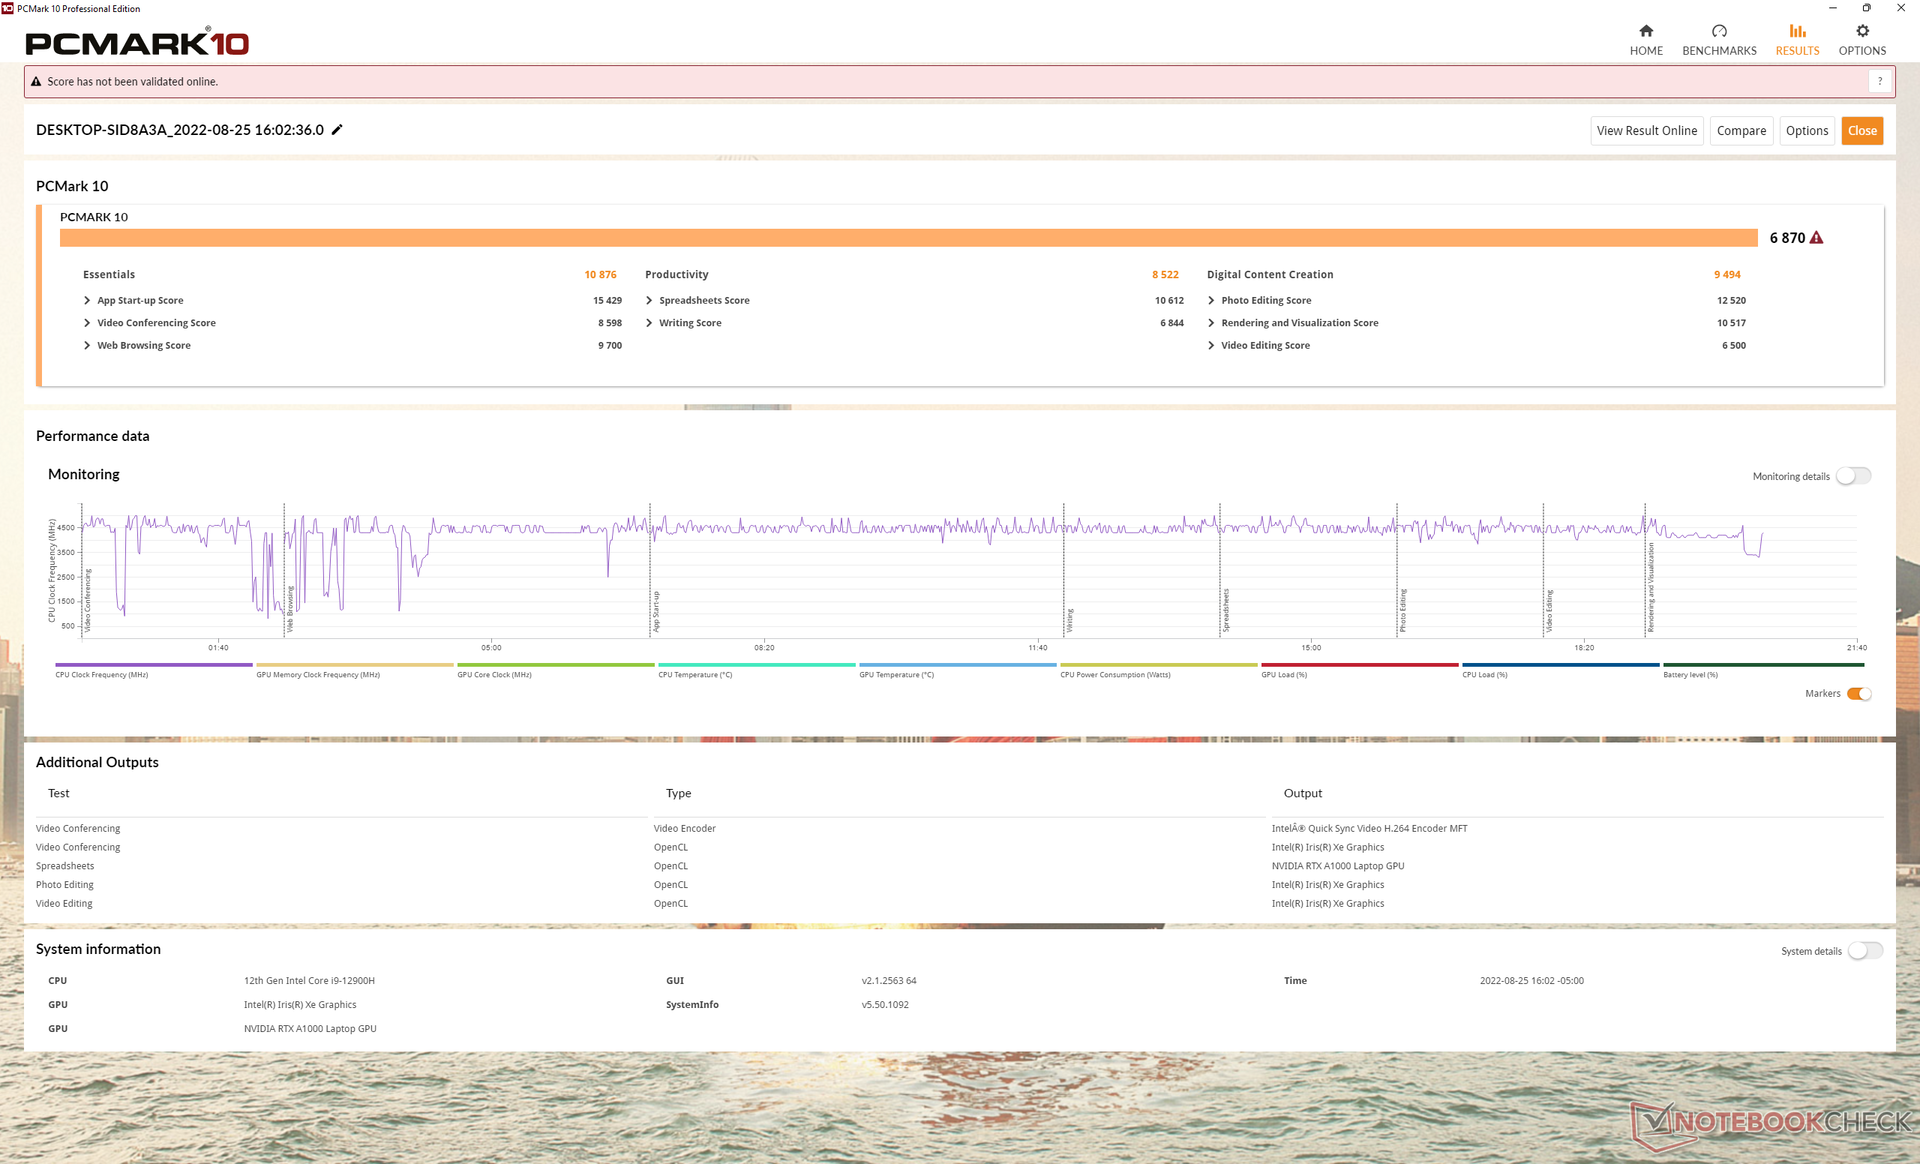
PCMark 10-resultaten är högre än förväntat jämfört med andra mobila arbetsstationer. Vi tillskriver detta den 12:e generationens Core i9 H-series CPU och PCIe4 x4 SSD som är relativt ovanliga alternativ för en 14-tums arbetsstation.
CrossMark: Overall | Productivity | Creativity | Responsiveness
| PCMark 10 / Score | |
| Dell Precision 5000 5470 | |
| Genomsnitt Intel Core i9-12900H, NVIDIA RTX A1000 Laptop GPU (n=1) | |
| Dell Precision 5000 5560 | |
| Lenovo ThinkPad P15v G2 21A9000XGE | |
| Lenovo ThinkPad P14s G2 AMD | |
| HP ZBook Firefly 14 G8 2C9Q2EA | |
| HP ZBook Firefly 14 G7 | |
| PCMark 10 / Essentials | |
| Dell Precision 5000 5470 | |
| Genomsnitt Intel Core i9-12900H, NVIDIA RTX A1000 Laptop GPU (n=1) | |
| Dell Precision 5000 5560 | |
| Lenovo ThinkPad P15v G2 21A9000XGE | |
| Lenovo ThinkPad P14s G2 AMD | |
| HP ZBook Firefly 14 G8 2C9Q2EA | |
| HP ZBook Firefly 14 G7 | |
| PCMark 10 / Productivity | |
| Dell Precision 5000 5560 | |
| Lenovo ThinkPad P14s G2 AMD | |
| Dell Precision 5000 5470 | |
| Genomsnitt Intel Core i9-12900H, NVIDIA RTX A1000 Laptop GPU (n=1) | |
| HP ZBook Firefly 14 G8 2C9Q2EA | |
| Lenovo ThinkPad P15v G2 21A9000XGE | |
| HP ZBook Firefly 14 G7 | |
| PCMark 10 / Digital Content Creation | |
| Dell Precision 5000 5470 | |
| Genomsnitt Intel Core i9-12900H, NVIDIA RTX A1000 Laptop GPU (n=1) | |
| Dell Precision 5000 5560 | |
| Lenovo ThinkPad P15v G2 21A9000XGE | |
| Lenovo ThinkPad P14s G2 AMD | |
| HP ZBook Firefly 14 G8 2C9Q2EA | |
| HP ZBook Firefly 14 G7 | |
| CrossMark / Overall | |
| Dell Precision 5000 5470 | |
| Genomsnitt Intel Core i9-12900H, NVIDIA RTX A1000 Laptop GPU (n=1) | |
| Lenovo ThinkPad P15v G2 21A9000XGE | |
| CrossMark / Productivity | |
| Dell Precision 5000 5470 | |
| Genomsnitt Intel Core i9-12900H, NVIDIA RTX A1000 Laptop GPU (n=1) | |
| Lenovo ThinkPad P15v G2 21A9000XGE | |
| CrossMark / Creativity | |
| Dell Precision 5000 5470 | |
| Genomsnitt Intel Core i9-12900H, NVIDIA RTX A1000 Laptop GPU (n=1) | |
| Lenovo ThinkPad P15v G2 21A9000XGE | |
| CrossMark / Responsiveness | |
| Dell Precision 5000 5470 | |
| Genomsnitt Intel Core i9-12900H, NVIDIA RTX A1000 Laptop GPU (n=1) | |
| Lenovo ThinkPad P15v G2 21A9000XGE | |
| PCMark 10 Score | 6870 poäng | |
Hjälp | ||
| AIDA64 / Memory Copy | |
| Dell Precision 5000 5470 | |
| Genomsnitt Intel Core i9-12900H (34438 - 74264, n=29) | |
| Lenovo ThinkPad P14s G2 AMD | |
| HP ZBook Firefly 14 G8 2C9Q2EA | |
| HP ZBook Firefly 14 G7 | |
| Lenovo ThinkPad P15v G2 21A9000XGE | |
| AIDA64 / Memory Read | |
| Dell Precision 5000 5470 | |
| Genomsnitt Intel Core i9-12900H (36365 - 74642, n=29) | |
| Lenovo ThinkPad P14s G2 AMD | |
| HP ZBook Firefly 14 G8 2C9Q2EA | |
| HP ZBook Firefly 14 G7 | |
| Lenovo ThinkPad P15v G2 21A9000XGE | |
| AIDA64 / Memory Write | |
| Dell Precision 5000 5470 | |
| Genomsnitt Intel Core i9-12900H (32276 - 67858, n=29) | |
| HP ZBook Firefly 14 G8 2C9Q2EA | |
| Lenovo ThinkPad P14s G2 AMD | |
| HP ZBook Firefly 14 G7 | |
| Lenovo ThinkPad P15v G2 21A9000XGE | |
| AIDA64 / Memory Latency | |
| Dell Precision 5000 5470 | |
| Lenovo ThinkPad P14s G2 AMD | |
| Lenovo ThinkPad P15v G2 21A9000XGE | |
| Genomsnitt Intel Core i9-12900H (74.7 - 118.1, n=28) | |
| HP ZBook Firefly 14 G7 | |
| HP ZBook Firefly 14 G8 2C9Q2EA | |
* ... mindre är bättre
DPC-latenstid
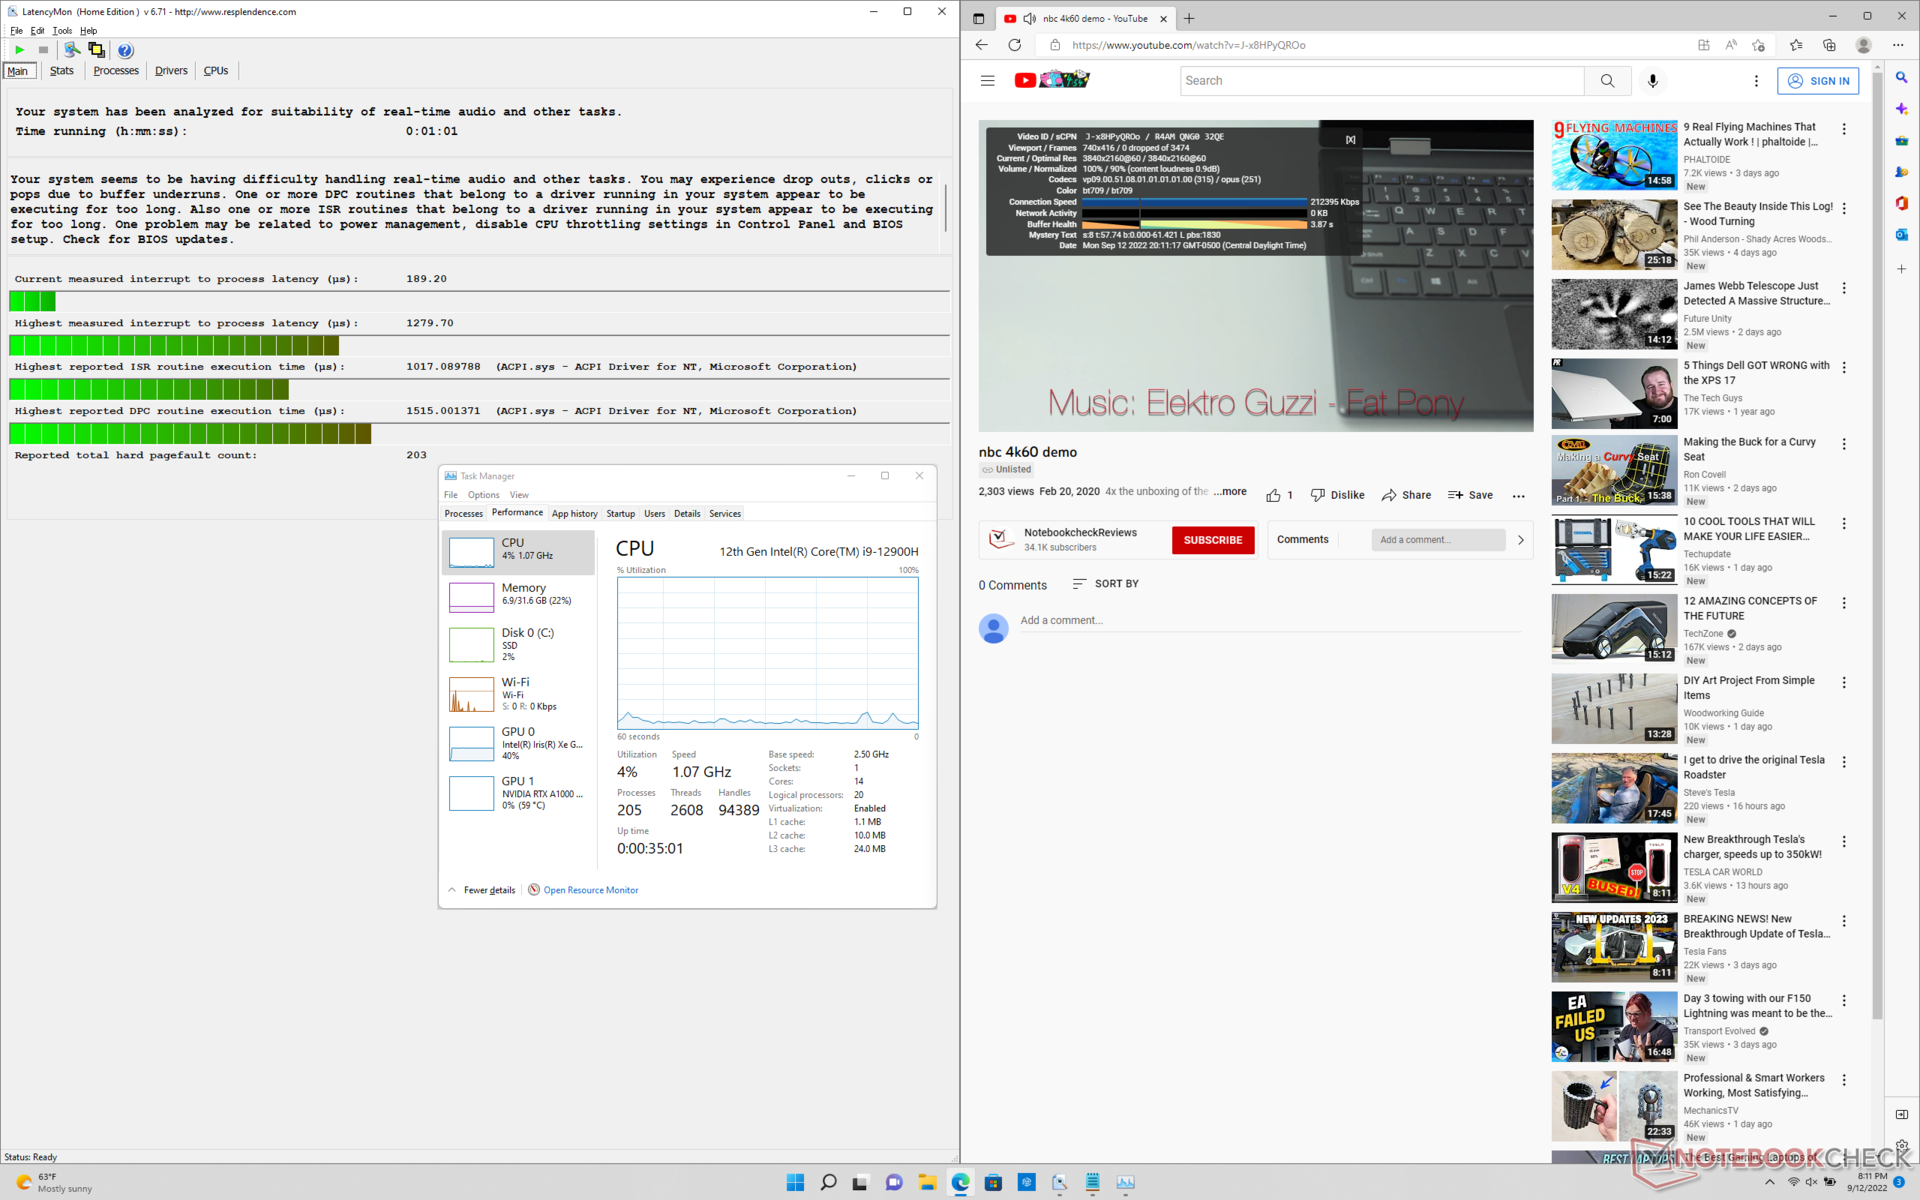
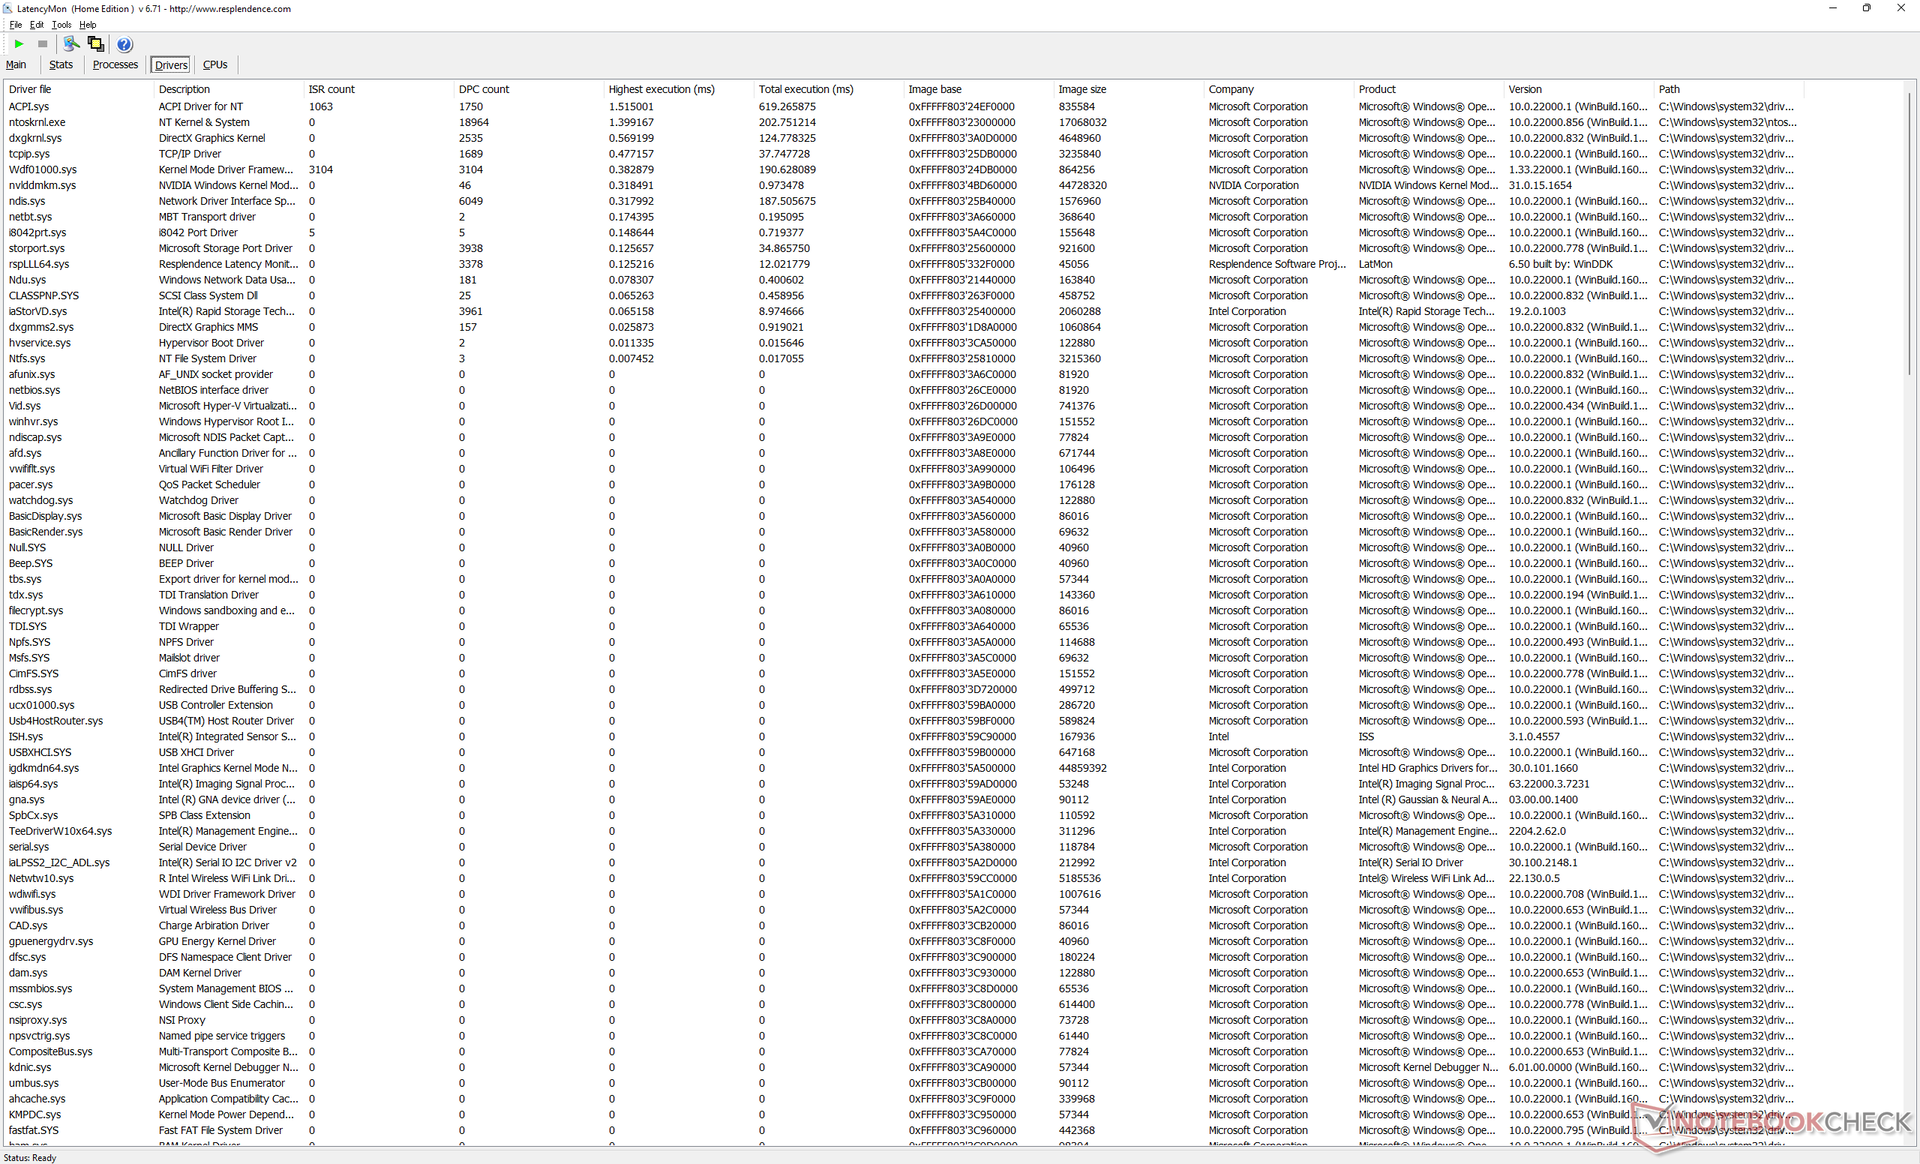
LatencyMon avslöjar små DPC-problem när vi öppnar flera webbläsarflikar på vår hemsida, vilket är en liten besvikelse att se på en arbetsstation. 4K-uppspelning vid 60 FPS är annars perfekt med inga tappade bilder under vårt minutlånga videotest.
| DPC Latencies / LatencyMon - interrupt to process latency (max), Web, Youtube, Prime95 | |
| Lenovo ThinkPad P15v G2 21A9000XGE | |
| HP ZBook Firefly 14 G8 2C9Q2EA | |
| Lenovo ThinkPad P14s G2 AMD | |
| HP ZBook Firefly 14 G7 | |
| Dell Precision 5000 5470 | |
| Dell Precision 5000 5560 | |
* ... mindre är bättre
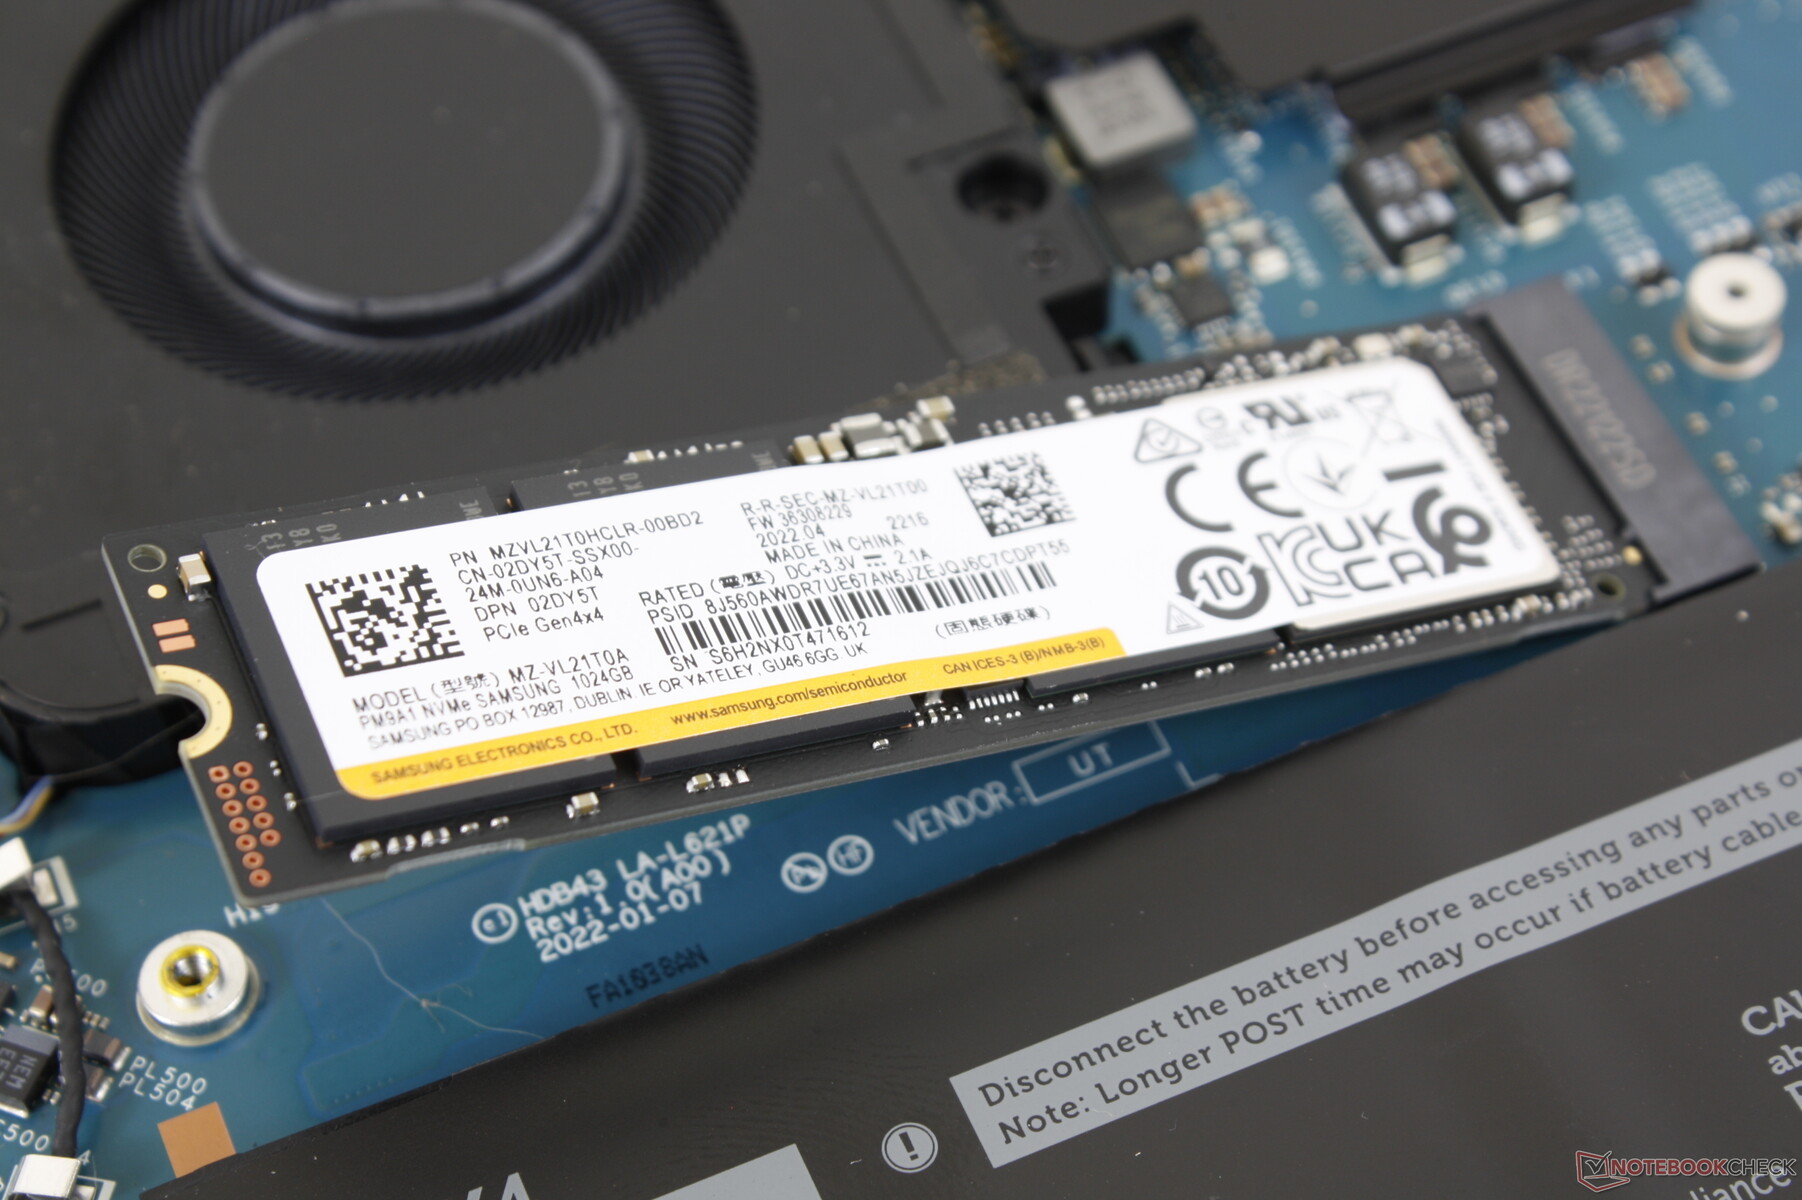
Lagringsenheter
Dell erbjuder 256 GB till 4 TB PCIe3- eller PCIe4-lagringsalternativ med självkryptering som tillval. PCIe4 Samsung PM9A1 enheten i vår testenhet har en egen värmespridare i koppar för bättre uthållig prestanda än på bärbara datorer utan värmespridare för SSD:er, som t.ex Latitude 7330.

| Drive Performance rating - Percent | |
| Dell Precision 5000 5560 | |
| Dell Precision 5000 5470 | |
| Lenovo ThinkPad P14s G2 AMD | |
| HP ZBook Firefly 14 G8 2C9Q2EA | |
| HP ZBook Firefly 14 G7 | |
| Lenovo ThinkPad P15v G2 21A9000XGE | |
* ... mindre är bättre
Disk Throttling: DiskSpd Read Loop, Queue Depth 8
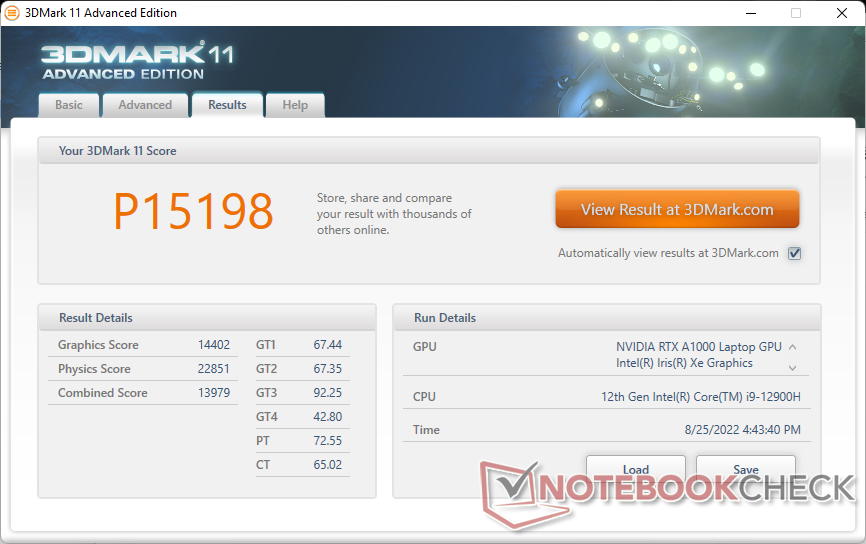
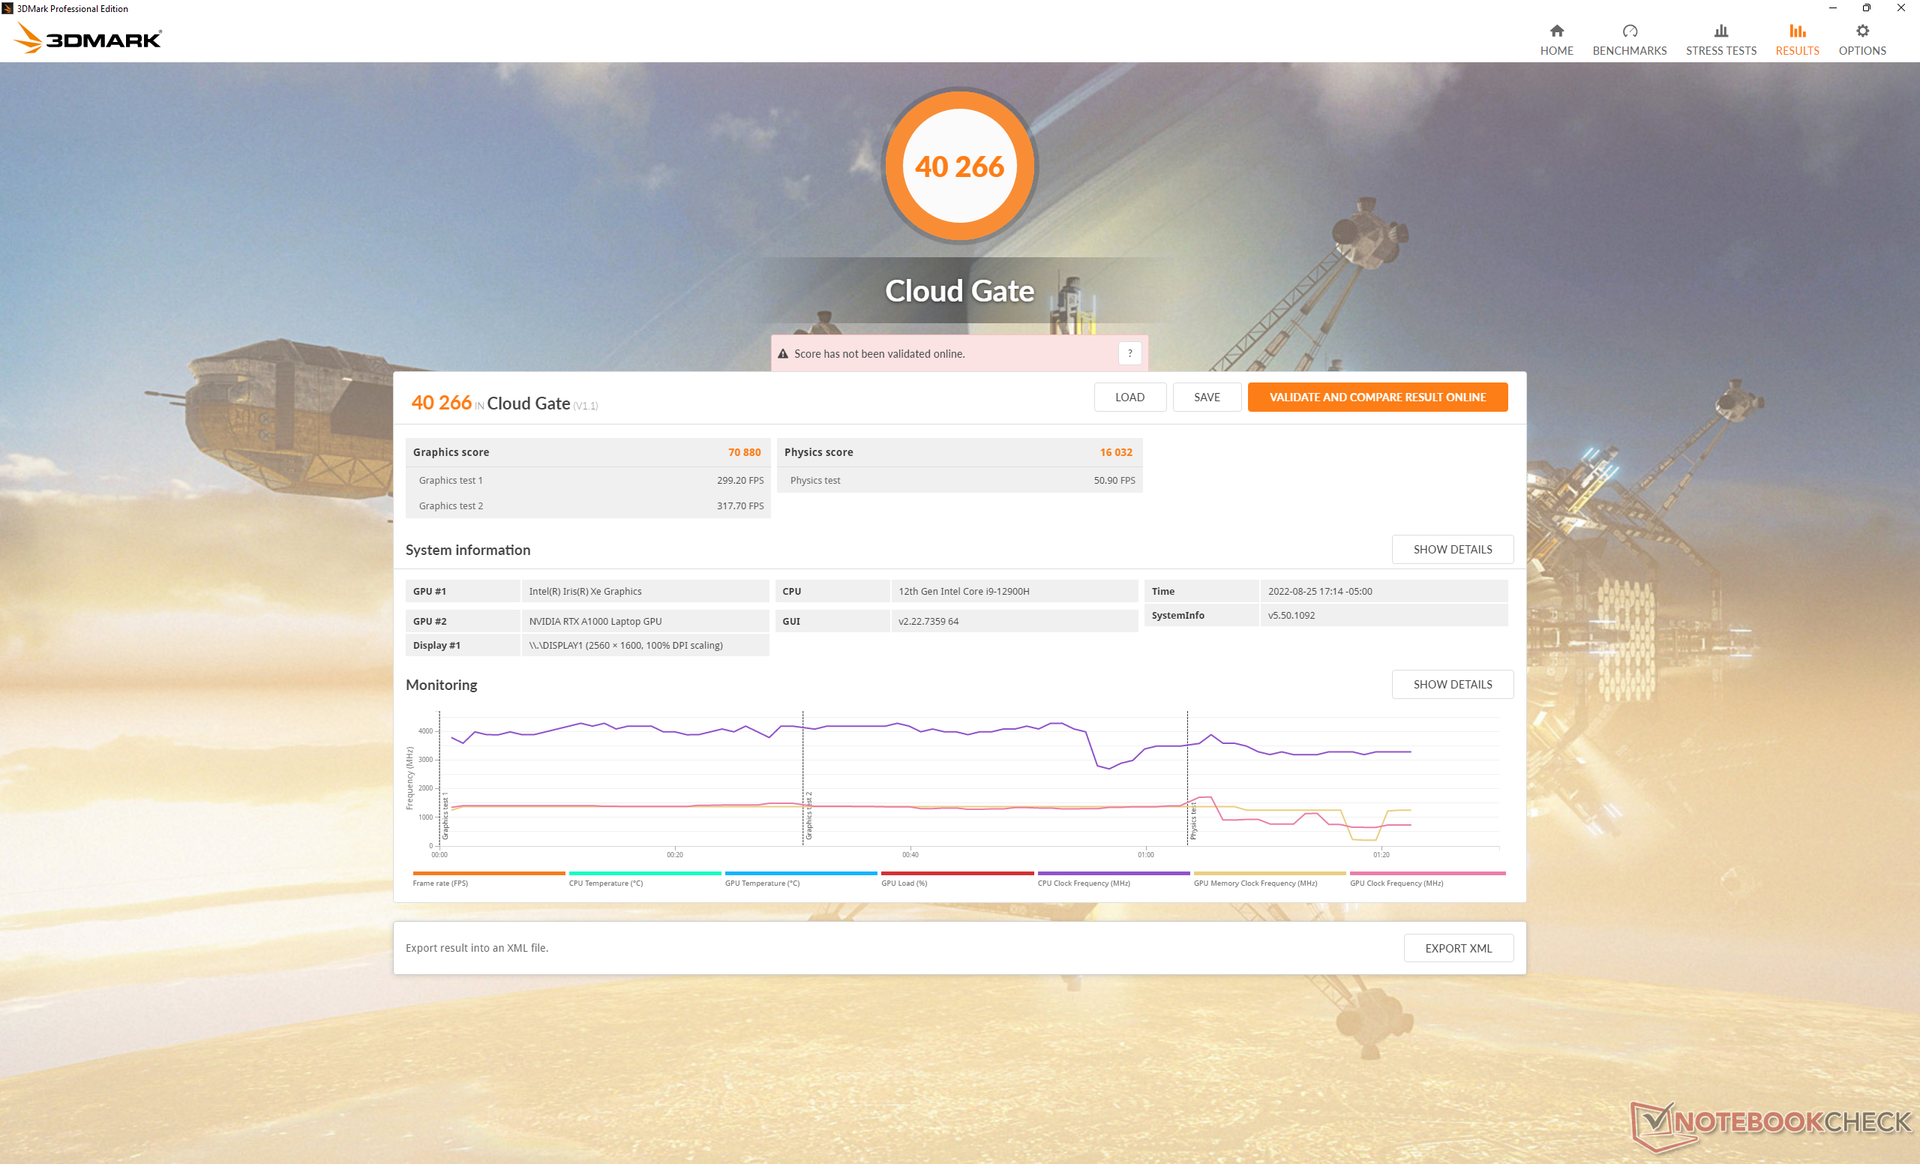
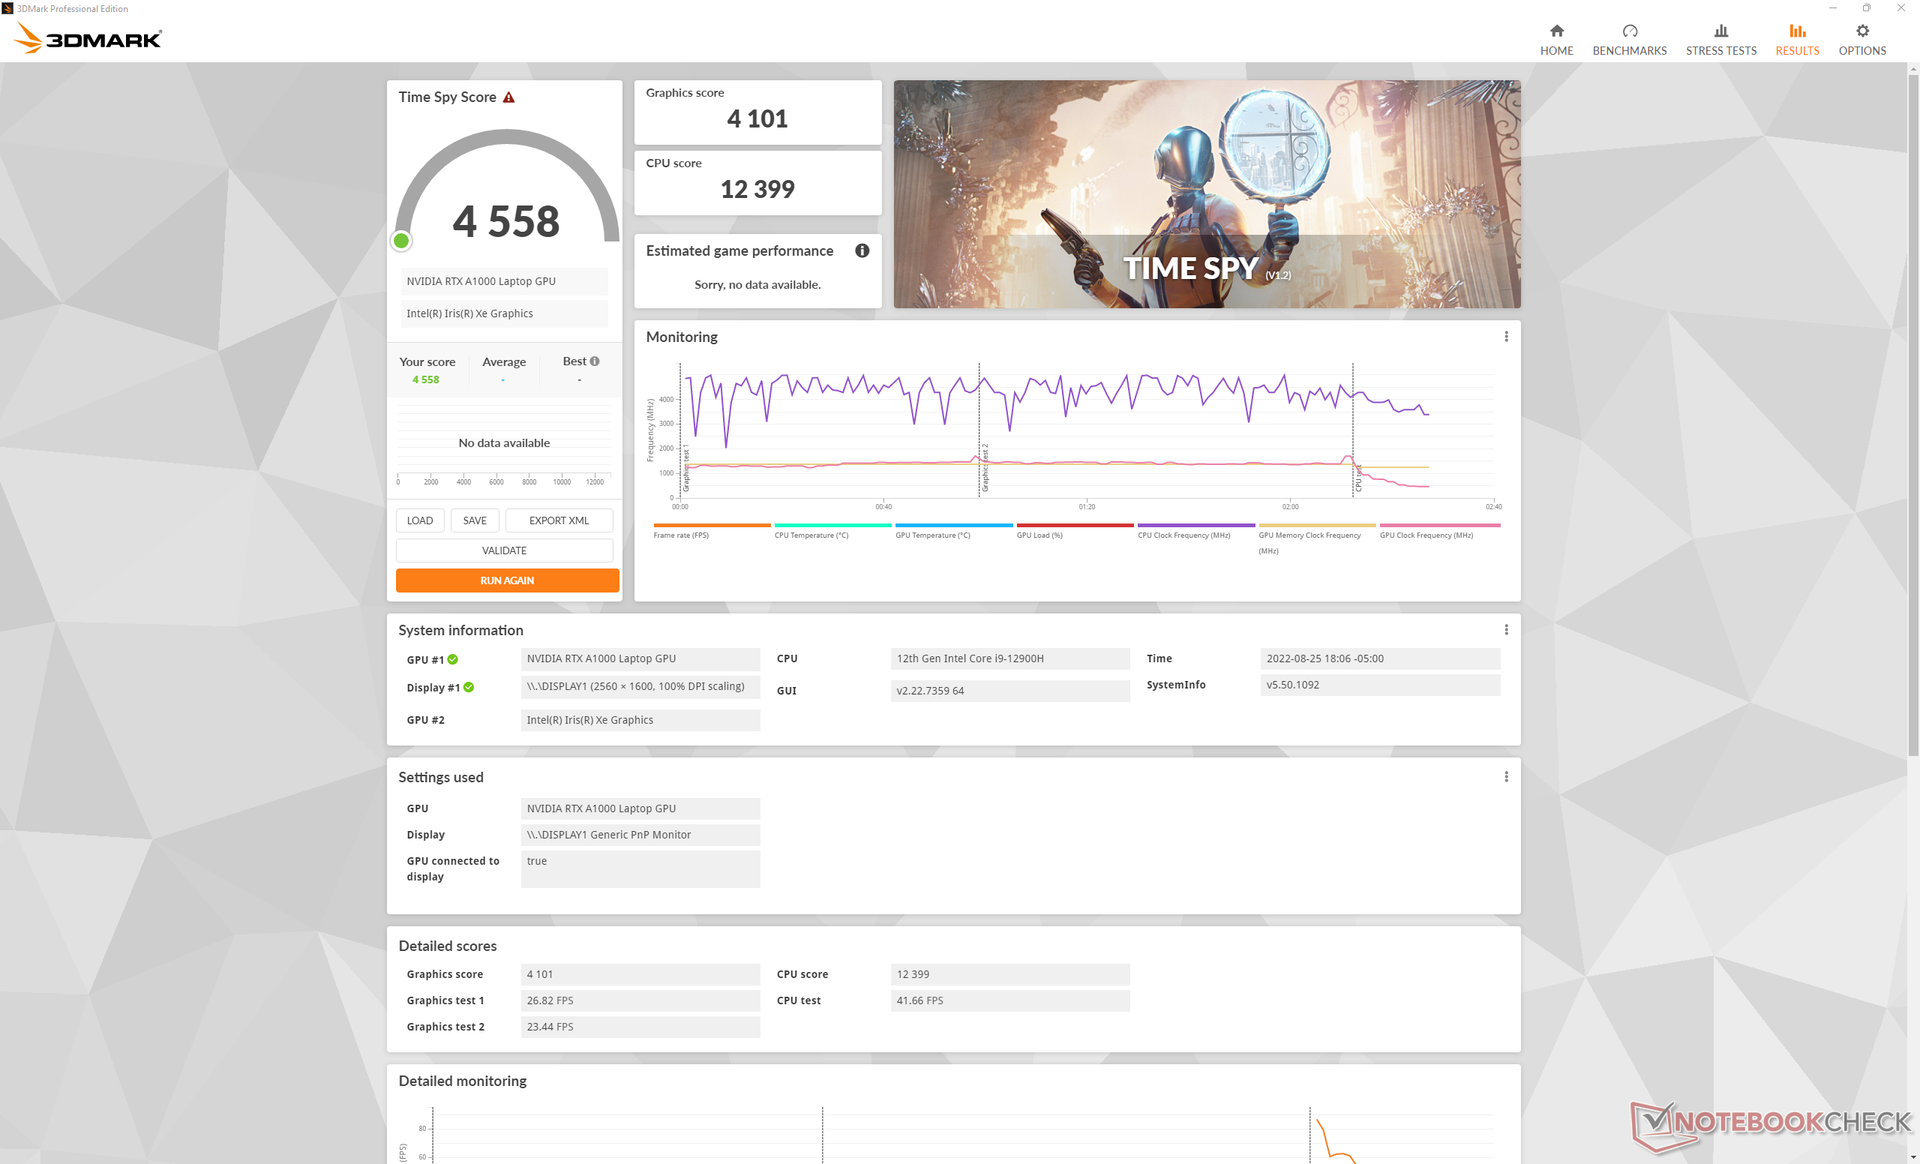
GPU-prestanda - 40 W RTX A1000-grafik
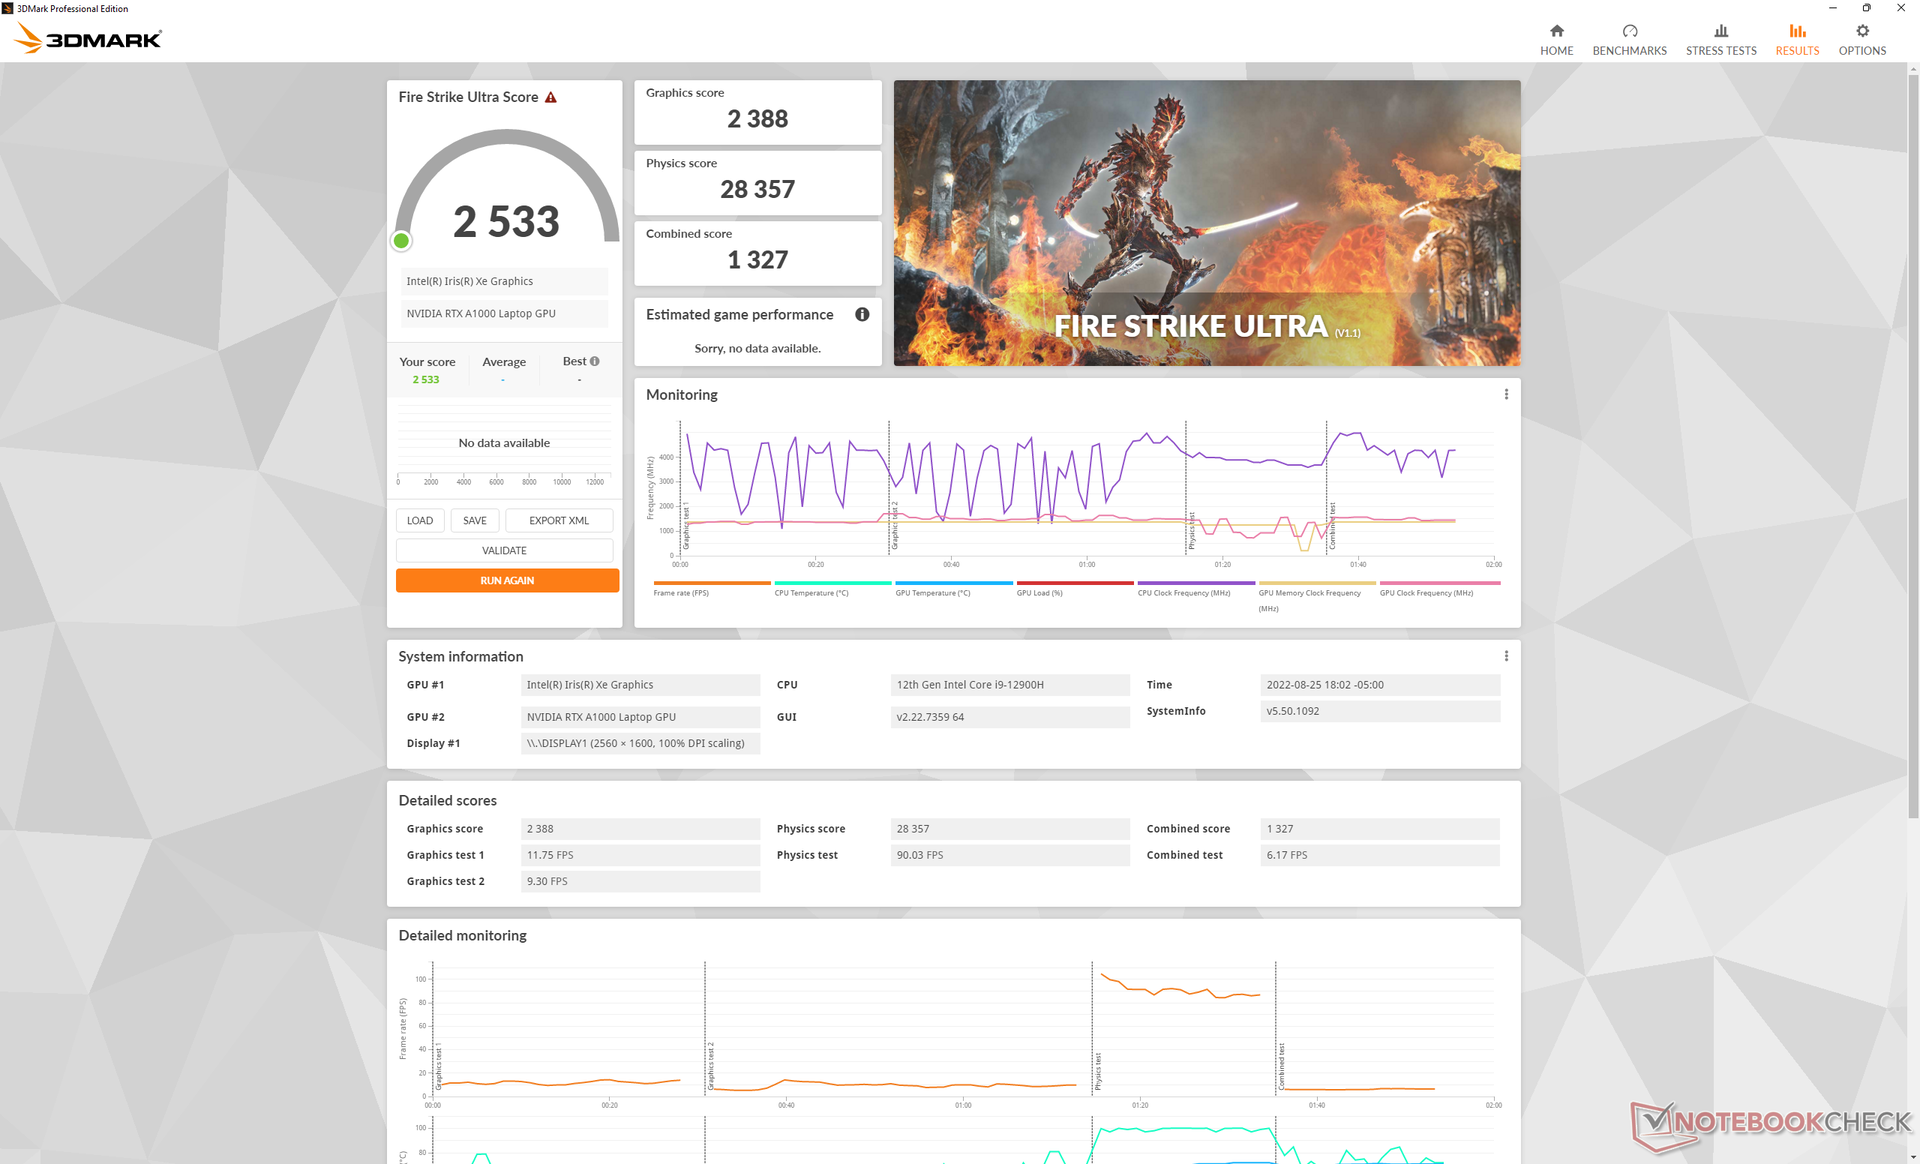
Den totala grafikprestandan är cirka 10-20 procent snabbare än förra åretsNVIDIA T1200. Mest anmärkningsvärt är dock RTX A1000 endast cirka 10 till 15 procent långsammare än RTX A2000 i Precision 5560 utom när det gäller ray-tracing-tillämpningar där A2000 kan vara över två gånger snabbare. Om dina arbetsbelastningar innefattar ray tracing-effekter är RTX A1000 den du bör undvika.
Att köra i balanserat läge istället för Ultra Performance-läge minskar CPU-prestandan med cirka 33 procent medan GPU-prestandan påverkas mindre.

| 3DMark 11 - 1280x720 Performance GPU | |
| HP ZBook Fury 17 G8-4A6A9EA | |
| HP ZBook Fury 17 G7 119W5EA | |
| Dell G15 5510 | |
| Dell Precision 5000 5560 | |
| Genomsnitt NVIDIA RTX A1000 Laptop GPU (14402 - 15867, n=2) | |
| Dell Precision 5000 5470 | |
| Lenovo ThinkPad P1 G4-20Y4Z9DVUS | |
| Lenovo ThinkPad P15v G2 21A9000XGE | |
| HP ZBook Power 15 G8 313S5EA | |
| HP ZBook Firefly 15 G8 2C9R7EA | |
| Dell Precision 3000 3551 | |
| Lenovo ThinkPad P15s Gen1-20T4000JGE | |
| 3DMark | |
| 1920x1080 Fire Strike Graphics | |
| HP ZBook Fury 17 G7 119W5EA | |
| HP ZBook Fury 17 G8-4A6A9EA | |
| Dell G15 5510 | |
| Dell Precision 5000 5560 | |
| Genomsnitt NVIDIA RTX A1000 Laptop GPU (10914 - 11728, n=2) | |
| Dell Precision 5000 5470 | |
| Lenovo ThinkPad P1 G4-20Y4Z9DVUS | |
| Lenovo ThinkPad P15v G2 21A9000XGE | |
| HP ZBook Power 15 G8 313S5EA | |
| HP ZBook Firefly 15 G8 2C9R7EA | |
| Dell Precision 3000 3551 | |
| Lenovo ThinkPad P15s Gen1-20T4000JGE | |
| 2560x1440 Time Spy Graphics | |
| HP ZBook Fury 17 G7 119W5EA | |
| HP ZBook Fury 17 G8-4A6A9EA | |
| Dell G15 5510 | |
| Dell Precision 5000 5560 | |
| Genomsnitt NVIDIA RTX A1000 Laptop GPU (4101 - 4410, n=2) | |
| Dell Precision 5000 5470 | |
| Lenovo ThinkPad P1 G4-20Y4Z9DVUS | |
| Lenovo ThinkPad P15v G2 21A9000XGE | |
| HP ZBook Power 15 G8 313S5EA | |
| HP ZBook Firefly 15 G8 2C9R7EA | |
| Dell Precision 3000 3551 | |
| Lenovo ThinkPad P15s Gen1-20T4000JGE | |
| 2560x1440 Port Royal Graphics | |
| HP ZBook Fury 17 G8-4A6A9EA | |
| Genomsnitt NVIDIA RTX A1000 Laptop GPU (304 - 2649, n=2) | |
| Dell Precision 5000 5560 | |
| Dell G15 5510 | |
| Dell Precision 5000 5470 | |
| 3DMark 11 Performance | 15198 poäng | |
| 3DMark Cloud Gate Standard Score | 40266 poäng | |
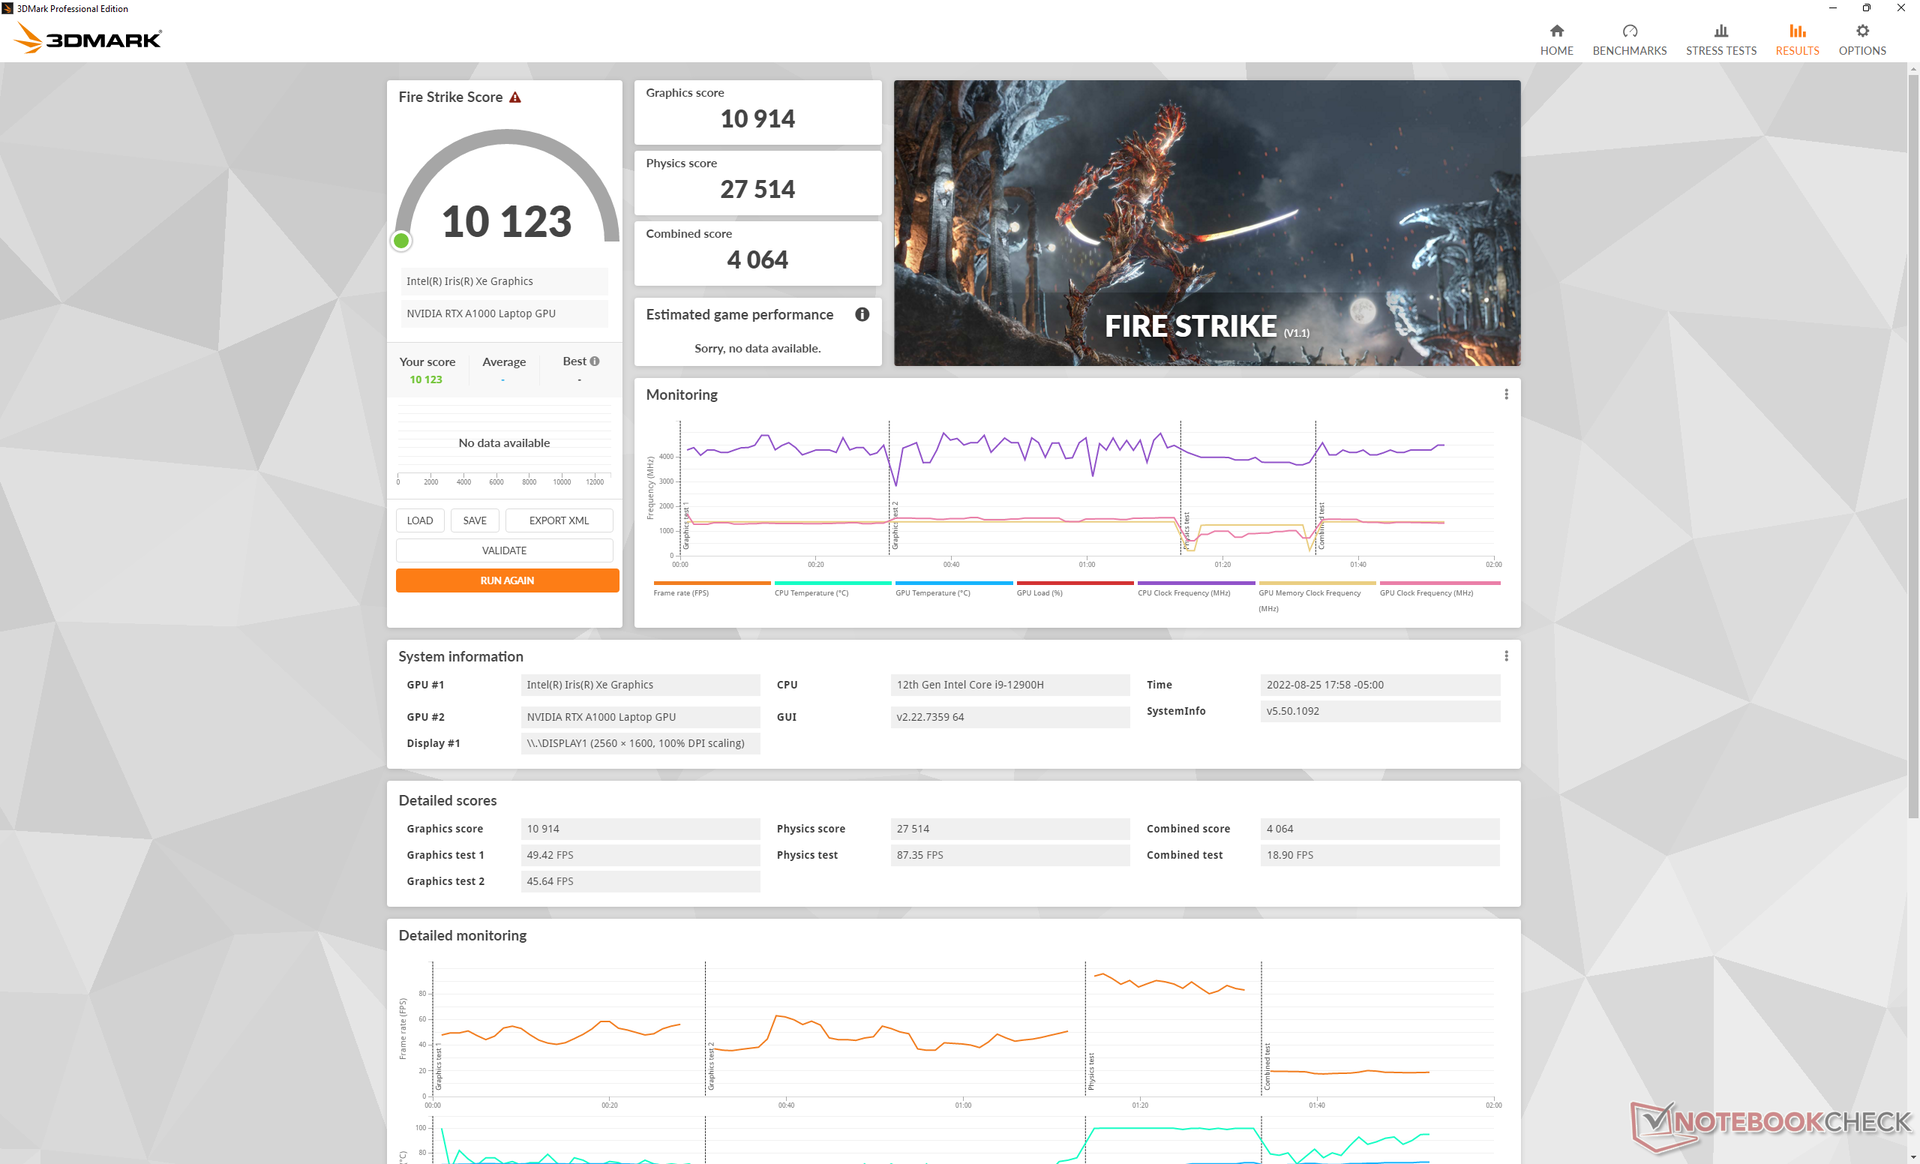
| 3DMark Fire Strike Score | 10123 poäng | |
| 3DMark Time Spy Score | 4558 poäng | |
Hjälp | ||
| Cyberpunk 2077 1.6 | |
| 1920x1080 Low Preset | |
| Dell Precision 5000 5470 | |
| Genomsnitt NVIDIA RTX A1000 Laptop GPU (n=1) | |
| 1920x1080 Medium Preset | |
| Dell Precision 5000 5470 | |
| Genomsnitt NVIDIA RTX A1000 Laptop GPU (n=1) | |
| 1920x1080 High Preset | |
| Dell Precision 5000 5470 | |
| Genomsnitt NVIDIA RTX A1000 Laptop GPU (n=1) | |
| 1920x1080 Ultra Preset | |
| Dell Precision 5000 5470 | |
| Genomsnitt NVIDIA RTX A1000 Laptop GPU (n=1) | |
Witcher 3 FPS Chart
| låg | med. | hög | ultra | QHD | |
|---|---|---|---|---|---|
| GTA V (2015) | 168 | 159.8 | 113.7 | 58.9 | |
| The Witcher 3 (2015) | 244.1 | 147.5 | 82.1 | 42.7 | |
| Dota 2 Reborn (2015) | 160.8 | 147.9 | 112.3 | 132.1 | |
| Final Fantasy XV Benchmark (2018) | 105.3 | 59.1 | 43 | ||
| X-Plane 11.11 (2018) | 118.7 | 94.8 | 76.3 | ||
| Strange Brigade (2018) | 242 | 106.2 | 84.7 | 72.8 | |
| Metro Exodus (2019) | 111 | 53.3 | 39.3 | 31.2 | 23.6 |
| Borderlands 3 (2019) | 110.4 | 68.4 | 42.6 | 31.3 | 18.8 |
| Gears Tactics (2020) | 161.5 | 106.5 | 63.9 | 46.8 | 31.1 |
| Horizon Zero Dawn (2020) | 82 | 68 | 58 | 48 | 38 |
| Watch Dogs Legion (2020) | 75 | 62 | 54 | 26 | 17 |
| Dirt 5 (2020) | 135 | 62.4 | 48.5 | 37.2 | 25.8 |
| Assassin´s Creed Valhalla (2020) | 103 | 50 | 33 | 25 | 22 |
| Hitman 3 (2021) | 171.9 | 83.7 | 71.3 | 66.1 | 41 |
| F1 2021 (2021) | 195 | 127 | 103 | 54 | 34 |
| Far Cry 6 (2021) | 103 | 64 | 54 | ||
| Guardians of the Galaxy (2021) | 92 | 64 | 64 | 61 | 37 |
| God of War (2022) | 60.2 | 49.1 | 40.9 | 25.8 | 20.5 |
| Cyberpunk 2077 1.6 (2022) | 61.3 | 50.4 | 36.7 | 29 | |
| F1 22 (2022) | 112 | 107 | 76 | 22 | 13 |
Utsläpp
Systemljud - högt ljud vid belastning
Precision 5470 är högre än den större Precision 5560 under belastning. Körning Witcher 3 i läget Ultra Performance skulle till exempel fläktljudet vara knappt 49 dB(A) jämfört med endast 40 dB(A) på 15,6-tums Precision. Faktum är att Precision 5470 lätt är en av de mest högljudda arbetsstationerna i sin lilla 14-tumskategori.
Systemet blir tystare med 40,3 dB(A) när man kör tunga belastningar i balanserat läge i stället för Ultra Performance-läge. Du förlorar lite CPU-prestanda som nämnts ovan, men de tystare fläktarna kan vara värda kompromissen beroende på miljön.
De interna fläktarna pulserar periodvis utan anledning om de är inställda på Ultra Performance-läget även när de bara går på tomgång på skrivbordet. Balanserat läge eller tyst läge rekommenderas om du kör kravlösa program.
Ljudnivå
| Låg belastning |
| 23.3 / 23.3 / 23.3 dB(A) |
| Hög belastning |
| 48.5 / 50.4 dB(A) |
 | ||
30 dB tyst 40 dB(A) hörbar 50 dB(A) högt ljud |
||
min: | ||
| Dell Precision 5000 5470 RTX A1000 Laptop GPU, i9-12900H, Samsung PM9A1 MZVL21T0HCLR | Lenovo ThinkPad P15v G2 21A9000XGE T1200 Laptop GPU, i7-11800H, Toshiba XG6 KXG6AZNV512G | Dell Precision 5000 5560 RTX A2000 Laptop GPU, i7-11850H, Samsung PM9A1 MZVL22T0HBLB | Lenovo ThinkPad P14s G2 AMD Vega 8, R7 PRO 5850U, SK Hynix PC711 1TB HFS001TDE9X081N | HP ZBook Firefly 14 G8 2C9Q2EA T500 Laptop GPU, i7-1165G7, Toshiba XG6 KXG60ZNV1T02 | HP ZBook Firefly 14 G7 Quadro P520, i7-10610U, Toshiba XG6 KXG60ZNV512G | |
|---|---|---|---|---|---|---|
| Noise | 3% | 11% | 8% | -4% | -4% | |
| av / miljö * (dB) | 23 | 25.21 -10% | 23.4 -2% | 24.04 -5% | 28.7 -25% | 29.7 -29% |
| Idle Minimum * (dB) | 23.3 | 25.21 -8% | 23.6 -1% | 24.04 -3% | 28.7 -23% | 29.7 -27% |
| Idle Average * (dB) | 23.3 | 25.21 -8% | 23.6 -1% | 24.04 -3% | 28.7 -23% | 29.7 -27% |
| Idle Maximum * (dB) | 23.3 | 25.21 -8% | 23.6 -1% | 24.04 -3% | 28.7 -23% | 30.4 -30% |
| Load Average * (dB) | 48.5 | 39.09 19% | 25.8 47% | 28.19 42% | 34 30% | 33.1 32% |
| Witcher 3 ultra * (dB) | 48.6 | 36.6 25% | 40.1 17% | 40.1 17% | 35.3 27% | |
| Load Maximum * (dB) | 50.4 | 43.53 14% | 41.4 18% | 40.77 19% | 40.1 20% | 37.9 25% |
* ... mindre är bättre
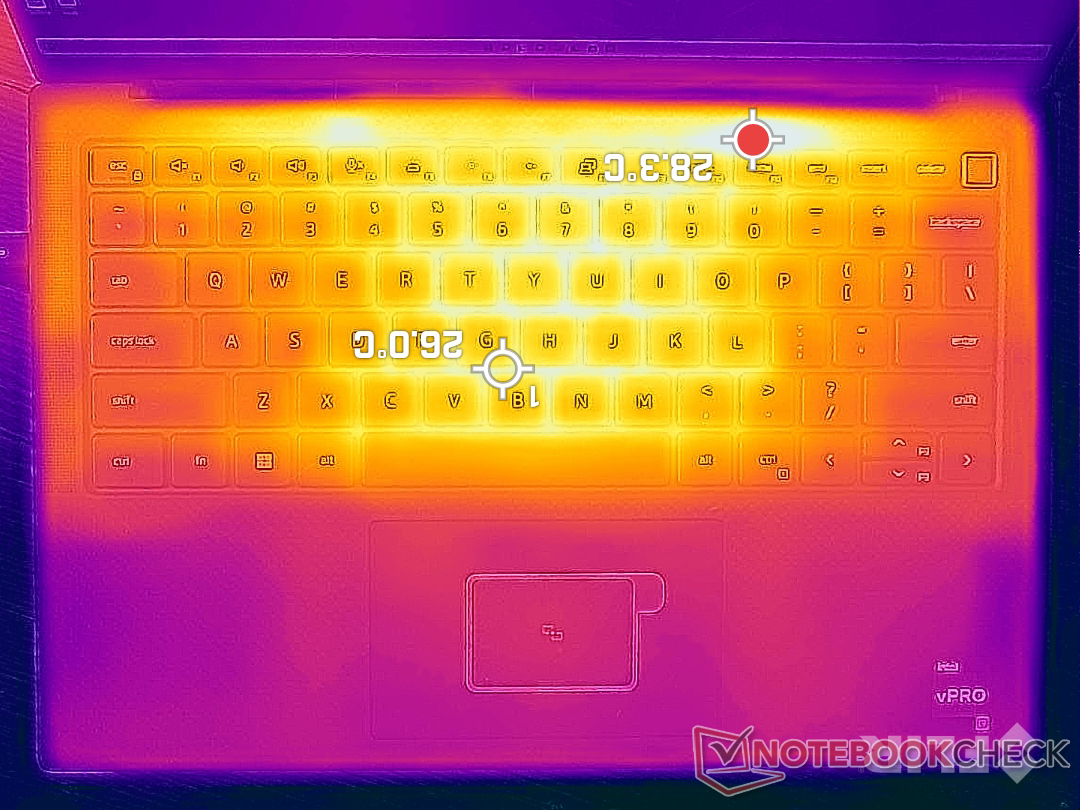
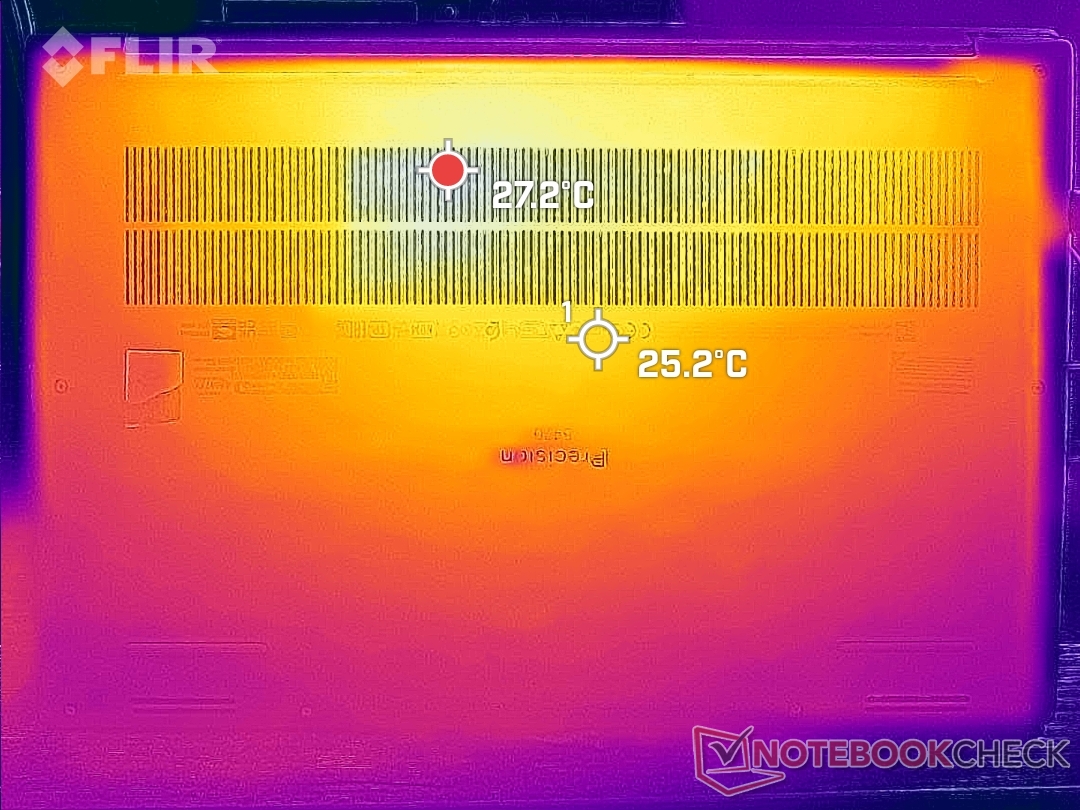
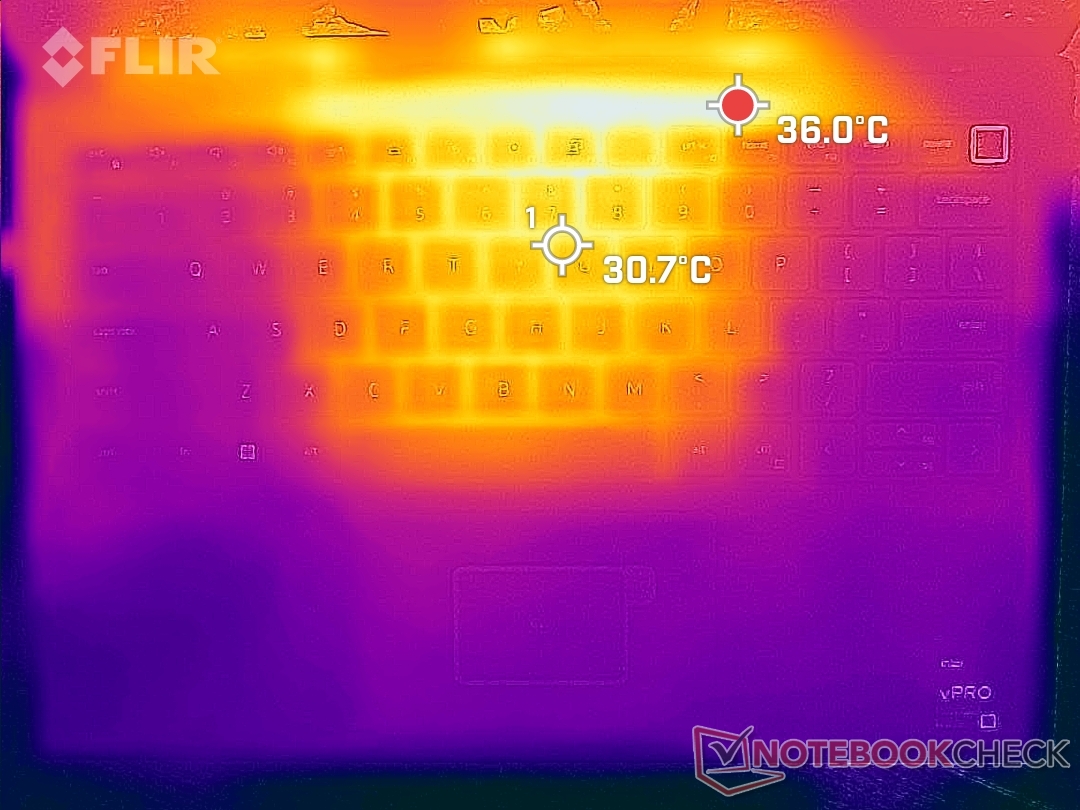
Temperatur
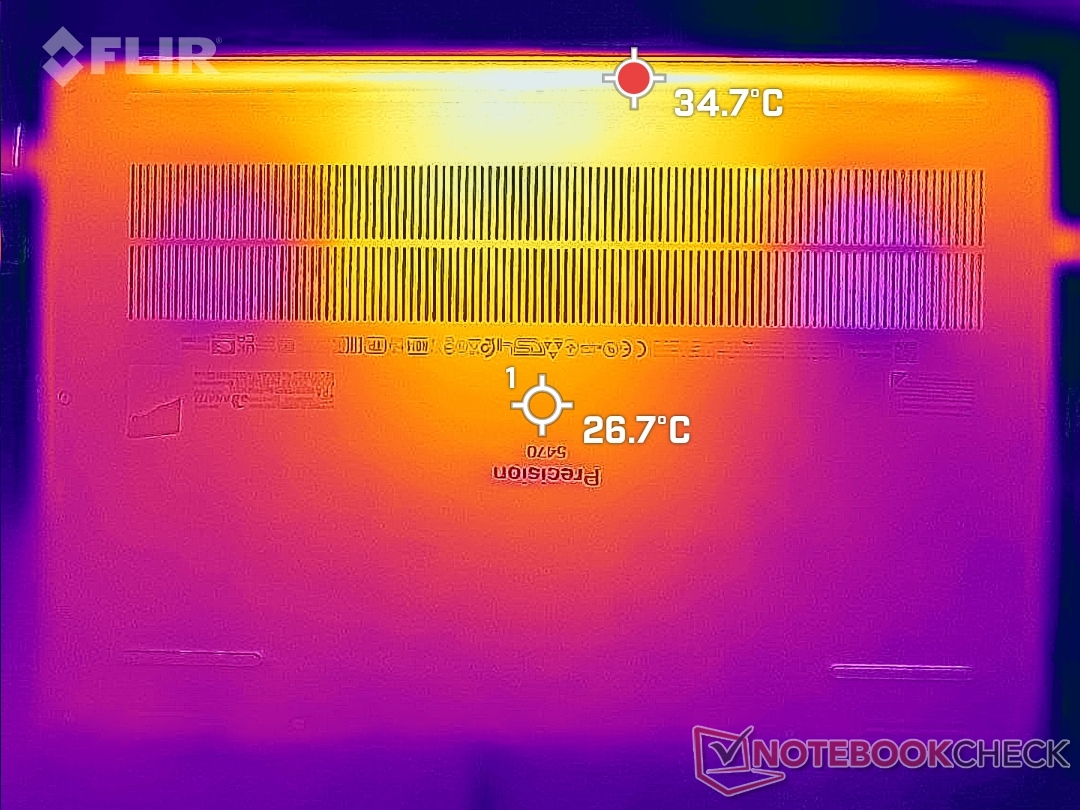
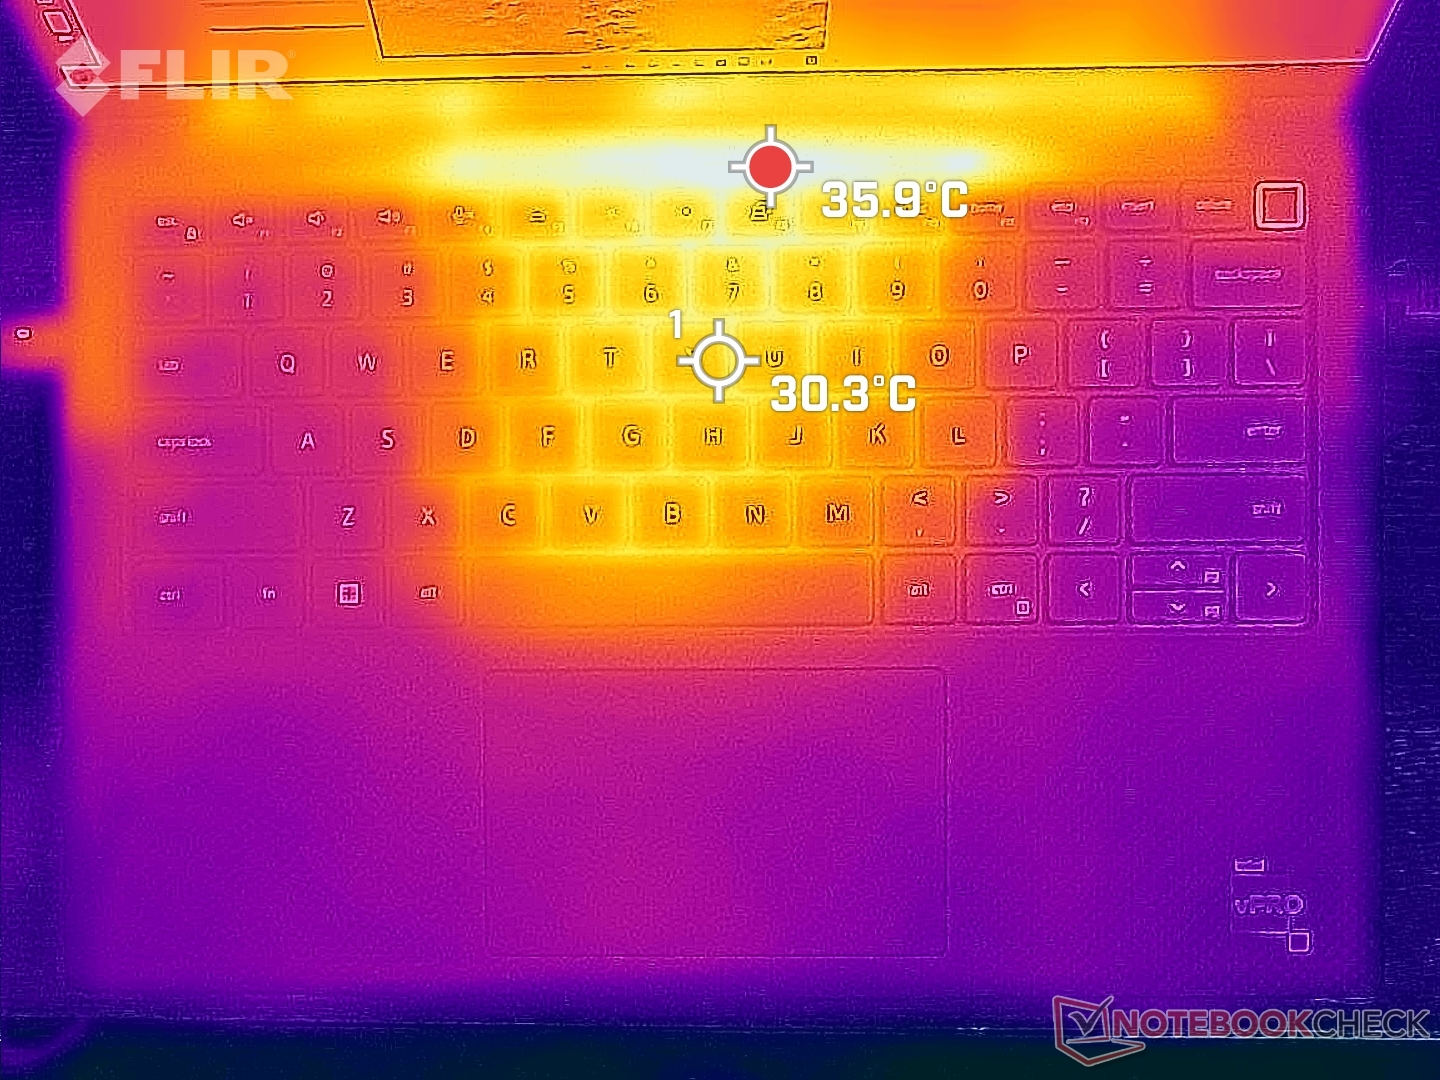
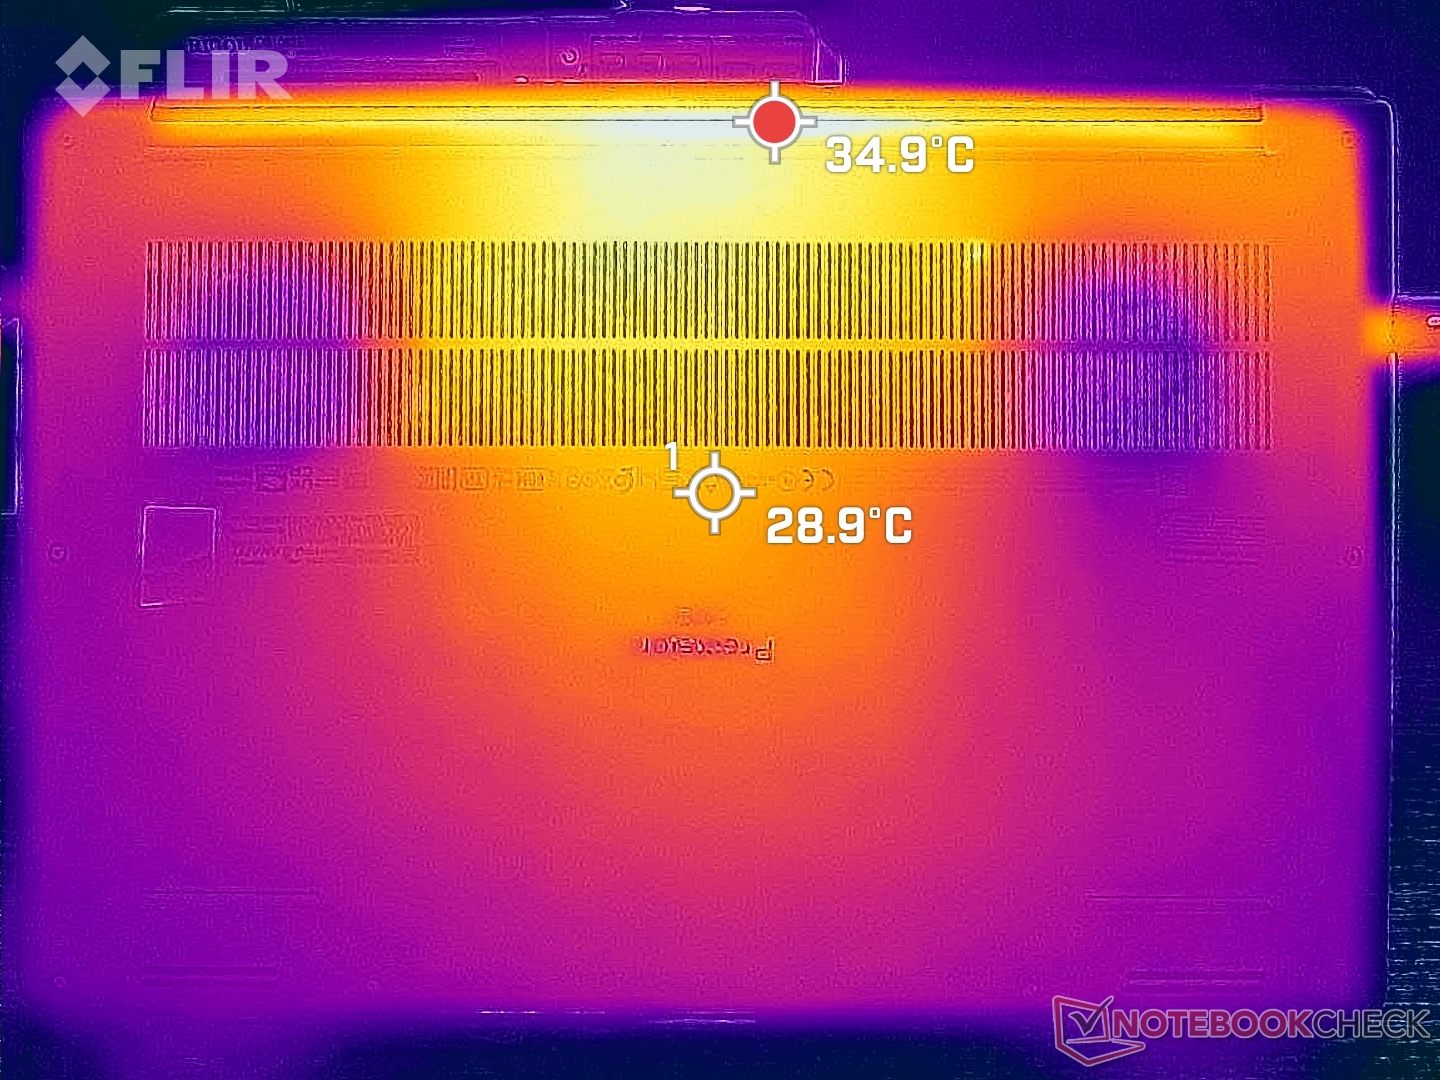
Yttemperaturerna är svalare än väntat med tanke på CPU:n i Core H-klass, den diskreta Nvidia GPU:n och det lilla chassit. Alternativa 14-tums arbetsstationer som ZBook Firefly 14 G8 eller ThinkPad P14s G2 har långsammare CPU:er och ändå kan de bli mycket varmare med värmepunkter som når 49 C jämfört med endast 42 C på vår Precision. Tangentbordets mittpunkt kan dock fortfarande bli ganska varm vid 42 C.
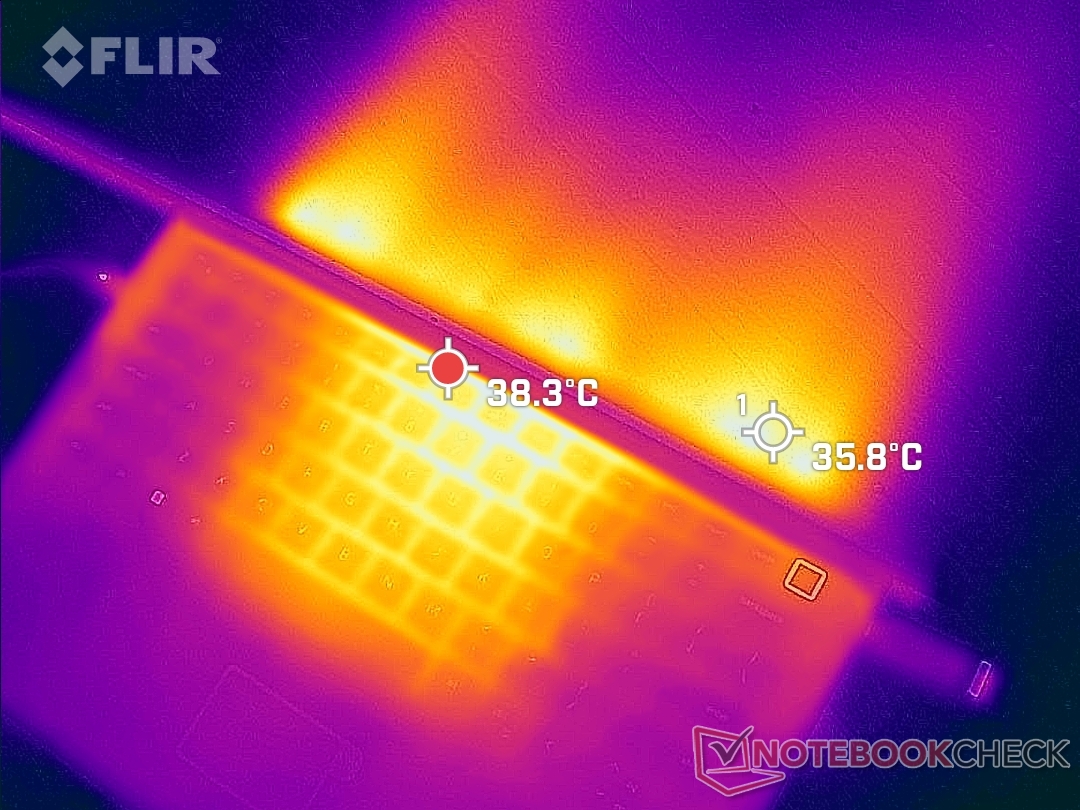
(±) Den maximala temperaturen på ovansidan är 41.8 °C / 107 F, jämfört med genomsnittet av 38.2 °C / 101 F , allt från 22.2 till 69.8 °C för klassen Workstation.
(+) Botten värms upp till maximalt 36 °C / 97 F, jämfört med genomsnittet av 41.1 °C / 106 F
(+) Vid tomgångsbruk är medeltemperaturen för ovansidan 31 °C / 88 F, jämfört med enhetsgenomsnittet på 32 °C / ### class_avg_f### F.
(±) När du spelar The Witcher 3 är medeltemperaturen för ovansidan 32.2 °C / 90 F, jämfört med enhetsgenomsnittet på 32 °C / ## #class_avg_f### F.
(+) Handledsstöden och pekplattan är kallare än hudtemperaturen med maximalt 27.6 °C / 81.7 F och är därför svala att ta på.
(±) Medeltemperaturen för handledsstödsområdet på liknande enheter var 27.8 °C / 82 F (+0.2 °C / 0.3 F).
| Dell Precision 5000 5470 Intel Core i9-12900H, NVIDIA RTX A1000 Laptop GPU | Lenovo ThinkPad P15v G2 21A9000XGE Intel Core i7-11800H, NVIDIA T1200 Laptop GPU | Dell Precision 5000 5560 Intel Core i7-11850H, NVIDIA RTX A2000 Laptop GPU | Lenovo ThinkPad P14s G2 AMD AMD Ryzen 7 PRO 5850U, AMD Radeon RX Vega 8 (Ryzen 4000/5000) | HP ZBook Firefly 14 G8 2C9Q2EA Intel Core i7-1165G7, NVIDIA T500 Laptop GPU | HP ZBook Firefly 14 G7 Intel Core i7-10610U, NVIDIA Quadro P520 | |
|---|---|---|---|---|---|---|
| Heat | -9% | -10% | 1% | 5% | -7% | |
| Maximum Upper Side * (°C) | 41.8 | 53.8 -29% | 48.2 -15% | 42.8 -2% | 42.6 -2% | 52.3 -25% |
| Maximum Bottom * (°C) | 36 | 52.1 -45% | 42.6 -18% | 47.5 -32% | 49.4 -37% | 60.9 -69% |
| Idle Upper Side * (°C) | 34.6 | 27.6 20% | 34.8 -1% | 27 22% | 24.2 30% | 23.1 33% |
| Idle Bottom * (°C) | 33.6 | 27.7 18% | 35.2 -5% | 28.3 16% | 24.6 27% | 23 32% |
* ... mindre är bättre
Stresstest - Cykling av CPU-klockfrekvenser
När Prime95 startas ökar CPU-klockfrekvensen, strömförbrukningen på kortet och kärntemperaturen till 3,6 GHz, 91 W respektive 101 C. Efter bara några sekunder börjar dock klockfrekvensen, strömförbrukningen och temperaturen växla mellan 1,0 och 2,4 GHz, 20-50 W respektive 61-82 C. Detta cykliska beteende stämmer överens med våra CineBency R15 xT loop-testresultat ovan som visar att Precision 5470 inte kan upprätthålla stabila Turbo Boost-klockfrekvenser under längre perioder. Att köra en Core i9-12900H CPU till sin fulla potential i ett så här litet chassi förblir en önskedröm.
När man kör Witcher 3 för att representera hög bearbetningsbelastning skulle CPU och GPU stabiliseras vid 82 C respektive 71 C, jämfört med 69 C och 75 C på Precision 5560.
Att köra på batteri begränsar CPU-prestandan. Ett Fire Strike -test på batterier skulle ge fysik- och grafikpoäng på 21067 respektive 10542 poäng, jämfört med 27514 och 10914 poäng när den är på strömförsörjning.
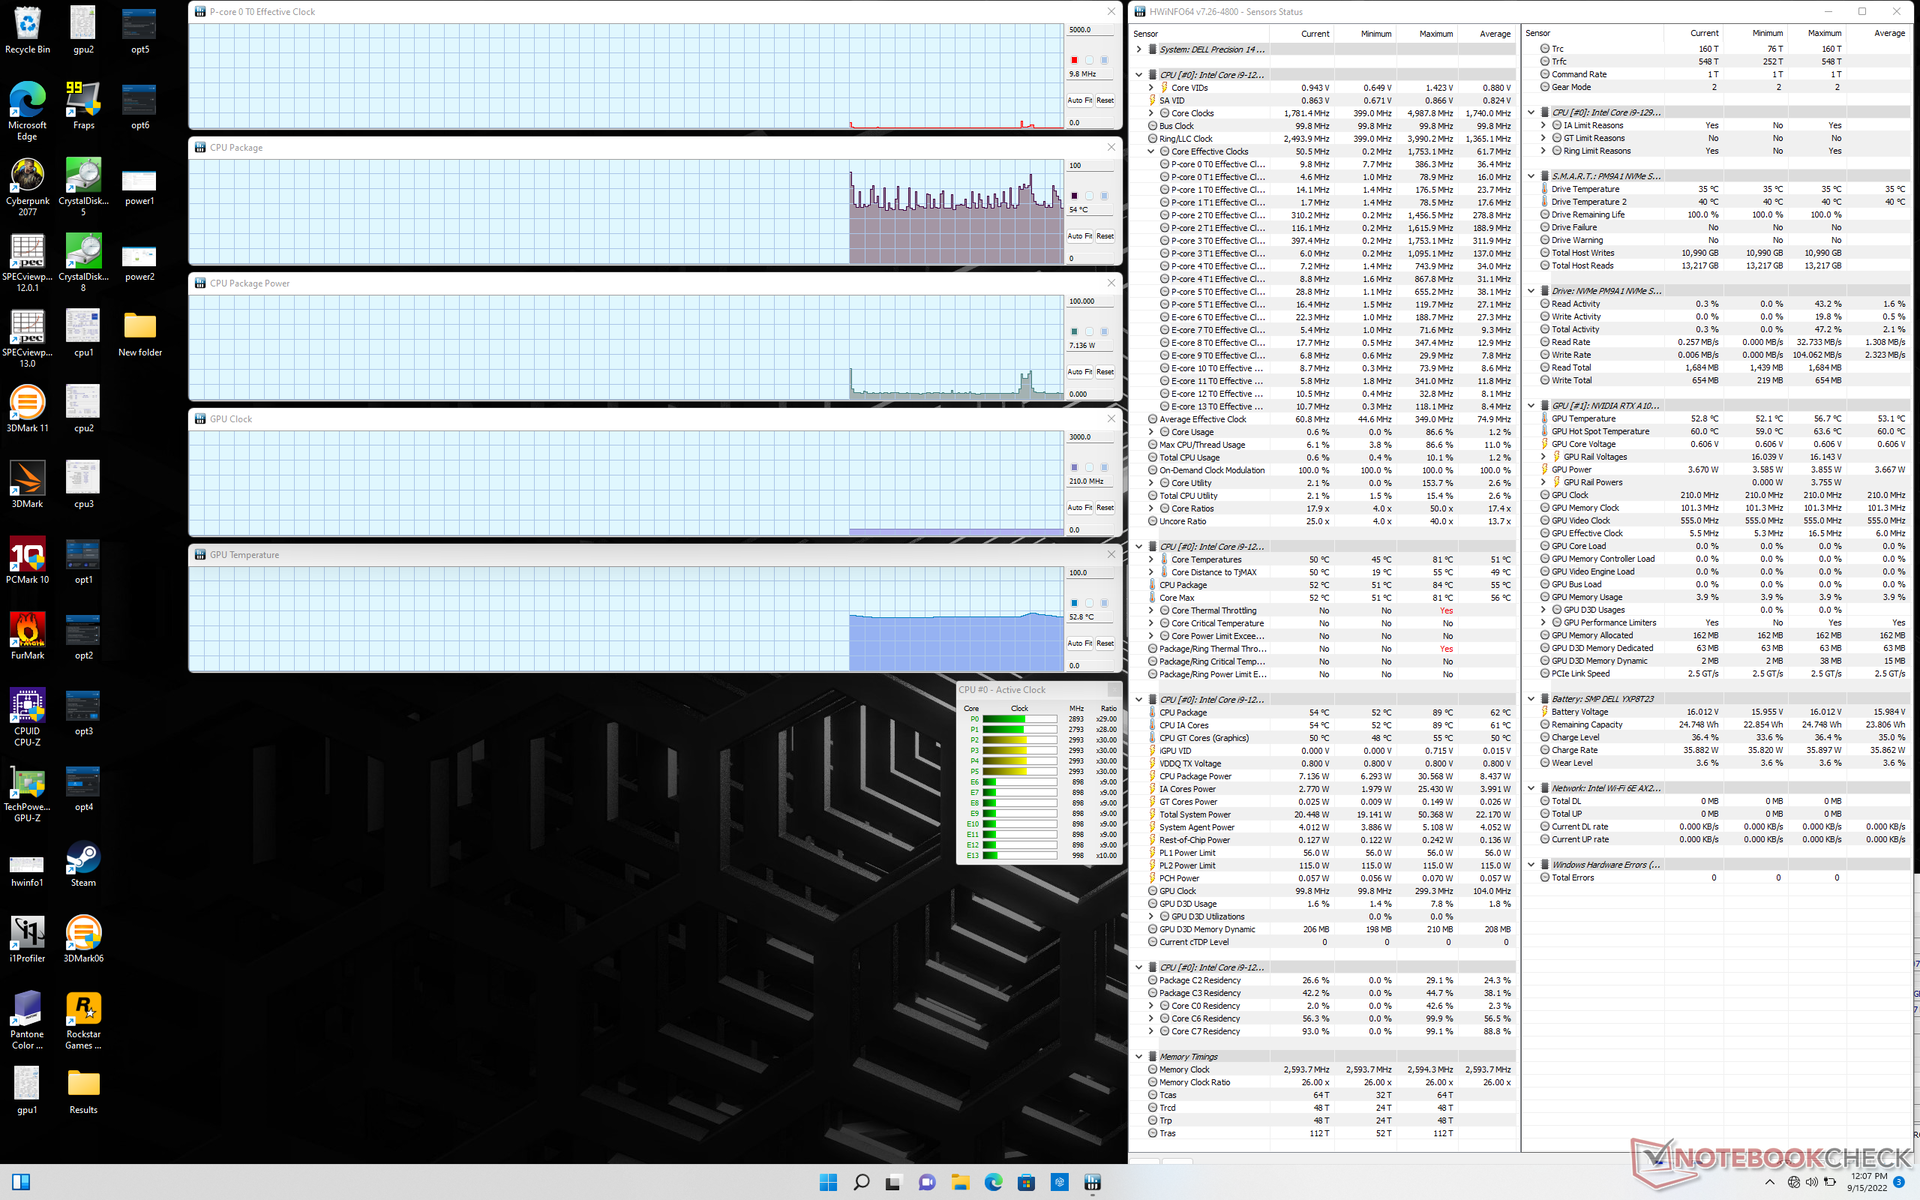
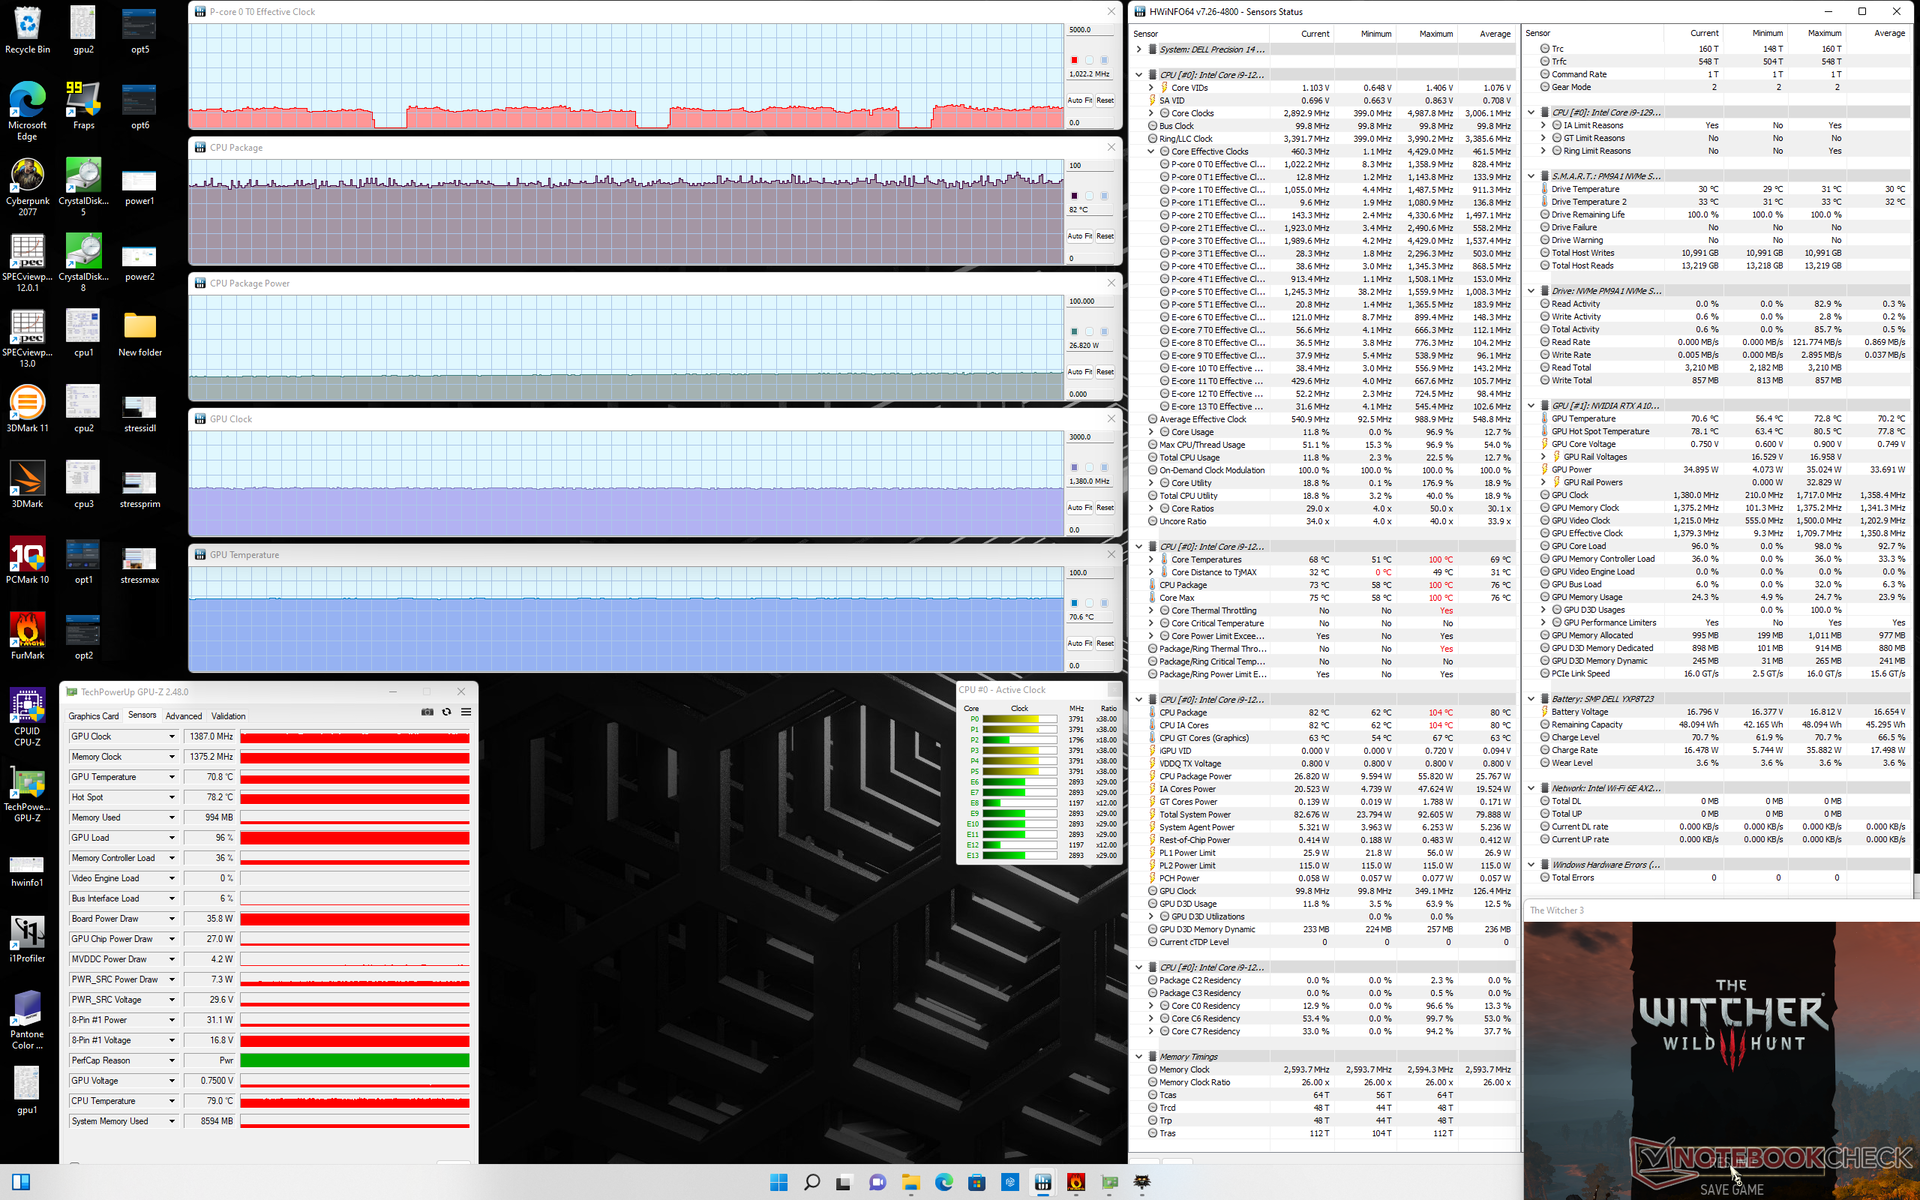
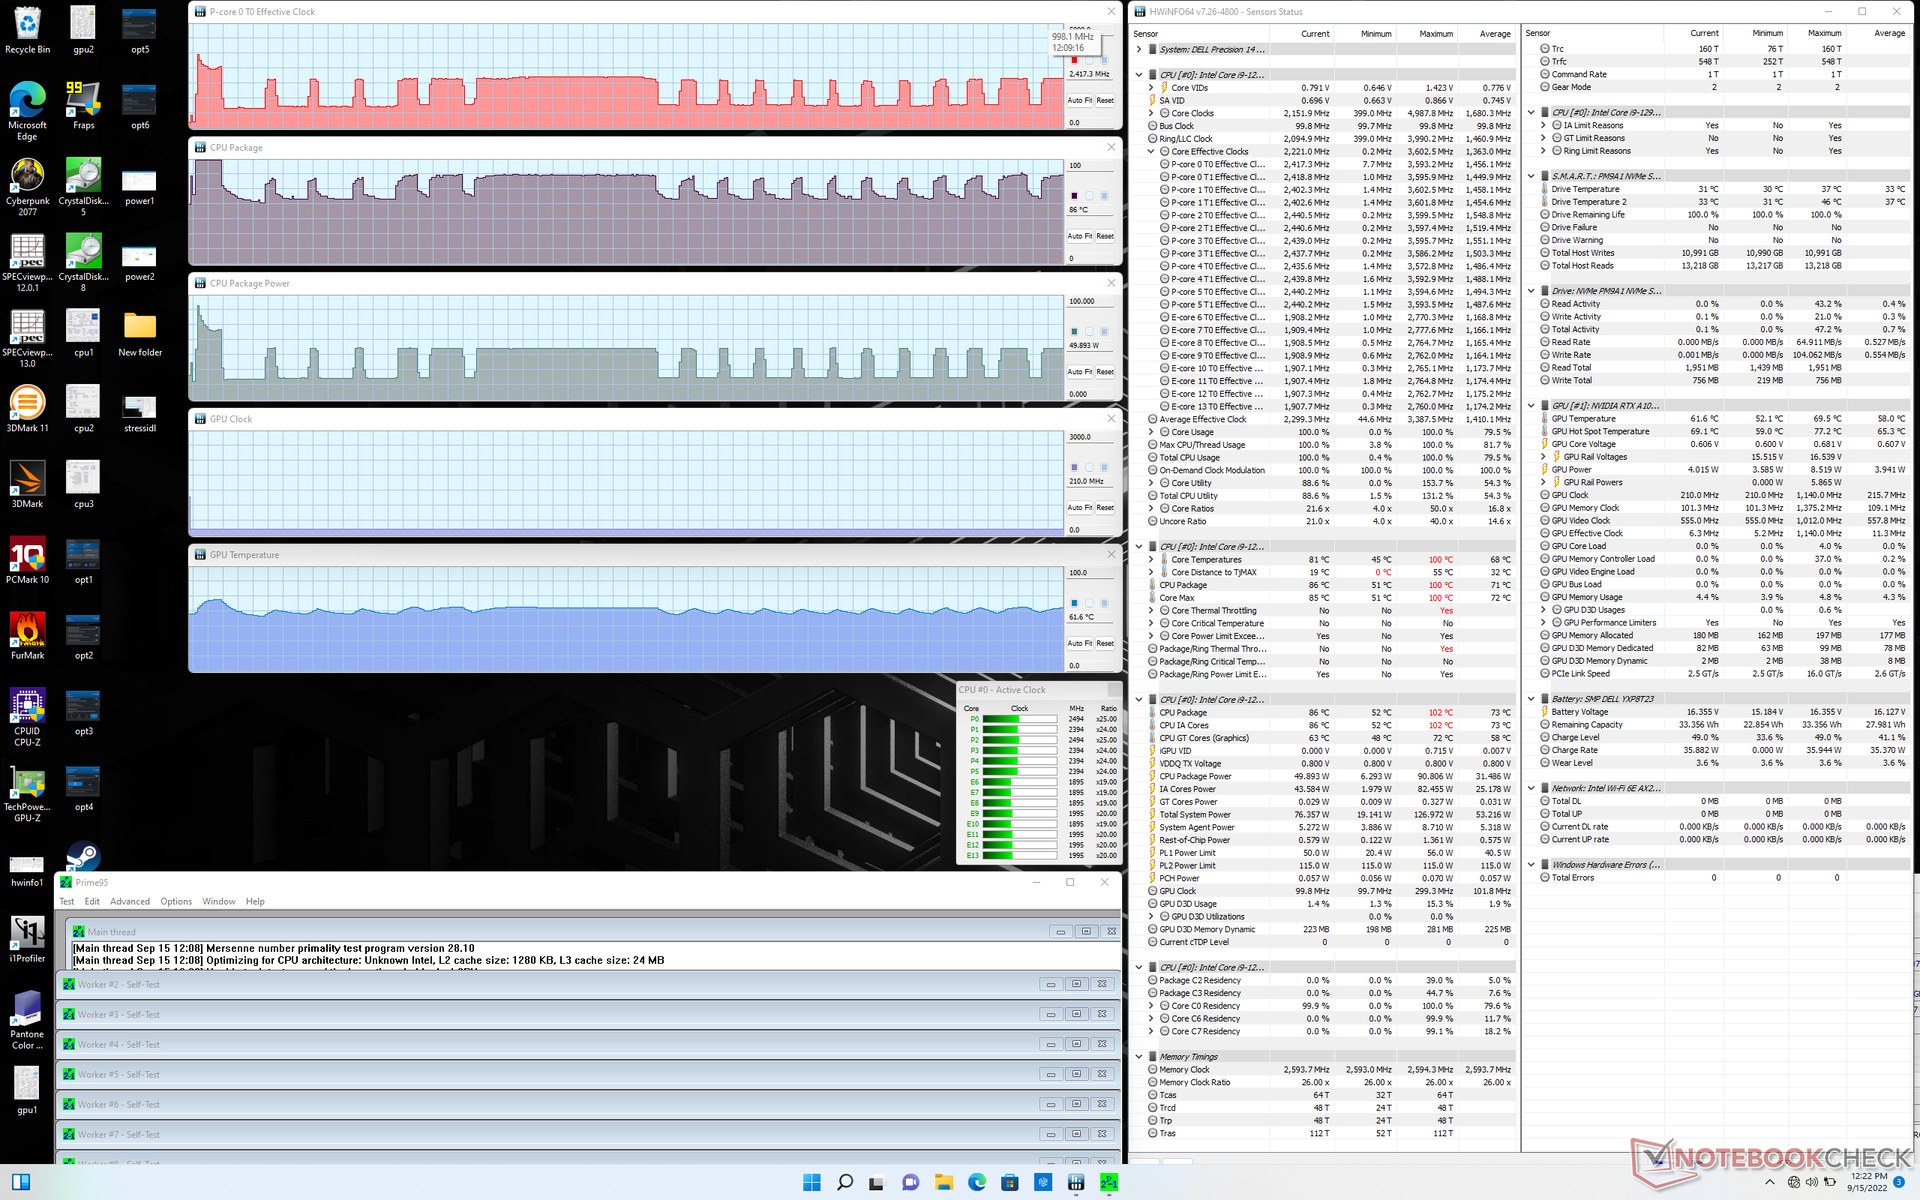
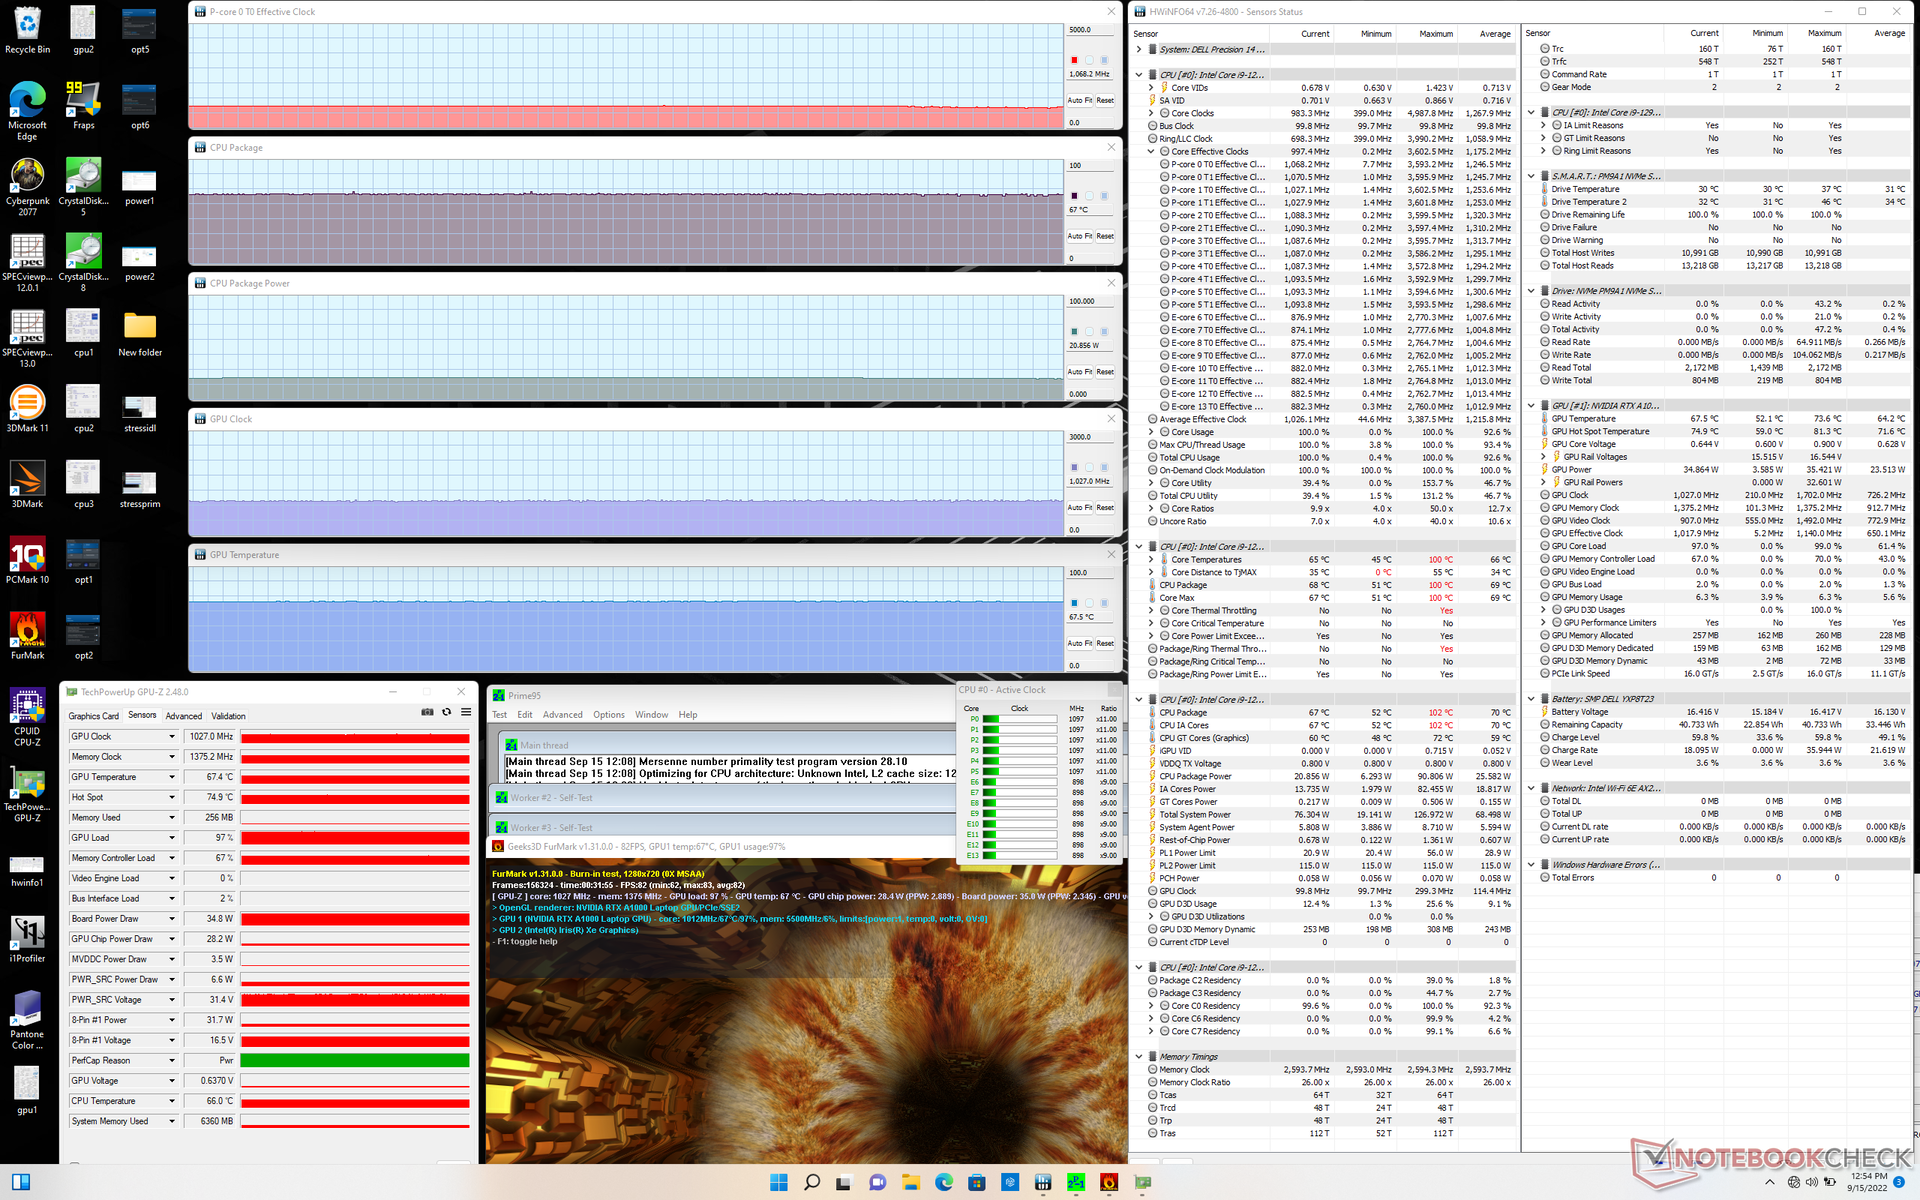
| CPU-klocka (GHz) | GPU-klocka (MHz) | Genomsnittlig CPU-temperatur (°C) | Genomsnittlig GPU-temperatur (°C) | |
| System Idle | -- | -- | 54 | 53 |
| Prime95 Stress | 1,0 - 2,4 | -- | 61 - 80 | ~61 |
| Prime95 + FurMark Stress | 1.1 | 1027 | 67 | 68 |
| Witcher 3 Stress | 1.0 | 1387 | 82 | 71 |
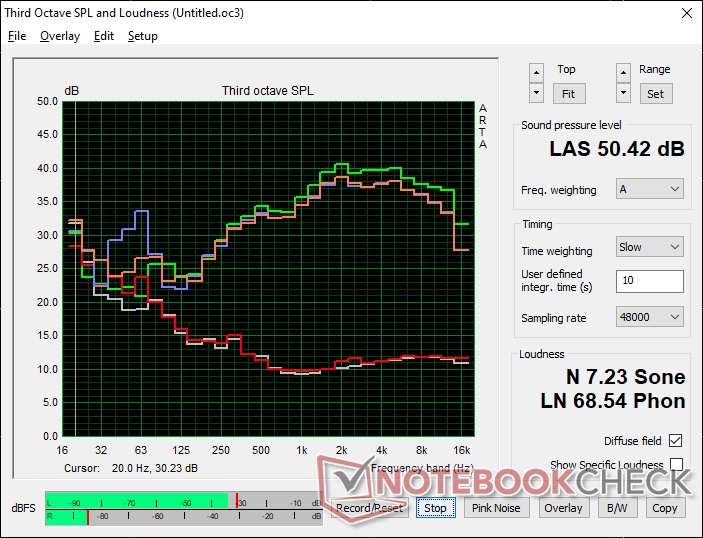
Högtalare
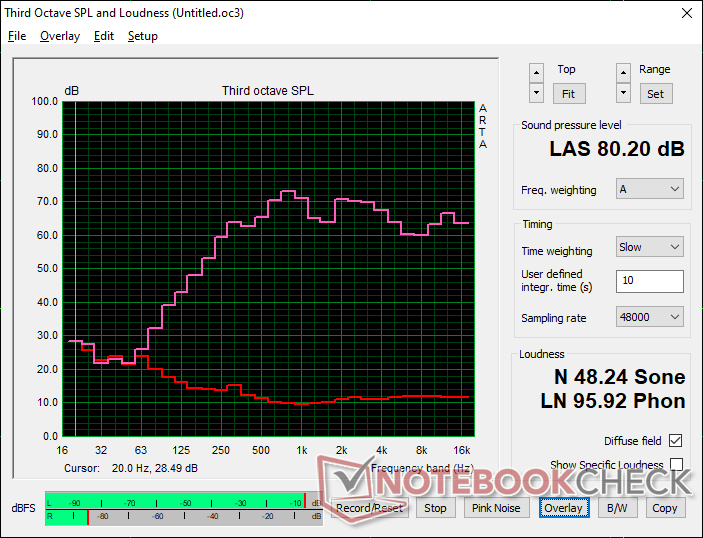
Dell Precision 5000 5470 ljudanalys
(±) | högtalarljudstyrkan är genomsnittlig men bra (80.2 dB)
Bas 100 - 315 Hz
(±) | reducerad bas - i genomsnitt 12.9% lägre än medianen
(±) | linjäriteten för basen är genomsnittlig (10.1% delta till föregående frekvens)
Mellan 400 - 2000 Hz
(+) | balanserad mellan - endast 4.2% från medianen
(+) | mids är linjära (6.5% delta till föregående frekvens)
Högsta 2 - 16 kHz
(+) | balanserade toppar - endast 3.4% från medianen
(+) | toppar är linjära (3.9% delta till föregående frekvens)
Totalt 100 - 16 000 Hz
(+) | det totala ljudet är linjärt (12.9% skillnad mot median)
Jämfört med samma klass
» 21% av alla testade enheter i den här klassen var bättre, 6% liknande, 72% sämre
» Den bästa hade ett delta på 7%, genomsnittet var 17%, sämst var 35%
Jämfört med alla testade enheter
» 12% av alla testade enheter var bättre, 3% liknande, 85% sämre
» Den bästa hade ett delta på 4%, genomsnittet var 24%, sämst var 134%
Apple MacBook Pro 16 2021 M1 Pro ljudanalys
(+) | högtalare kan spela relativt högt (84.7 dB)
Bas 100 - 315 Hz
(+) | bra bas - bara 3.8% från medianen
(+) | basen är linjär (5.2% delta till föregående frekvens)
Mellan 400 - 2000 Hz
(+) | balanserad mellan - endast 1.3% från medianen
(+) | mids är linjära (2.1% delta till föregående frekvens)
Högsta 2 - 16 kHz
(+) | balanserade toppar - endast 1.9% från medianen
(+) | toppar är linjära (2.7% delta till föregående frekvens)
Totalt 100 - 16 000 Hz
(+) | det totala ljudet är linjärt (4.6% skillnad mot median)
Jämfört med samma klass
» 0% av alla testade enheter i den här klassen var bättre, 0% liknande, 100% sämre
» Den bästa hade ett delta på 5%, genomsnittet var 17%, sämst var 45%
Jämfört med alla testade enheter
» 0% av alla testade enheter var bättre, 0% liknande, 100% sämre
» Den bästa hade ett delta på 4%, genomsnittet var 24%, sämst var 134%
Energiförvaltning
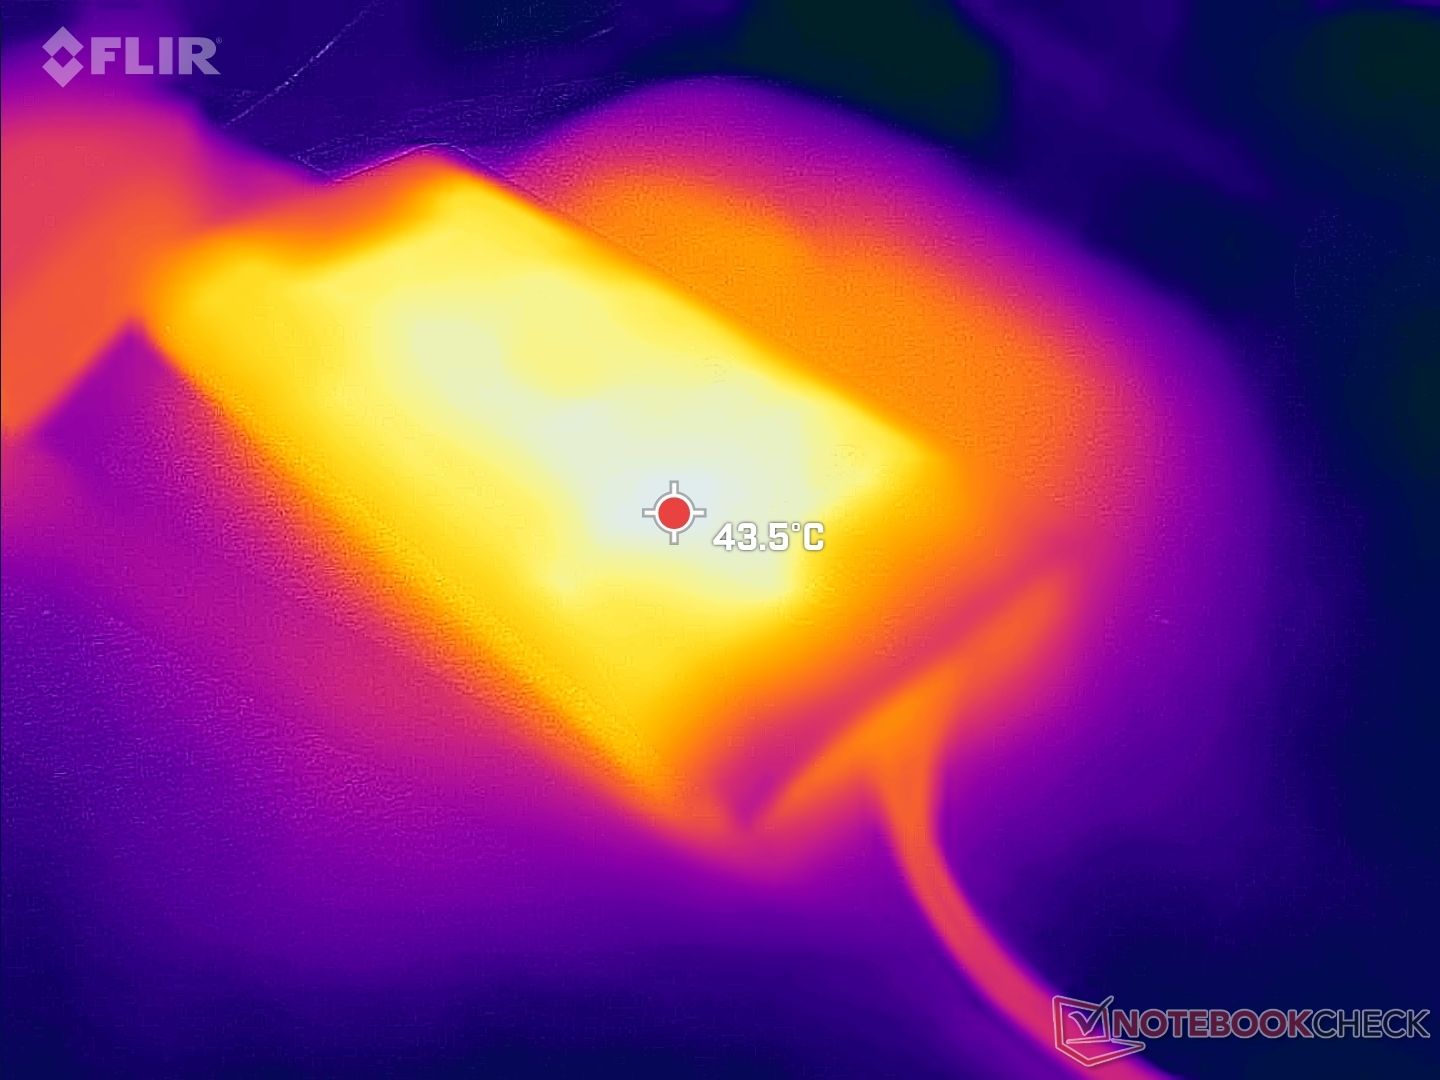
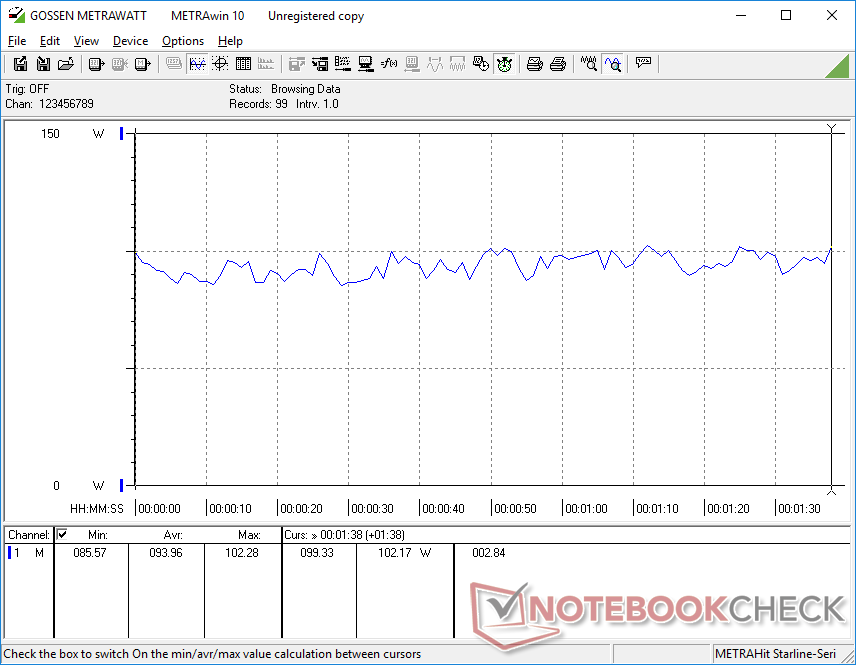
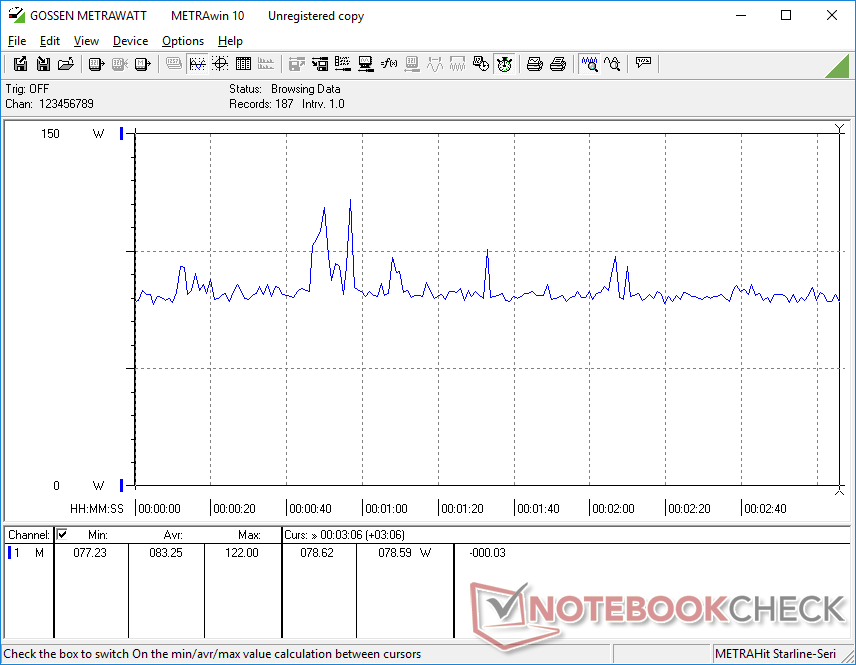
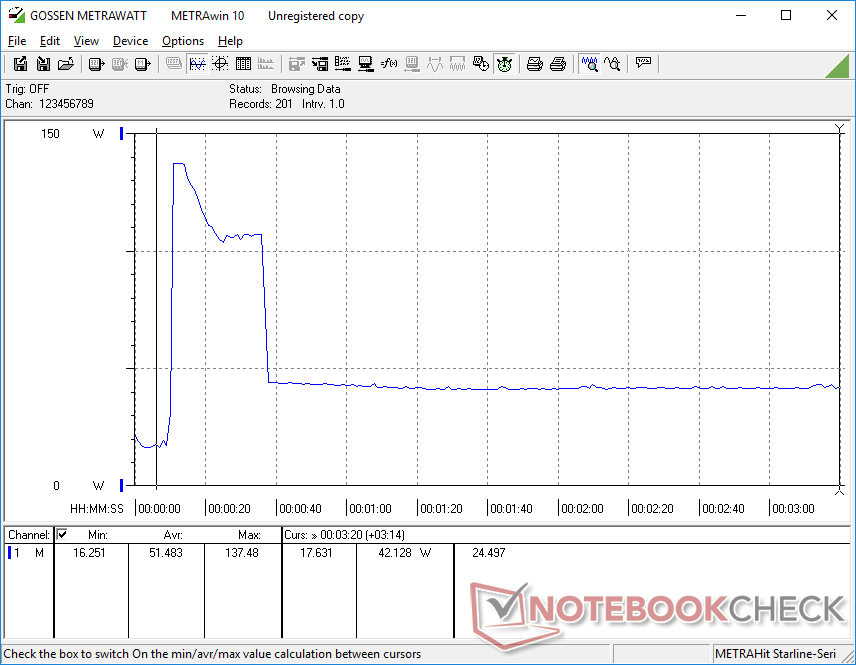
Strömförbrukning - en krävande liten maskin
Tomgång på skrivbordet med den lägsta ljusstyrkan och energiprofilen kräver bara 4,3 W, medan den högsta ljusstyrkan och energiprofilen med dGPU:n aktiv kräver nästan 19 W. När man kör mer krävande belastningar, t.ex. spel, blir systemet dock lika krävande som den större Precision 5560 med den snabbare RTX A2000 GPU:n men den långsammare i7-11850H CPU:n. Systemet är generellt sett mer krävande än andra 14-tums arbetsstationer, vilket kan förväntas med tanke på dess snabbare interna hårdvara
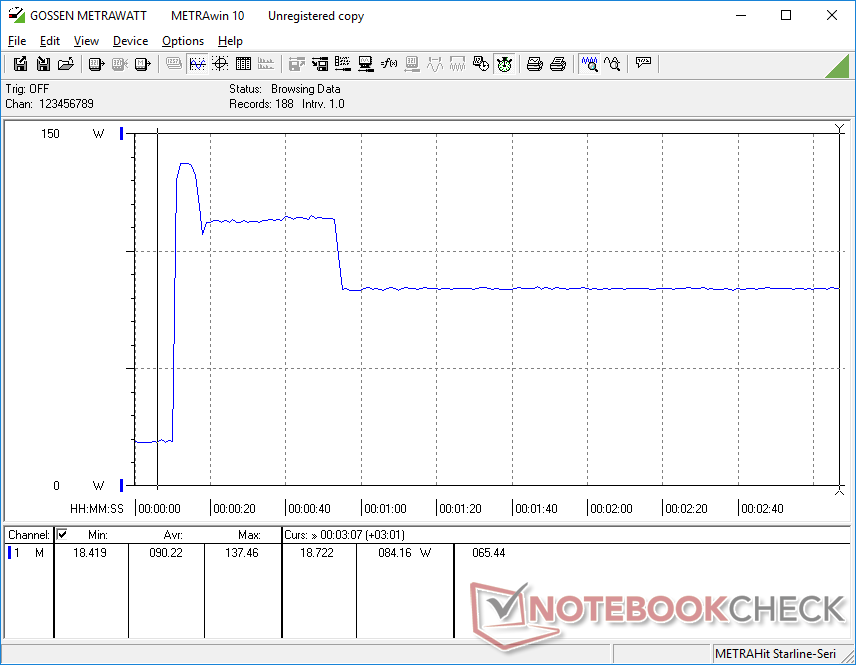
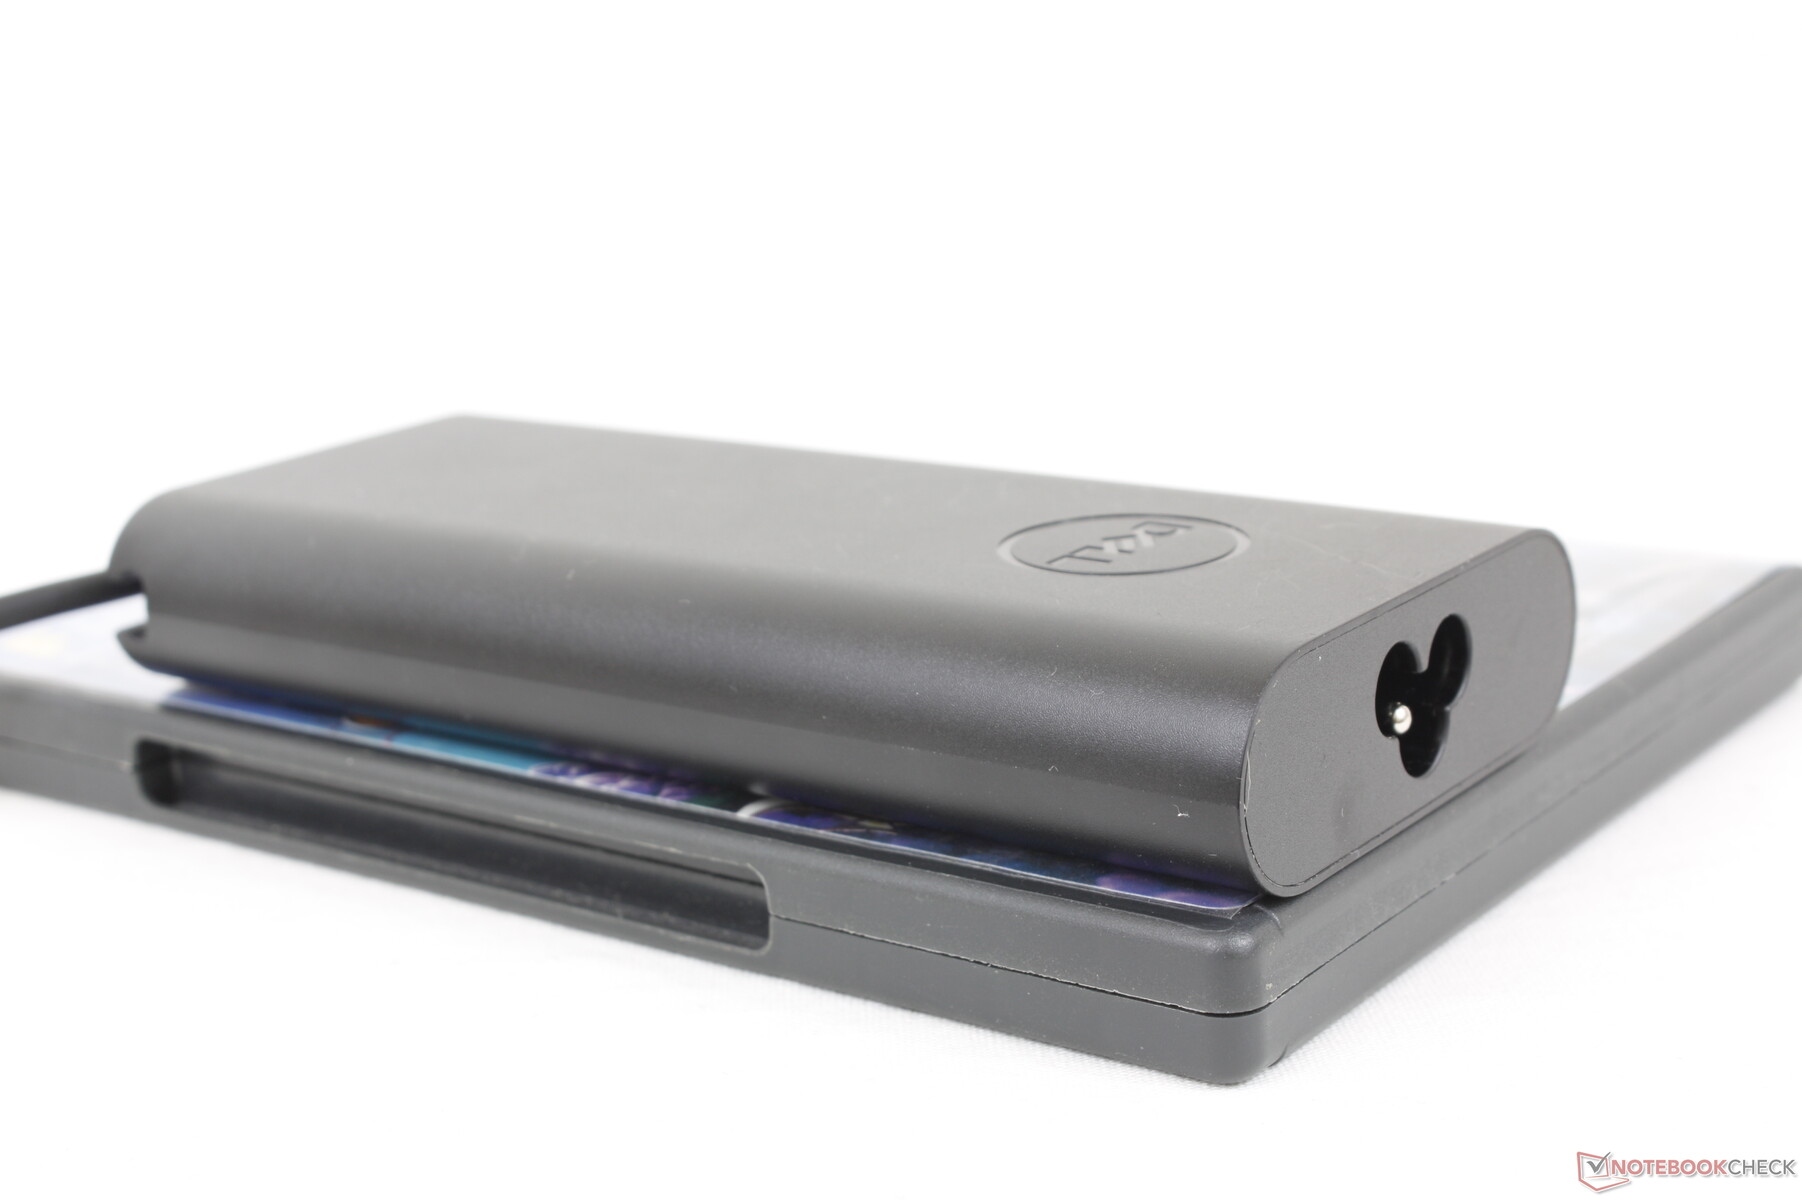
Vi kan registrera ett maximalt uttag på nästan 138 W från den små-medelstora (~14,3 x 6,5 x 2,2 cm) 130 W USB-C AC-adaptern när vi kör Prim95. Den här hastigheten är endast tillfällig som framgår av skärmdumparna nedan på grund av kylningslösningens termiska begränsningar. Formen på strömförbrukningskurvan stämmer väl överens med våra observationer av klockfrekvens och kortets strömförbrukning från ovan.
Observera att SKU:er utan diskret RTX A1000 GPU levereras med en mindre 90 W USB-C AC-adapter i stället för en större 130 W-adapter.
| Av/Standby | |
| Låg belastning | |
| Hög belastning |
|
Förklaring:
min: | |
| Dell Precision 5000 5470 i9-12900H, RTX A1000 Laptop GPU, Samsung PM9A1 MZVL21T0HCLR, IPS, 2560x1600, 14" | Lenovo ThinkPad P15v G2 21A9000XGE i7-11800H, T1200 Laptop GPU, Toshiba XG6 KXG6AZNV512G, IPS LED, 1920x1080, 15.6" | Dell Precision 5000 5560 i7-11850H, RTX A2000 Laptop GPU, Samsung PM9A1 MZVL22T0HBLB, IPS, 3840x2400, 15.6" | Lenovo ThinkPad P14s G2 AMD R7 PRO 5850U, Vega 8, SK Hynix PC711 1TB HFS001TDE9X081N, IPS LED, 3840x2160, 14" | HP ZBook Firefly 14 G8 2C9Q2EA i7-1165G7, T500 Laptop GPU, Toshiba XG6 KXG60ZNV1T02, IPS, 1920x1080, 14" | HP ZBook Firefly 14 G7 i7-10610U, Quadro P520, Toshiba XG6 KXG60ZNV512G, IPS, 1920x1080, 14" | |
|---|---|---|---|---|---|---|
| Power Consumption | 1% | -22% | 35% | 40% | 30% | |
| Idle Minimum * (Watt) | 4.3 | 5.96 -39% | 6.2 -44% | 4.49 -4% | 3.1 28% | 3.3 23% |
| Idle Average * (Watt) | 8.9 | 8.37 6% | 13.9 -56% | 9.62 -8% | 4.7 47% | 9.3 -4% |
| Idle Maximum * (Watt) | 18.9 | 9.05 52% | 23.8 -26% | 10.24 46% | 8.6 54% | 12.1 36% |
| Load Average * (Watt) | 94 | 91.82 2% | 95.7 -2% | 31.56 66% | 64.8 31% | 59.4 37% |
| Witcher 3 ultra * (Watt) | 83.2 | 102 -23% | 87 -5% | 43.7 47% | 59.6 28% | 52.7 37% |
| Load Maximum * (Watt) | 137.5 | 126.38 8% | 132.6 4% | 52.37 62% | 68.5 50% | 69.4 50% |
* ... mindre är bättre
Power Consumption Witcher 3 / Stresstest
Power Consumption external Monitor
Batteritid
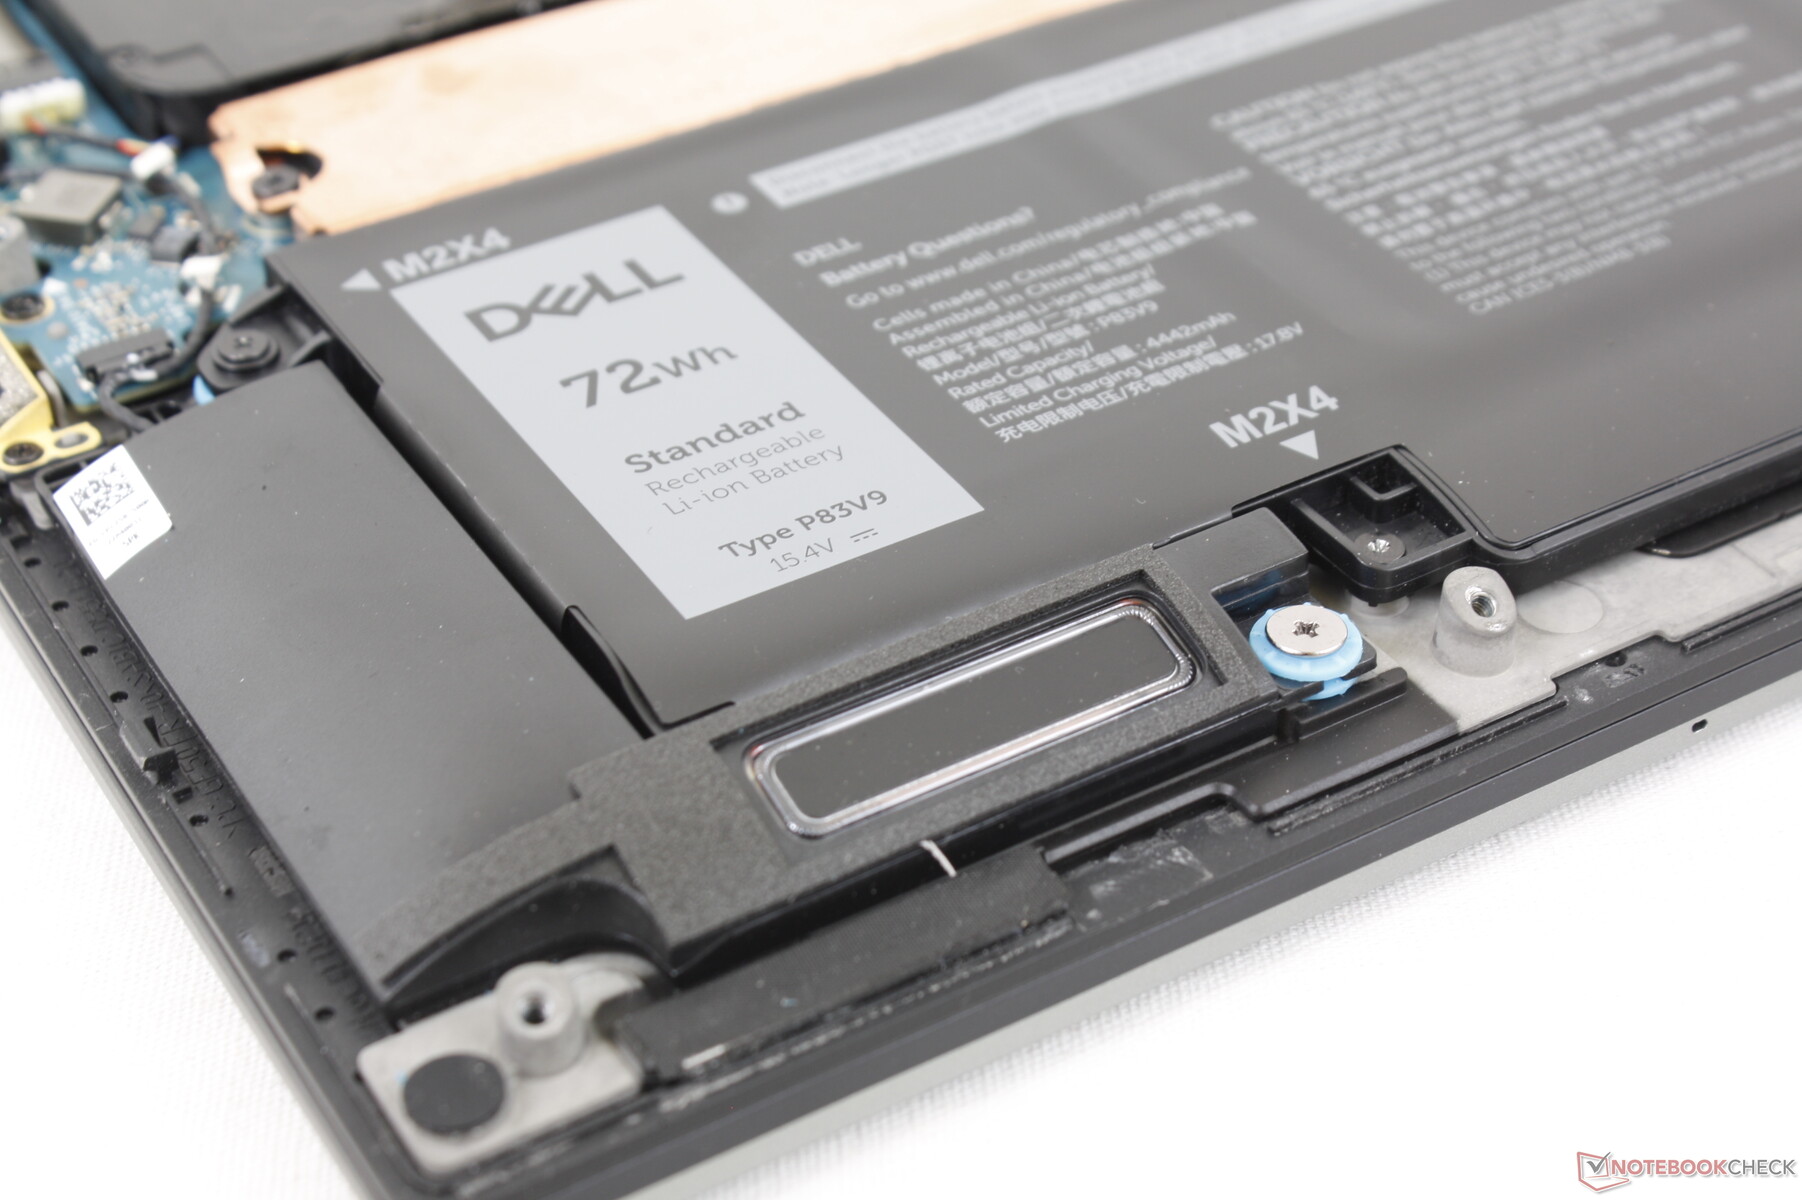
Batterikapaciteten är relativt stor för en ultratunn 14-tums bärbar dator med 72 Wh. WLAN-driftstiden varar drygt 9,5 timmar på en full laddning, vilket är några timmar kortare än vad vi noterade på den långsammare Core U-serien-drivna HP ZBook Firefly 14 G8.
Laddning från tom till full kapacitet tar cirka 2 timmar.
| Dell Precision 5000 5470 i9-12900H, RTX A1000 Laptop GPU, 72 Wh | Lenovo ThinkPad P15v G2 21A9000XGE i7-11800H, T1200 Laptop GPU, 68 Wh | Dell Precision 5000 5560 i7-11850H, RTX A2000 Laptop GPU, 86 Wh | Lenovo ThinkPad P14s G2 AMD R7 PRO 5850U, Vega 8, 50 Wh | HP ZBook Firefly 14 G8 2C9Q2EA i7-1165G7, T500 Laptop GPU, 53 Wh | HP ZBook Firefly 14 G7 i7-10610U, Quadro P520, 53 Wh | |
|---|---|---|---|---|---|---|
| Batteridrifttid | -8% | 4% | 7% | 162% | 21% | |
| Reader / Idle (h) | 14.7 | 17.2 17% | 12 -18% | |||
| WiFi v1.3 (h) | 9.6 | 7.5 -22% | 6.3 -34% | 8.3 -14% | 12.8 33% | 10.1 5% |
| Load (h) | 1.1 | 0.9 -18% | 1.8 64% | 1.4 27% | 4.3 291% | 1.5 36% |
| H.264 (h) | 8 | 10.6 | 12.5 |
För
Emot
Omdöme - Rejält kraftfull utan rejäl storlek
Precision 5470 kan bäst beskrivas som en tunn och lätt arbetsstation med processorn från en tjock och tung bärbar dator för spel. Du kommer inte att hitta någon annan 14-tums arbetsstation som är så kompakt med samma Core i9-12900H CPU och till och med diskret Nvidia RTX GPU som denna Dell. Om du vill maximera prestandan och samtidigt hålla vikten och storleken så låg som möjligt kan Precision 5470 vara värd att överväga.
Precision 5470 är snabbare och kraftfullare än vad dess lilla storlek annars skulle kunna antyda. Det här är den arbetsstationsmodell du ska skaffa om du vill hålla prestandan så hög som möjligt på en liten 14-tums formfaktor.
Tyvärr är systemet lite för ambitiöst när det gäller prestanda. Dess Core i9-12900H presterar undermåligt jämfört med andra bärbara datorer med samma CPU. Den är fortfarande snabb i förhållande tillandra 14-tums arbetsstationer, men det kunde definitivt ha varit snabbare. Vi har våra farhågor om hur mycket bättre Core i9-12900HK SKU faktiskt kan prestera jämfört med vår Core i9-12900H med tanke på de oönskade klockfrekvensfluktuationerna under vår granskning. Samtidigt uppvisar RTX A1000 dålig ray tracing-potential trots att den har RTX i sitt namn, ungefär som våra observationer med GeForce RTX 3050 som A1000 är baserad på.
Den krävande CPU:n i 12:e generationens H-serie är direkt ansvarig för det relativt höga fläktljudet och den höga strömförbrukningen hos Precision 5470. Den må se ut och kännas som en 14-tums bärbar dator, men den kan definitivt låta som en bärbar speldator ibland. Denna nackdel är vanlig på små bärbara datorer med hög prestanda.
Pris och tillgänglighet
Precision 5470 är nu allmänt tillgänglig via onlineåterförsäljare som Newegg eller Amazon om än endast i begränsade FHD-konfigurationer som ligger på mellan 2 000 och 2 300 USD. Användare kan istället köpa direkt från Dell som kommer att ha fler konfigurerbara alternativ att välja mellan.
Dell Precision 5000 5470
- 09/16/2022 v7 (old)
Allen Ngo
Price comparison

