Test: Lenovo ThinkPad P15 Gen 2 - Traditionell arbetsstation med nya grafikkort (Sammanfattning)
Testgrupp
Gradering | Datum | Modell | Vikt | Höjd | Storlek | Upplösning | Pris |
|---|---|---|---|---|---|---|---|
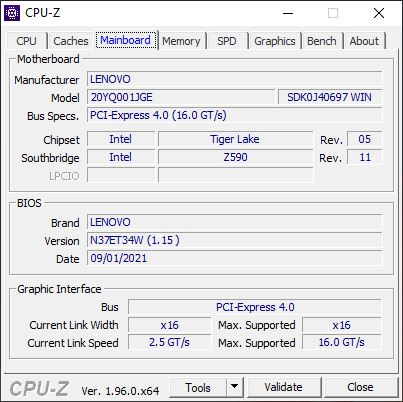
| 87.2 % v7 (old) | 10/2021 | Lenovo ThinkPad P15 G2-20YQ001JGE i7-11800H, RTX A3000 Laptop GPU | 2.9 kg | 31.5 mm | 15.60" | 1920x1080 | |
| 87.8 % v7 (old) | 09/2021 | HP ZBook Studio 15 G8 i9-11950H, GeForce RTX 3070 Laptop GPU | 1.9 kg | 18 mm | 15.60" | 3840x2160 | |
| 90.2 % v7 (old) | 06/2021 | HP ZBook Fury 15 G7 W-10885M, Quadro RTX 5000 Max-Q | 2.4 kg | 25.9 mm | 15.60" | 3840x2160 | |
| 87.8 % v7 (old) | 12/2020 | Dell Precision 7550 W-10885M, Quadro RTX 5000 Max-Q | 2.8 kg | 27.36 mm | 15.60" | 3840x2160 | |
| 83.4 % v7 (old) | 02/2021 | MSI WS66 10TMT-207US i9-10980HK, Quadro RTX 5000 Max-Q | 2.3 kg | 19.8 mm | 15.60" | 1920x1080 | |
| 85.6 % v7 (old) | Lenovo ThinkPad P15 Gen1-20ST000DGE i7-10750H, Quadro T1000 (Laptop) | 2.7 kg | 31.45 mm | 15.60" | 1920x1080 |
| SD Card Reader | |
| average JPG Copy Test (av. of 3 runs) | |
| MSI WS66 10TMT-207US (Toshiba Exceria Pro SDXC 64 GB UHS-II) | |
| Lenovo ThinkPad P15 G2-20YQ001JGE (AV Pro V60) | |
| Dell Precision 7550 (Toshiba Exceria Pro SDXC 64 GB UHS-II) | |
| HP ZBook Fury 15 G7 (Toshiba Exceria Pro SDXC 64 GB UHS-II) | |
| Genomsnitt av klass Workstation (49.6 - 681, n=14, senaste 2 åren) | |
| Lenovo ThinkPad P15 Gen1-20ST000DGE (Toshiba Exceria Pro SDXC 64 GB UHS-II) | |
| HP ZBook Studio 15 G8 (AV Pro V60) | |
| maximum AS SSD Seq Read Test (1GB) | |
| Genomsnitt av klass Workstation (87.6 - 1455, n=14, senaste 2 åren) | |
| MSI WS66 10TMT-207US (Toshiba Exceria Pro SDXC 64 GB UHS-II) | |
| Lenovo ThinkPad P15 G2-20YQ001JGE (AV Pro V60) | |
| HP ZBook Fury 15 G7 (Toshiba Exceria Pro SDXC 64 GB UHS-II) | |
| Dell Precision 7550 (Toshiba Exceria Pro SDXC 64 GB UHS-II) | |
| Lenovo ThinkPad P15 Gen1-20ST000DGE (Toshiba Exceria Pro SDXC 64 GB UHS-II) | |
| HP ZBook Studio 15 G8 (AV Pro V60) | |
| Networking | |
| iperf3 transmit AX12 | |
| MSI WS66 10TMT-207US | |
| HP ZBook Studio 15 G8 | |
| Lenovo ThinkPad P15 G2-20YQ001JGE | |
| Lenovo ThinkPad P15 Gen1-20ST000DGE | |
| Genomsnitt Intel Wi-Fi 6E AX210 (675 - 1602, n=27) | |
| Dell Precision 7550 | |
| HP ZBook Fury 15 G7 | |
| iperf3 receive AX12 | |
| Lenovo ThinkPad P15 G2-20YQ001JGE | |
| HP ZBook Studio 15 G8 | |
| Lenovo ThinkPad P15 Gen1-20ST000DGE | |
| Dell Precision 7550 | |
| Genomsnitt Intel Wi-Fi 6E AX210 (914 - 1716, n=27) | |
| MSI WS66 10TMT-207US | |
| HP ZBook Fury 15 G7 | |


| |||||||||||||||||||||||||
Distribution av ljusstyrkan: 95 %
Mitt på batteriet: 499 cd/m²
Kontrast: 1277:1 (Svärta: 0.39 cd/m²)
ΔE ColorChecker Calman: 2.1 | ∀{0.5-29.43 Ø4.71}
calibrated: 0.8
ΔE Greyscale Calman: 3.4 | ∀{0.09-98 Ø4.96}
70.6% AdobeRGB 1998 (Argyll 3D)
99.8% sRGB (Argyll 3D)
68.6% Display P3 (Argyll 3D)
Gamma: 2.32
CCT: 7162 K
| Lenovo ThinkPad P15 G2-20YQ001JGE N156HCE_GN1, IPS, 1920x1080, 15.6" | HP ZBook Studio 15 G8 SDC4145, OLED, 3840x2160, 15.6" | HP ZBook Fury 15 G7 LG Philips LGD0661, IPS, 3840x2160, 15.6" | Dell Precision 7550 AU Optronics B156ZAN, IPS, 3840x2160, 15.6" | MSI WS66 10TMT-207US AU Optronics B156HAB03.0, IPS, 1920x1080, 15.6" | Lenovo ThinkPad P15 Gen1-20ST000DGE N156HCE-EN1, a-Si IPS LED, 1920x1080, 15.6" | |
|---|---|---|---|---|---|---|
| Display | 27% | 20% | 19% | -10% | -5% | |
| Display P3 Coverage (%) | 68.6 | 99.9 46% | 95.6 39% | 82.1 20% | 62.8 -8% | 66.6 -3% |
| sRGB Coverage (%) | 99.8 | 100 0% | 99.8 0% | 99.6 0% | 86.9 -13% | 92.3 -8% |
| AdobeRGB 1998 Coverage (%) | 70.6 | 95.3 35% | 84.5 20% | 96.8 37% | 63.6 -10% | 67.1 -5% |
| Response Times | 90% | -87% | -75% | -50% | -58% | |
| Response Time Grey 50% / Grey 80% * (ms) | 37.6 ? | 2.4 ? 94% | 56 ? -49% | 51.2 ? -36% | 44.8 ? -19% | 41.2 ? -10% |
| Response Time Black / White * (ms) | 16 ? | 2.4 ? 85% | 36 ? -125% | 34 ? -113% | 28.8 ? -80% | 32.8 ? -105% |
| PWM Frequency (Hz) | 26040 ? | 240.4 ? | 24270 | |||
| Screen | -71% | -40% | -69% | -73% | -75% | |
| Brightness middle (cd/m²) | 498 | 379.6 -24% | 672.8 35% | 473.5 -5% | 374.5 -25% | 338 -32% |
| Brightness (cd/m²) | 490 | 380 -22% | 674 38% | 461 -6% | 363 -26% | 304 -38% |
| Brightness Distribution (%) | 95 | 95 0% | 89 -6% | 90 -5% | 91 -4% | 81 -15% |
| Black Level * (cd/m²) | 0.39 | 0.5 -28% | 0.55 -41% | 0.42 -8% | 0.45 -15% | |
| Contrast (:1) | 1277 | 1346 5% | 861 -33% | 892 -30% | 751 -41% | |
| Colorchecker dE 2000 * | 2.1 | 5.15 -145% | 3.48 -66% | 4.8 -129% | 4.05 -93% | 5.5 -162% |
| Colorchecker dE 2000 max. * | 5.6 | 7.79 -39% | 9.44 -69% | 8.73 -56% | 8.17 -46% | 11.5 -105% |
| Colorchecker dE 2000 calibrated * | 0.8 | 3.1 -288% | 3.03 -279% | 3.08 -285% | 4.36 -445% | 1.9 -137% |
| Greyscale dE 2000 * | 3.4 | 2.6 24% | 3.1 9% | 5.6 -65% | 2.6 24% | 7.8 -129% |
| Gamma | 2.32 95% | 1.99 111% | 2.04 108% | 2.34 94% | 2.21 100% | 2.24 98% |
| CCT | 7162 91% | 6166 105% | 6380 102% | 7549 86% | 7027 93% | 6764 96% |
| Color Space (Percent of AdobeRGB 1998) (%) | 75.2 | 86.4 | 56.4 | 60 | ||
| Color Space (Percent of sRGB) (%) | 100 | 99.7 | 86.3 | 92.1 | ||
| Totalt genomsnitt (program/inställningar) | 15% /
-20% | -36% /
-34% | -42% /
-51% | -44% /
-56% | -46% /
-58% |
* ... mindre är bättre
Visa svarstider
| ↔ Svarstid svart till vitt | ||
|---|---|---|
| 16 ms ... stiga ↗ och falla ↘ kombinerat | ↗ 6 ms stiga | 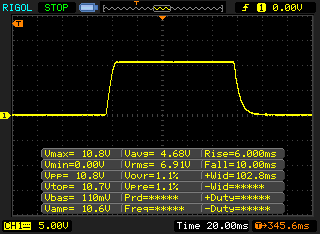 |
| ↘ 10 ms hösten | ||
| Skärmen visar bra svarsfrekvens i våra tester, men kan vara för långsam för konkurrenskraftiga spelare. I jämförelse sträcker sig alla testade enheter från 0.1 (minst) till 240 (maximalt) ms. » 37 % av alla enheter är bättre. Det betyder att den uppmätta svarstiden är bättre än genomsnittet av alla testade enheter (19.8 ms). | ||
| ↔ Svarstid 50 % grått till 80 % grått | ||
| 37.6 ms ... stiga ↗ och falla ↘ kombinerat | ↗ 18 ms stiga | 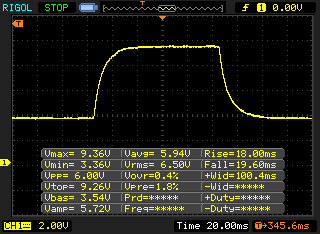 |
| ↘ 19.6 ms hösten | ||
| Skärmen visar långsamma svarsfrekvenser i våra tester och kommer att vara otillfredsställande för spelare. I jämförelse sträcker sig alla testade enheter från 0.165 (minst) till 636 (maximalt) ms. » 55 % av alla enheter är bättre. Detta innebär att den uppmätta svarstiden är sämre än genomsnittet av alla testade enheter (31 ms). | ||
Skärmflimmer / PWM (Puls-Width Modulation)
| Skärmflimmer / PWM upptäckt | 26040 Hz | ≤ 50 % ljusstyrka inställning | 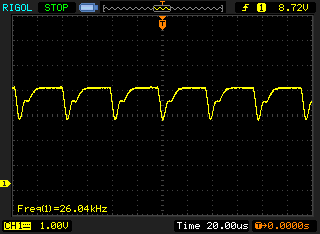 |
| ≤ 118 cd/m² ljusstyrka | |||
Displayens bakgrundsbelysning flimrar vid 26040 Hz (i värsta fall, t.ex. med PWM) Flimrande upptäckt vid en ljusstyrkeinställning på 50 % (118 cd/m²) och lägre. Det ska inte finnas något flimmer eller PWM över denna ljusstyrkeinställning. Frekvensen för 26040 Hz är ganska hög, så de flesta användare som är känsliga för PWM bör inte märka något flimmer. Flimrande förekommer vid relativt låga ljusstyrkeinställningar, så långvarig användning med denna ljusstyrkeinställning eller lägre kan orsaka ögonansträngning. Som jämförelse: 52 % av alla testade enheter använder inte PWM för att dämpa skärmen. Om PWM upptäcktes mättes ett medelvärde av 7754 (minst: 5 - maximum: 343500) Hz. | |||
Cinebench R15 Multi Uthållighetstest
Cinebench R20: CPU (Multi Core) | CPU (Single Core)
Cinebench R15: CPU Multi 64Bit | CPU Single 64Bit
Blender: v2.79 BMW27 CPU
7-Zip 18.03: 7z b 4 | 7z b 4 -mmt1
Geekbench 5.5: Multi-Core | Single-Core
HWBOT x265 Benchmark v2.2: 4k Preset
LibreOffice : 20 Documents To PDF
R Benchmark 2.5: Overall mean
| Cinebench R23 / Multi Core | |
| Genomsnitt av klass Workstation (14621 - 38520, n=23, senaste 2 åren) | |
| HP ZBook Studio 15 G8 | |
| Genomsnitt Intel Core i7-11800H (6508 - 14088, n=48) | |
| Lenovo ThinkPad P15 G2-20YQ001JGE | |
| Lenovo ThinkPad P15 Gen1-20ST000DGE | |
| HP ZBook Fury 15 G7 | |
| Cinebench R23 / Single Core | |
| Genomsnitt av klass Workstation (1712 - 2228, n=23, senaste 2 åren) | |
| HP ZBook Studio 15 G8 | |
| Lenovo ThinkPad P15 G2-20YQ001JGE | |
| Genomsnitt Intel Core i7-11800H (1386 - 1522, n=45) | |
| HP ZBook Fury 15 G7 | |
| Lenovo ThinkPad P15 Gen1-20ST000DGE | |
| Cinebench R20 / CPU (Multi Core) | |
| Genomsnitt av klass Workstation (5760 - 15043, n=23, senaste 2 åren) | |
| HP ZBook Studio 15 G8 | |
| Genomsnitt Intel Core i7-11800H (2498 - 5408, n=50) | |
| Lenovo ThinkPad P15 G2-20YQ001JGE | |
| MSI WS66 10TMT-207US | |
| Dell Precision 7550 | |
| HP ZBook Fury 15 G7 | |
| HP ZBook Fury 15 G7 | |
| Lenovo ThinkPad P15 Gen1-20ST000DGE | |
| Cinebench R20 / CPU (Single Core) | |
| Genomsnitt av klass Workstation (671 - 857, n=23, senaste 2 åren) | |
| HP ZBook Studio 15 G8 | |
| Lenovo ThinkPad P15 G2-20YQ001JGE | |
| Genomsnitt Intel Core i7-11800H (520 - 586, n=47) | |
| HP ZBook Fury 15 G7 | |
| HP ZBook Fury 15 G7 | |
| MSI WS66 10TMT-207US | |
| Lenovo ThinkPad P15 Gen1-20ST000DGE | |
| Dell Precision 7550 | |
| Cinebench R15 / CPU Multi 64Bit | |
| Genomsnitt av klass Workstation (2489 - 5810, n=23, senaste 2 åren) | |
| Genomsnitt Intel Core i7-11800H (1342 - 2173, n=50) | |
| Lenovo ThinkPad P15 G2-20YQ001JGE | |
| HP ZBook Studio 15 G8 | |
| MSI WS66 10TMT-207US | |
| Dell Precision 7550 | |
| HP ZBook Fury 15 G7 | |
| HP ZBook Fury 15 G7 | |
| Lenovo ThinkPad P15 Gen1-20ST000DGE | |
| Cinebench R15 / CPU Single 64Bit | |
| Genomsnitt av klass Workstation (191.4 - 328, n=23, senaste 2 åren) | |
| HP ZBook Studio 15 G8 | |
| Lenovo ThinkPad P15 G2-20YQ001JGE | |
| Genomsnitt Intel Core i7-11800H (201 - 231, n=46) | |
| HP ZBook Fury 15 G7 | |
| HP ZBook Fury 15 G7 | |
| MSI WS66 10TMT-207US | |
| Dell Precision 7550 | |
| Lenovo ThinkPad P15 Gen1-20ST000DGE | |
| Blender / v2.79 BMW27 CPU | |
| HP ZBook Fury 15 G7 | |
| Lenovo ThinkPad P15 Gen1-20ST000DGE | |
| Dell Precision 7550 | |
| Genomsnitt Intel Core i7-11800H (217 - 454, n=46) | |
| MSI WS66 10TMT-207US | |
| Lenovo ThinkPad P15 G2-20YQ001JGE | |
| HP ZBook Studio 15 G8 | |
| Genomsnitt av klass Workstation (91 - 222, n=23, senaste 2 åren) | |
| 7-Zip 18.03 / 7z b 4 | |
| Genomsnitt av klass Workstation (60489 - 116969, n=23, senaste 2 åren) | |
| HP ZBook Studio 15 G8 | |
| Lenovo ThinkPad P15 G2-20YQ001JGE | |
| MSI WS66 10TMT-207US | |
| Genomsnitt Intel Core i7-11800H (33718 - 56758, n=46) | |
| Dell Precision 7550 | |
| Lenovo ThinkPad P15 Gen1-20ST000DGE | |
| HP ZBook Fury 15 G7 | |
| 7-Zip 18.03 / 7z b 4 -mmt1 | |
| Genomsnitt av klass Workstation (5126 - 6960, n=23, senaste 2 åren) | |
| HP ZBook Studio 15 G8 | |
| HP ZBook Fury 15 G7 | |
| Dell Precision 7550 | |
| Genomsnitt Intel Core i7-11800H (5138 - 5732, n=46) | |
| Lenovo ThinkPad P15 G2-20YQ001JGE | |
| MSI WS66 10TMT-207US | |
| Lenovo ThinkPad P15 Gen1-20ST000DGE | |
| Geekbench 5.5 / Multi-Core | |
| Genomsnitt av klass Workstation (11542 - 25554, n=23, senaste 2 åren) | |
| Lenovo ThinkPad P15 G2-20YQ001JGE | |
| Genomsnitt Intel Core i7-11800H (4655 - 9851, n=40) | |
| Dell Precision 7550 | |
| MSI WS66 10TMT-207US | |
| HP ZBook Studio 15 G8 | |
| HP ZBook Fury 15 G7 | |
| Lenovo ThinkPad P15 Gen1-20ST000DGE | |
| Geekbench 5.5 / Single-Core | |
| Genomsnitt av klass Workstation (1783 - 2183, n=23, senaste 2 åren) | |
| HP ZBook Studio 15 G8 | |
| Lenovo ThinkPad P15 G2-20YQ001JGE | |
| Genomsnitt Intel Core i7-11800H (1429 - 1625, n=40) | |
| MSI WS66 10TMT-207US | |
| HP ZBook Fury 15 G7 | |
| Dell Precision 7550 | |
| Lenovo ThinkPad P15 Gen1-20ST000DGE | |
| HWBOT x265 Benchmark v2.2 / 4k Preset | |
| Genomsnitt av klass Workstation (17.8 - 40.5, n=23, senaste 2 åren) | |
| HP ZBook Studio 15 G8 | |
| Lenovo ThinkPad P15 G2-20YQ001JGE | |
| Genomsnitt Intel Core i7-11800H (7.38 - 17.4, n=46) | |
| Dell Precision 7550 | |
| MSI WS66 10TMT-207US | |
| Lenovo ThinkPad P15 Gen1-20ST000DGE | |
| HP ZBook Fury 15 G7 | |
| LibreOffice / 20 Documents To PDF | |
| HP ZBook Fury 15 G7 | |
| Lenovo ThinkPad P15 Gen1-20ST000DGE | |
| HP ZBook Studio 15 G8 | |
| Lenovo ThinkPad P15 G2-20YQ001JGE | |
| Genomsnitt av klass Workstation (37.1 - 74.7, n=23, senaste 2 åren) | |
| Dell Precision 7550 | |
| Genomsnitt Intel Core i7-11800H (38.6 - 59.9, n=45) | |
| MSI WS66 10TMT-207US | |
| R Benchmark 2.5 / Overall mean | |
| Lenovo ThinkPad P15 Gen1-20ST000DGE | |
| MSI WS66 10TMT-207US | |
| Dell Precision 7550 | |
| Lenovo ThinkPad P15 G2-20YQ001JGE | |
| Genomsnitt Intel Core i7-11800H (0.548 - 0.615, n=46) | |
| HP ZBook Fury 15 G7 | |
| HP ZBook Studio 15 G8 | |
| Genomsnitt av klass Workstation (0.3825 - 0.603, n=23, senaste 2 åren) | |
* ... mindre är bättre
| PCMark 10 / Score | |
| Genomsnitt av klass Workstation (6563 - 10409, n=19, senaste 2 åren) | |
| HP ZBook Studio 15 G8 | |
| Lenovo ThinkPad P15 G2-20YQ001JGE | |
| Genomsnitt Intel Core i7-11800H, NVIDIA RTX A3000 Laptop GPU (n=1) | |
| Dell Precision 7550 | |
| MSI WS66 10TMT-207US | |
| HP ZBook Fury 15 G7 | |
| Lenovo ThinkPad P15 Gen1-20ST000DGE | |
| PCMark 10 / Essentials | |
| MSI WS66 10TMT-207US | |
| Genomsnitt av klass Workstation (9622 - 11157, n=19, senaste 2 åren) | |
| Lenovo ThinkPad P15 G2-20YQ001JGE | |
| Genomsnitt Intel Core i7-11800H, NVIDIA RTX A3000 Laptop GPU (n=1) | |
| HP ZBook Studio 15 G8 | |
| Lenovo ThinkPad P15 Gen1-20ST000DGE | |
| Dell Precision 7550 | |
| HP ZBook Fury 15 G7 | |
| PCMark 10 / Productivity | |
| Genomsnitt av klass Workstation (8789 - 20616, n=19, senaste 2 åren) | |
| MSI WS66 10TMT-207US | |
| HP ZBook Studio 15 G8 | |
| Lenovo ThinkPad P15 G2-20YQ001JGE | |
| Genomsnitt Intel Core i7-11800H, NVIDIA RTX A3000 Laptop GPU (n=1) | |
| Lenovo ThinkPad P15 Gen1-20ST000DGE | |
| Dell Precision 7550 | |
| HP ZBook Fury 15 G7 | |
| PCMark 10 / Digital Content Creation | |
| Genomsnitt av klass Workstation (8108 - 15631, n=19, senaste 2 åren) | |
| HP ZBook Studio 15 G8 | |
| Lenovo ThinkPad P15 G2-20YQ001JGE | |
| Genomsnitt Intel Core i7-11800H, NVIDIA RTX A3000 Laptop GPU (n=1) | |
| Dell Precision 7550 | |
| HP ZBook Fury 15 G7 | |
| Lenovo ThinkPad P15 Gen1-20ST000DGE | |
| MSI WS66 10TMT-207US | |
| PCMark 10 Score | 6564 poäng | |
Hjälp | ||
| DPC Latencies / LatencyMon - interrupt to process latency (max), Web, Youtube, Prime95 | |
| Dell Precision 7550 | |
| Lenovo ThinkPad P15 G2-20YQ001JGE | |
| MSI WS66 10TMT-207US | |
| HP ZBook Fury 15 G7 | |
| HP ZBook Studio 15 G8 | |
| Lenovo ThinkPad P15 Gen1-20ST000DGE | |
* ... mindre är bättre
| Lenovo ThinkPad P15 G2-20YQ001JGE Kioxia XG7 KXG7AZNV512G | HP ZBook Studio 15 G8 Samsung PM981a MZVLB2T0HALB | HP ZBook Fury 15 G7 Samsung PM981a MZVLB1T0HBLR | Dell Precision 7550 SK Hynix PC601A NVMe 1TB | MSI WS66 10TMT-207US WDC PC SN730 SDBPNTY-1T00 | Lenovo ThinkPad P15 Gen1-20ST000DGE Toshiba XG6 KXG6AZNV512G | Genomsnitt Kioxia XG7 KXG7AZNV512G | |
|---|---|---|---|---|---|---|---|
| CrystalDiskMark 5.2 / 6 | -21% | -19% | -27% | -10% | -17% | 0% | |
| Write 4K (MB/s) | 141.1 | 110.5 -22% | 114.1 -19% | 121 -14% | 185.8 32% | 129.5 -8% | 141.1 ? 0% |
| Read 4K (MB/s) | 58.8 | 51.8 -12% | 57.2 -3% | 42.16 -28% | 47.21 -20% | 49.54 -16% | 58.8 ? 0% |
| Write Seq (MB/s) | 3320 | 2071 -38% | 2580 -22% | 2150 -35% | 2874 -13% | 2379 -28% | 3320 ? 0% |
| Read Seq (MB/s) | 2994 | 2505 -16% | 2527 -16% | 1755 -41% | 1786 -40% | 1989 -34% | 2994 ? 0% |
| Write 4K Q32T1 (MB/s) | 626 | 429.8 -31% | 480.2 -23% | 395.3 -37% | 466.8 -25% | 663 6% | 626 ? 0% |
| Read 4K Q32T1 (MB/s) | 401.8 | 418.3 4% | 387.6 -4% | 381.8 -5% | 563 40% | 425.2 6% | 402 ? 0% |
| Write Seq Q32T1 (MB/s) | 3742 | 3060 -18% | 2996 -20% | 2730 -27% | 3091 -17% | 2960 -21% | 3742 ? 0% |
| Read Seq Q32T1 (MB/s) | 5097 | 3539 -31% | 2853 -44% | 3468 -32% | 3395 -33% | 3182 -38% | 5097 ? 0% |
| AS SSD | -20% | -34% | -40% | -3% | -25% | -9% | |
| Seq Read (MB/s) | 5105 | 2953 -42% | 2127 -58% | 2028 -60% | 2321 -55% | 2747 -46% | 4551 ? -11% |
| Seq Write (MB/s) | 1815 | 1691 -7% | 1296 -29% | 1193 -34% | 2620 44% | 1192 -34% | 1432 ? -21% |
| 4K Read (MB/s) | 47.46 | 43.98 -7% | 54.8 15% | 42.31 -11% | 48.57 2% | 46.49 -2% | 46.2 ? -3% |
| 4K Write (MB/s) | 137.3 | 105.4 -23% | 110.8 -19% | 105.5 -23% | 165.1 20% | 131.9 -4% | 126.3 ? -8% |
| 4K-64 Read (MB/s) | 2112 | 1065 -50% | 1420 -33% | 1128 -47% | 1712 -19% | 1431 -32% | 2136 ? 1% |
| 4K-64 Write (MB/s) | 1702 | 1957 15% | 2012 18% | 1537 -10% | 2174 28% | 1437 -16% | 1700 ? 0% |
| Access Time Read * (ms) | 0.065 | 0.04 38% | 0.046 29% | 0.069 -6% | 0.057 12% | 0.102 -57% | 0.1105 ? -70% |
| Access Time Write * (ms) | 0.03 | 0.105 -250% | 0.099 -230% | 0.106 -253% | 0.068 -127% | 0.031 -3% | 0.033 ? -10% |
| Score Read (Points) | 2670 | 1404 -47% | 1687 -37% | 1373 -49% | 1993 -25% | 1752 -34% | 2638 ? -1% |
| Score Write (Points) | 2021 | 2232 10% | 2253 11% | 1762 -13% | 2601 29% | 1688 -16% | 1970 ? -3% |
| Score Total (Points) | 5885 | 4297 -27% | 4770 -19% | 3801 -35% | 5630 -4% | 4261 -28% | 5793 ? -2% |
| Copy ISO MB/s (MB/s) | 2054 | 2474 20% | 2779 35% | 1768 -14% | 2589 26% | 2054 ? 0% | |
| Copy Program MB/s (MB/s) | 714 | 1074 50% | 123.3 -83% | 627 -12% | 791 11% | 714 ? 0% | |
| Copy Game MB/s (MB/s) | 1431 | 1929 35% | 440.8 -69% | 1477 3% | 1625 14% | 1431 ? 0% | |
| Totalt genomsnitt (program/inställningar) | -21% /
-20% | -27% /
-28% | -34% /
-36% | -7% /
-5% | -21% /
-21% | -5% /
-6% |
* ... mindre är bättre

DiskSpd Read Loop, Queue Depth 8
| 3DMark Vantage P Result | 71308 poäng | |
| 3DMark 11 Performance | 23888 poäng | |
| 3DMark Fire Strike Score | 18291 poäng | |
| 3DMark Time Spy Score | 7779 poäng | |
Hjälp | ||
The Witcher 3 FPS-diagram
| låg | med. | hög | ultra | |
|---|---|---|---|---|
| GTA V (2015) | 180 | 174 | 158 | 90.1 |
| The Witcher 3 (2015) | 335 | 222 | 152 | 69.8 |
| Dota 2 Reborn (2015) | 164 | 148 | 142 | 132 |
| Final Fantasy XV Benchmark (2018) | 160 | 101 | 75.1 | |
| X-Plane 11.11 (2018) | 124 | 105 | 85.1 | |
| Far Cry 5 (2018) | 115 | 111 | 103 | |
| Strange Brigade (2018) | 365 | 183 | 151 | 114 |
| Far Cry New Dawn (2019) | 127 | 103 | 98 | 87 |
| Borderlands 3 (2019) | 129 | 115 | 87 | 69 |
| Gears Tactics (2020) | 306 | 173 | 123 | 87 |
| F1 2020 (2020) | 264 | 164 | 151 | 114 |
| Death Stranding (2020) | 159 | 133 | 124 | 120 |
| Horizon Zero Dawn (2020) | 139 | 104 | 94 | 83 |
| Watch Dogs Legion (2020) | 98 | 93 | 86 | 39 |
| Dirt 5 (2020) | 183 | 111 | 89 | 72 |
| Assassin´s Creed Valhalla (2020) | 110 | 79 | 68 | 51 |
| Immortals Fenyx Rising (2020) | 133 | 90 | 82 | 77 |
| Cyberpunk 2077 1.0 (2020) | 110 | 71 | 60 | 51 |
| Hitman 3 (2021) | 227 | 146 | 129 | 118 |
| F1 2021 (2021) | 266 | 172 | 154 | 82.9 |
Ljudnivå
| Låg belastning |
| 24.3 / 24.3 / 28.6 dB(A) |
| Hög belastning |
| 47.5 / 54.9 dB(A) |
 | ||
30 dB tyst 40 dB(A) hörbar 50 dB(A) högt ljud |
||
min: | ||
| Lenovo ThinkPad P15 G2-20YQ001JGE RTX A3000 Laptop GPU, i7-11800H, Kioxia XG7 KXG7AZNV512G | HP ZBook Studio 15 G8 GeForce RTX 3070 Laptop GPU, i9-11950H, Samsung PM981a MZVLB2T0HALB | HP ZBook Fury 15 G7 Quadro RTX 5000 Max-Q, W-10885M, Samsung PM981a MZVLB1T0HBLR | Dell Precision 7550 Quadro RTX 5000 Max-Q, W-10885M, SK Hynix PC601A NVMe 1TB | MSI WS66 10TMT-207US Quadro RTX 5000 Max-Q, i9-10980HK, WDC PC SN730 SDBPNTY-1T00 | Lenovo ThinkPad P15 Gen1-20ST000DGE Quadro T1000 (Laptop), i7-10750H, Toshiba XG6 KXG6AZNV512G | |
|---|---|---|---|---|---|---|
| Noise | 5% | 5% | -2% | -13% | 6% | |
| av / miljö * (dB) | 24.3 | 23.5 3% | 26.4 -9% | 25.8 -6% | 26 -7% | 24.9 -2% |
| Idle Minimum * (dB) | 24.3 | 25.3 -4% | 26.4 -9% | 25.8 -6% | 32 -32% | 24.9 -2% |
| Idle Average * (dB) | 24.3 | 25.3 -4% | 26.4 -9% | 25.8 -6% | 32 -32% | 24.9 -2% |
| Idle Maximum * (dB) | 28.6 | 25.3 12% | 26.4 8% | 25.9 9% | 32 -12% | 28.8 -1% |
| Load Average * (dB) | 47.5 | 41.2 13% | 31.7 33% | 51.2 -8% | 42 12% | 37.7 21% |
| Load Maximum * (dB) | 54.9 | 49.4 10% | 47 14% | 51.9 5% | 59.7 -9% | 44.6 19% |
| Witcher 3 ultra * (dB) | 49.4 | 47 | 51.9 | 47.4 | 37.7 |
* ... mindre är bättre
(-) Den maximala temperaturen på ovansidan är 49.7 °C / 121 F, jämfört med genomsnittet av 38.2 °C / 101 F , allt från 22.2 till 69.8 °C för klassen Workstation.
(-) Botten värms upp till maximalt 63.2 °C / 146 F, jämfört med genomsnittet av 41.1 °C / 106 F
(+) Vid tomgångsbruk är medeltemperaturen för ovansidan 26.3 °C / 79 F, jämfört med enhetsgenomsnittet på 32 °C / ### class_avg_f### F.
(±) När du spelar The Witcher 3 är medeltemperaturen för ovansidan 37.9 °C / 100 F, jämfört med enhetsgenomsnittet på 32 °C / ## #class_avg_f### F.
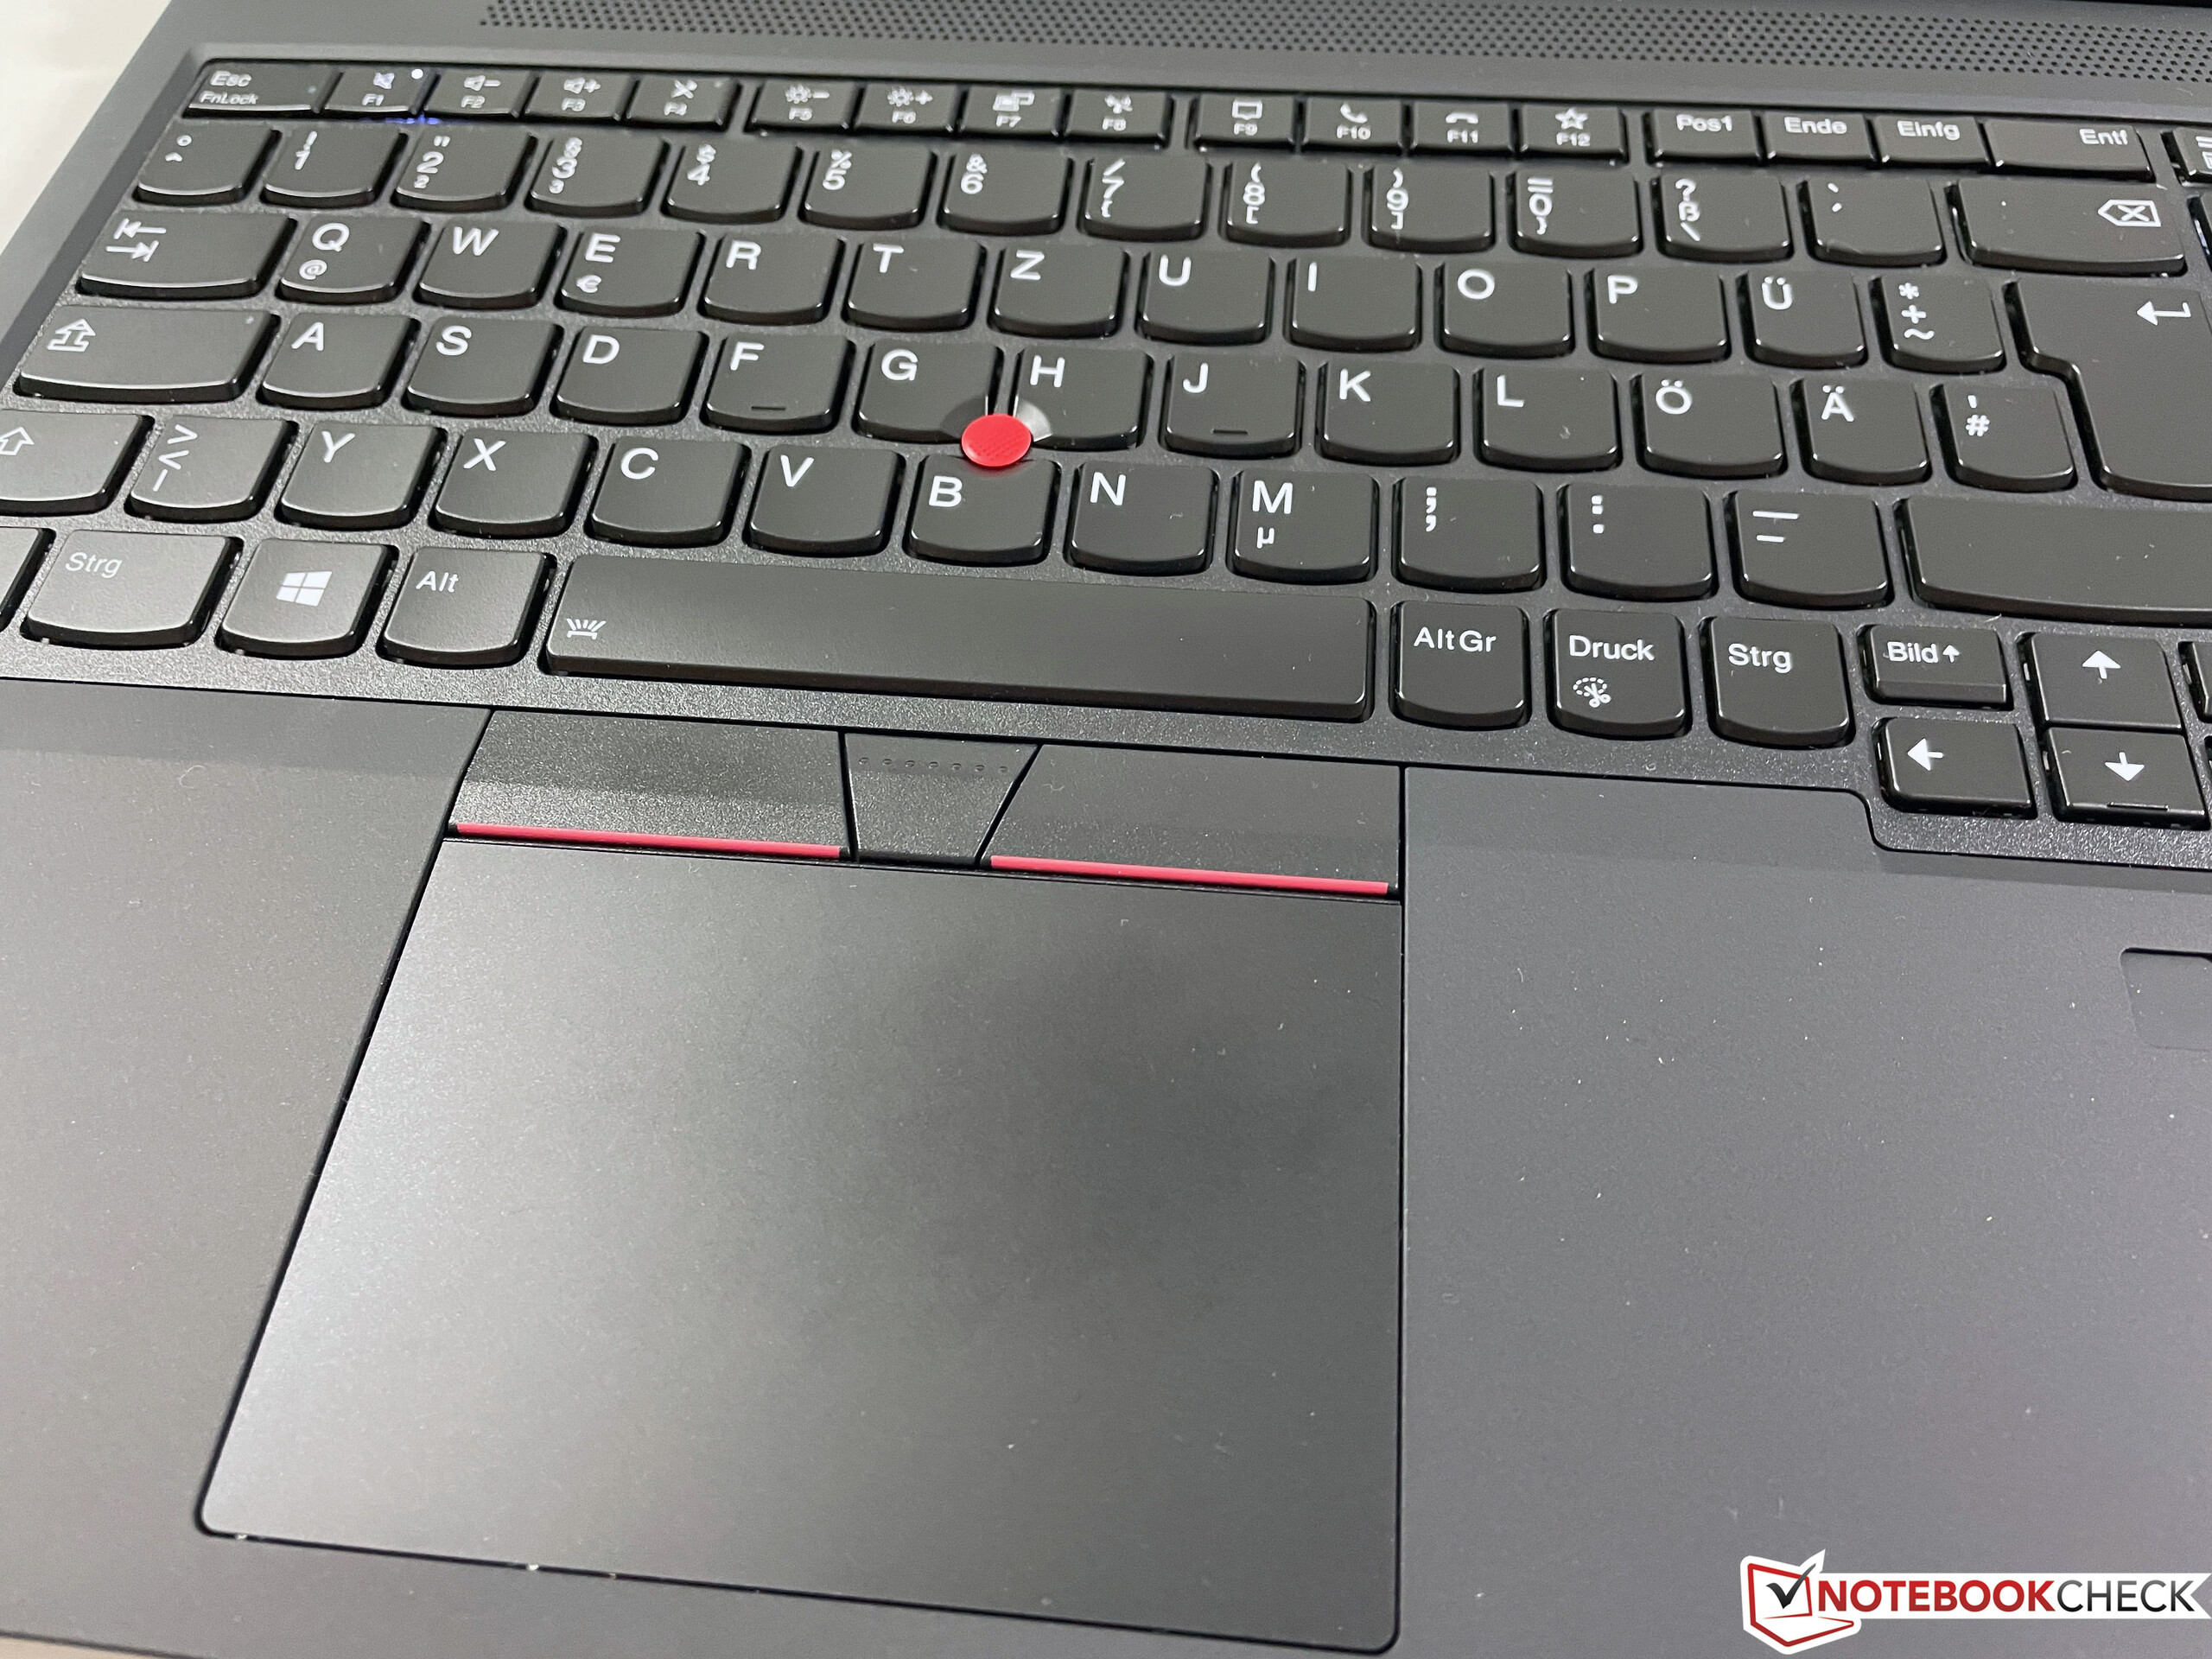
(+) Handledsstöden och pekplattan når maximal hudtemperatur (35.1 °C / 95.2 F) och är därför inte varma.
(-) Medeltemperaturen för handledsstödsområdet på liknande enheter var 27.8 °C / 82 F (-7.3 °C / -13.2 F).
Lenovo ThinkPad P15 G2-20YQ001JGE ljudanalys
(±) | högtalarljudstyrkan är genomsnittlig men bra (78 dB)
Bas 100 - 315 Hz
(-) | nästan ingen bas - i genomsnitt 15.5% lägre än medianen
(±) | linjäriteten för basen är genomsnittlig (9.6% delta till föregående frekvens)
Mellan 400 - 2000 Hz
(±) | högre mellan - i genomsnitt 7.5% högre än median
(+) | mids är linjära (6.6% delta till föregående frekvens)
Högsta 2 - 16 kHz
(+) | balanserade toppar - endast 2.4% från medianen
(+) | toppar är linjära (5.8% delta till föregående frekvens)
Totalt 100 - 16 000 Hz
(±) | linjäriteten för det totala ljudet är genomsnittlig (20.6% skillnad mot median)
Jämfört med samma klass
» 74% av alla testade enheter i den här klassen var bättre, 6% liknande, 21% sämre
» Den bästa hade ett delta på 7%, genomsnittet var 17%, sämst var 35%
Jämfört med alla testade enheter
» 55% av alla testade enheter var bättre, 8% liknande, 37% sämre
» Den bästa hade ett delta på 4%, genomsnittet var 23%, sämst var 134%
HP ZBook Fury 15 G7 ljudanalys
(±) | högtalarljudstyrkan är genomsnittlig men bra (80.1 dB)
Bas 100 - 315 Hz
(±) | reducerad bas - i genomsnitt 8% lägre än medianen
(±) | linjäriteten för basen är genomsnittlig (9.5% delta till föregående frekvens)
Mellan 400 - 2000 Hz
(+) | balanserad mellan - endast 3.3% från medianen
(+) | mids är linjära (4.8% delta till föregående frekvens)
Högsta 2 - 16 kHz
(+) | balanserade toppar - endast 2.2% från medianen
(+) | toppar är linjära (3.5% delta till föregående frekvens)
Totalt 100 - 16 000 Hz
(+) | det totala ljudet är linjärt (10.1% skillnad mot median)
Jämfört med samma klass
» 6% av alla testade enheter i den här klassen var bättre, 4% liknande, 90% sämre
» Den bästa hade ett delta på 7%, genomsnittet var 17%, sämst var 35%
Jämfört med alla testade enheter
» 5% av alla testade enheter var bättre, 2% liknande, 94% sämre
» Den bästa hade ett delta på 4%, genomsnittet var 23%, sämst var 134%
Dell Precision 7550 ljudanalys
(+) | högtalare kan spela relativt högt (83.6 dB)
Bas 100 - 315 Hz
(±) | reducerad bas - i genomsnitt 11.5% lägre än medianen
(±) | linjäriteten för basen är genomsnittlig (11.6% delta till föregående frekvens)
Mellan 400 - 2000 Hz
(±) | högre mellan - i genomsnitt 5.7% högre än median
(+) | mids är linjära (4.5% delta till föregående frekvens)
Högsta 2 - 16 kHz
(+) | balanserade toppar - endast 3.2% från medianen
(+) | toppar är linjära (5.4% delta till föregående frekvens)
Totalt 100 - 16 000 Hz
(+) | det totala ljudet är linjärt (12.6% skillnad mot median)
Jämfört med samma klass
» 21% av alla testade enheter i den här klassen var bättre, 4% liknande, 75% sämre
» Den bästa hade ett delta på 7%, genomsnittet var 17%, sämst var 35%
Jämfört med alla testade enheter
» 11% av alla testade enheter var bättre, 3% liknande, 86% sämre
» Den bästa hade ett delta på 4%, genomsnittet var 23%, sämst var 134%
| Av/Standby | |
| Låg belastning | |
| Hög belastning |
|
Förklaring:
min: | |
| Lenovo ThinkPad P15 G2-20YQ001JGE i7-11800H, RTX A3000 Laptop GPU, Kioxia XG7 KXG7AZNV512G, IPS, 1920x1080, 15.6" | HP ZBook Studio 15 G8 i9-11950H, GeForce RTX 3070 Laptop GPU, Samsung PM981a MZVLB2T0HALB, OLED, 3840x2160, 15.6" | HP ZBook Fury 15 G7 W-10885M, Quadro RTX 5000 Max-Q, Samsung PM981a MZVLB1T0HBLR, IPS, 3840x2160, 15.6" | Dell Precision 7550 W-10885M, Quadro RTX 5000 Max-Q, SK Hynix PC601A NVMe 1TB, IPS, 3840x2160, 15.6" | MSI WS66 10TMT-207US i9-10980HK, Quadro RTX 5000 Max-Q, WDC PC SN730 SDBPNTY-1T00, IPS, 1920x1080, 15.6" | Lenovo ThinkPad P15 Gen1-20ST000DGE i7-10750H, Quadro T1000 (Laptop), Toshiba XG6 KXG6AZNV512G, a-Si IPS LED, 1920x1080, 15.6" | Genomsnitt NVIDIA RTX A3000 Laptop GPU | Genomsnitt av klass Workstation | |
|---|---|---|---|---|---|---|---|---|
| Power Consumption | -51% | -16% | -38% | -78% | -2% | -21% | -22% | |
| Idle Minimum * (Watt) | 6.3 | 11 -75% | 4.6 27% | 8.2 -30% | 13.8 -119% | 8.4 -33% | 8.23 ? -31% | 9.11 ? -45% |
| Idle Average * (Watt) | 10.7 | 18.8 -76% | 13.6 -27% | 16.8 -57% | 18.4 -72% | 12.3 -15% | 14.6 ? -36% | 13.8 ? -29% |
| Idle Maximum * (Watt) | 11.6 | 31.7 -173% | 21.5 -85% | 24.4 -110% | 41.5 -258% | 14.2 -22% | 15.3 ? -32% | 17.9 ? -54% |
| Load Average * (Watt) | 99.3 | 105.2 -6% | 113.1 -14% | 131 -32% | 110.5 -11% | 96 3% | 109.3 ? -10% | 96 ? 3% |
| Witcher 3 ultra * (Watt) | 154 | 148 4% | 157.5 -2% | 156.6 -2% | 151.6 2% | 95 38% | ||
| Load Maximum * (Watt) | 210 | 171.8 18% | 199 5% | 201.8 4% | 227.1 -8% | 168.8 20% | 196.5 ? 6% | 180.3 ? 14% |
* ... mindre är bättre
Energiförbrukning: The Witcher 3 / stress-test
| Lenovo ThinkPad P15 G2-20YQ001JGE i7-11800H, RTX A3000 Laptop GPU, 94 Wh | HP ZBook Studio 15 G8 i9-11950H, GeForce RTX 3070 Laptop GPU, 83 Wh | HP ZBook Fury 15 G7 W-10885M, Quadro RTX 5000 Max-Q, 94 Wh | Dell Precision 7550 W-10885M, Quadro RTX 5000 Max-Q, 95 Wh | MSI WS66 10TMT-207US i9-10980HK, Quadro RTX 5000 Max-Q, 99.99 Wh | Genomsnitt av klass Workstation | |
|---|---|---|---|---|---|---|
| Batteridrifttid | 1% | -7% | -17% | -15% | -1% | |
| H.264 (h) | 10 | 10.1 ? 1% | ||||
| WiFi v1.3 (h) | 9.9 | 6.2 -37% | 8.6 -13% | 8.9 -10% | 7.8 -21% | 8.55 ? -14% |
| Load (h) | 1.3 | 1.8 38% | 1.3 0% | 1 -23% | 1.2 -8% | 1.441 ? 11% |
För
Emot
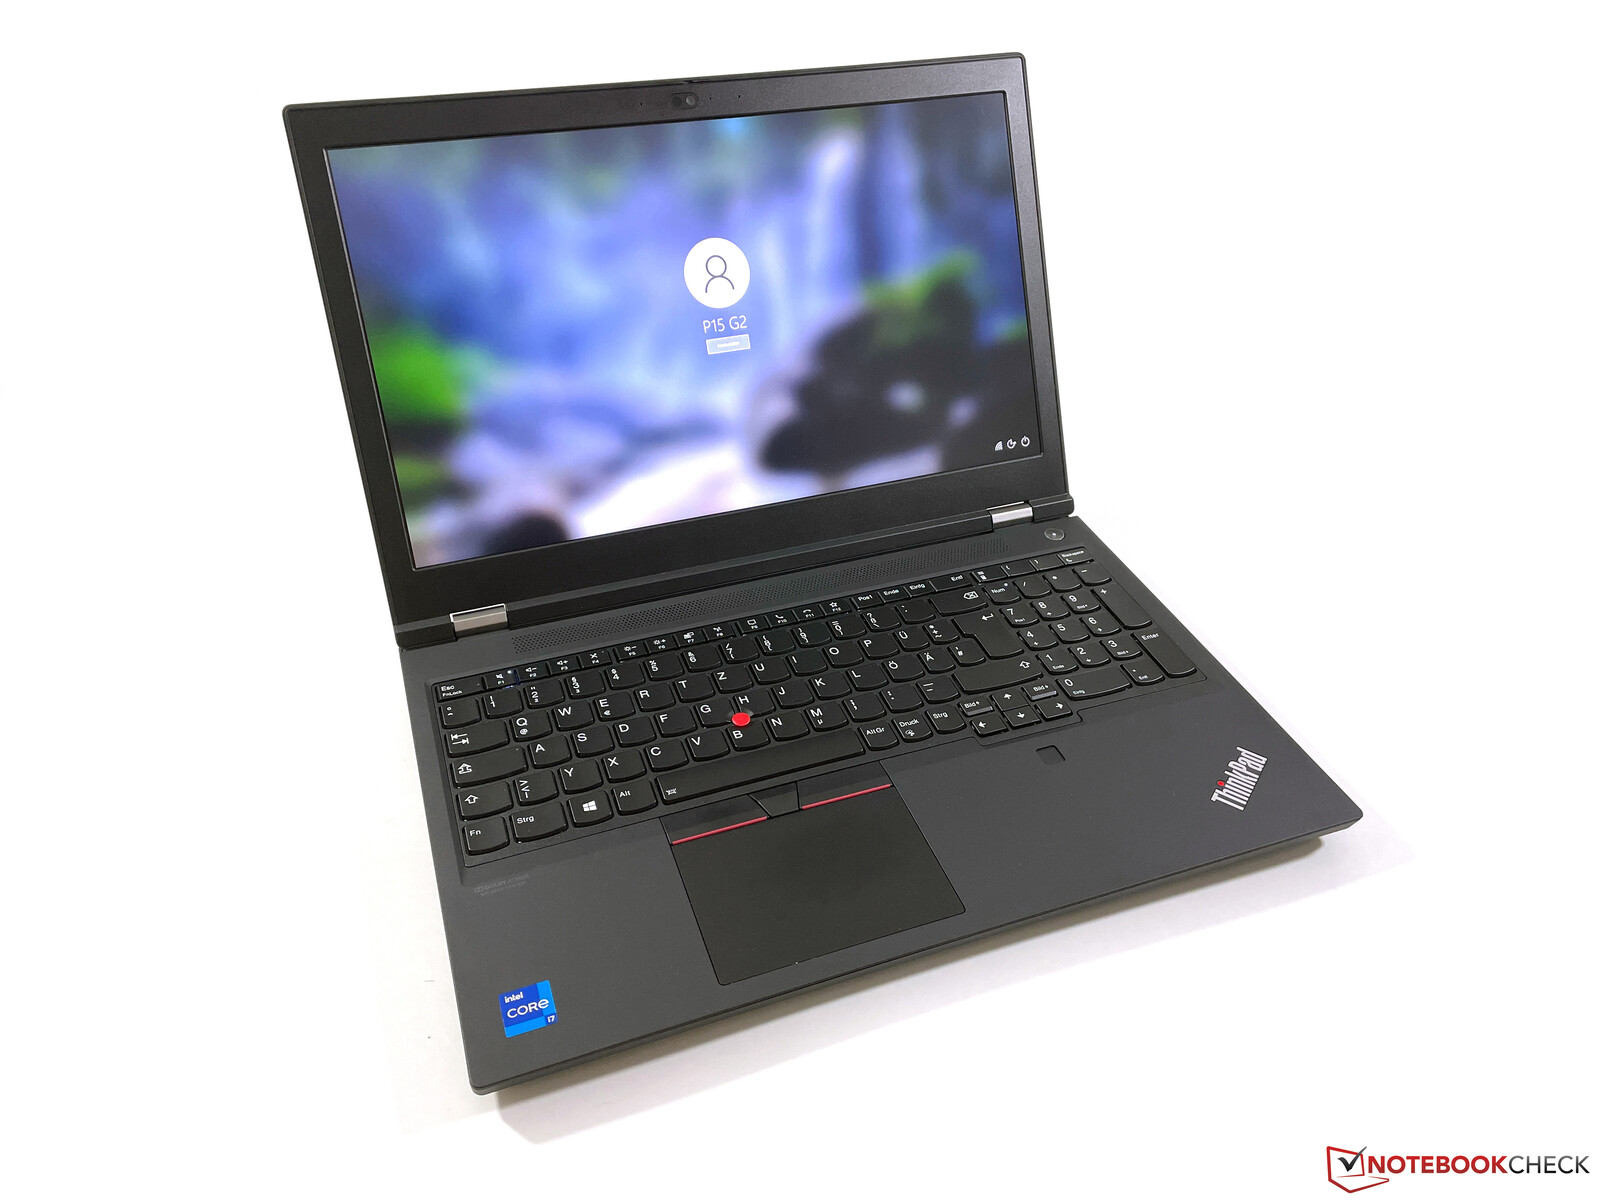
Omdöme - P15 Gen 2 visar i synnerhet upp svagheter i kylsystemet

Läs den fullständiga versionen av den här recensionen på engelska här.
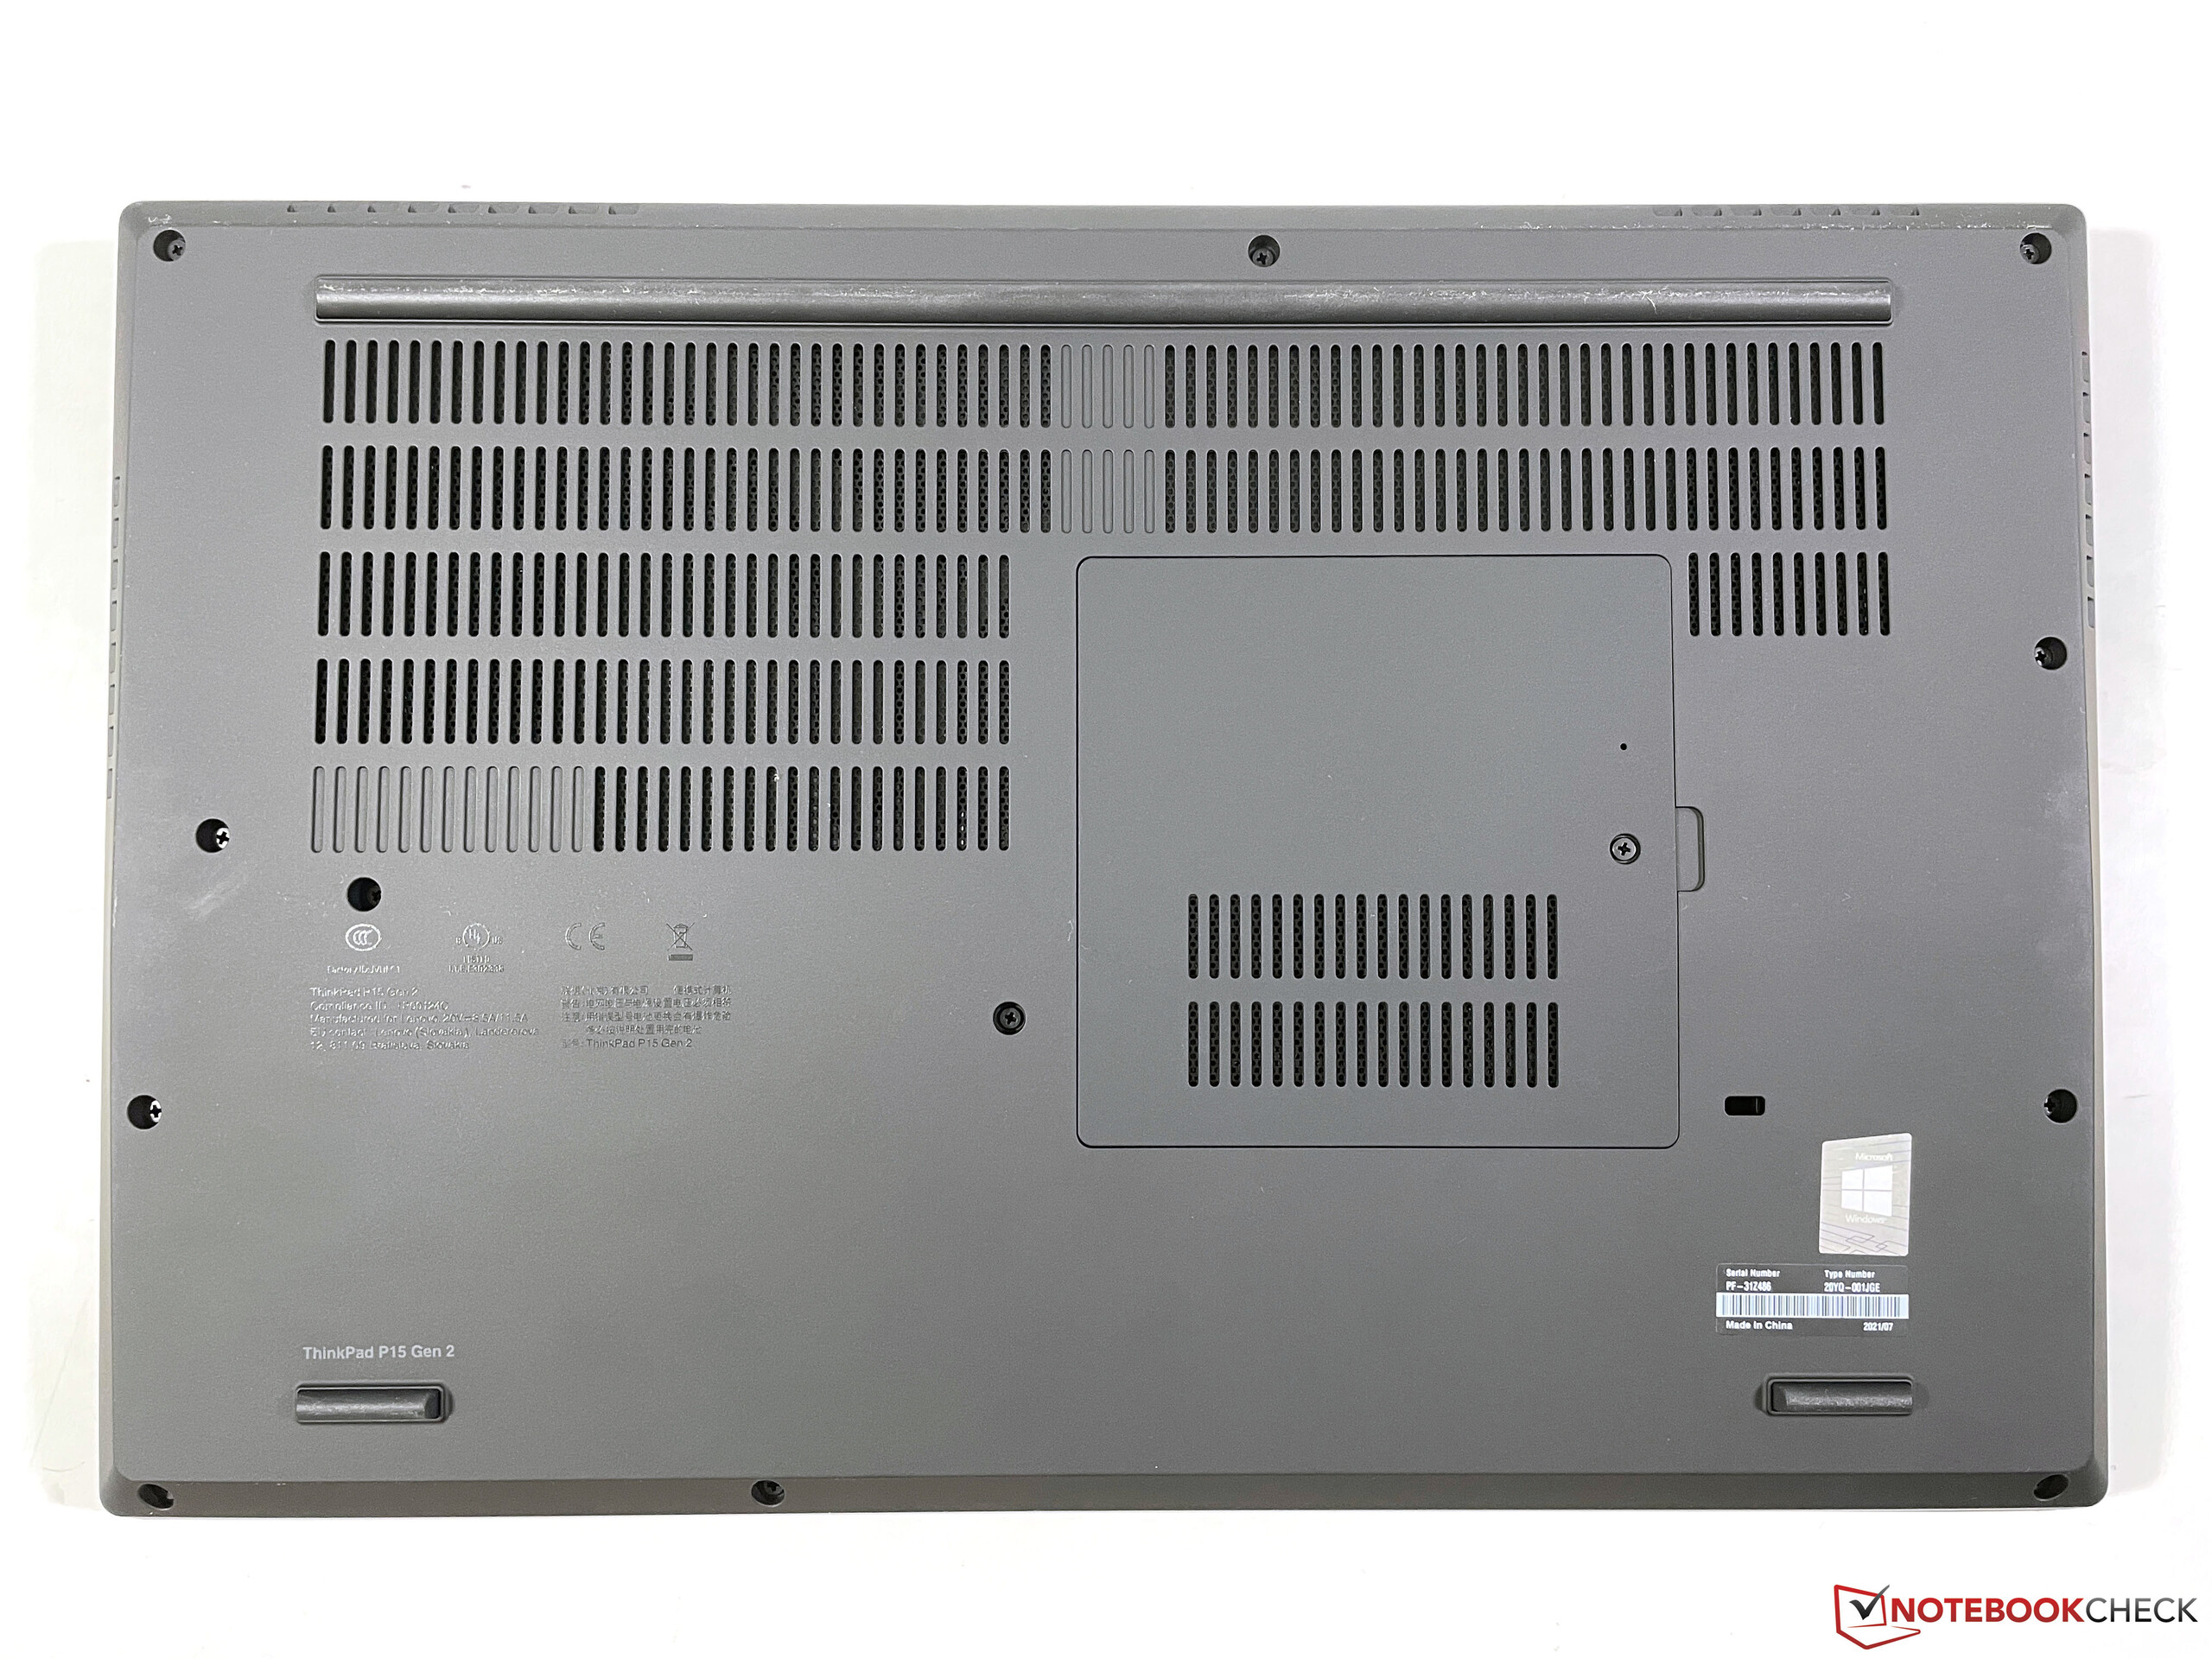
Traditionellt sett erbjuder mobila arbetsstationer den högsta prestandan och är också enkla att underhålla. I gengäld står användarna glatt ut med större och tjockare höljen. Men detta gäller inte längre hela vägen. Ja, ThinkPad P15 Gen 2 har utmärkta servicemöjligheter, men den dyra arbetsstationen blir särskilt lidande i fråga om prestanda och kylning. Oundvikligen får man ställa sig frågan om varför man fortfarande behöver ett såpass tjockt hölje nuförtiden när prestandan (för både CPU och GPU) samt temperaturerna är sämre än på moderna spellaptops och ibland också jämfört med ännu tunnare mobila arbetsstationer. När det kommer till processorn hade vi också gärna sett en lite mer dynamisk hantering (högre TDP vid CPU-specifik belastning).
ThinkPad P15 Gen 2 är en besvikelse och den kämpar med både höga temperaturer och högljudda fläktar vid belastning. Men nya RTX A3000 levererar hög prestanda och ger en betydande ökning jämfört med de äldre Quadro-korten.
Totalt sett känns P15 Gen 2:s koncept lite utdaterat, särskilt med tanke på den massiva skärminfattningen. Man kunde lätt ha installerat en 16-tumsskärm (16:10) här, som exempelvis i nya ThinkPad P1 Gen 4.
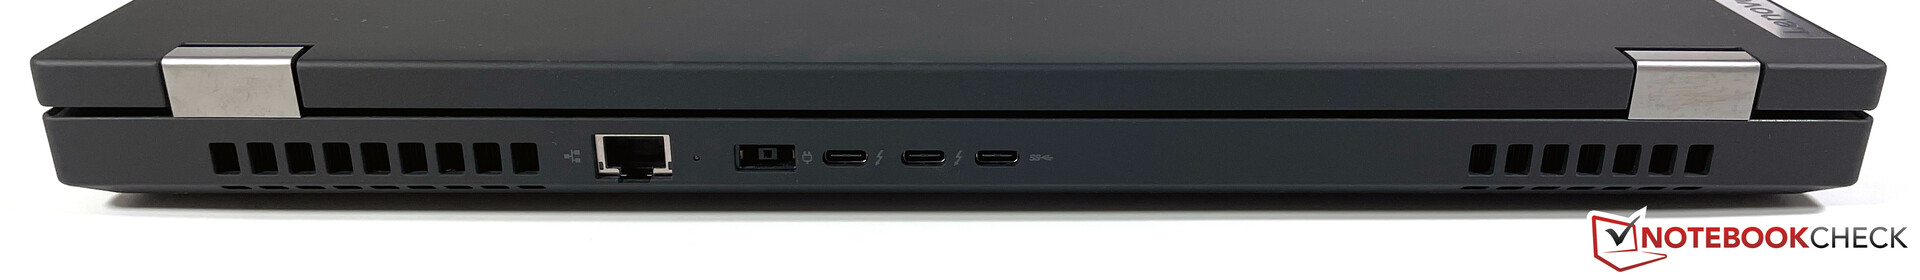
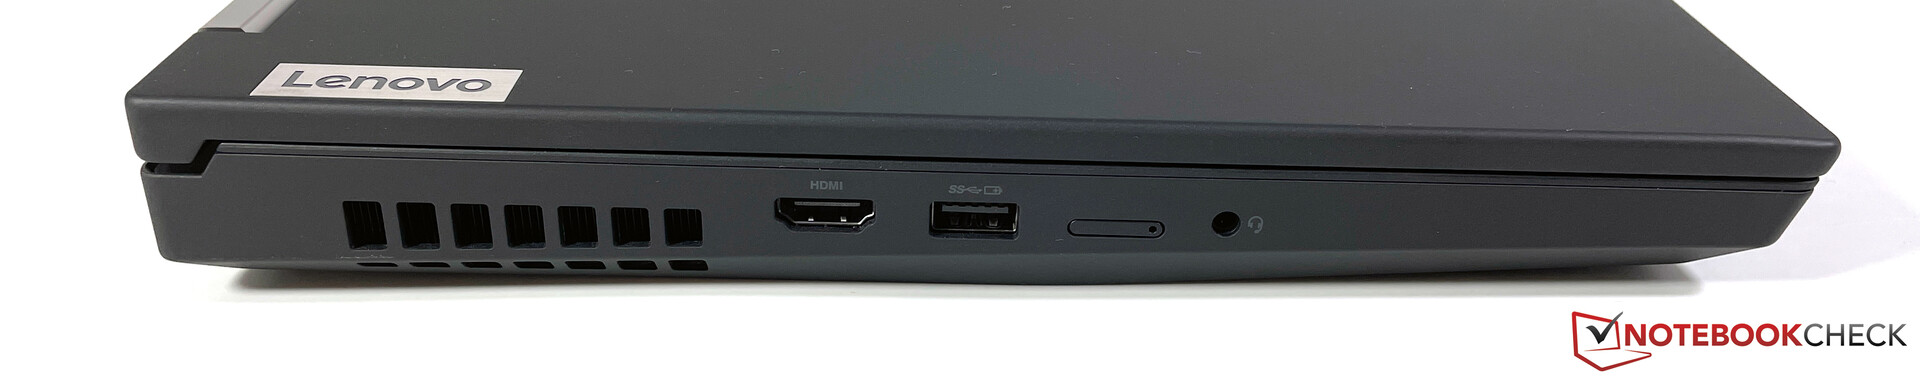
P15 Gen 2 uppfyller kraven på portutbud, servicemöjligheter och inmatningsenheter och den ljusstarka 1080p-skärmen gör ett bra jobb, men vi hade gärna sett ett bättre kylsystem. Särskilt med tanke på att P15 Gen 2 ändå får bra poäng för sin höga prestanda i grafik- och proffsprogram. Vi är redan ivriga att se hur de nya arbetsstationerna från Dell, HP och MSI kommer att prestera.
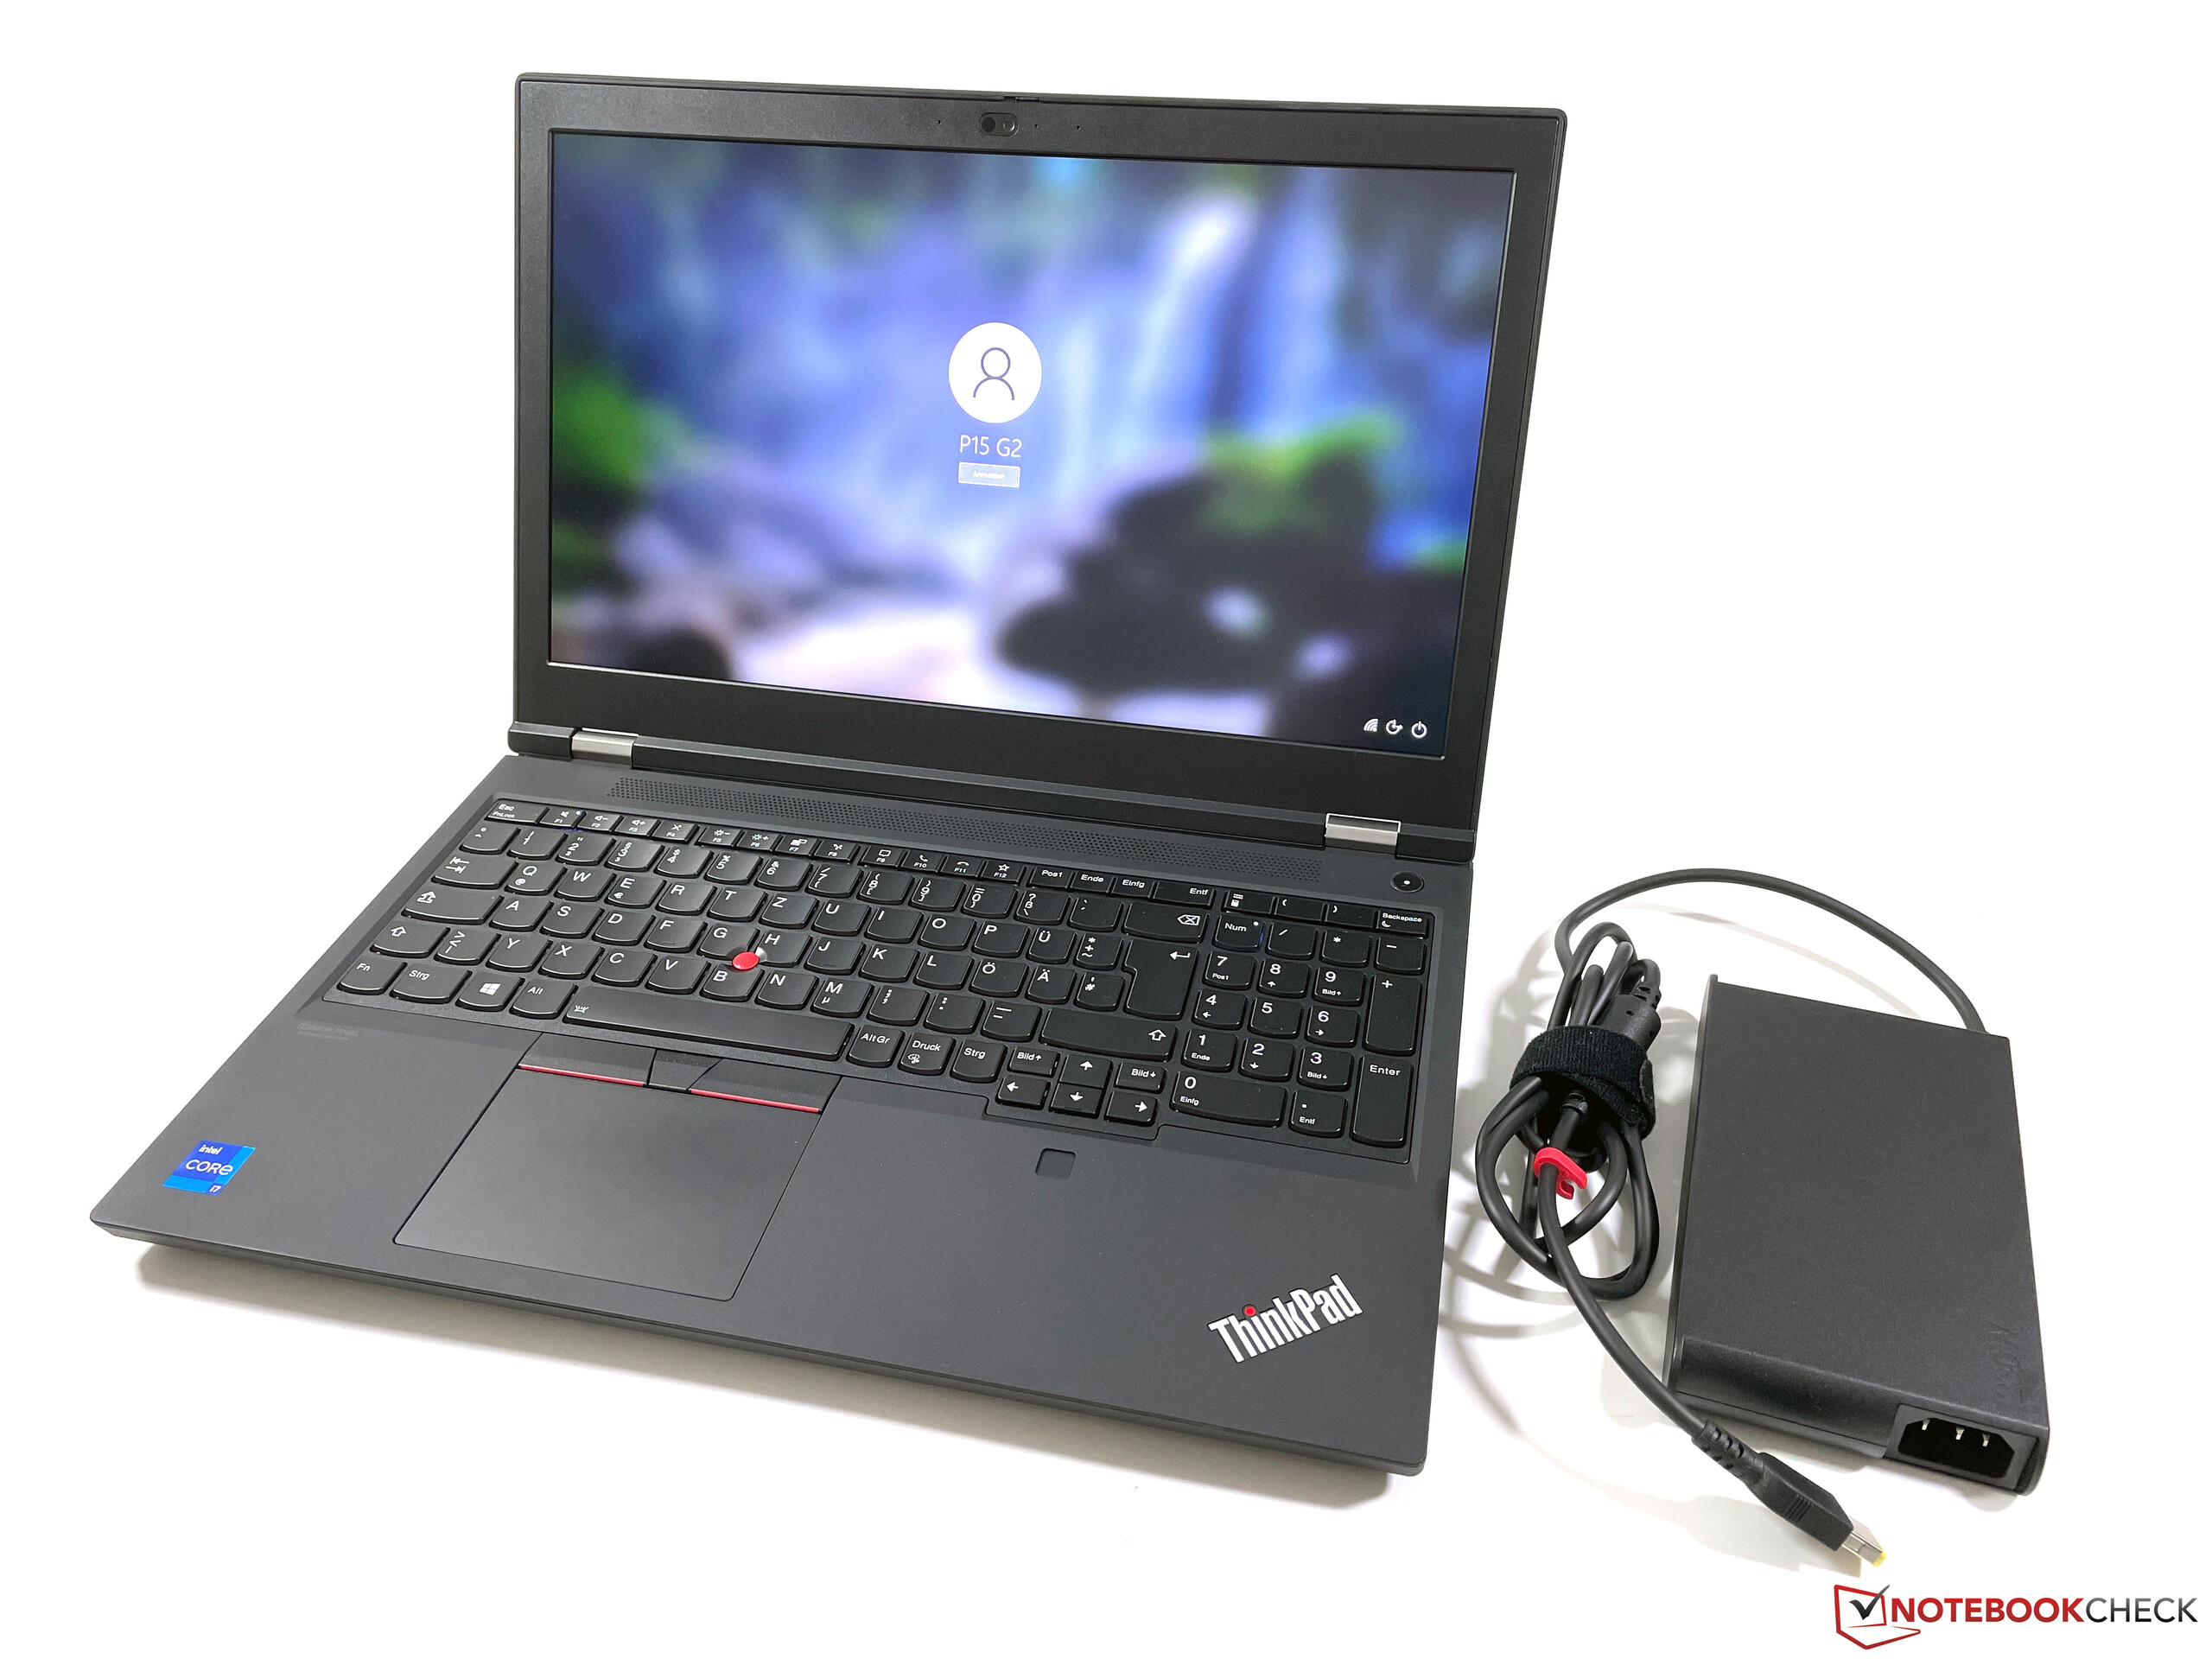
Lenovo ThinkPad P15 G2-20YQ001JGE
- 09/29/2021 v7 (old)
Andreas Osthoff
Price comparison
