Test: Lenovo ThinkPad P14s G2 AMD - Med matt 4K LCD och Ryzen 5000 (Sammanfattning)
Testgrupp
Gradering | Datum | Modell | Vikt | Höjd | Storlek | Upplösning | Pris |
|---|---|---|---|---|---|---|---|
| 85.2 % v7 (old) | 09/2021 | Lenovo ThinkPad P14s G2 AMD R7 PRO 5850U, Vega 8 | 1.5 kg | 17.9 mm | 14.00" | 3840x2160 | |
| 83.8 % v7 (old) | Lenovo ThinkPad P14s Gen1-20Y10002GE R7 PRO 4750U, Vega 7 | 1.6 kg | 17.9 mm | 14.00" | 1920x1080 | ||
| 85.1 % v7 (old) | 06/2021 | Lenovo ThinkPad P14s Gen2-20VX000GGE i7-1185G7, T500 Laptop GPU | 1.5 kg | 18 mm | 14.00" | 1920x1080 | |
| 85.2 % v7 (old) | 09/2021 | HP ZBook Firefly 14 G8 2C9Q2EA i7-1165G7, T500 Laptop GPU | 1.4 kg | 17.9 mm | 14.00" | 1920x1080 |
| SD Card Reader | |
| average JPG Copy Test (av. of 3 runs) | |
| Genomsnitt av klass Workstation (49.6 - 681, n=14, senaste 2 åren) | |
| Lenovo ThinkPad P14s Gen1-20Y10002GE (Toshiba Exceria Pro M501 64 GB UHS-II) | |
| Lenovo ThinkPad P14s Gen2-20VX000GGE (AV Pro V60) | |
| Lenovo ThinkPad P14s G2 AMD (AV PRO V60) | |
| maximum AS SSD Seq Read Test (1GB) | |
| Genomsnitt av klass Workstation (87.6 - 1455, n=14, senaste 2 åren) | |
| Lenovo ThinkPad P14s G2 AMD (AV PRO V60) | |
| Lenovo ThinkPad P14s Gen1-20Y10002GE (Toshiba Exceria Pro M501 64 GB UHS-II) | |
| Lenovo ThinkPad P14s Gen2-20VX000GGE (AV Pro V60) | |
| Networking | |
| iperf3 transmit AX12 | |
| Lenovo ThinkPad P14s Gen1-20Y10002GE | |
| HP ZBook Firefly 14 G8 2C9Q2EA | |
| Lenovo ThinkPad P14s Gen2-20VX000GGE | |
| Lenovo ThinkPad P14s G2 AMD | |
| Genomsnitt RealTek Semiconductor RTL8852AE (424 - 928, n=20) | |
| iperf3 receive AX12 | |
| HP ZBook Firefly 14 G8 2C9Q2EA | |
| Lenovo ThinkPad P14s Gen1-20Y10002GE | |
| Lenovo ThinkPad P14s Gen2-20VX000GGE | |
| Genomsnitt RealTek Semiconductor RTL8852AE (621 - 877, n=20) | |
| Lenovo ThinkPad P14s G2 AMD | |


Skärmflimmer / PWM (Puls-Width Modulation)
| Skärmflimmer / PWM upptäcktes inte | 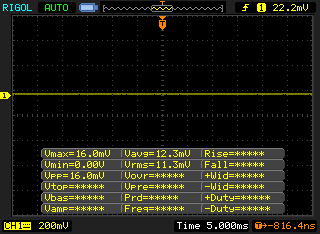 | ||
Som jämförelse: 52 % av alla testade enheter använder inte PWM för att dämpa skärmen. Om PWM upptäcktes mättes ett medelvärde av 7754 (minst: 5 - maximum: 343500) Hz. | |||
| |||||||||||||||||||||||||
Distribution av ljusstyrkan: 90 %
Mitt på batteriet: 512 cd/m²
Kontrast: 1463:1 (Svärta: 0.35 cd/m²)
ΔE ColorChecker Calman: 3.1 | ∀{0.5-29.43 Ø4.71}
calibrated: 0.4
ΔE Greyscale Calman: 5.5 | ∀{0.09-98 Ø4.96}
Gamma: 2.22
CCT: 6373 K
| Lenovo ThinkPad P14s G2 AMD MNE001EA1-5, IPS LED, 3840x2160, 14" | Lenovo ThinkPad P14s G2 AMD FHD NE140FHM-N61, IPS LED, 1920x1080, 14" | Lenovo ThinkPad P14s Gen1-20Y10002GE N140HCR-GL2, a-Si IPS LED, 1920x1080, 14" | Lenovo ThinkPad P14s Gen2-20VX000GGE B140HAN05.7, IPS, 1920x1080, 14" | HP ZBook Firefly 14 G8 2C9Q2EA AU Optronics AUO068B, IPS, 1920x1080, 14" | Lenovo ThinkPad X1 Carbon 2020-20U9003BGE NV140QUM-N53, , 3840x2160, 14" | |
|---|---|---|---|---|---|---|
| Display | -20% | -17% | -19% | -15% | -7% | |
| Display P3 Coverage (%) | 96.8 | 68.1 -30% | 67.3 -30% | 65.4 -32% | 70 -28% | 82.4 -15% |
| sRGB Coverage (%) | 99.9 | 91.1 -9% | 98.5 -1% | 96.6 -3% | 99.5 0% | 99.4 -1% |
| AdobeRGB 1998 Coverage (%) | 85.8 | 66.6 -22% | 69.4 -19% | 66.5 -22% | 71.4 -17% | 82.7 -4% |
| Response Times | -55% | 20% | -15% | -14% | 23% | |
| Response Time Grey 50% / Grey 80% * (ms) | 52 ? | 72 ? -38% | 38.4 ? 26% | 58.8 ? -13% | 64.4 ? -24% | 47.2 ? 9% |
| Response Time Black / White * (ms) | 28 ? | 48 ? -71% | 24 ? 14% | 32.8 ? -17% | 29.2 ? -4% | 17.6 ? 37% |
| PWM Frequency (Hz) | 200 ? | |||||
| Screen | -47% | 5% | -24% | -7% | -35% | |
| Brightness middle (cd/m²) | 512 | 403 -21% | 430 -16% | 350 -32% | 461 -10% | 574 12% |
| Brightness (cd/m²) | 487 | 395 -19% | 432 -11% | 348 -29% | 439 -10% | 540 11% |
| Brightness Distribution (%) | 90 | 91 1% | 88 -2% | 94 4% | 89 -1% | 86 -4% |
| Black Level * (cd/m²) | 0.35 | 0.25 29% | 0.27 23% | 0.14 60% | 0.24 31% | 0.36 -3% |
| Contrast (:1) | 1463 | 1612 10% | 1593 9% | 2500 71% | 1921 31% | 1594 9% |
| Colorchecker dE 2000 * | 3.1 | 4.4 -42% | 2.2 29% | 4.3 -39% | 2.6 16% | 4.7 -52% |
| Colorchecker dE 2000 max. * | 8.4 | 8.8 -5% | 4.4 48% | 6.7 20% | 5.8 31% | 8.8 -5% |
| Colorchecker dE 2000 calibrated * | 0.4 | 1.9 -375% | 0.7 -75% | 1.5 -275% | 1.1 -175% | 1.4 -250% |
| Greyscale dE 2000 * | 5.5 | 5.7 -4% | 3.3 40% | 5.3 4% | 4.4 20% | 7.2 -31% |
| Gamma | 2.22 99% | 2.18 101% | 2.21 100% | 2.42 91% | 2.29 96% | 2.04 108% |
| CCT | 6373 102% | 7375 88% | 6056 107% | 7631 85% | 6478 100% | 6886 94% |
| Color Space (Percent of AdobeRGB 1998) (%) | 63 | 61.1 | 65.2 | 73.8 | ||
| Color Space (Percent of sRGB) (%) | 98.5 | 96.4 | 99.4 | 99.4 | ||
| Totalt genomsnitt (program/inställningar) | -41% /
-43% | 3% /
3% | -19% /
-22% | -12% /
-10% | -6% /
-21% |
* ... mindre är bättre
Visa svarstider
| ↔ Svarstid svart till vitt | ||
|---|---|---|
| 28 ms ... stiga ↗ och falla ↘ kombinerat | ↗ 13 ms stiga | 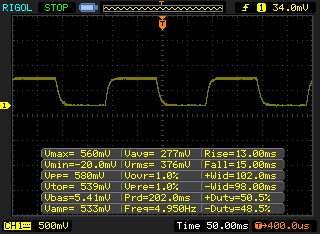 |
| ↘ 15 ms hösten | ||
| Skärmen visar relativt långsamma svarsfrekvenser i våra tester och kan vara för långsam för spelare. I jämförelse sträcker sig alla testade enheter från 0.1 (minst) till 240 (maximalt) ms. » 71 % av alla enheter är bättre. Detta innebär att den uppmätta svarstiden är sämre än genomsnittet av alla testade enheter (19.8 ms). | ||
| ↔ Svarstid 50 % grått till 80 % grått | ||
| 52 ms ... stiga ↗ och falla ↘ kombinerat | ↗ 26 ms stiga | 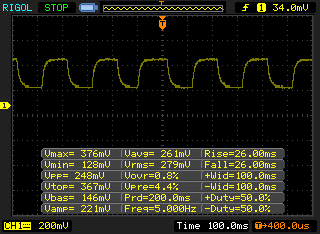 |
| ↘ 26 ms hösten | ||
| Skärmen visar långsamma svarsfrekvenser i våra tester och kommer att vara otillfredsställande för spelare. I jämförelse sträcker sig alla testade enheter från 0.165 (minst) till 636 (maximalt) ms. » 88 % av alla enheter är bättre. Detta innebär att den uppmätta svarstiden är sämre än genomsnittet av alla testade enheter (31 ms). | ||
Cinebench R15 Multi - Konstant belastning
Cinebench R20: CPU (Single Core) | CPU (Multi Core)
Cinebench R15: CPU Single 64Bit | CPU Multi 64Bit
Blender: v2.79 BMW27 CPU
7-Zip 18.03: 7z b 4 -mmt1 | 7z b 4
Geekbench 5.5: Single-Core | Multi-Core
HWBOT x265 Benchmark v2.2: 4k Preset
LibreOffice : 20 Documents To PDF
R Benchmark 2.5: Overall mean
| Cinebench R23 / Single Core | |
| Genomsnitt av klass Workstation (1712 - 2228, n=23, senaste 2 åren) | |
| Lenovo ThinkPad P14s Gen2-20VX000GGE | |
| Genomsnitt AMD Ryzen 7 PRO 5850U (1401 - 1431, n=3) | |
| Lenovo ThinkPad P14s G2 AMD | |
| Lenovo ThinkPad P14s Gen1-20Y10002GE | |
| Cinebench R23 / Multi Core | |
| Genomsnitt av klass Workstation (14621 - 38520, n=23, senaste 2 åren) | |
| Lenovo ThinkPad P14s G2 AMD | |
| Genomsnitt AMD Ryzen 7 PRO 5850U (8201 - 9111, n=3) | |
| Lenovo ThinkPad P14s Gen1-20Y10002GE | |
| Lenovo ThinkPad P14s Gen2-20VX000GGE | |
| Cinebench R20 / CPU (Single Core) | |
| Genomsnitt av klass Workstation (671 - 857, n=23, senaste 2 åren) | |
| HP ZBook Firefly 14 G8 2C9Q2EA | |
| Genomsnitt AMD Ryzen 7 PRO 5850U (543 - 558, n=3) | |
| Lenovo ThinkPad P14s G2 AMD | |
| Lenovo ThinkPad P14s Gen2-20VX000GGE | |
| Lenovo ThinkPad P14s Gen1-20Y10002GE | |
| Cinebench R20 / CPU (Multi Core) | |
| Genomsnitt av klass Workstation (5760 - 15043, n=23, senaste 2 åren) | |
| Lenovo ThinkPad P14s G2 AMD | |
| Genomsnitt AMD Ryzen 7 PRO 5850U (3184 - 3523, n=3) | |
| Lenovo ThinkPad P14s Gen1-20Y10002GE | |
| Lenovo ThinkPad P14s Gen2-20VX000GGE | |
| HP ZBook Firefly 14 G8 2C9Q2EA | |
| Cinebench R15 / CPU Single 64Bit | |
| Genomsnitt av klass Workstation (191.4 - 328, n=23, senaste 2 åren) | |
| Genomsnitt AMD Ryzen 7 PRO 5850U (225 - 227, n=3) | |
| HP ZBook Firefly 14 G8 2C9Q2EA | |
| Lenovo ThinkPad P14s G2 AMD | |
| Lenovo ThinkPad P14s Gen2-20VX000GGE | |
| Lenovo ThinkPad P14s Gen1-20Y10002GE | |
| Cinebench R15 / CPU Multi 64Bit | |
| Genomsnitt av klass Workstation (2489 - 5810, n=23, senaste 2 åren) | |
| Lenovo ThinkPad P14s G2 AMD | |
| Genomsnitt AMD Ryzen 7 PRO 5850U (1398 - 1527, n=3) | |
| Lenovo ThinkPad P14s Gen1-20Y10002GE | |
| Lenovo ThinkPad P14s Gen2-20VX000GGE | |
| HP ZBook Firefly 14 G8 2C9Q2EA | |
| Blender / v2.79 BMW27 CPU | |
| Lenovo ThinkPad P14s Gen2-20VX000GGE | |
| HP ZBook Firefly 14 G8 2C9Q2EA | |
| Lenovo ThinkPad P14s Gen1-20Y10002GE | |
| Genomsnitt AMD Ryzen 7 PRO 5850U (331 - 364, n=3) | |
| Lenovo ThinkPad P14s G2 AMD | |
| Genomsnitt av klass Workstation (91 - 222, n=23, senaste 2 åren) | |
| 7-Zip 18.03 / 7z b 4 -mmt1 | |
| Genomsnitt av klass Workstation (5126 - 6960, n=23, senaste 2 åren) | |
| Lenovo ThinkPad P14s Gen2-20VX000GGE | |
| HP ZBook Firefly 14 G8 2C9Q2EA | |
| Lenovo ThinkPad P14s G2 AMD | |
| Genomsnitt AMD Ryzen 7 PRO 5850U (5050 - 5300, n=3) | |
| Lenovo ThinkPad P14s Gen1-20Y10002GE | |
| 7-Zip 18.03 / 7z b 4 | |
| Genomsnitt av klass Workstation (60489 - 116969, n=23, senaste 2 åren) | |
| Lenovo ThinkPad P14s G2 AMD | |
| Genomsnitt AMD Ryzen 7 PRO 5850U (38553 - 45543, n=3) | |
| Lenovo ThinkPad P14s Gen1-20Y10002GE | |
| HP ZBook Firefly 14 G8 2C9Q2EA | |
| Lenovo ThinkPad P14s Gen2-20VX000GGE | |
| Geekbench 5.5 / Single-Core | |
| Genomsnitt av klass Workstation (1783 - 2183, n=23, senaste 2 åren) | |
| Lenovo ThinkPad P14s Gen2-20VX000GGE | |
| HP ZBook Firefly 14 G8 2C9Q2EA | |
| Lenovo ThinkPad P14s G2 AMD | |
| Genomsnitt AMD Ryzen 7 PRO 5850U (1354 - 1448, n=3) | |
| Lenovo ThinkPad P14s Gen1-20Y10002GE | |
| Geekbench 5.5 / Multi-Core | |
| Genomsnitt av klass Workstation (11542 - 25554, n=23, senaste 2 åren) | |
| Lenovo ThinkPad P14s G2 AMD | |
| Genomsnitt AMD Ryzen 7 PRO 5850U (5137 - 7039, n=3) | |
| Lenovo ThinkPad P14s Gen1-20Y10002GE | |
| Lenovo ThinkPad P14s Gen2-20VX000GGE | |
| HP ZBook Firefly 14 G8 2C9Q2EA | |
| HWBOT x265 Benchmark v2.2 / 4k Preset | |
| Genomsnitt av klass Workstation (17.8 - 40.5, n=23, senaste 2 åren) | |
| Lenovo ThinkPad P14s G2 AMD | |
| Genomsnitt AMD Ryzen 7 PRO 5850U (9.89 - 11.6, n=3) | |
| Lenovo ThinkPad P14s Gen1-20Y10002GE | |
| Lenovo ThinkPad P14s Gen2-20VX000GGE | |
| HP ZBook Firefly 14 G8 2C9Q2EA | |
| LibreOffice / 20 Documents To PDF | |
| Lenovo ThinkPad P14s Gen1-20Y10002GE | |
| HP ZBook Firefly 14 G8 2C9Q2EA | |
| Genomsnitt AMD Ryzen 7 PRO 5850U (49.1 - 51.9, n=3) | |
| Lenovo ThinkPad P14s G2 AMD | |
| Genomsnitt av klass Workstation (37.1 - 74.7, n=23, senaste 2 åren) | |
| Lenovo ThinkPad P14s Gen2-20VX000GGE | |
| R Benchmark 2.5 / Overall mean | |
| Lenovo ThinkPad P14s Gen1-20Y10002GE | |
| HP ZBook Firefly 14 G8 2C9Q2EA | |
| Lenovo ThinkPad P14s Gen2-20VX000GGE | |
| Genomsnitt AMD Ryzen 7 PRO 5850U (0.536 - 0.557, n=3) | |
| Lenovo ThinkPad P14s G2 AMD | |
| Genomsnitt av klass Workstation (0.3825 - 0.603, n=23, senaste 2 åren) | |
* ... mindre är bättre
| PCMark 10 / Score | |
| Genomsnitt av klass Workstation (6563 - 10409, n=19, senaste 2 åren) | |
| Genomsnitt AMD Ryzen 7 PRO 5850U, AMD Radeon RX Vega 8 (Ryzen 4000/5000) (5491 - 5933, n=3) | |
| Lenovo ThinkPad P14s Gen2-20VX000GGE | |
| Lenovo ThinkPad P14s G2 AMD | |
| HP ZBook Firefly 14 G8 2C9Q2EA | |
| Lenovo ThinkPad P14s Gen1-20Y10002GE | |
| PCMark 10 / Essentials | |
| Genomsnitt av klass Workstation (9622 - 11157, n=19, senaste 2 åren) | |
| Genomsnitt AMD Ryzen 7 PRO 5850U, AMD Radeon RX Vega 8 (Ryzen 4000/5000) (8772 - 10331, n=3) | |
| Lenovo ThinkPad P14s Gen2-20VX000GGE | |
| Lenovo ThinkPad P14s Gen1-20Y10002GE | |
| Lenovo ThinkPad P14s G2 AMD | |
| HP ZBook Firefly 14 G8 2C9Q2EA | |
| PCMark 10 / Productivity | |
| Genomsnitt av klass Workstation (8789 - 20616, n=19, senaste 2 åren) | |
| Genomsnitt AMD Ryzen 7 PRO 5850U, AMD Radeon RX Vega 8 (Ryzen 4000/5000) (8967 - 9512, n=3) | |
| Lenovo ThinkPad P14s Gen2-20VX000GGE | |
| Lenovo ThinkPad P14s G2 AMD | |
| HP ZBook Firefly 14 G8 2C9Q2EA | |
| Lenovo ThinkPad P14s Gen1-20Y10002GE | |
| PCMark 10 / Digital Content Creation | |
| Genomsnitt av klass Workstation (8108 - 15631, n=19, senaste 2 åren) | |
| Lenovo ThinkPad P14s G2 AMD | |
| Lenovo ThinkPad P14s Gen2-20VX000GGE | |
| Genomsnitt AMD Ryzen 7 PRO 5850U, AMD Radeon RX Vega 8 (Ryzen 4000/5000) (5141 - 5938, n=3) | |
| HP ZBook Firefly 14 G8 2C9Q2EA | |
| Lenovo ThinkPad P14s Gen1-20Y10002GE | |
| PCMark 10 Score | 5491 poäng | |
Hjälp | ||
| DPC Latencies / LatencyMon - interrupt to process latency (max), Web, Youtube, Prime95 | |
| HP ZBook Firefly 14 G8 2C9Q2EA | |
| Lenovo ThinkPad P14s G2 AMD | |
| Lenovo ThinkPad P14s Gen2-20VX000GGE | |
* ... mindre är bättre
| Lenovo ThinkPad P14s G2 AMD SK Hynix PC711 1TB HFS001TDE9X081N | Lenovo ThinkPad P14s Gen1-20Y10002GE Samsung PM981a MZVLB1T0HBLR | Lenovo ThinkPad P14s Gen2-20VX000GGE Toshiba XG6 KXG6AZNV1T02 | HP ZBook Firefly 14 G8 2C9Q2EA Toshiba XG6 KXG60ZNV1T02 | Genomsnitt SK Hynix PC711 1TB HFS001TDE9X081N | |
|---|---|---|---|---|---|
| AS SSD | -7% | 17% | -12% | 19% | |
| Seq Read (MB/s) | 2762 | 2579 -7% | 2632 -5% | 2674 -3% | 2818 ? 2% |
| Seq Write (MB/s) | 1712 | 1456 -15% | 2394 40% | 1289 -25% | 2028 ? 18% |
| 4K Read (MB/s) | 48.36 | 50.9 5% | 57 18% | 49.52 2% | 53.4 ? 10% |
| 4K Write (MB/s) | 126.4 | 115.7 -8% | 198.4 57% | 128 1% | 140 ? 11% |
| 4K-64 Read (MB/s) | 980 | 858 -12% | 1476 51% | 1113 14% | 1455 ? 48% |
| 4K-64 Write (MB/s) | 2179 | 2152 -1% | 1460 -33% | 1470 -33% | 2530 ? 16% |
| Access Time Read * (ms) | 0.05 | 0.053 -6% | 0.044 12% | 0.072 -44% | 0.041 ? 18% |
| Access Time Write * (ms) | 0.029 | 0.032 -10% | 0.021 28% | 0.032 -10% | 0.027 ? 7% |
| Score Read (Points) | 1304 | 1166 -11% | 1796 38% | 1430 10% | 1790 ? 37% |
| Score Write (Points) | 2477 | 2414 -3% | 1897 -23% | 1727 -30% | 2873 ? 16% |
| Score Total (Points) | 4405 | 4132 -6% | 4608 5% | 3827 -13% | 5545 ? 26% |
* ... mindre är bättre

DiskSpd Read Loop, Queue Depth 8
| 3DMark 11 - 1280x720 Performance GPU | |
| Genomsnitt av klass Workstation (12535 - 69594, n=23, senaste 2 åren) | |
| HP ZBook Firefly 14 G8 2C9Q2EA | |
| Lenovo ThinkPad P14s Gen2-20VX000GGE | |
| Lenovo ThinkPad P14s G2 AMD | |
| Genomsnitt AMD Radeon RX Vega 8 (Ryzen 4000/5000) (3459 - 7591, n=57) | |
| Lenovo ThinkPad P14s Gen1-20Y10002GE | |
| 3DMark | |
| 1920x1080 Fire Strike Graphics | |
| Genomsnitt av klass Workstation (8293 - 52560, n=23, senaste 2 åren) | |
| HP ZBook Firefly 14 G8 2C9Q2EA | |
| Lenovo ThinkPad P14s G2 AMD | |
| Lenovo ThinkPad P14s Gen2-20VX000GGE | |
| Genomsnitt AMD Radeon RX Vega 8 (Ryzen 4000/5000) (1694 - 5041, n=57) | |
| Lenovo ThinkPad P14s Gen1-20Y10002GE | |
| 2560x1440 Time Spy Graphics | |
| Genomsnitt av klass Workstation (2725 - 24806, n=23, senaste 2 åren) | |
| HP ZBook Firefly 14 G8 2C9Q2EA | |
| Lenovo ThinkPad P14s Gen2-20VX000GGE | |
| Lenovo ThinkPad P14s G2 AMD | |
| Genomsnitt AMD Radeon RX Vega 8 (Ryzen 4000/5000) (540 - 1557, n=57) | |
| Lenovo ThinkPad P14s Gen1-20Y10002GE | |
| 3DMark 11 Performance | 6342 poäng | |
| 3DMark Fire Strike Score | 3694 poäng | |
| 3DMark Time Spy Score | 1462 poäng | |
Hjälp | ||
| The Witcher 3 - 1024x768 Low Graphics & Postprocessing | |
| Genomsnitt av klass Workstation (n=1senaste 2 åren) | |
| HP ZBook Firefly 14 G8 2C9Q2EA | |
| Lenovo ThinkPad P14s Gen2-20VX000GGE | |
| Lenovo ThinkPad P14s G2 AMD | |
| Lenovo ThinkPad P14s Gen1-20Y10002GE | |
| Genomsnitt AMD Radeon RX Vega 8 (Ryzen 4000/5000) (27.2 - 89, n=47) | |
| låg | med. | hög | ultra | QHD | 4K | |
|---|---|---|---|---|---|---|
| GTA V (2015) | 29.1 | 13.3 | 9.13 | 8.82 | ||
| The Witcher 3 (2015) | 71.3 | 20.2 | 11.4 | |||
| Dota 2 Reborn (2015) | 119 | 100 | 59 | 55.6 | 21 | |
| Final Fantasy XV Benchmark (2018) | 36.5 | 17.4 | 12.3 | 8.33 | 4.64 | |
| X-Plane 11.11 (2018) | 45.9 | 36.7 | 31.7 | 17.6 | ||
| Strange Brigade (2018) | 88.3 | 33.8 | 28.6 | 24.5 | 16.4 | 8.6 |
The Witcher 3 FPS-tabell
Ljudnivå
| Låg belastning |
| 24.04 / 24.04 / 24.04 dB(A) |
| Hög belastning |
| 28.19 / 40.77 dB(A) |
 | ||
30 dB tyst 40 dB(A) hörbar 50 dB(A) högt ljud |
||
min: | ||
(±) Den maximala temperaturen på ovansidan är 42.8 °C / 109 F, jämfört med genomsnittet av 38.2 °C / 101 F , allt från 22.2 till 69.8 °C för klassen Workstation.
(-) Botten värms upp till maximalt 47.5 °C / 118 F, jämfört med genomsnittet av 41.1 °C / 106 F
(+) Vid tomgångsbruk är medeltemperaturen för ovansidan 25.3 °C / 78 F, jämfört med enhetsgenomsnittet på 32 °C / ### class_avg_f### F.
(+) Handledsstöden och pekplattan når maximal hudtemperatur (32.6 °C / 90.7 F) och är därför inte varma.
(-) Medeltemperaturen för handledsstödsområdet på liknande enheter var 27.8 °C / 82 F (-4.8 °C / -8.7 F).
Lenovo ThinkPad P14s Gen2-20VX000GGE ljudanalys
(±) | högtalarljudstyrkan är genomsnittlig men bra (75 dB)
Bas 100 - 315 Hz
(-) | nästan ingen bas - i genomsnitt 18.6% lägre än medianen
(±) | linjäriteten för basen är genomsnittlig (10.1% delta till föregående frekvens)
Mellan 400 - 2000 Hz
(±) | högre mellan - i genomsnitt 6% högre än median
(+) | mids är linjära (4.7% delta till föregående frekvens)
Högsta 2 - 16 kHz
(+) | balanserade toppar - endast 2.3% från medianen
(+) | toppar är linjära (3.7% delta till föregående frekvens)
Totalt 100 - 16 000 Hz
(±) | linjäriteten för det totala ljudet är genomsnittlig (20.4% skillnad mot median)
Jämfört med samma klass
» 72% av alla testade enheter i den här klassen var bättre, 5% liknande, 23% sämre
» Den bästa hade ett delta på 7%, genomsnittet var 17%, sämst var 35%
Jämfört med alla testade enheter
» 54% av alla testade enheter var bättre, 8% liknande, 38% sämre
» Den bästa hade ett delta på 4%, genomsnittet var 23%, sämst var 134%
HP ZBook Firefly 14 G8 2C9Q2EA ljudanalys
(±) | högtalarljudstyrkan är genomsnittlig men bra (80.2 dB)
Bas 100 - 315 Hz
(±) | reducerad bas - i genomsnitt 13.5% lägre än medianen
(±) | linjäriteten för basen är genomsnittlig (10.6% delta till föregående frekvens)
Mellan 400 - 2000 Hz
(+) | balanserad mellan - endast 4% från medianen
(+) | mids är linjära (3.2% delta till föregående frekvens)
Högsta 2 - 16 kHz
(+) | balanserade toppar - endast 3.1% från medianen
(+) | toppar är linjära (3.1% delta till föregående frekvens)
Totalt 100 - 16 000 Hz
(±) | linjäriteten för det totala ljudet är genomsnittlig (15.2% skillnad mot median)
Jämfört med samma klass
» 33% av alla testade enheter i den här klassen var bättre, 10% liknande, 57% sämre
» Den bästa hade ett delta på 7%, genomsnittet var 17%, sämst var 35%
Jämfört med alla testade enheter
» 22% av alla testade enheter var bättre, 4% liknande, 74% sämre
» Den bästa hade ett delta på 4%, genomsnittet var 23%, sämst var 134%
| Av/Standby | |
| Låg belastning | |
| Hög belastning |
|
Förklaring:
min: | |
| Lenovo ThinkPad P14s G2 AMD R7 PRO 5850U, Vega 8, SK Hynix PC711 1TB HFS001TDE9X081N, IPS LED, 3840x2160, 14" | Lenovo ThinkPad P14s G2 AMD FHD R7 PRO 5850U, Vega 8, WDC PC SN730 SDBQNTY-1T00, IPS LED, 1920x1080, 14" | Lenovo ThinkPad P14s Gen1-20Y10002GE R7 PRO 4750U, Vega 7, Samsung PM981a MZVLB1T0HBLR, a-Si IPS LED, 1920x1080, 14" | Lenovo ThinkPad P14s Gen2-20VX000GGE i7-1185G7, T500 Laptop GPU, Toshiba XG6 KXG6AZNV1T02, IPS, 1920x1080, 14" | HP ZBook Firefly 14 G8 2C9Q2EA i7-1165G7, T500 Laptop GPU, Toshiba XG6 KXG60ZNV1T02, IPS, 1920x1080, 14" | Genomsnitt AMD Radeon RX Vega 8 (Ryzen 4000/5000) | Genomsnitt av klass Workstation | |
|---|---|---|---|---|---|---|---|
| Power Consumption | 13% | -7% | -3% | -12% | -9% | -134% | |
| Idle Minimum * (Watt) | 4.49 | 4.06 10% | 4.8 -7% | 4.5 -0% | 3.1 31% | 5.3 ? -18% | 9.11 ? -103% |
| Idle Average * (Watt) | 9.62 | 7.27 24% | 8.8 9% | 7.1 26% | 4.7 51% | 7.85 ? 18% | 13.8 ? -43% |
| Idle Maximum * (Watt) | 10.24 | 8.2 20% | 11.4 -11% | 9.7 5% | 8.6 16% | 9.31 ? 9% | 17.9 ? -75% |
| Load Average * (Watt) | 31.56 | 29.4 7% | 45.2 -43% | 37.8 -20% | 64.8 -105% | 44.2 ? -40% | 96 ? -204% |
| Witcher 3 ultra * (Watt) | 43.7 | 42.2 3% | 59.6 -36% | ||||
| Load Maximum * (Watt) | 52.37 | 50.1 4% | 50 5% | 64.7 -24% | 68.5 -31% | 58.9 ? -12% | 180.3 ? -244% |
* ... mindre är bättre
Energiförbrukning: The Witcher 3 - Stress-test
| Lenovo ThinkPad P14s G2 AMD R7 PRO 5850U, Vega 8, 50 Wh | Lenovo ThinkPad P14s G2 AMD FHD R7 PRO 5850U, Vega 8, Wh | Lenovo ThinkPad P14s Gen1-20Y10002GE R7 PRO 4750U, Vega 7, 50 Wh | Lenovo ThinkPad P14s Gen2-20VX000GGE i7-1185G7, T500 Laptop GPU, 50 Wh | HP ZBook Firefly 14 G8 2C9Q2EA i7-1165G7, T500 Laptop GPU, 53 Wh | Genomsnitt av klass Workstation | |
|---|---|---|---|---|---|---|
| Batteridrifttid | 22% | -25% | 11% | 131% | 0% | |
| H.264 (h) | 10.6 | 8.2 -23% | 10.1 ? -5% | |||
| WiFi v1.3 (h) | 8.3 | 10.1 22% | 5.8 -30% | 9.2 11% | 12.8 54% | 8.55 ? 3% |
| Load (h) | 1.4 | 1.1 -21% | 4.3 207% | 1.441 ? 3% |
För
Emot
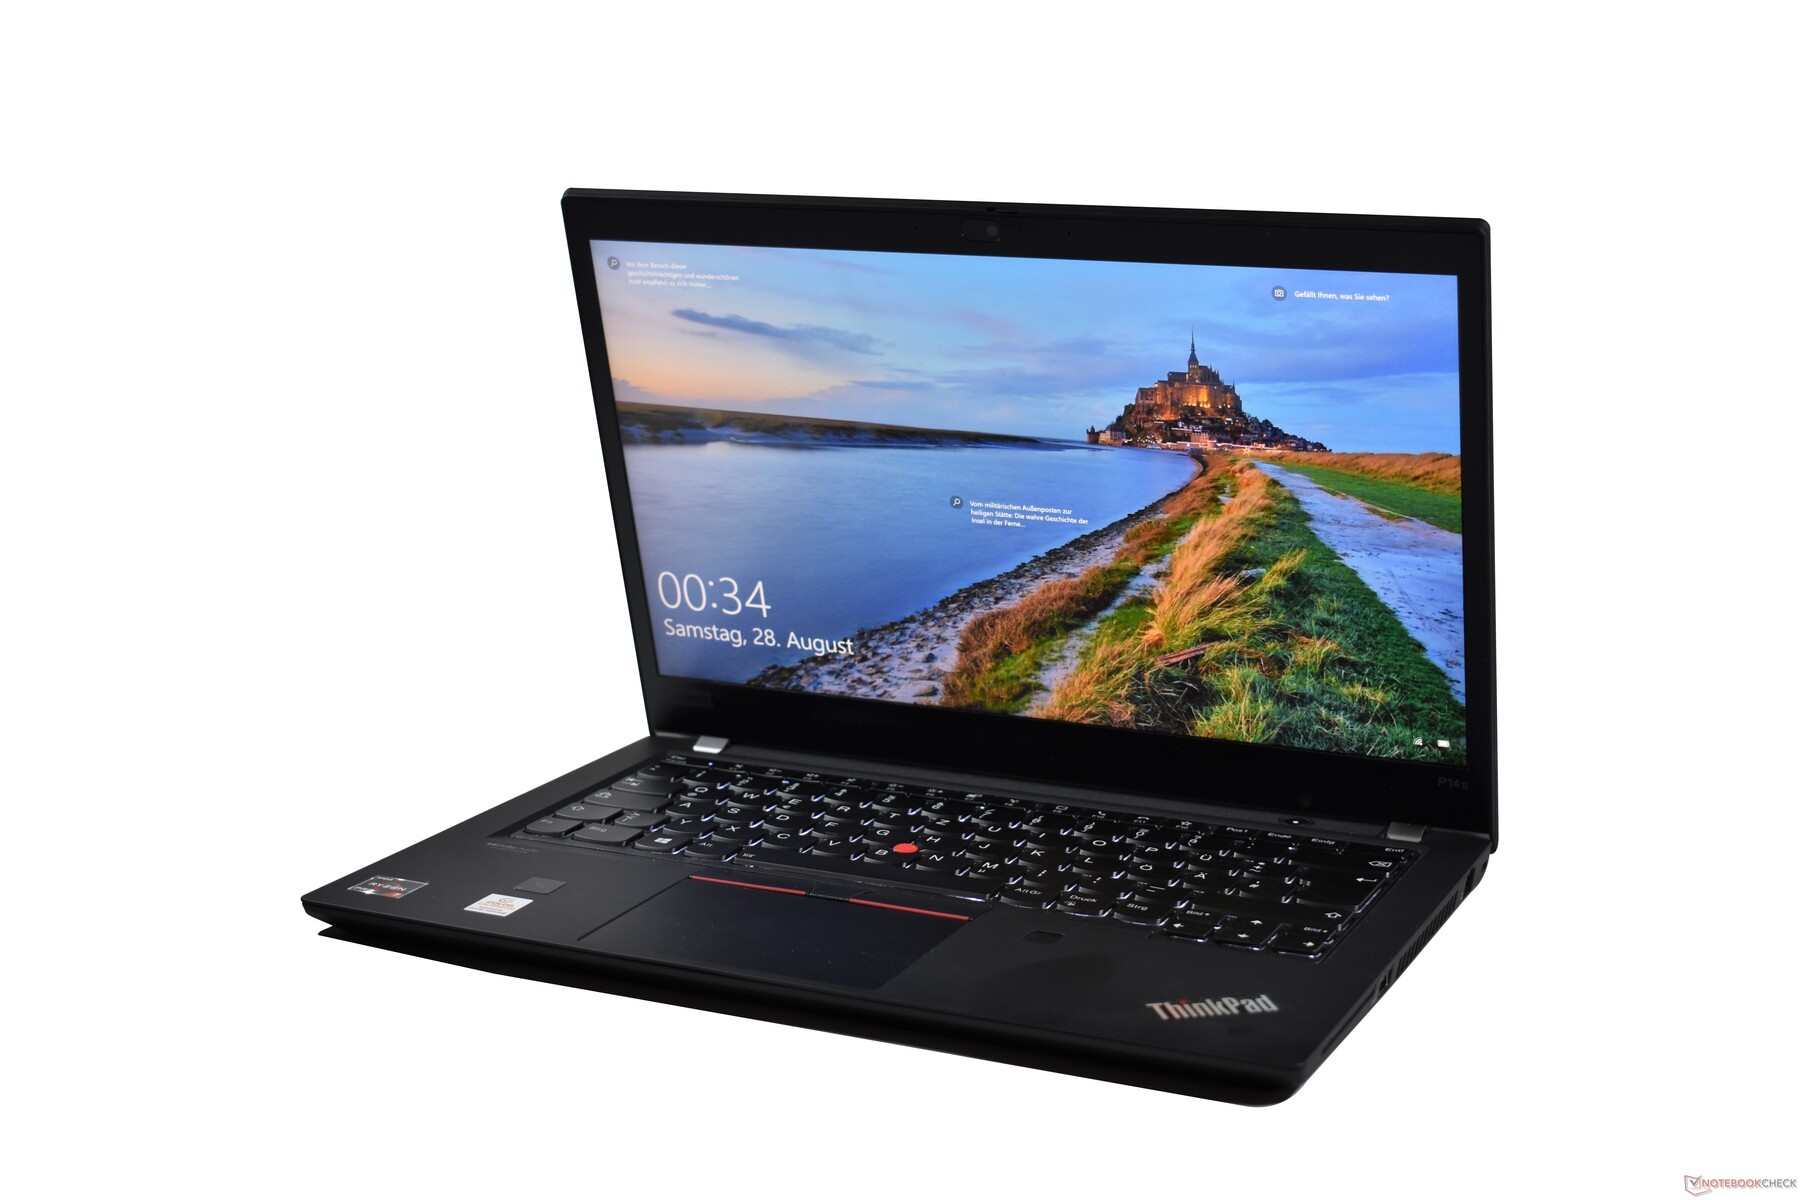
Omdöme: ThinkPad P14s G2 AMD åtgärdar G1:s svagheter
Läs den fullständiga versionen av den här recensionen på engelska här.
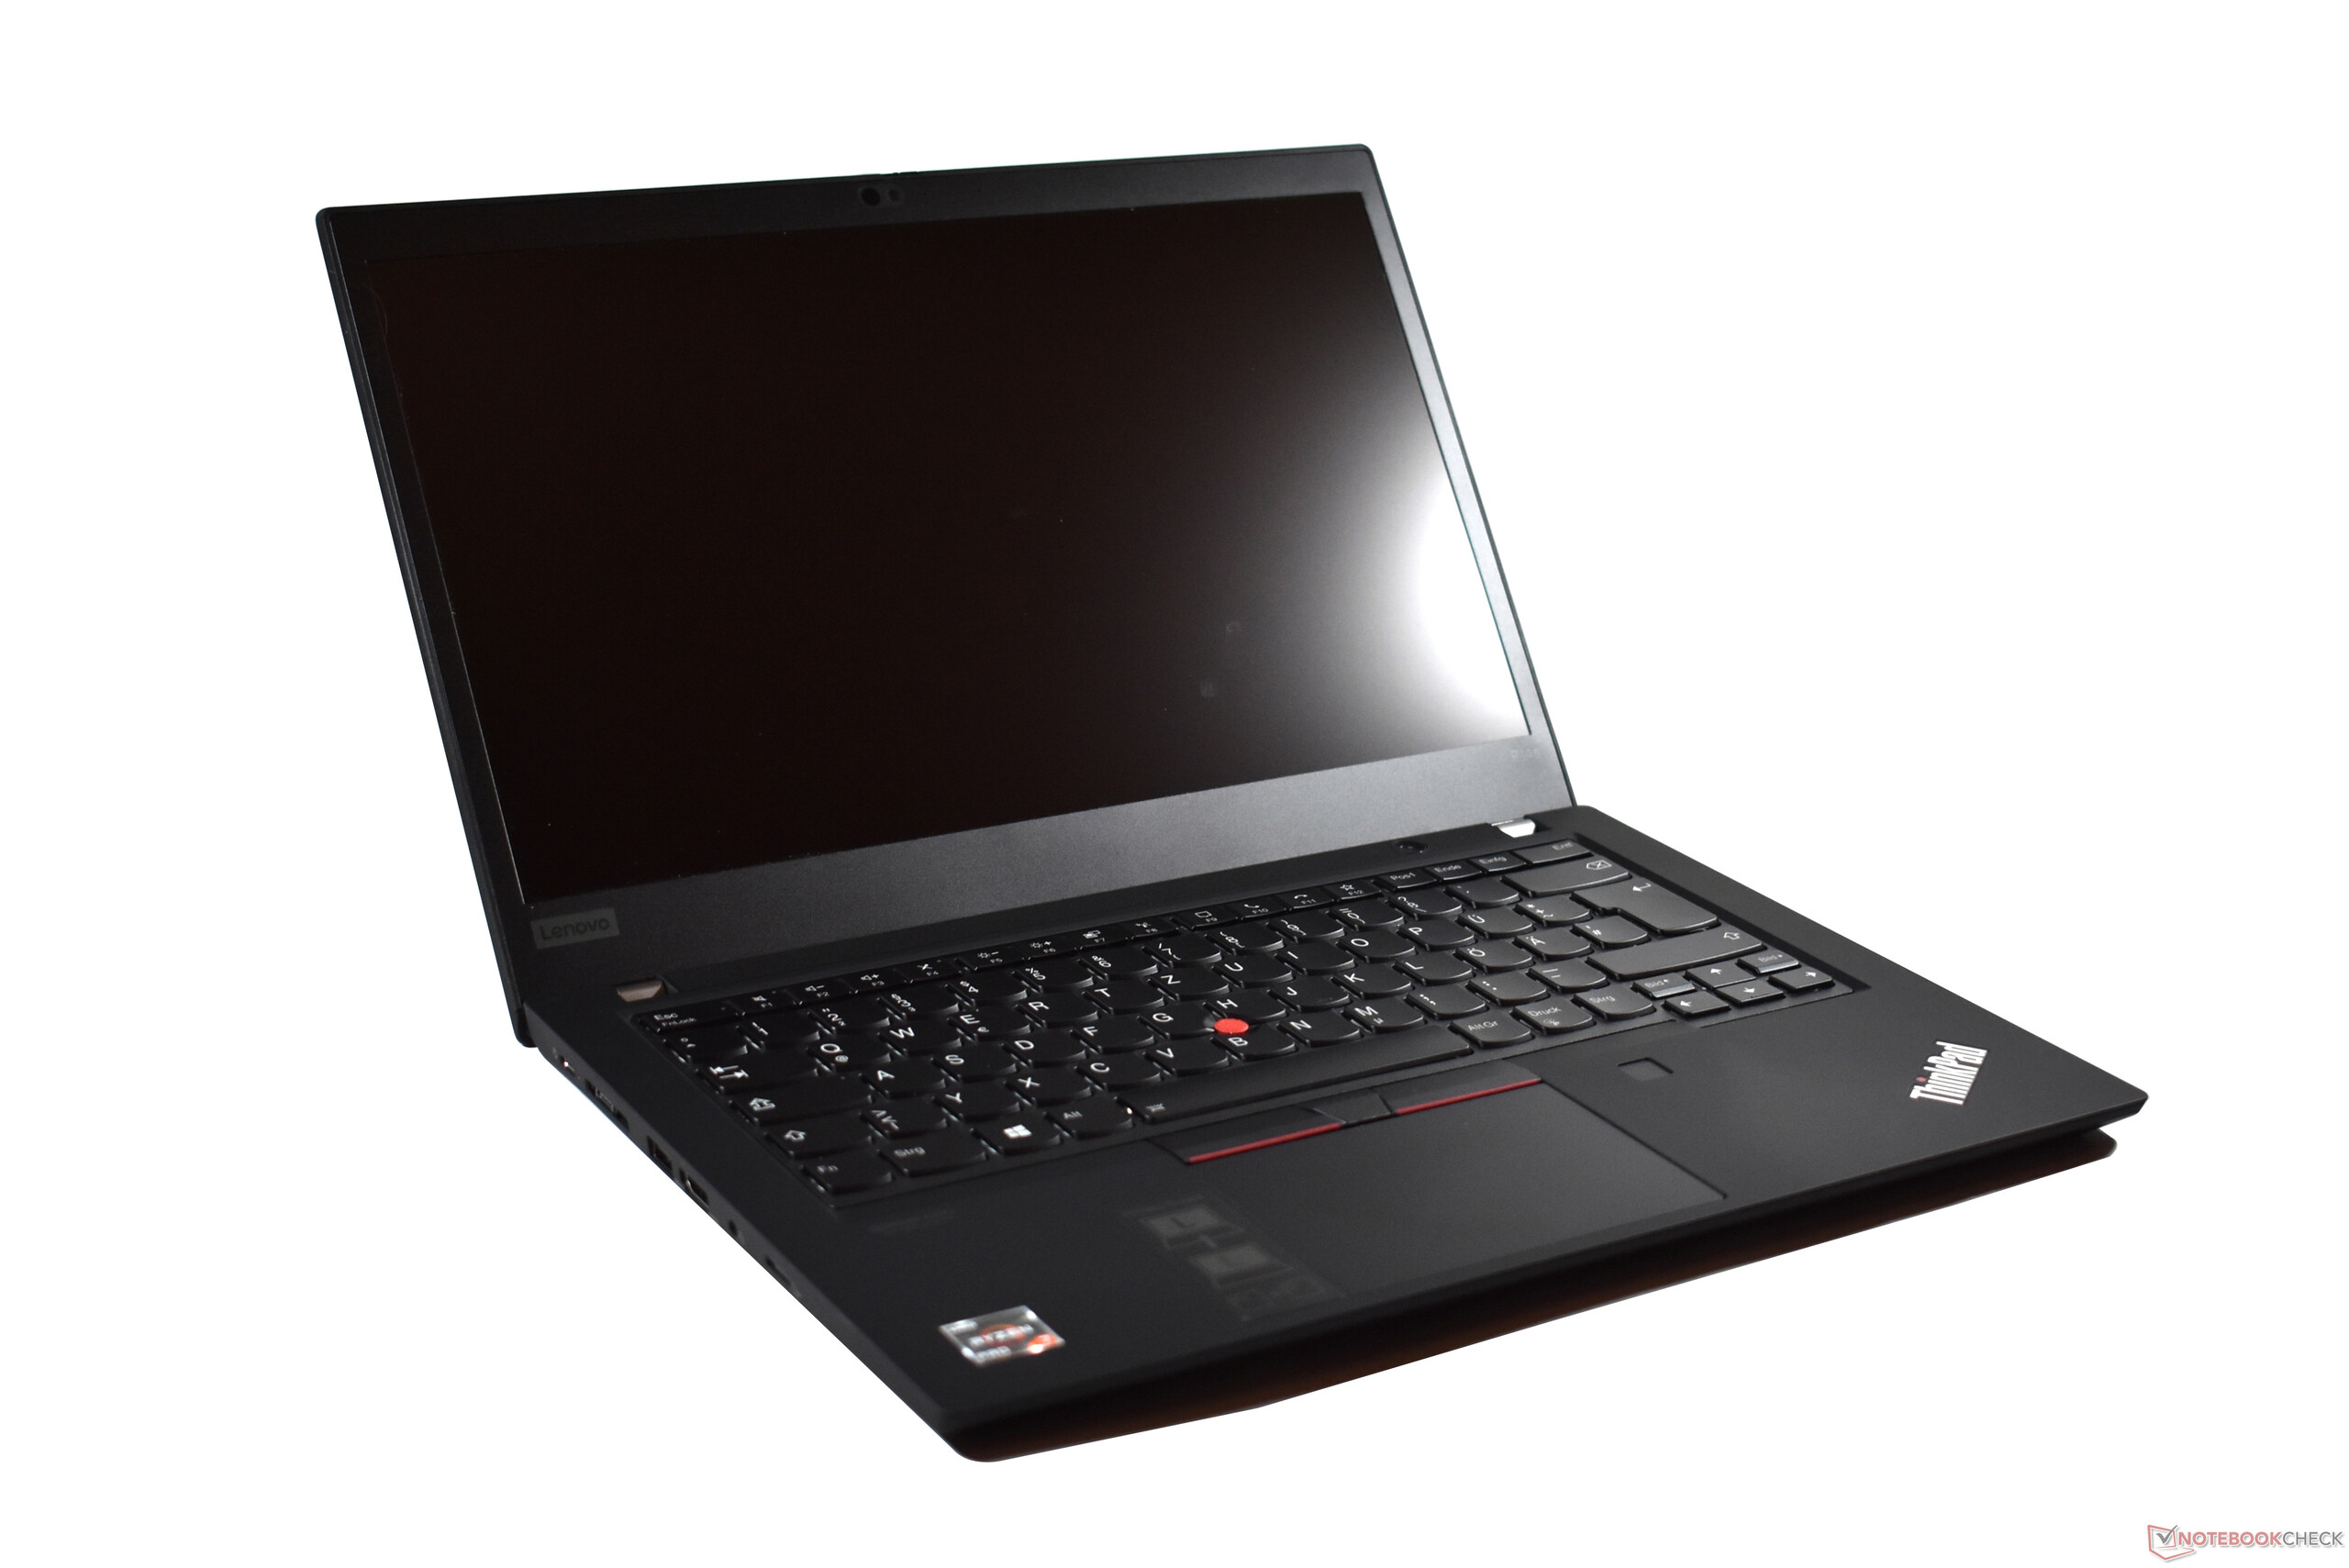
Vi har redan utvärderat första generationen av Lenovo ThinkPad P14s AMD och fann den värdig en rekommendation trots att konfigurationen vi testade hade en inte särskilt tilltalande PrivacyGuard-skärm och kort batteritid. Så det är inte förvånande att nya Lenovo ThinkPad P14s Gen 2 med AMD Ryzen 5000 också får en rekommendation, särskilt med tanke på att den har bättre batteritid och kan konfigureras med en utmärkt matt 4K UHD-skärm - ett alternativ som inte fanns tillgängligt till föregångaren.
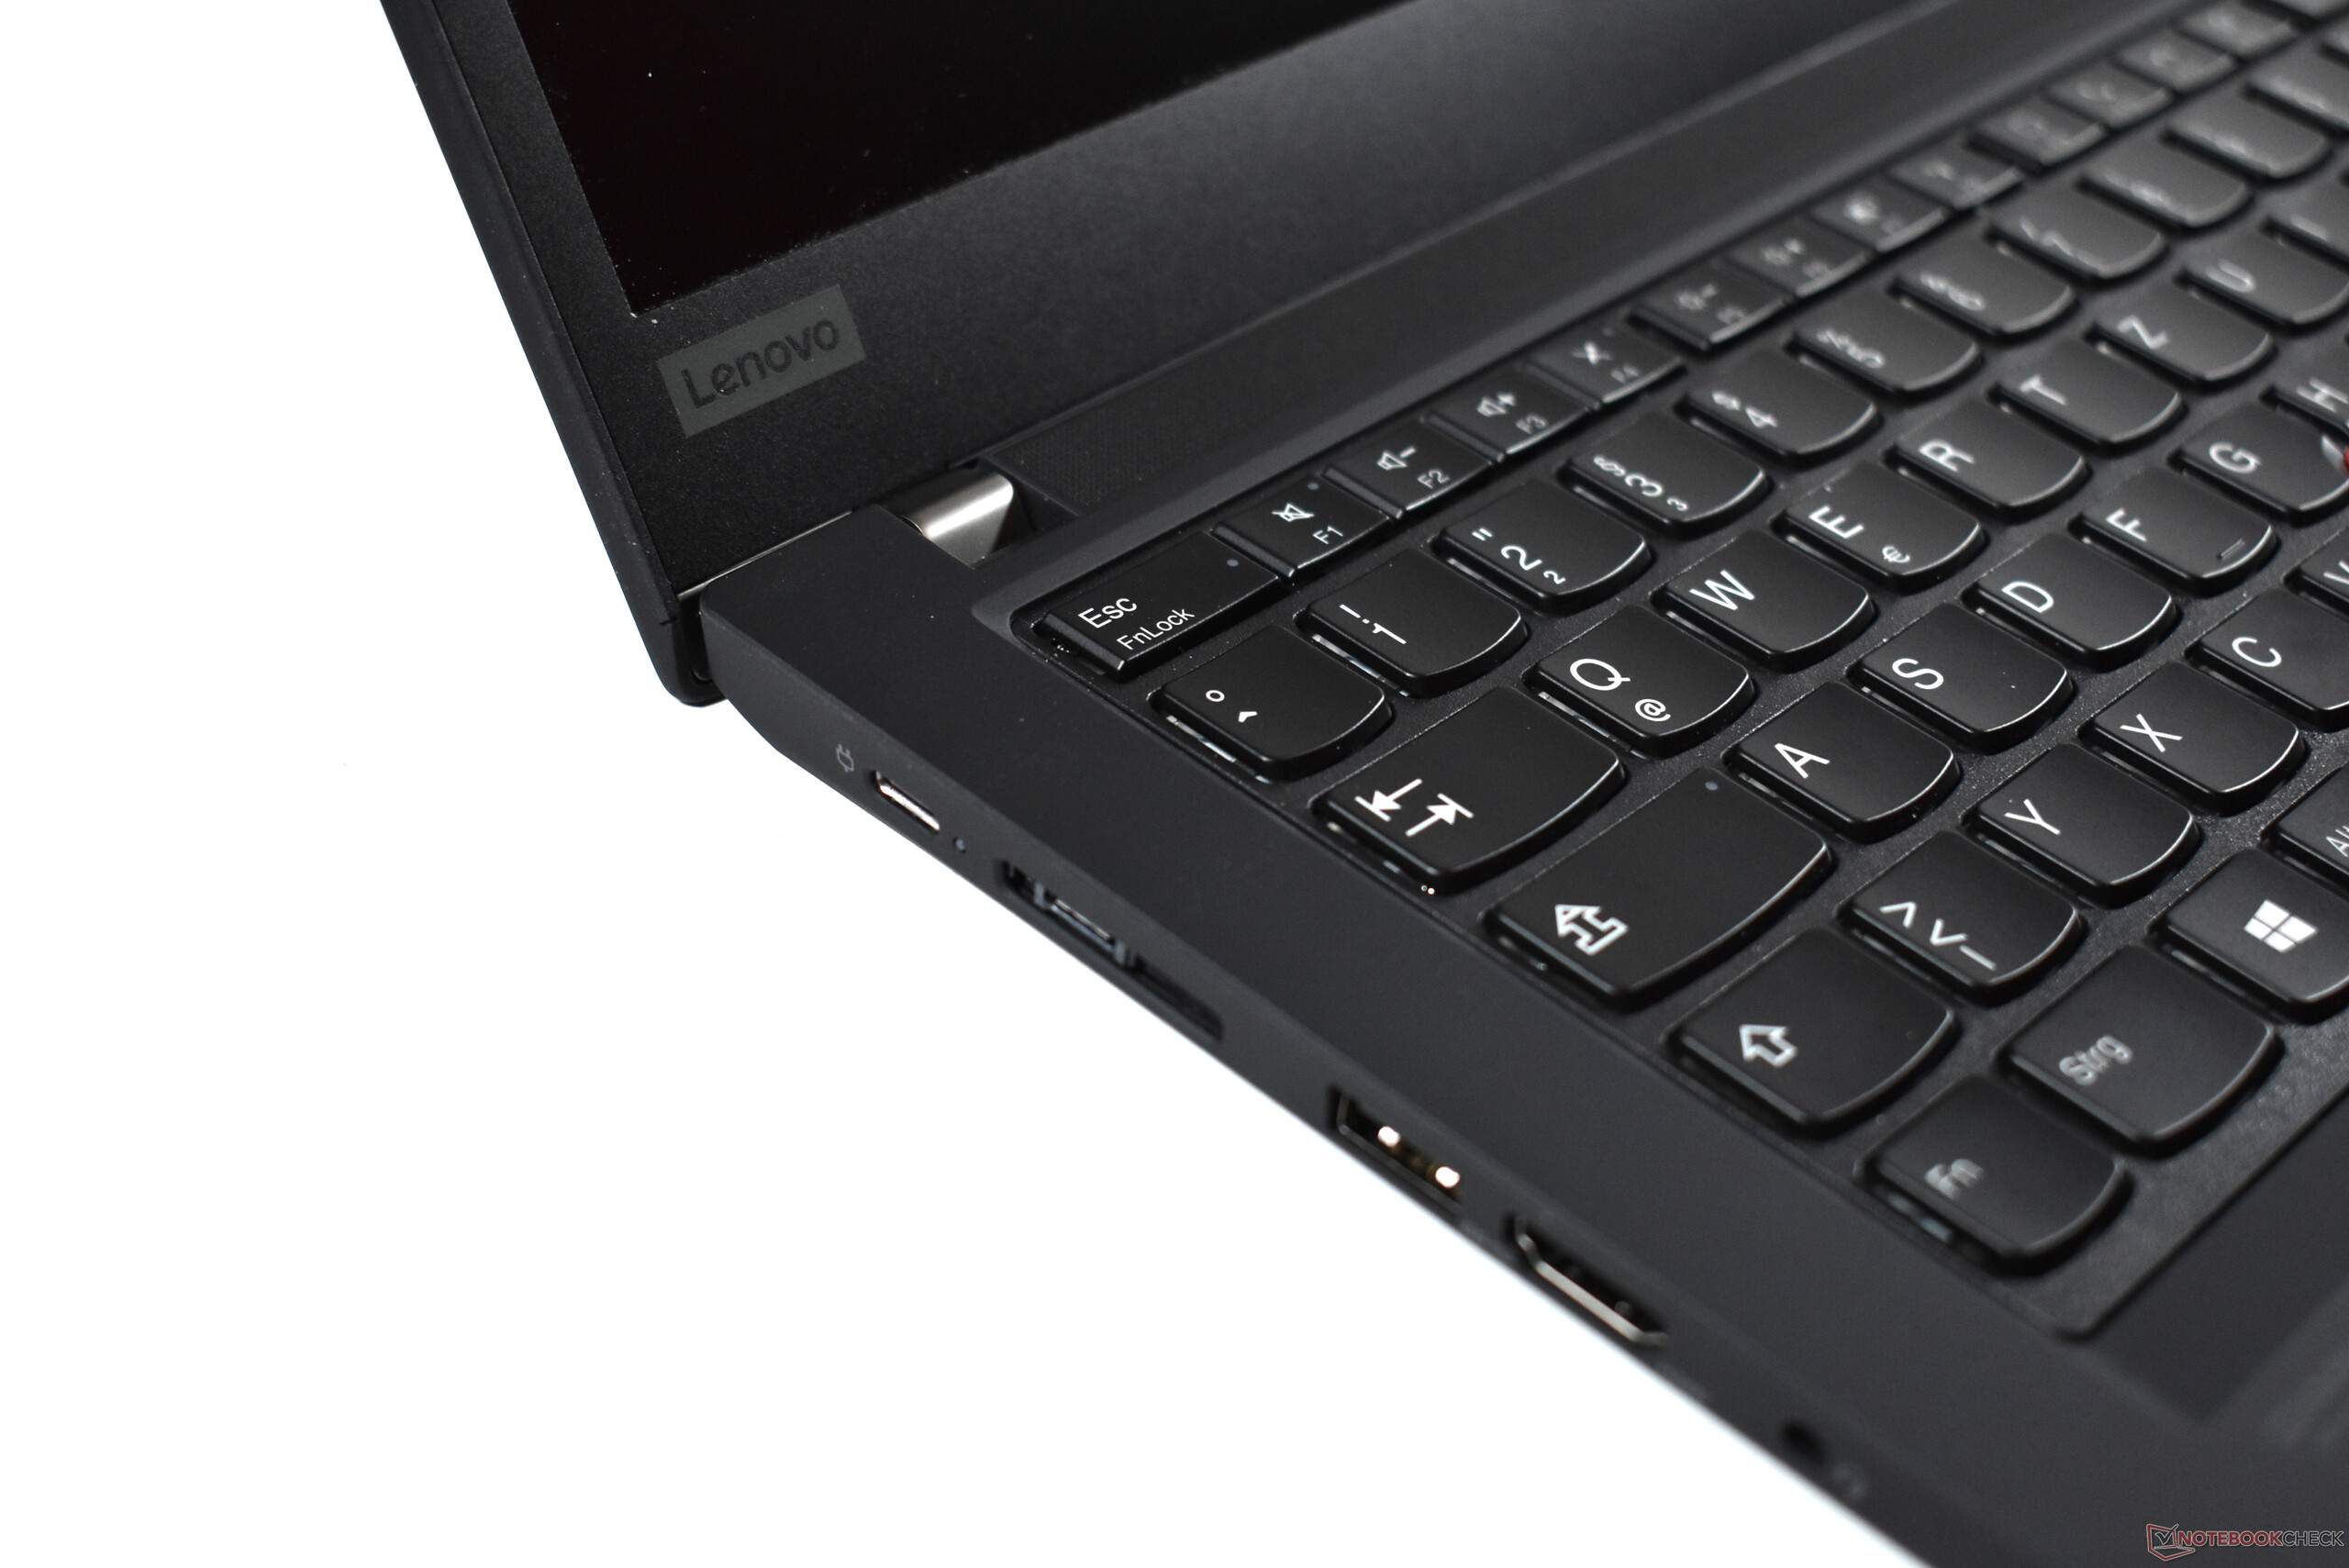
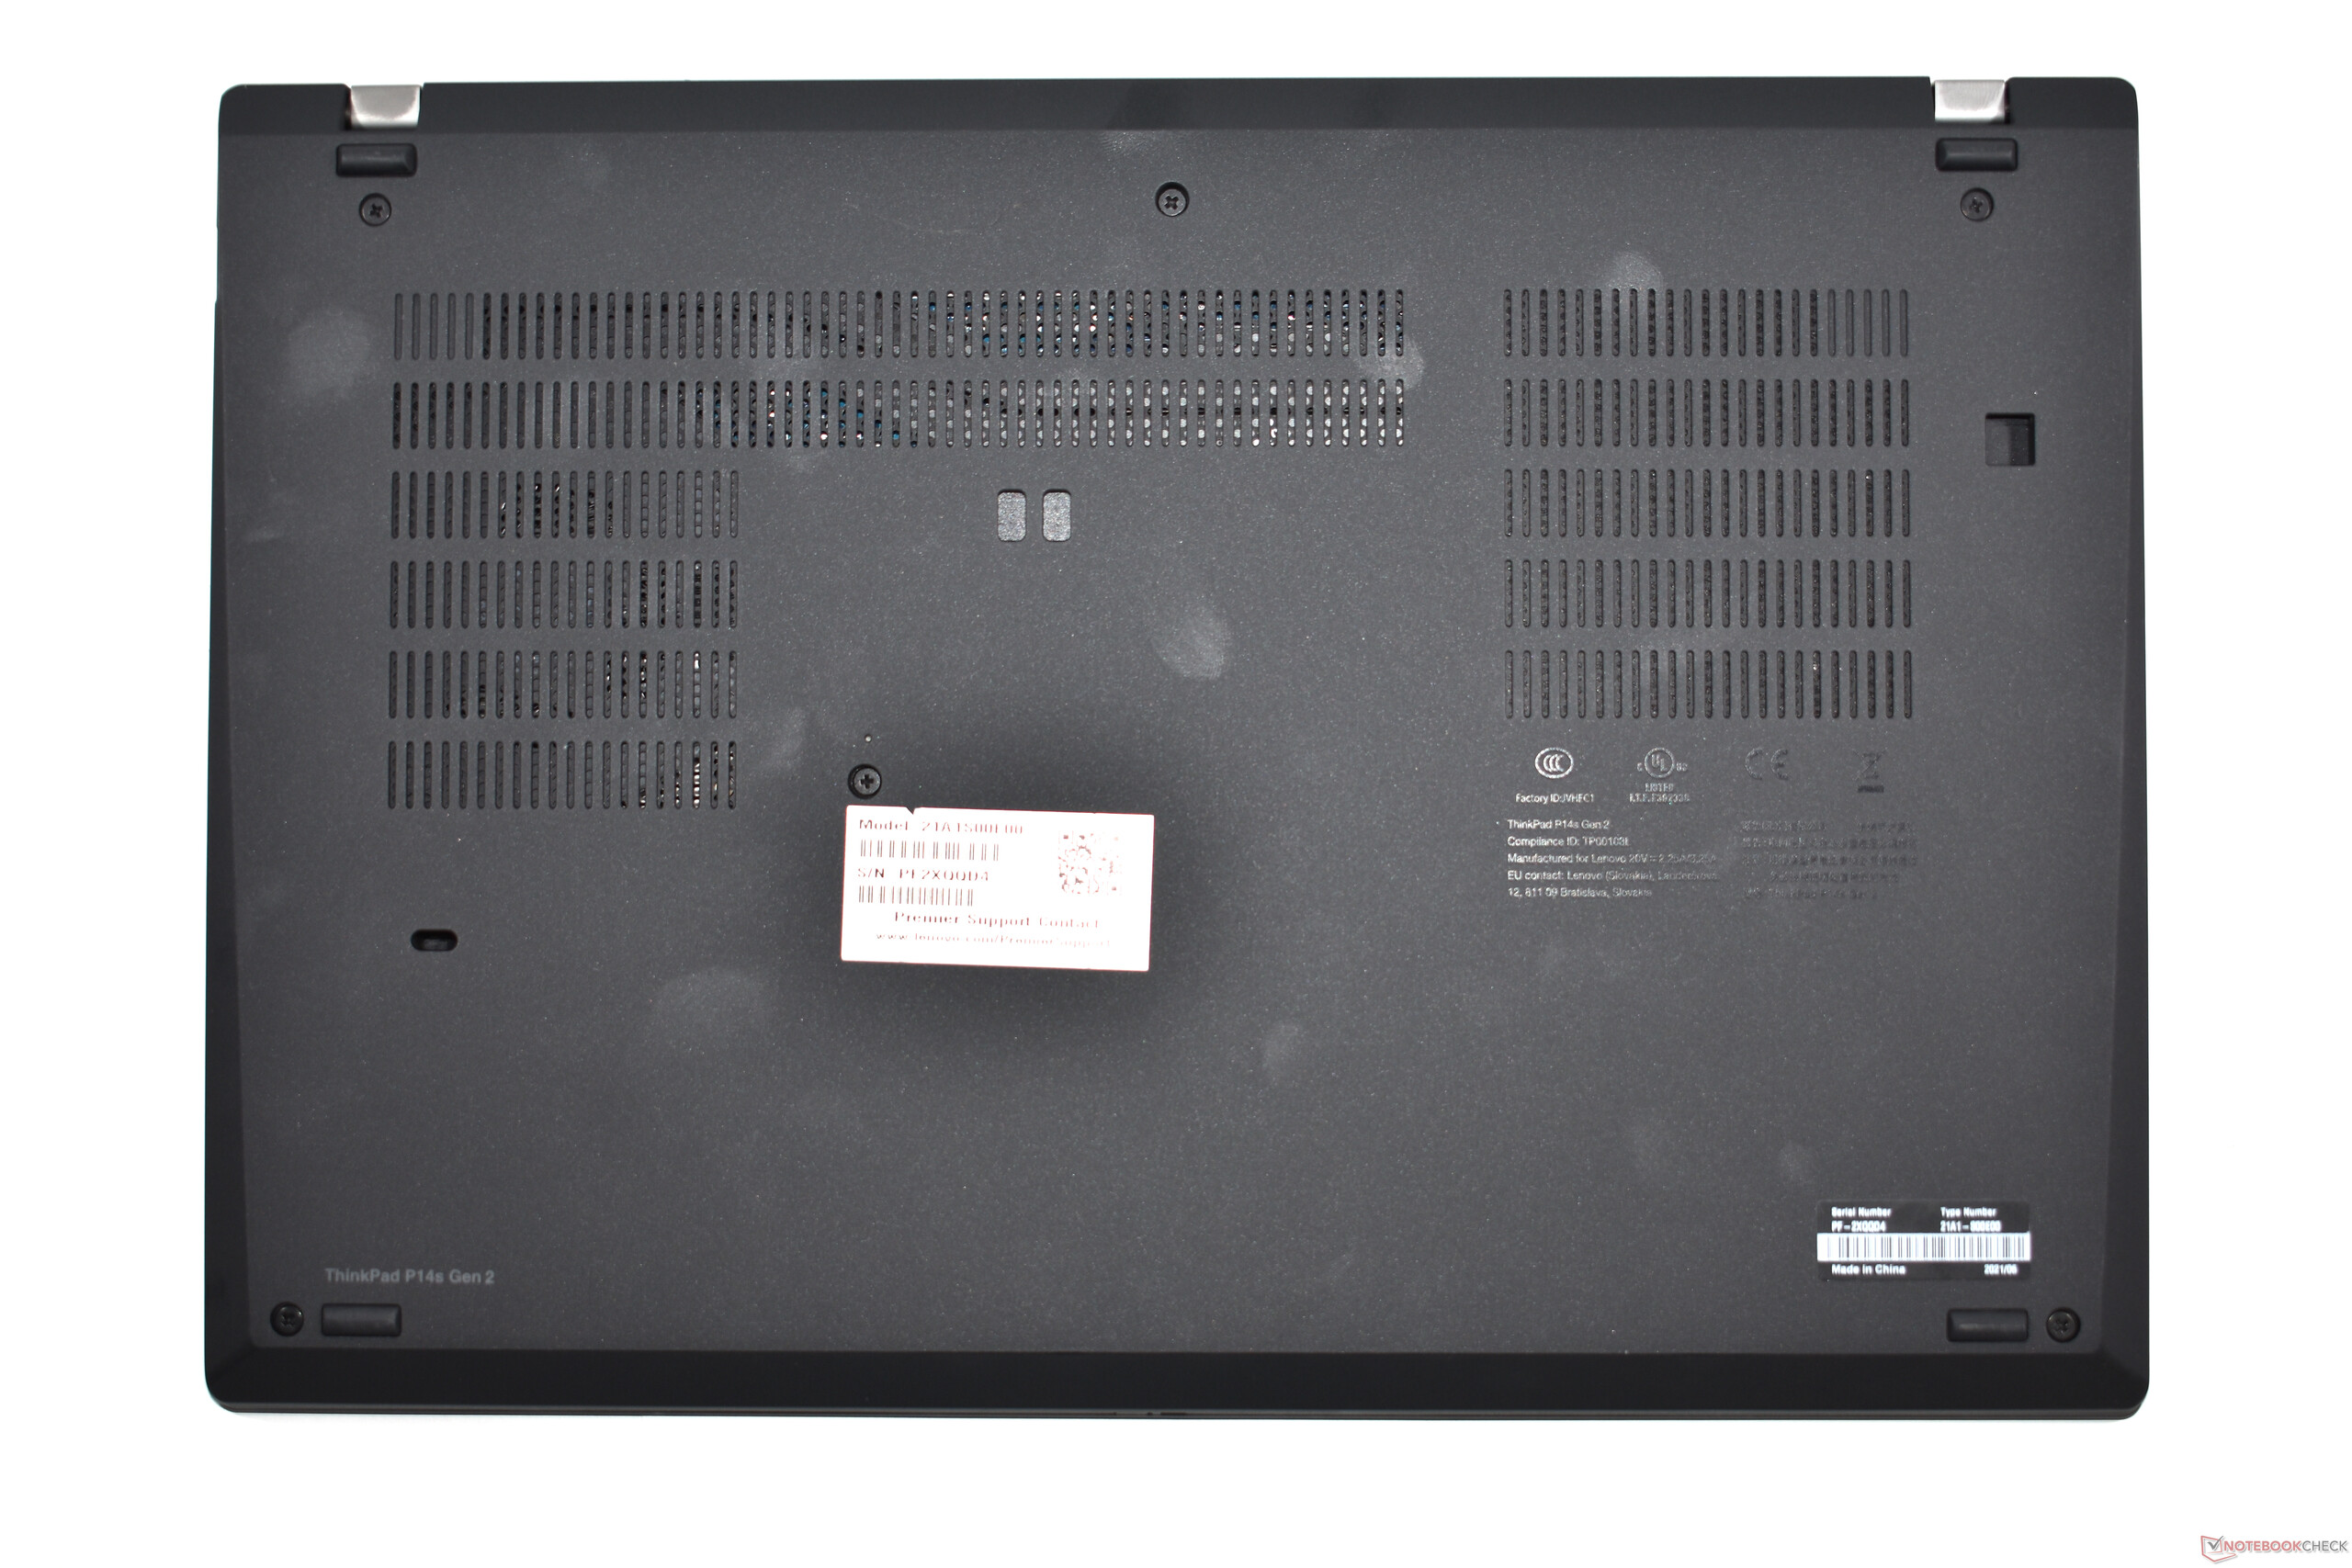
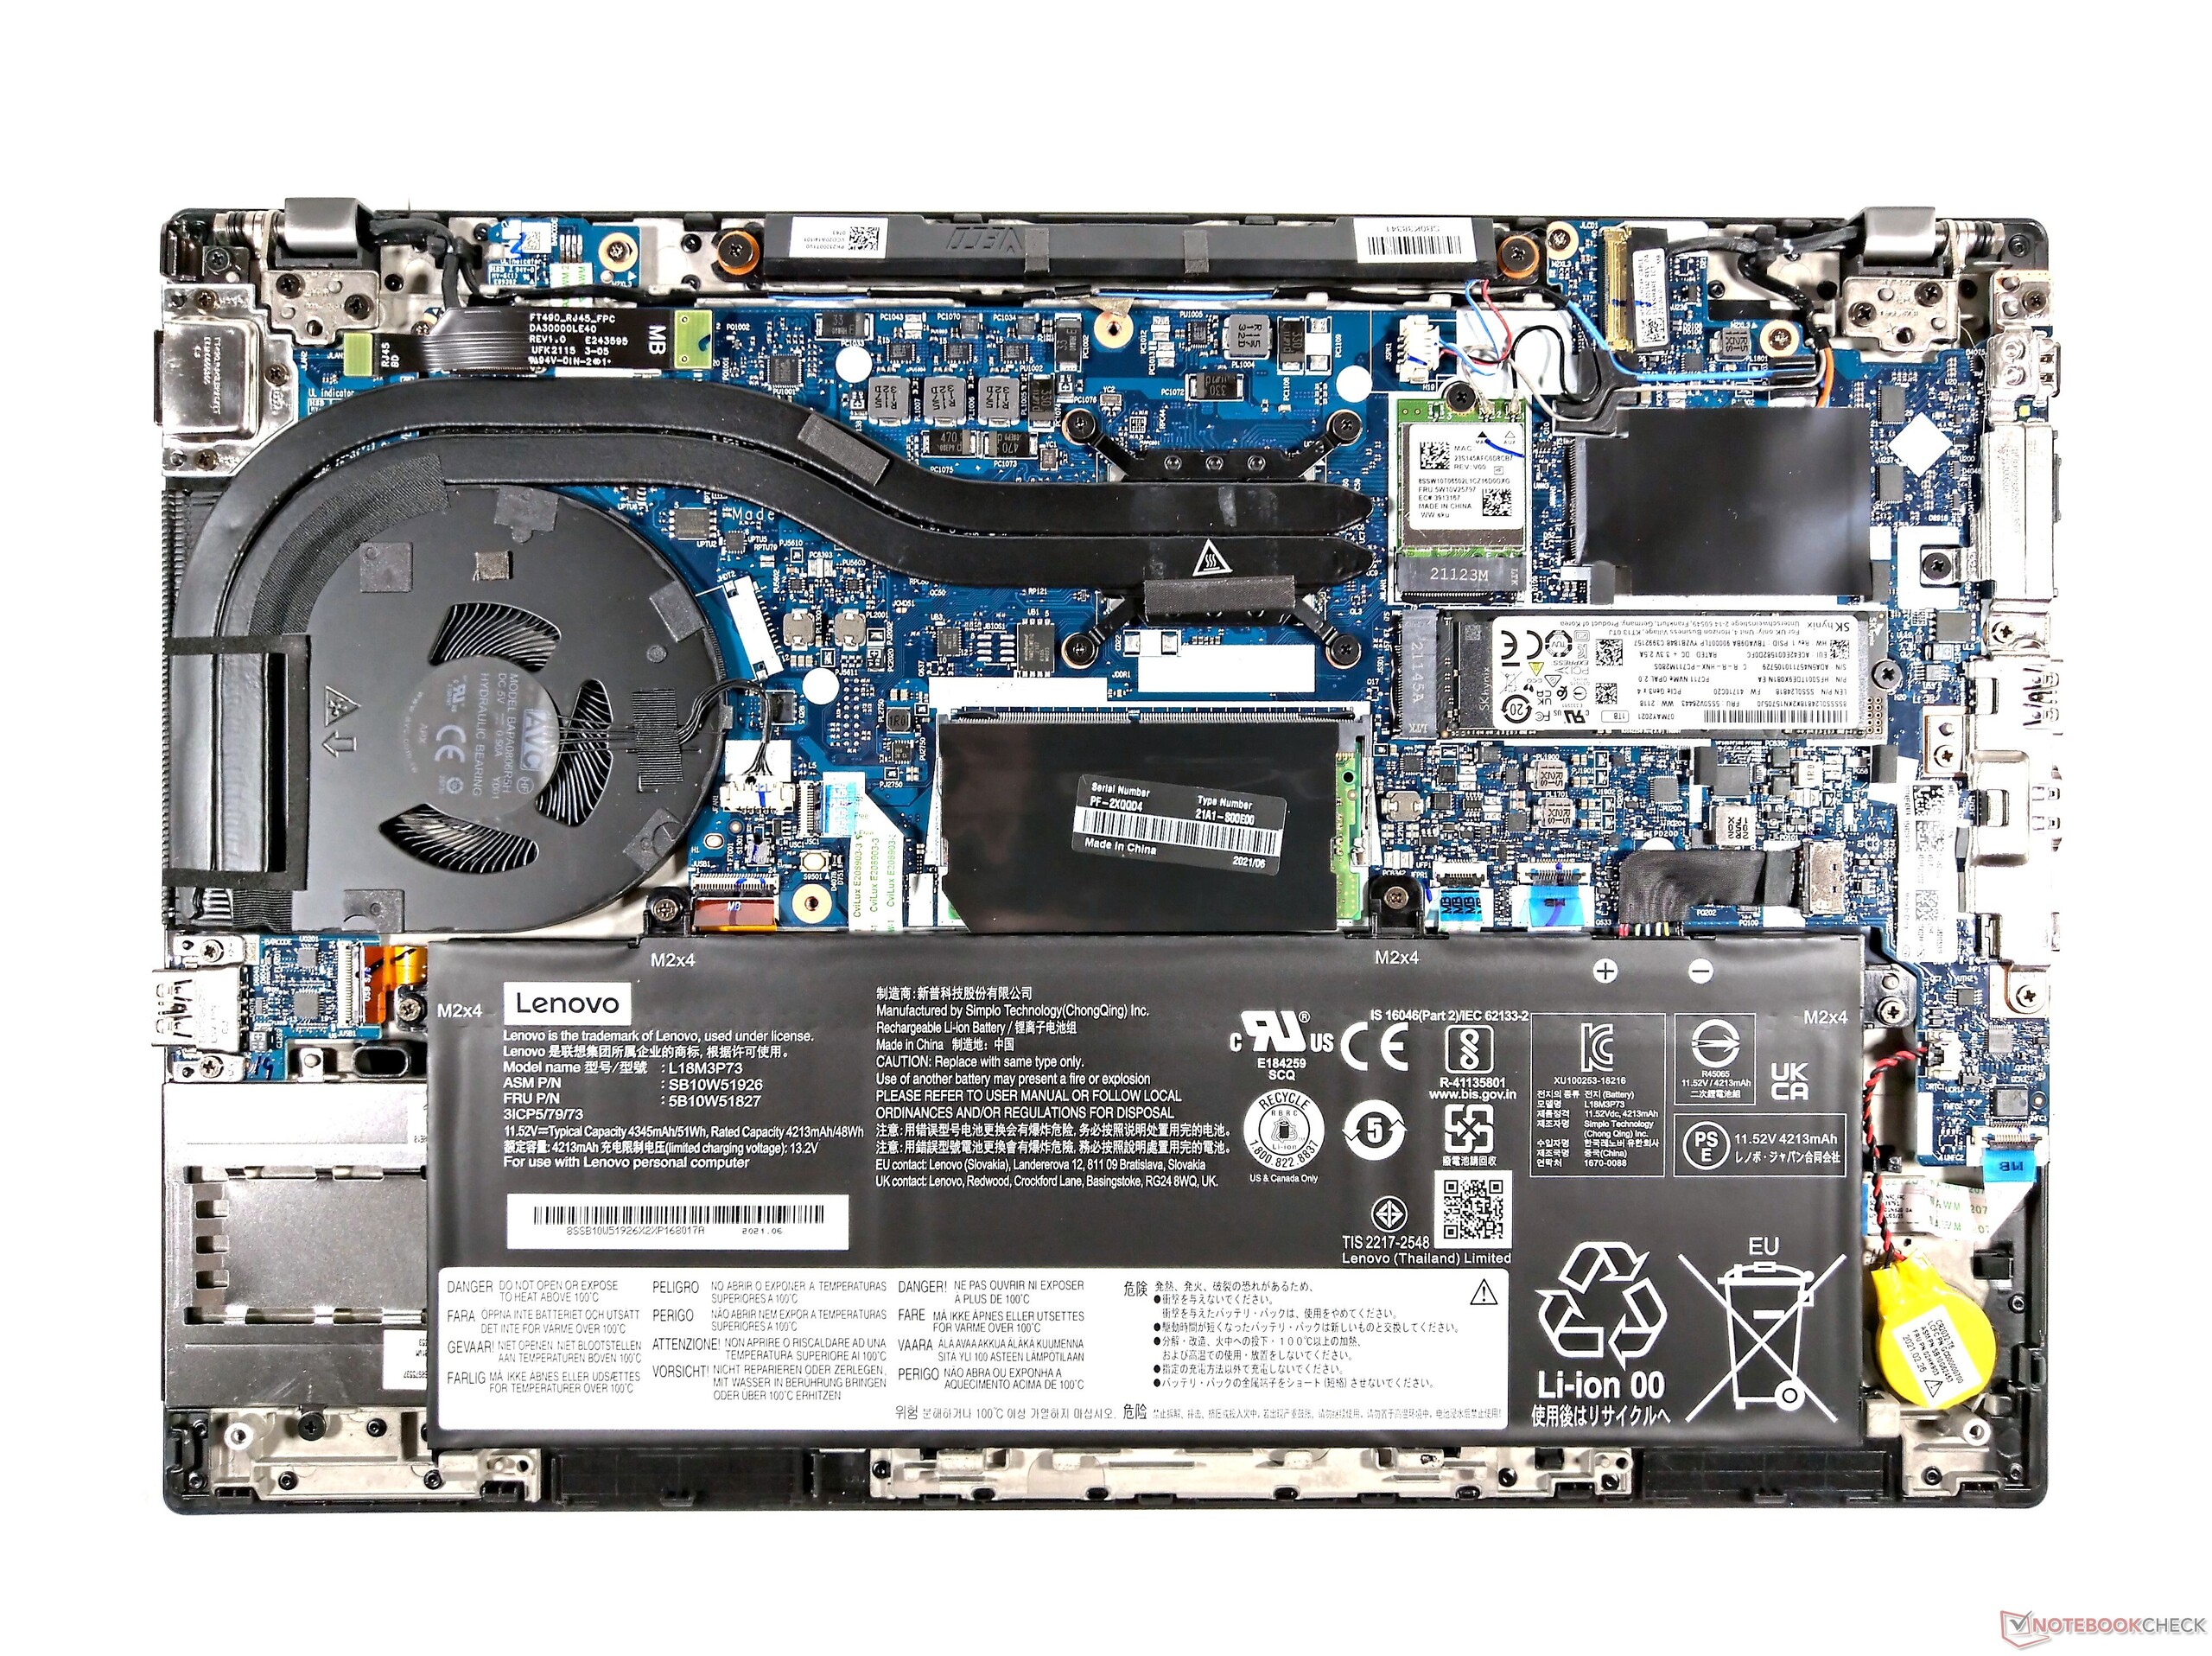
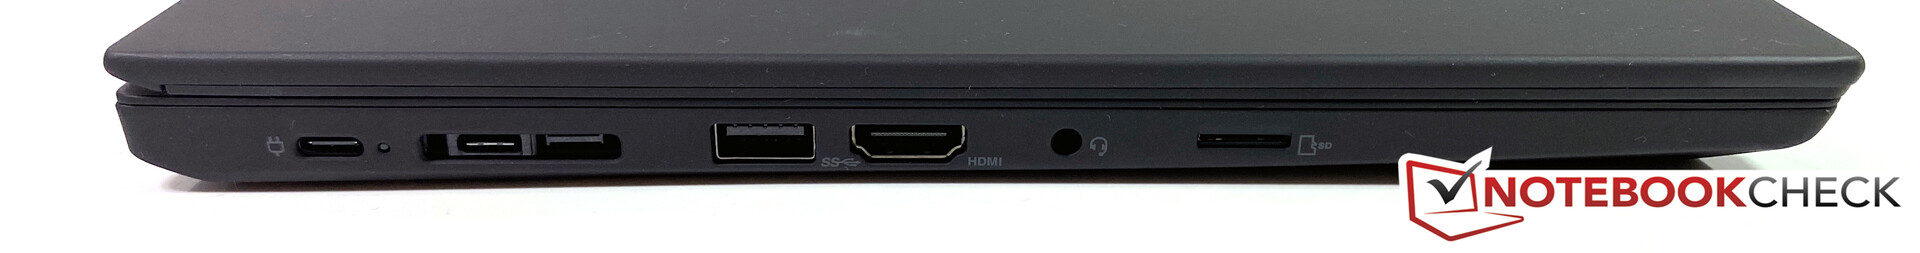
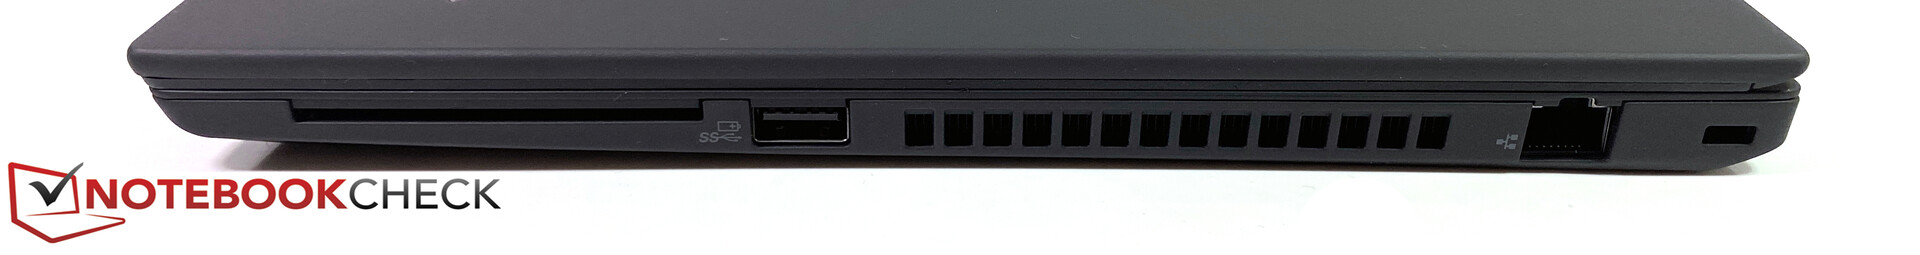
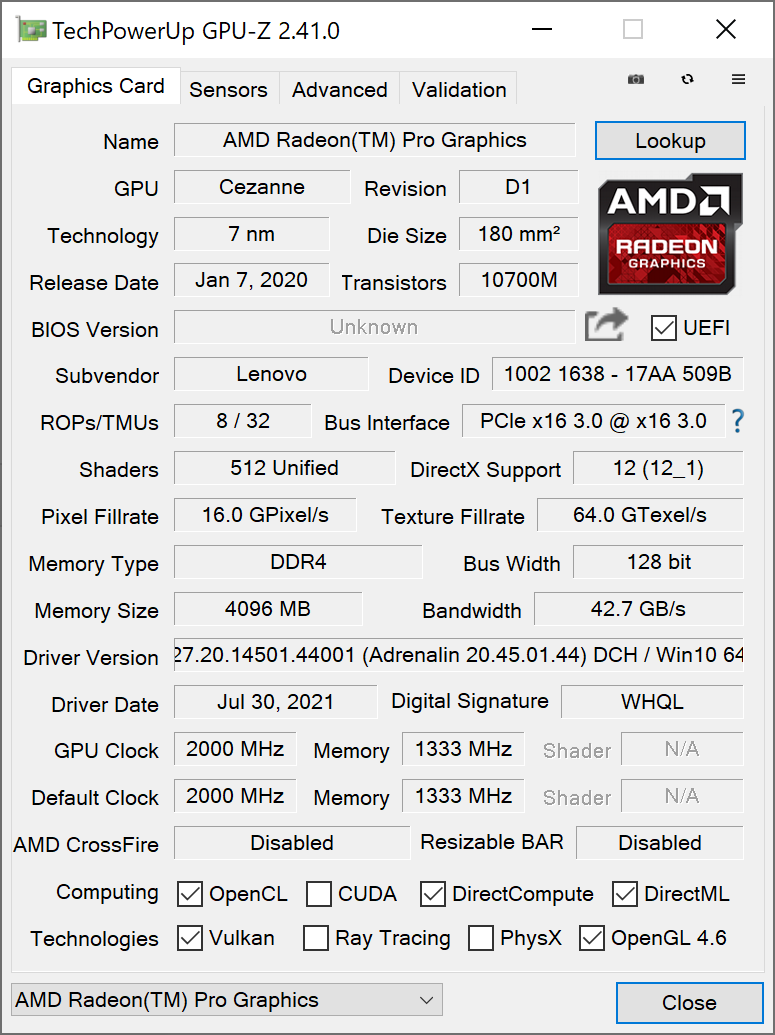
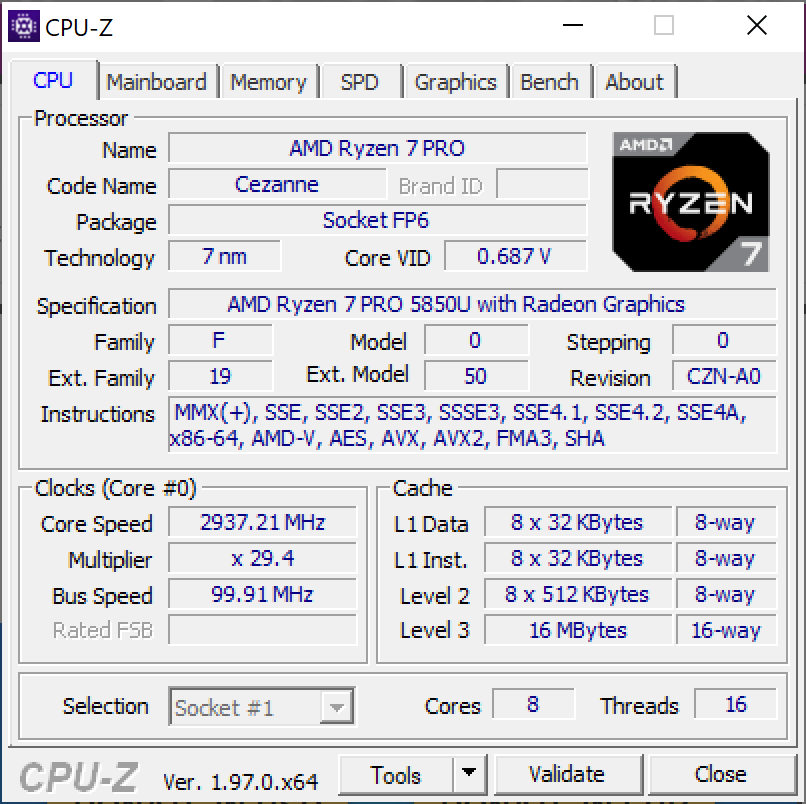
Med det har den största svagheten åtgärdats, vilket gör Lenovo ThinkPad P14s G2 AMD till en riktigt bra arbetsstation på instegsnivå. Den är särskilt ett bra val för program som fokuserar på CPU-prestanda. Däremot är GPU-prestandan en svaghet jämfört med andra arbetsstationer, precis som faktum att den saknar Thunderbolt. Vidare saknar P14s en SD-kortsläsare i full storlek, WiFi-kortet från Realtek är begränsande och den hade passat målgruppen mycket bättre om den kom med en skärm i 16:10-format.
En högupplöst skärm tillsammans med en AMD Ryzen CPU i en Lenovo ThinkPad - Lenovo ThinkPad P14s G2 AMD är verkligen den första Ryzen-utrustade ThinkPad-modellen som har en riktigt bra 4K UHD-skärm.
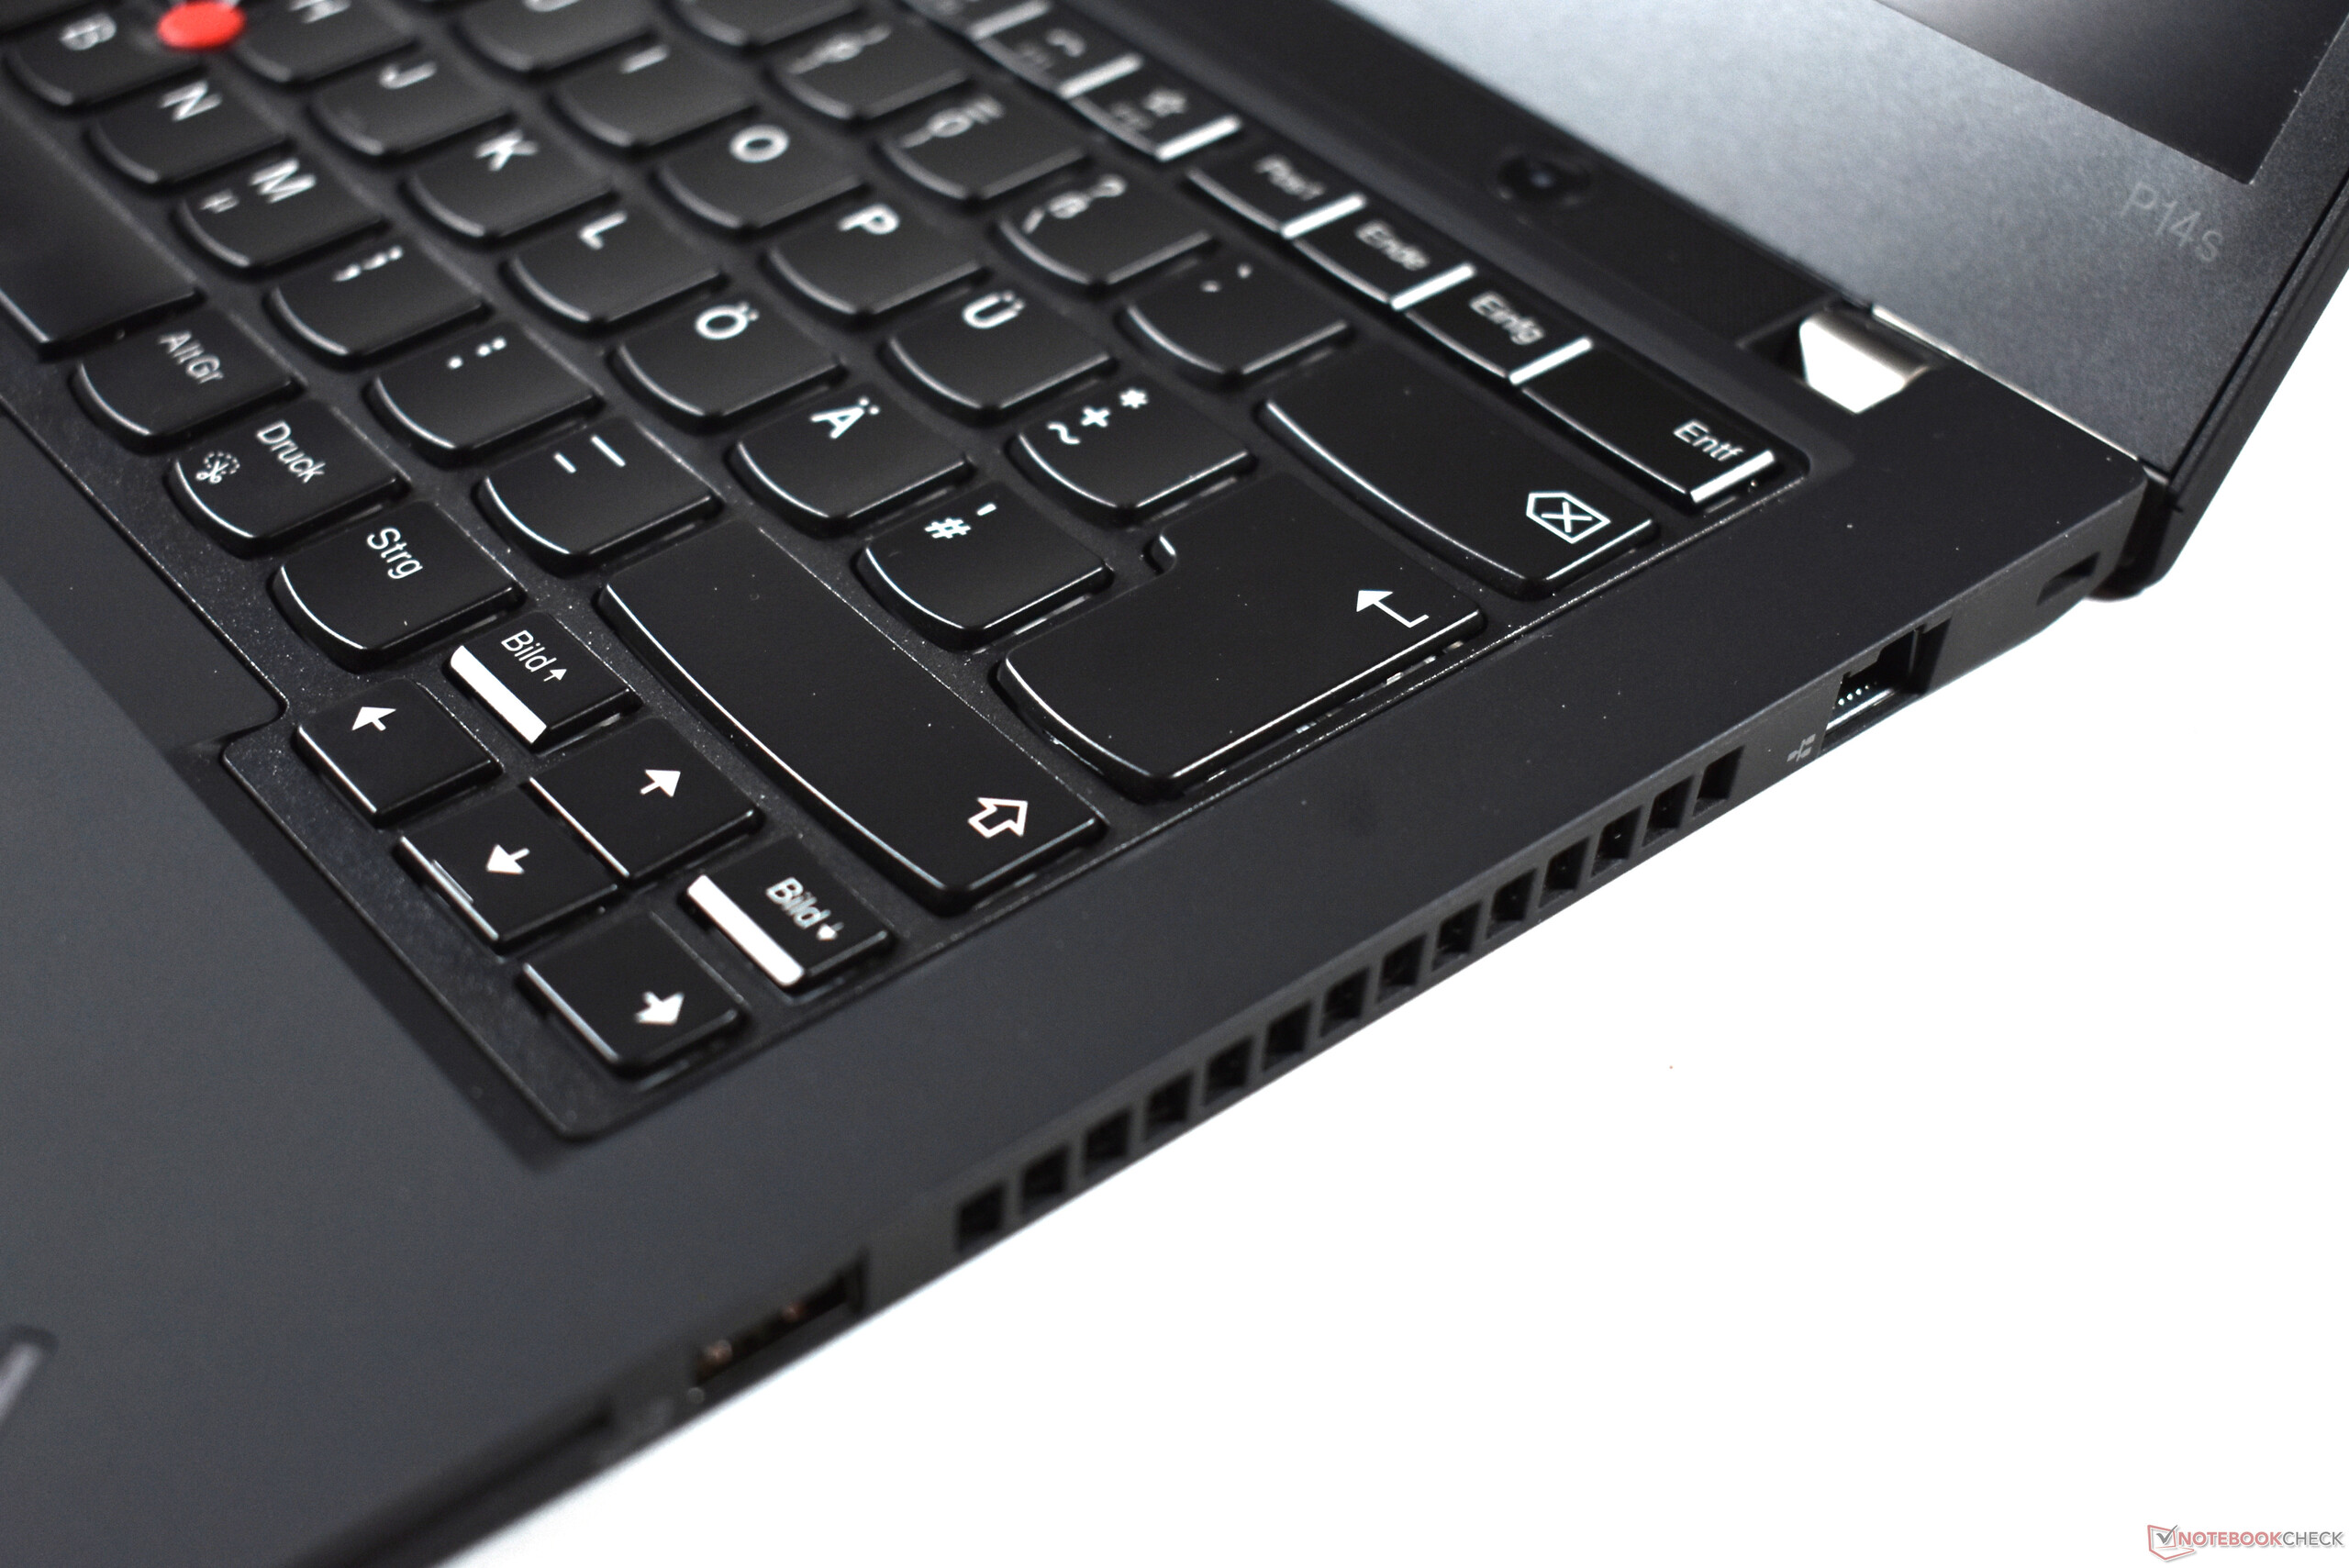
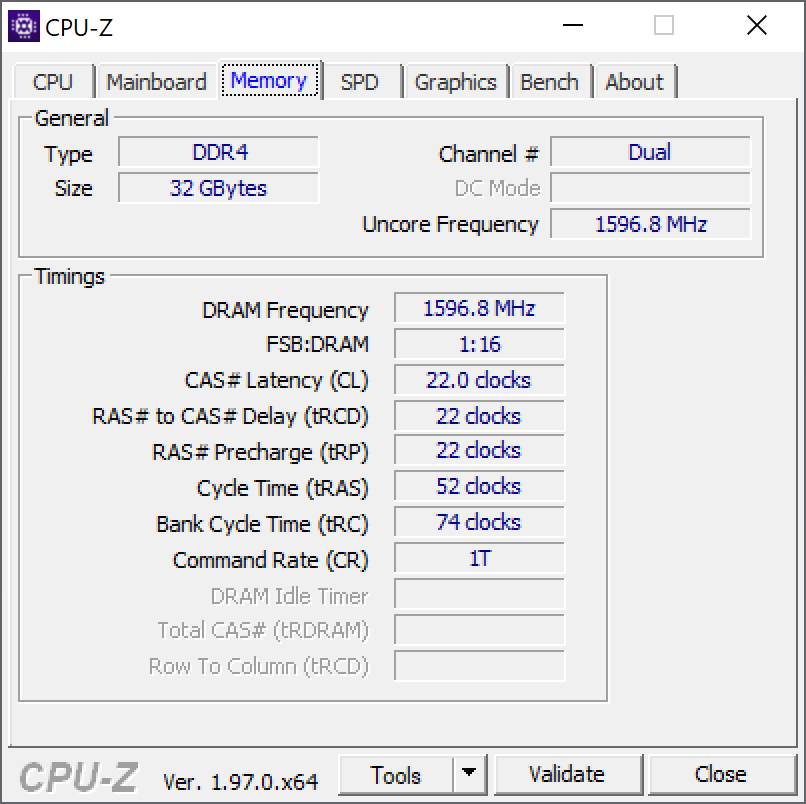
Även om detta är en nackdel jämfört med vissa nyare ThinkPad-modeller, som Lenovo ThinkPad X1 Carbon G9, är det gamla tangentbordet med 1.8 mm resväg en av de största styrkorna med den här laptopen. Jämfört med HP:s ZBook Firefly 14 G8 har ThinkPad P14s G2 AMD högre CPU-prestanda och möjlighet att utöka arbetsminnet, men ZBook har istället en aning högre grafikprestanda.
Lenovo ThinkPad P14s G2 AMD
- 09/17/2021 v7 (old)
Benjamin Herzig
Price comparison
