Test: Acer Predator Triton 500 (i7-8750H, RTX 2080 Max-Q) Laptop (Sammanfattning)
| |||||||||||||||||||||||||
Distribution av ljusstyrkan: 89 %
Mitt på batteriet: 304 cd/m²
Kontrast: 1126:1 (Svärta: 0.27 cd/m²)
ΔE ColorChecker Calman: 4.66 | ∀{0.5-29.43 Ø4.73}
calibrated: 1.72
ΔE Greyscale Calman: 5.53 | ∀{0.09-98 Ø4.97}
93% sRGB (Argyll 1.6.3 3D)
60% AdobeRGB 1998 (Argyll 1.6.3 3D)
65.7% AdobeRGB 1998 (Argyll 3D)
92.6% sRGB (Argyll 3D)
64.2% Display P3 (Argyll 3D)
Gamma: 2.5
CCT: 8028 K
| Acer Predator Triton 500 AU Optronics B156HAN08.2 (AUO82ED), IPS, 1920x1080 | Gigabyte Aero 15-X9 LGD05C0, IPS, 1920x1080 | Razer Blade 15 RTX 2070 Max-Q LG Philips LGD05C0, IPS, 1920x1080 | MSI GS65 8RF-019DE Stealth Thin AU Optronics B156HAN08.0 (AUO80ED), IPS, 1920x1080 | Asus Zephyrus S GX531GS AU Optronics B156HAN08.2 (AUO82ED), IPS, 1920x1080 | |
|---|---|---|---|---|---|
| Display | -1% | 2% | 1% | 1% | |
| Display P3 Coverage (%) | 64.2 | 63.5 -1% | 65.3 2% | 66.2 3% | 66.7 4% |
| sRGB Coverage (%) | 92.6 | 93.1 1% | 94.9 2% | 92.1 -1% | 91.2 -2% |
| AdobeRGB 1998 Coverage (%) | 65.7 | 64.5 -2% | 66.3 1% | 67.2 2% | 66.7 2% |
| Response Times | -63% | -57% | -67% | 9% | |
| Response Time Grey 50% / Grey 80% * (ms) | 8 ? | 16.4 ? -105% | 16.8 ? -110% | 17.6 ? -120% | 7.4 ? 7% |
| Response Time Black / White * (ms) | 11.2 ? | 13.6 ? -21% | 11.6 ? -4% | 12.8 ? -14% | 10 ? 11% |
| PWM Frequency (Hz) | |||||
| Screen | 15% | 7% | 14% | 11% | |
| Brightness middle (cd/m²) | 304 | 250 -18% | 314.7 4% | 254 -16% | 294 -3% |
| Brightness (cd/m²) | 299 | 235 -21% | 312 4% | 262 -12% | 275 -8% |
| Brightness Distribution (%) | 89 | 85 -4% | 90 1% | 89 0% | 84 -6% |
| Black Level * (cd/m²) | 0.27 | 0.29 -7% | 0.38 -41% | 0.22 19% | 0.24 11% |
| Contrast (:1) | 1126 | 862 -23% | 828 -26% | 1155 3% | 1225 9% |
| Colorchecker dE 2000 * | 4.66 | 1.46 69% | 2.56 45% | 2.37 49% | 2.57 45% |
| Colorchecker dE 2000 max. * | 9.65 | 2.47 74% | 4.89 49% | 4.71 51% | 4.88 49% |
| Colorchecker dE 2000 calibrated * | 1.72 | 1.71 1% | 1.84 -7% | 2.14 -24% | |
| Greyscale dE 2000 * | 5.53 | 1.27 77% | 3.4 39% | 1.58 71% | 2.41 56% |
| Gamma | 2.5 88% | 2.4 92% | 2.3 96% | 2.48 89% | 2.5 88% |
| CCT | 8028 81% | 6749 96% | 6435 101% | 6785 96% | 6370 102% |
| Color Space (Percent of AdobeRGB 1998) (%) | 60 | 60 0% | 60.7 1% | 60 0% | 59 -2% |
| Color Space (Percent of sRGB) (%) | 93 | 93 0% | 94.6 2% | 92 -1% | 91 -2% |
| Totalt genomsnitt (program/inställningar) | -16% /
1% | -16% /
-2% | -17% /
2% | 7% /
9% |
* ... mindre är bättre
Visa svarstider
| ↔ Svarstid svart till vitt | ||
|---|---|---|
| 11.2 ms ... stiga ↗ och falla ↘ kombinerat | ↗ 6 ms stiga | 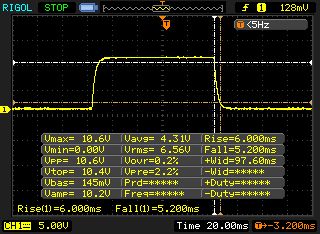 |
| ↘ 5.2 ms hösten | ||
| Skärmen visar bra svarsfrekvens i våra tester, men kan vara för långsam för konkurrenskraftiga spelare. I jämförelse sträcker sig alla testade enheter från 0.1 (minst) till 240 (maximalt) ms. » 30 % av alla enheter är bättre. Det betyder att den uppmätta svarstiden är bättre än genomsnittet av alla testade enheter (19.9 ms). | ||
| ↔ Svarstid 50 % grått till 80 % grått | ||
| 8 ms ... stiga ↗ och falla ↘ kombinerat | ↗ 4 ms stiga | 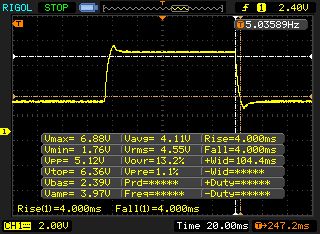 |
| ↘ 4 ms hösten | ||
| Skärmen visar snabba svarsfrekvenser i våra tester och bör passa för spel. I jämförelse sträcker sig alla testade enheter från 0.165 (minst) till 636 (maximalt) ms. » 21 % av alla enheter är bättre. Det betyder att den uppmätta svarstiden är bättre än genomsnittet av alla testade enheter (31.1 ms). | ||
Skärmflimmer / PWM (Puls-Width Modulation)
| Skärmflimmer / PWM upptäcktes inte | 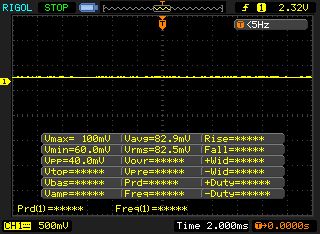 | ||
Som jämförelse: 52 % av alla testade enheter använder inte PWM för att dämpa skärmen. Om PWM upptäcktes mättes ett medelvärde av 7798 (minst: 5 - maximum: 343500) Hz. | |||
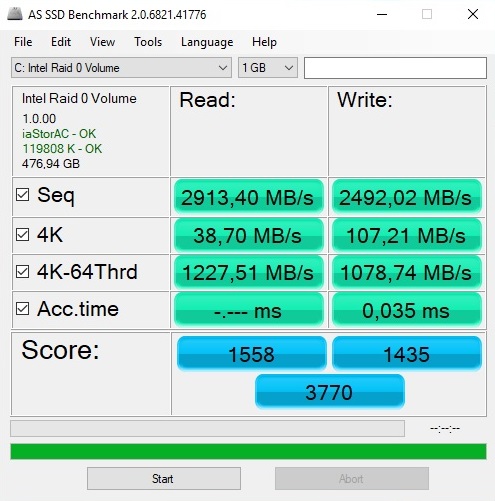
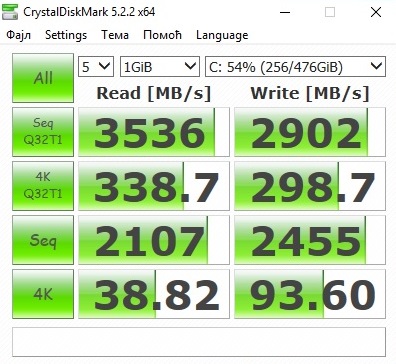
| Acer Predator Triton 500 2x WDC PC SN720 SDAPNTW-256G-1014 (RAID 0) | Gigabyte Aero 15-X9 Intel SSD 760p SSDPEKKW010T8 | Razer Blade 15 RTX 2070 Max-Q Samsung SSD PM981 MZVLB512HAJQ | MSI GS65 8RF-019DE Stealth Thin Samsung SSD PM981 MZVLB512HAJQ | Asus Zephyrus S GX531GS WDC PC SN520 SDAPNUW-512G | |
|---|---|---|---|---|---|
| AS SSD | -16% | 1% | -3% | -21% | |
| Score Total (Points) | 3770 | 2722 -28% | 4079 8% | 4122 9% | 3294 -13% |
| Seq Write (MB/s) | 2492 | 1471 -41% | 1822 -27% | 1834 -26% | 1261 -49% |
| Seq Read (MB/s) | 2913 | 2113 -27% | 1840 -37% | 1266 -57% | 903 -69% |
| 4K Write (MB/s) | 107.2 | 107.1 0% | 110.7 3% | 107.2 0% | 103.6 -3% |
| 4K Read (MB/s) | 38.7 | 55 42% | 52.3 35% | 48.94 26% | 40.02 3% |
| Score Write (Points) | 1435 | 957 -33% | 2010 40% | 2051 43% | 1515 6% |
| Score Read (Points) | 1558 | 1180 -24% | 1362 -13% | 1346 -14% | 1161 -25% |

| 3DMark 11 Performance | 20149 poäng | |
Hjälp | ||
| The Witcher 3 | |
| 1920x1080 High Graphics & Postprocessing (Nvidia HairWorks Off) | |
| Genomsnitt av klass Gaming (181 - 341, n=3, senaste 2 åren) | |
| Acer Predator Triton 500 | |
| Razer Blade 15 RTX 2070 Max-Q | |
| MSI GS65 8RF-019DE Stealth Thin | |
| Asus Zephyrus S GX531GS | |
| Gigabyte Aero 15-X9 | |
| 1920x1080 Ultra Graphics & Postprocessing (HBAO+) | |
| Genomsnitt av klass Gaming (95 - 240, n=8, senaste 2 åren) | |
| Acer Predator Triton 500 | |
| Razer Blade 15 RTX 2070 Max-Q | |
| Gigabyte Aero 15-X9 | |
| MSI GS65 8RF-019DE Stealth Thin | |
| Asus Zephyrus S GX531GS | |
| låg | med. | hög | ultra | |
|---|---|---|---|---|
| The Witcher 3 (2015) | 136 | 76.5 | ||
| Battlefield 1 (2016) | 134 | 129 | ||
| Assassin´s Creed Origins (2017) | 65 | 62 |
Ljudnivå
| Låg belastning |
| 30 / 32 / 34 dB(A) |
| Hög belastning |
| 44 / 47 dB(A) |
 | ||
30 dB tyst 40 dB(A) hörbar 50 dB(A) högt ljud |
||
min: | ||
| Acer Predator Triton 500 GeForce RTX 2080 Max-Q, i7-8750H | Gigabyte Aero 15-X9 GeForce RTX 2070 Max-Q, i7-8750H | Razer Blade 15 RTX 2070 Max-Q GeForce RTX 2070 Max-Q, i7-8750H | MSI GS65 8RF-019DE Stealth Thin GeForce GTX 1070 Max-Q, i7-8750H | Asus Zephyrus S GX531GS GeForce GTX 1070 Max-Q, i7-8750H | Genomsnitt av klass Gaming | |
|---|---|---|---|---|---|---|
| Noise | -2% | 9% | 2% | -9% | 7% | |
| av / miljö * (dB) | 29 | 30 -3% | 28.8 1% | 30 -3% | 29 -0% | 24.1 ? 17% |
| Idle Minimum * (dB) | 30 | 32 -7% | 28.8 4% | 30 -0% | 33 -10% | 25.8 ? 14% |
| Idle Average * (dB) | 32 | 34 -6% | 28.8 10% | 31 3% | 34 -6% | 27.4 ? 14% |
| Idle Maximum * (dB) | 34 | 36 -6% | 29.4 14% | 34 -0% | 40 -18% | 30 ? 12% |
| Load Average * (dB) | 44 | 42 5% | 35.7 19% | 43 2% | 47 -7% | 43 ? 2% |
| Witcher 3 ultra * (dB) | 46 | 44 4% | 42.5 8% | 42 9% | 51 -11% | |
| Load Maximum * (dB) | 47 | 48 -2% | 45 4% | 44 6% | 53 -13% | 54 ? -15% |
* ... mindre är bättre
(-) Den maximala temperaturen på ovansidan är 49 °C / 120 F, jämfört med genomsnittet av 40.4 °C / 105 F , allt från 21.2 till 68.8 °C för klassen Gaming.
(-) Botten värms upp till maximalt 58 °C / 136 F, jämfört med genomsnittet av 43.2 °C / 110 F
(+) Vid tomgångsbruk är medeltemperaturen för ovansidan 30.2 °C / 86 F, jämfört med enhetsgenomsnittet på 33.9 °C / ### class_avg_f### F.
(-) När du spelar The Witcher 3 är medeltemperaturen för ovansidan 42.8 °C / 109 F, jämfört med enhetsgenomsnittet på 33.9 °C / ## #class_avg_f### F.
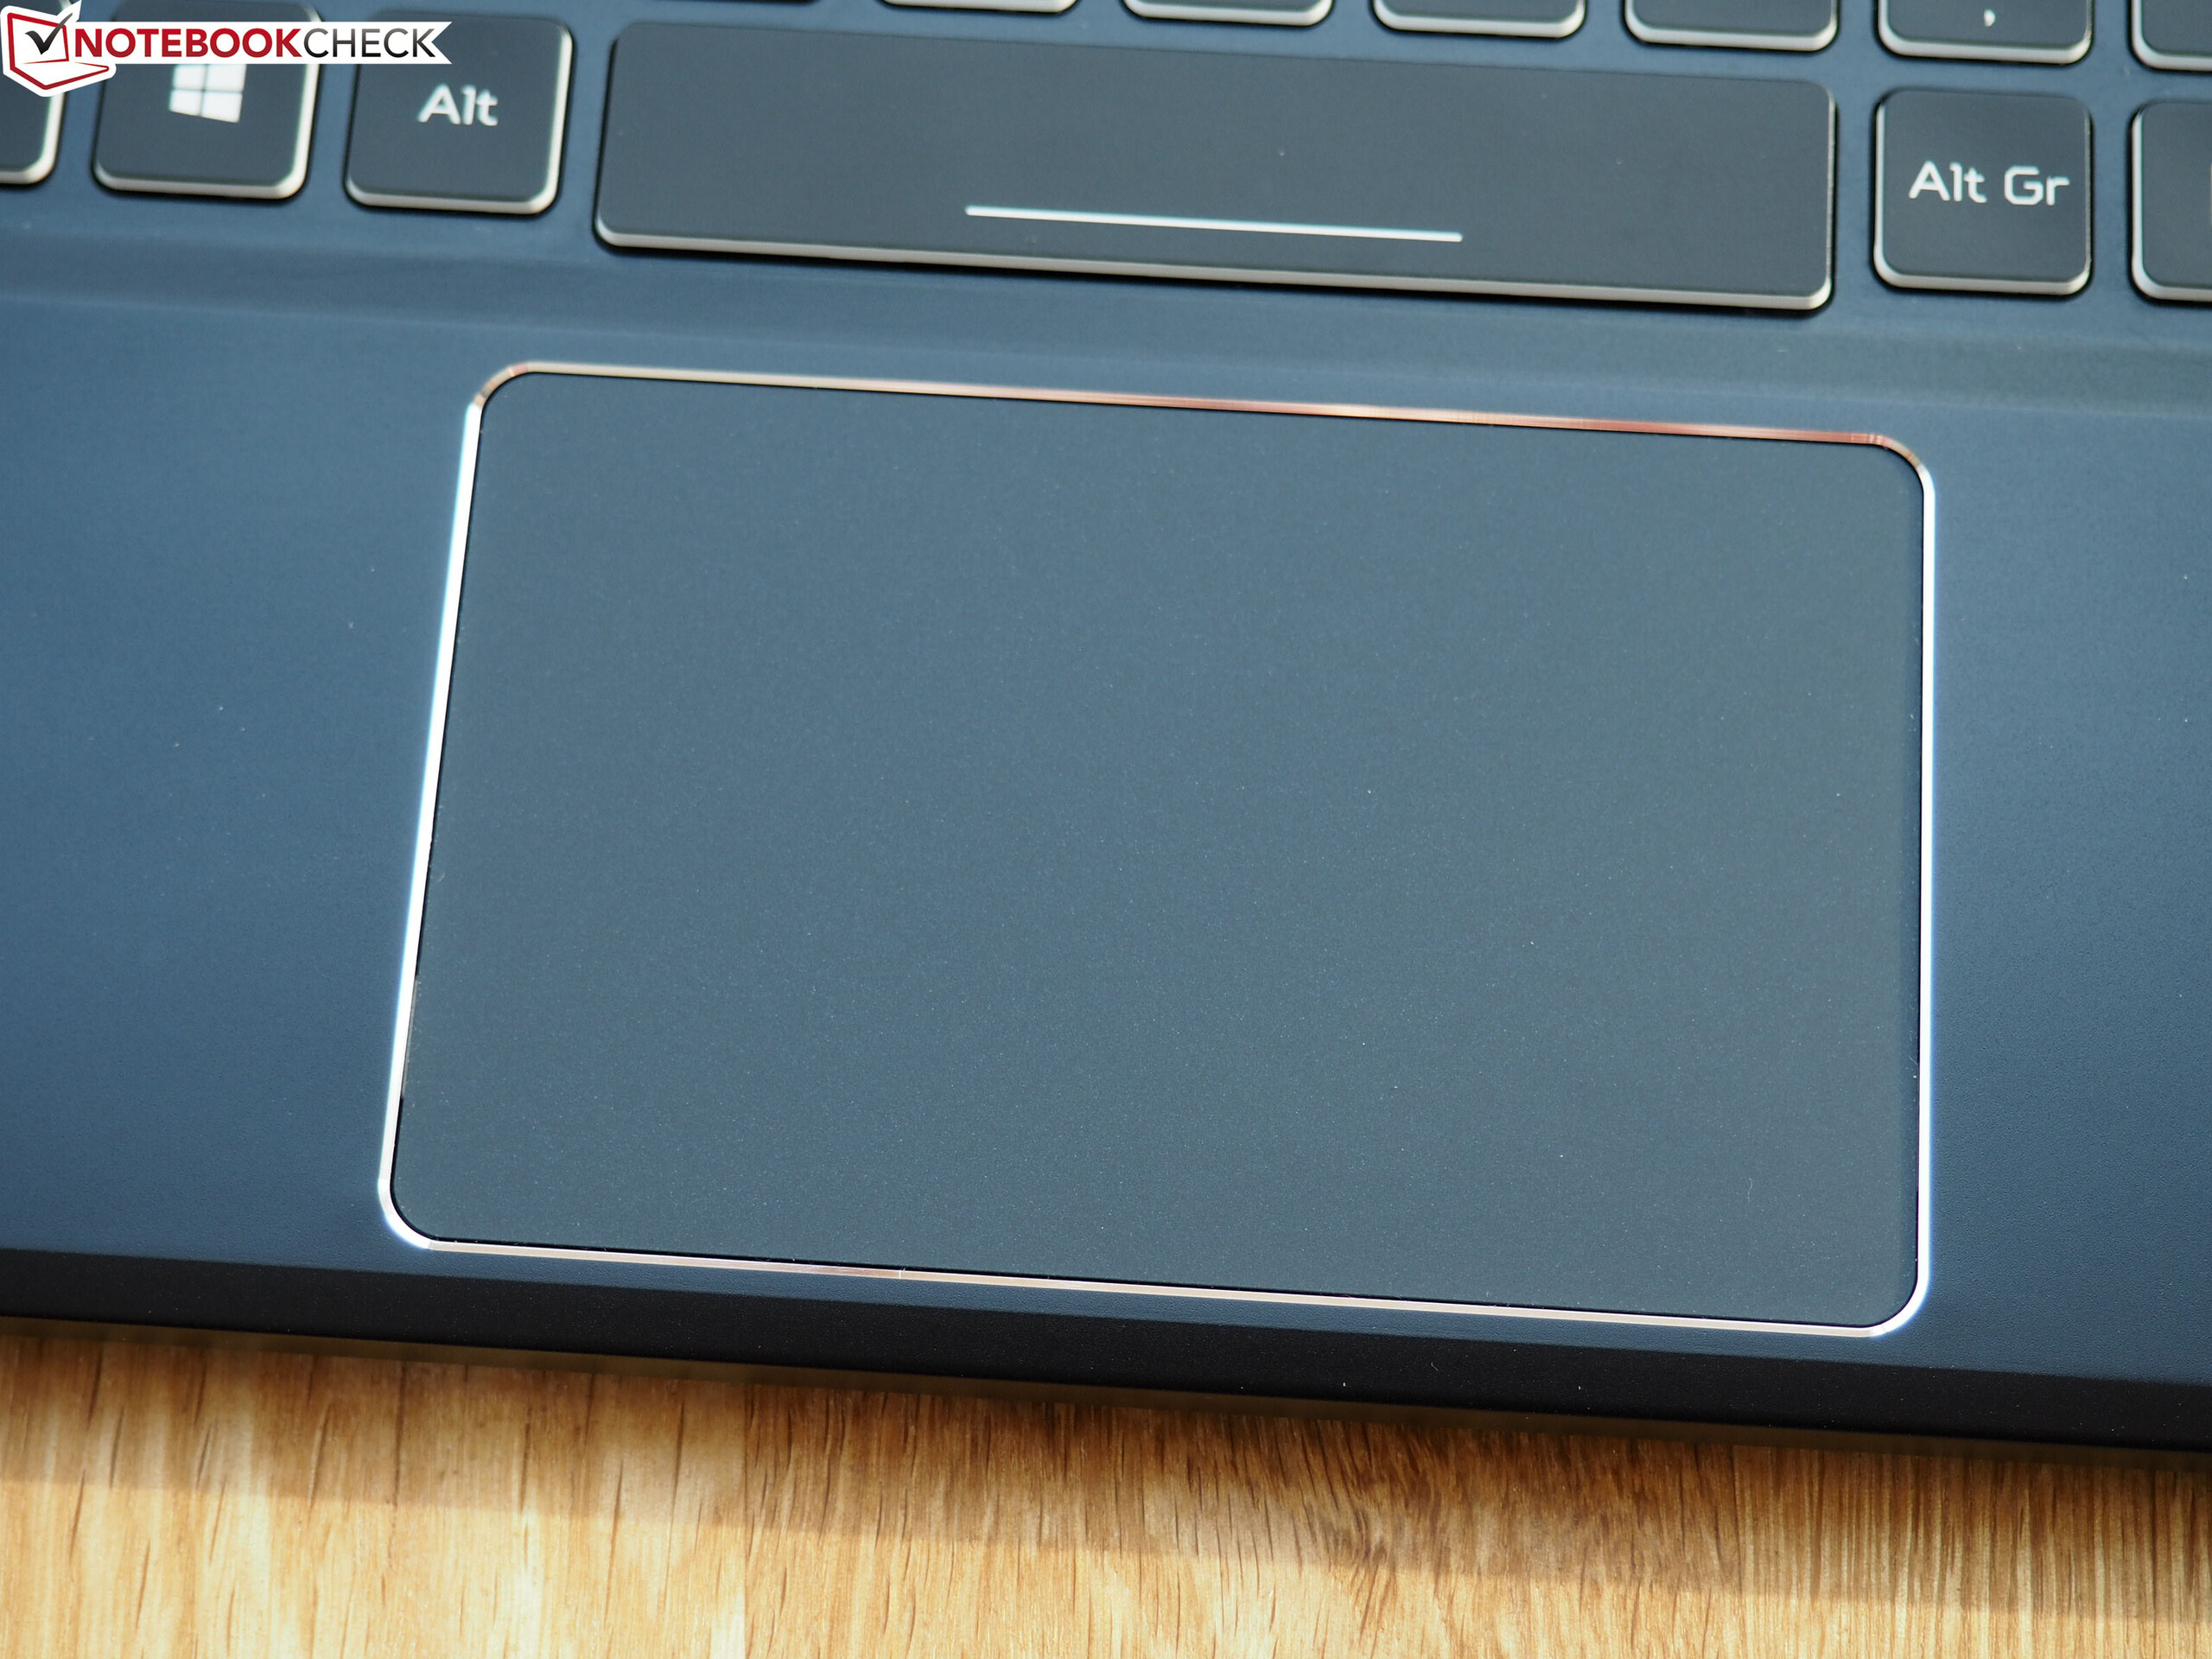
(±) Handledsstöden och pekplattan kan bli väldigt varma vid beröring med maximalt 39 °C / 102.2 F.
(-) Medeltemperaturen för handledsstödsområdet på liknande enheter var 28.8 °C / 83.8 F (-10.2 °C / -18.4 F).
| Acer Predator Triton 500 GeForce RTX 2080 Max-Q, i7-8750H | Gigabyte Aero 15-X9 GeForce RTX 2070 Max-Q, i7-8750H | Razer Blade 15 RTX 2070 Max-Q GeForce RTX 2070 Max-Q, i7-8750H | MSI GS65 8RF-019DE Stealth Thin GeForce GTX 1070 Max-Q, i7-8750H | Asus Zephyrus S GX531GS GeForce GTX 1070 Max-Q, i7-8750H | Genomsnitt av klass Gaming | |
|---|---|---|---|---|---|---|
| Heat | 2% | 14% | 11% | 1% | 7% | |
| Maximum Upper Side * (°C) | 49 | 56 -14% | 49 -0% | 49 -0% | 54 -10% | 45.2 ? 8% |
| Maximum Bottom * (°C) | 58 | 66 -14% | 49 16% | 63 -9% | 60 -3% | 48 ? 17% |
| Idle Upper Side * (°C) | 33 | 27 18% | 25.4 23% | 24 27% | 30 9% | 31.1 ? 6% |
| Idle Bottom * (°C) | 33 | 27 18% | 27.2 18% | 25 24% | 30 9% | 34.2 ? -4% |
* ... mindre är bättre
Acer Predator Triton 500 ljudanalys
(±) | högtalarljudstyrkan är genomsnittlig men bra (81 dB)
Bas 100 - 315 Hz
(±) | reducerad bas - i genomsnitt 13% lägre än medianen
(±) | linjäriteten för basen är genomsnittlig (12.3% delta till föregående frekvens)
Mellan 400 - 2000 Hz
(+) | balanserad mellan - endast 3.8% från medianen
(+) | mids är linjära (5.3% delta till föregående frekvens)
Högsta 2 - 16 kHz
(+) | balanserade toppar - endast 2.3% från medianen
(+) | toppar är linjära (4.7% delta till föregående frekvens)
Totalt 100 - 16 000 Hz
(+) | det totala ljudet är linjärt (14.5% skillnad mot median)
Jämfört med samma klass
» 27% av alla testade enheter i den här klassen var bättre, 7% liknande, 66% sämre
» Den bästa hade ett delta på 6%, genomsnittet var 18%, sämst var 132%
Jämfört med alla testade enheter
» 18% av alla testade enheter var bättre, 4% liknande, 78% sämre
» Den bästa hade ett delta på 4%, genomsnittet var 24%, sämst var 134%
Acer Predator Triton 700 ljudanalys
(+) | högtalare kan spela relativt högt (83 dB)
Bas 100 - 315 Hz
(-) | nästan ingen bas - i genomsnitt 15.2% lägre än medianen
(±) | linjäriteten för basen är genomsnittlig (10.1% delta till föregående frekvens)
Mellan 400 - 2000 Hz
(±) | högre mellan - i genomsnitt 8% högre än median
(+) | mids är linjära (6.7% delta till föregående frekvens)
Högsta 2 - 16 kHz
(+) | balanserade toppar - endast 2% från medianen
(+) | toppar är linjära (4.9% delta till föregående frekvens)
Totalt 100 - 16 000 Hz
(±) | linjäriteten för det totala ljudet är genomsnittlig (19.9% skillnad mot median)
Jämfört med samma klass
» 70% av alla testade enheter i den här klassen var bättre, 6% liknande, 24% sämre
» Den bästa hade ett delta på 6%, genomsnittet var 18%, sämst var 132%
Jämfört med alla testade enheter
» 51% av alla testade enheter var bättre, 7% liknande, 42% sämre
» Den bästa hade ett delta på 4%, genomsnittet var 24%, sämst var 134%
| Av/Standby | |
| Låg belastning | |
| Hög belastning |
|
Förklaring:
min: | |
| Acer Predator Triton 500 GeForce RTX 2080 Max-Q, i7-8750H | Gigabyte Aero 15-X9 GeForce RTX 2070 Max-Q, i7-8750H | Razer Blade 15 RTX 2070 Max-Q GeForce RTX 2070 Max-Q, i7-8750H | MSI GS65 8RF-019DE Stealth Thin GeForce GTX 1070 Max-Q, i7-8750H | Asus Zephyrus S GX531GS GeForce GTX 1070 Max-Q, i7-8750H | Genomsnitt av klass Gaming | |
|---|---|---|---|---|---|---|
| Power Consumption | 11% | 18% | 23% | -7% | -3% | |
| Idle Minimum * (Watt) | 16 | 16 -0% | 10.4 35% | 7 56% | 17 -6% | 13.2 ? 17% |
| Idle Average * (Watt) | 22 | 18 18% | 14.6 34% | 11 50% | 20 9% | 18.9 ? 14% |
| Idle Maximum * (Watt) | 32 | 23 28% | 16.3 49% | 20 37% | 29 9% | 24.3 ? 24% |
| Load Average * (Watt) | 89 | 88 1% | 88.5 1% | 98 -10% | 112 -26% | 108 ? -21% |
| Witcher 3 ultra * (Watt) | 147 | 120 18% | 155.4 -6% | 132 10% | 152 -3% | |
| Load Maximum * (Watt) | 173 | 167 3% | 182.4 -5% | 182 -5% | 211 -22% | 254 ? -47% |
* ... mindre är bättre
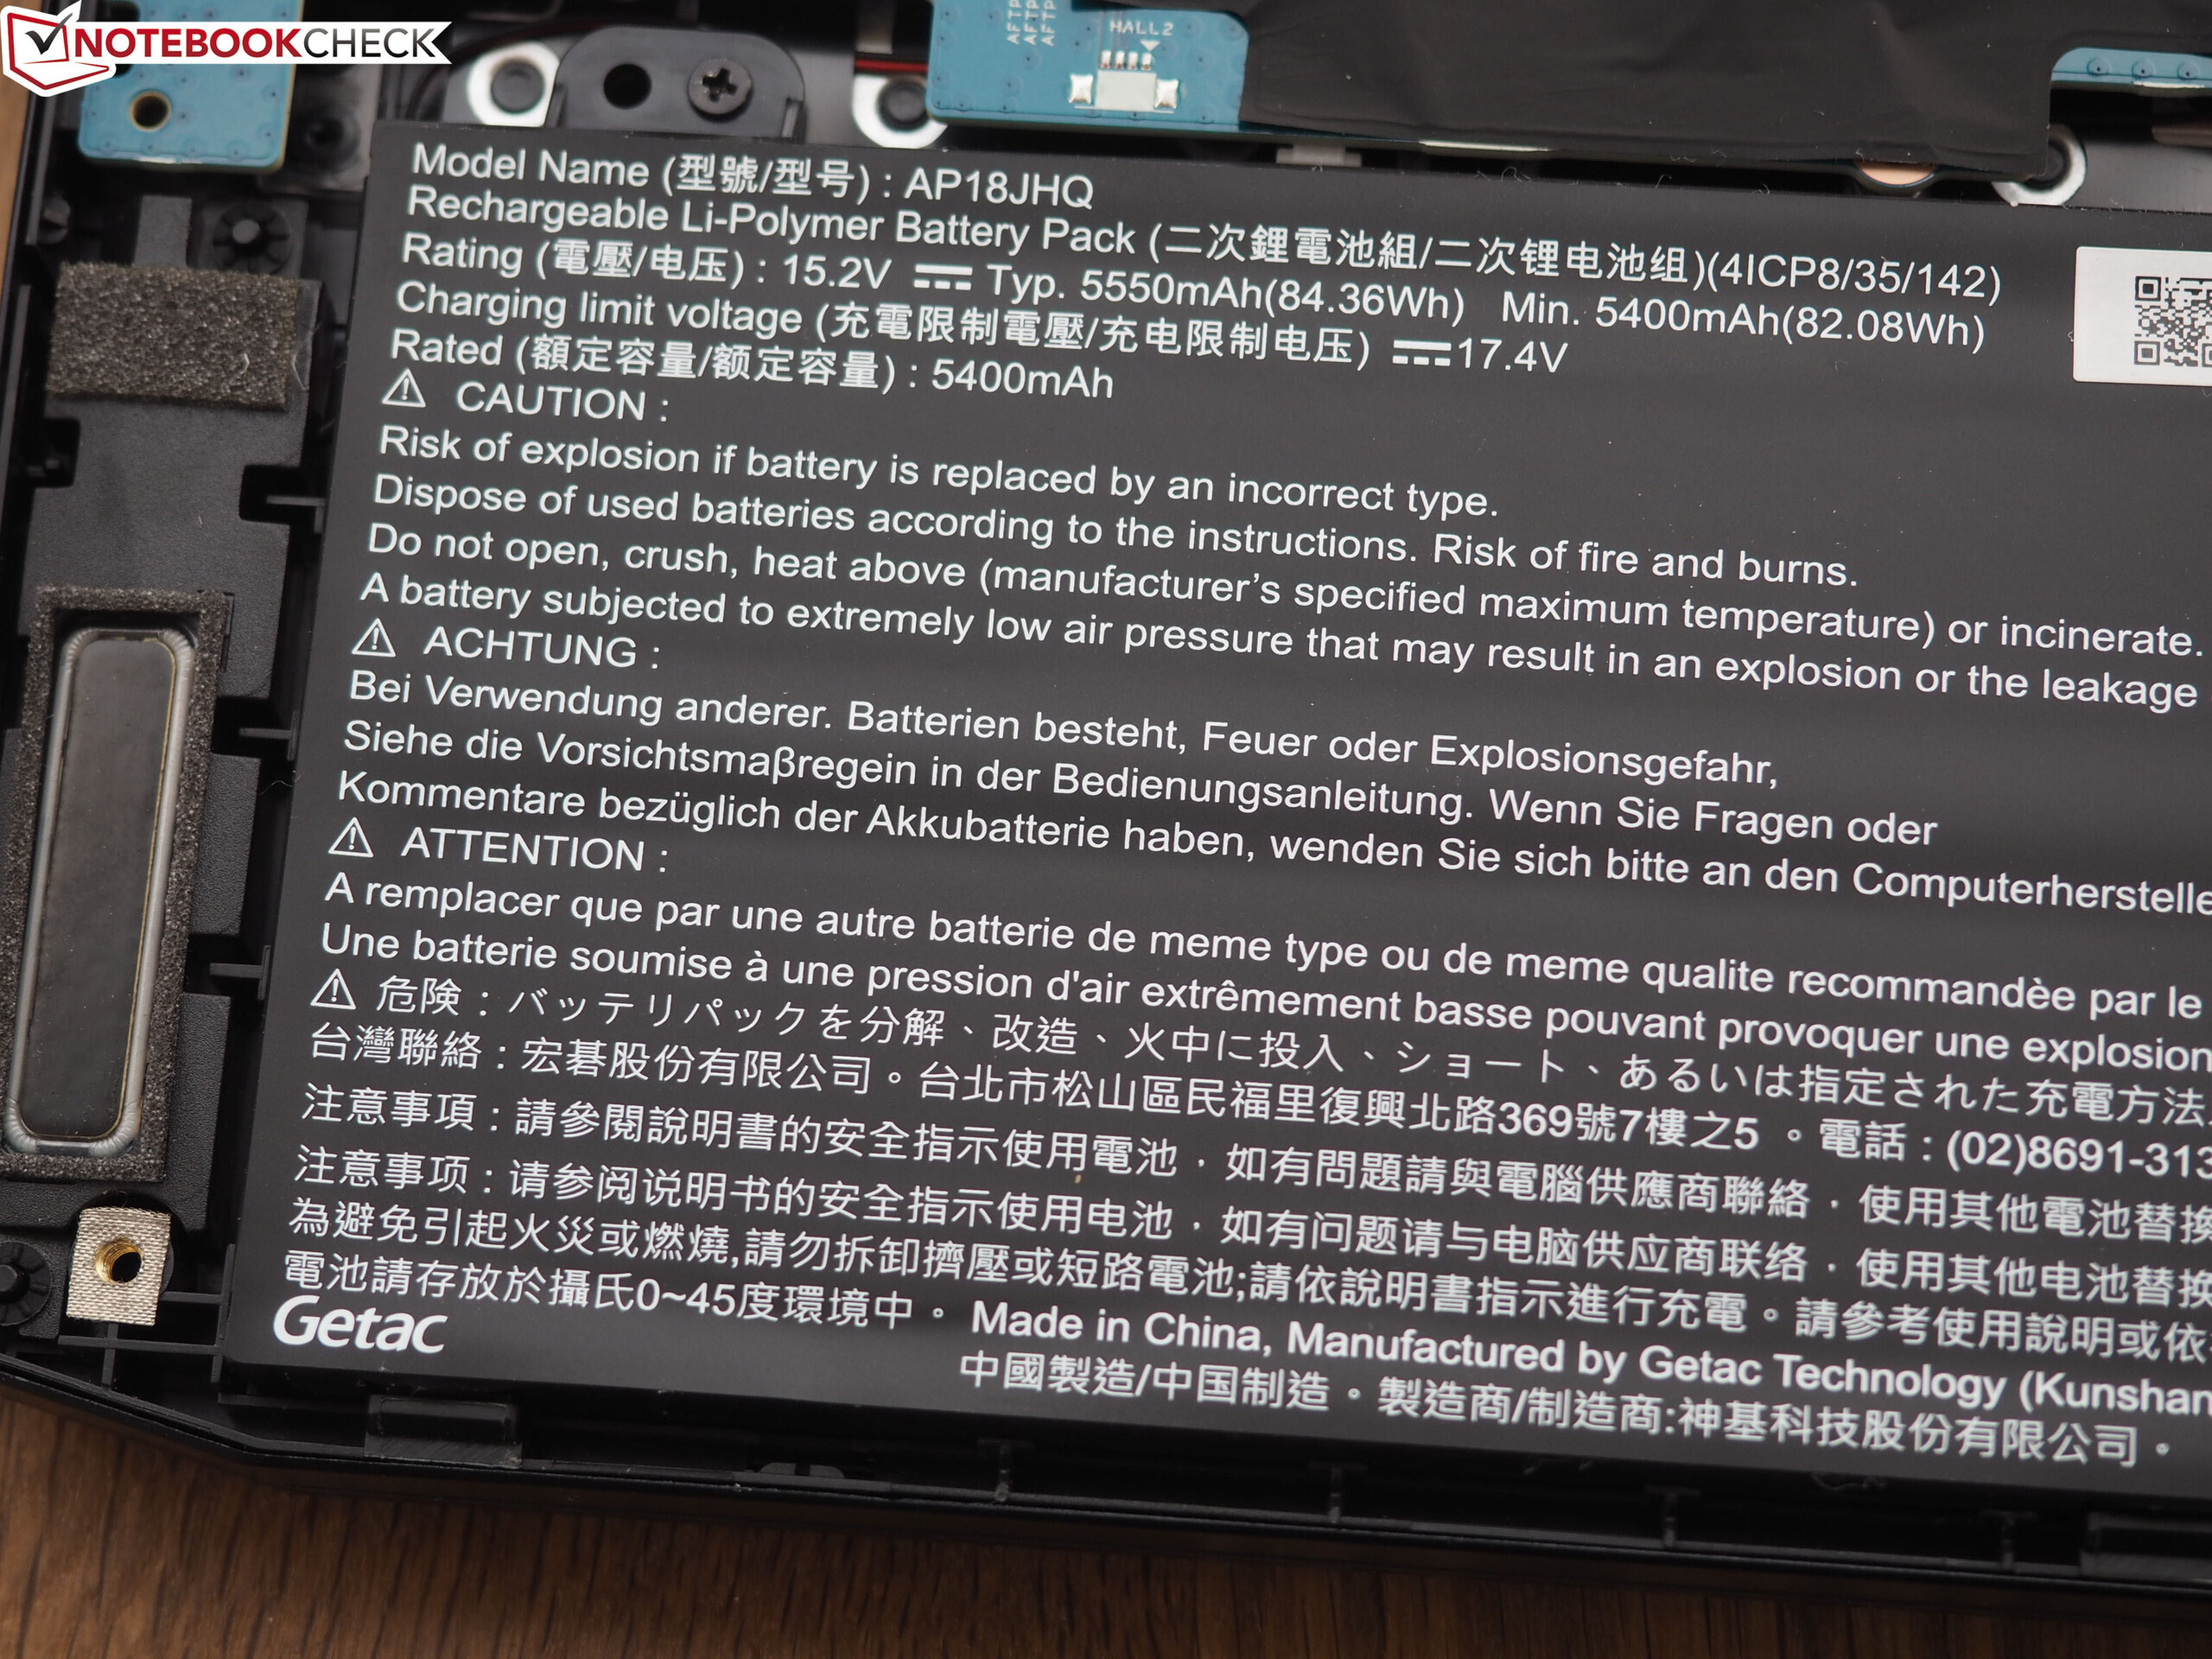
| Acer Predator Triton 500 GeForce RTX 2080 Max-Q, i7-8750H, 82 Wh | Gigabyte Aero 15-X9 GeForce RTX 2070 Max-Q, i7-8750H, 94.24 Wh | Razer Blade 15 RTX 2070 Max-Q GeForce RTX 2070 Max-Q, i7-8750H, 80 Wh | MSI GS65 8RF-019DE Stealth Thin GeForce GTX 1070 Max-Q, i7-8750H, 82 Wh | Asus Zephyrus S GX531GS GeForce GTX 1070 Max-Q, i7-8750H, 50 Wh | Genomsnitt av klass Gaming | |
|---|---|---|---|---|---|---|
| Batteridrifttid | 90% | 71% | 47% | -35% | 60% | |
| Reader / Idle (h) | 5.6 | 9.2 64% | 11.4 104% | 8.5 52% | 3.6 -36% | 8.71 ? 56% |
| WiFi v1.3 (h) | 3.2 | 6.4 100% | 6.5 103% | 6 88% | 2.6 -19% | 7.02 ? 119% |
| Load (h) | 1.4 | 2.9 107% | 1.5 7% | 1.4 0% | 0.7 -50% | 1.47 ? 5% |
| H.264 (h) | 6.1 | 5.9 | 8.26 ? |
För
Emot
Läs den fullständiga versionen av den här recensionen på engelska här.
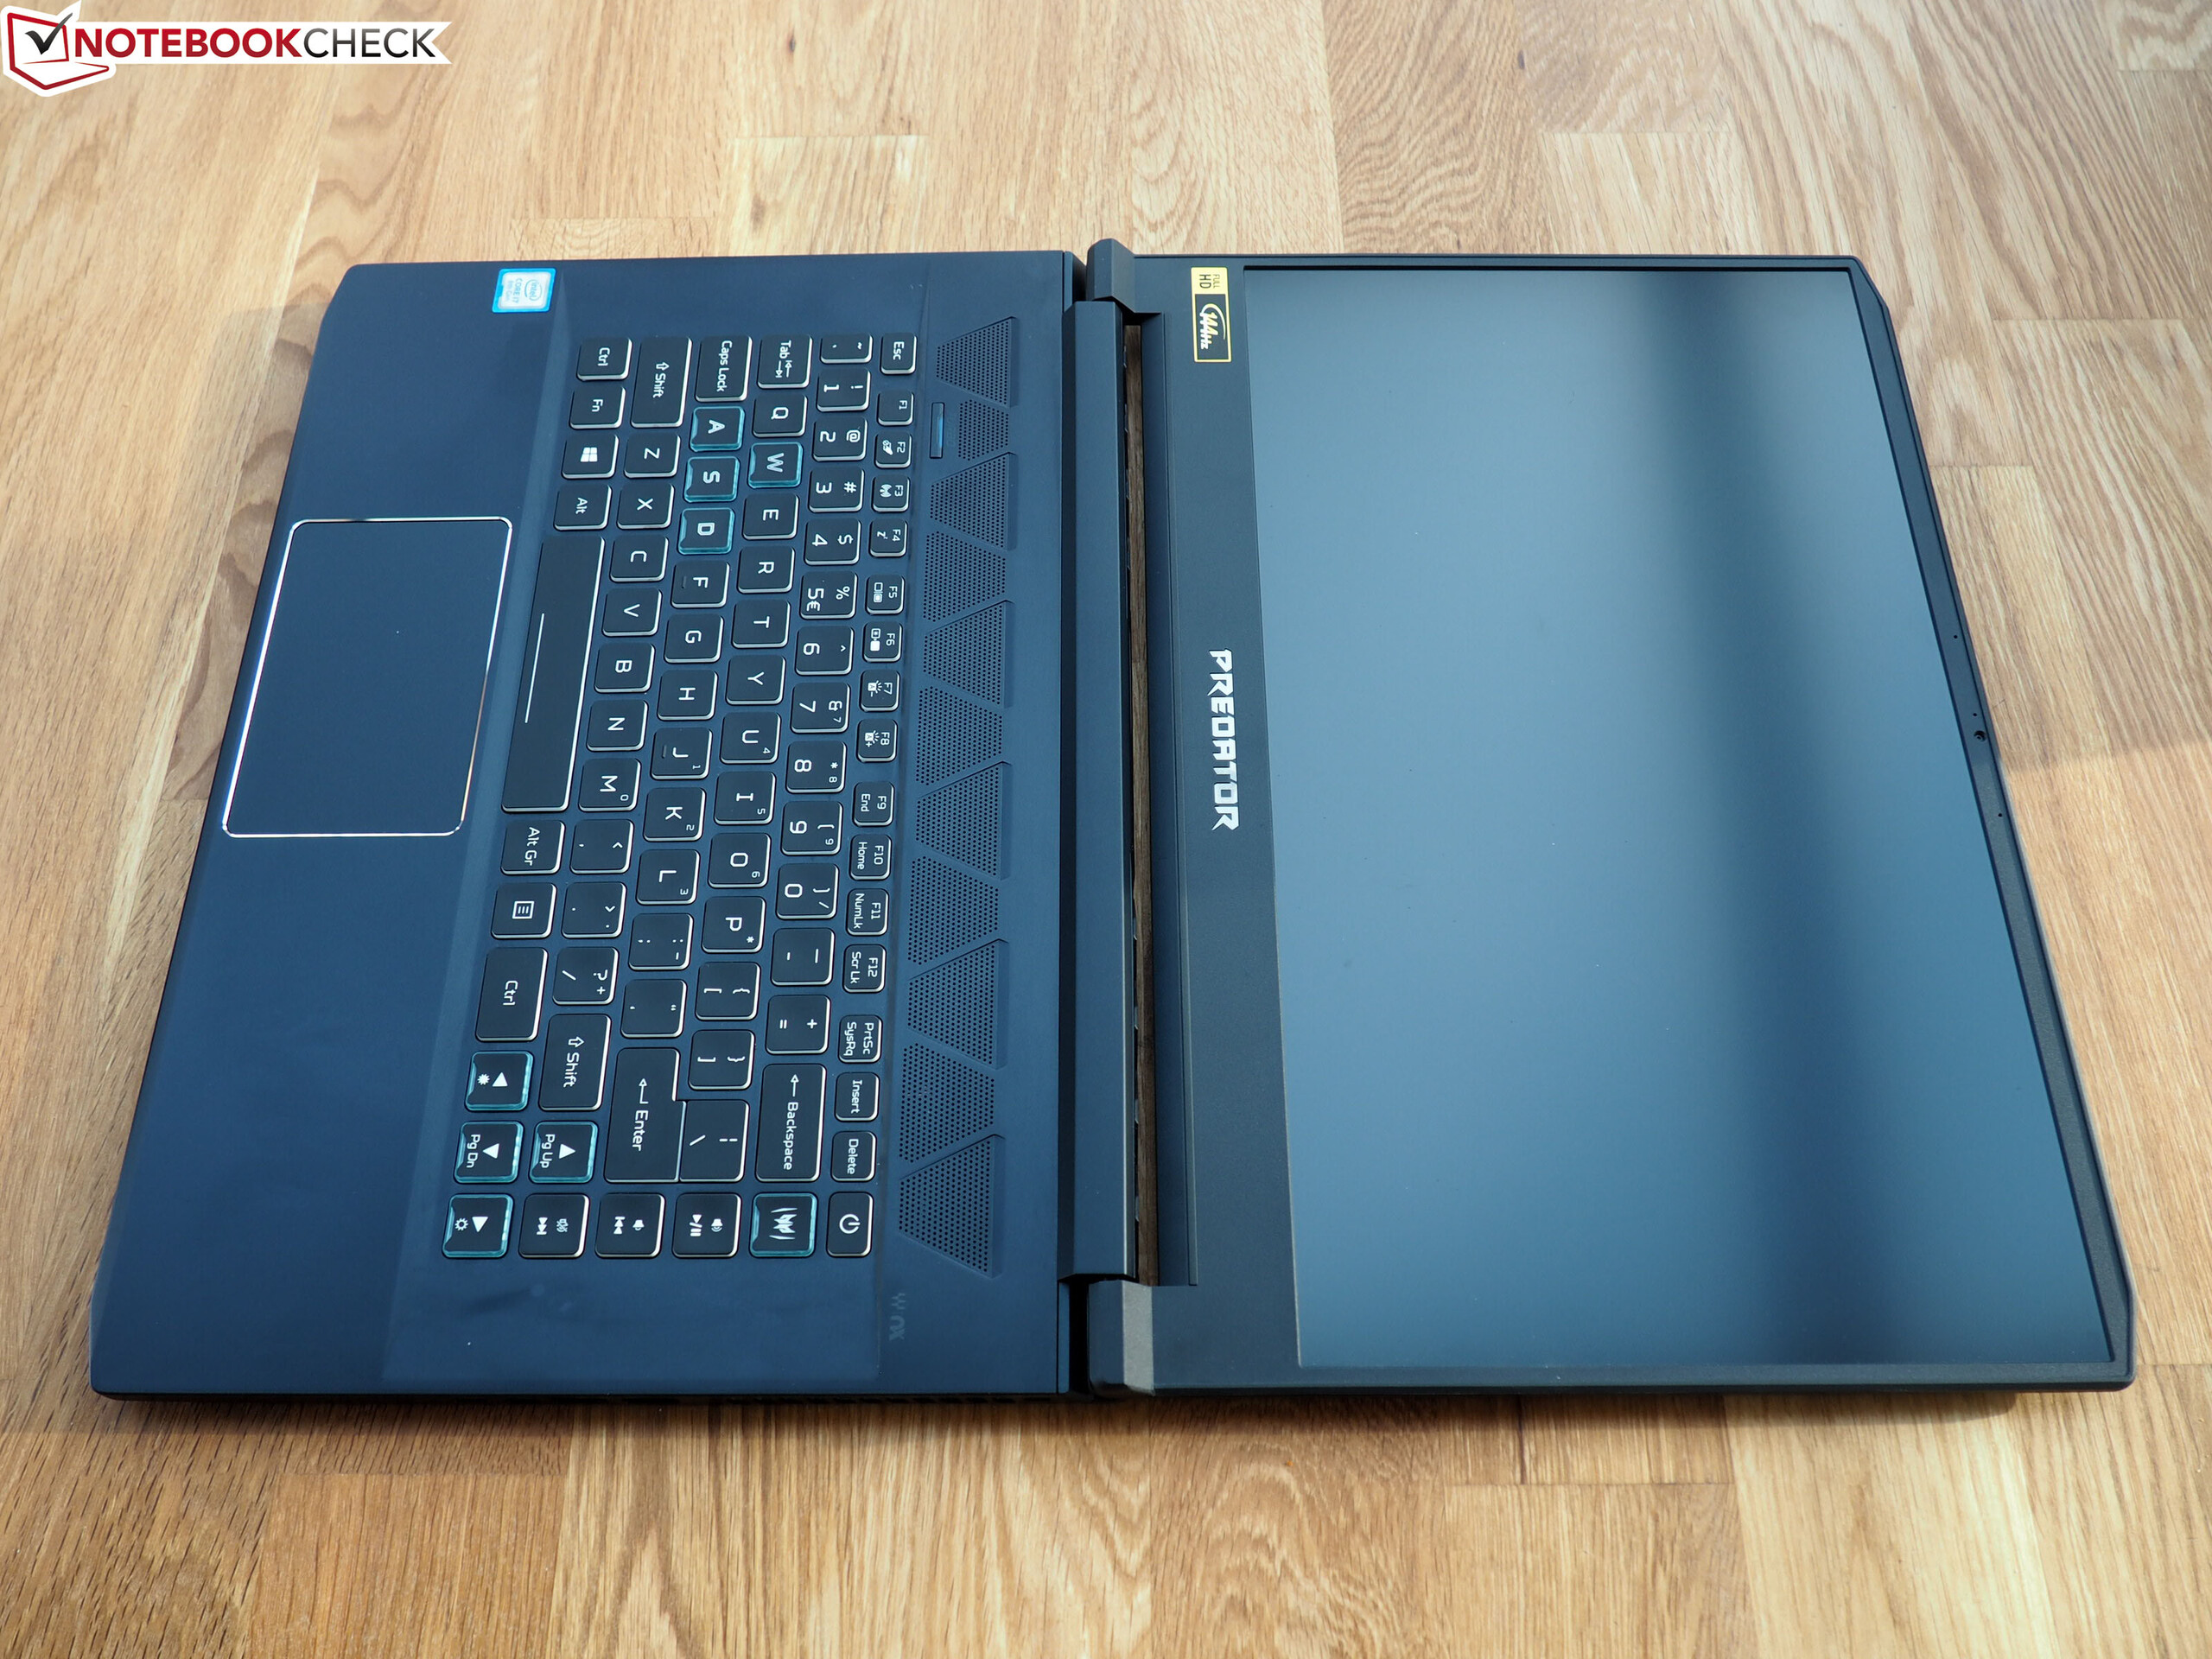
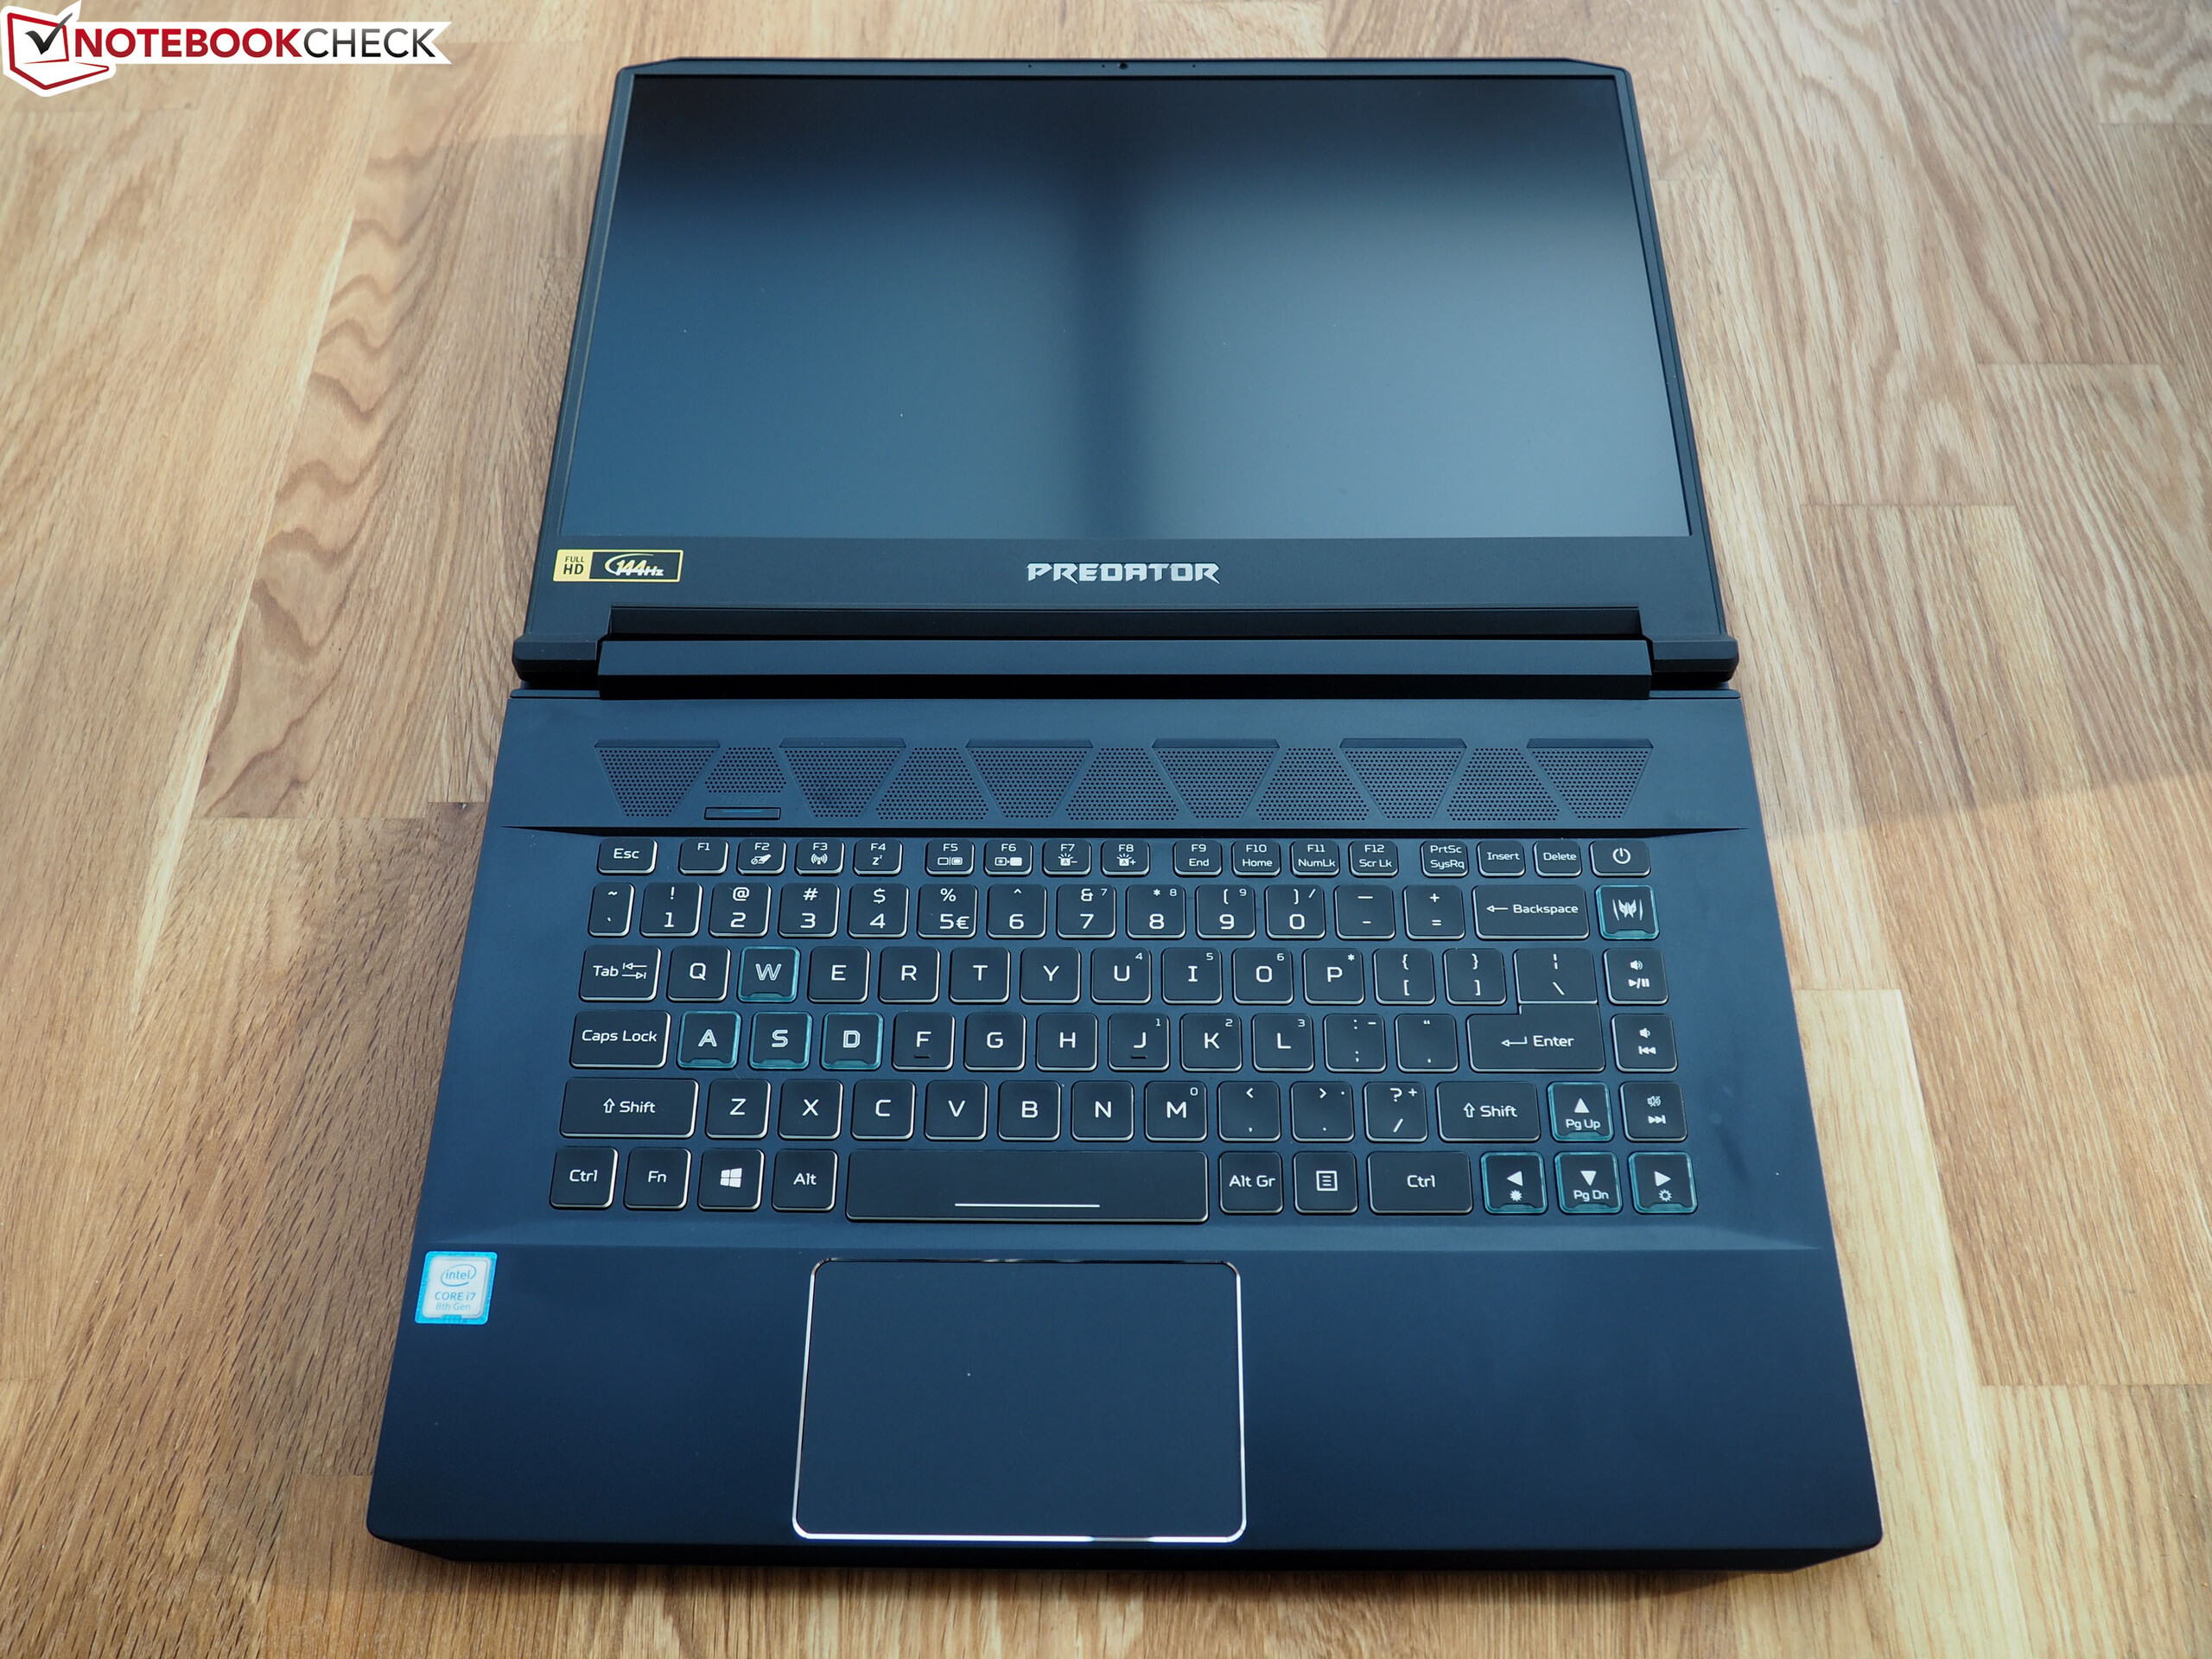
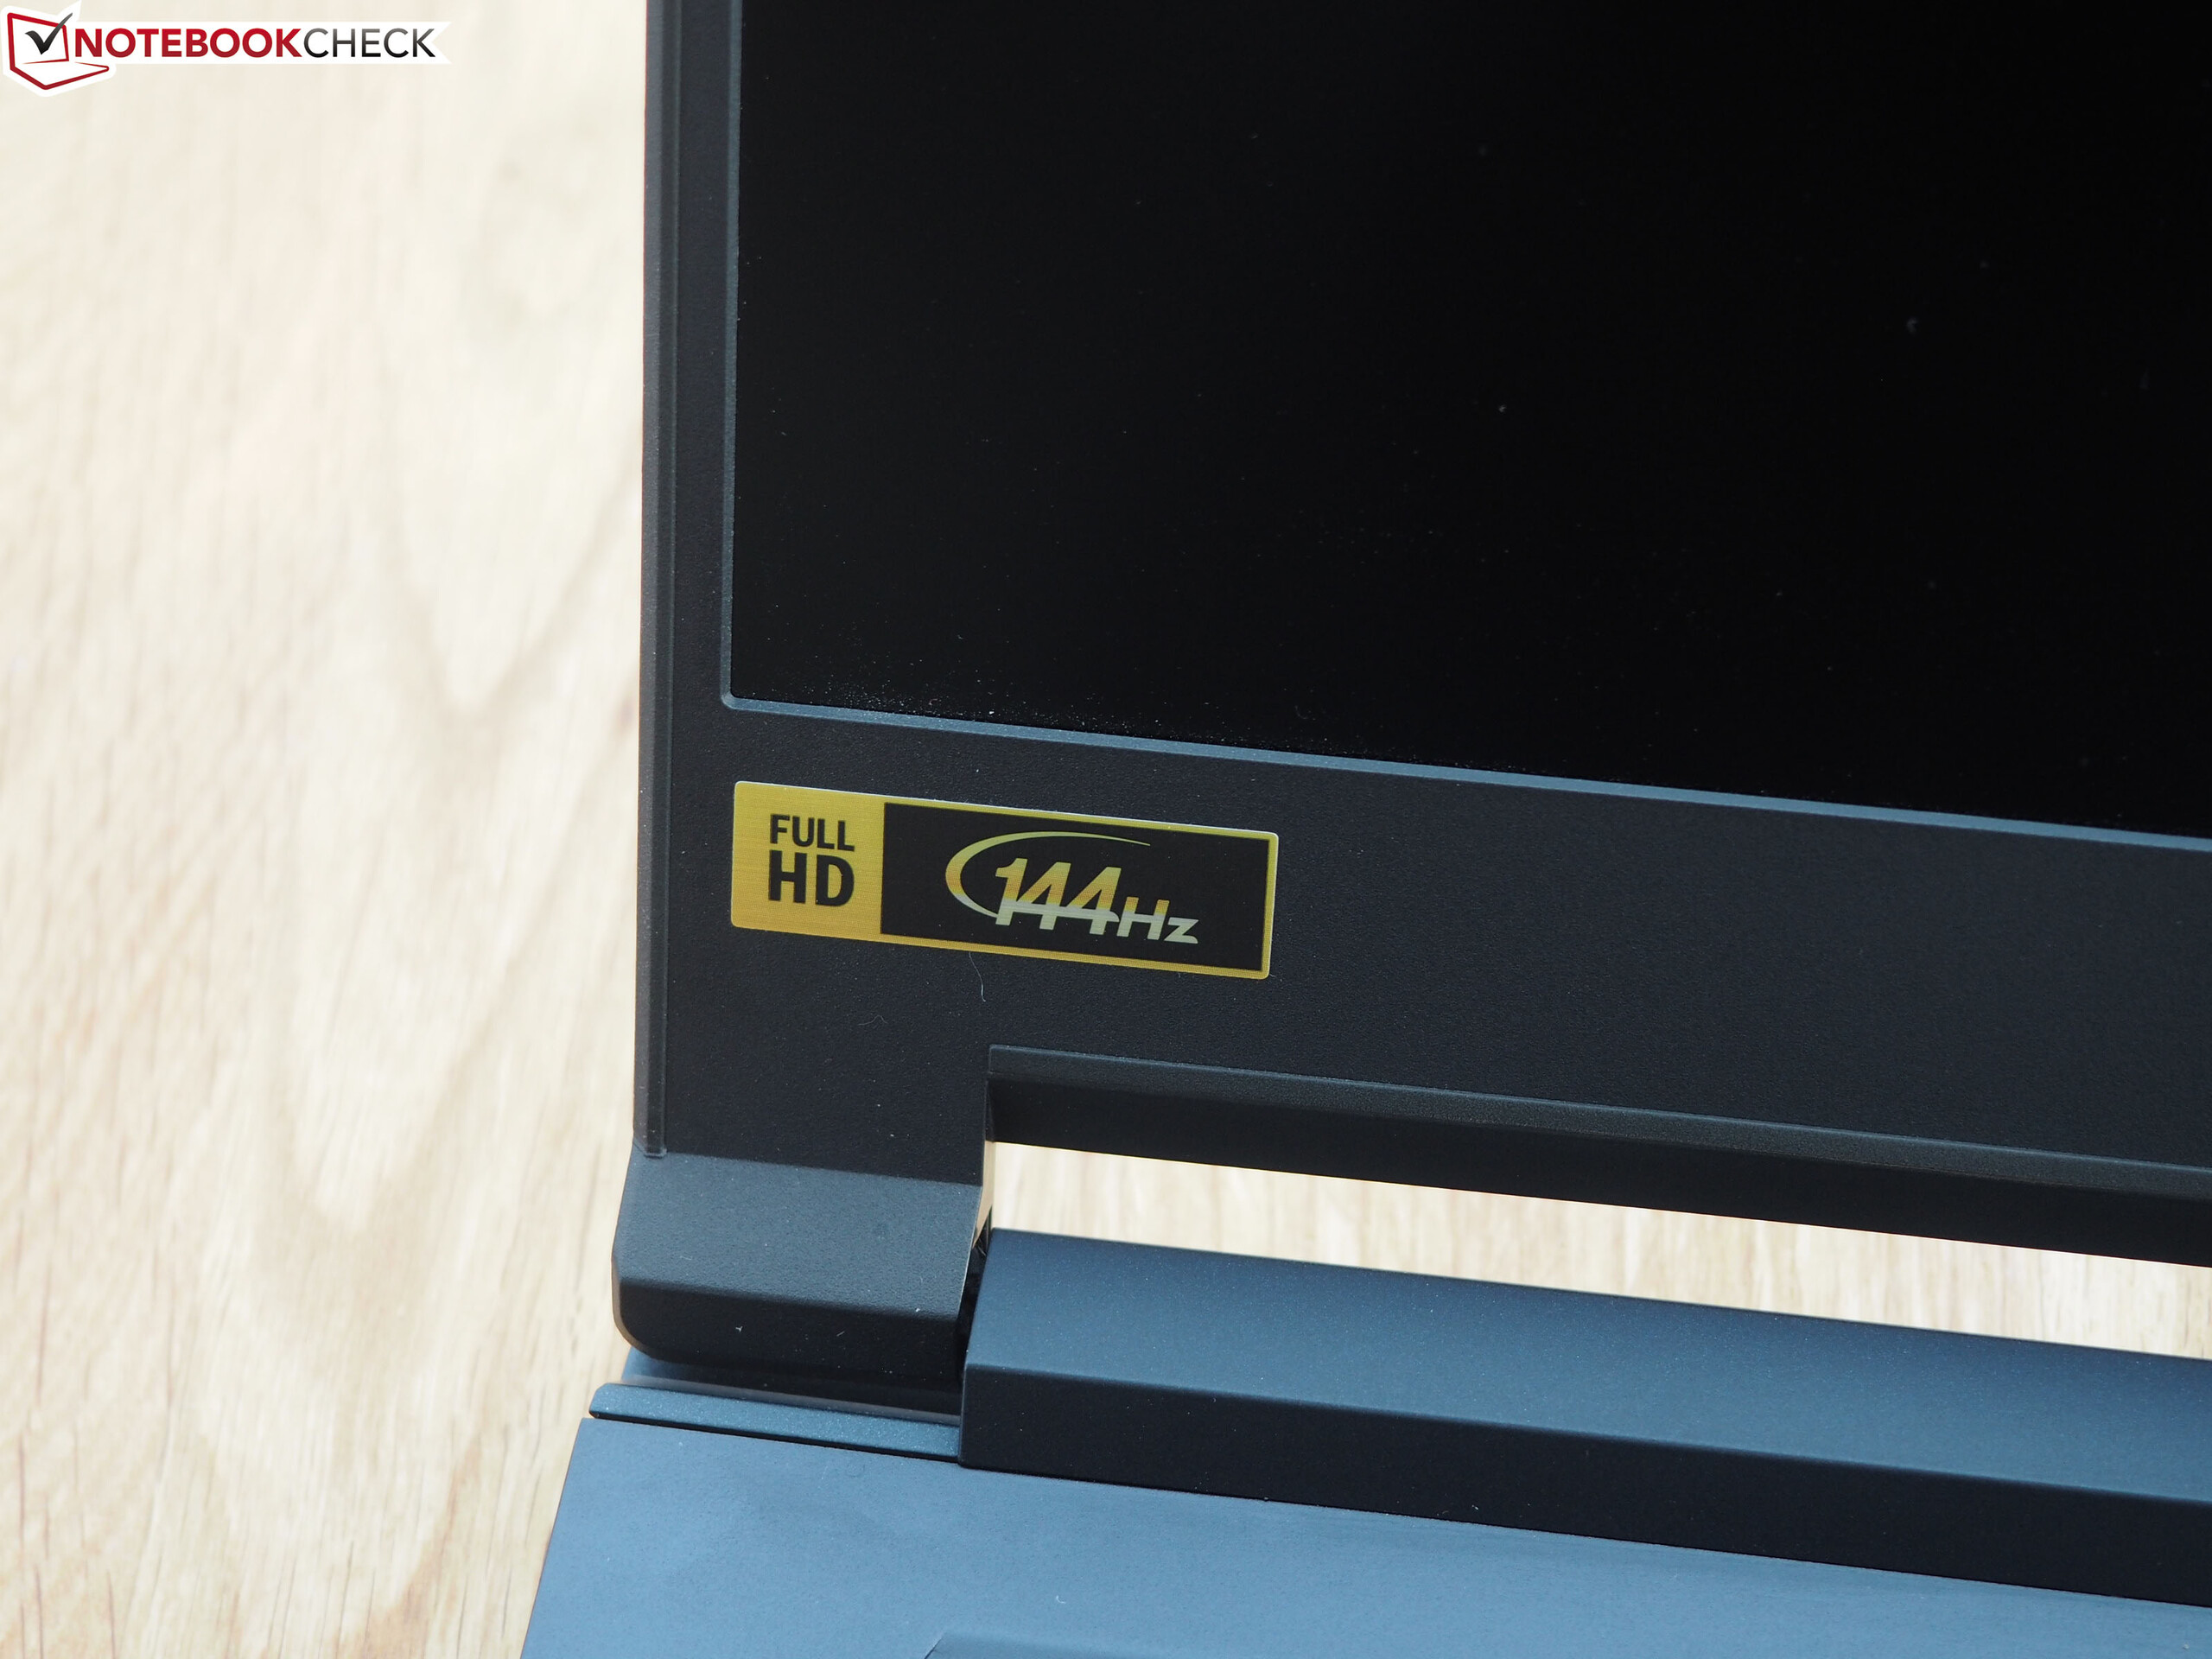
Acer Predator Triton 500 missar precis omdömet "riktigt bra". Denna laptop på 15 tum uppfyller nästan alla kriterier som utmärker en modern spellaptop. Utöver en skärm med smal infattning och ett tunt hölje bör vi också nämna 144 Hz-skärmen som får poäng för sitt G-Sync stöd.
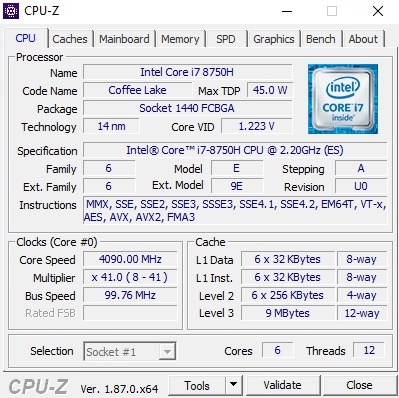
Triton 500 saknar heller inte prestanda. Versionen vi testade med Core i7-8750H och GeForce RTX 2080 Max-Q kan hantera alla moderna spel i Full HD-upplösning utan problem.
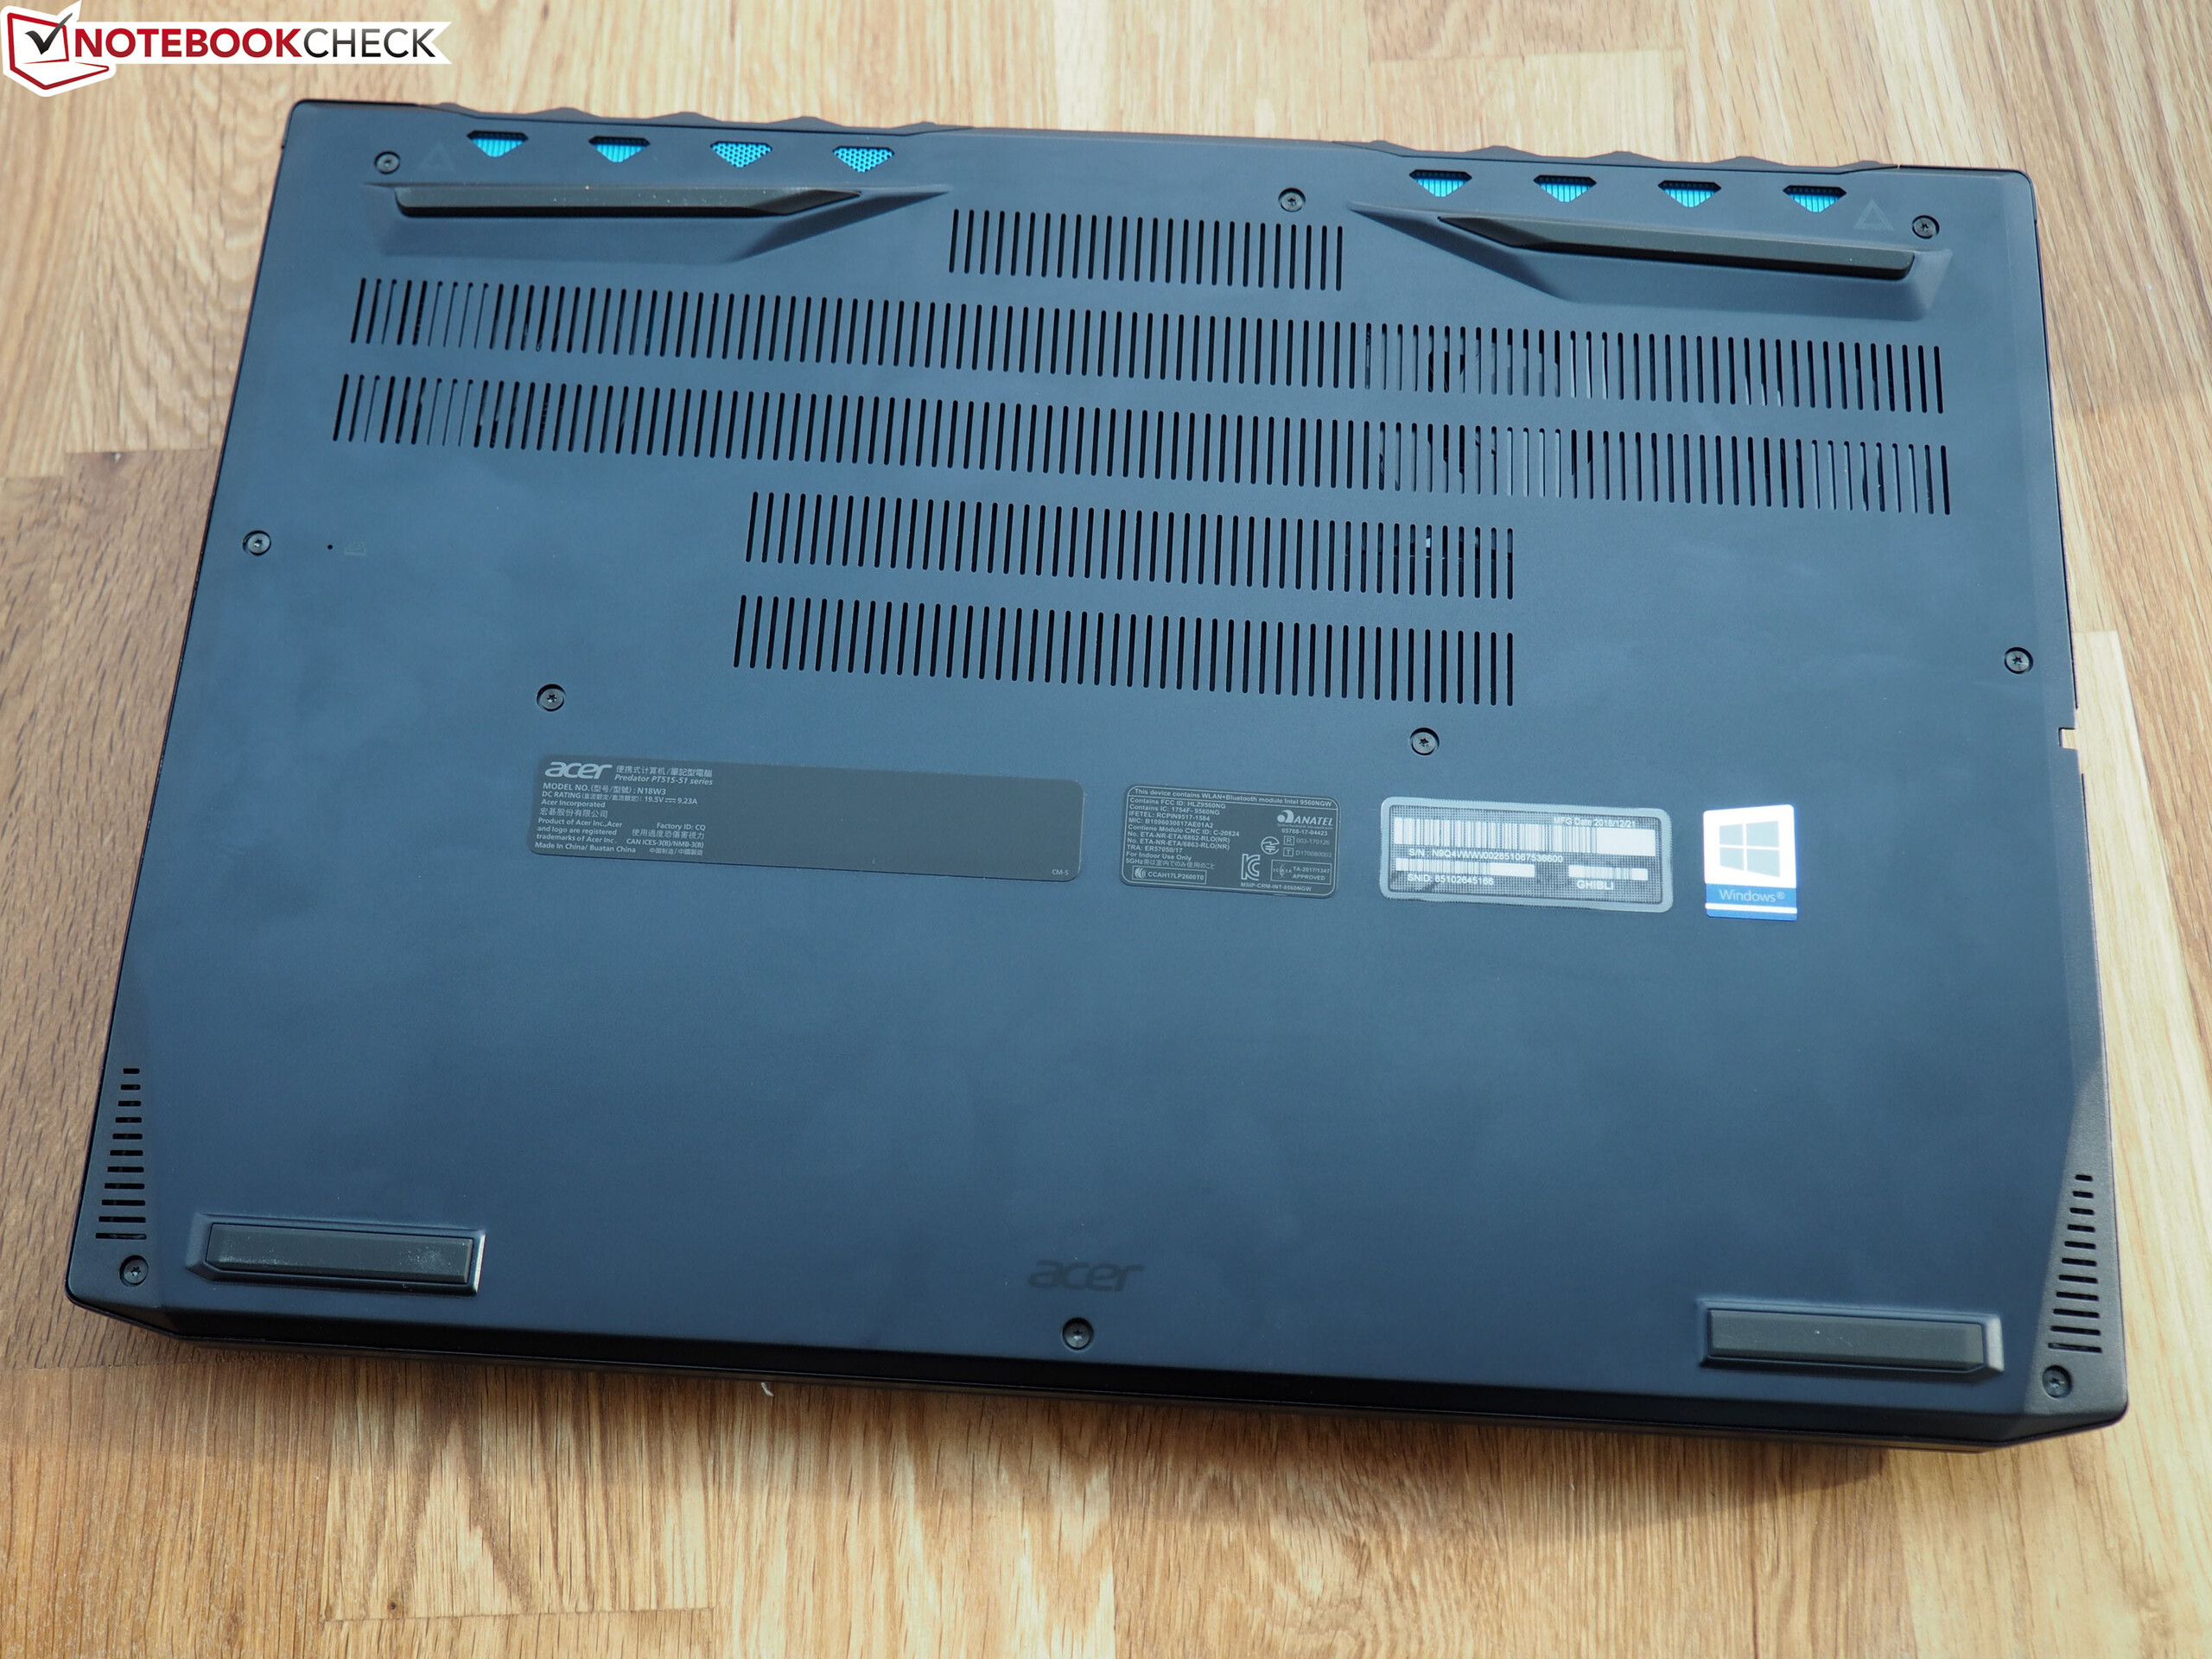
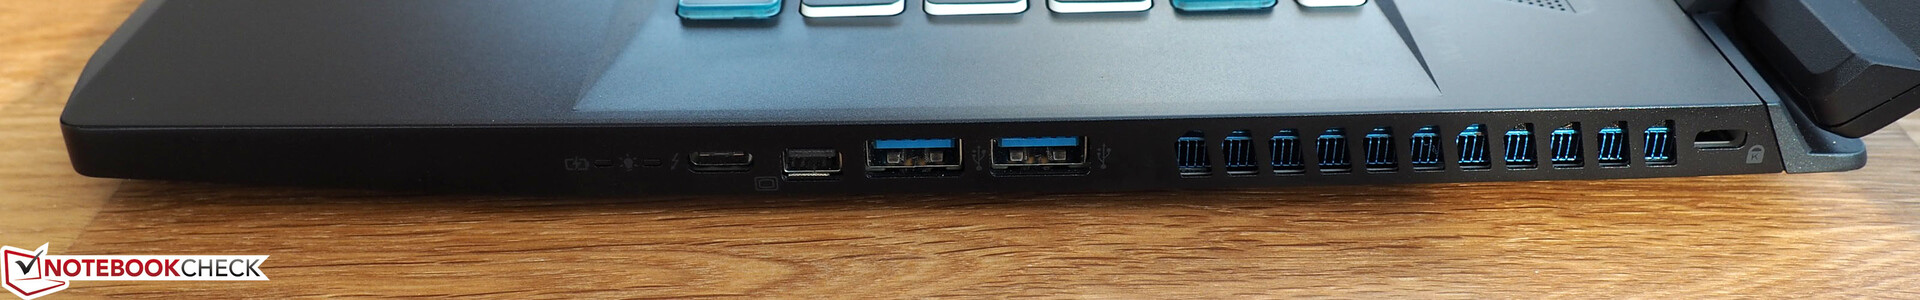
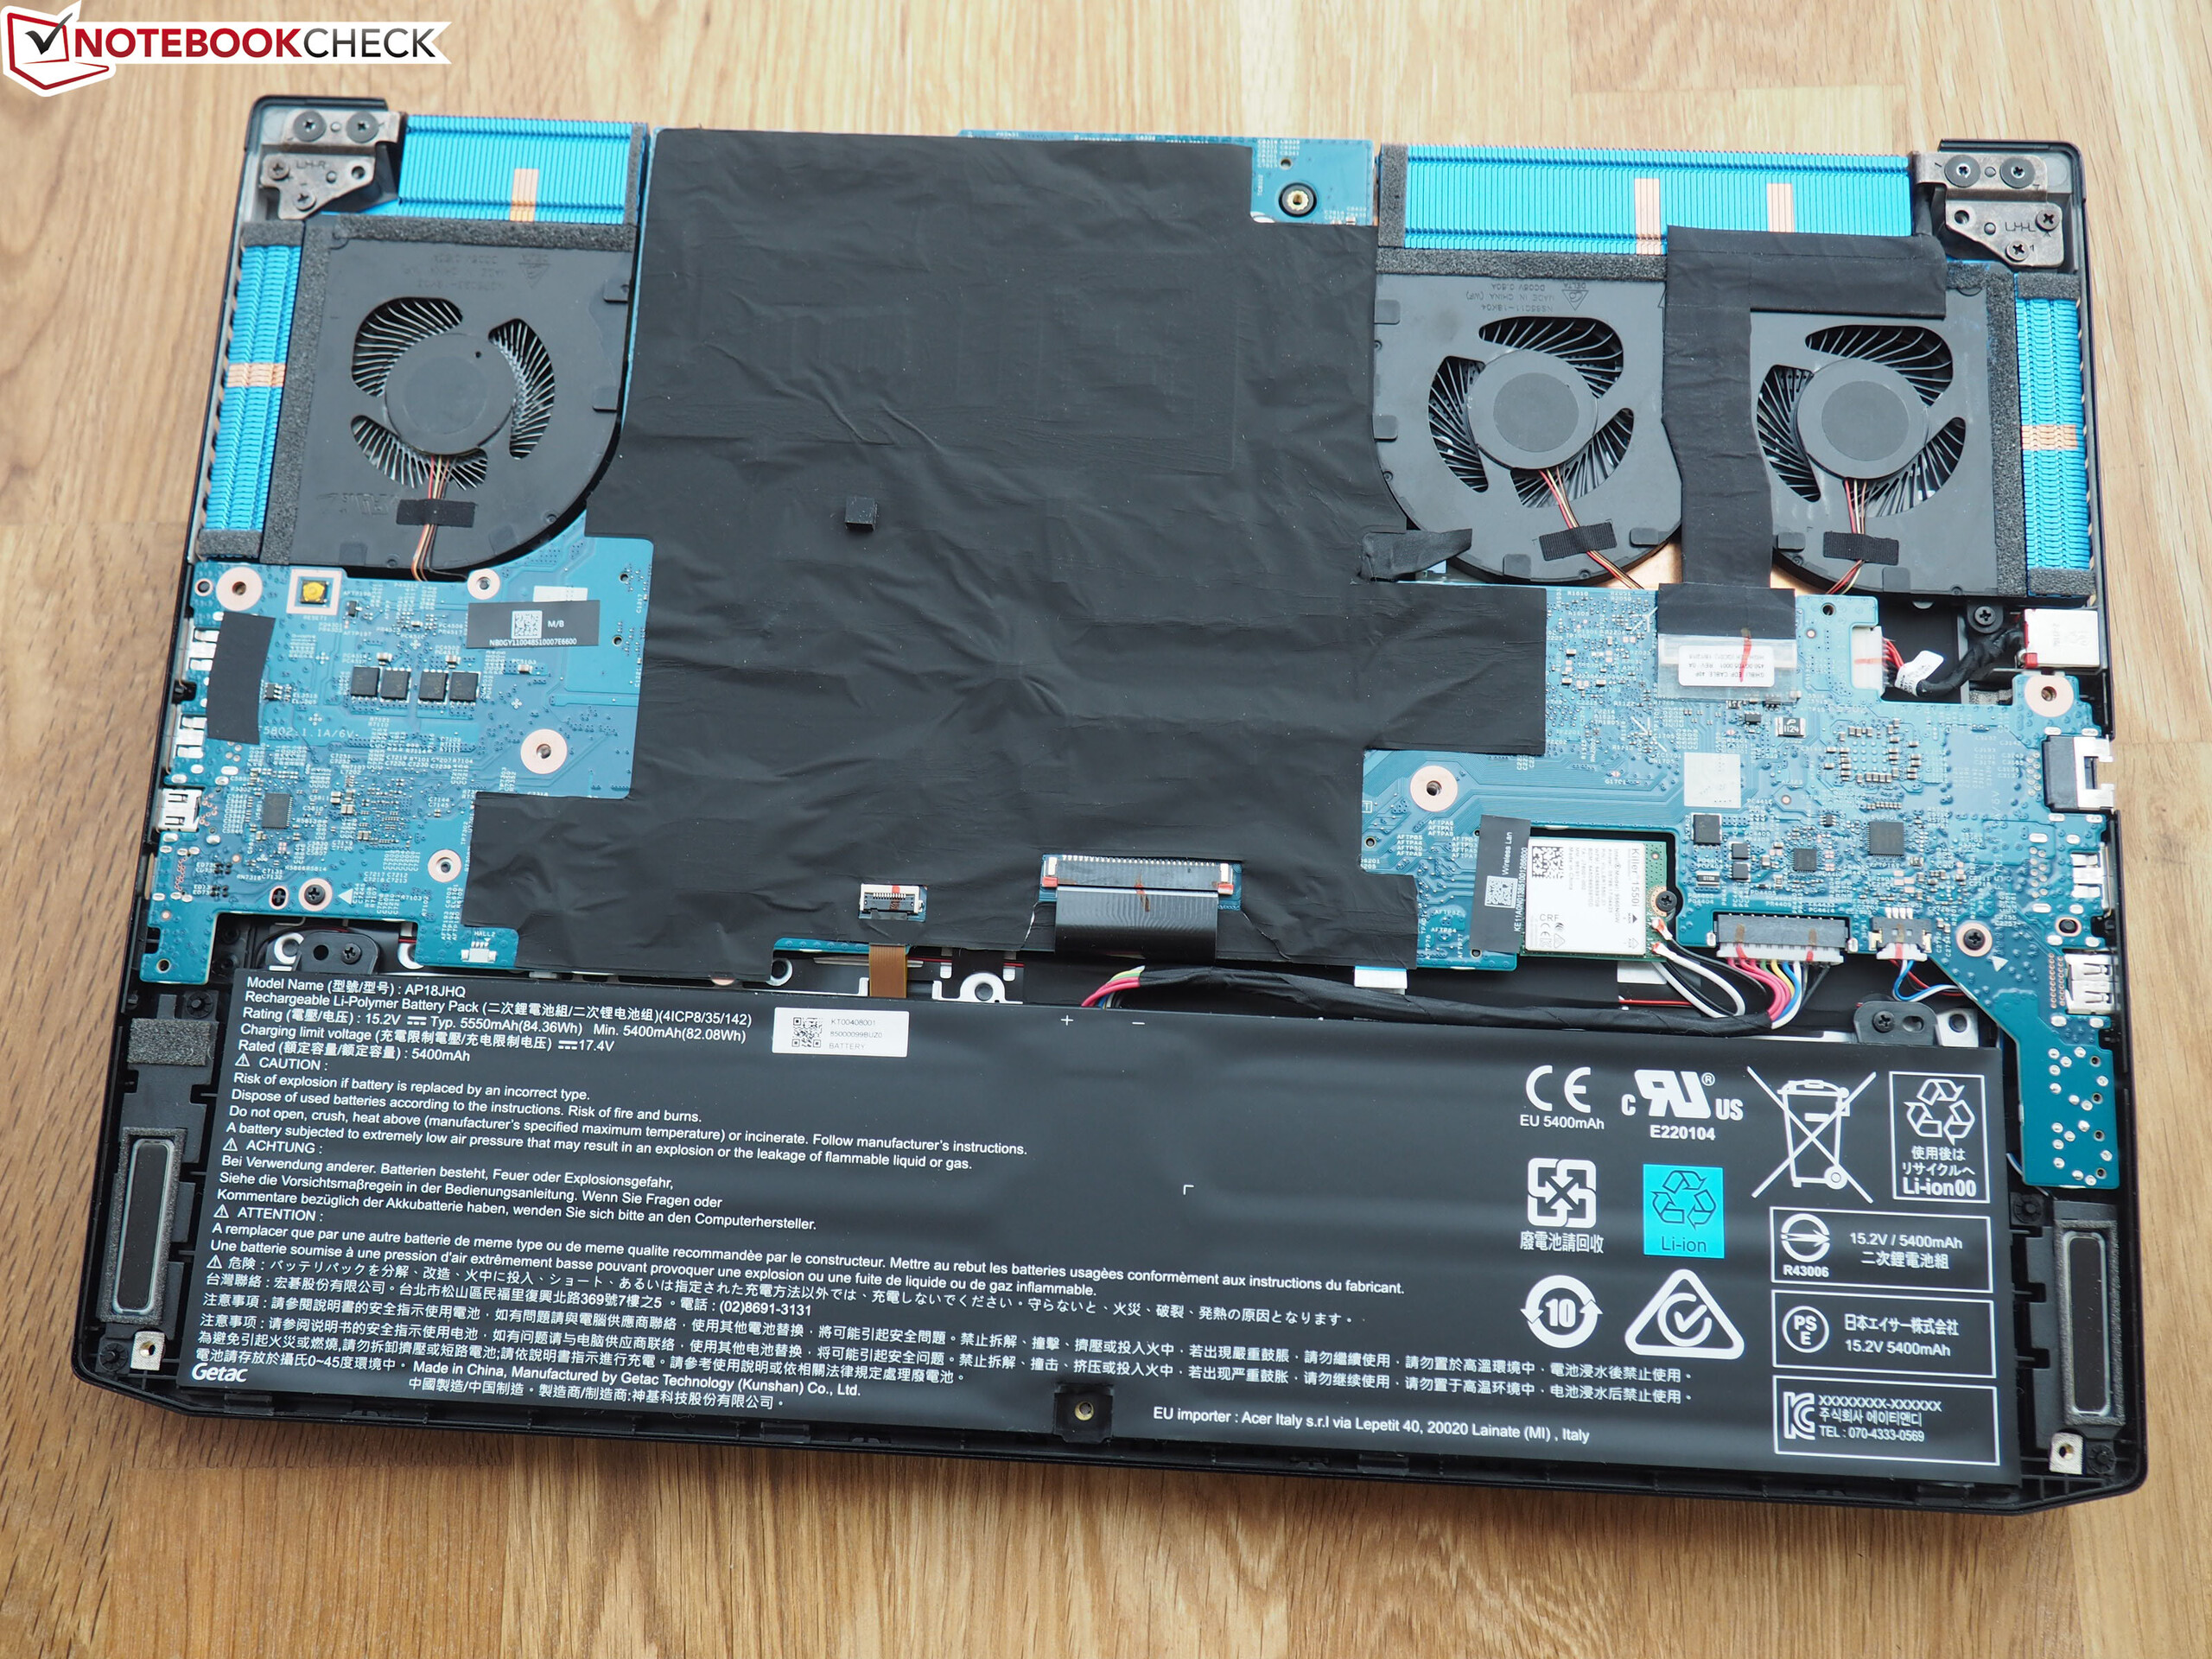
Men det är obegripligt att Acer inte använder grafikbyte. I fråga om mobilitet hade Optimus verkligen varit en fördel. Vi kan se ytterligare brister i fråga om servicemöjligheter. Insidan är designad på ett sådant sätt att användaren knappt kan komma åt några komponenter alls (nyckelord: lagringslösningen och RAM-minnet).
Trots det är Triton 500 i vårt tycke betydligt mer framgångsrik än den äldre modellen Triton 700.
Acer Predator Triton 500
- 02/14/2019 v6 (old)
Florian Glaser
Price comparison