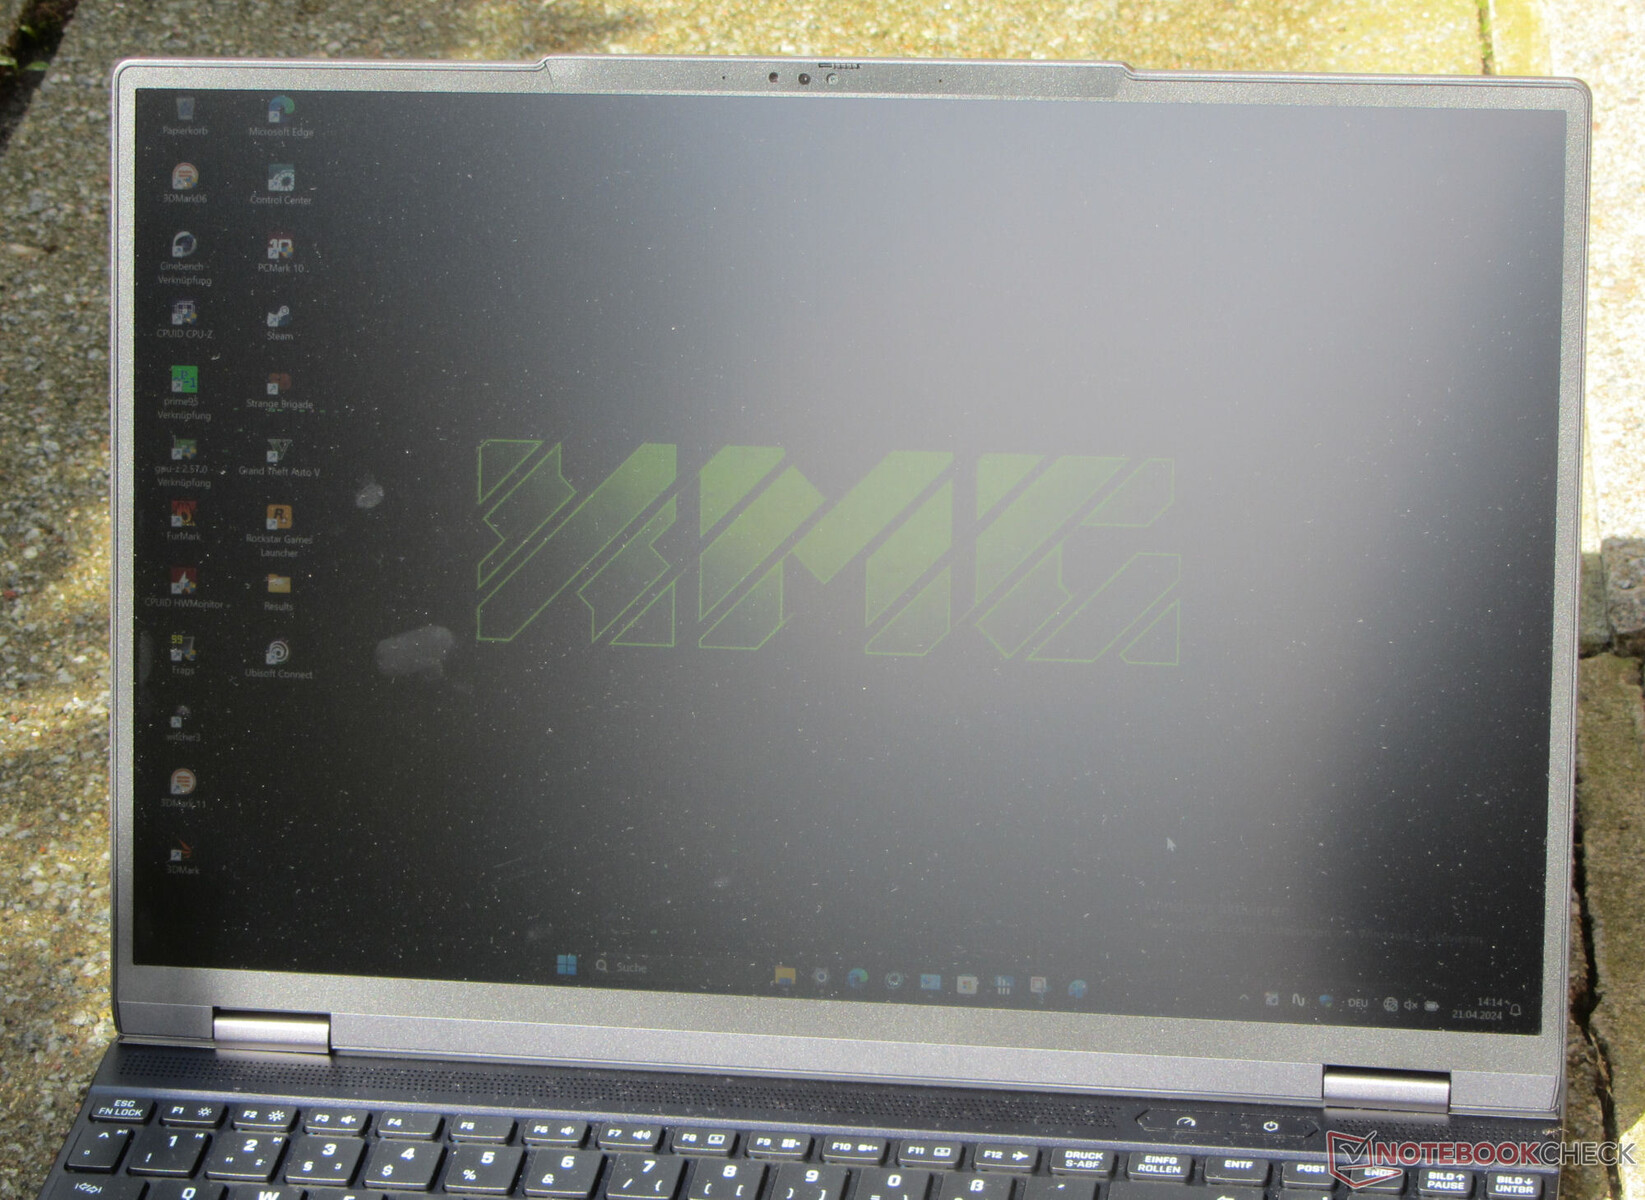
XMG Fusion 15 (Early 24) recension: En kompakt RTX 4070-bärbar dator för spelare och skapare
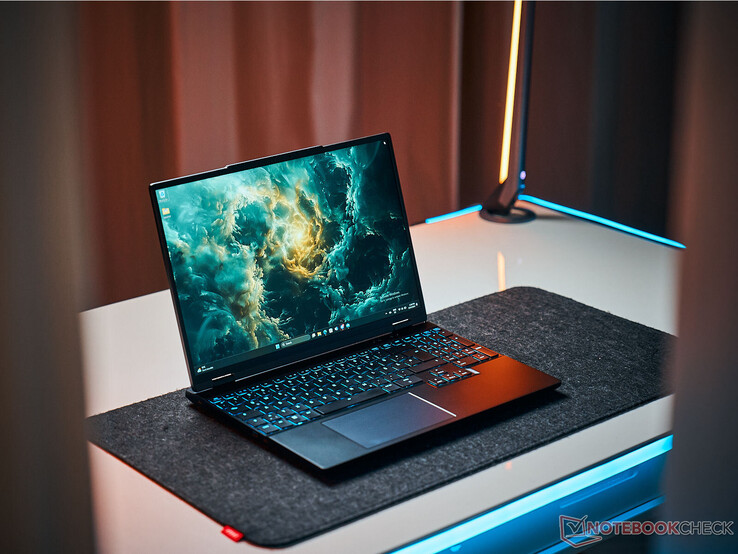
XMG Fusion 15 (Early 24) - en 15,3-tums bärbar dator för gamers och kreatörer - är baserad på ett barebone (GM5IX7A) från tillverkaren Tongfang. Raptor Lake, Ada Lovelace och 32 GB RAM utrustar den bärbara datorn för streaming, rendering och spel. Den nuvarande varianten kan köpas för cirka 2 500 USD. Konkurrenter inkluderar enheter som t.ex Aorus 16X (2024), Alienware m16 R2, HP Omen Transcend 16 och Lenovo Legion Pro 5 16IRX9.
Potentiella konkurrenter i jämförelse
Gradering | Datum | Modell | Vikt | Höjd | Storlek | Upplösning | Pris |
|---|---|---|---|---|---|---|---|
| 88.9 % v7 (old) | 05/2024 | Schenker XMG Fusion 15 (Early 24) i9-14900HX, GeForce RTX 4070 Laptop GPU | 2.1 kg | 21.9 mm | 15.30" | 2560x1600 | |
| 87.4 % v7 (old) | 04/2024 | Aorus 16X 2024 i9-14900HX, GeForce RTX 4070 Laptop GPU | 2.3 kg | 20 mm | 16.00" | 2560x1600 | |
| 90.2 % v7 (old) | 03/2024 | Alienware m16 R2 Ultra 7 155H, GeForce RTX 4070 Laptop GPU | 2.5 kg | 23.5 mm | 16.00" | 2560x1600 | |
| 88.4 % v7 (old) | 02/2024 | HP Omen Transcend 16-u1095ng i9-14900HX, GeForce RTX 4070 Laptop GPU | 2.3 kg | 20 mm | 16.00" | 2560x1600 | |
| 89.3 % v7 (old) | 04/2024 | Lenovo Legion Pro 5 16IRX9 i9-14900HX, GeForce RTX 4070 Laptop GPU | 2.5 kg | 26.95 mm | 16.00" | 2560x1600 |
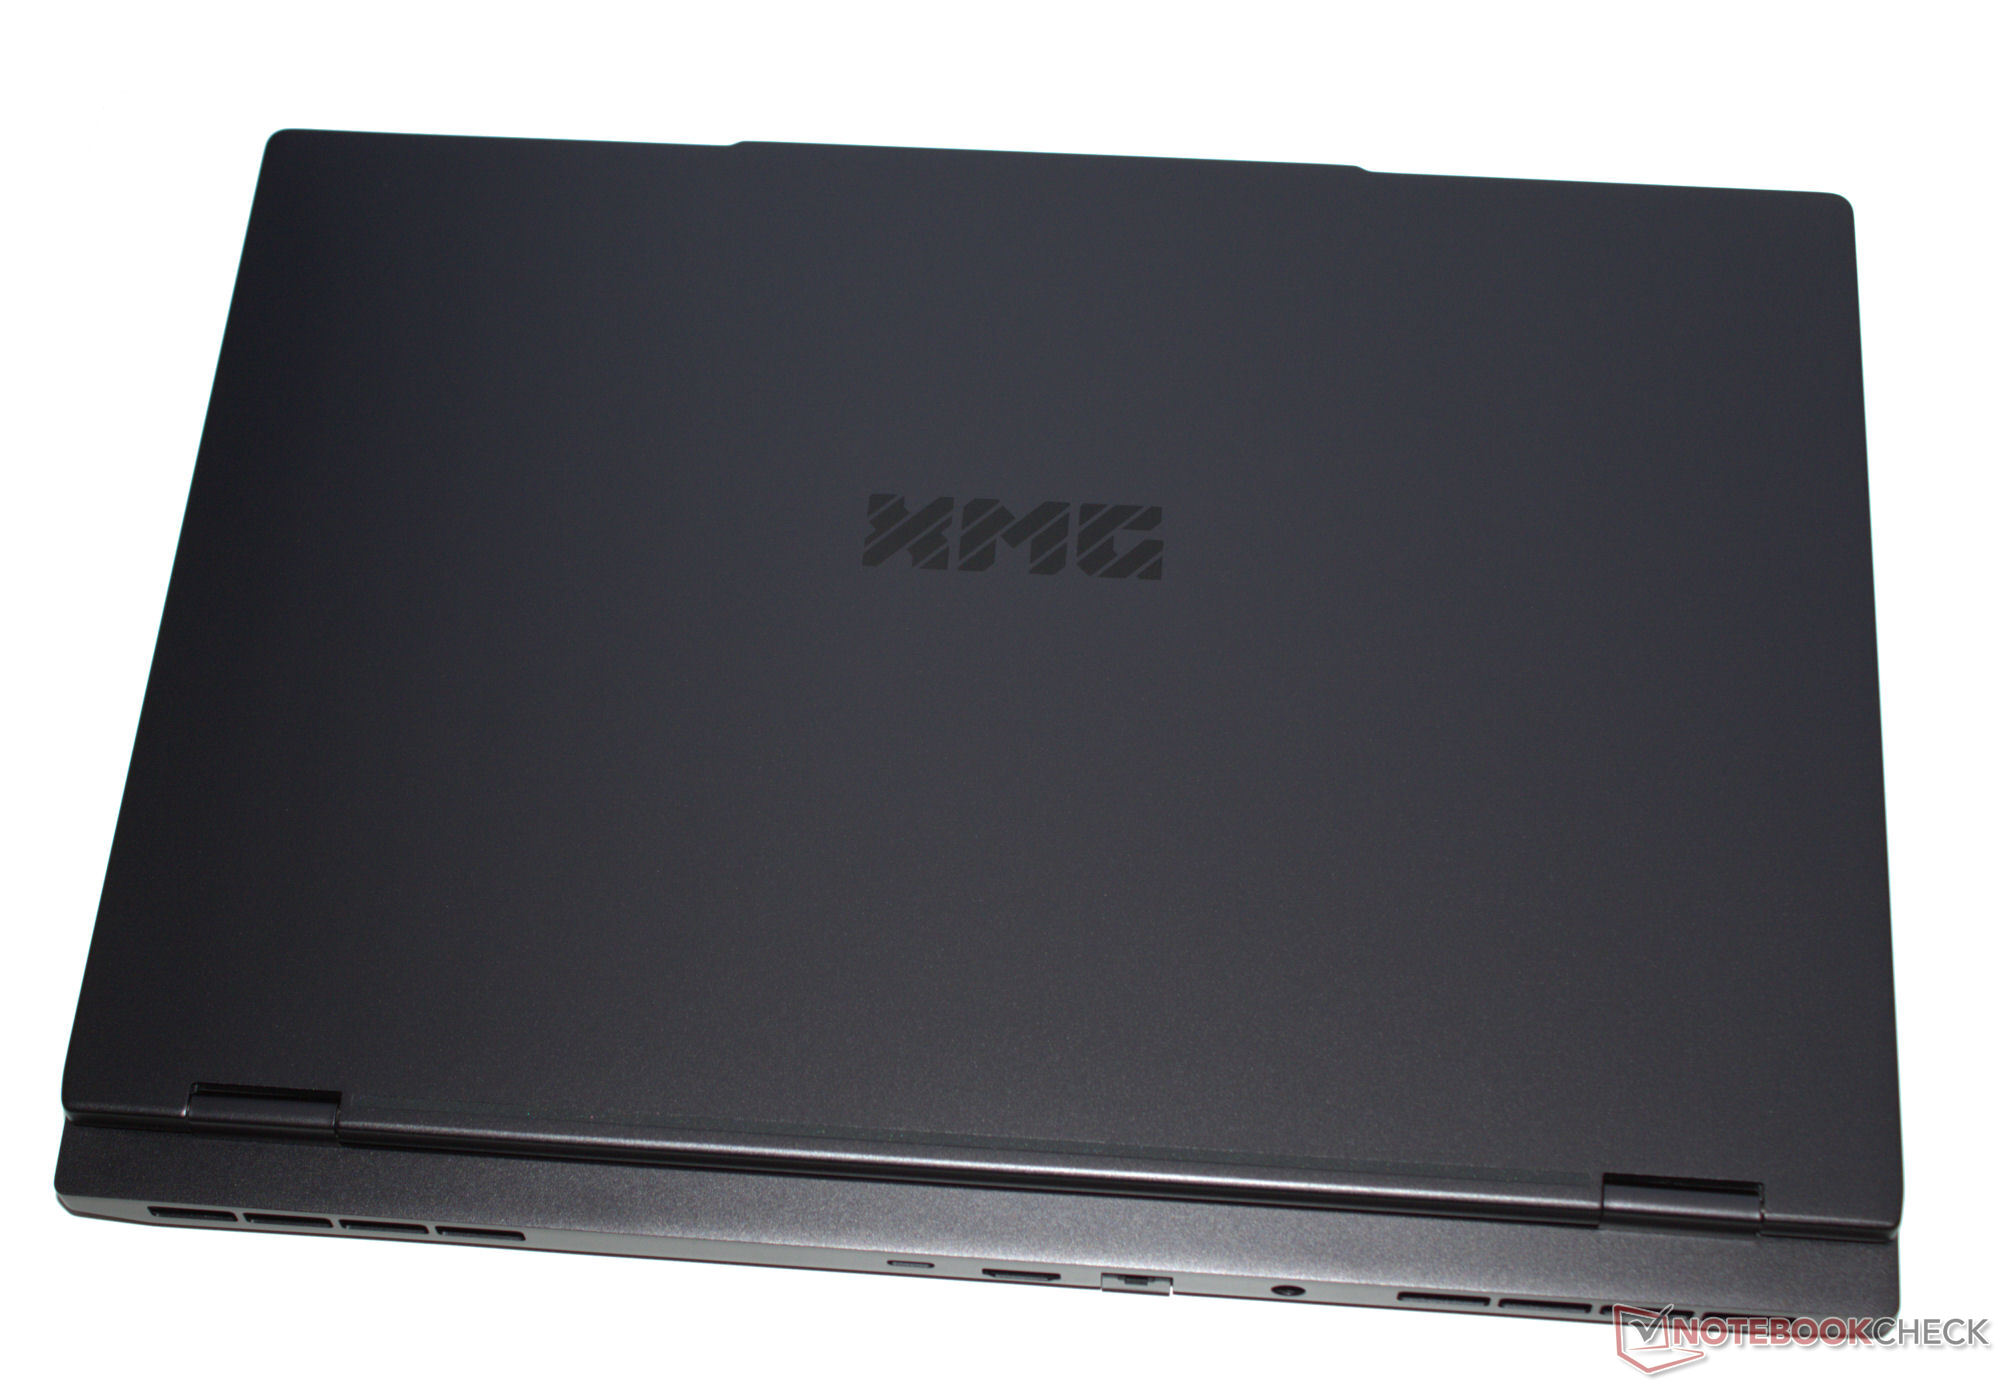
Fodral - Den bärbara datorn XMG med ett aluminiumfodral
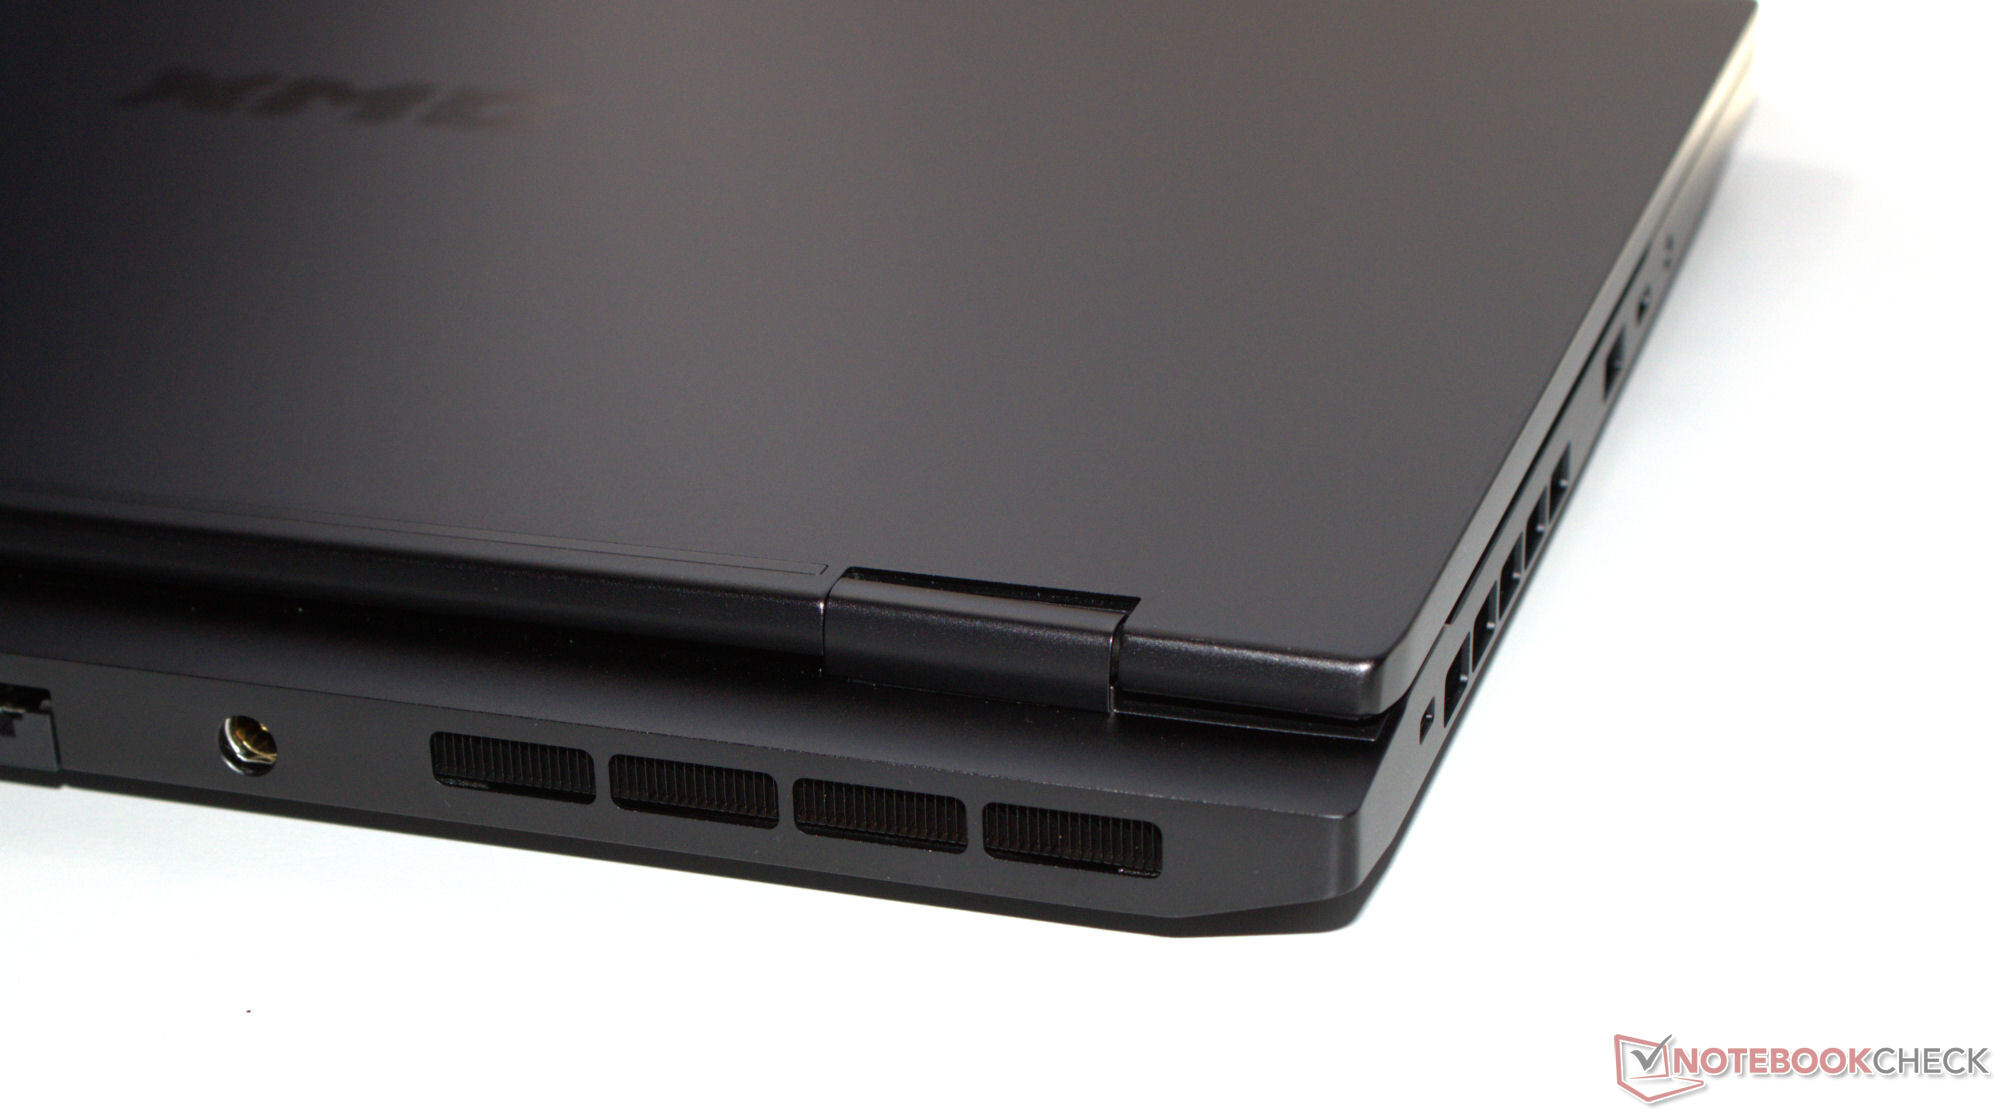
Schenker har valt ett elegant, mattsvart aluminiumhölje med släta ytor. Den bärbara datorn har inga iögonfallande designelement eller LED-remsor - det är bara tangentbordets bakgrundsbelysning (RGB) som ger enheten lite färg. Den bärbara datorn skulle knappt sticka ut i professionella miljöer.
Vi noterade inga materialutsprång och alla luckor är perfekt anpassade. Basenheten och locket kan vridas en aning, men det är inget utöver det vanliga. Att trycka på baksidan av locket resulterar inte i några bildförändringar. De styva gångjärnen medger en maximal öppningsvinkel på 180 grader. Det är möjligt att öppna den med en hand.
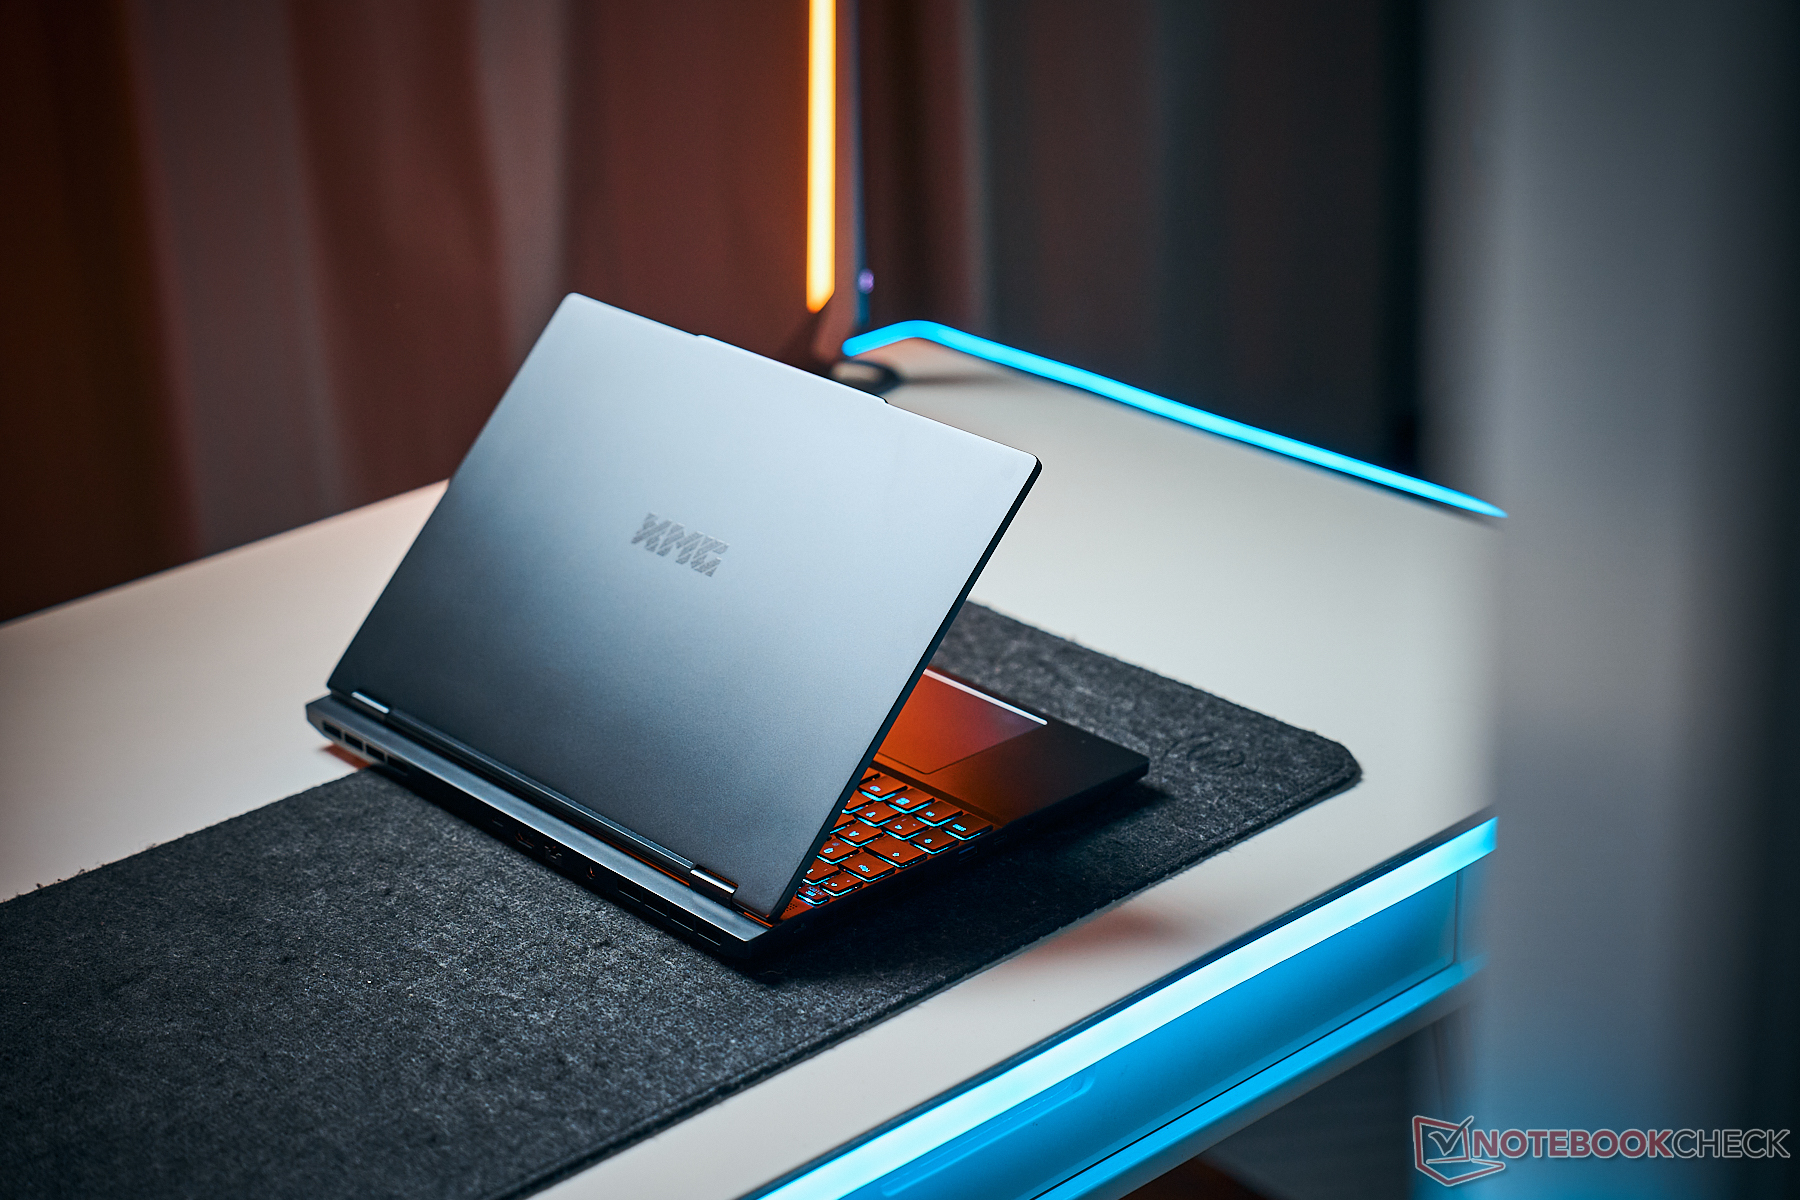
Det är ingen överraskning: I jämförelsefältet är Fusion den mest kompakta enheten - den har den minsta skärmen. Samtidigt är den också den lättaste av dem alla.
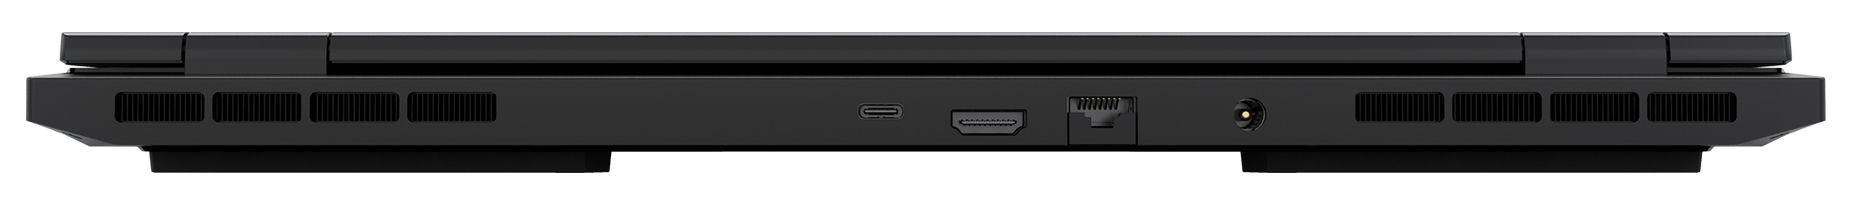
Anslutningsmöjligheter - Fusion 15 med Thunderbolt 4
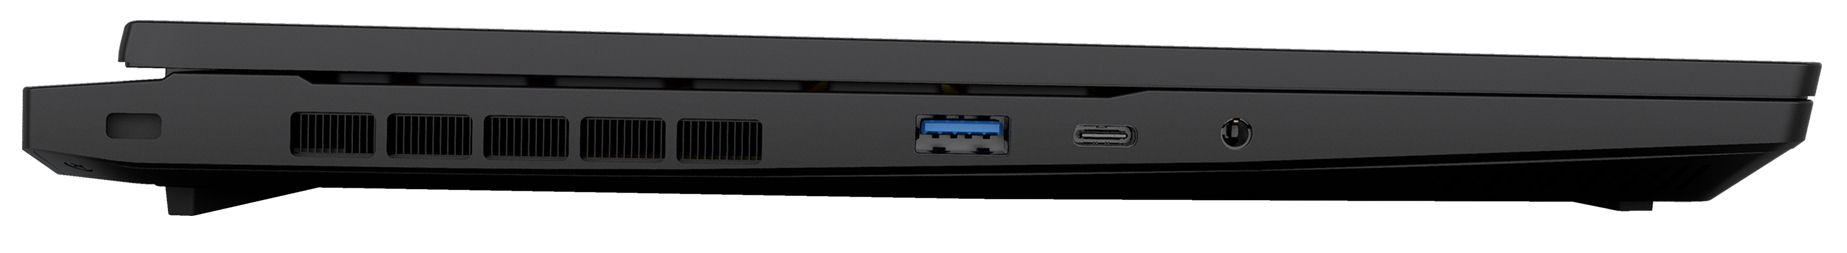
Fusion har tre USB-A-portar (USB 3.2 Gen 1) och två USB-C-portar (1x USB 3.2 Gen 1, 1x Thunderbolt 4). TB4-porten stöder Power Delivery och kan mata ut en DisplayPort-signal. Totalt har den bärbara datorn två videoutgångar (1x HDMI, 1x DP). Ett ljuduttag och en Gigabit Ethernet-port kompletterar anslutningsmöjligheterna. Dess videoutgångar och strömanslutning är placerade på enhetens baksida. Motsvarande kablar löper ut på baksidan, så att de inte kommer i vägen.
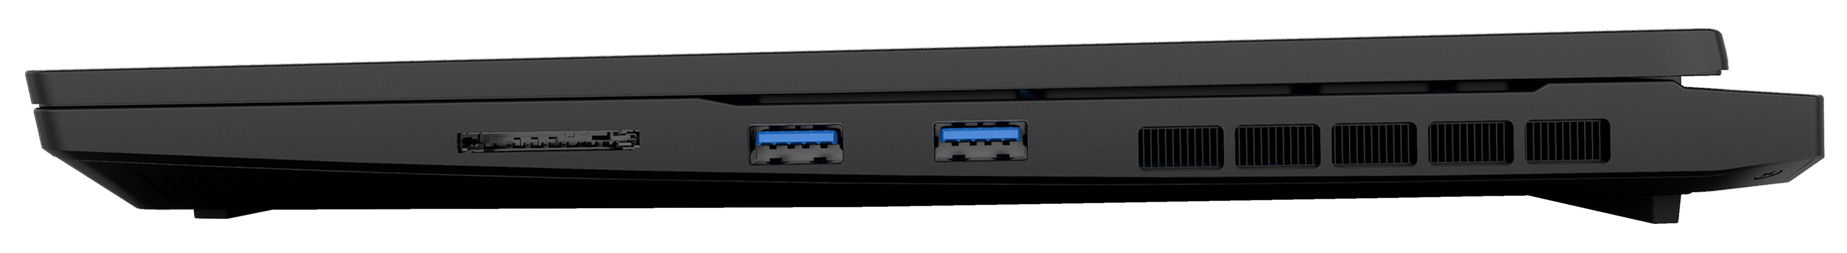
SD-kortläsare
Med överföringshastigheter på 81 MB/s (överföring av 250 jpg-bilder, vardera 5 MB i storlek) och 82 MB/s (kopiering av stora datablock) är SD-kortläsaren (referenskort: AV PRO microSD 128 GB V60) av medelhastighet. Konkurrensen erbjuder till stor del snabbare läsare.
| SD Card Reader | |
| average JPG Copy Test (av. of 3 runs) | |
| Aorus 16X 2024 (AV PRO microSD 128 GB V60) | |
| Genomsnitt av klass Gaming (20.9 - 210, n=54, senaste 2 åren) | |
| Schenker XMG Fusion 15 (Early 24) (AV PRO microSD 128 GB V60) | |
| Alienware m16 R2 (AV PRO microSD 128 GB V60) | |
| maximum AS SSD Seq Read Test (1GB) | |
| Alienware m16 R2 (AV PRO microSD 128 GB V60) | |
| Aorus 16X 2024 (AV PRO microSD 128 GB V60) | |
| Genomsnitt av klass Gaming (25.5 - 261, n=51, senaste 2 åren) | |
| Schenker XMG Fusion 15 (Early 24) (AV PRO microSD 128 GB V60) | |
Kommunikation
Fusion använder ett WiFi 6E-chip (Intel AX211) som i bästa fall (inga WiFi-enheter i närheten, kort avstånd mellan bärbar dator och server) uppnår mycket bra datahastigheter. Trådbundna anslutningar sköts av en Gigabit Ethernet-kontroller (YT6801) från Motorcomm - en tillverkare som vi inte har stött på tidigare.
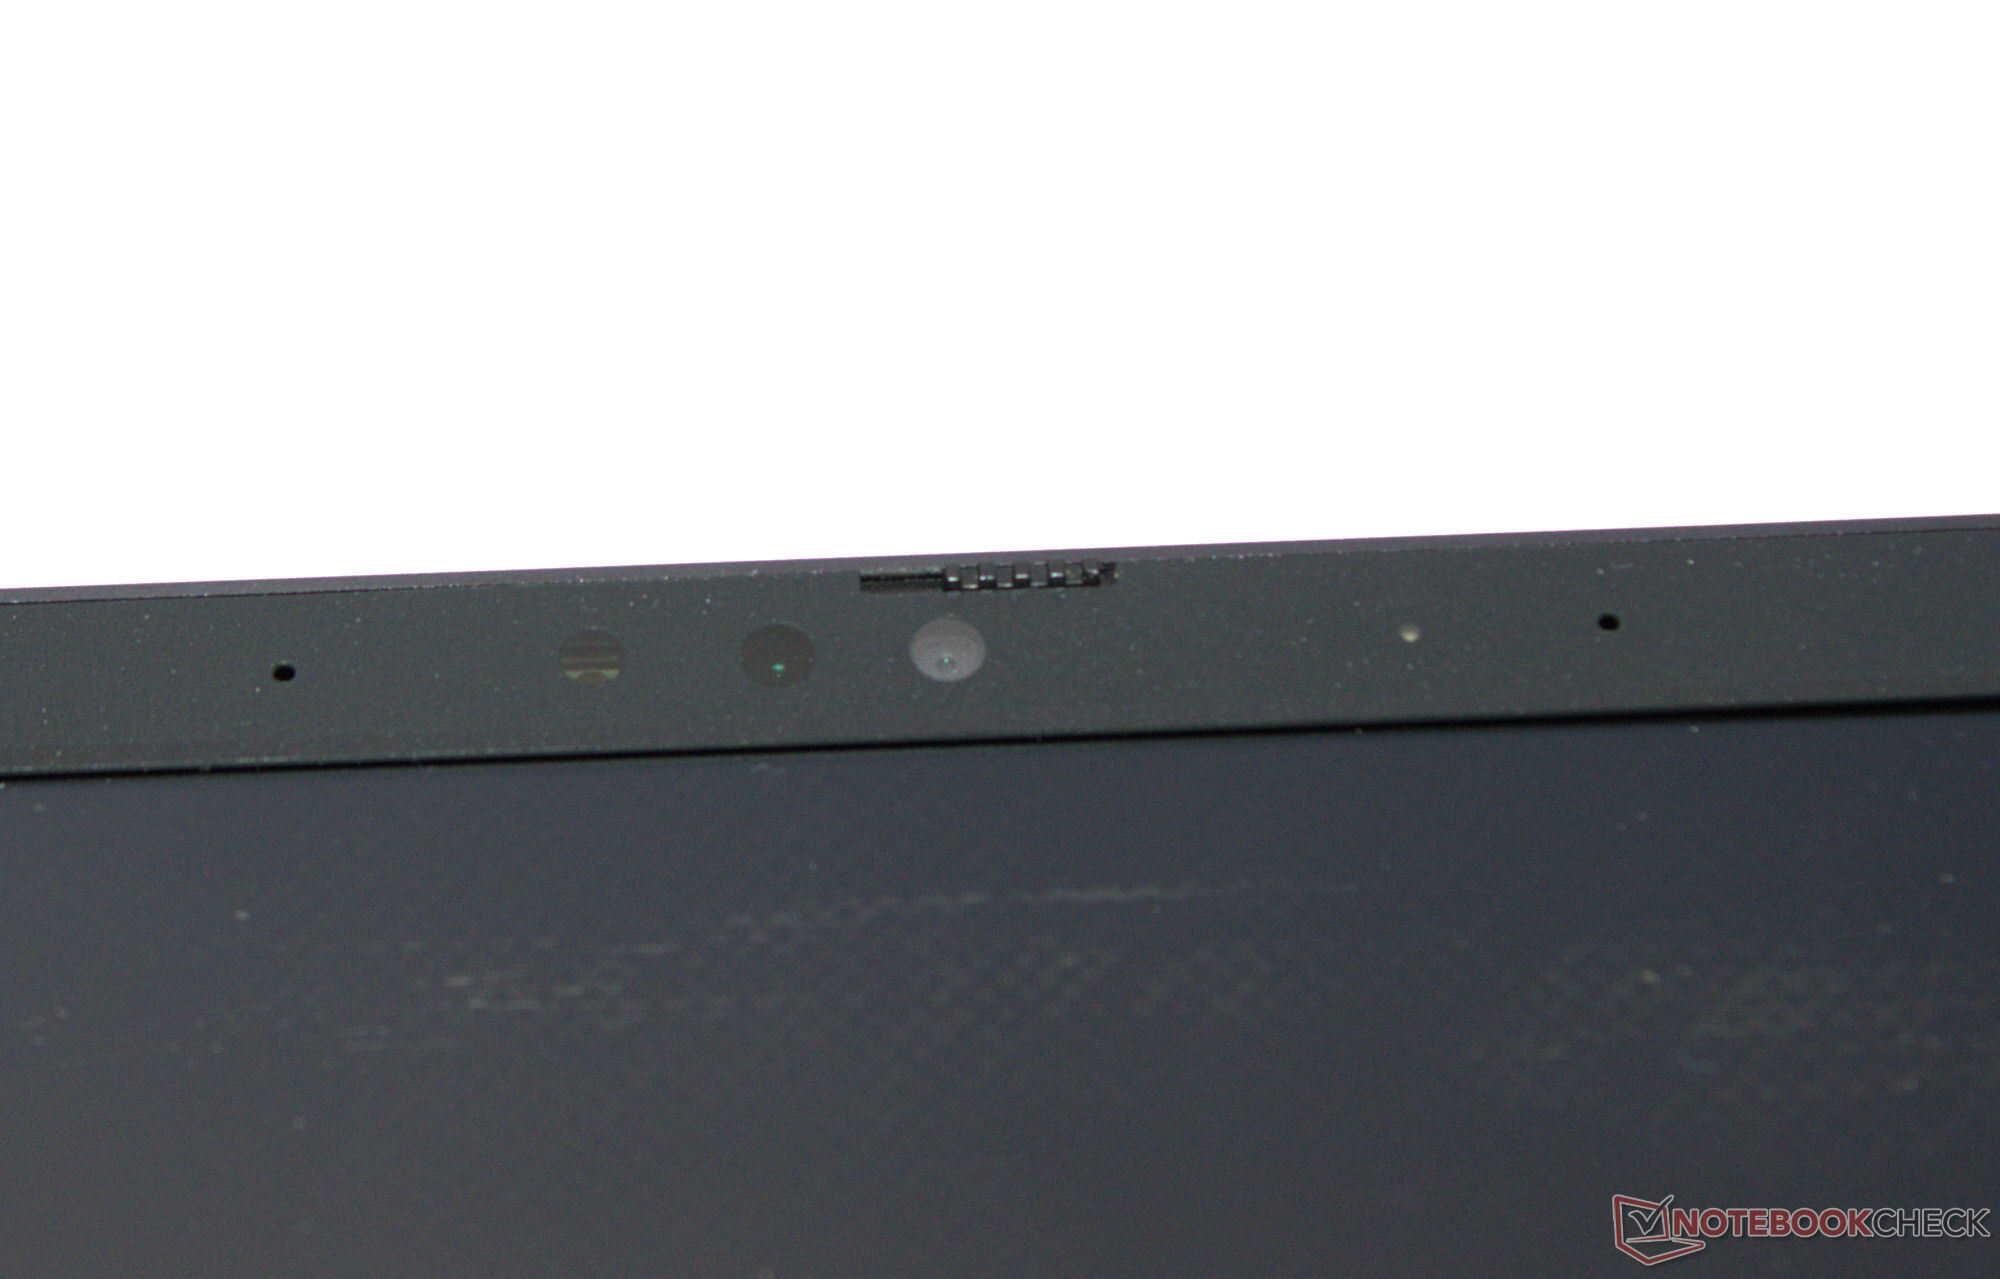
Webbkamera
Dess webbkamera (2,1 MP) är av genomsnittlig kvalitet. Den misslyckas när det gäller färgprecision: Med en avvikelse på cirka 9 har målvärdet (DeltaE<3) missats. Den har dock stöd för Windows Hello. Dessutom är den utrustad med ett mekaniskt skydd.

 GeForce RTX 4070 Laptop GPU, i9-14900HX, Samsung 990 Pro 1 TB")
 GeForce RTX 4070 Laptop GPU, i9-14900HX, Samsung 990 Pro 1 TB")
Tillbehör
Den bärbara datorn levereras med ett USB-minne (drivrutin, manualer), klistermärken och en musmatta.
Underhåll
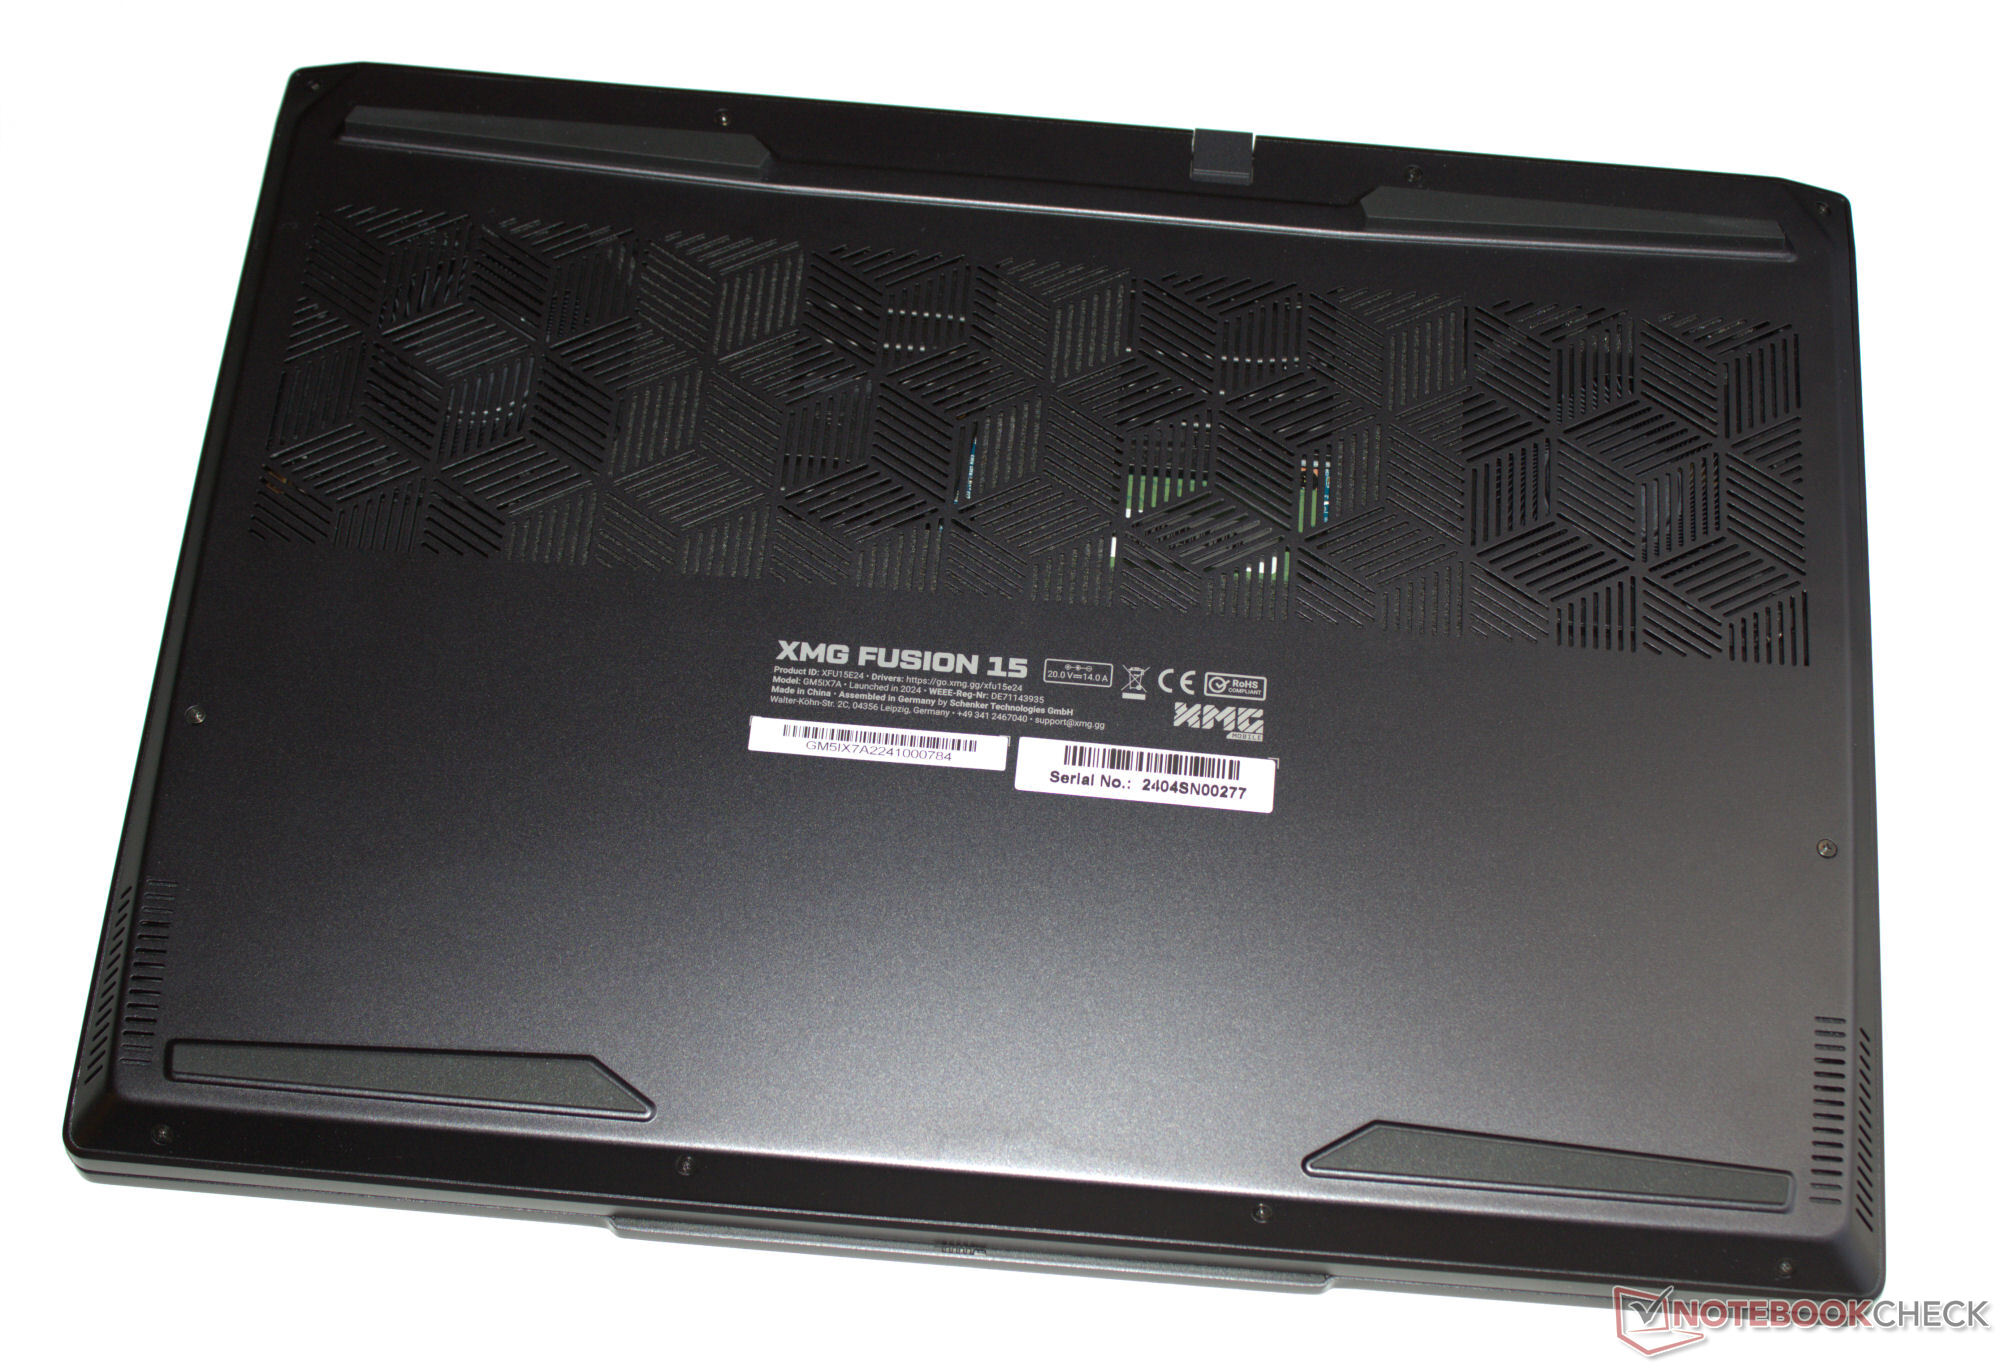
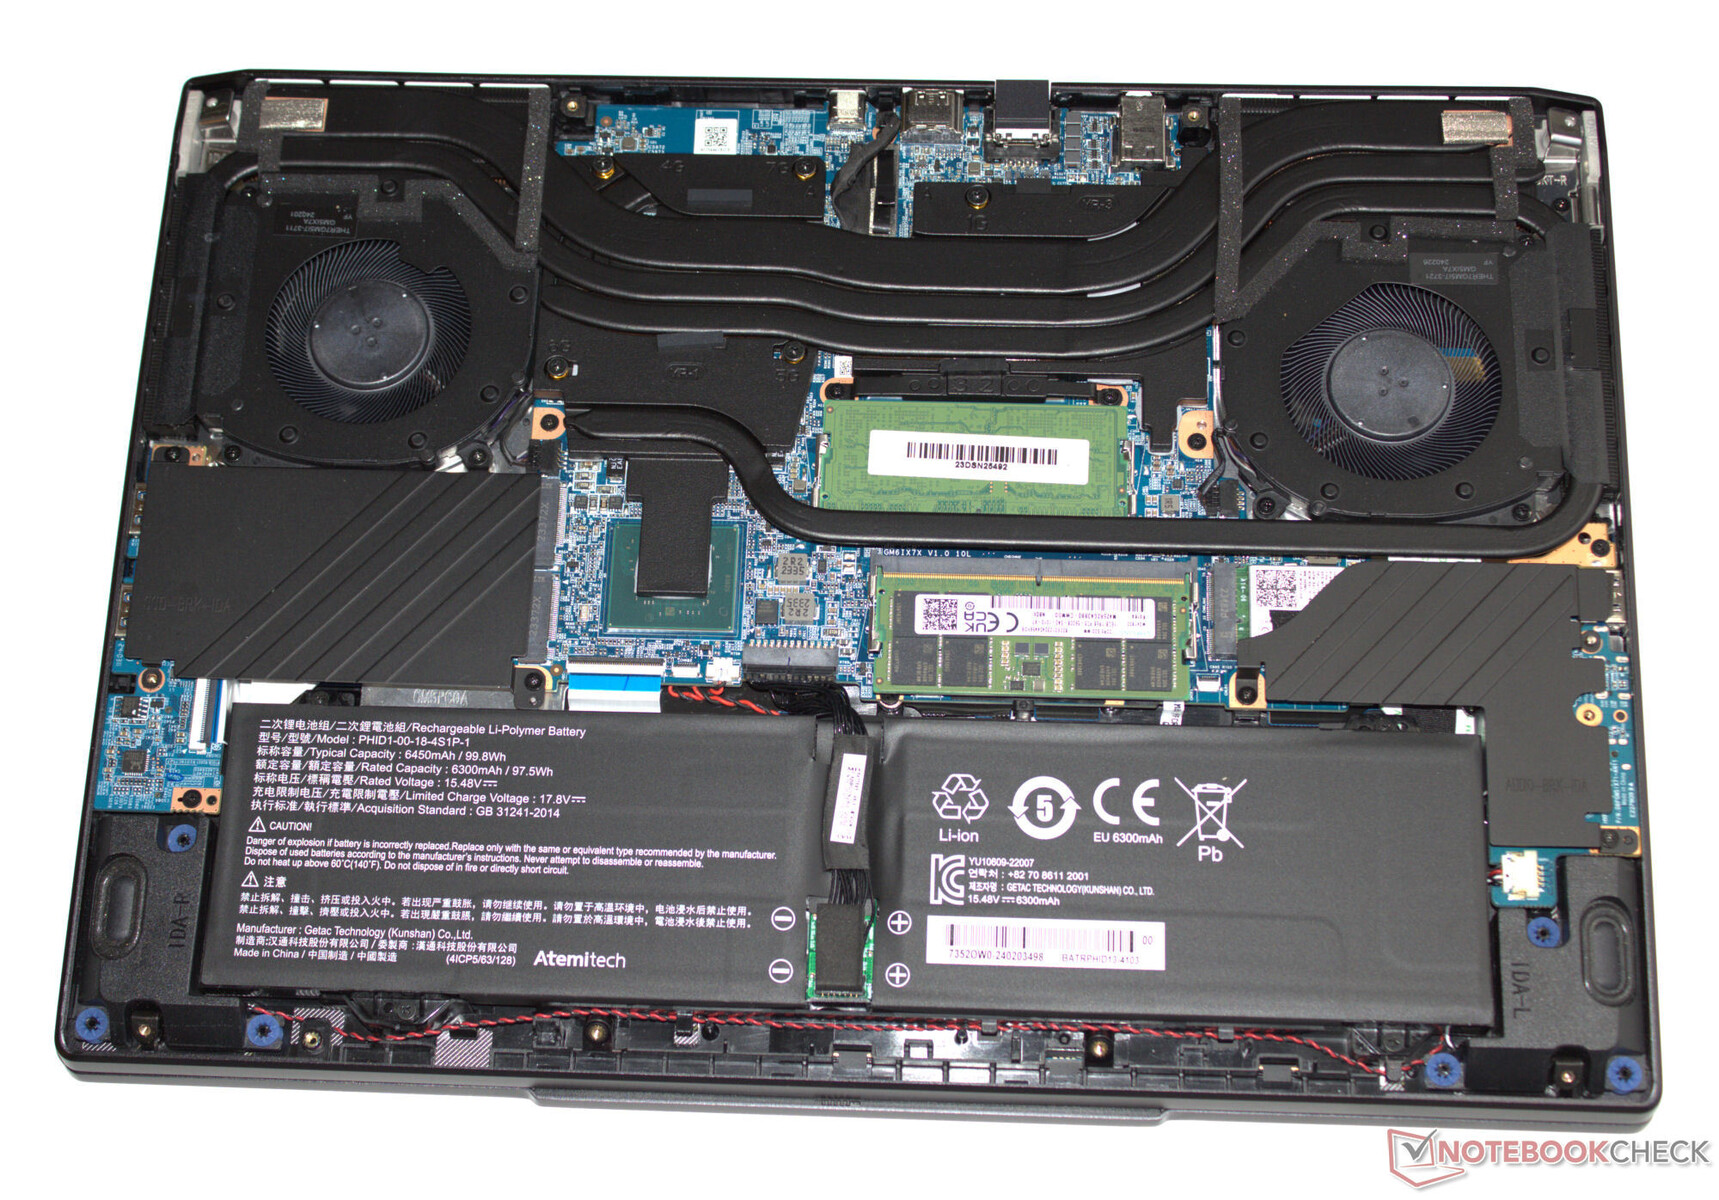
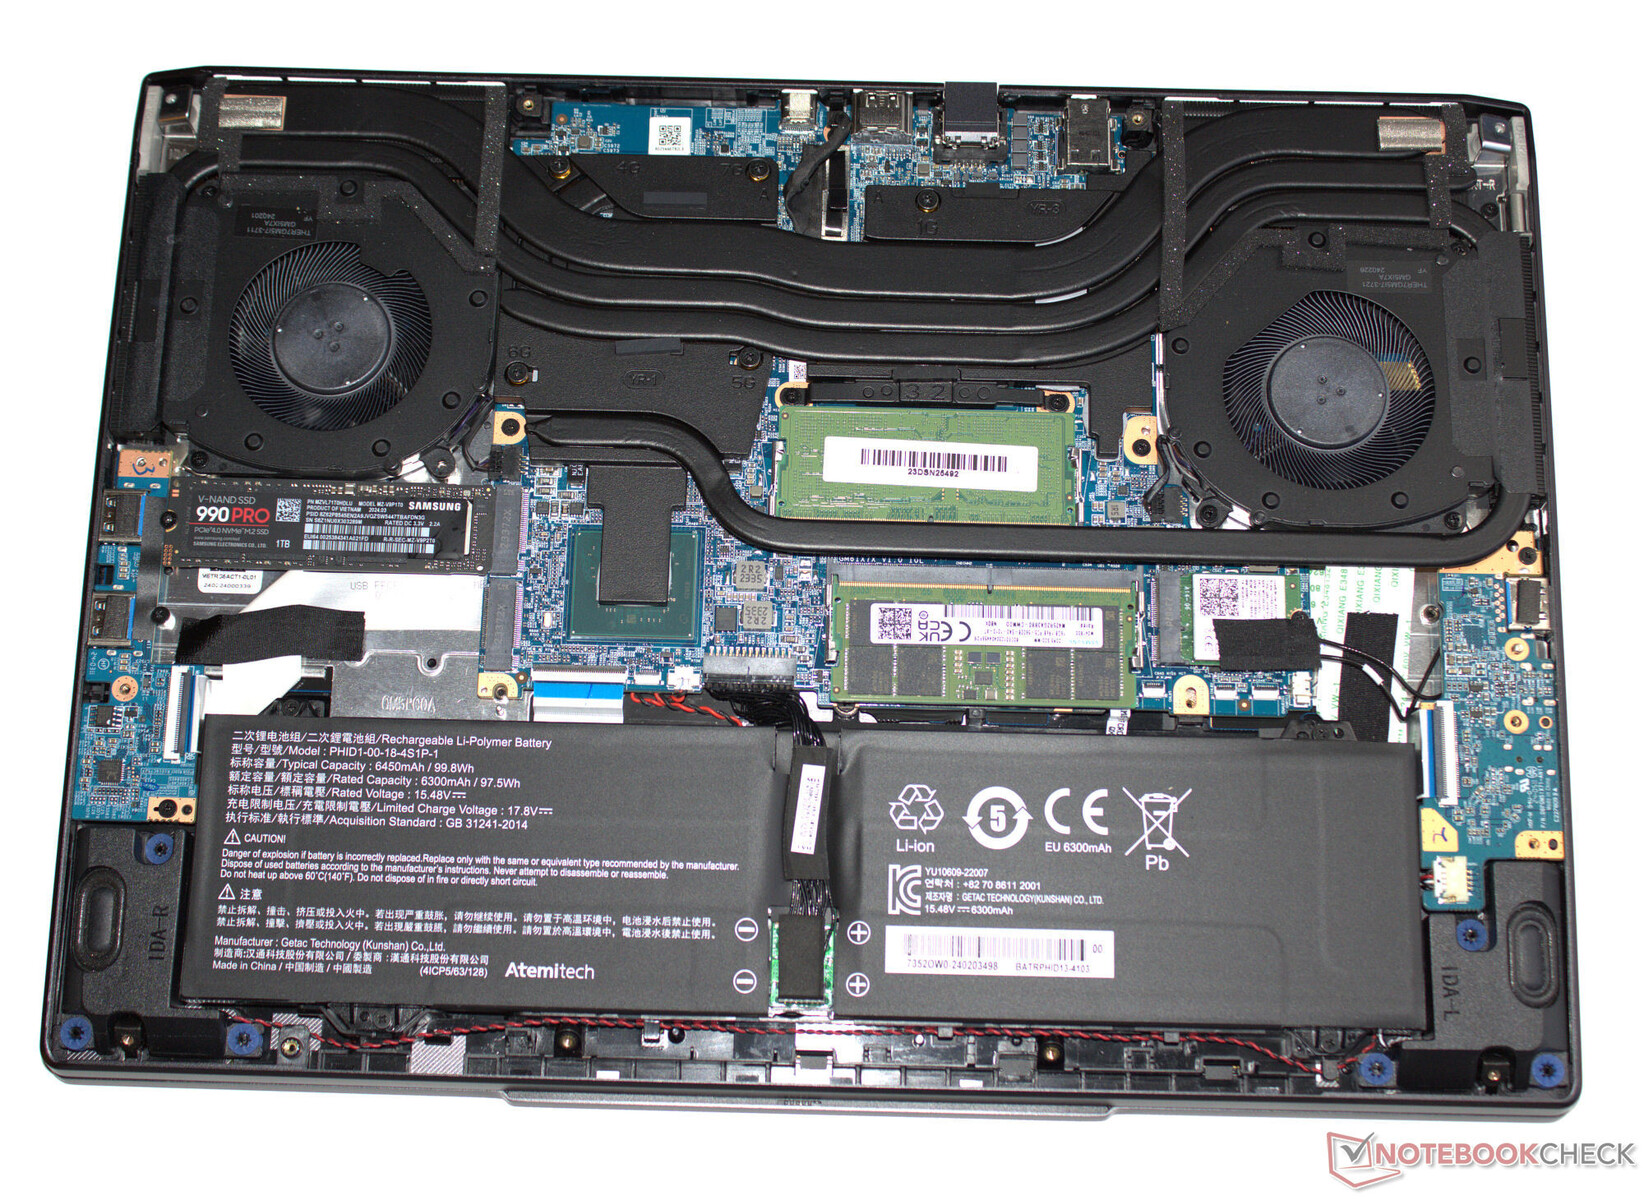
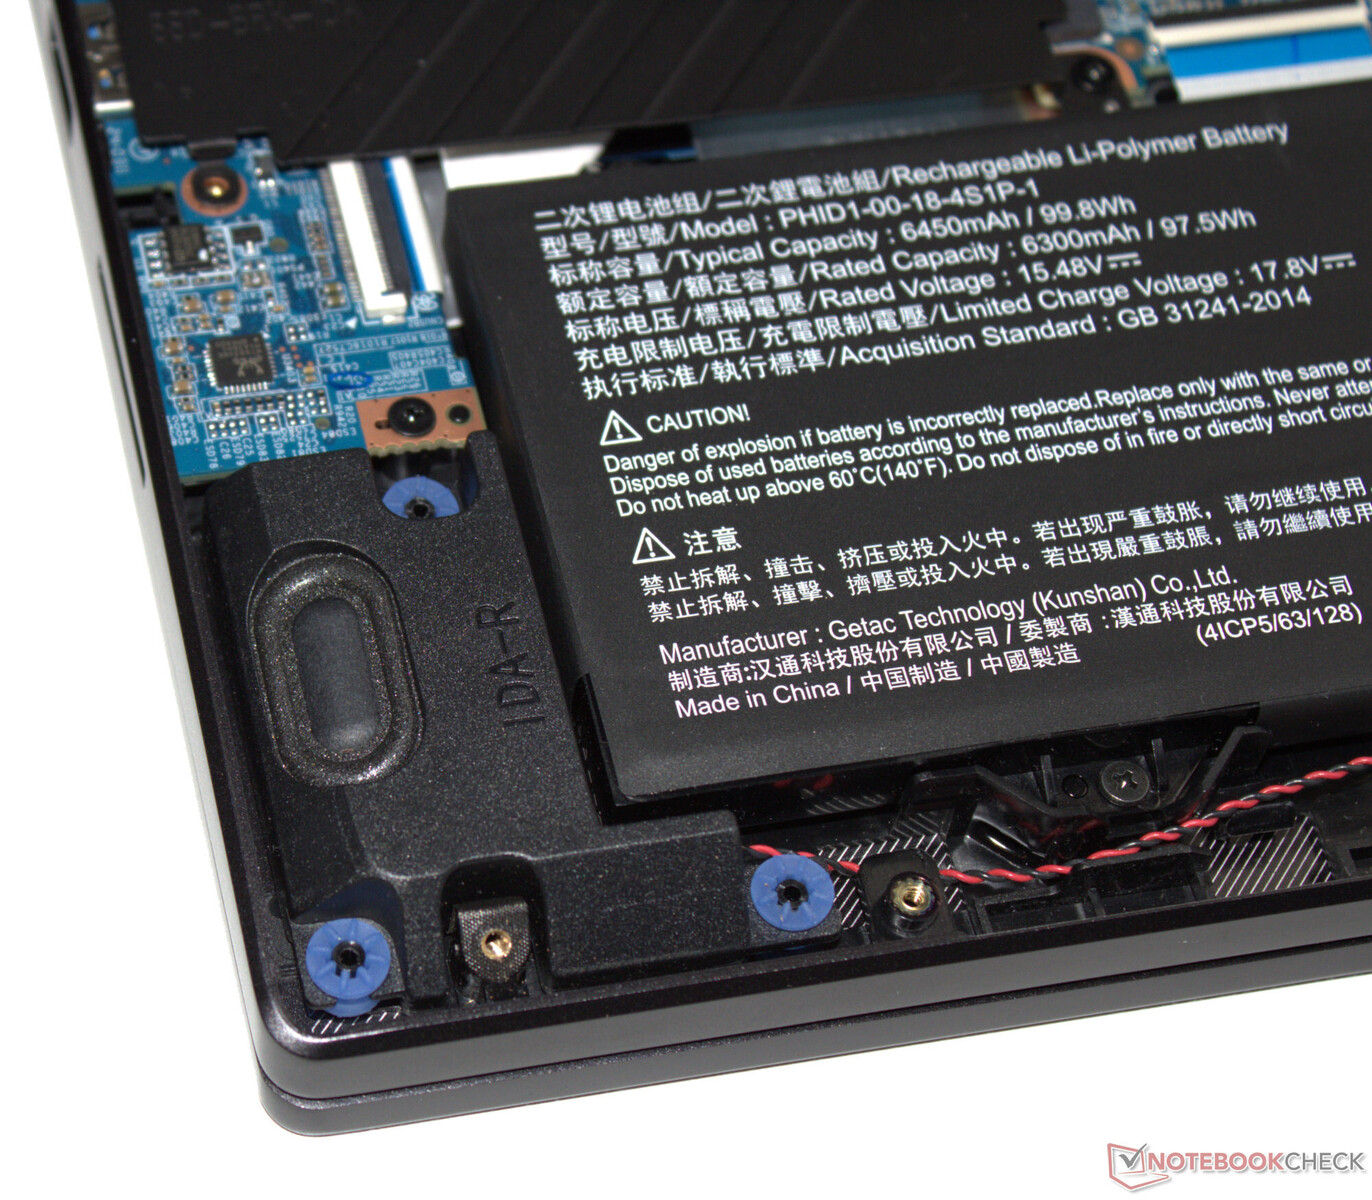
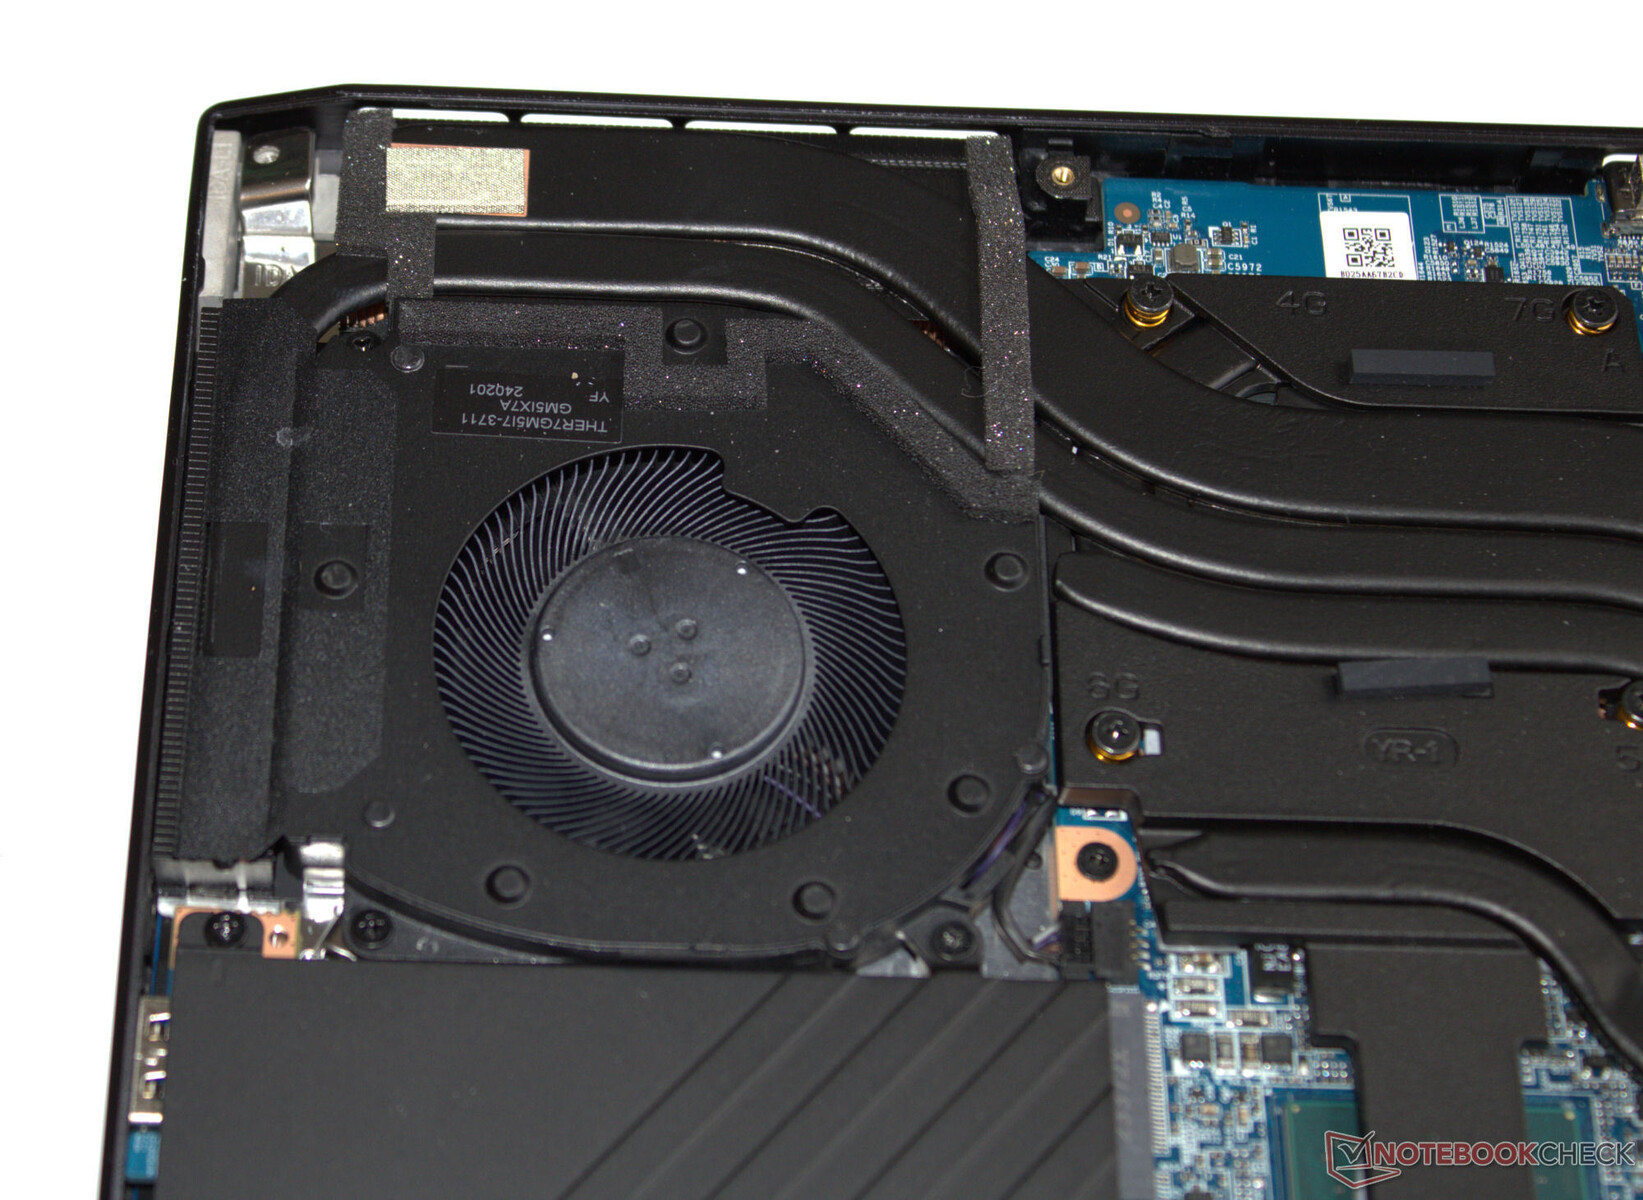
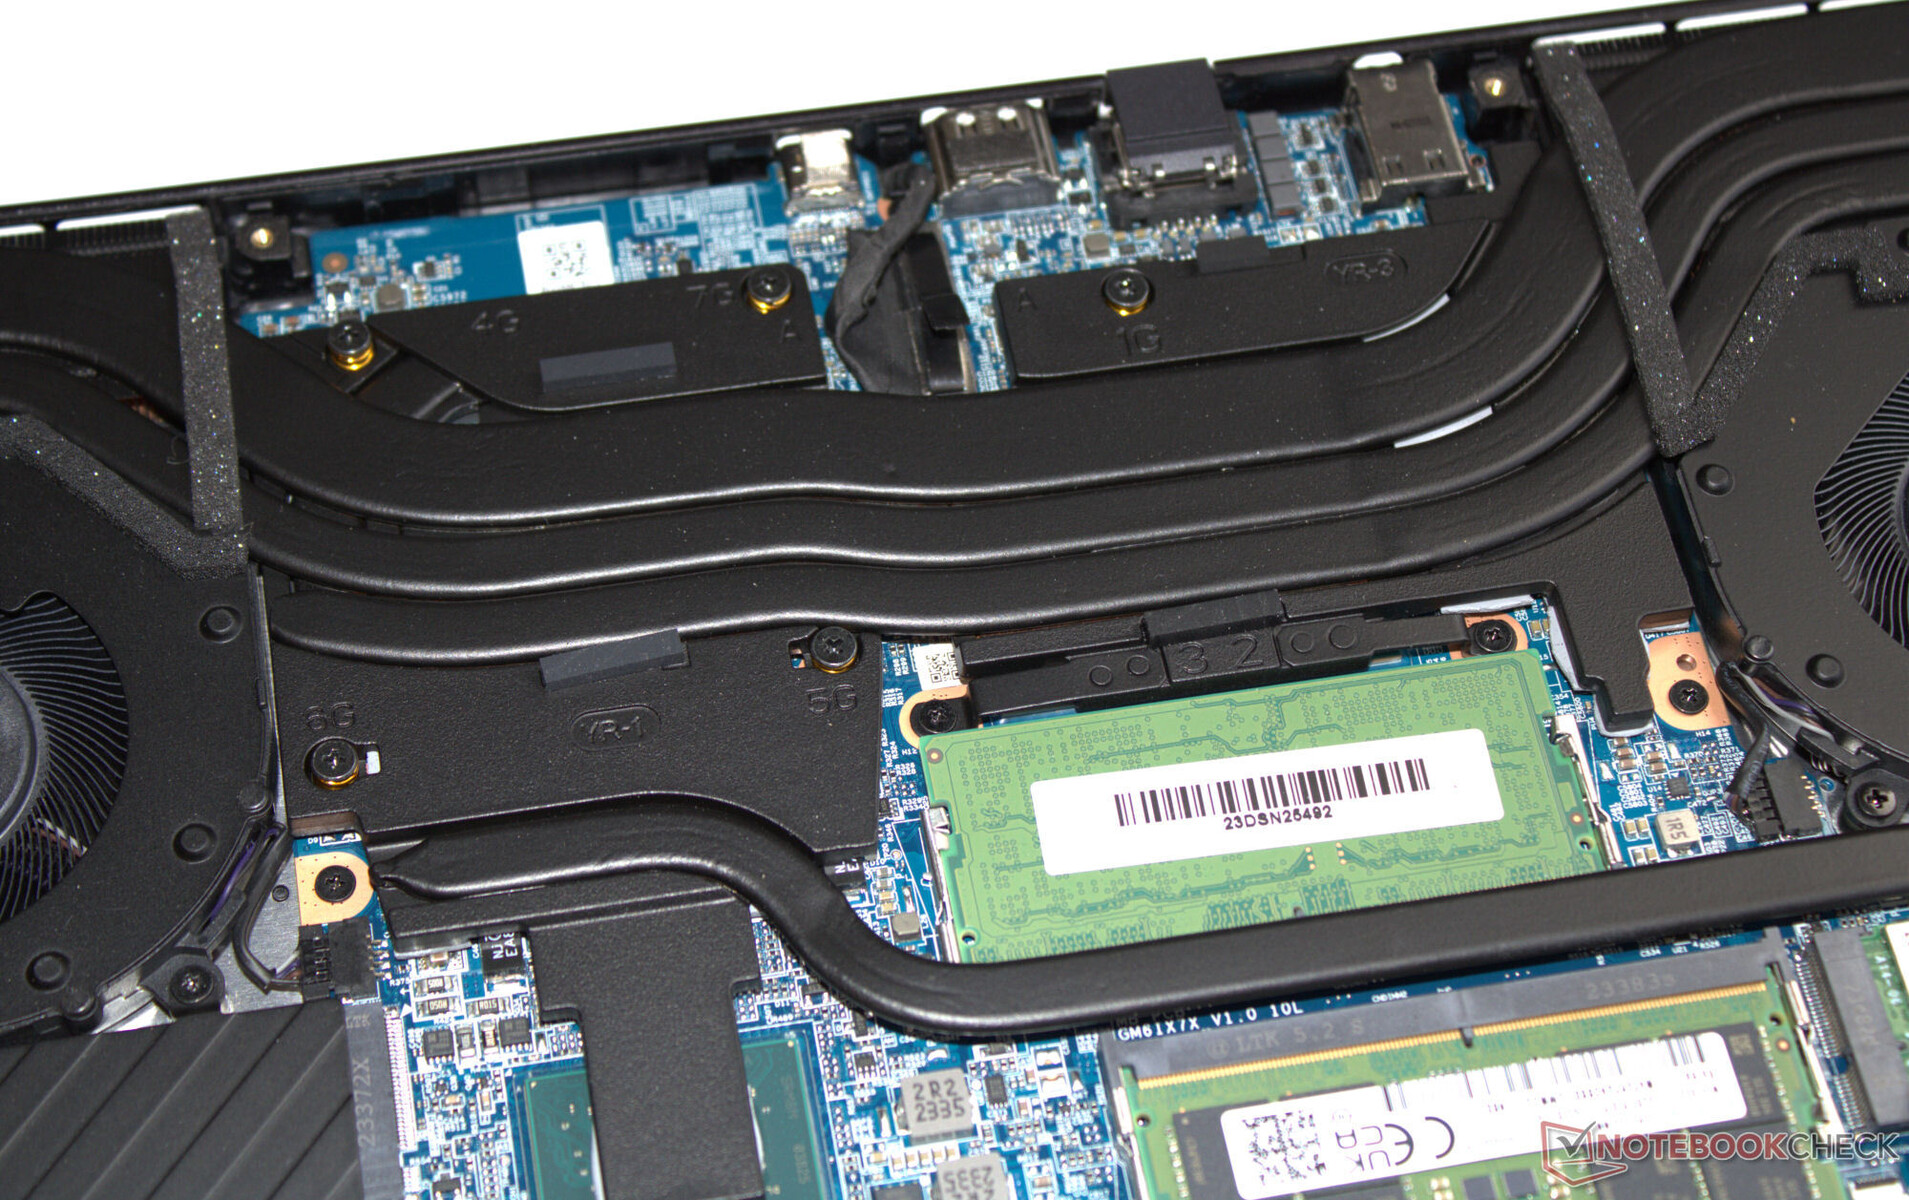
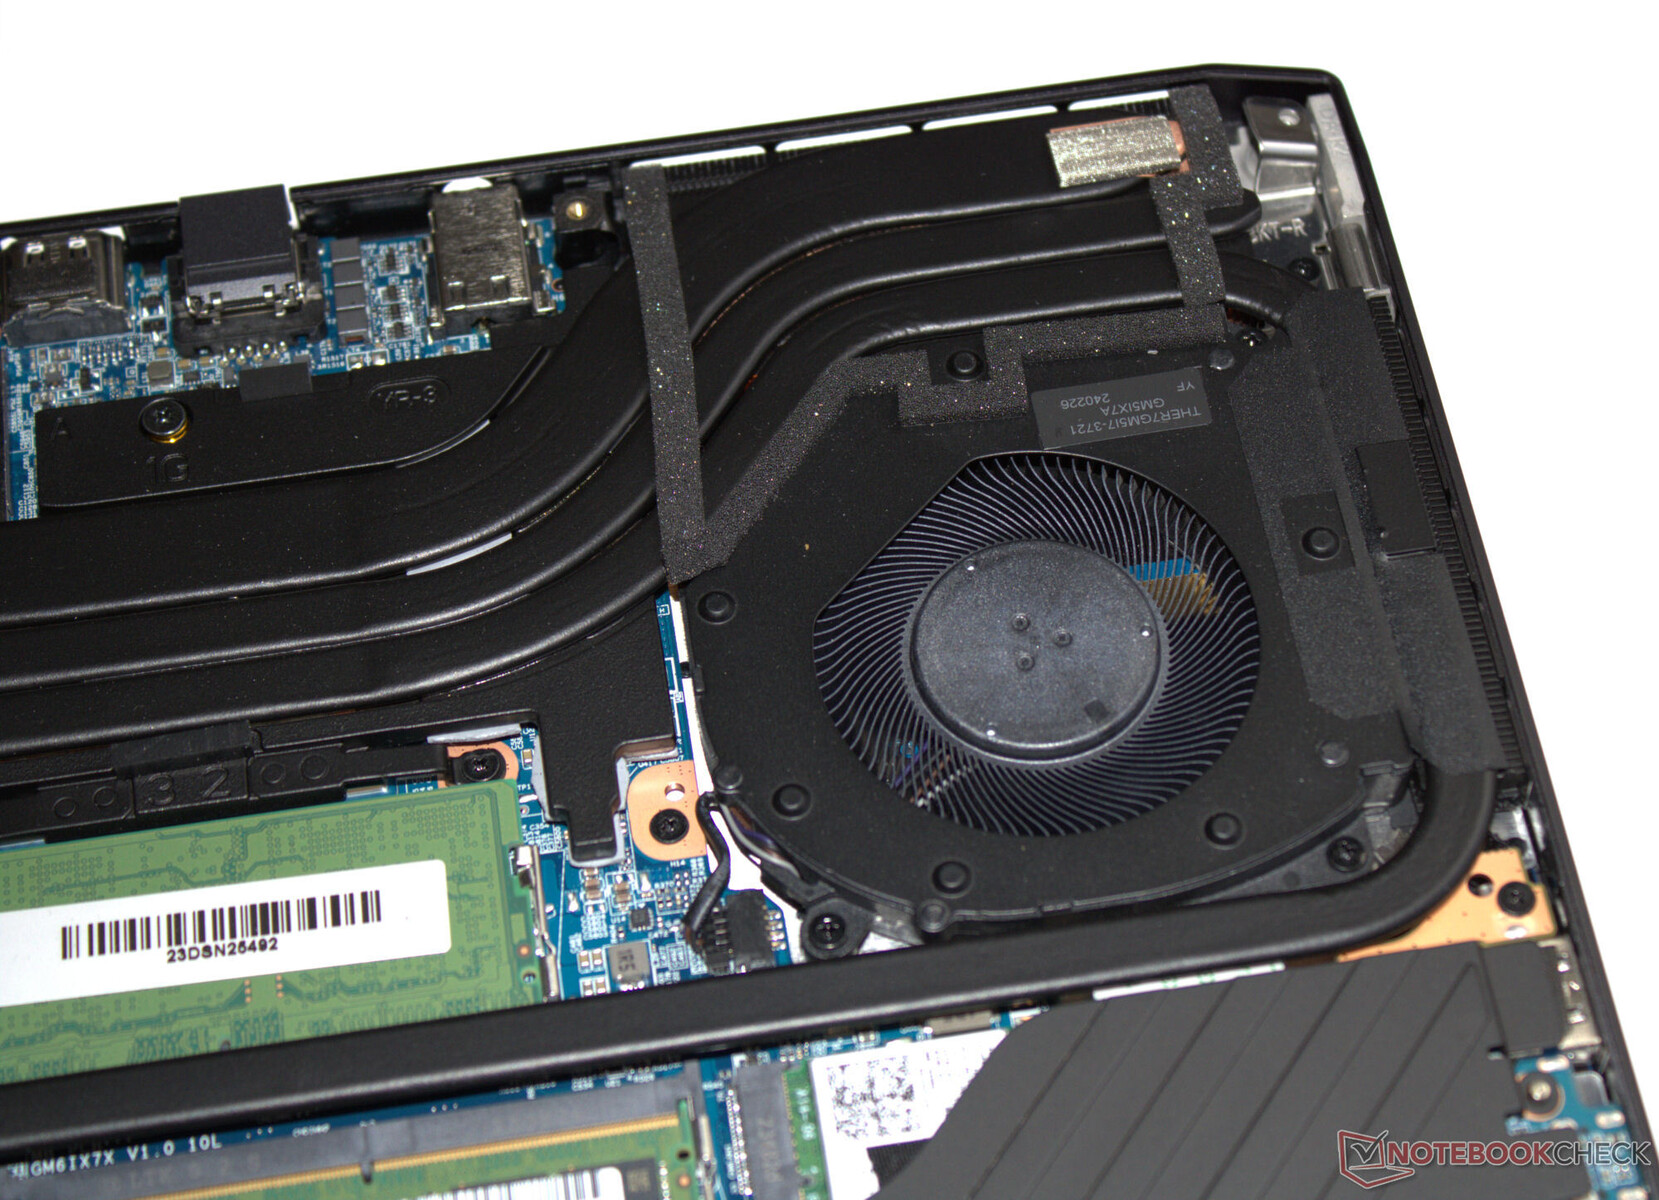
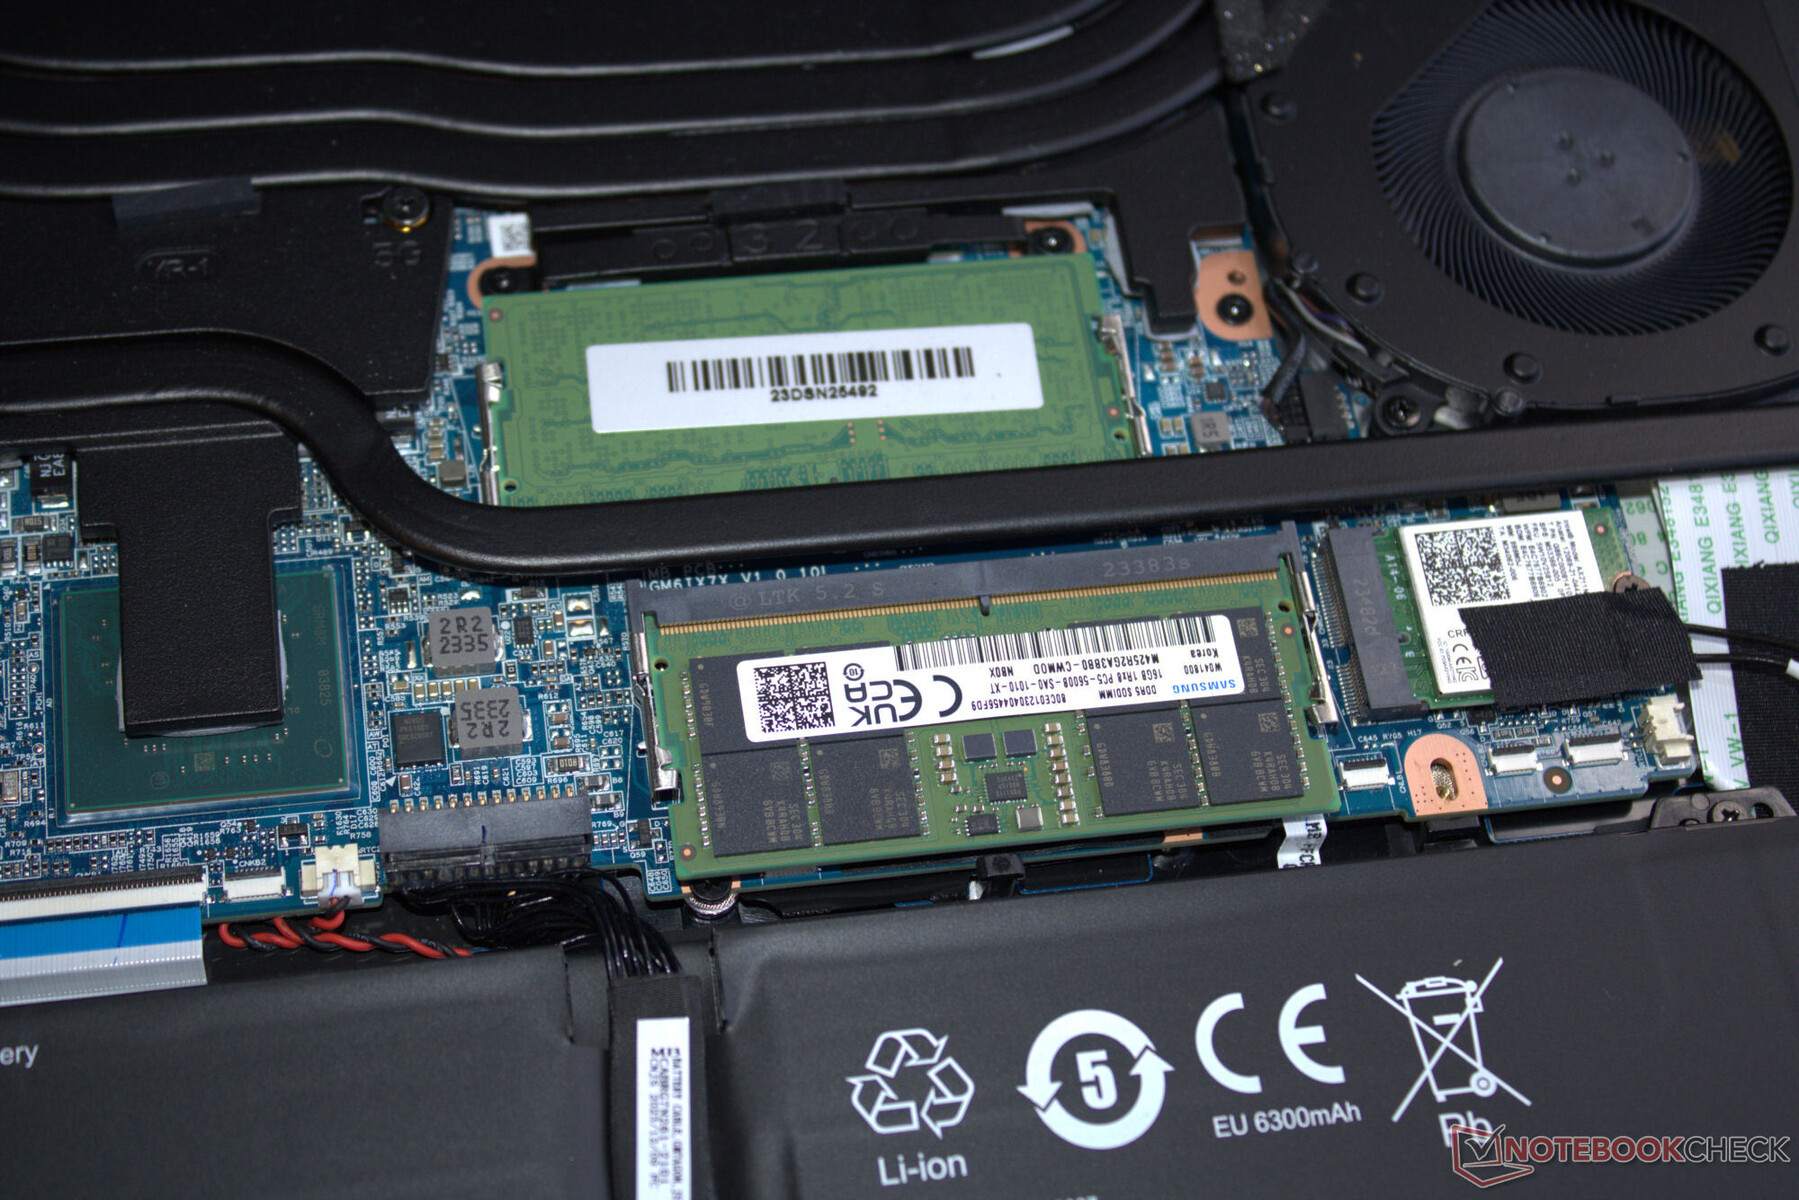
Efter att ha tagit bort alla skruvar på enhetens undersida kan den nedre delen av höljet tas bort ganska enkelt - du kan bara behöva ett plektrum eller en platt spatel för att hjälpa till med detta. Därefter kan du komma åt RAM-bankerna (båda upptagna), SSD (PCIe 4, M.2-2280), andra SSD-platsen (PCIe 4, M.2-2280), WLAN-modul, fläktar, BIOS-batteri och den bärbara datorns batteri.
Garanti
Enheten omfattas av en basgaranti som varar i två år - detta inkluderar upphämtningsservice och en 6-månaders snabb reparationsservice (reparation inom 48 timmar). Du kan förlänga garantin till 36 månader mot en avgift.
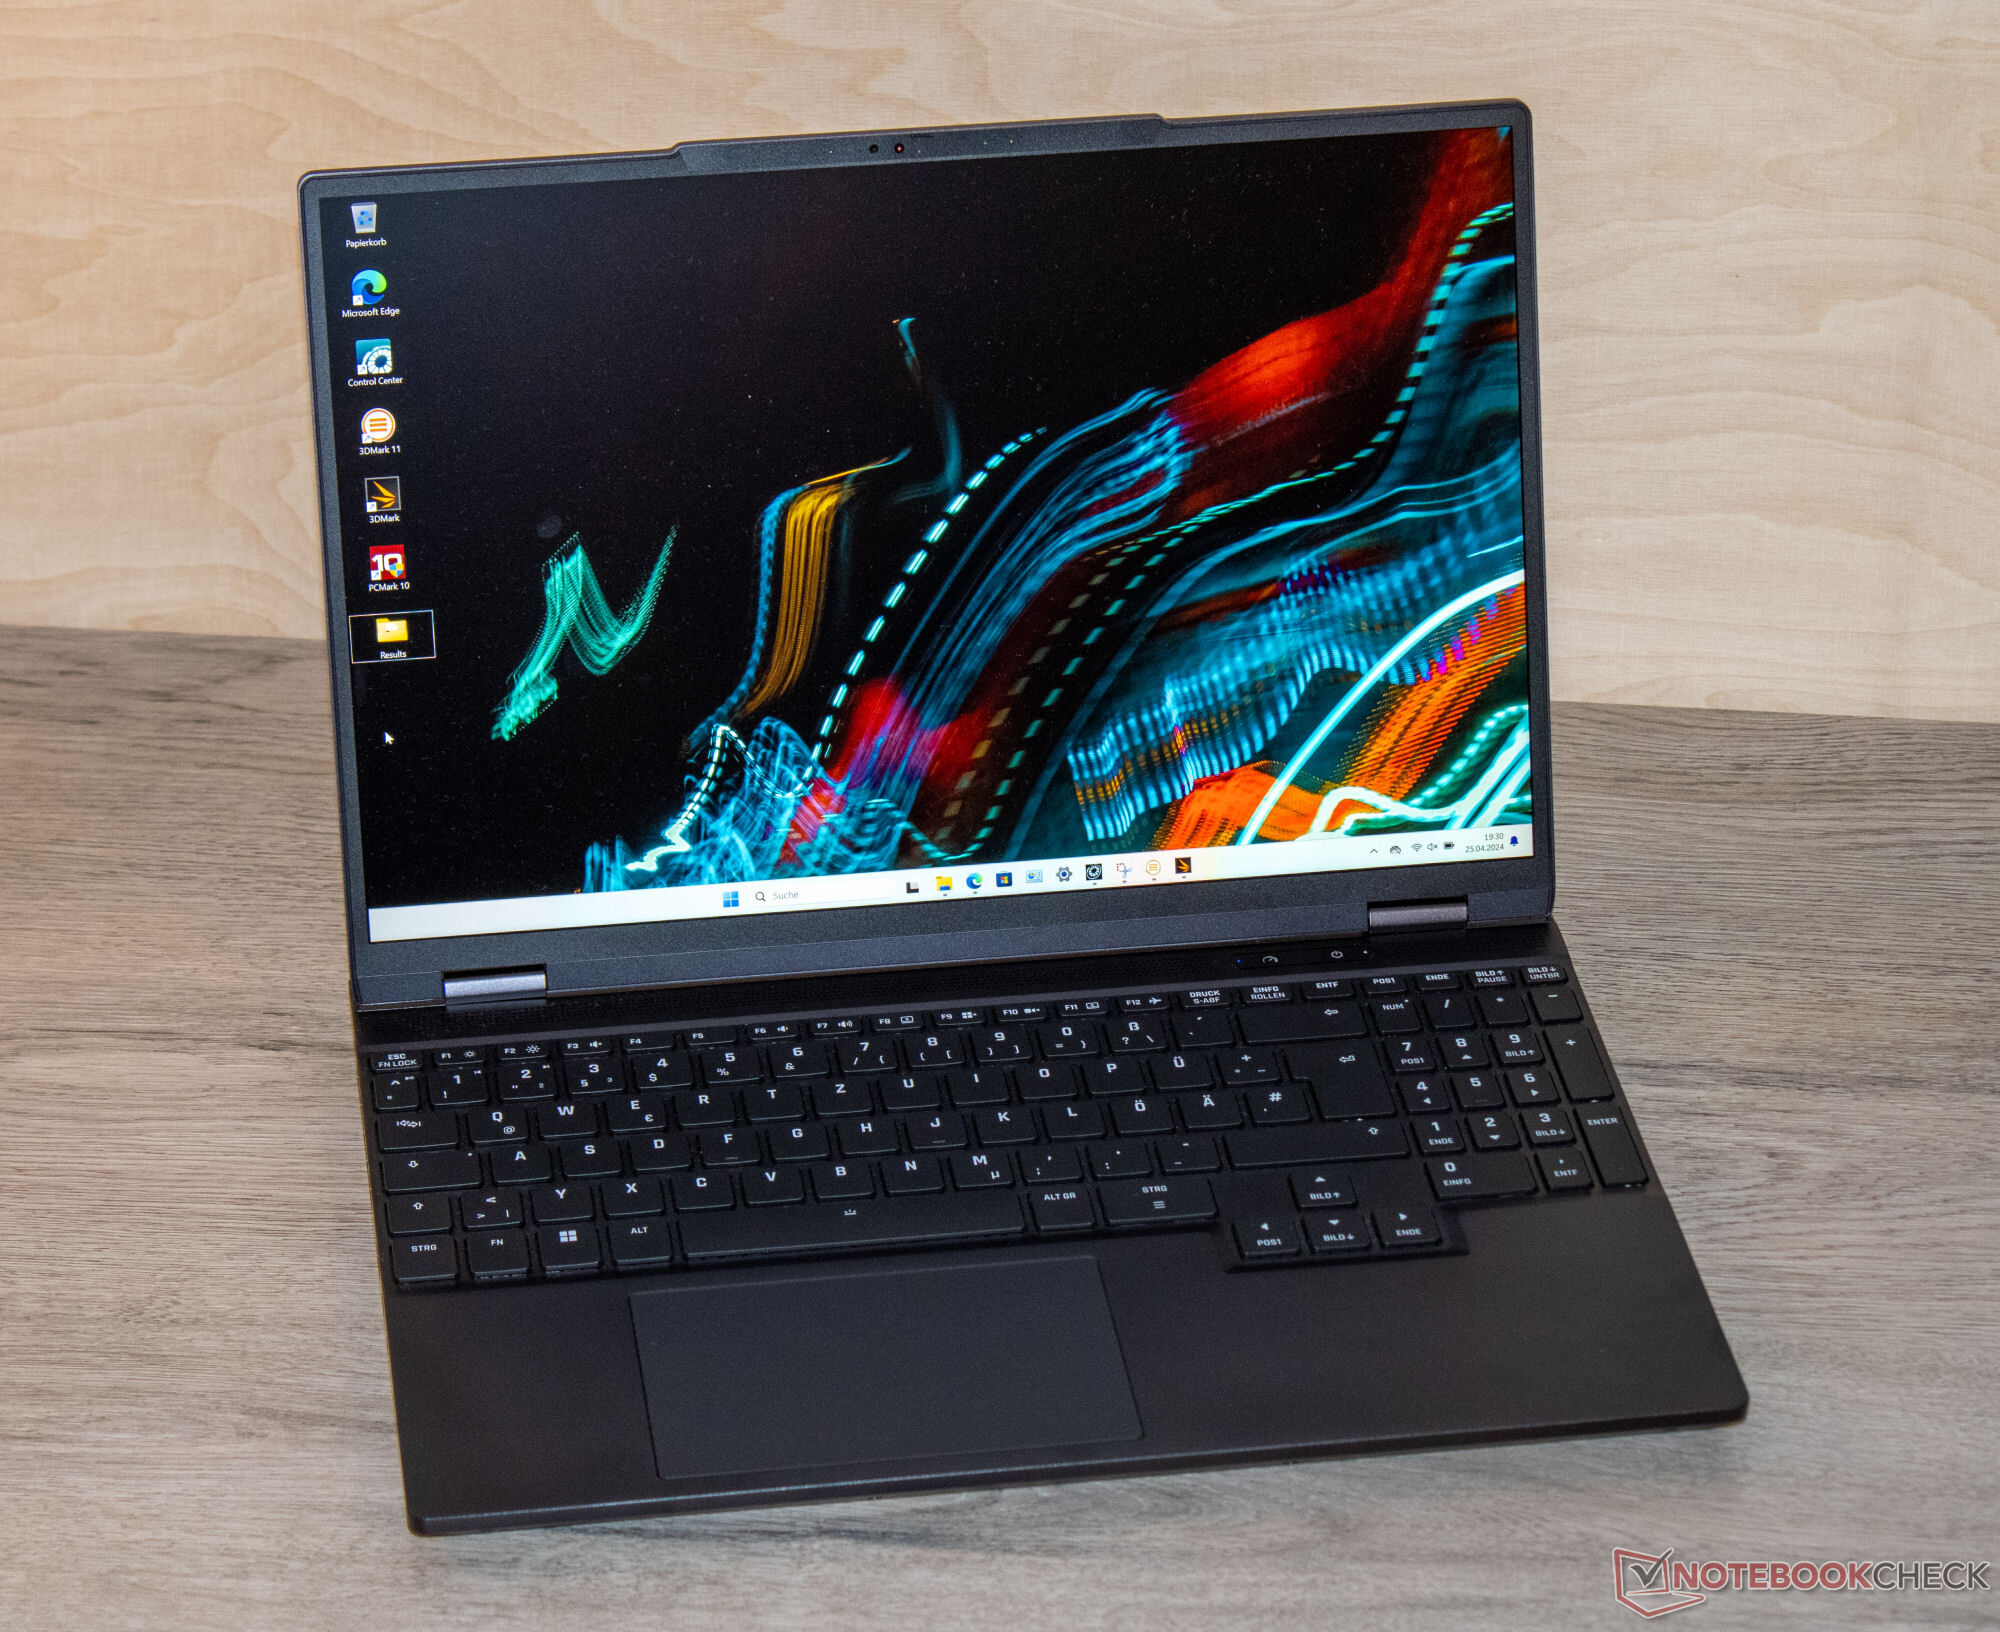
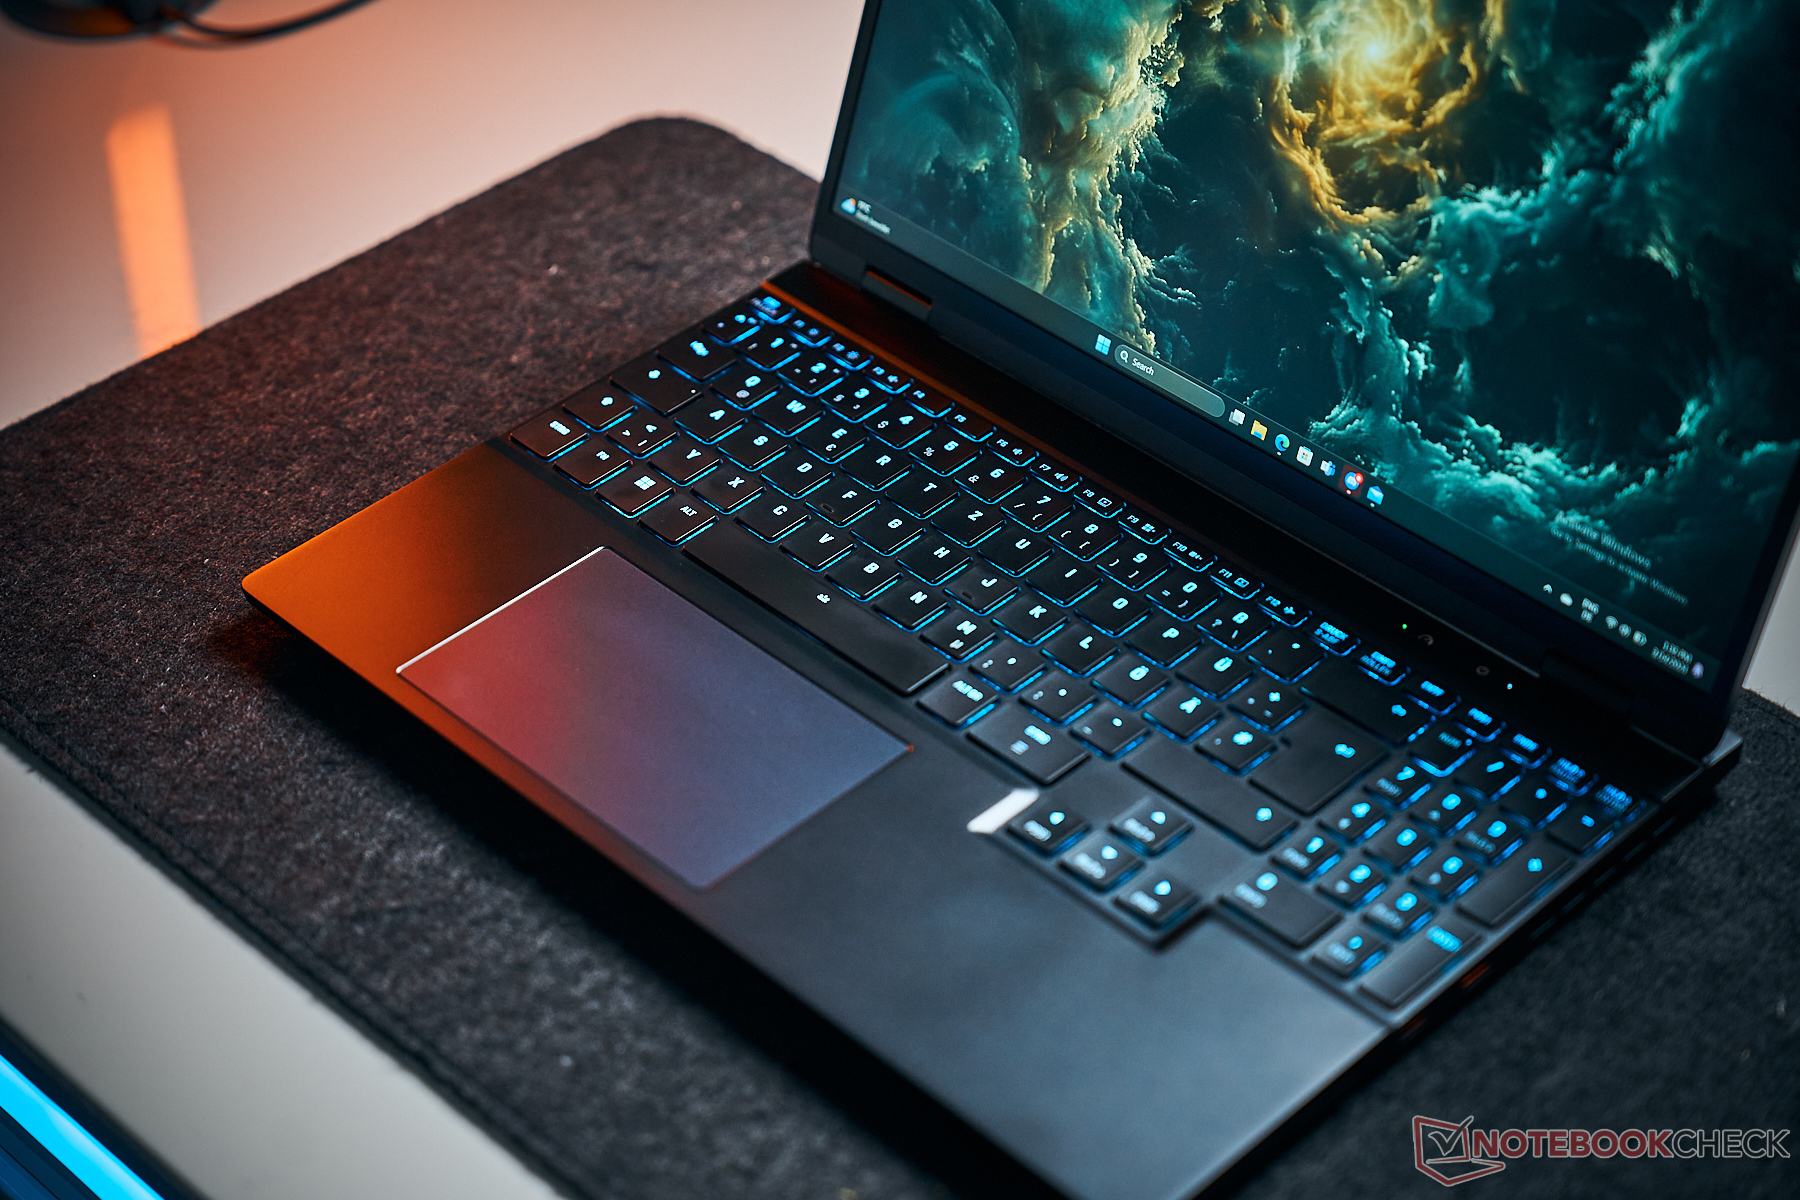
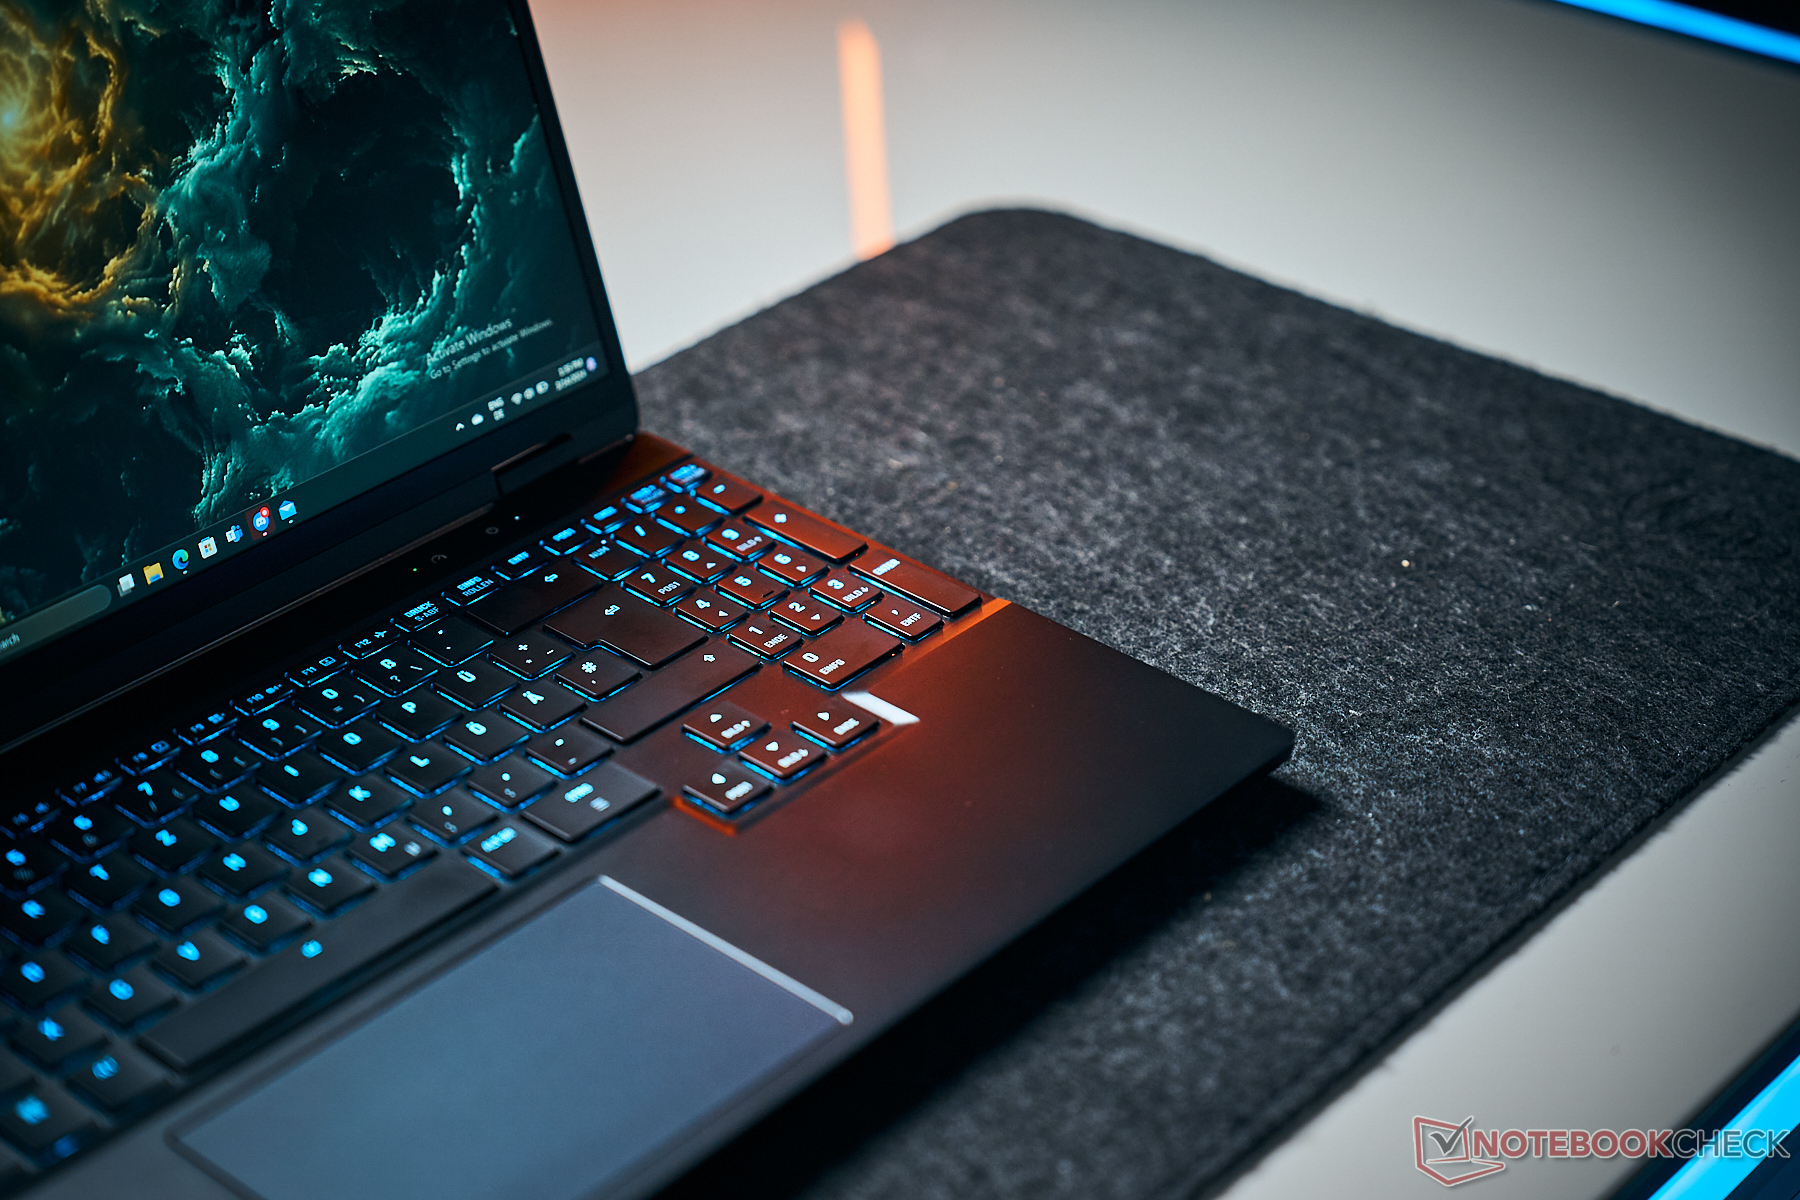
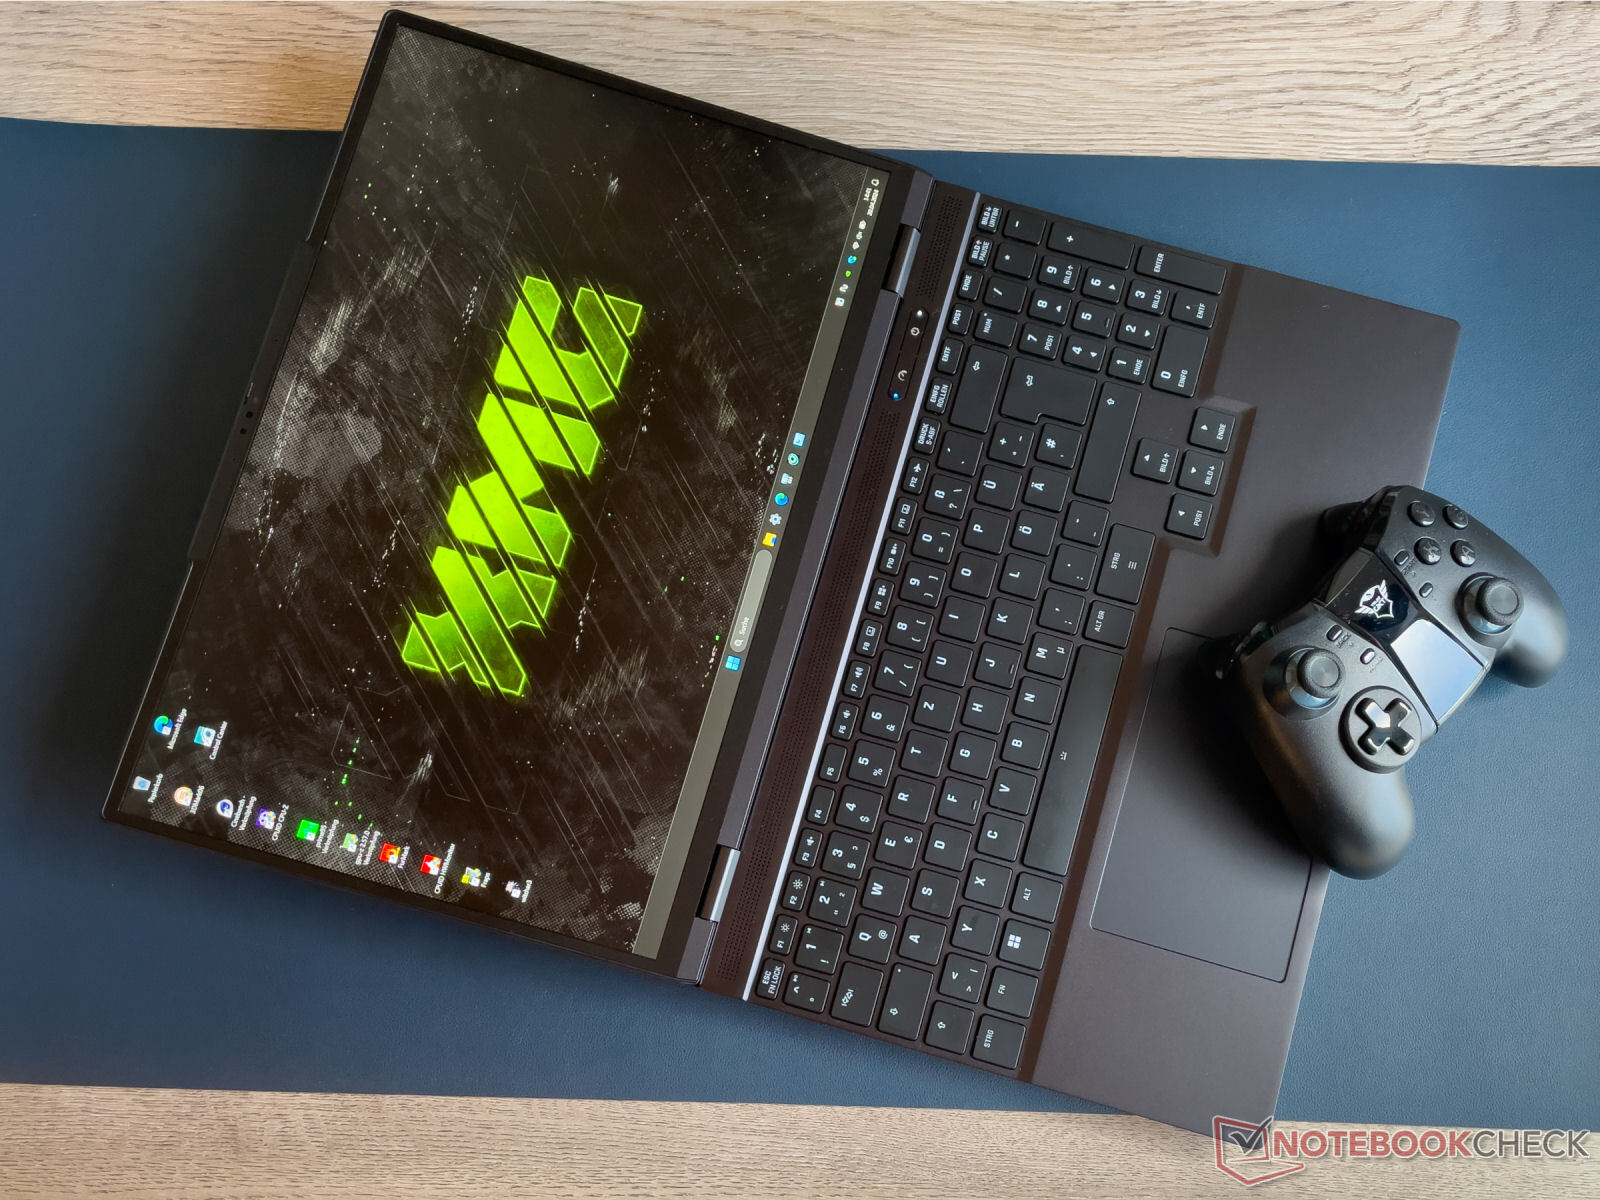
Inmatningsenheter - RGB-bakgrundsbelysning med en knapp
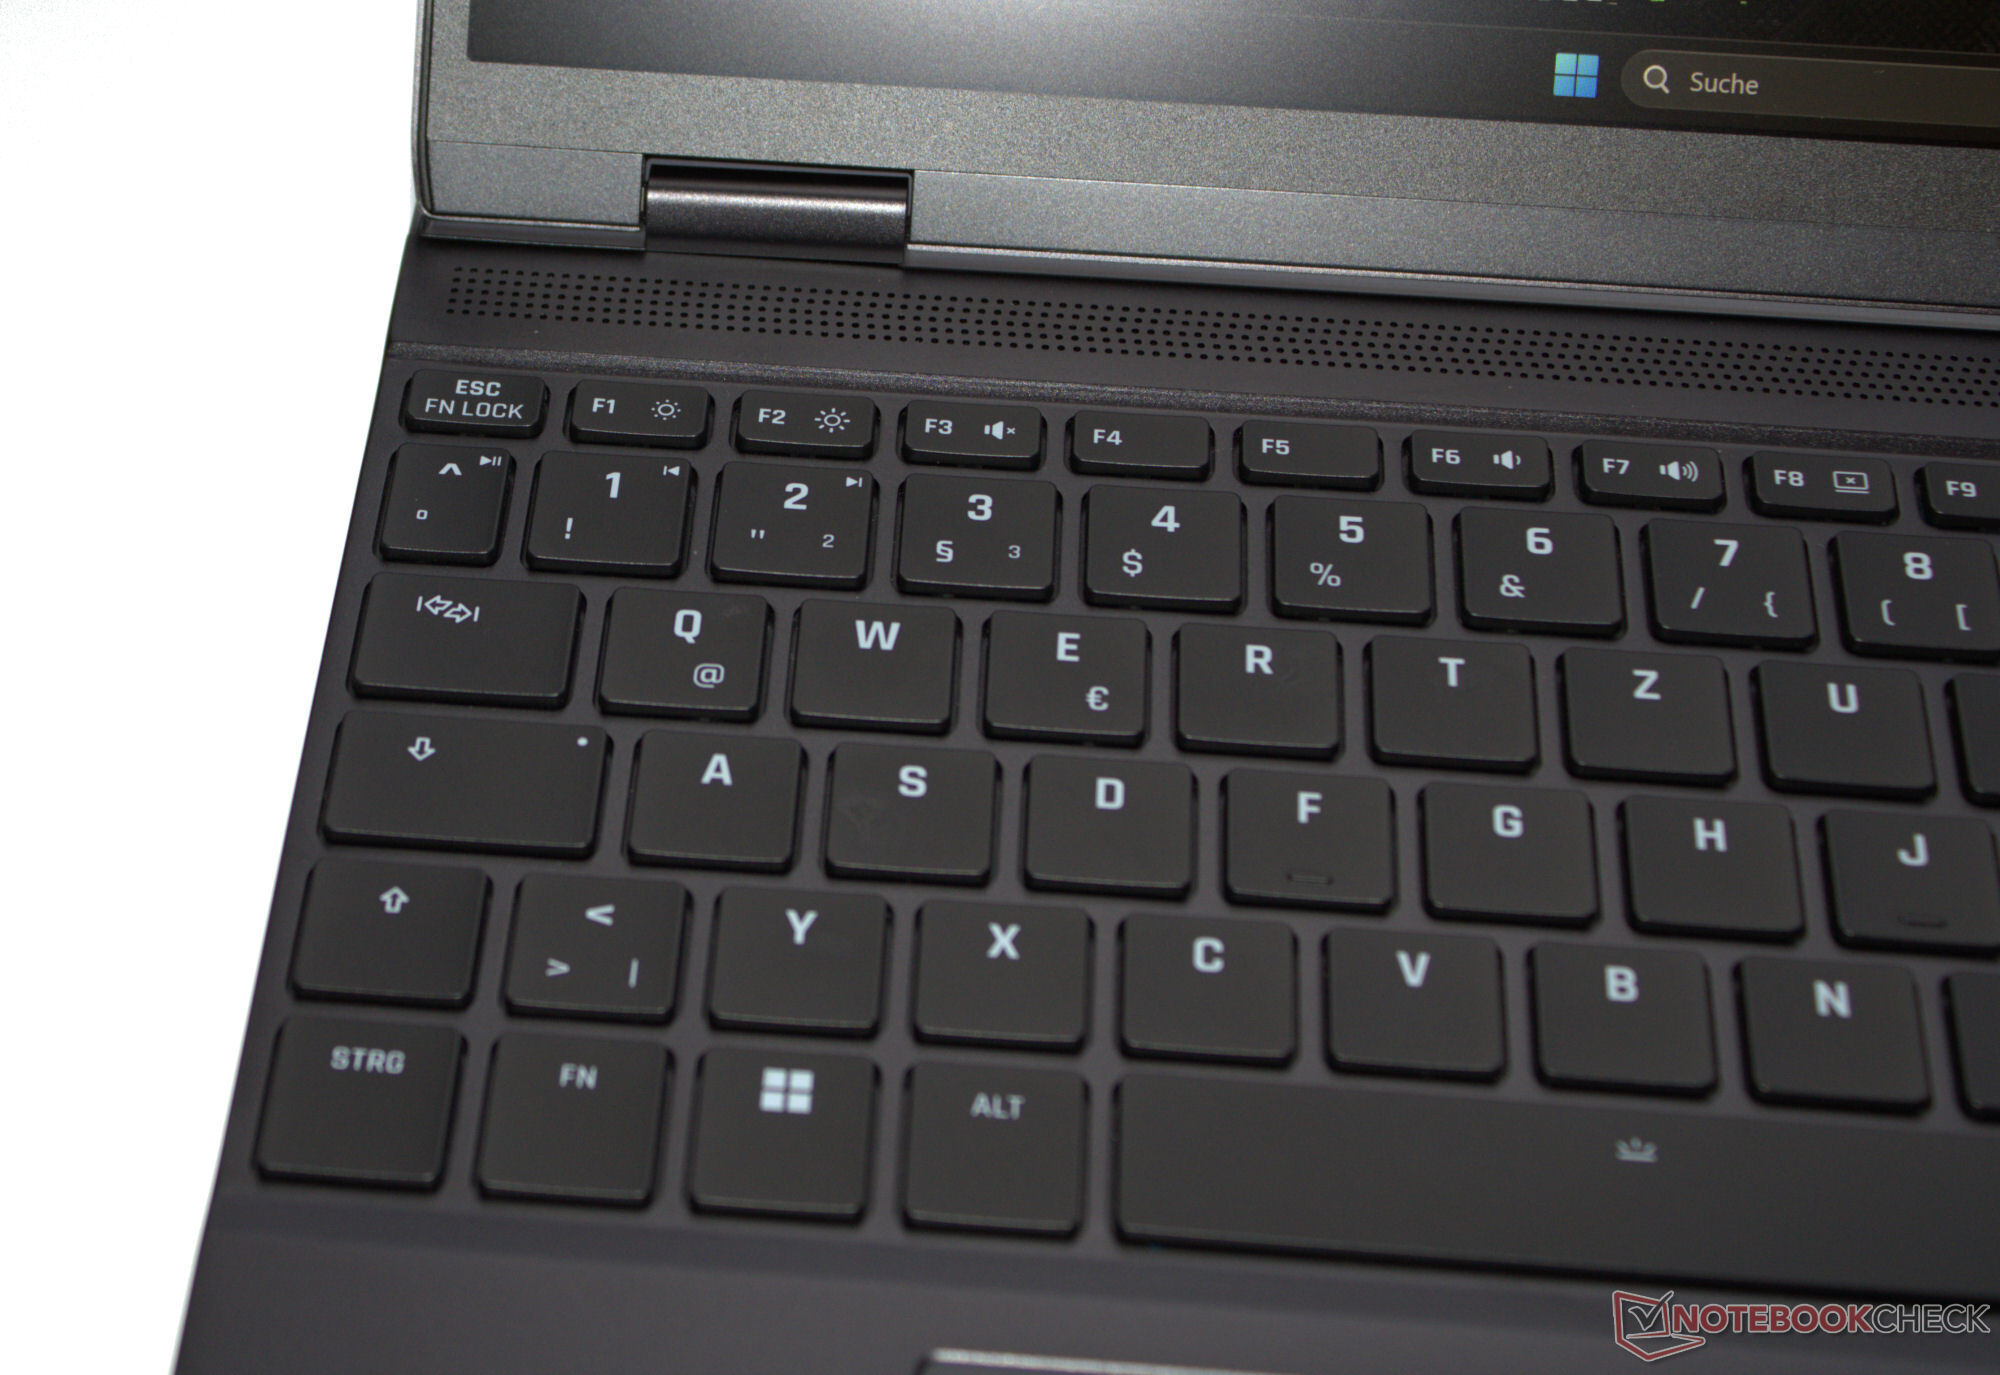
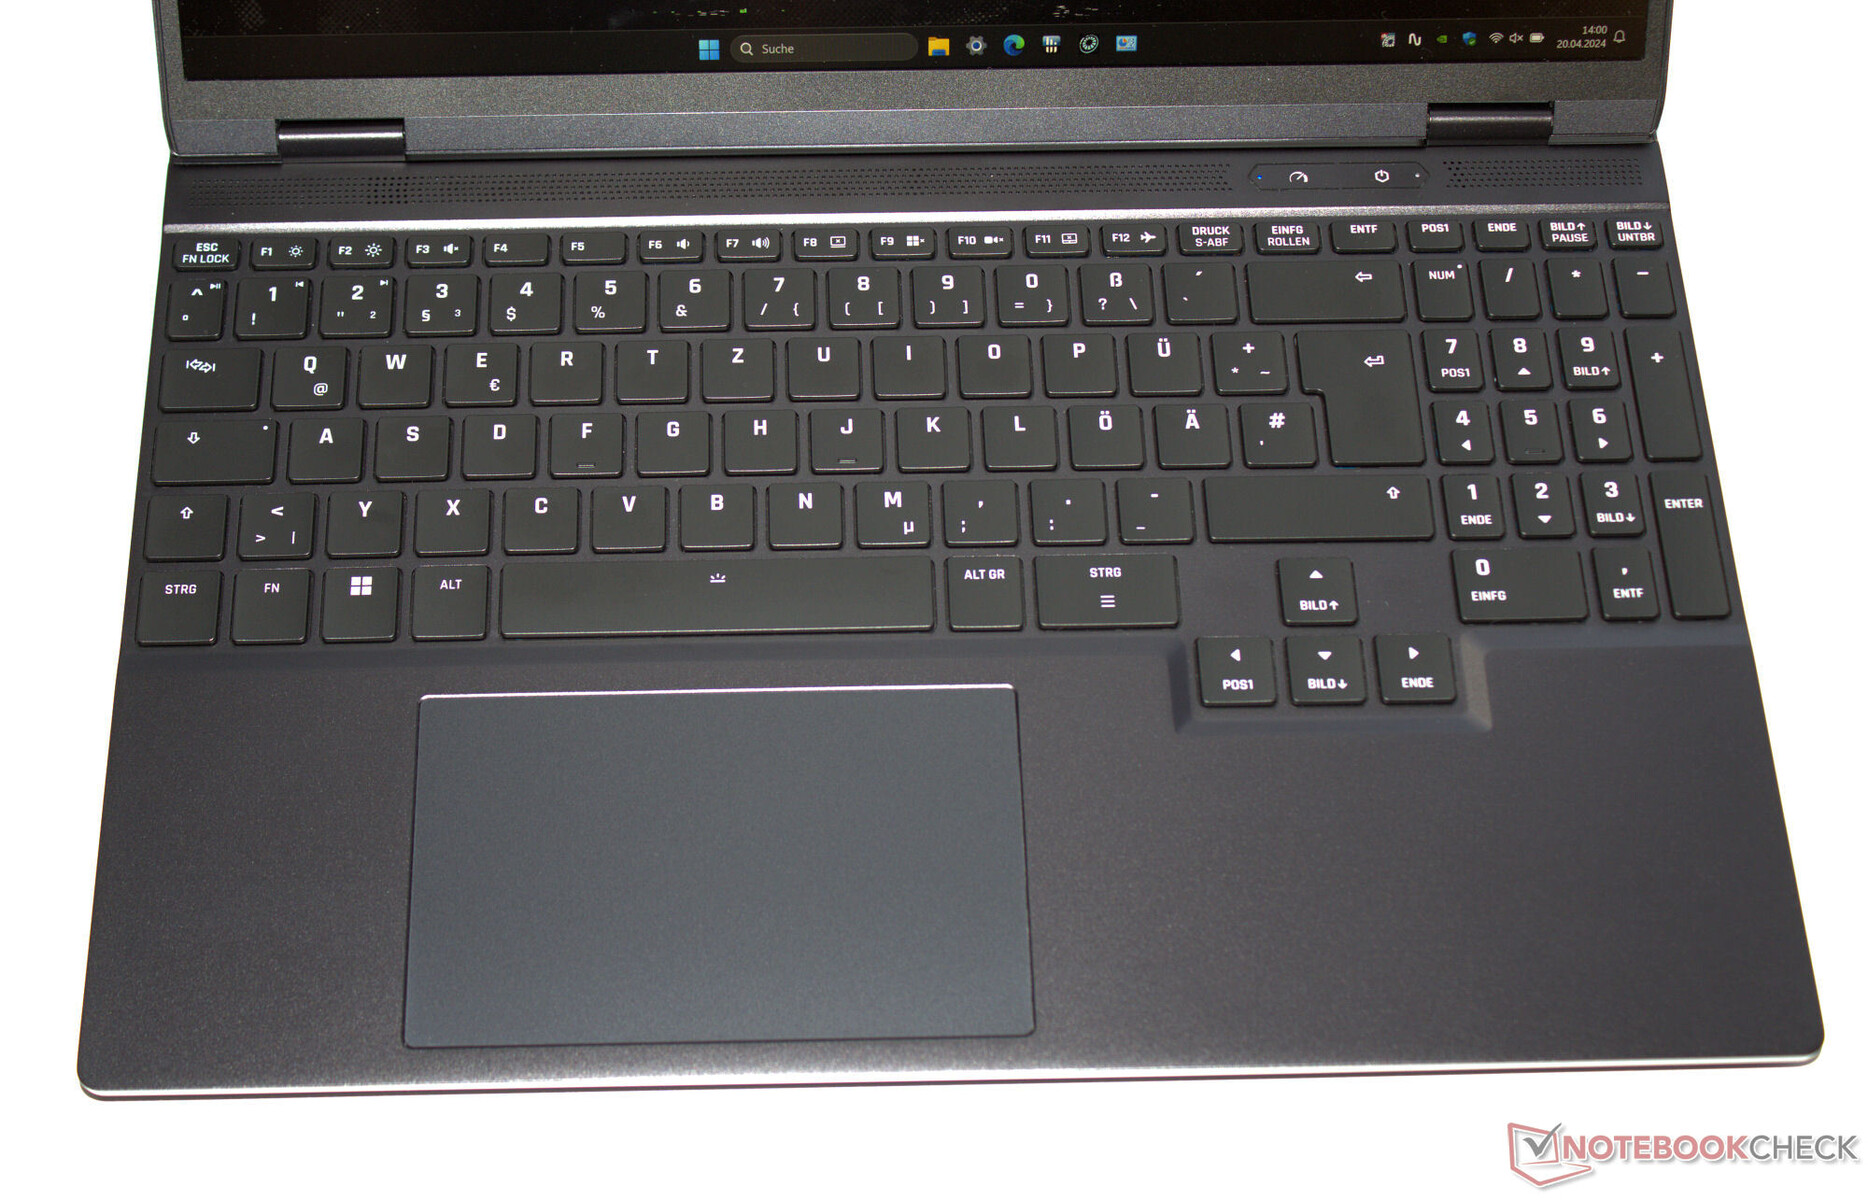
Tangentbord
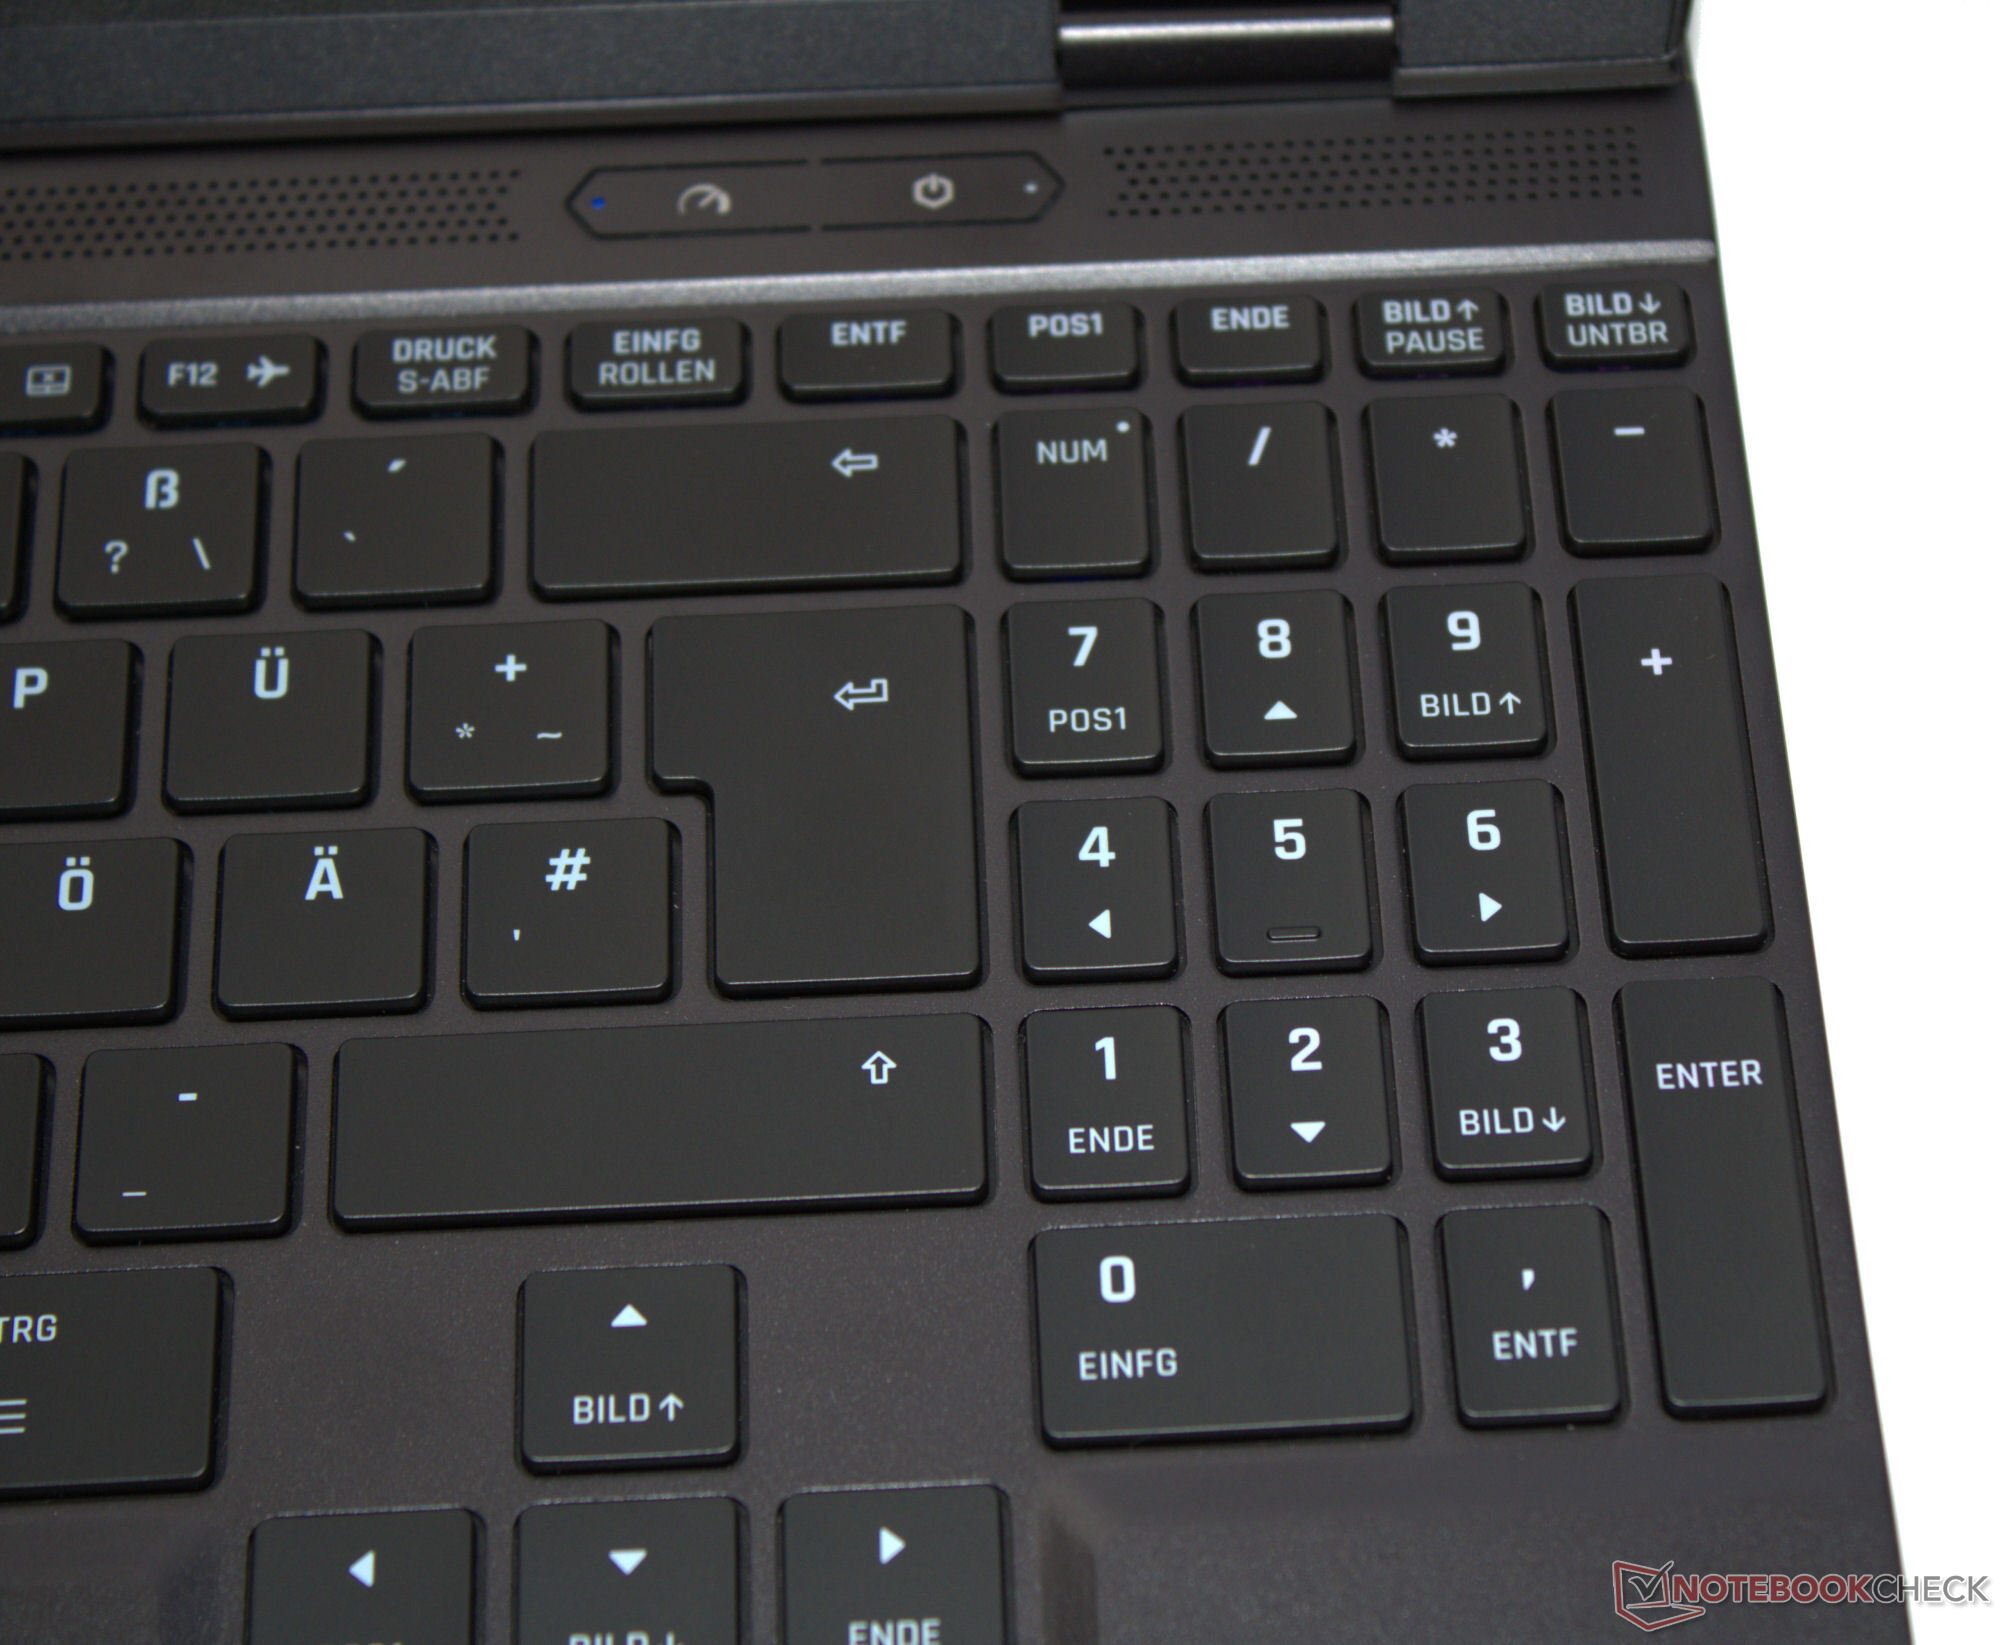
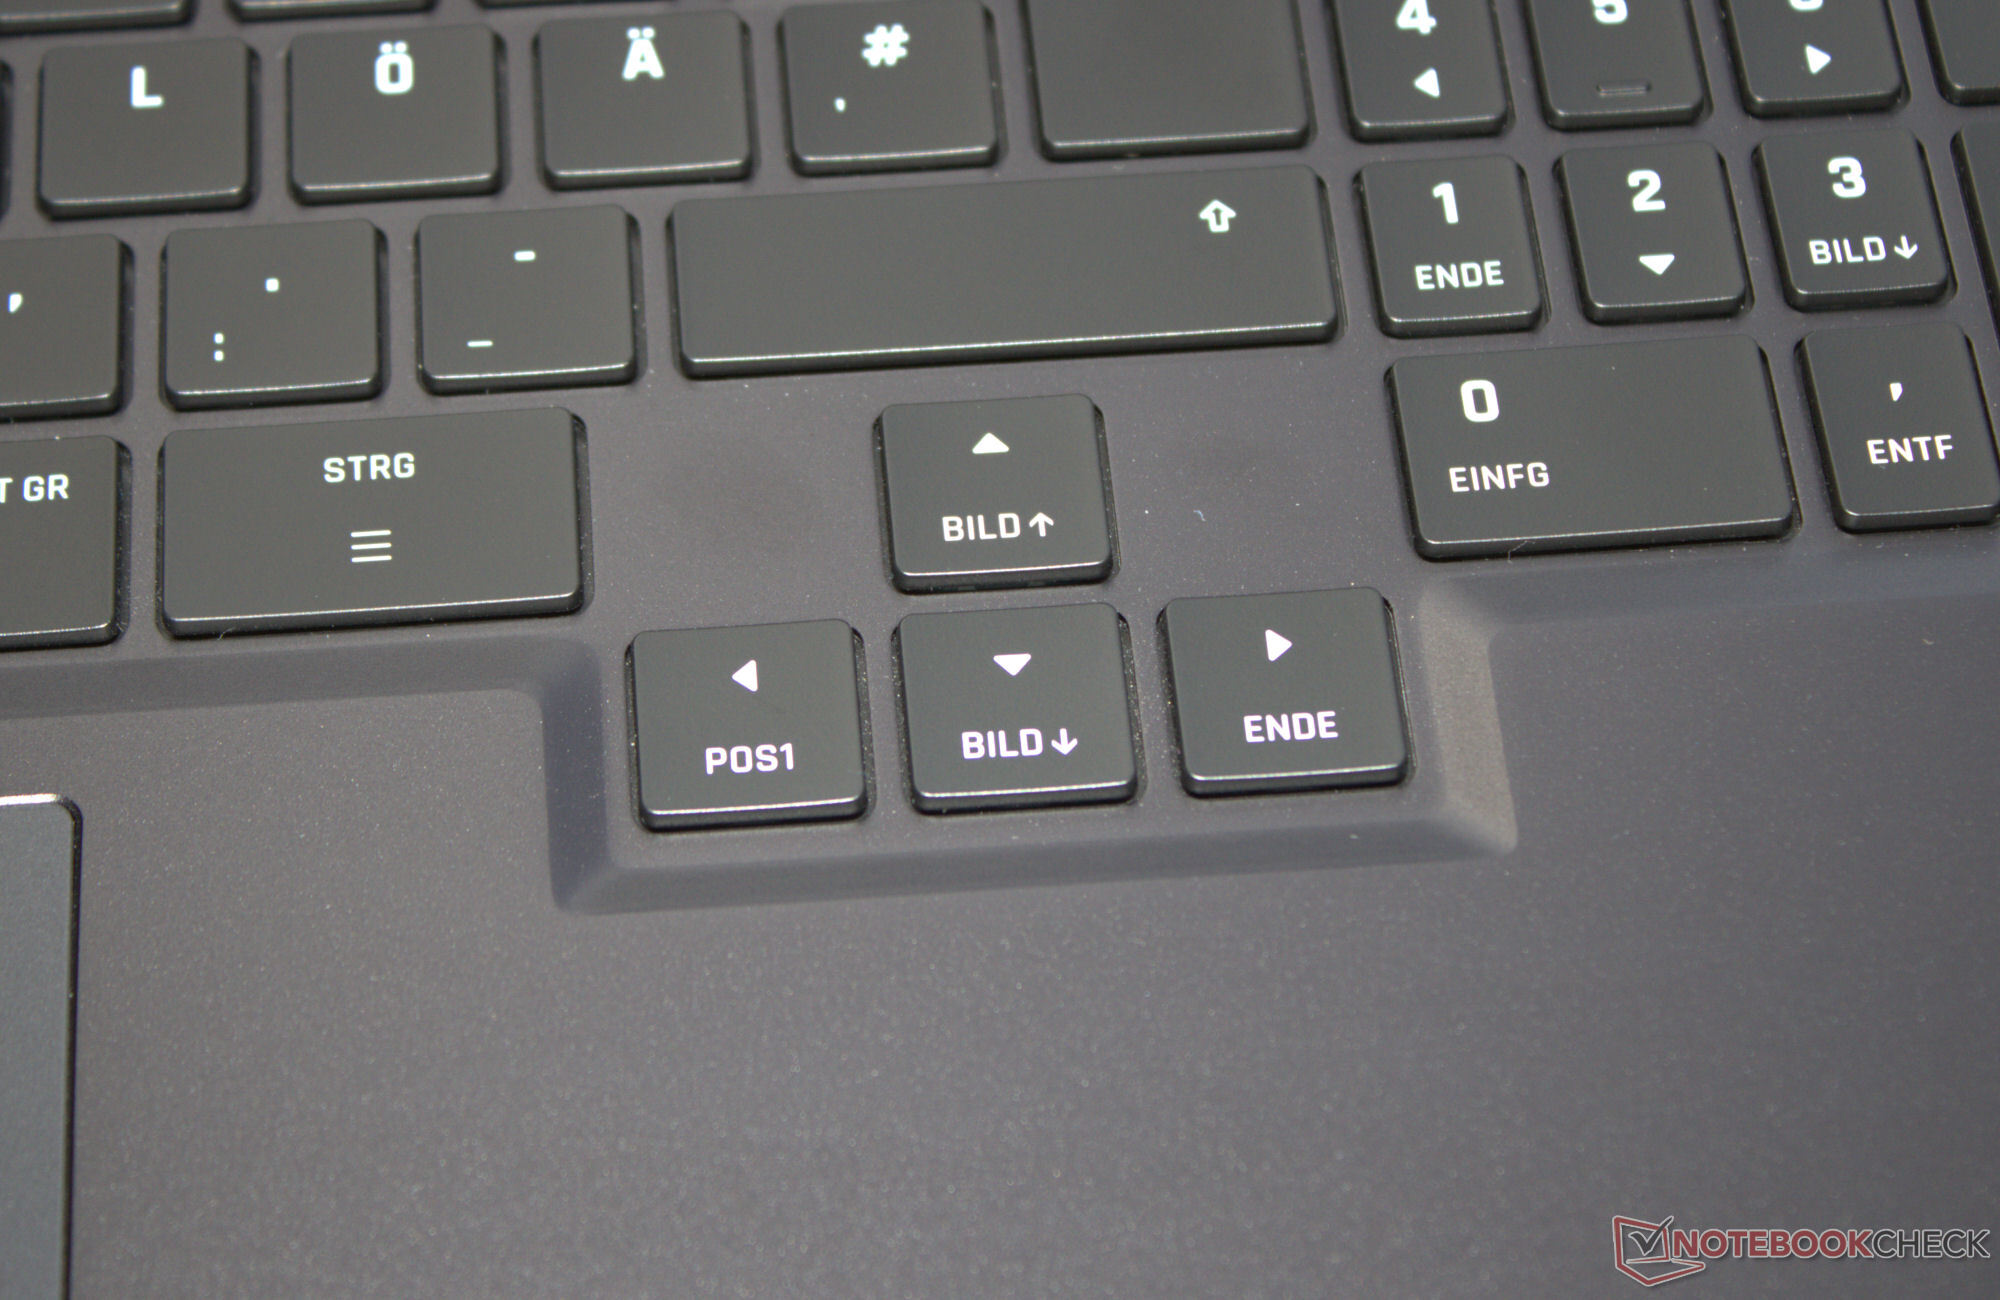
Tangenterna på chiclet-tangentbordet (RGB-bakgrundsbelysning i fyra nivåer) har ett medelhögt lyft och en tydlig tryckpunkt. Motståndet kunde vara lite skarpare, men det är en smaksak. Tangentbordet ger efter minimalt när du skriver, men det visade sig inte vara irriterande under vårt test. Positiva egenskaper: De fyra piltangenterna har inte bara full storlek utan är också separerade från de andra tangenterna.
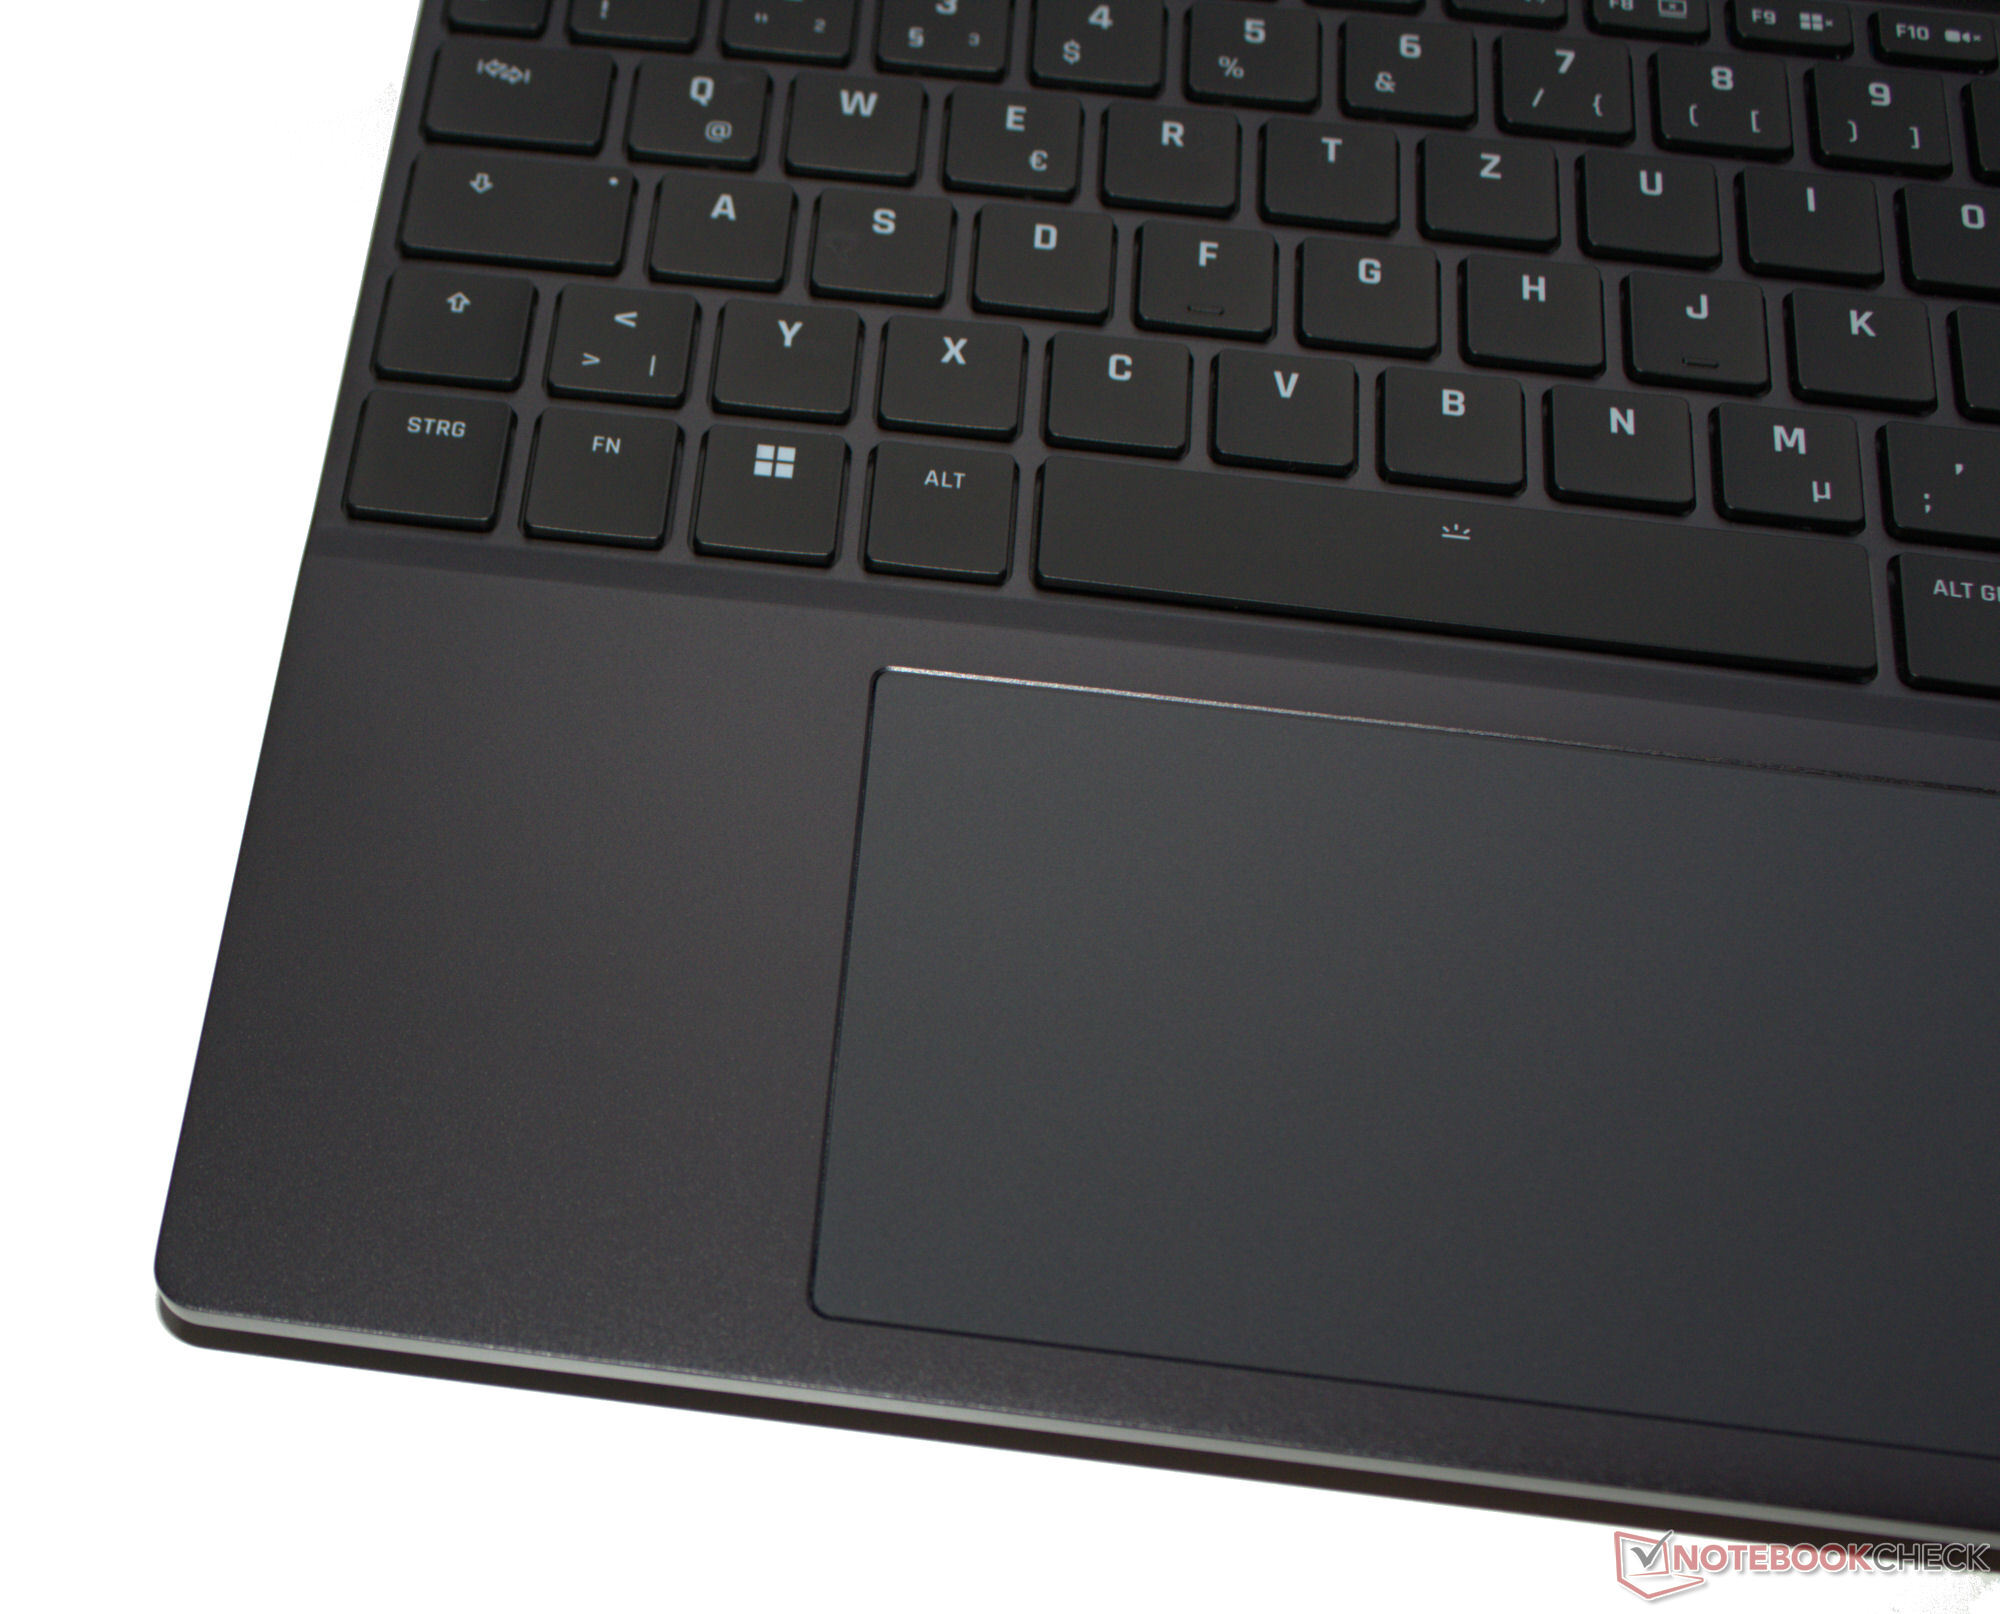
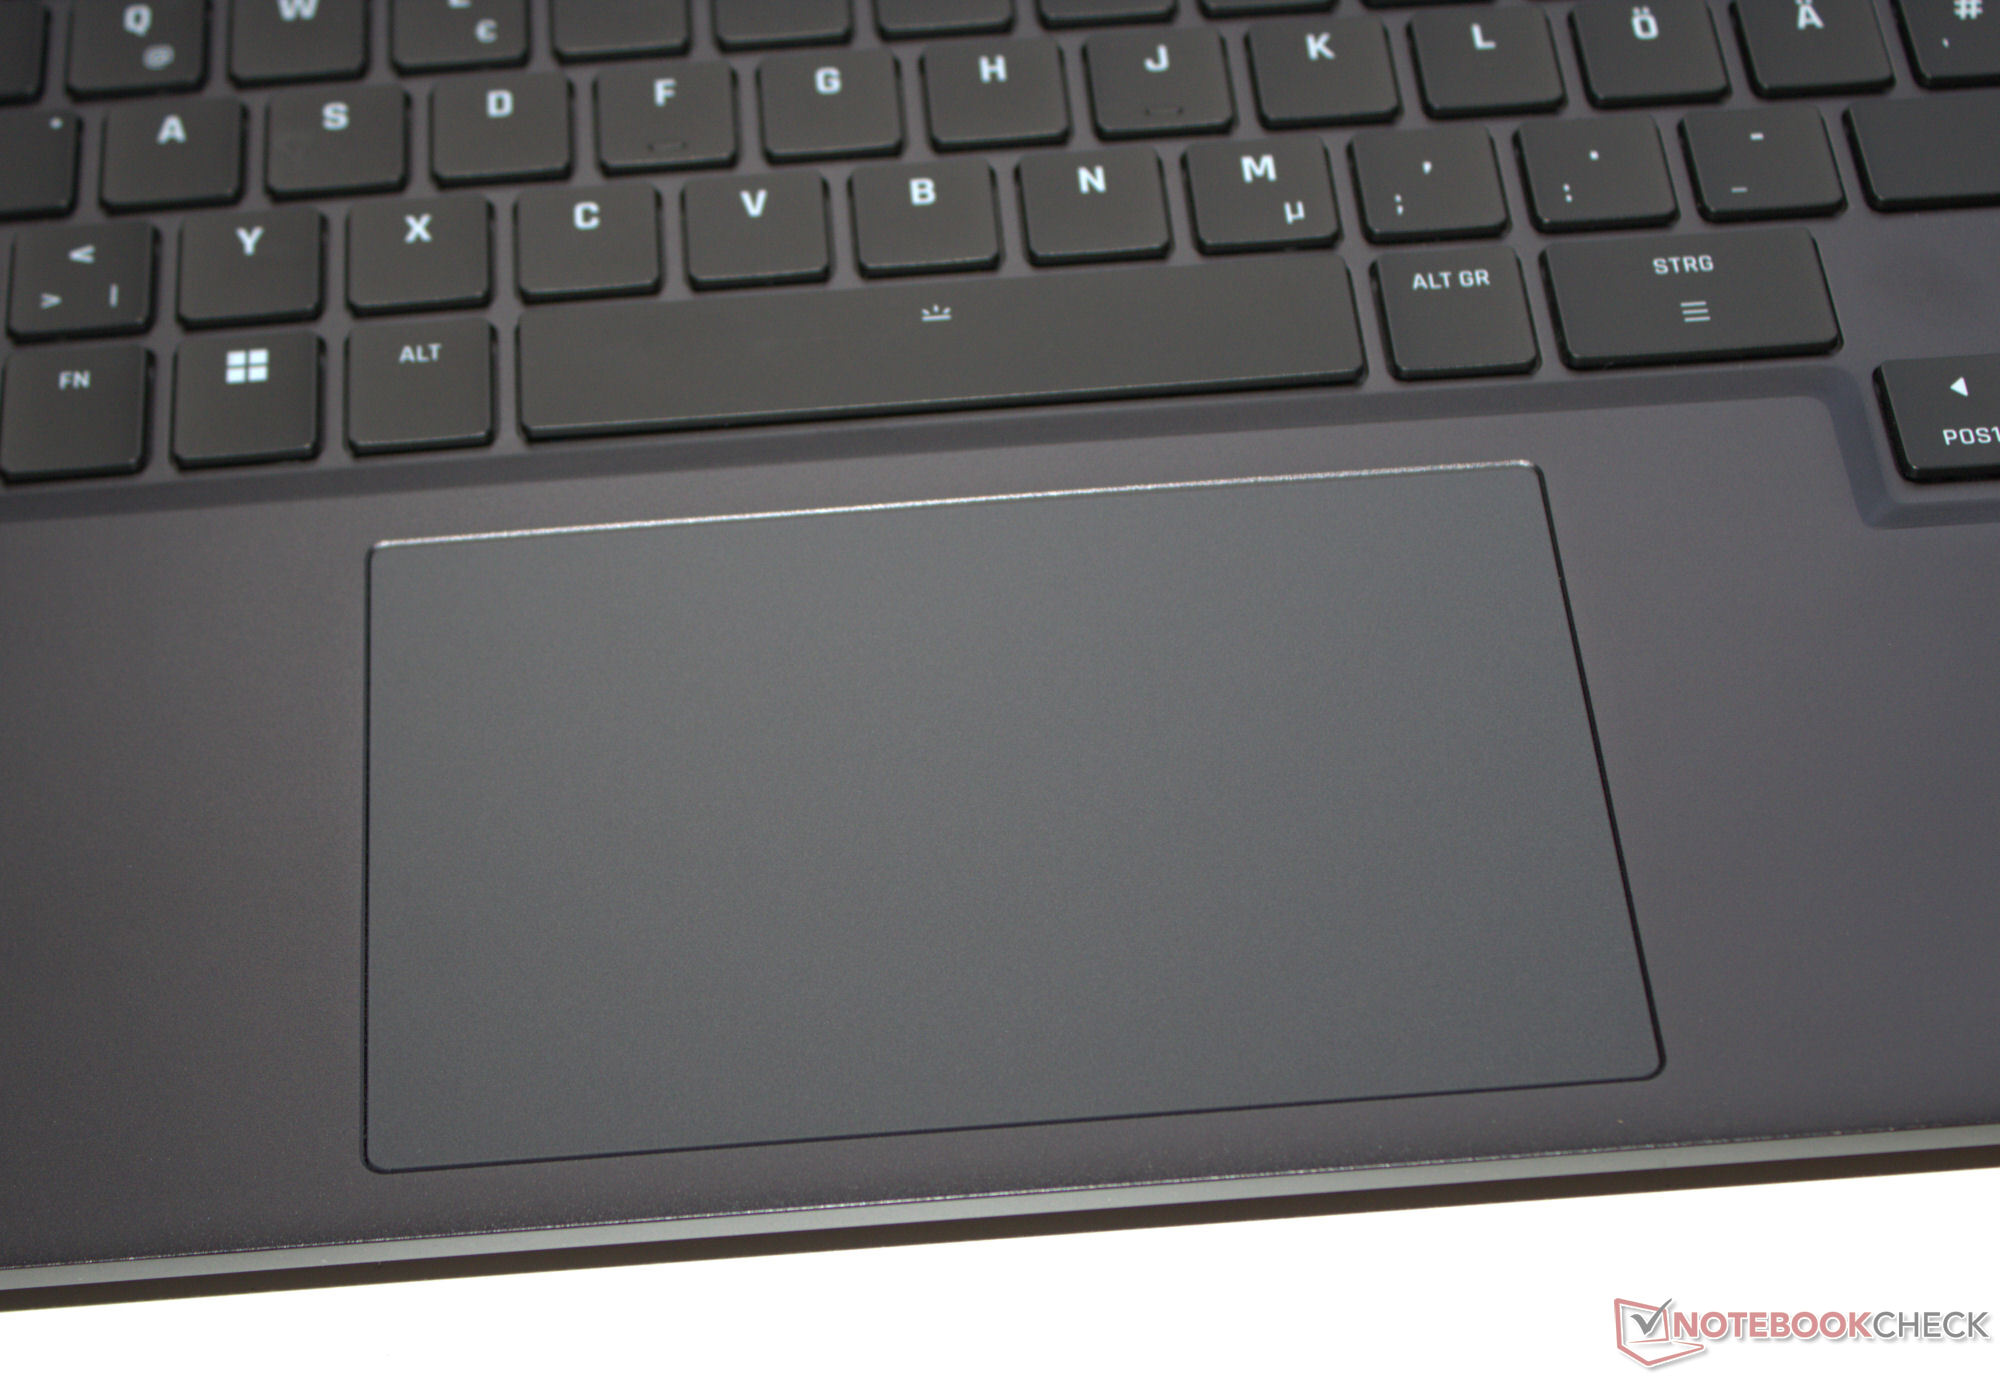
Pekplatta
En multi-touch clickpad (ca 12,3 x 7,8 cm) ersätter behovet av en mus och den släta ytan gör det lätt för fingrarna att glida över. Den har ett kort lyft och en tydlig tryckpunkt.
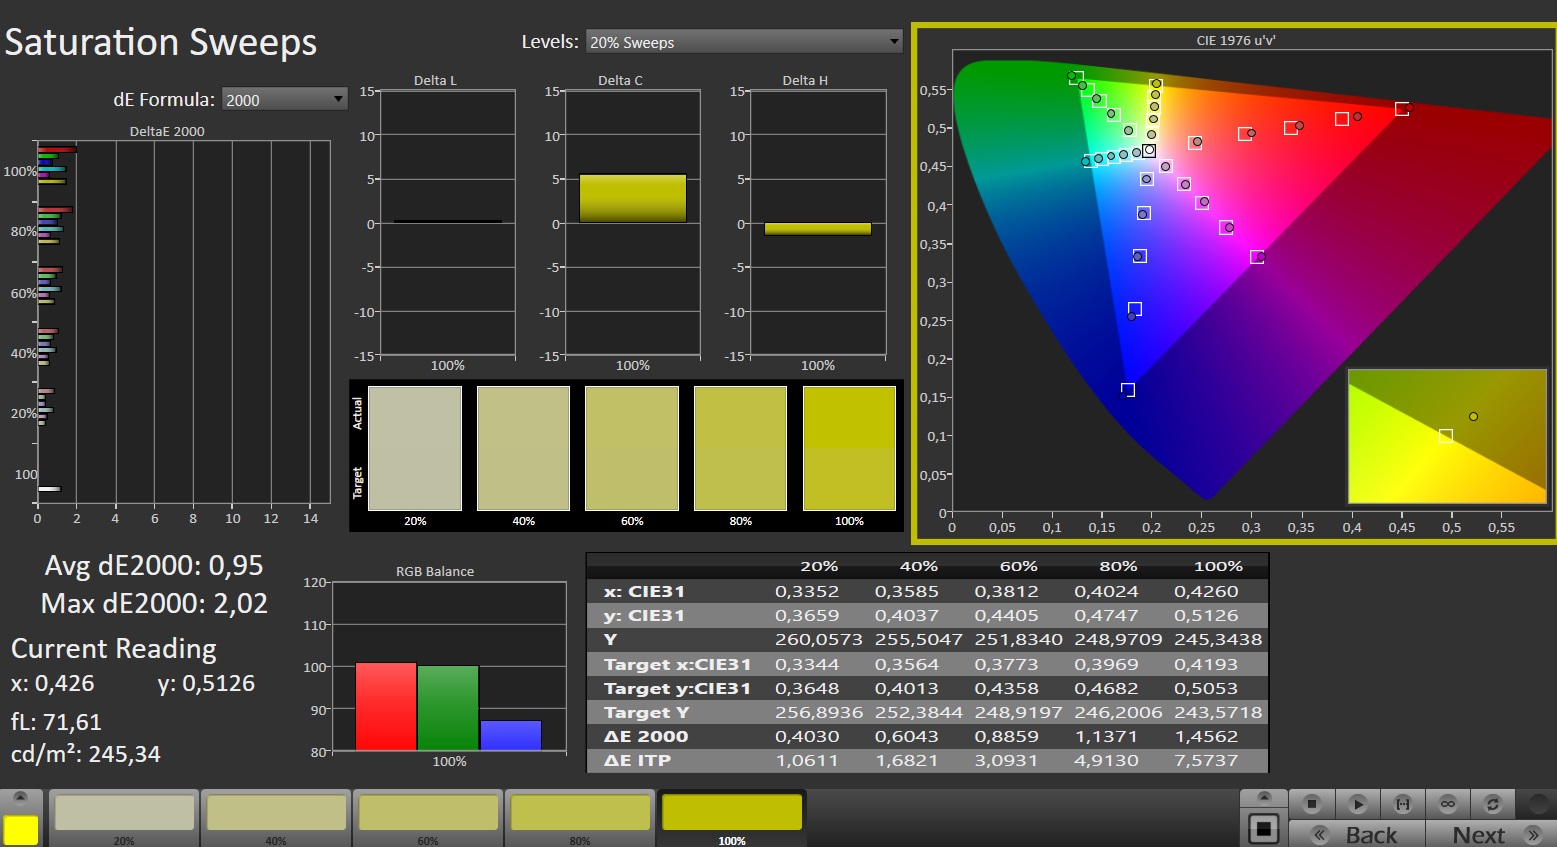
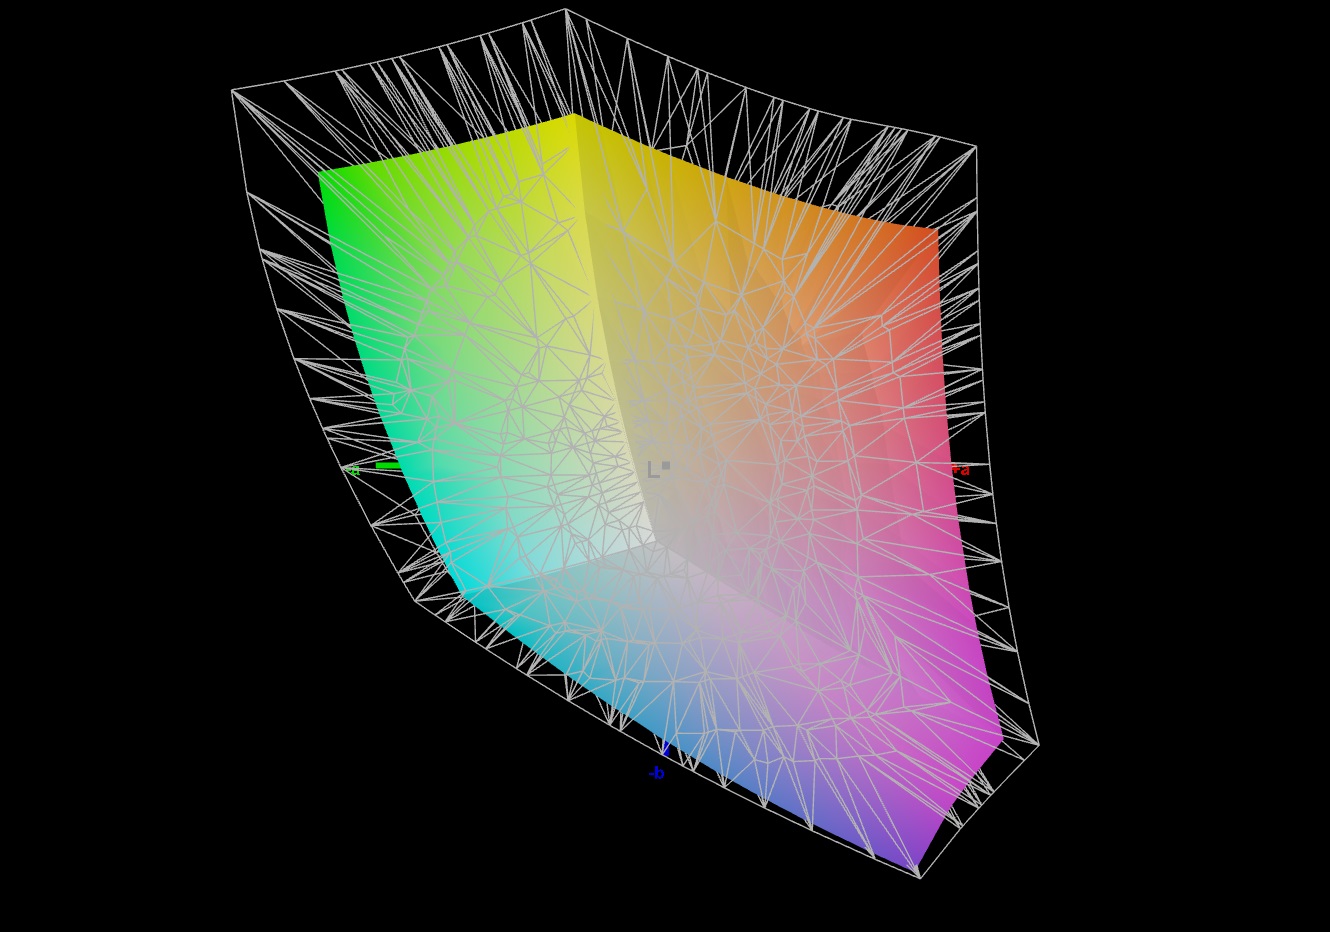
Skärm - Ljus panel med sRGB-täckning
Schenker har utrustat Fusion med en 15,3-tumsskärm (2.560 x 1.600 pixlar) med ett bildförhållande på 16:10. Den matta 240-Hz-panelen har Adaptive Sync, inget PWM-flimmer, korta svarstider och hög ljusstyrka. Alternativa skärmar är inte tillgängliga.

| |||||||||||||||||||||||||
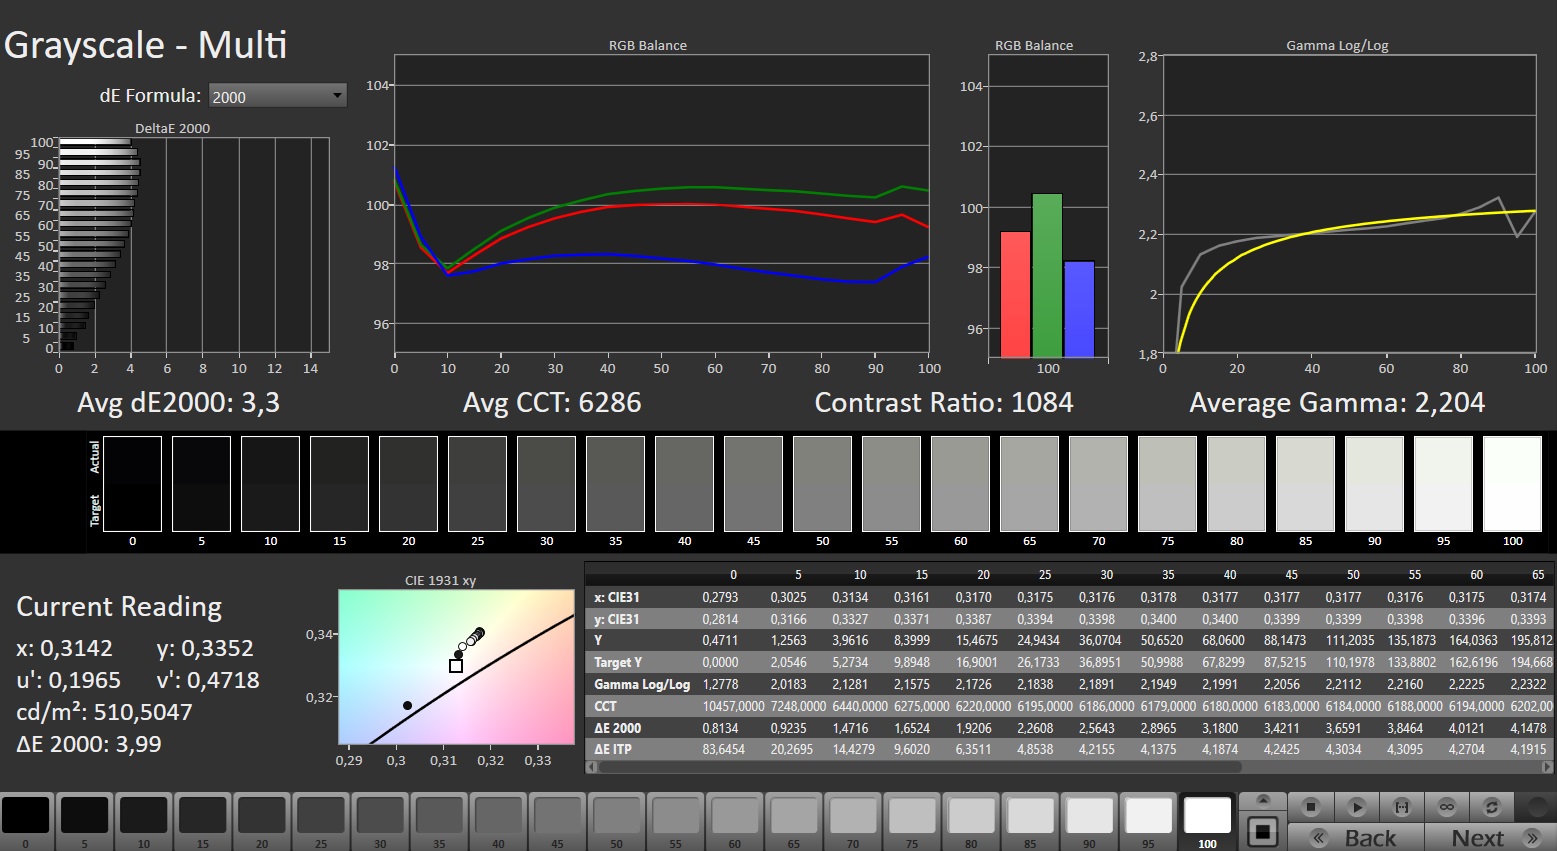
Distribution av ljusstyrkan: 89 %
Mitt på batteriet: 491 cd/m²
Kontrast: 1045:1 (Svärta: 0.47 cd/m²)
ΔE ColorChecker Calman: 2.16 | ∀{0.5-29.43 Ø4.72}
calibrated: 1.14
ΔE Greyscale Calman: 3.3 | ∀{0.09-98 Ø4.97}
75% AdobeRGB 1998 (Argyll 3D)
100% sRGB (Argyll 3D)
73.5% Display P3 (Argyll 3D)
Gamma: 2.204
CCT: 6286 K
| Schenker XMG Fusion 15 (Early 24) BOE NJ NE153QDM-NZ1, IPS, 2560x1600, 15.3" | Aorus 16X 2024 BOE CQ NE160QDM-NY1, IPS, 2560x1600, 16" | Alienware m16 R2 BOE NE16NYH, IPS, 2560x1600, 16" | HP Omen Transcend 16-u1095ng ATNA60DL02-0 (SDC41A4), OLED, 2560x1600, 16" | Lenovo Legion Pro 5 16IRX9 BOE NE160QDM-NYC, IPS, 2560x1600, 16" | |
|---|---|---|---|---|---|
| Display | -7% | -3% | 22% | -5% | |
| Display P3 Coverage (%) | 73.5 | 67.2 -9% | 71 -3% | 99.8 36% | 69.3 -6% |
| sRGB Coverage (%) | 100 | 96.7 -3% | 100 0% | 100 0% | 99.4 -1% |
| AdobeRGB 1998 Coverage (%) | 75 | 69.3 -8% | 71.4 -5% | 97 29% | 70.1 -7% |
| Response Times | -27% | -41% | 96% | -105% | |
| Response Time Grey 50% / Grey 80% * (ms) | 5 ? | 7.5 ? -50% | 5.7 ? -14% | 0.2 ? 96% | 11.9 ? -138% |
| Response Time Black / White * (ms) | 5.2 ? | 5.4 ? -4% | 8.7 ? -67% | 0.2 ? 96% | 8.9 ? -71% |
| PWM Frequency (Hz) | 120 ? | ||||
| Screen | -1% | 11% | 182% | 17% | |
| Brightness middle (cd/m²) | 491 | 542 10% | 345.8 -30% | 390 -21% | 384 -22% |
| Brightness (cd/m²) | 460 | 504 10% | 337 -27% | 392 -15% | 366 -20% |
| Brightness Distribution (%) | 89 | 86 -3% | 87 -2% | 98 10% | 91 2% |
| Black Level * (cd/m²) | 0.47 | 0.45 4% | 0.3 36% | 0.02 96% | 0.35 26% |
| Contrast (:1) | 1045 | 1204 15% | 1153 10% | 19500 1766% | 1097 5% |
| Colorchecker dE 2000 * | 2.16 | 2.73 -26% | 1.99 8% | 1.94 10% | 0.97 55% |
| Colorchecker dE 2000 max. * | 4.44 | 5.29 -19% | 3.52 21% | 4.26 4% | 3.57 20% |
| Colorchecker dE 2000 calibrated * | 1.14 | 1.32 -16% | 0.62 46% | 4.21 -269% | 0.77 32% |
| Greyscale dE 2000 * | 3.3 | 2.9 12% | 2.1 36% | 1.5 55% | 1.5 55% |
| Gamma | 2.204 100% | 2.192 100% | 2.32 95% | 2.221 99% | 2.24 98% |
| CCT | 6286 103% | 6173 105% | 6369 102% | 6395 102% | 6709 97% |
| Totalt genomsnitt (program/inställningar) | -12% /
-6% | -11% /
1% | 100% /
135% | -31% /
-5% |
* ... mindre är bättre
Displayen visade redan bra färgåtergivning direkt från förpackningen: Med en avvikelse på cirka 2,2 har målvärdet (DeltaE < 3) uppnåtts. Kalibrering av skärmen sänker avvikelsen till 1,14 och resulterar i mer balanserade gråtoner. Panelen kan täcka sRGB-färgrymden helt och hållet men inte färgrymderna AdobeRGB eller DCI P3. Detta skiljer sig inte från de flesta av konkurrenternas skärmar.
Visa svarstider
| ↔ Svarstid svart till vitt | ||
|---|---|---|
| 5.2 ms ... stiga ↗ och falla ↘ kombinerat | ↗ 1.5 ms stiga | 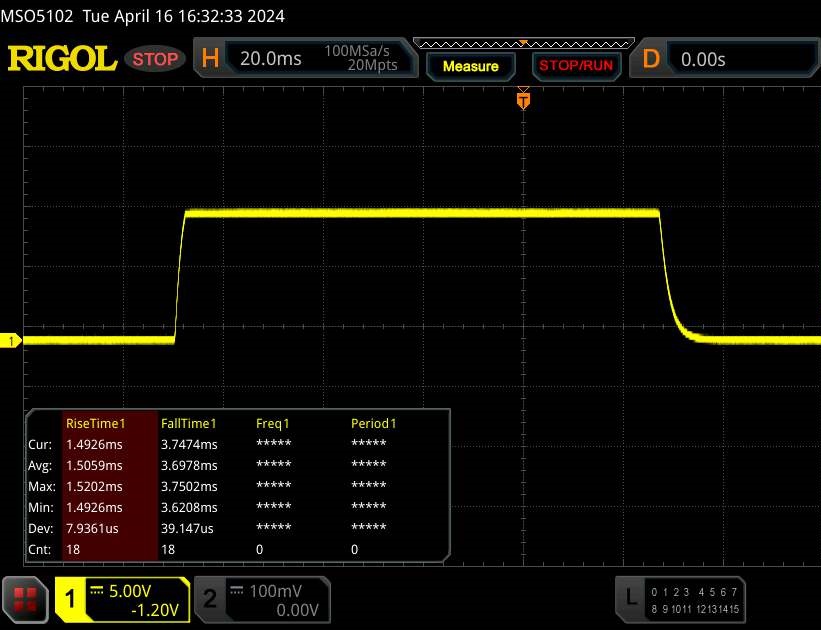 |
| ↘ 3.7 ms hösten | ||
| Skärmen visar väldigt snabba svarsfrekvenser i våra tester och borde vara mycket väl lämpad för fartfyllt spel. I jämförelse sträcker sig alla testade enheter från 0.1 (minst) till 240 (maximalt) ms. » 18 % av alla enheter är bättre. Det betyder att den uppmätta svarstiden är bättre än genomsnittet av alla testade enheter (19.8 ms). | ||
| ↔ Svarstid 50 % grått till 80 % grått | ||
| 5 ms ... stiga ↗ och falla ↘ kombinerat | ↗ 2.3 ms stiga | 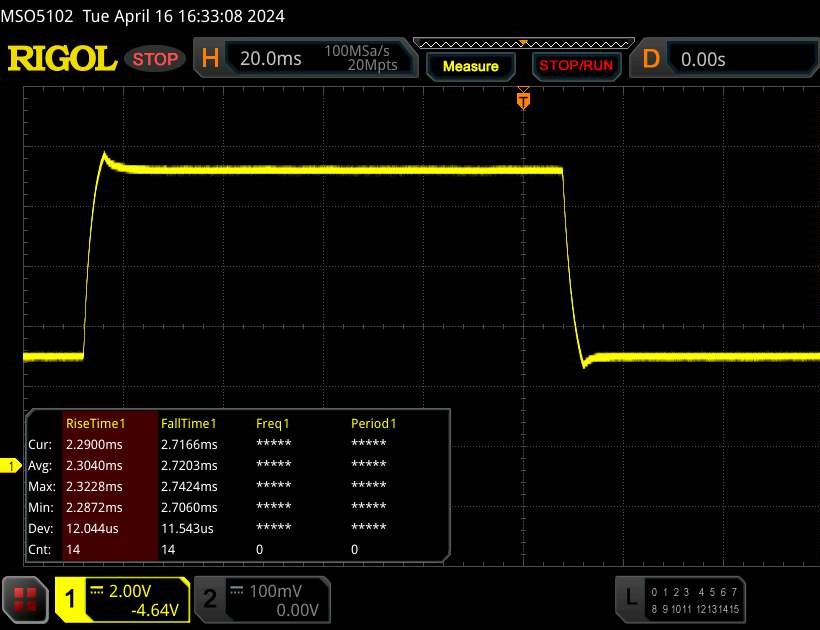 |
| ↘ 2.7 ms hösten | ||
| Skärmen visar väldigt snabba svarsfrekvenser i våra tester och borde vara mycket väl lämpad för fartfyllt spel. I jämförelse sträcker sig alla testade enheter från 0.165 (minst) till 636 (maximalt) ms. » 17 % av alla enheter är bättre. Det betyder att den uppmätta svarstiden är bättre än genomsnittet av alla testade enheter (31 ms). | ||
Skärmflimmer / PWM (Puls-Width Modulation)
| Skärmflimmer / PWM upptäcktes inte | 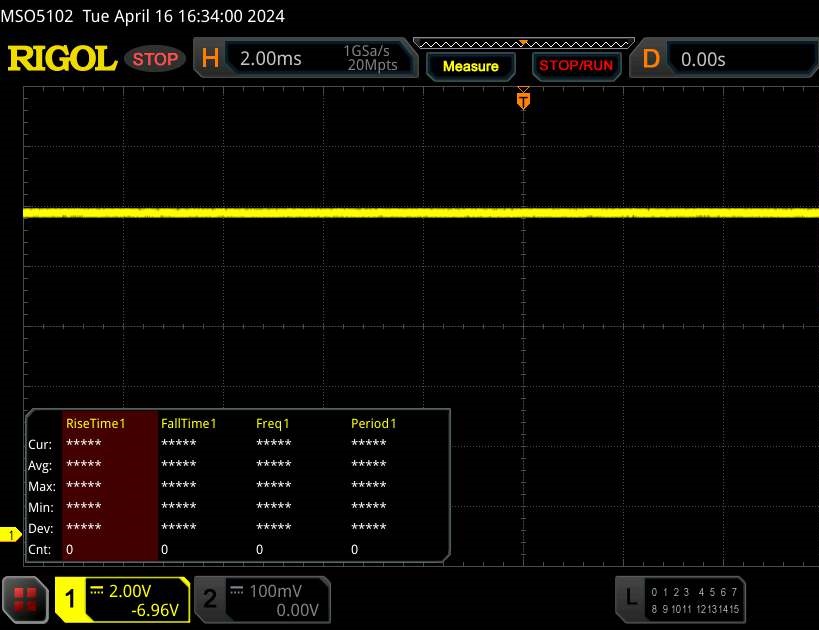 | ||
Som jämförelse: 52 % av alla testade enheter använder inte PWM för att dämpa skärmen. Om PWM upptäcktes mättes ett medelvärde av 7781 (minst: 5 - maximum: 343500) Hz. | |||
Enhetens IPS-panel med stabil betraktningsvinkel förblir läsbar från alla vinklar. Utomhus kan du läsa på skärmen så länge solen inte skiner för starkt.

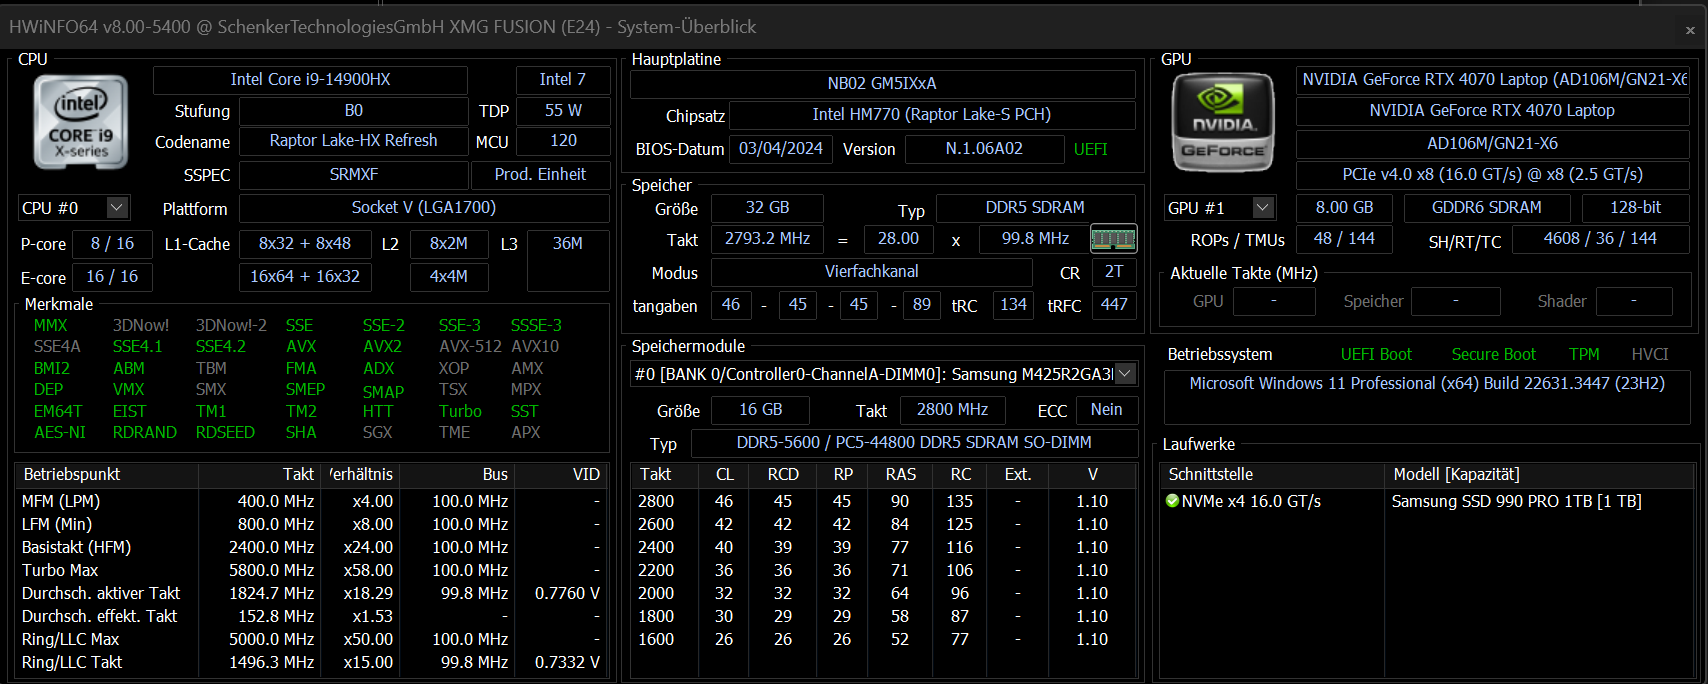
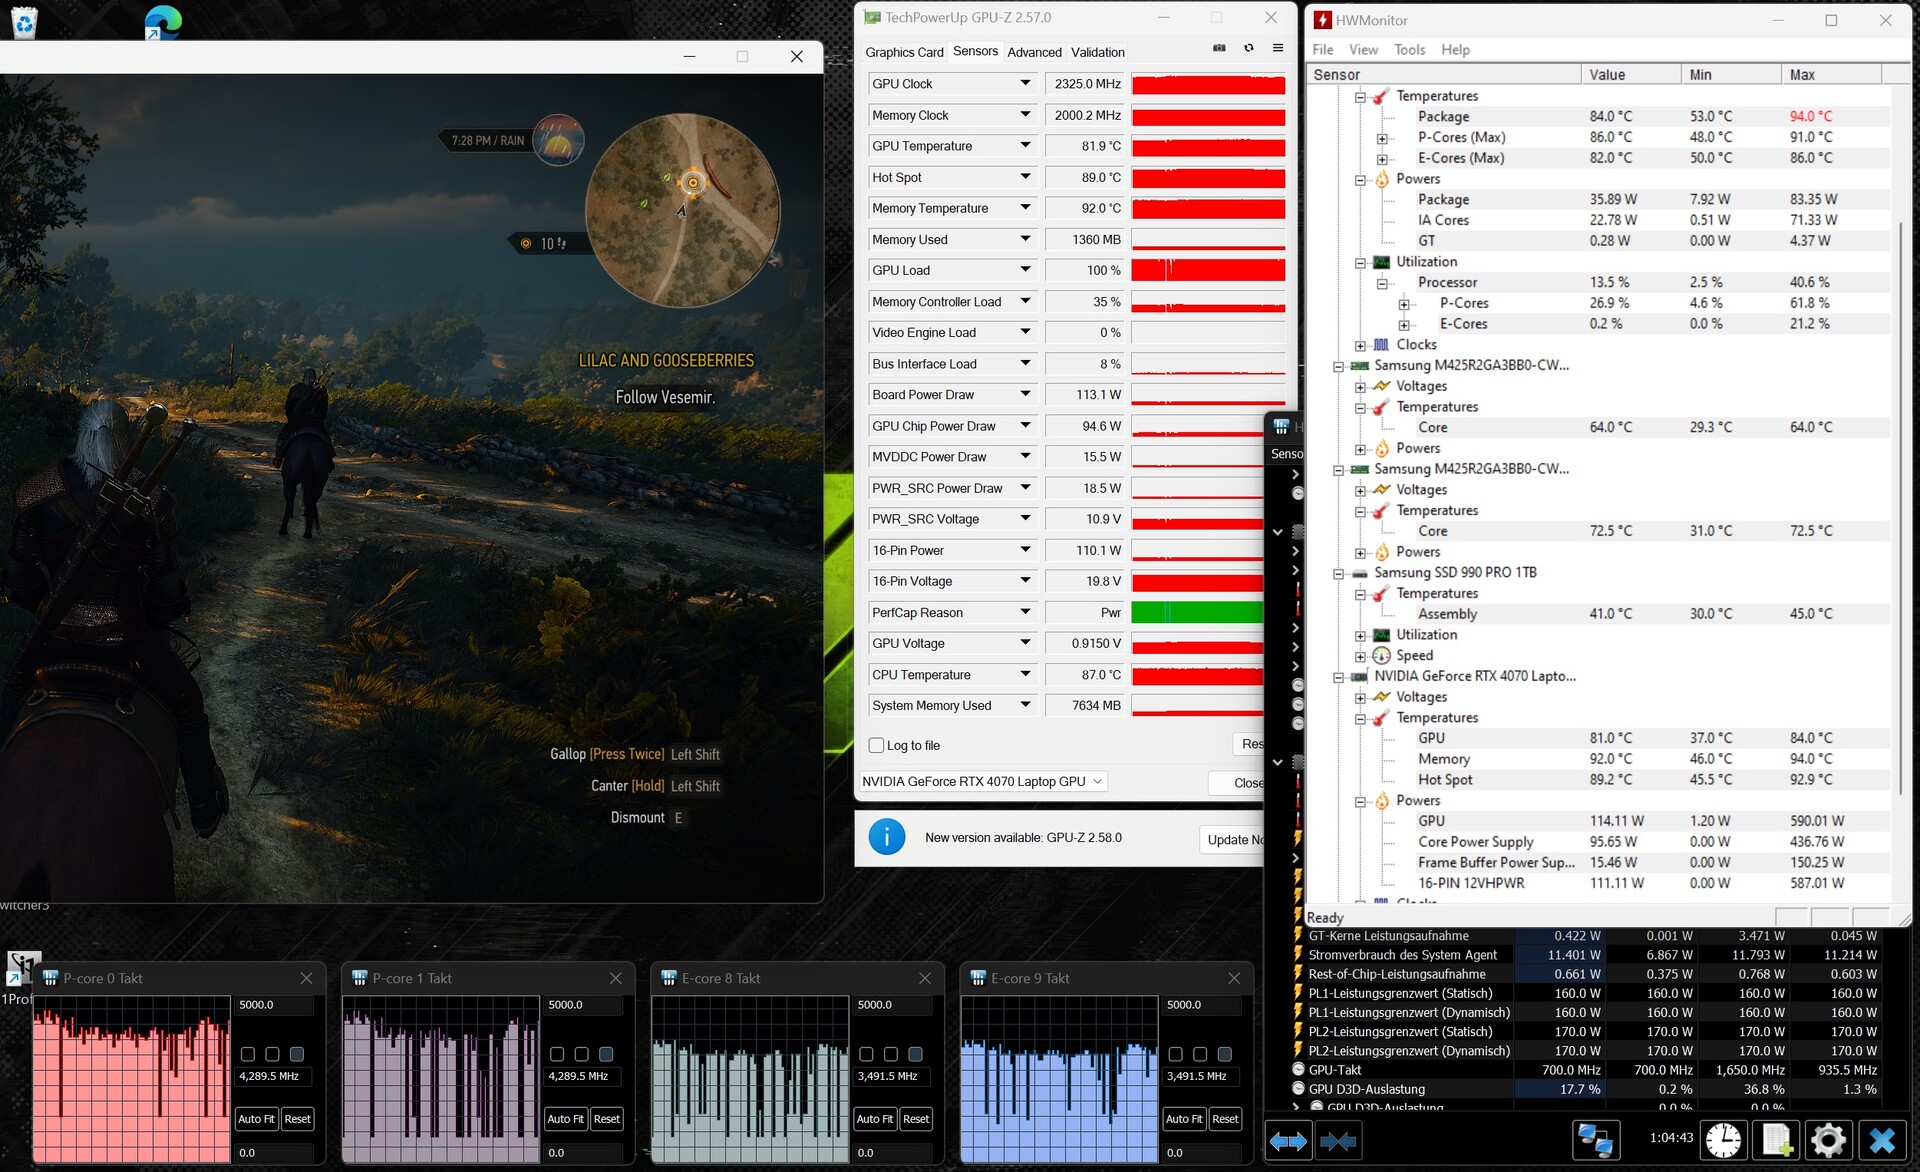
Prestanda - Raptor Lake och Ada Lovelace driver den bärbara datorn
Den kraftfulla, kompakta XMG Fusion 15 (Early 24) riktar sig till spelare och kreatörer. Raptor Lake och Ada Lovelace levererar den prestanda som krävs. Den bärbara datorn kan konfigureras individuellt via Schenkers onlinebutik. Den aktuella varianten kostar ca 2.500 US-dollar. Billigare modeller börjar från ca 1.700 USD.
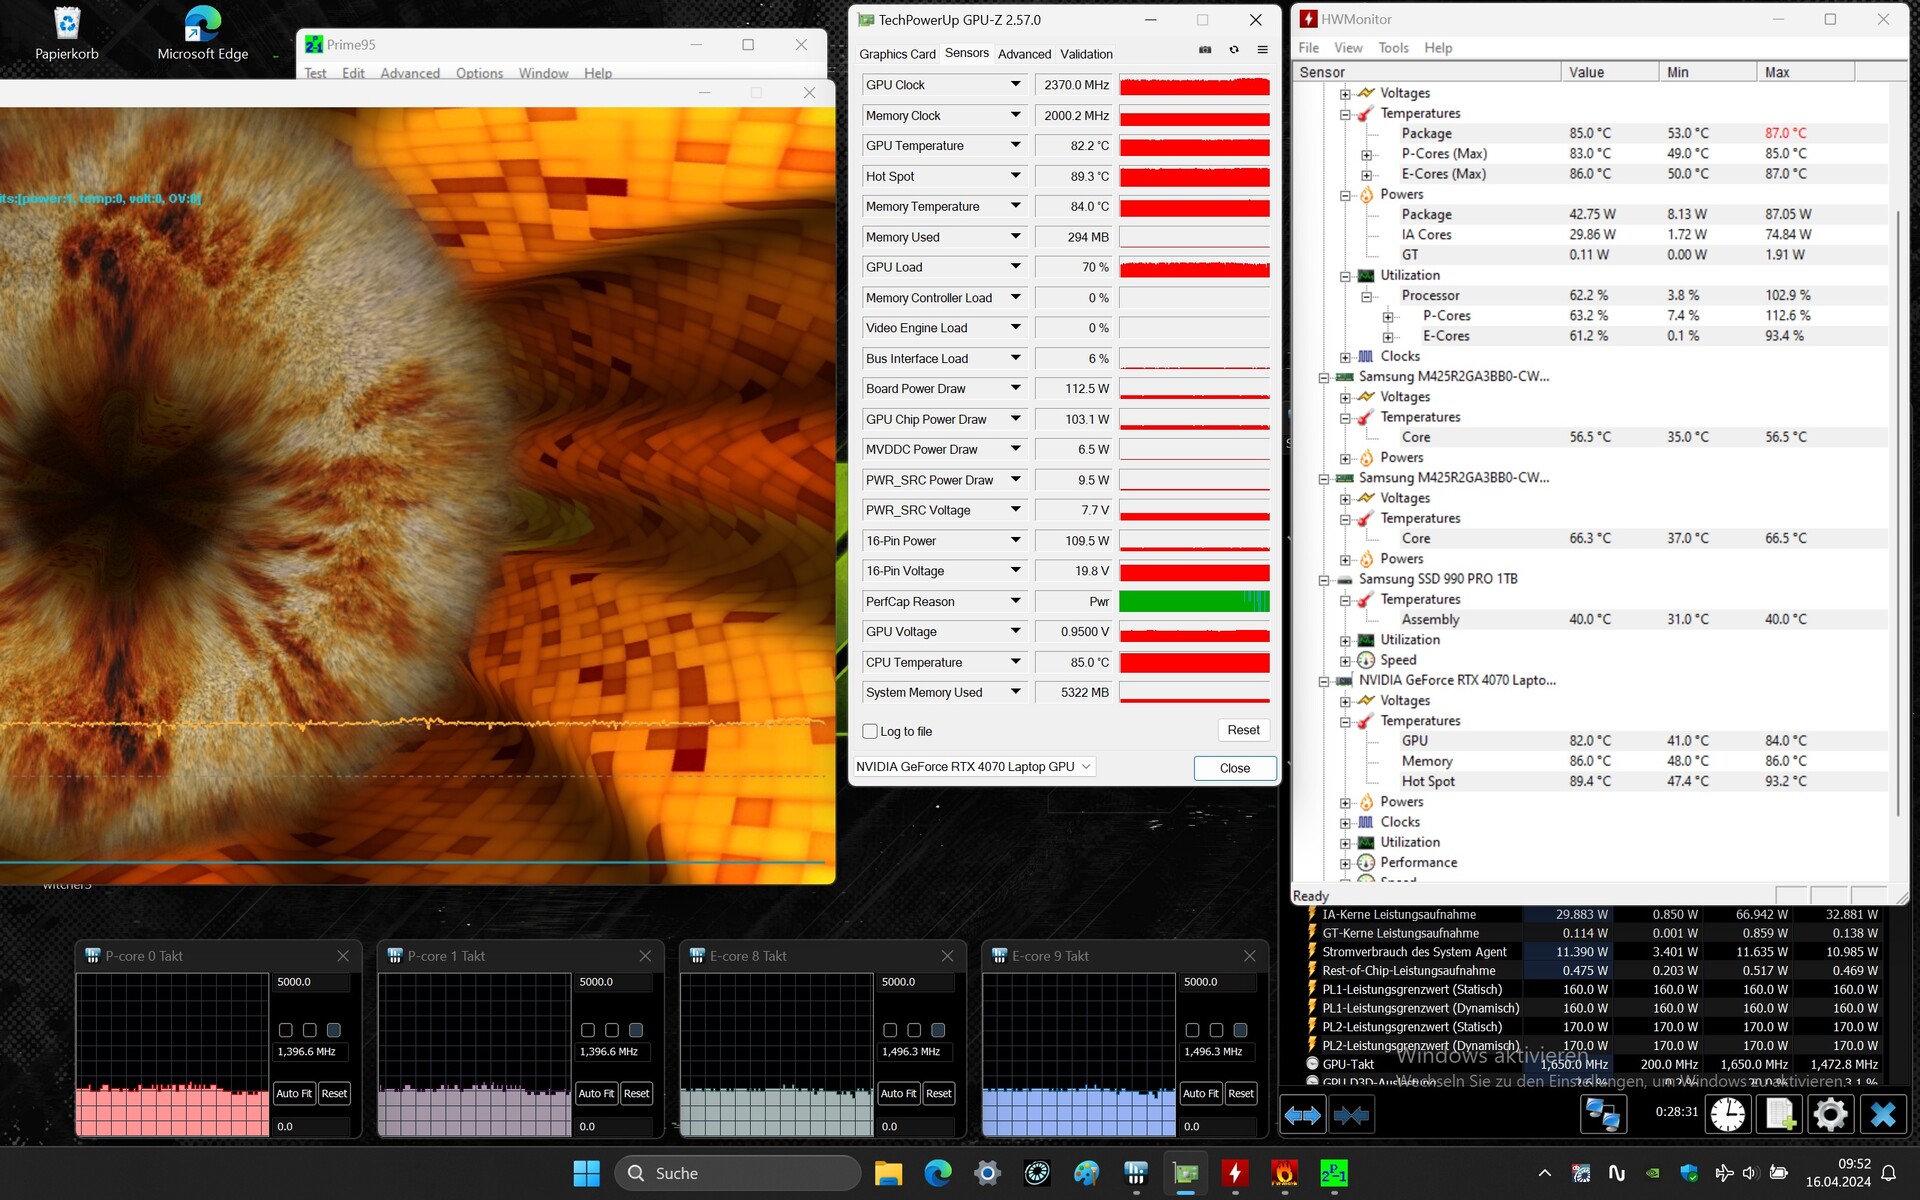
Testförhållanden
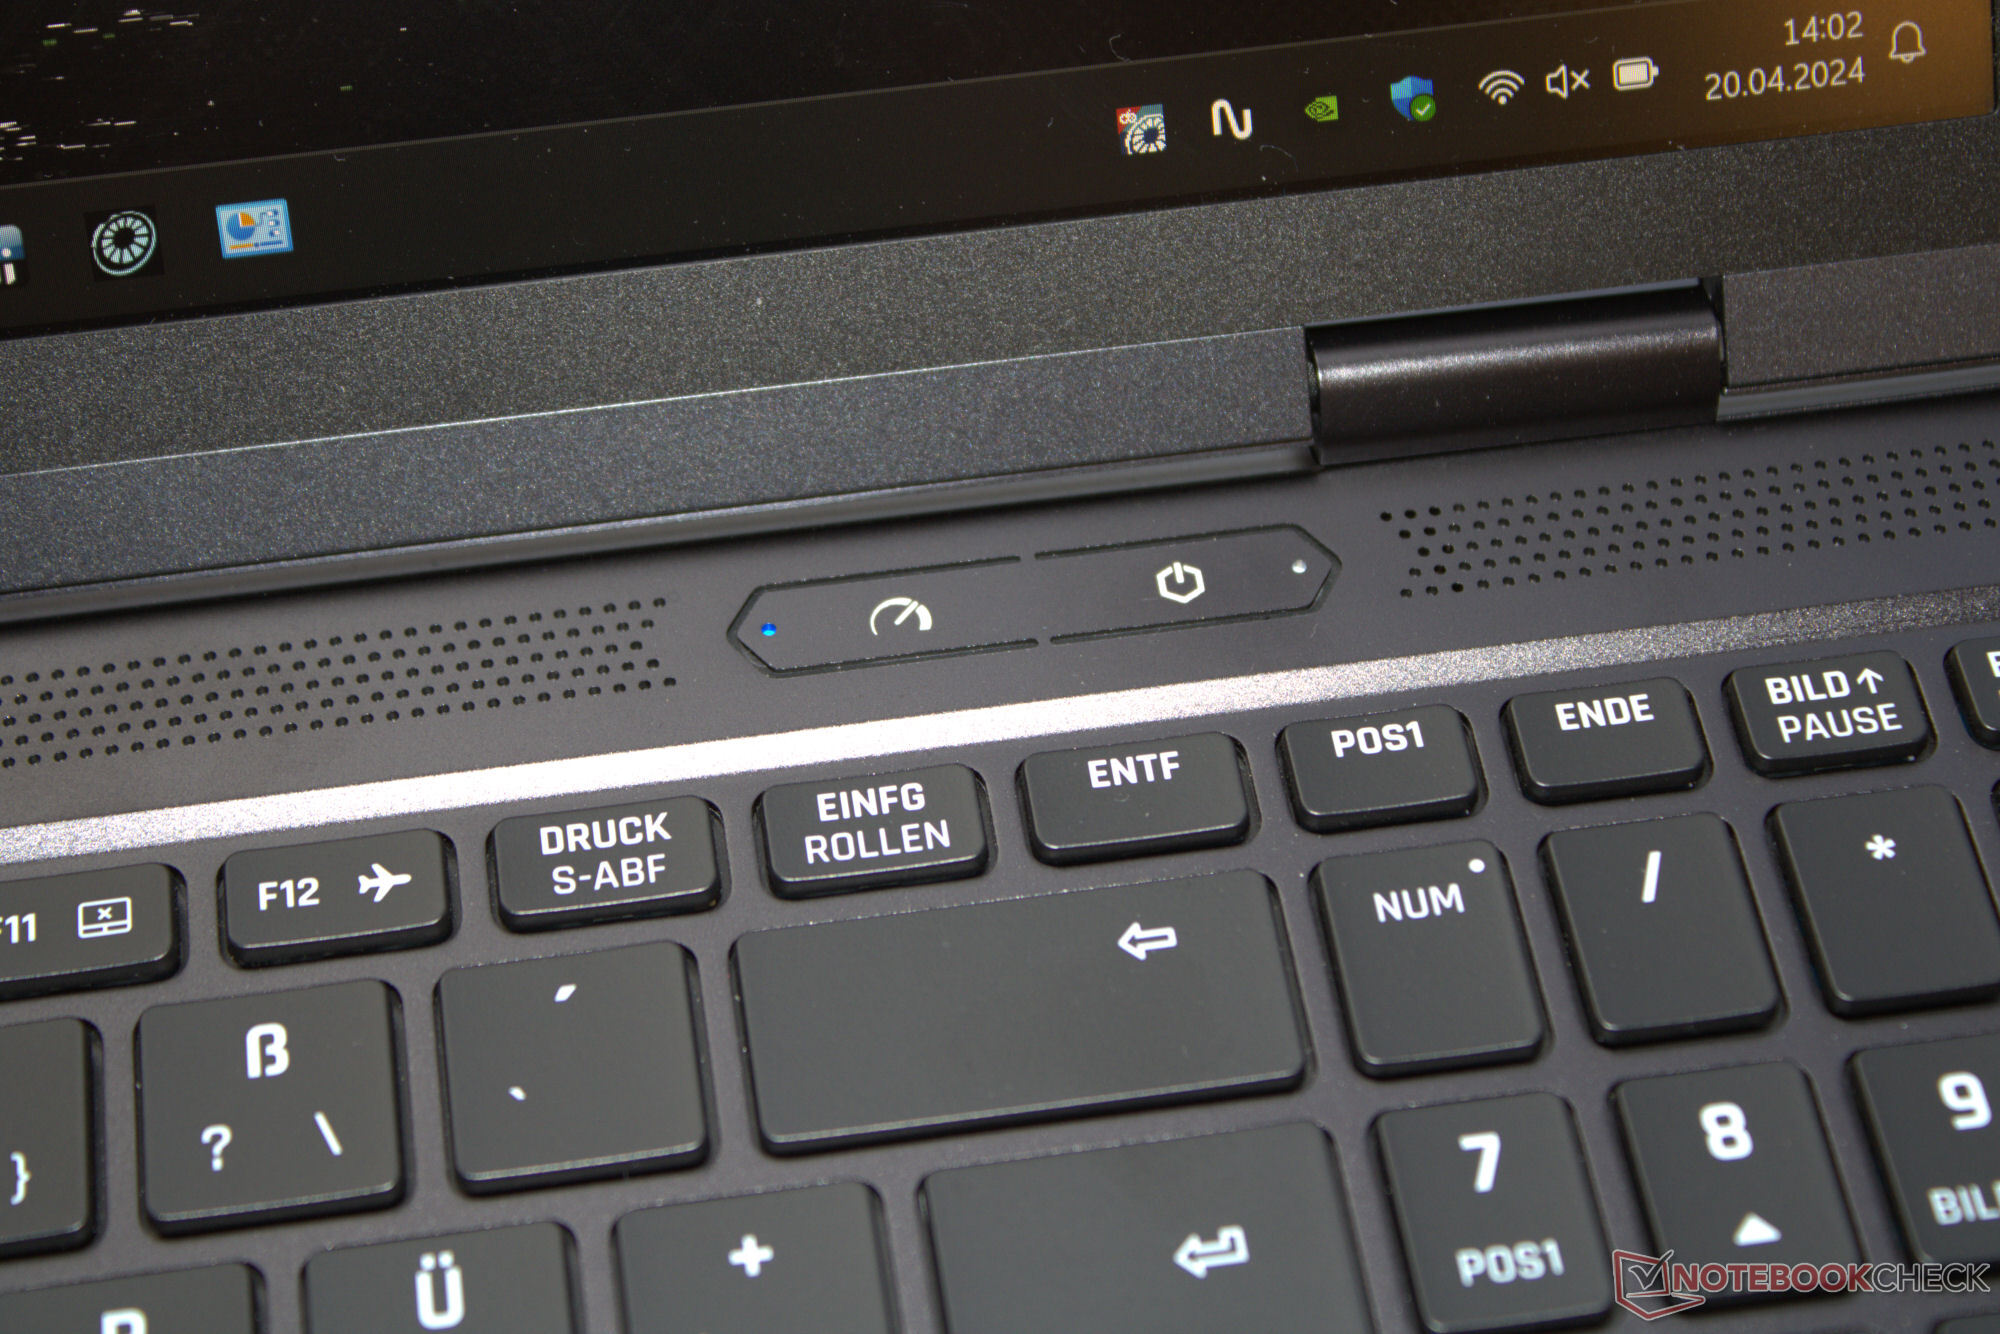
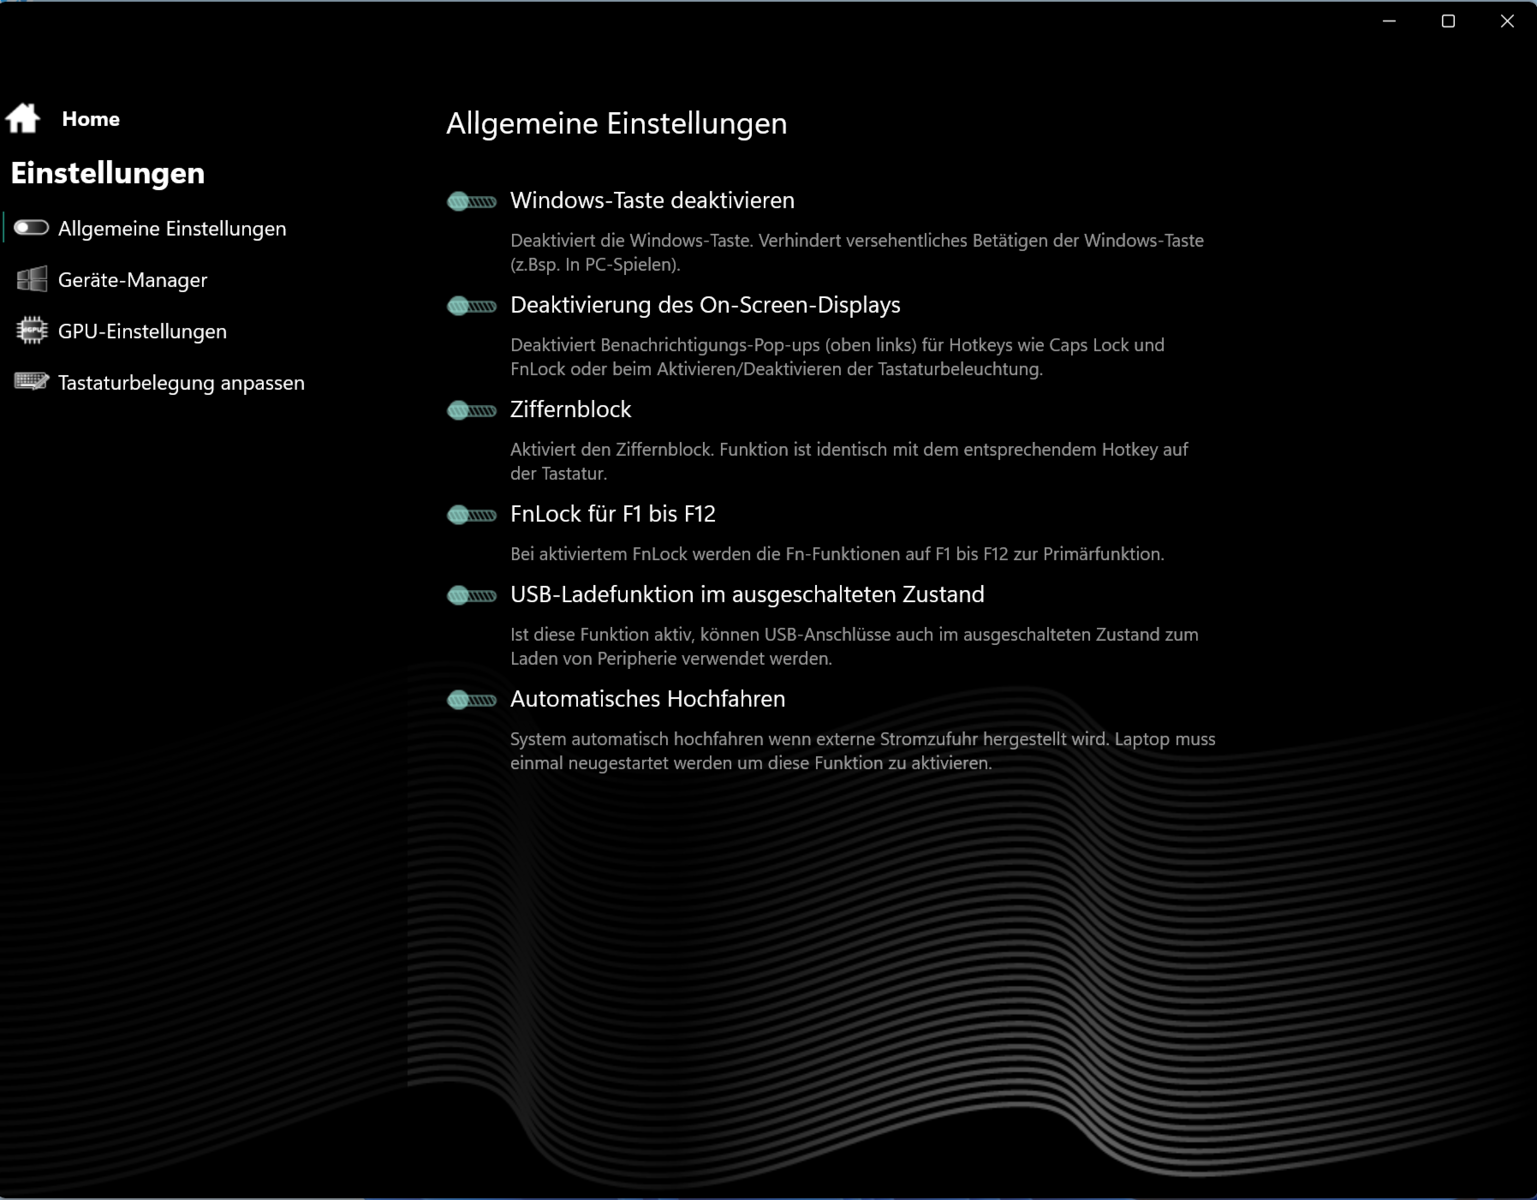
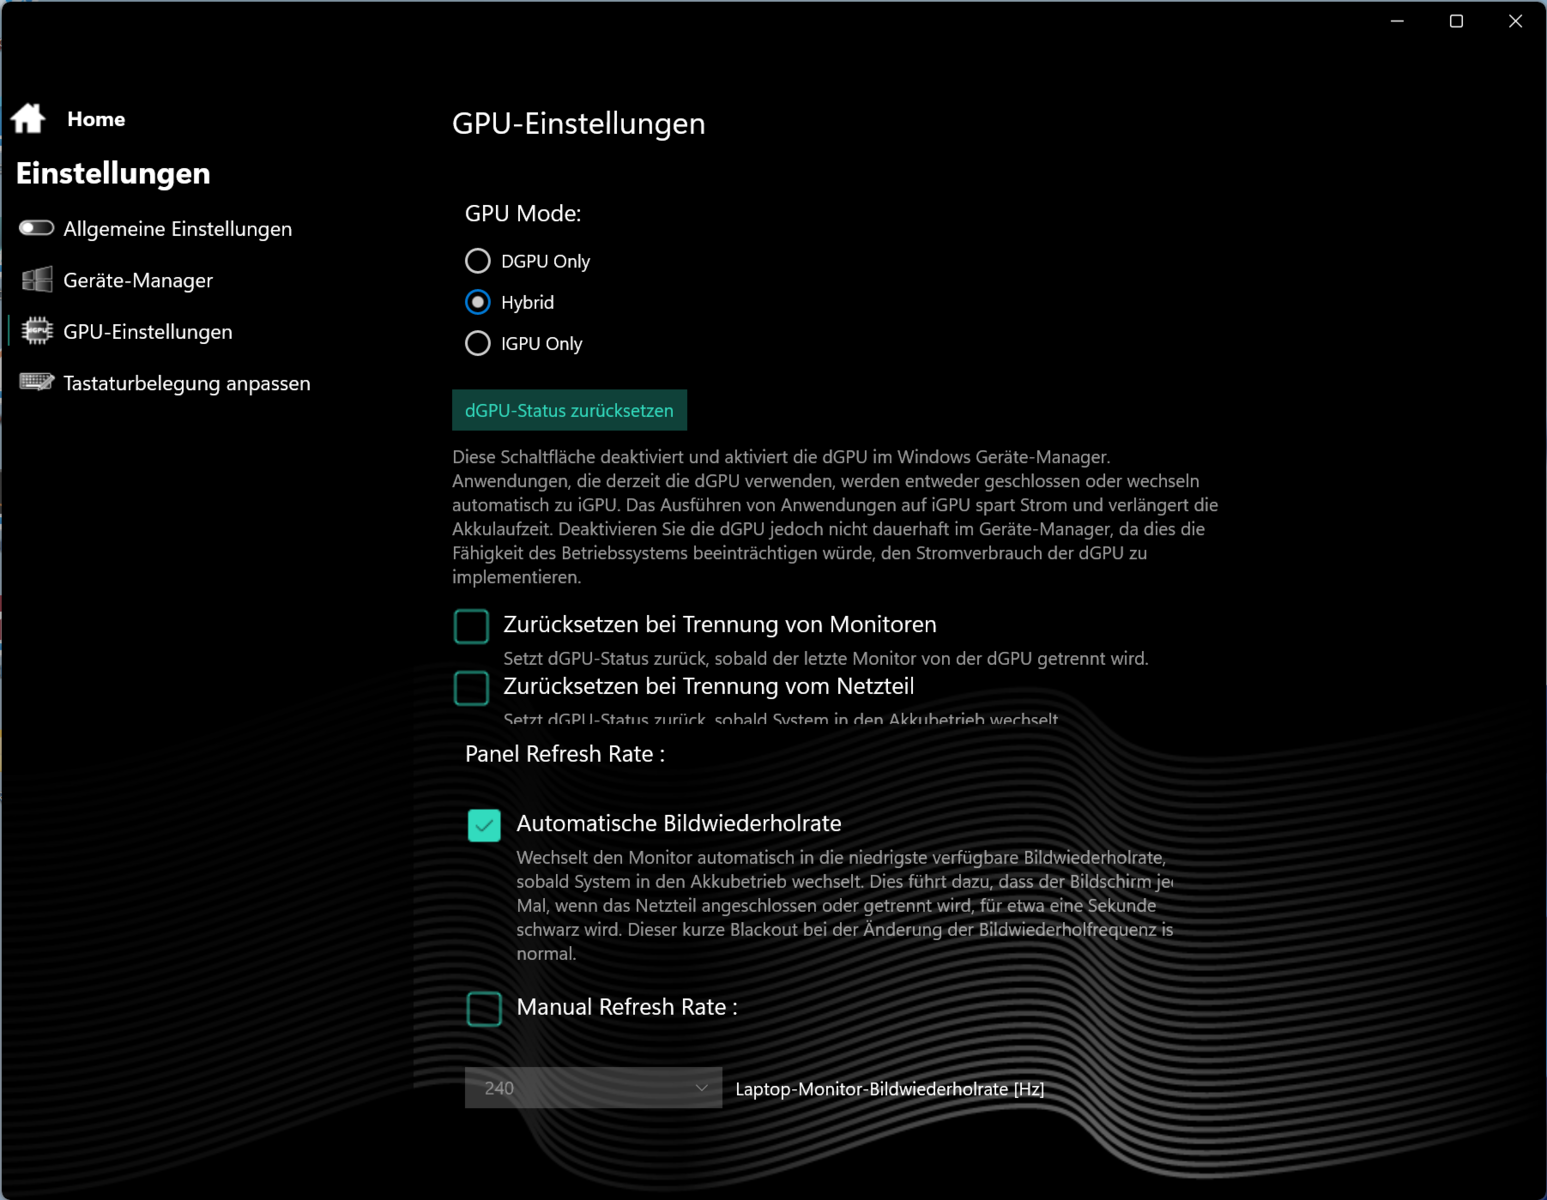
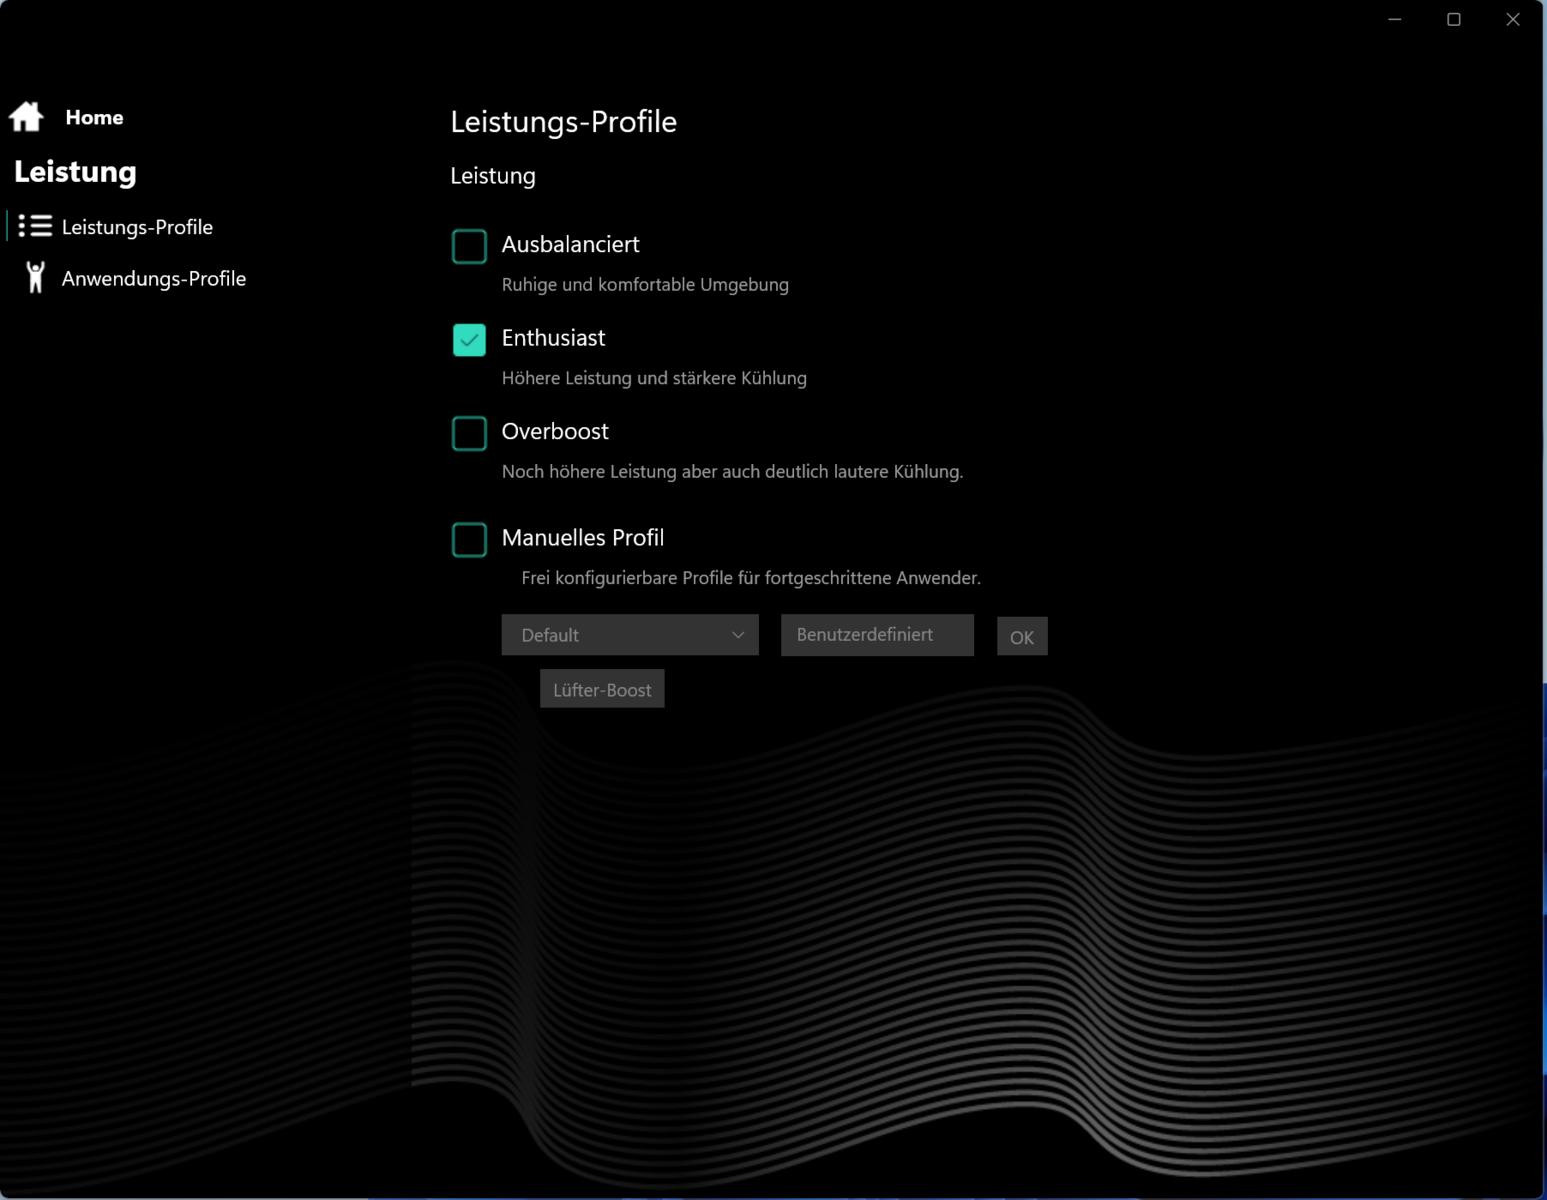
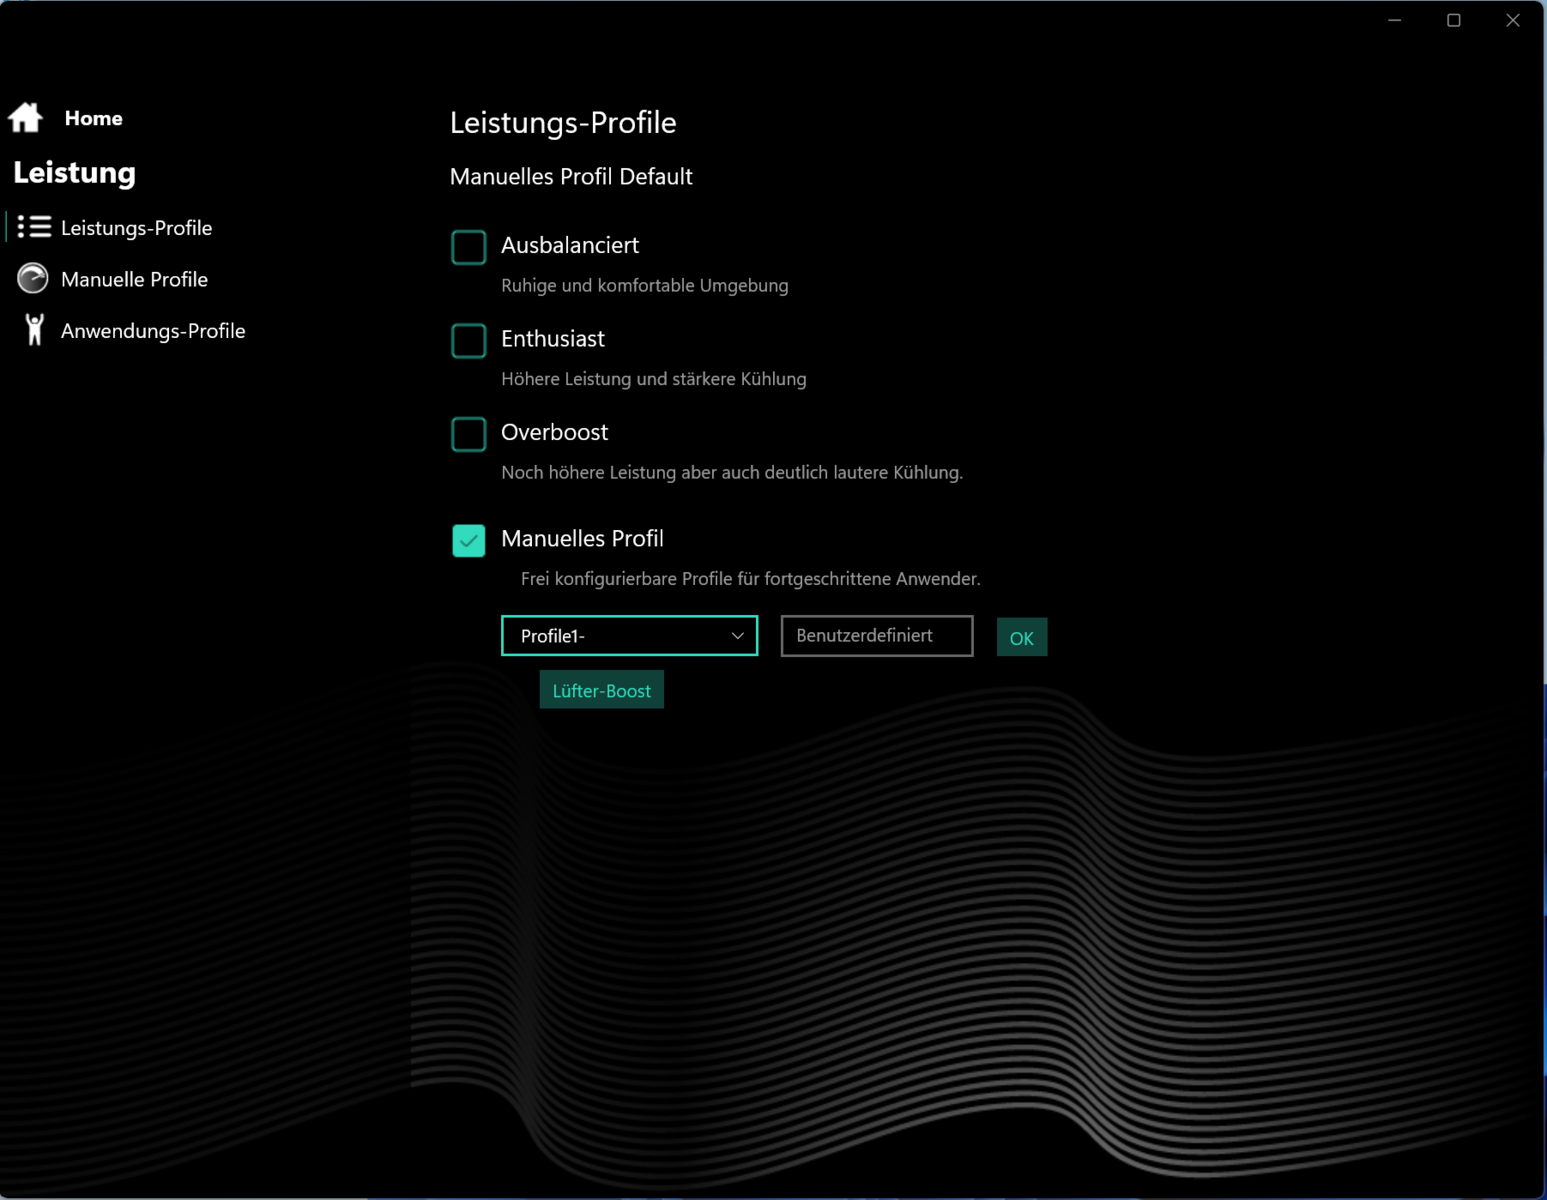
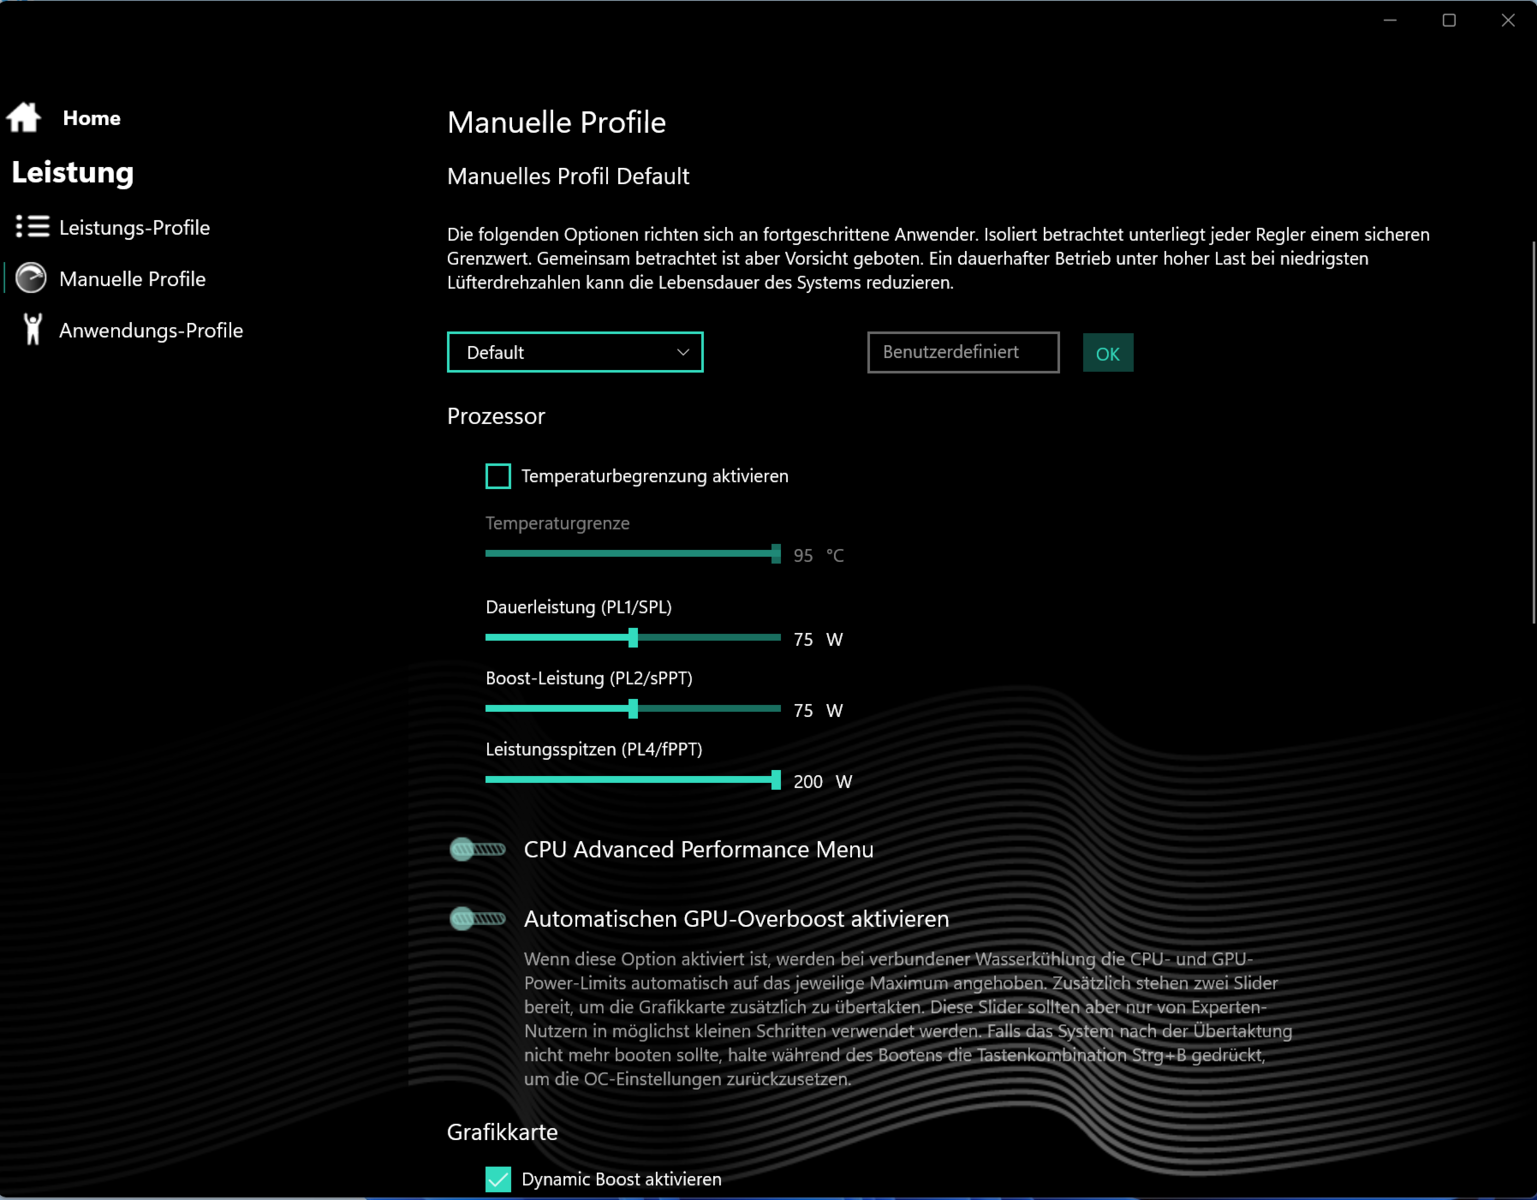
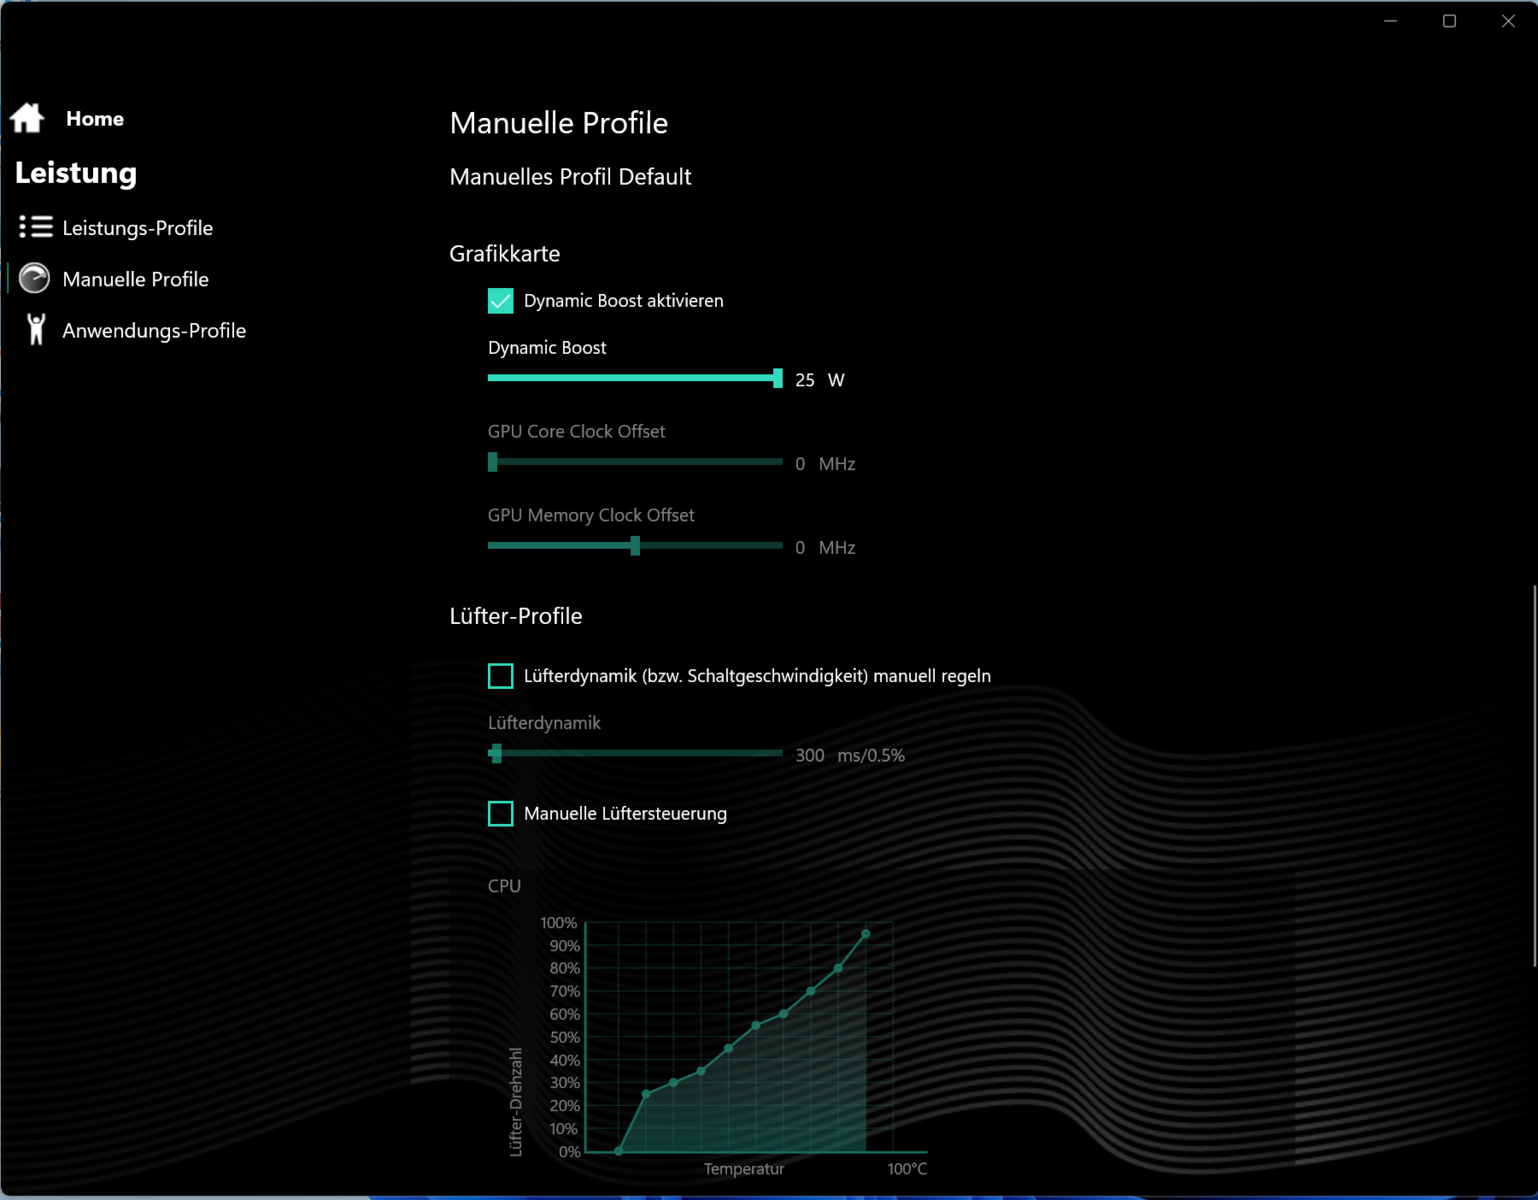
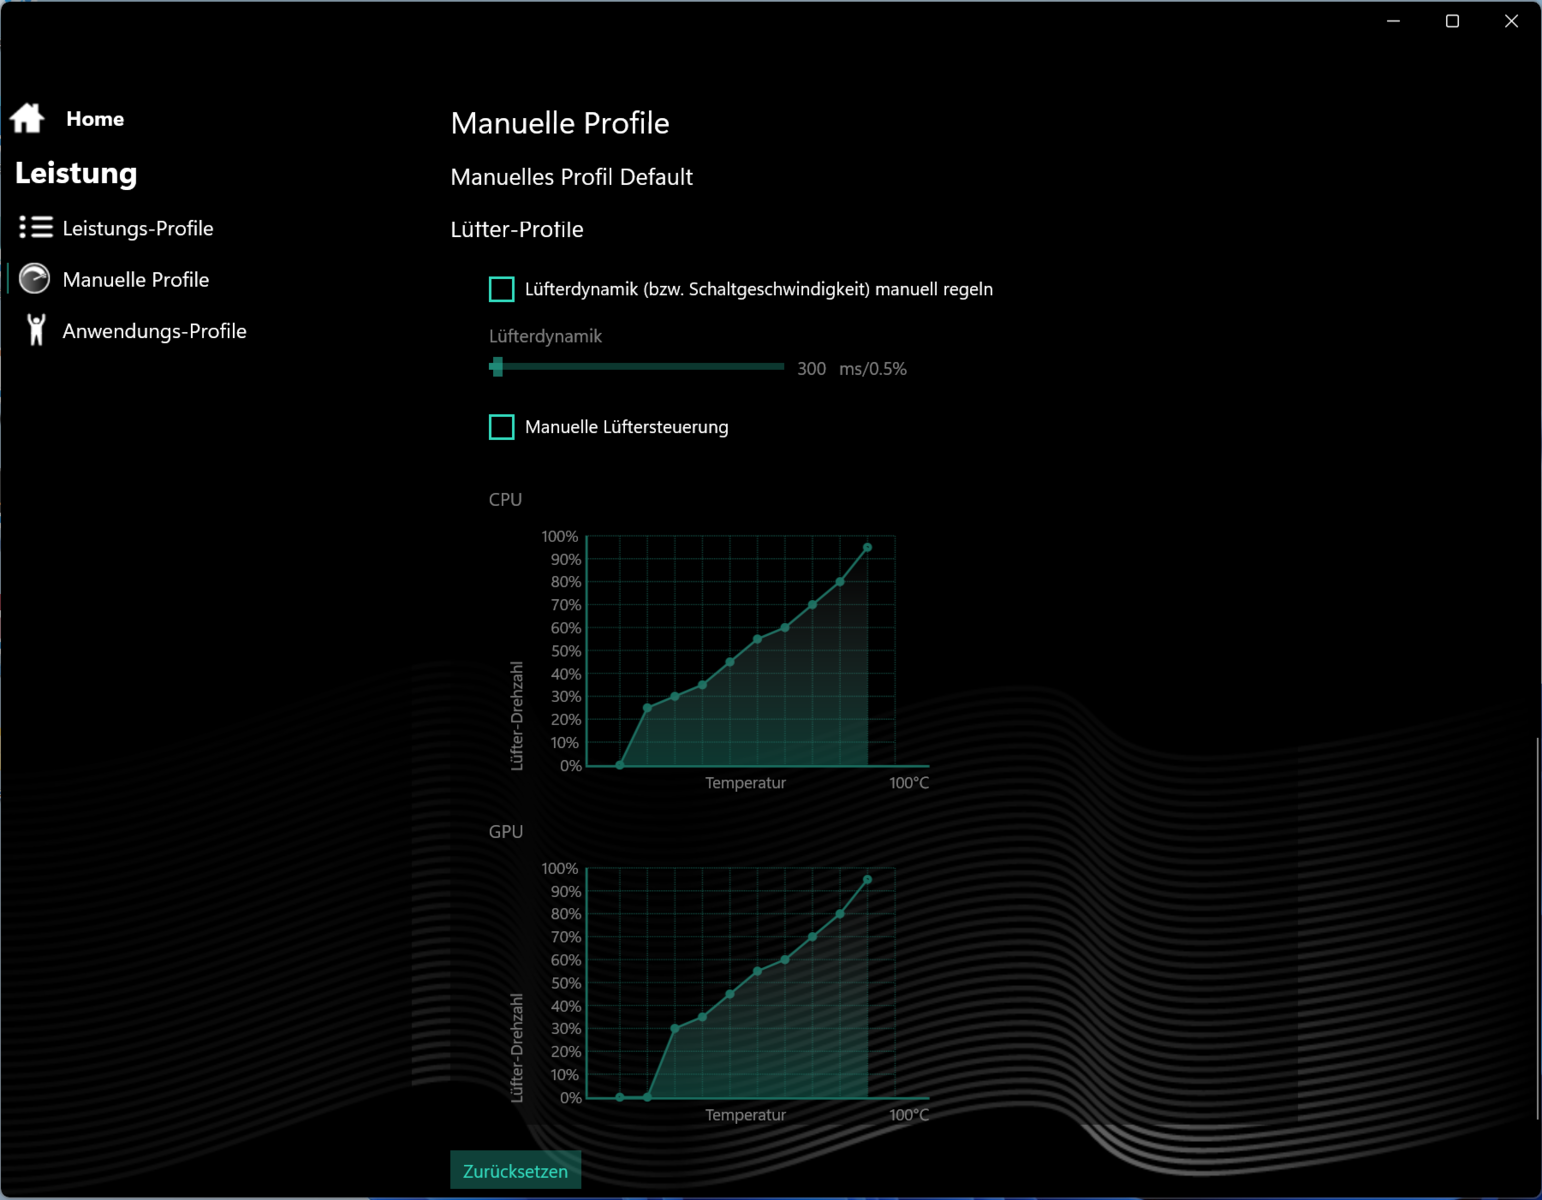
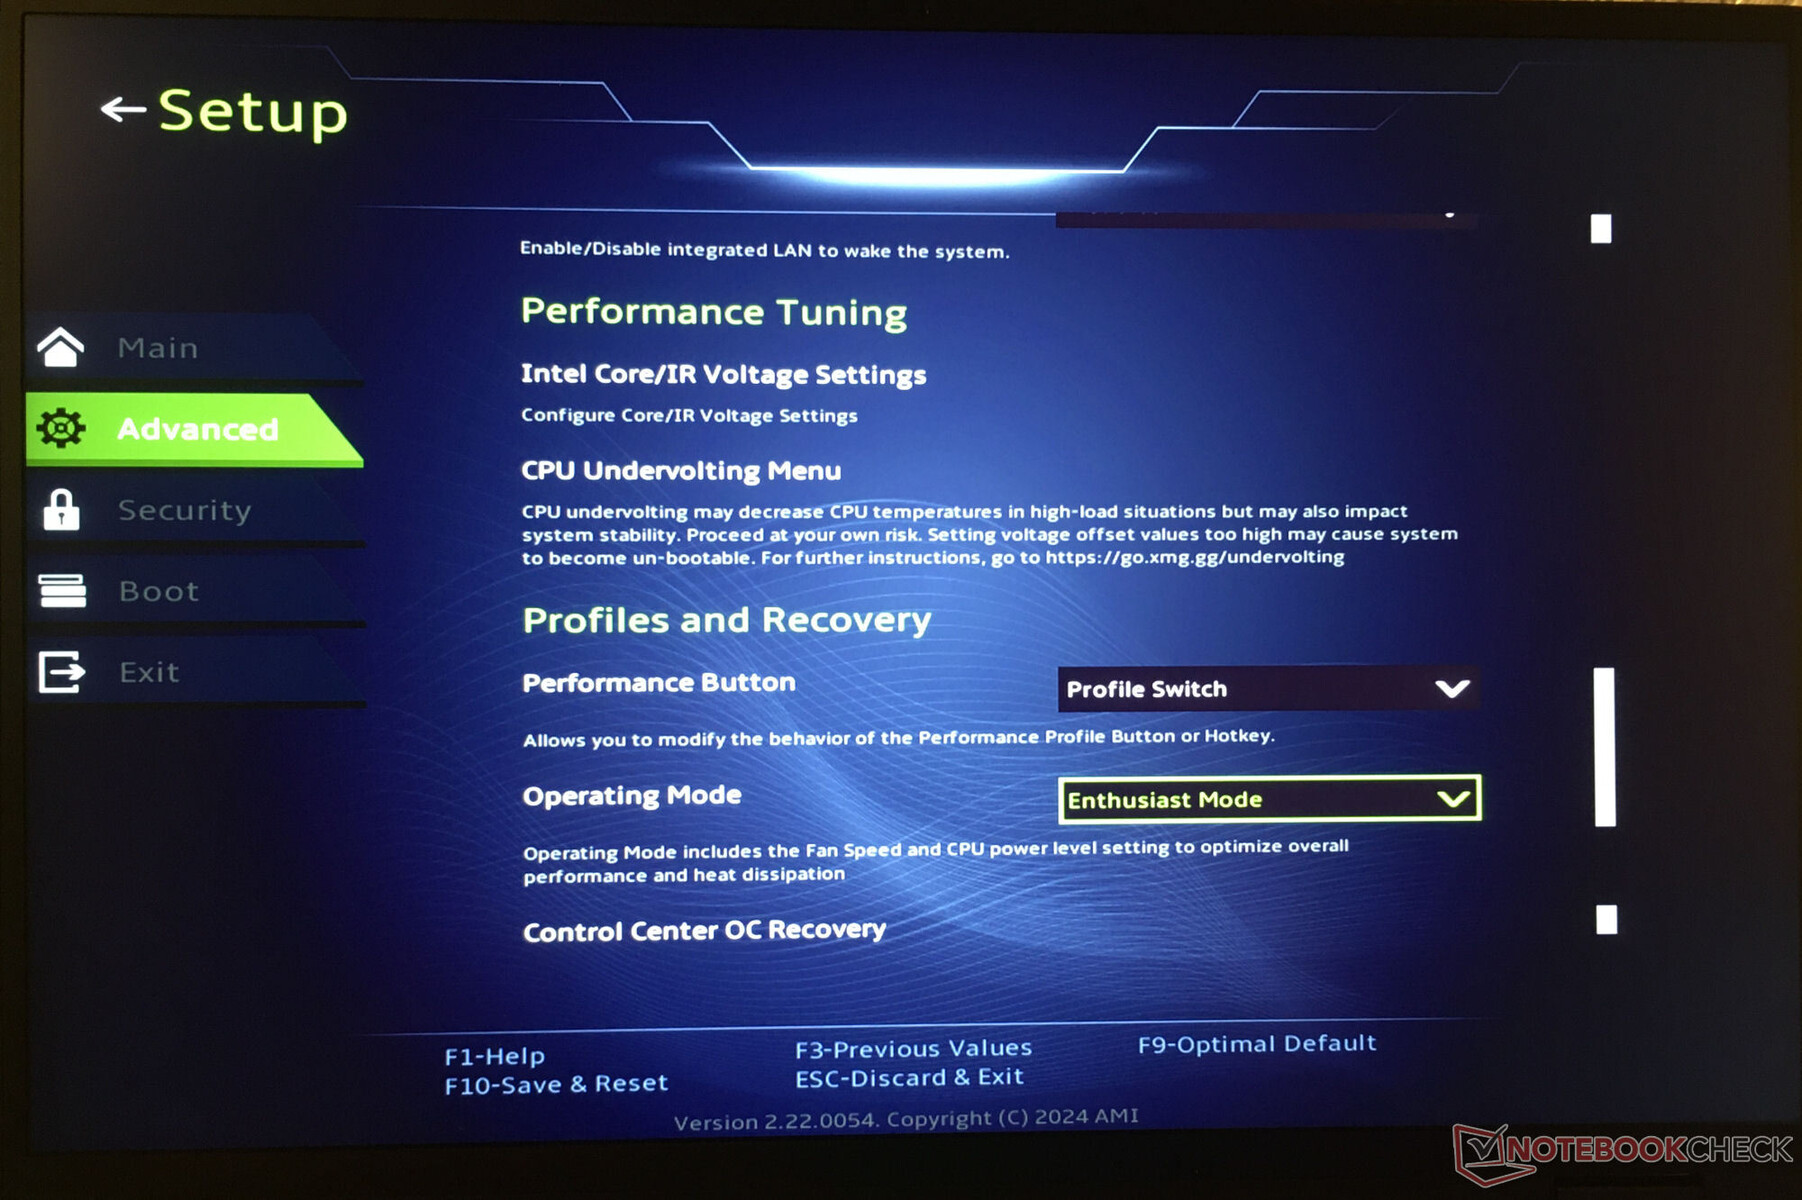
Den bärbara datorn erbjuder tre tillverkarspecifika prestandalägen (se tabell), som snabbt kan växlas mellan med hjälp av en separat knapp (bredvid strömbrytaren). Individuella profiler kan skapas med hjälp av den förinstallerade programvaran Control Center. Till exempel kan CPU:ns effektgränser, GPU:ns TGP och/eller enhetens övre temperaturgränser justeras.
Lägena Enthusiast (benchmarks) och Balanced (batteritester) användes under vårt test. GPU-läget var inställt på Hybrid (= Optimus).
| Entusiast | Overboost | Balanserad | |
|---|---|---|---|
| Effektbegränsning 1 (HWInfo) | 160 watt | 160 watt | 160 watt |
| Effektgräns 2 (HWInfo) | 170 watt | 170 watt | 170 watt |
| Buller (Witcher 3) | 51 dB(A) | 53 dB(A) | 39 dB(A) |
| Prestanda (Witcher 3) | 128 fps | 130 fps | 14-128 fps |

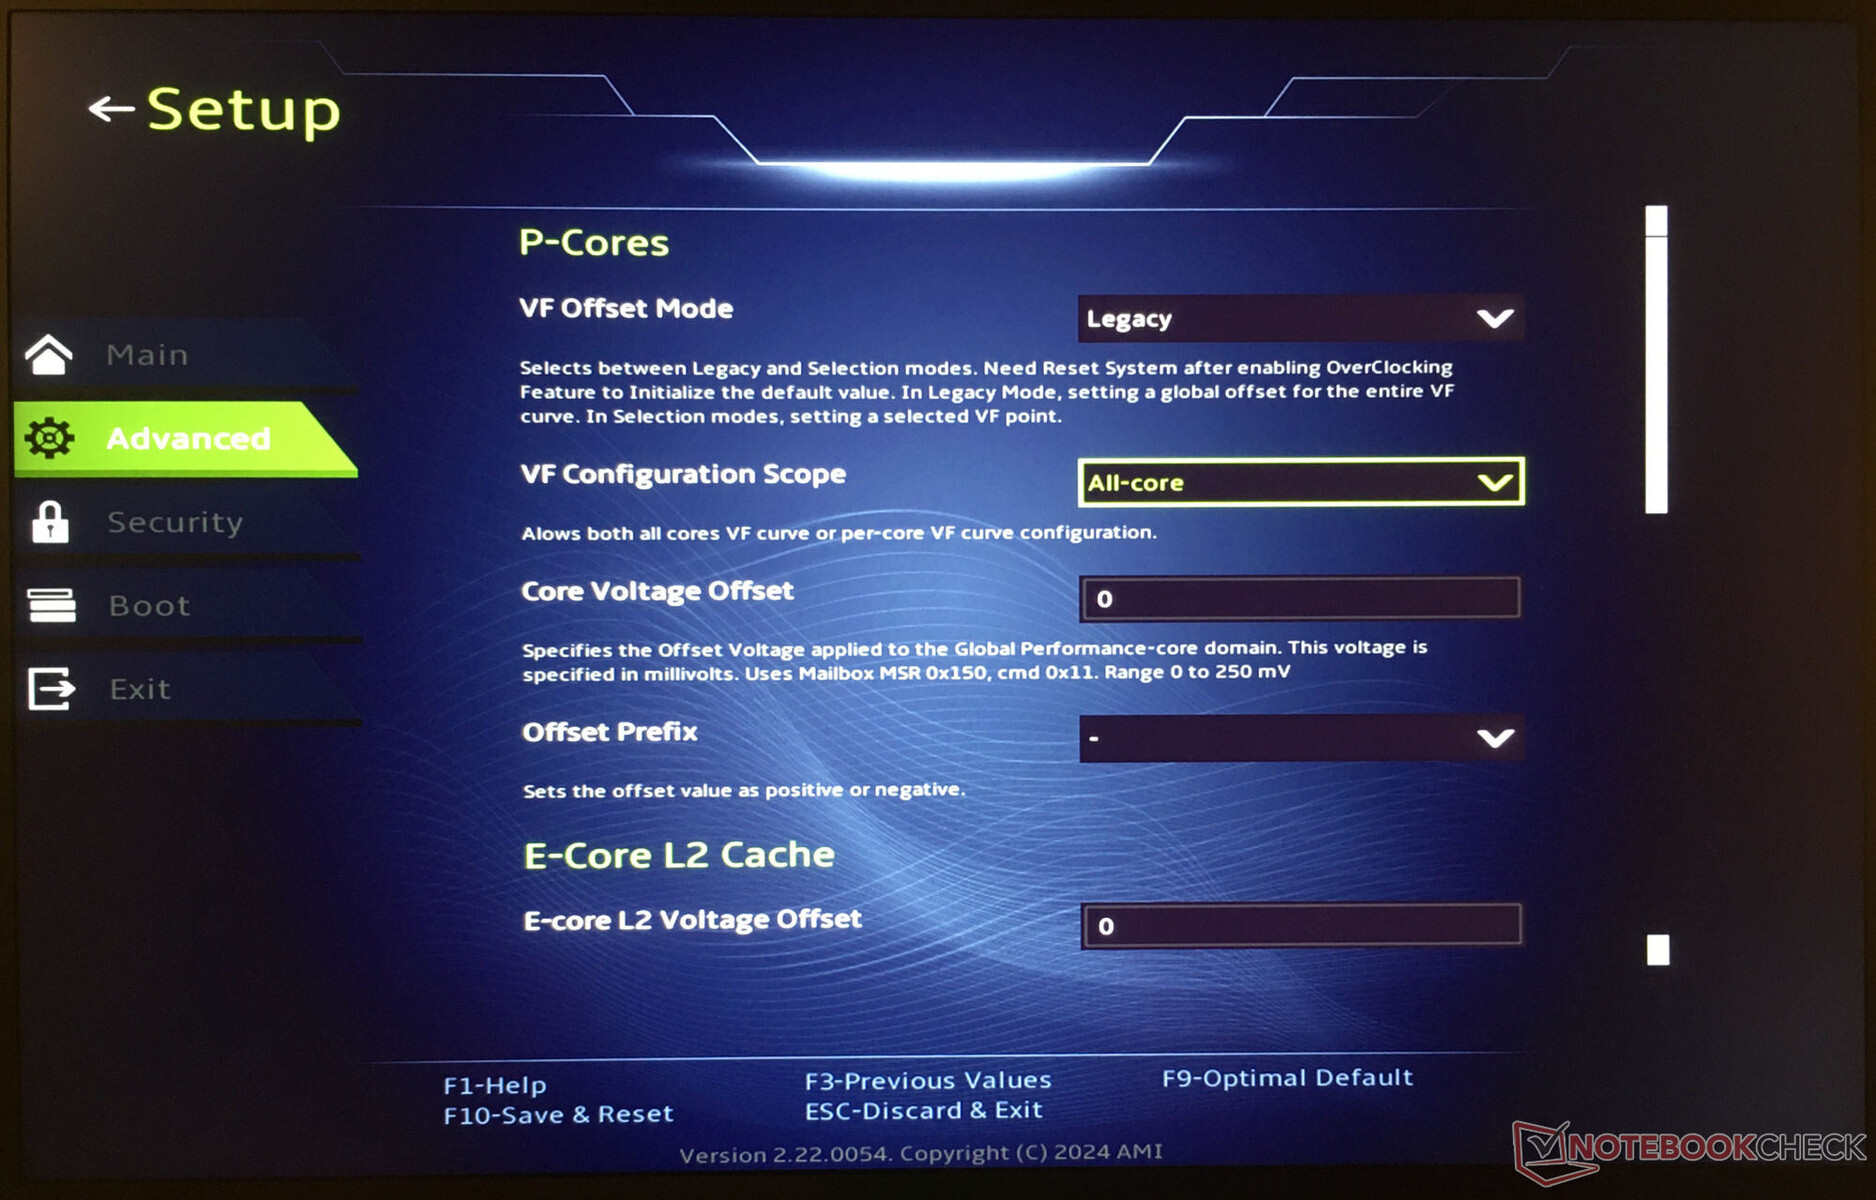
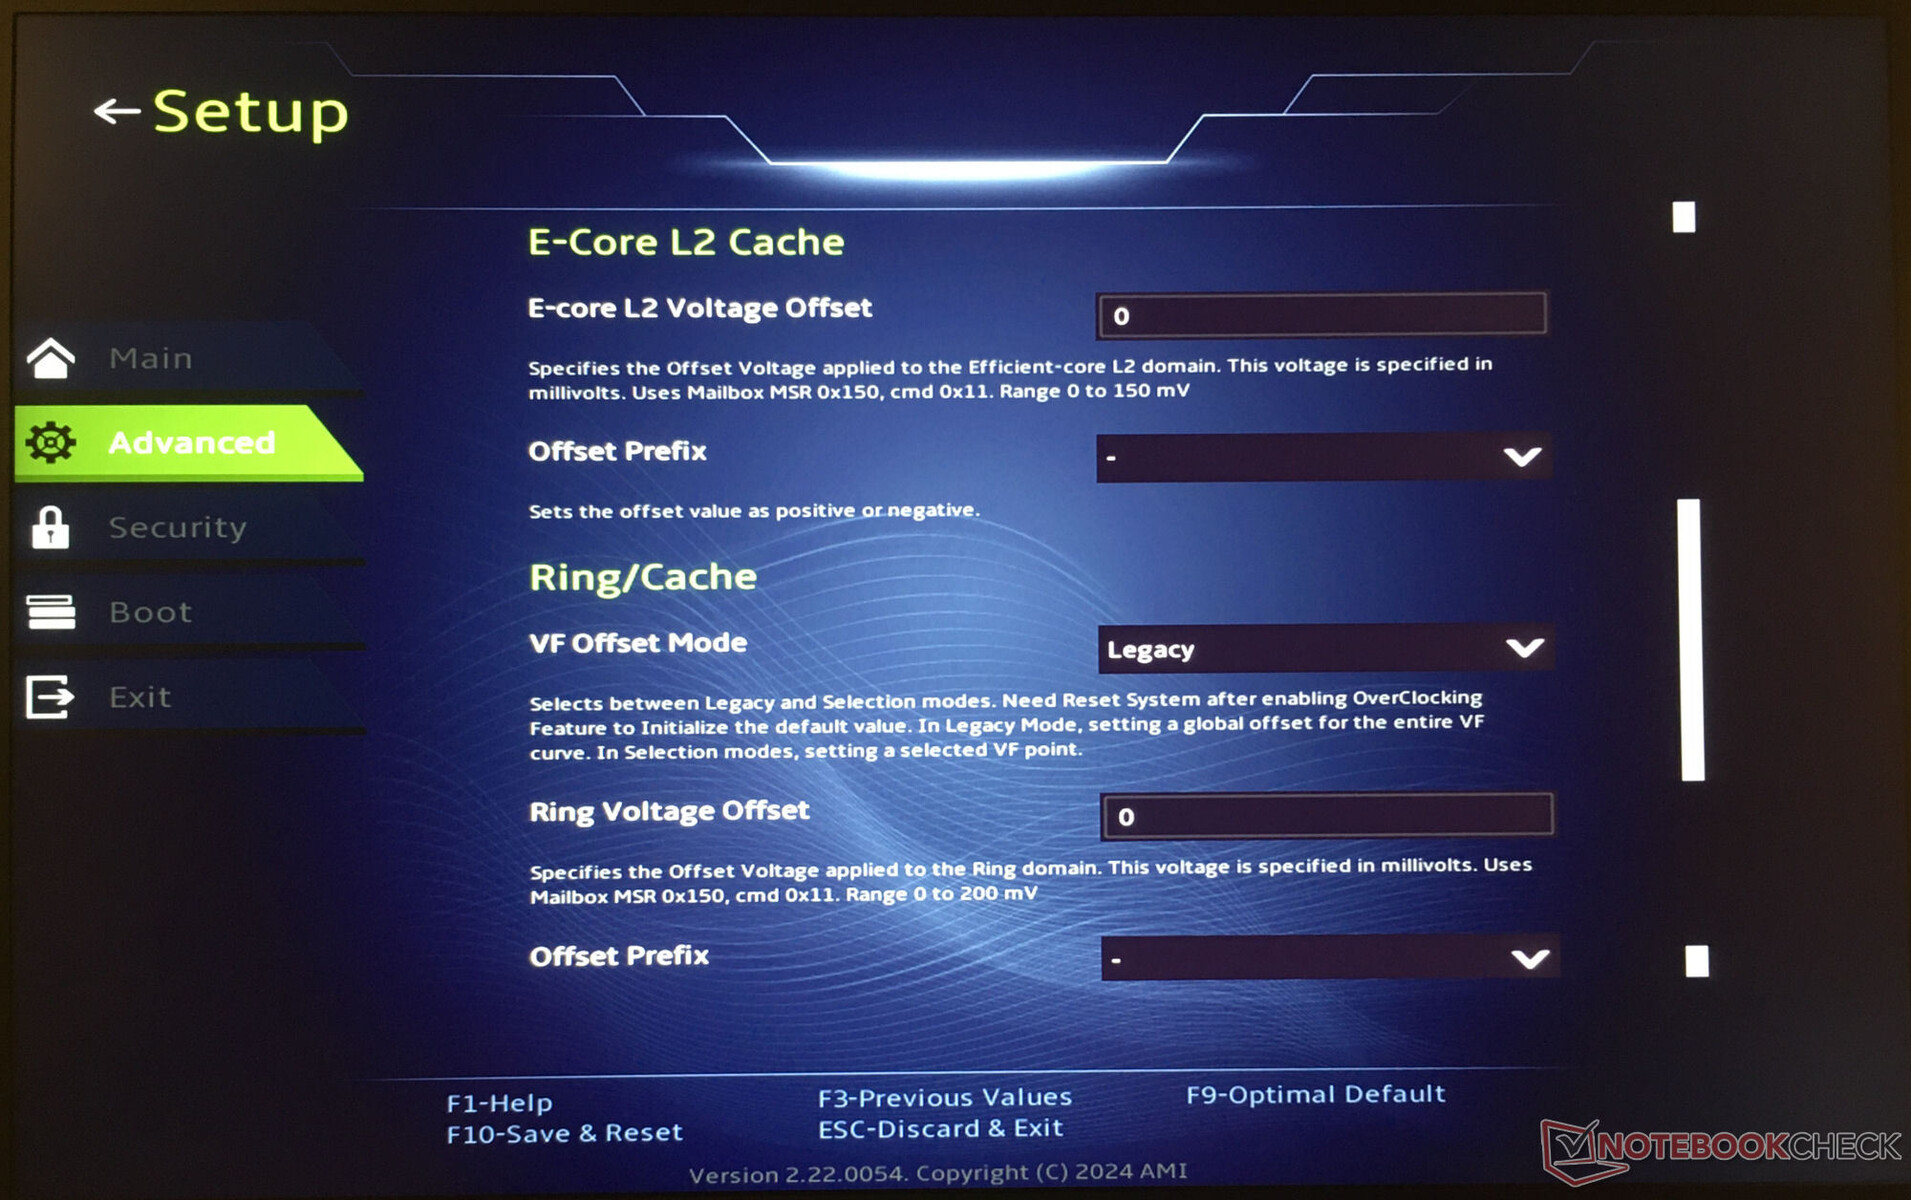
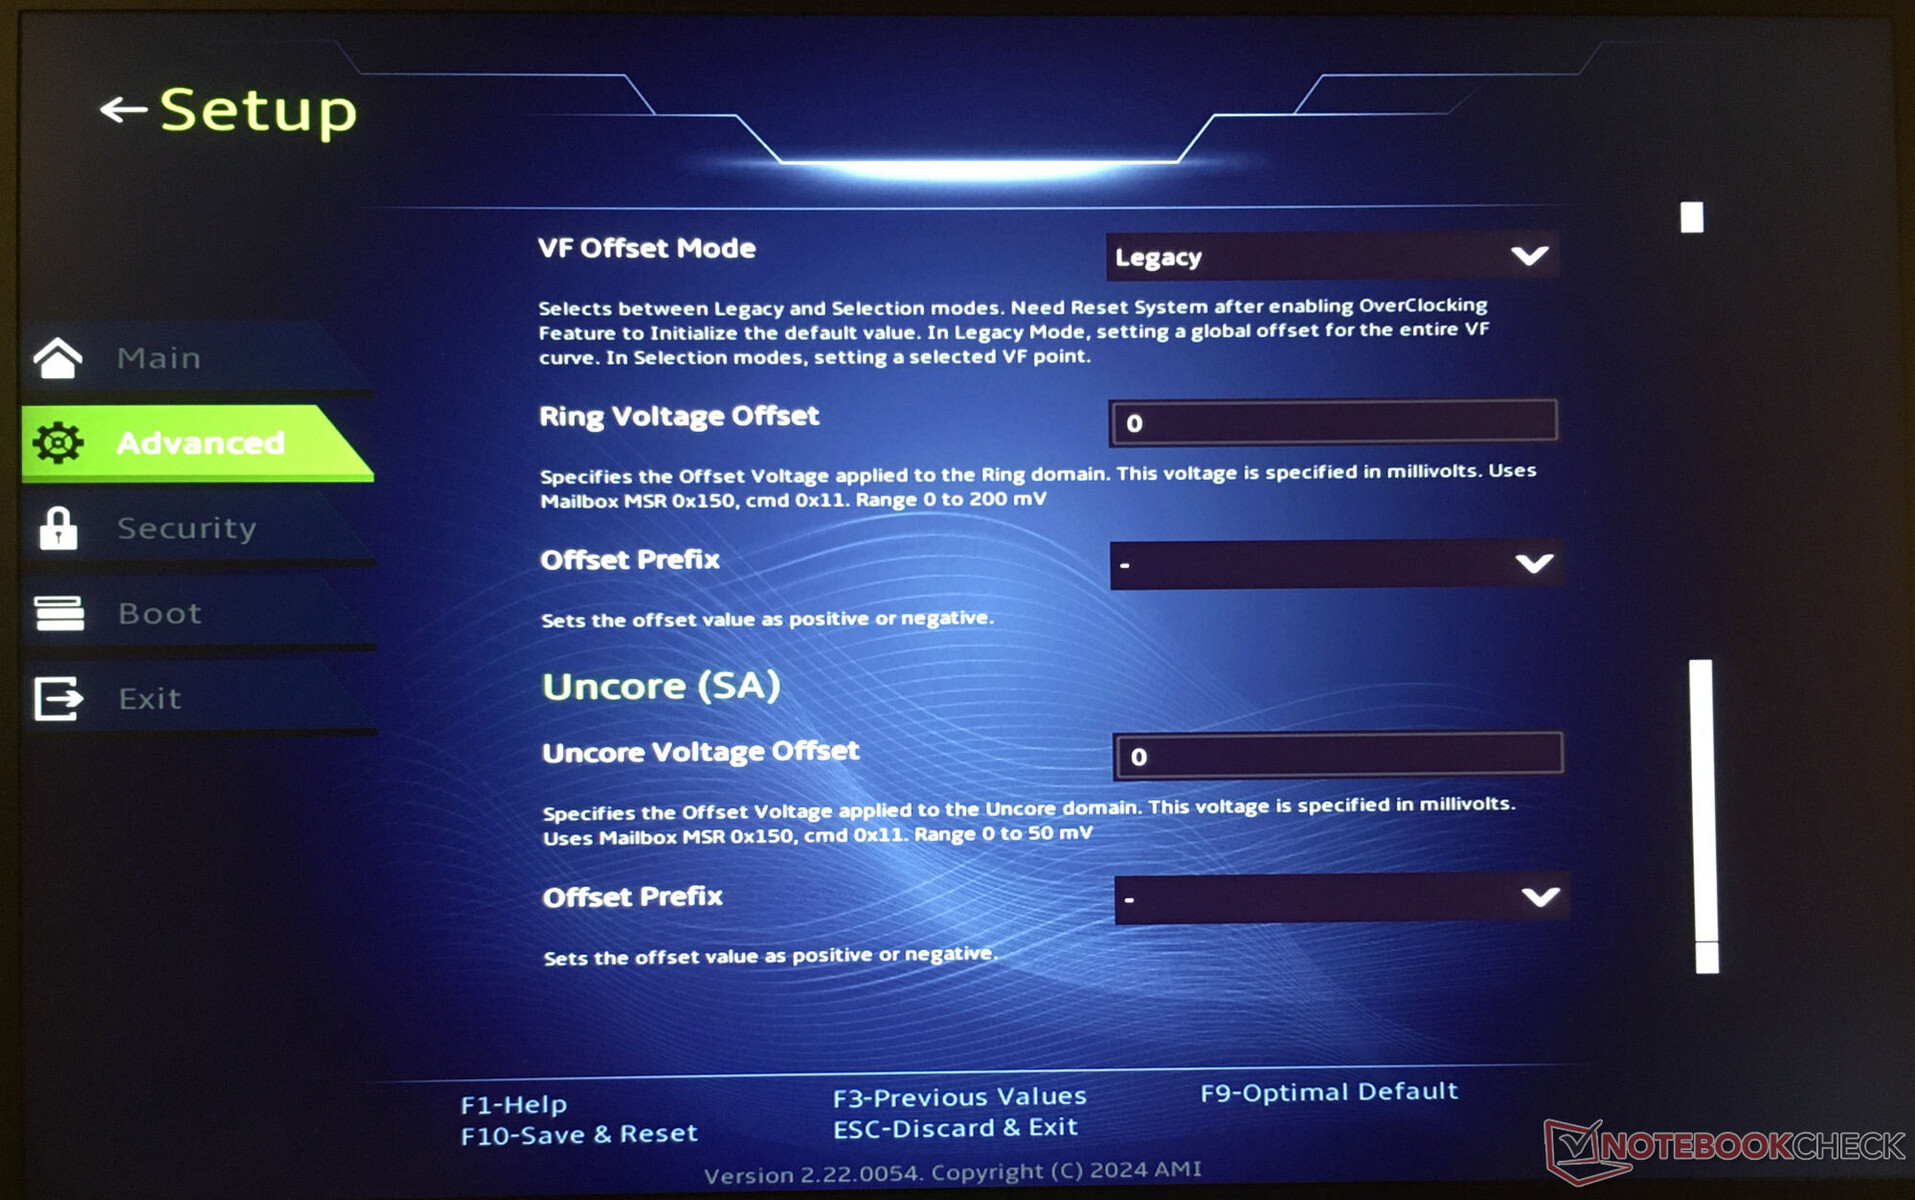
Undervolting
Processorn kan drivas med lägre spänningar än vad tillverkaren har avsett (undervolting). På så sätt minskar enhetens strömförbrukning och värmeutsläpp. Men var försiktig: Om du sänker spänningen för mycket kan det leda till ett instabilt eller felaktigt system. I så fall måste ändringarna återställas - undervolting sker på egen risk.
Processor
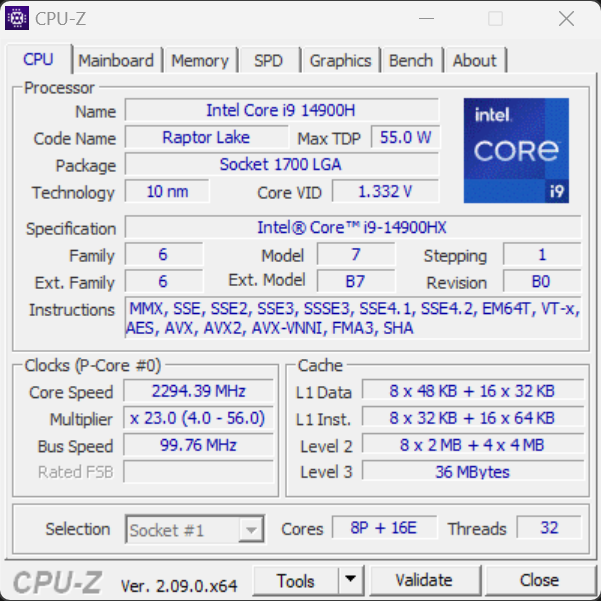
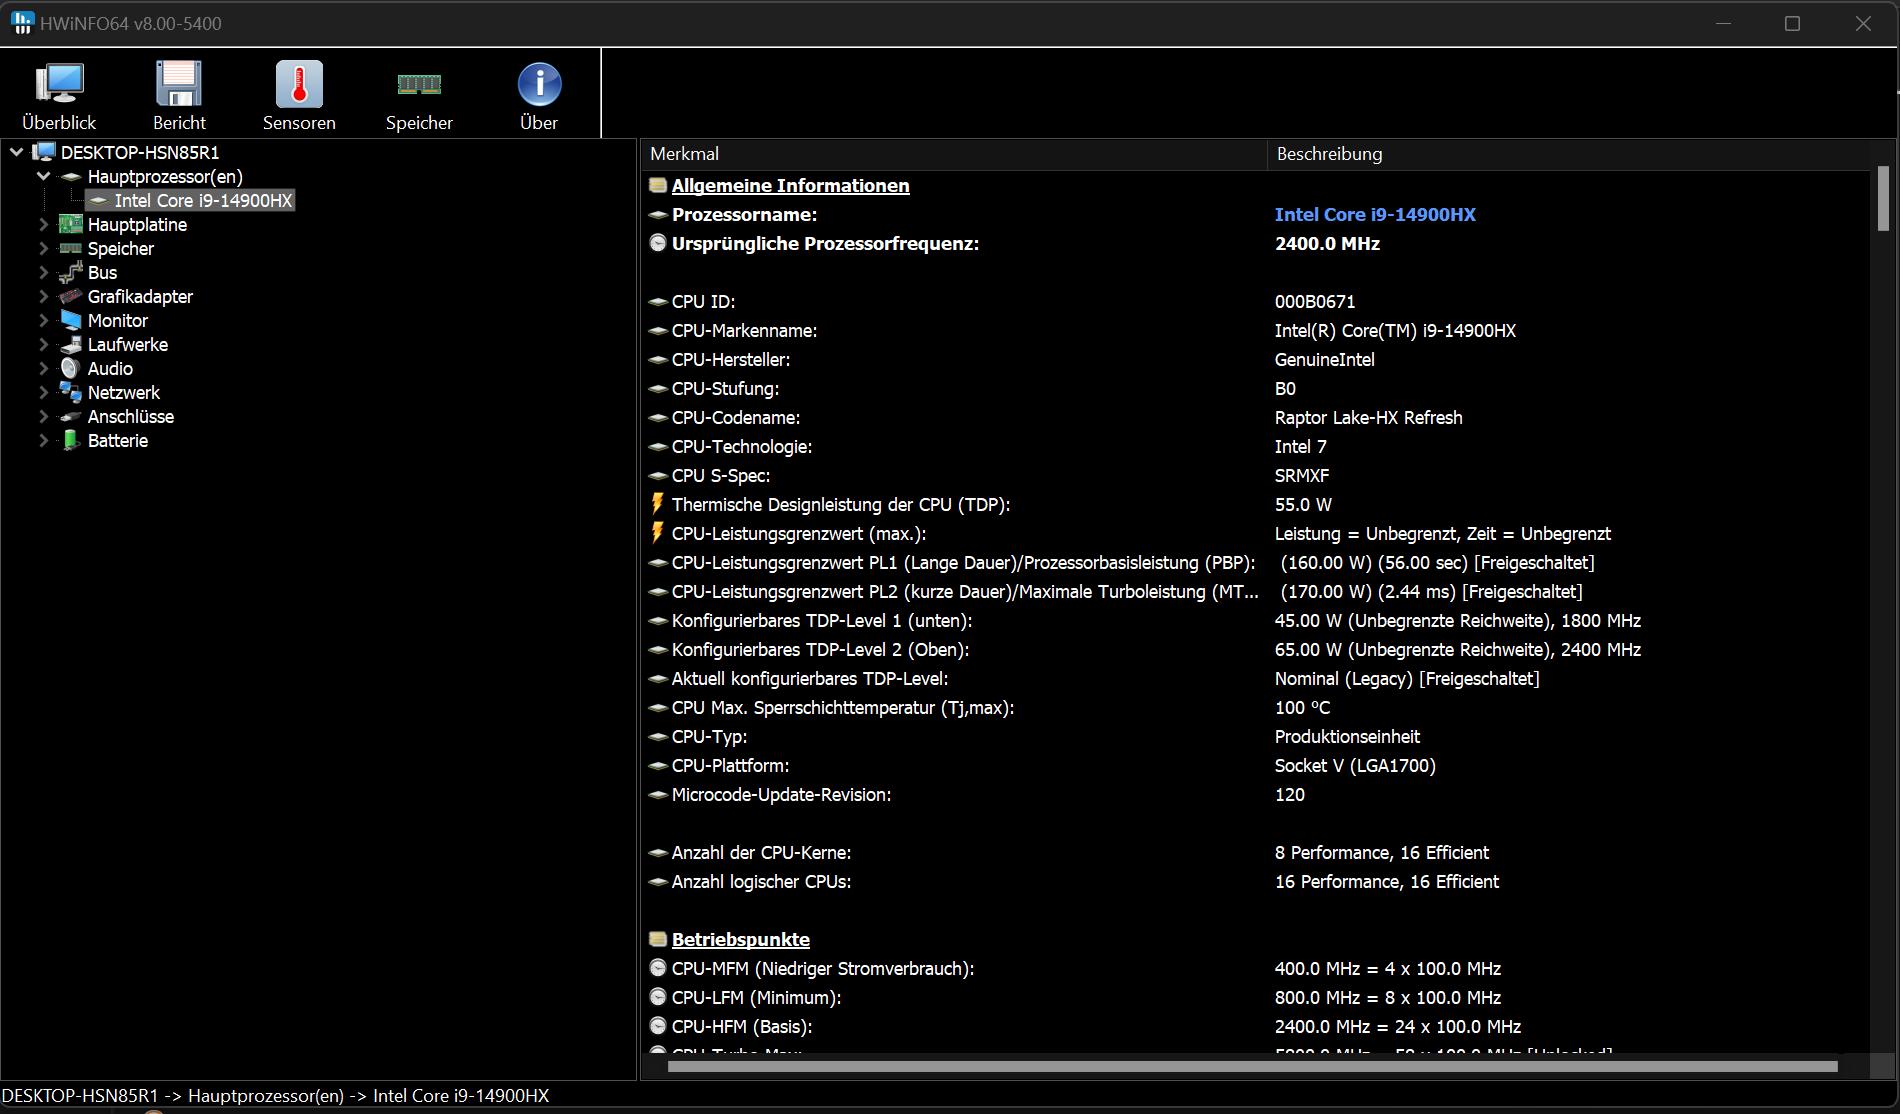
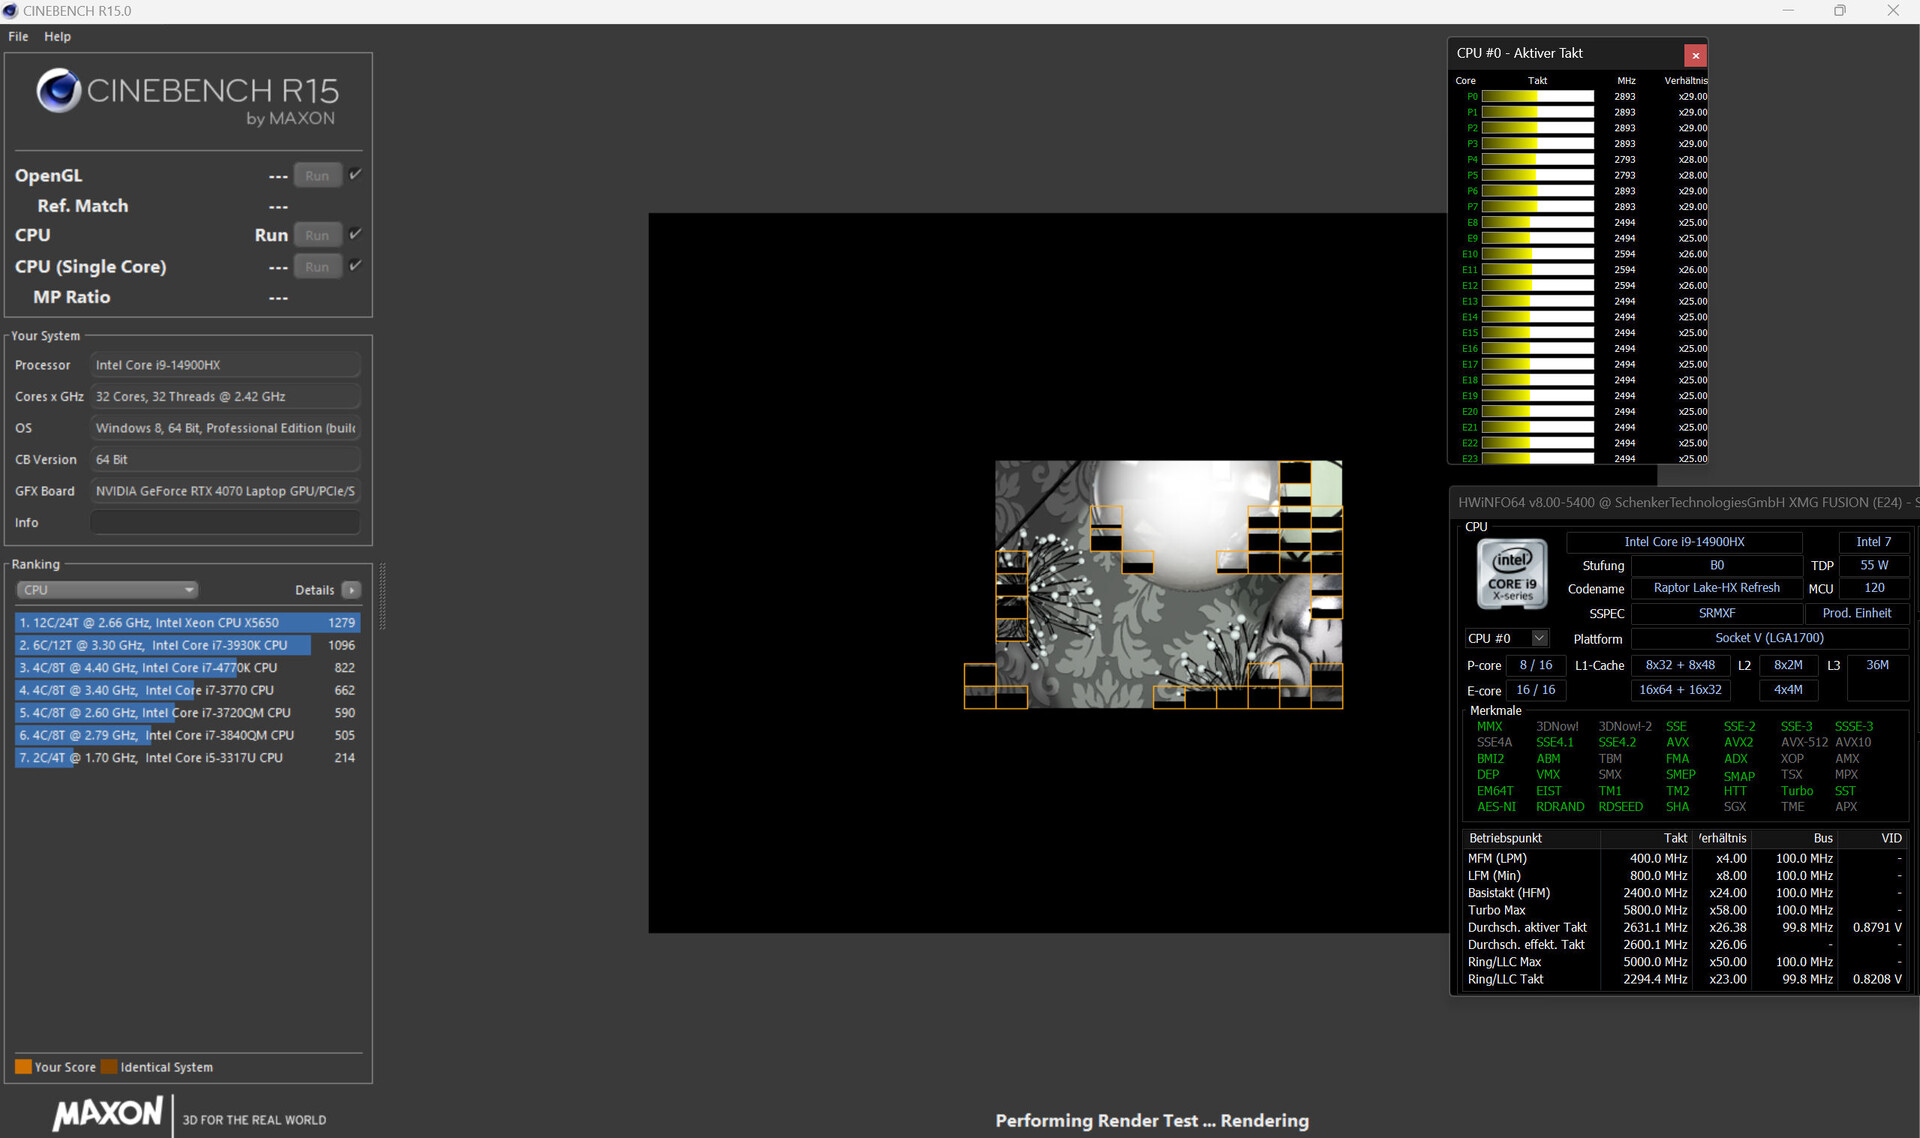
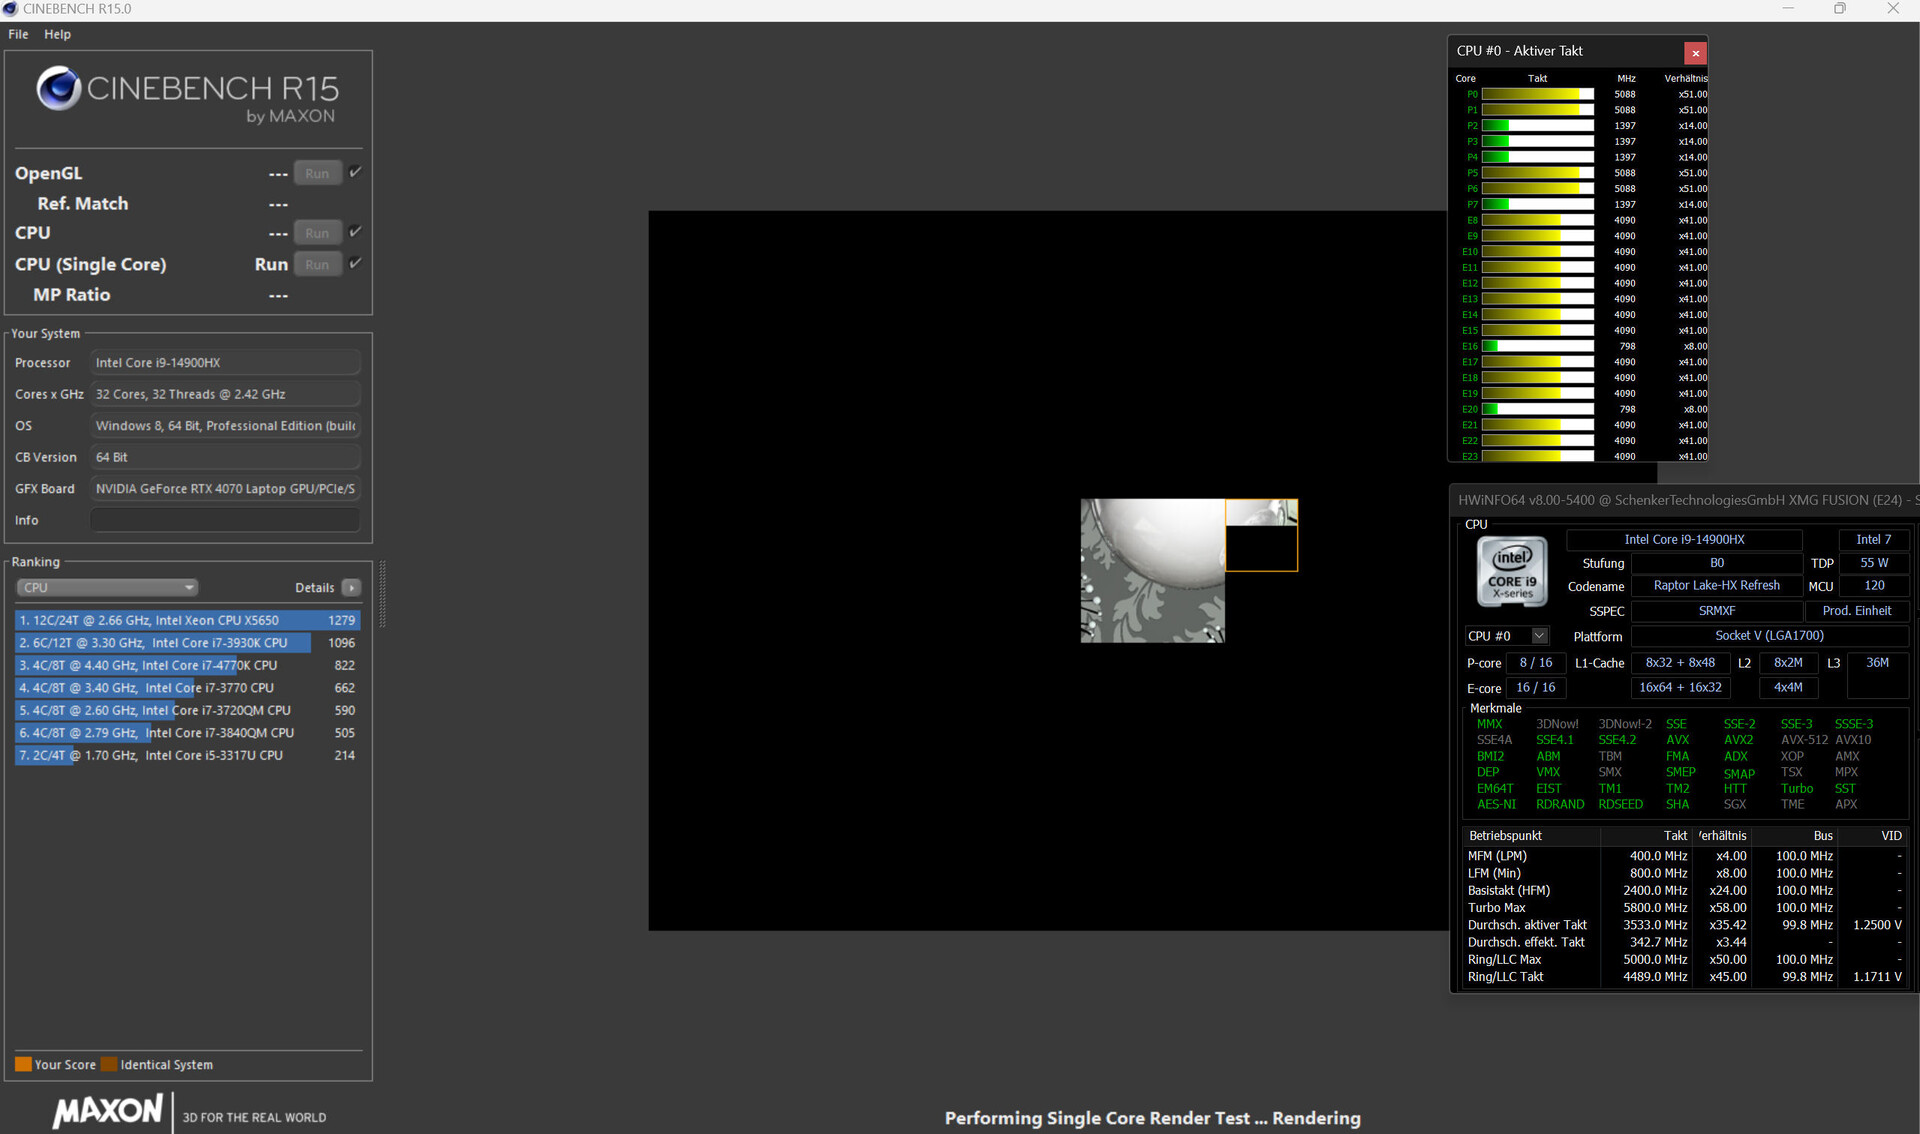
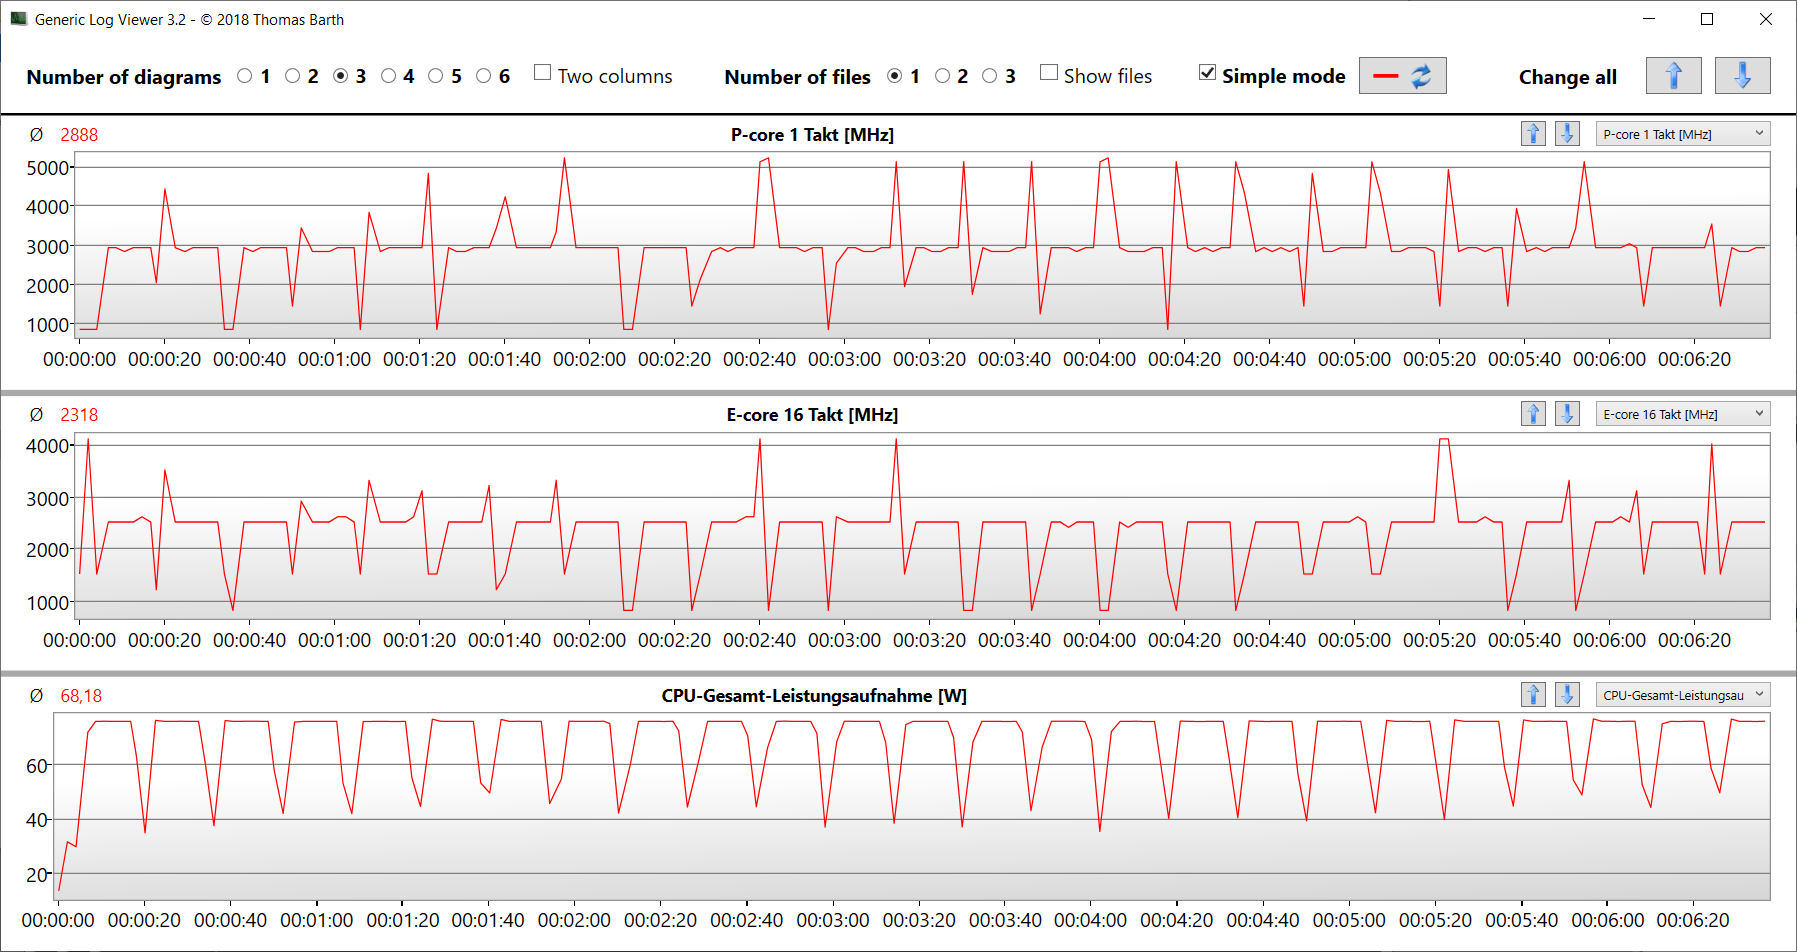
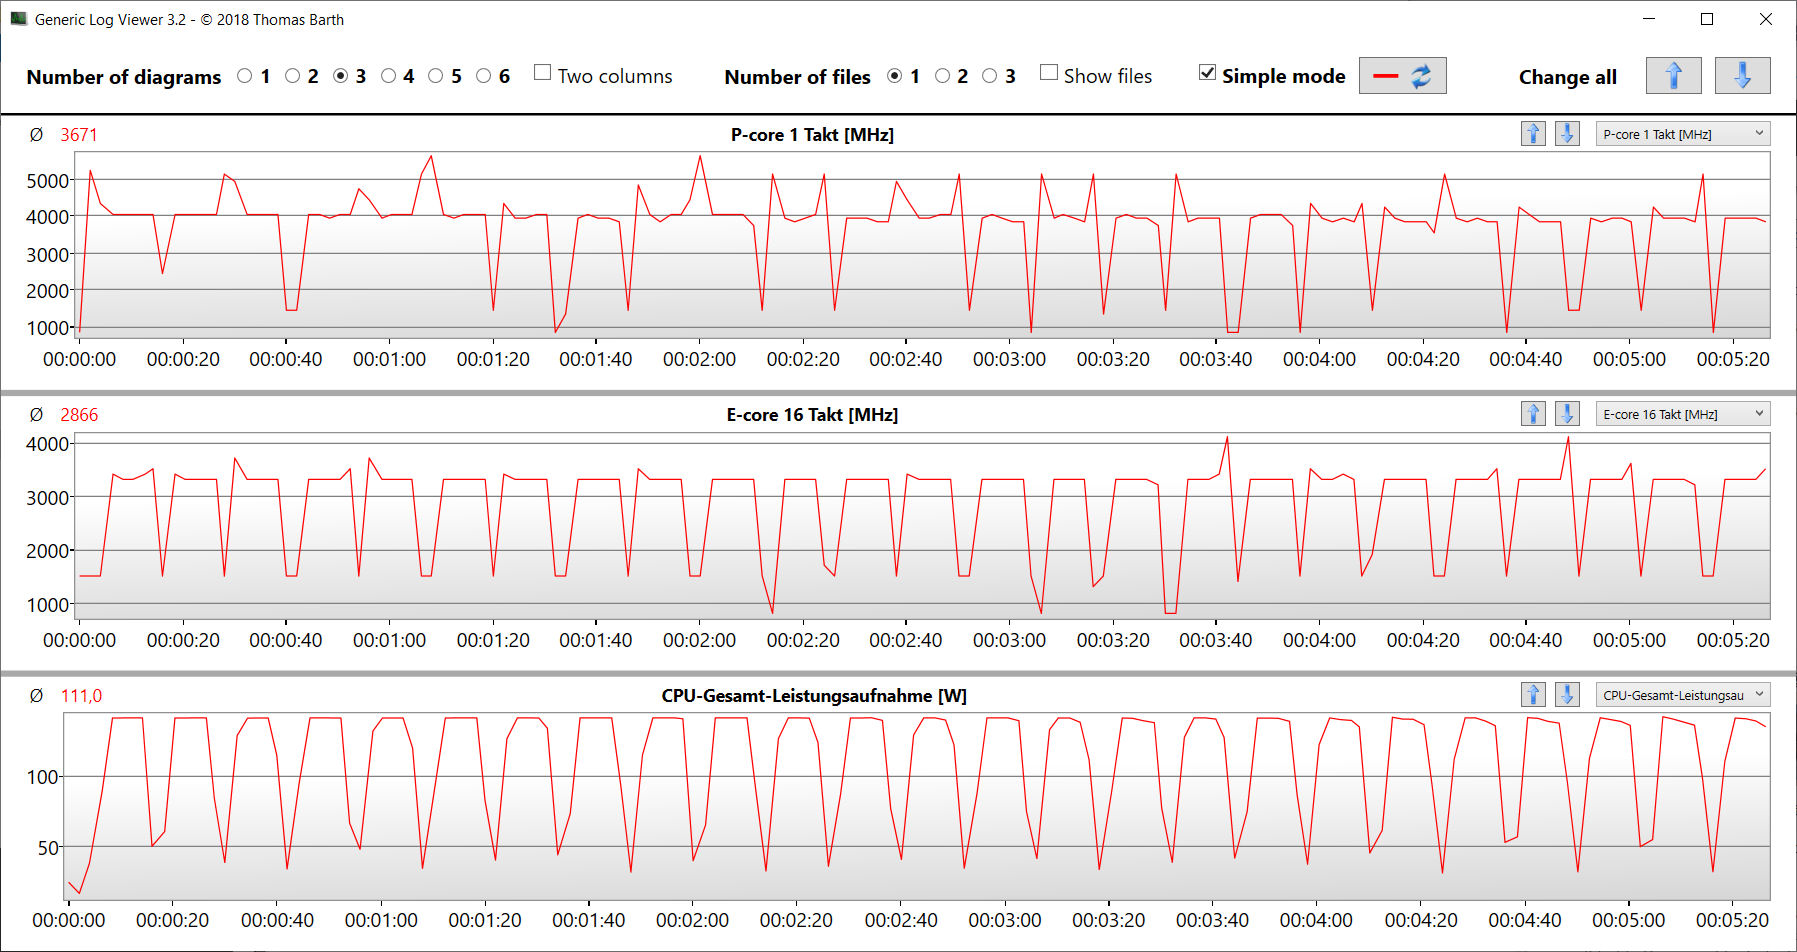
Core Core i9-14900HX (Raptor Lake) 24 CPU-kärnor (8P + 16E = 32 trådar) uppnår maximala klockfrekvenser på 5,8 GHz (P) och 4,1 GHz (E). Permanent belastning med flera trådar (CB15 Loop) resulterar i stabila klockfrekvenser - nivån beror på det valda strömläget.
Enthusiast levererar benchmark-värden under CPU-genomsnittet, medan Overboost höjer dem betydligt över genomsnittet - detta gäller främst den bärbara datorns multi-thread-prestanda. Dess single-thread-prestanda ligger på en hög och mycket likartad nivå när alla tre profilerna används.
Mer information om Core i9 finns i vår analysartikel.
Cinebench R15 Multi continuous test
| CPU Performance rating - Percent | |
| Schenker XMG Fusion 15 (Early 24) | |
| Lenovo Legion Pro 5 16IRX9 | |
| Aorus 16X 2024 | |
| Genomsnitt Intel Core i9-14900HX | |
| Schenker XMG Fusion 15 (Early 24) | |
| Genomsnitt av klass Gaming | |
| HP Omen Transcend 16-u1095ng | |
| Alienware m16 R2 -1! | |
| Cinebench R23 | |
| Multi Core | |
| Schenker XMG Fusion 15 (Early 24) (Overboost) | |
| Lenovo Legion Pro 5 16IRX9 | |
| Genomsnitt Intel Core i9-14900HX (17078 - 36249, n=37) | |
| Aorus 16X 2024 | |
| Genomsnitt av klass Gaming (10488 - 40970, n=110, senaste 2 åren) | |
| Schenker XMG Fusion 15 (Early 24) | |
| HP Omen Transcend 16-u1095ng | |
| Alienware m16 R2 | |
| Single Core | |
| Schenker XMG Fusion 15 (Early 24) (Overboost) | |
| Aorus 16X 2024 | |
| HP Omen Transcend 16-u1095ng | |
| Genomsnitt Intel Core i9-14900HX (1720 - 2245, n=37) | |
| Lenovo Legion Pro 5 16IRX9 | |
| Schenker XMG Fusion 15 (Early 24) | |
| Genomsnitt av klass Gaming (1166 - 2356, n=110, senaste 2 åren) | |
| Alienware m16 R2 | |
| Cinebench R20 | |
| CPU (Multi Core) | |
| Schenker XMG Fusion 15 (Early 24) (Overboost) | |
| Lenovo Legion Pro 5 16IRX9 | |
| Genomsnitt Intel Core i9-14900HX (6579 - 13832, n=37) | |
| Aorus 16X 2024 | |
| Genomsnitt av klass Gaming (4029 - 16108, n=109, senaste 2 åren) | |
| Schenker XMG Fusion 15 (Early 24) | |
| HP Omen Transcend 16-u1095ng | |
| Alienware m16 R2 | |
| CPU (Single Core) | |
| Schenker XMG Fusion 15 (Early 24) (Overboost) | |
| Aorus 16X 2024 | |
| HP Omen Transcend 16-u1095ng | |
| Genomsnitt Intel Core i9-14900HX (657 - 859, n=37) | |
| Lenovo Legion Pro 5 16IRX9 | |
| Schenker XMG Fusion 15 (Early 24) | |
| Genomsnitt av klass Gaming (442 - 895, n=109, senaste 2 åren) | |
| Alienware m16 R2 | |
| Cinebench R15 | |
| CPU Multi 64Bit | |
| Lenovo Legion Pro 5 16IRX9 | |
| Schenker XMG Fusion 15 (Early 24) (Overboost) | |
| Genomsnitt Intel Core i9-14900HX (3263 - 5589, n=38) | |
| Aorus 16X 2024 | |
| Genomsnitt av klass Gaming (1578 - 6271, n=109, senaste 2 åren) | |
| HP Omen Transcend 16-u1095ng | |
| Schenker XMG Fusion 15 (Early 24) | |
| Alienware m16 R2 | |
| CPU Single 64Bit | |
| Aorus 16X 2024 | |
| Schenker XMG Fusion 15 (Early 24) (Overboost) | |
| Genomsnitt Intel Core i9-14900HX (247 - 323, n=37) | |
| Lenovo Legion Pro 5 16IRX9 | |
| HP Omen Transcend 16-u1095ng | |
| Genomsnitt av klass Gaming (188.8 - 343, n=109, senaste 2 åren) | |
| Schenker XMG Fusion 15 (Early 24) | |
| Alienware m16 R2 | |
| Blender - v2.79 BMW27 CPU | |
| HP Omen Transcend 16-u1095ng | |
| Genomsnitt av klass Gaming (80 - 330, n=107, senaste 2 åren) | |
| Schenker XMG Fusion 15 (Early 24) | |
| Aorus 16X 2024 | |
| Genomsnitt Intel Core i9-14900HX (91 - 206, n=37) | |
| Lenovo Legion Pro 5 16IRX9 | |
| Schenker XMG Fusion 15 (Early 24) (Overboost) | |
| 7-Zip 18.03 | |
| 7z b 4 | |
| Schenker XMG Fusion 15 (Early 24) (Overboost) | |
| Lenovo Legion Pro 5 16IRX9 | |
| Genomsnitt Intel Core i9-14900HX (66769 - 136645, n=37) | |
| Aorus 16X 2024 | |
| Schenker XMG Fusion 15 (Early 24) | |
| Genomsnitt av klass Gaming (33491 - 148086, n=108, senaste 2 åren) | |
| HP Omen Transcend 16-u1095ng | |
| Alienware m16 R2 | |
| 7z b 4 -mmt1 | |
| Schenker XMG Fusion 15 (Early 24) | |
| Schenker XMG Fusion 15 (Early 24) (Overboost) | |
| Aorus 16X 2024 | |
| HP Omen Transcend 16-u1095ng | |
| Genomsnitt Intel Core i9-14900HX (5452 - 7545, n=37) | |
| Lenovo Legion Pro 5 16IRX9 | |
| Genomsnitt av klass Gaming (4199 - 7436, n=108, senaste 2 åren) | |
| Alienware m16 R2 | |
| Geekbench 6.7 | |
| Multi-Core | |
| Lenovo Legion Pro 5 16IRX9 (6.2.1) | |
| Schenker XMG Fusion 15 (Early 24) (6.2.1, Overboost) | |
| Aorus 16X 2024 (6.2.1) | |
| Genomsnitt Intel Core i9-14900HX (13158 - 19665, n=37) | |
| Schenker XMG Fusion 15 (Early 24) (6.2.1) | |
| HP Omen Transcend 16-u1095ng (6.2.1) | |
| Genomsnitt av klass Gaming (6625 - 22104, n=109, senaste 2 åren) | |
| Alienware m16 R2 (6.2.1) | |
| Single-Core | |
| Schenker XMG Fusion 15 (Early 24) (6.2.1) | |
| Aorus 16X 2024 (6.2.1) | |
| Schenker XMG Fusion 15 (Early 24) (6.2.1, Overboost) | |
| Genomsnitt Intel Core i9-14900HX (2419 - 3129, n=37) | |
| Lenovo Legion Pro 5 16IRX9 (6.2.1) | |
| Genomsnitt av klass Gaming (1490 - 3259, n=109, senaste 2 åren) | |
| HP Omen Transcend 16-u1095ng (6.2.1) | |
| Alienware m16 R2 (6.2.1) | |
| Geekbench 5.5 | |
| Multi-Core | |
| Lenovo Legion Pro 5 16IRX9 | |
| Schenker XMG Fusion 15 (Early 24) (Overboost) | |
| Aorus 16X 2024 | |
| Genomsnitt Intel Core i9-14900HX (8618 - 23194, n=37) | |
| HP Omen Transcend 16-u1095ng | |
| Schenker XMG Fusion 15 (Early 24) | |
| Genomsnitt av klass Gaming (6460 - 27010, n=108, senaste 2 åren) | |
| Alienware m16 R2 | |
| Single-Core | |
| Aorus 16X 2024 | |
| Schenker XMG Fusion 15 (Early 24) (Overboost) | |
| Schenker XMG Fusion 15 (Early 24) | |
| Genomsnitt Intel Core i9-14900HX (1669 - 2210, n=37) | |
| HP Omen Transcend 16-u1095ng | |
| Genomsnitt av klass Gaming (986 - 2474, n=108, senaste 2 åren) | |
| Lenovo Legion Pro 5 16IRX9 | |
| Alienware m16 R2 | |
| HWBOT x265 Benchmark v2.2 - 4k Preset | |
| Schenker XMG Fusion 15 (Early 24) (Overboost) | |
| Lenovo Legion Pro 5 16IRX9 | |
| Genomsnitt Intel Core i9-14900HX (16.8 - 38.9, n=37) | |
| Genomsnitt av klass Gaming (11.5 - 44.3, n=108, senaste 2 åren) | |
| Aorus 16X 2024 | |
| Schenker XMG Fusion 15 (Early 24) | |
| HP Omen Transcend 16-u1095ng | |
| Alienware m16 R2 | |
| LibreOffice - 20 Documents To PDF | |
| HP Omen Transcend 16-u1095ng (6.3.4.2) | |
| Alienware m16 R2 (6.3.4.2) | |
| Genomsnitt av klass Gaming (19 - 88.8, n=108, senaste 2 åren) | |
| Genomsnitt Intel Core i9-14900HX (19 - 85.1, n=37) | |
| Lenovo Legion Pro 5 16IRX9 (6.3.4.2) | |
| Schenker XMG Fusion 15 (Early 24) (6.3.4.2) | |
| Aorus 16X 2024 (6.3.4.2) | |
| Schenker XMG Fusion 15 (Early 24) (6.3.4.2, Overboost) | |
| R Benchmark 2.5 - Overall mean | |
| Alienware m16 R2 | |
| Genomsnitt av klass Gaming (0.3439 - 0.759, n=109, senaste 2 åren) | |
| HP Omen Transcend 16-u1095ng | |
| Lenovo Legion Pro 5 16IRX9 | |
| Genomsnitt Intel Core i9-14900HX (0.3604 - 0.4859, n=37) | |
| Aorus 16X 2024 | |
| Schenker XMG Fusion 15 (Early 24) (Overboost) | |
| Schenker XMG Fusion 15 (Early 24) | |
* ... mindre är bättre
AIDA64: FP32 Ray-Trace | FPU Julia | CPU SHA3 | CPU Queen | FPU SinJulia | FPU Mandel | CPU AES | CPU ZLib | FP64 Ray-Trace | CPU PhotoWorxx
| Performance rating | |
| Schenker XMG Fusion 15 (Early 24) | |
| Lenovo Legion Pro 5 16IRX9 | |
| Genomsnitt av klass Gaming | |
| Genomsnitt Intel Core i9-14900HX | |
| Aorus 16X 2024 | |
| Schenker XMG Fusion 15 (Early 24) | |
| HP Omen Transcend 16-u1095ng | |
| Alienware m16 R2 | |
| AIDA64 / FP32 Ray-Trace | |
| Genomsnitt av klass Gaming (10227 - 85542, n=107, senaste 2 åren) | |
| Schenker XMG Fusion 15 (Early 24) (v6.92.6600, Overboost) | |
| Lenovo Legion Pro 5 16IRX9 (v6.92.6600) | |
| Genomsnitt Intel Core i9-14900HX (13098 - 33474, n=36) | |
| Aorus 16X 2024 (v6.92.6600) | |
| Schenker XMG Fusion 15 (Early 24) (v6.92.6600) | |
| Alienware m16 R2 (v6.92.6600) | |
| HP Omen Transcend 16-u1095ng (v6.92.6600) | |
| AIDA64 / FPU Julia | |
| Schenker XMG Fusion 15 (Early 24) (v6.92.6600, Overboost) | |
| Genomsnitt av klass Gaming (51376 - 238426, n=107, senaste 2 åren) | |
| Lenovo Legion Pro 5 16IRX9 (v6.92.6600) | |
| Genomsnitt Intel Core i9-14900HX (67573 - 166040, n=36) | |
| Aorus 16X 2024 (v6.92.6600) | |
| Schenker XMG Fusion 15 (Early 24) (v6.92.6600) | |
| Alienware m16 R2 (v6.92.6600) | |
| HP Omen Transcend 16-u1095ng (v6.92.6600) | |
| AIDA64 / CPU SHA3 | |
| Schenker XMG Fusion 15 (Early 24) (v6.92.6600, Overboost) | |
| Lenovo Legion Pro 5 16IRX9 (v6.92.6600) | |
| Genomsnitt av klass Gaming (2180 - 9817, n=107, senaste 2 åren) | |
| Genomsnitt Intel Core i9-14900HX (3589 - 7979, n=36) | |
| Aorus 16X 2024 (v6.92.6600) | |
| Schenker XMG Fusion 15 (Early 24) (v6.92.6600) | |
| HP Omen Transcend 16-u1095ng (v6.92.6600) | |
| Alienware m16 R2 (v6.92.6600) | |
| AIDA64 / CPU Queen | |
| Lenovo Legion Pro 5 16IRX9 (v6.92.6600) | |
| Schenker XMG Fusion 15 (Early 24) (v6.92.6600, Overboost) | |
| Aorus 16X 2024 (v6.92.6600) | |
| Genomsnitt Intel Core i9-14900HX (118405 - 148966, n=36) | |
| Schenker XMG Fusion 15 (Early 24) (v6.92.6600) | |
| HP Omen Transcend 16-u1095ng (v6.92.6600) | |
| Genomsnitt av klass Gaming (49785 - 173351, n=98, senaste 2 åren) | |
| Alienware m16 R2 (v6.92.6600) | |
| AIDA64 / FPU SinJulia | |
| Schenker XMG Fusion 15 (Early 24) (v6.92.6600, Overboost) | |
| Lenovo Legion Pro 5 16IRX9 (v6.92.6600) | |
| Genomsnitt Intel Core i9-14900HX (10475 - 18517, n=36) | |
| Aorus 16X 2024 (v6.92.6600) | |
| Genomsnitt av klass Gaming (4424 - 33636, n=107, senaste 2 åren) | |
| Schenker XMG Fusion 15 (Early 24) (v6.92.6600) | |
| HP Omen Transcend 16-u1095ng (v6.92.6600) | |
| Alienware m16 R2 (v6.92.6600) | |
| AIDA64 / FPU Mandel | |
| Genomsnitt av klass Gaming (25115 - 128721, n=107, senaste 2 åren) | |
| Schenker XMG Fusion 15 (Early 24) (v6.92.6600, Overboost) | |
| Lenovo Legion Pro 5 16IRX9 (v6.92.6600) | |
| Genomsnitt Intel Core i9-14900HX (32543 - 83662, n=36) | |
| Aorus 16X 2024 (v6.92.6600) | |
| Schenker XMG Fusion 15 (Early 24) (v6.92.6600) | |
| Alienware m16 R2 (v6.92.6600) | |
| HP Omen Transcend 16-u1095ng (v6.92.6600) | |
| AIDA64 / CPU AES | |
| Schenker XMG Fusion 15 (Early 24) (v6.92.6600, Overboost) | |
| Schenker XMG Fusion 15 (Early 24) (v6.92.6600) | |
| Genomsnitt Intel Core i9-14900HX (86964 - 241777, n=36) | |
| Lenovo Legion Pro 5 16IRX9 (v6.92.6600) | |
| Aorus 16X 2024 (v6.92.6600) | |
| Genomsnitt av klass Gaming (39258 - 247074, n=107, senaste 2 åren) | |
| HP Omen Transcend 16-u1095ng (v6.92.6600) | |
| Alienware m16 R2 (v6.92.6600) | |
| AIDA64 / CPU ZLib | |
| Schenker XMG Fusion 15 (Early 24) (v6.92.6600, Overboost) | |
| Lenovo Legion Pro 5 16IRX9 (v6.92.6600) | |
| Genomsnitt Intel Core i9-14900HX (1054 - 2292, n=36) | |
| Aorus 16X 2024 (v6.92.6600) | |
| Genomsnitt av klass Gaming (574 - 2531, n=107, senaste 2 åren) | |
| Schenker XMG Fusion 15 (Early 24) (v6.92.6600) | |
| HP Omen Transcend 16-u1095ng (v6.92.6600) | |
| Alienware m16 R2 (v6.92.6600) | |
| AIDA64 / FP64 Ray-Trace | |
| Genomsnitt av klass Gaming (5509 - 45446, n=107, senaste 2 åren) | |
| Schenker XMG Fusion 15 (Early 24) (v6.92.6600, Overboost) | |
| Lenovo Legion Pro 5 16IRX9 (v6.92.6600) | |
| Genomsnitt Intel Core i9-14900HX (6809 - 18349, n=36) | |
| Aorus 16X 2024 (v6.92.6600) | |
| Schenker XMG Fusion 15 (Early 24) (v6.92.6600) | |
| Alienware m16 R2 (v6.92.6600) | |
| HP Omen Transcend 16-u1095ng (v6.92.6600) | |
| AIDA64 / CPU PhotoWorxx | |
| Lenovo Legion Pro 5 16IRX9 (v6.92.6600) | |
| HP Omen Transcend 16-u1095ng (v6.92.6600) | |
| Aorus 16X 2024 (v6.92.6600) | |
| Schenker XMG Fusion 15 (Early 24) (v6.92.6600, Overboost) | |
| Schenker XMG Fusion 15 (Early 24) (v6.92.6600) | |
| Genomsnitt Intel Core i9-14900HX (23903 - 54702, n=36) | |
| Genomsnitt av klass Gaming (12271 - 89891, n=107, senaste 2 åren) | |
| Alienware m16 R2 (v6.92.6600) | |
Systemets prestanda
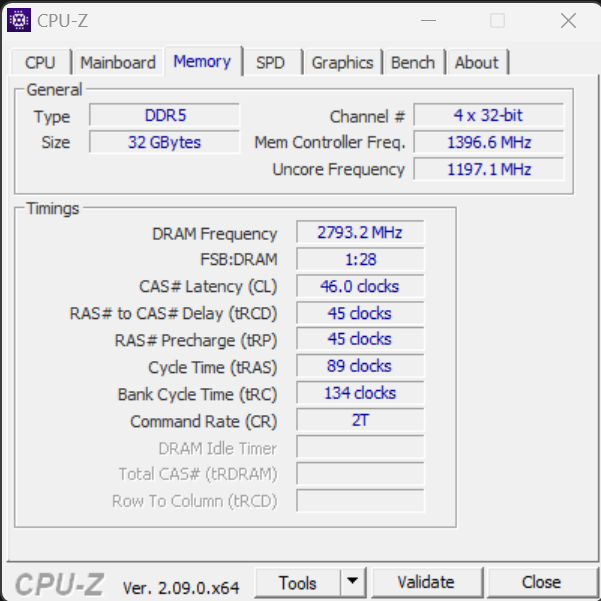
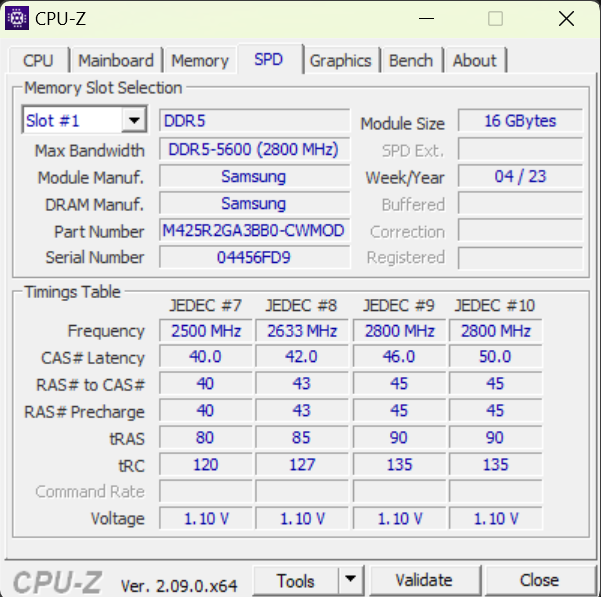
Det välfungerande systemet saknar inte datorkraft. Spel, streaming och rendering utgör inga större utmaningar för den bärbara datorn. RAM-minnets överföringshastigheter ligger inom en normal nivå för DDR5-5600 RAM. Dess PCMark-resultat var också bra.
CrossMark: Overall | Productivity | Creativity | Responsiveness
WebXPRT 3: Overall
WebXPRT 4: Overall
Mozilla Kraken 1.1: Total
| PCMark 10 / Score | |
| Lenovo Legion Pro 5 16IRX9 | |
| Schenker XMG Fusion 15 (Early 24) | |
| Aorus 16X 2024 | |
| Genomsnitt av klass Gaming (5828 - 11574, n=95, senaste 2 åren) | |
| Genomsnitt Intel Core i9-14900HX, NVIDIA GeForce RTX 4070 Laptop GPU (7768 - 8550, n=8) | |
| HP Omen Transcend 16-u1095ng | |
| Alienware m16 R2 | |
| PCMark 10 / Essentials | |
| Schenker XMG Fusion 15 (Early 24) | |
| Lenovo Legion Pro 5 16IRX9 | |
| Aorus 16X 2024 | |
| Genomsnitt Intel Core i9-14900HX, NVIDIA GeForce RTX 4070 Laptop GPU (10104 - 11815, n=8) | |
| Genomsnitt av klass Gaming (8810 - 12600, n=99, senaste 2 åren) | |
| HP Omen Transcend 16-u1095ng | |
| Alienware m16 R2 | |
| PCMark 10 / Productivity | |
| Aorus 16X 2024 | |
| Genomsnitt av klass Gaming (6845 - 18766, n=97, senaste 2 åren) | |
| Schenker XMG Fusion 15 (Early 24) | |
| Genomsnitt Intel Core i9-14900HX, NVIDIA GeForce RTX 4070 Laptop GPU (9577 - 11103, n=8) | |
| HP Omen Transcend 16-u1095ng | |
| Lenovo Legion Pro 5 16IRX9 | |
| Alienware m16 R2 | |
| PCMark 10 / Digital Content Creation | |
| Lenovo Legion Pro 5 16IRX9 | |
| Genomsnitt av klass Gaming (7602 - 19657, n=97, senaste 2 åren) | |
| Schenker XMG Fusion 15 (Early 24) | |
| Genomsnitt Intel Core i9-14900HX, NVIDIA GeForce RTX 4070 Laptop GPU (12114 - 14827, n=8) | |
| Aorus 16X 2024 | |
| Alienware m16 R2 | |
| HP Omen Transcend 16-u1095ng | |
| CrossMark / Overall | |
| Aorus 16X 2024 | |
| Schenker XMG Fusion 15 (Early 24) | |
| Genomsnitt Intel Core i9-14900HX, NVIDIA GeForce RTX 4070 Laptop GPU (2002 - 2312, n=7) | |
| Lenovo Legion Pro 5 16IRX9 | |
| Genomsnitt av klass Gaming (1366 - 2409, n=96, senaste 2 åren) | |
| Alienware m16 R2 | |
| CrossMark / Productivity | |
| Aorus 16X 2024 | |
| Schenker XMG Fusion 15 (Early 24) | |
| Genomsnitt Intel Core i9-14900HX, NVIDIA GeForce RTX 4070 Laptop GPU (1827 - 2191, n=7) | |
| Genomsnitt av klass Gaming (1386 - 2254, n=96, senaste 2 åren) | |
| Lenovo Legion Pro 5 16IRX9 | |
| Alienware m16 R2 | |
| CrossMark / Creativity | |
| Aorus 16X 2024 | |
| Genomsnitt Intel Core i9-14900HX, NVIDIA GeForce RTX 4070 Laptop GPU (2258 - 2458, n=7) | |
| Schenker XMG Fusion 15 (Early 24) | |
| Lenovo Legion Pro 5 16IRX9 | |
| Genomsnitt av klass Gaming (1343 - 2729, n=96, senaste 2 åren) | |
| Alienware m16 R2 | |
| CrossMark / Responsiveness | |
| Aorus 16X 2024 | |
| Genomsnitt Intel Core i9-14900HX, NVIDIA GeForce RTX 4070 Laptop GPU (1734 - 2330, n=7) | |
| Schenker XMG Fusion 15 (Early 24) | |
| Lenovo Legion Pro 5 16IRX9 | |
| Genomsnitt av klass Gaming (1226 - 2334, n=96, senaste 2 åren) | |
| Alienware m16 R2 | |
| WebXPRT 3 / Overall | |
| HP Omen Transcend 16-u1095ng | |
| Schenker XMG Fusion 15 (Early 24) | |
| Aorus 16X 2024 | |
| Lenovo Legion Pro 5 16IRX9 | |
| Genomsnitt Intel Core i9-14900HX, NVIDIA GeForce RTX 4070 Laptop GPU (269 - 342, n=8) | |
| Genomsnitt av klass Gaming (242 - 532, n=99, senaste 2 åren) | |
| Alienware m16 R2 | |
| WebXPRT 4 / Overall | |
| Schenker XMG Fusion 15 (Early 24) | |
| Genomsnitt Intel Core i9-14900HX, NVIDIA GeForce RTX 4070 Laptop GPU (291 - 304, n=6) | |
| Lenovo Legion Pro 5 16IRX9 | |
| Genomsnitt av klass Gaming (176.4 - 354, n=99, senaste 2 åren) | |
| Alienware m16 R2 | |
| Mozilla Kraken 1.1 / Total | |
| Alienware m16 R2 | |
| Genomsnitt av klass Gaming (391 - 590, n=104, senaste 2 åren) | |
| Lenovo Legion Pro 5 16IRX9 | |
| Genomsnitt Intel Core i9-14900HX, NVIDIA GeForce RTX 4070 Laptop GPU (431 - 469, n=8) | |
| HP Omen Transcend 16-u1095ng | |
| Aorus 16X 2024 | |
| Schenker XMG Fusion 15 (Early 24) | |
* ... mindre är bättre
| PCMark 10 Score | 8522 poäng | |
Hjälp | ||
| AIDA64 / Memory Copy | |
| Lenovo Legion Pro 5 16IRX9 | |
| Aorus 16X 2024 | |
| HP Omen Transcend 16-u1095ng | |
| Schenker XMG Fusion 15 (Early 24) | |
| Genomsnitt Intel Core i9-14900HX (38028 - 83392, n=36) | |
| Genomsnitt av klass Gaming (21750 - 129946, n=107, senaste 2 åren) | |
| Alienware m16 R2 | |
| AIDA64 / Memory Read | |
| Aorus 16X 2024 | |
| Lenovo Legion Pro 5 16IRX9 | |
| Schenker XMG Fusion 15 (Early 24) | |
| HP Omen Transcend 16-u1095ng | |
| Genomsnitt Intel Core i9-14900HX (43306 - 87568, n=36) | |
| Alienware m16 R2 | |
| Genomsnitt av klass Gaming (22956 - 118858, n=107, senaste 2 åren) | |
| AIDA64 / Memory Write | |
| HP Omen Transcend 16-u1095ng | |
| Aorus 16X 2024 | |
| Lenovo Legion Pro 5 16IRX9 | |
| Genomsnitt av klass Gaming (22297 - 135096, n=107, senaste 2 åren) | |
| Genomsnitt Intel Core i9-14900HX (37146 - 80589, n=36) | |
| Schenker XMG Fusion 15 (Early 24) | |
| Alienware m16 R2 | |
| AIDA64 / Memory Latency | |
| Alienware m16 R2 | |
| Genomsnitt av klass Gaming (75.3 - 259, n=107, senaste 2 åren) | |
| HP Omen Transcend 16-u1095ng | |
| Genomsnitt Intel Core i9-14900HX (76.1 - 105, n=36) | |
| Lenovo Legion Pro 5 16IRX9 | |
| Schenker XMG Fusion 15 (Early 24) | |
| Aorus 16X 2024 | |
* ... mindre är bättre
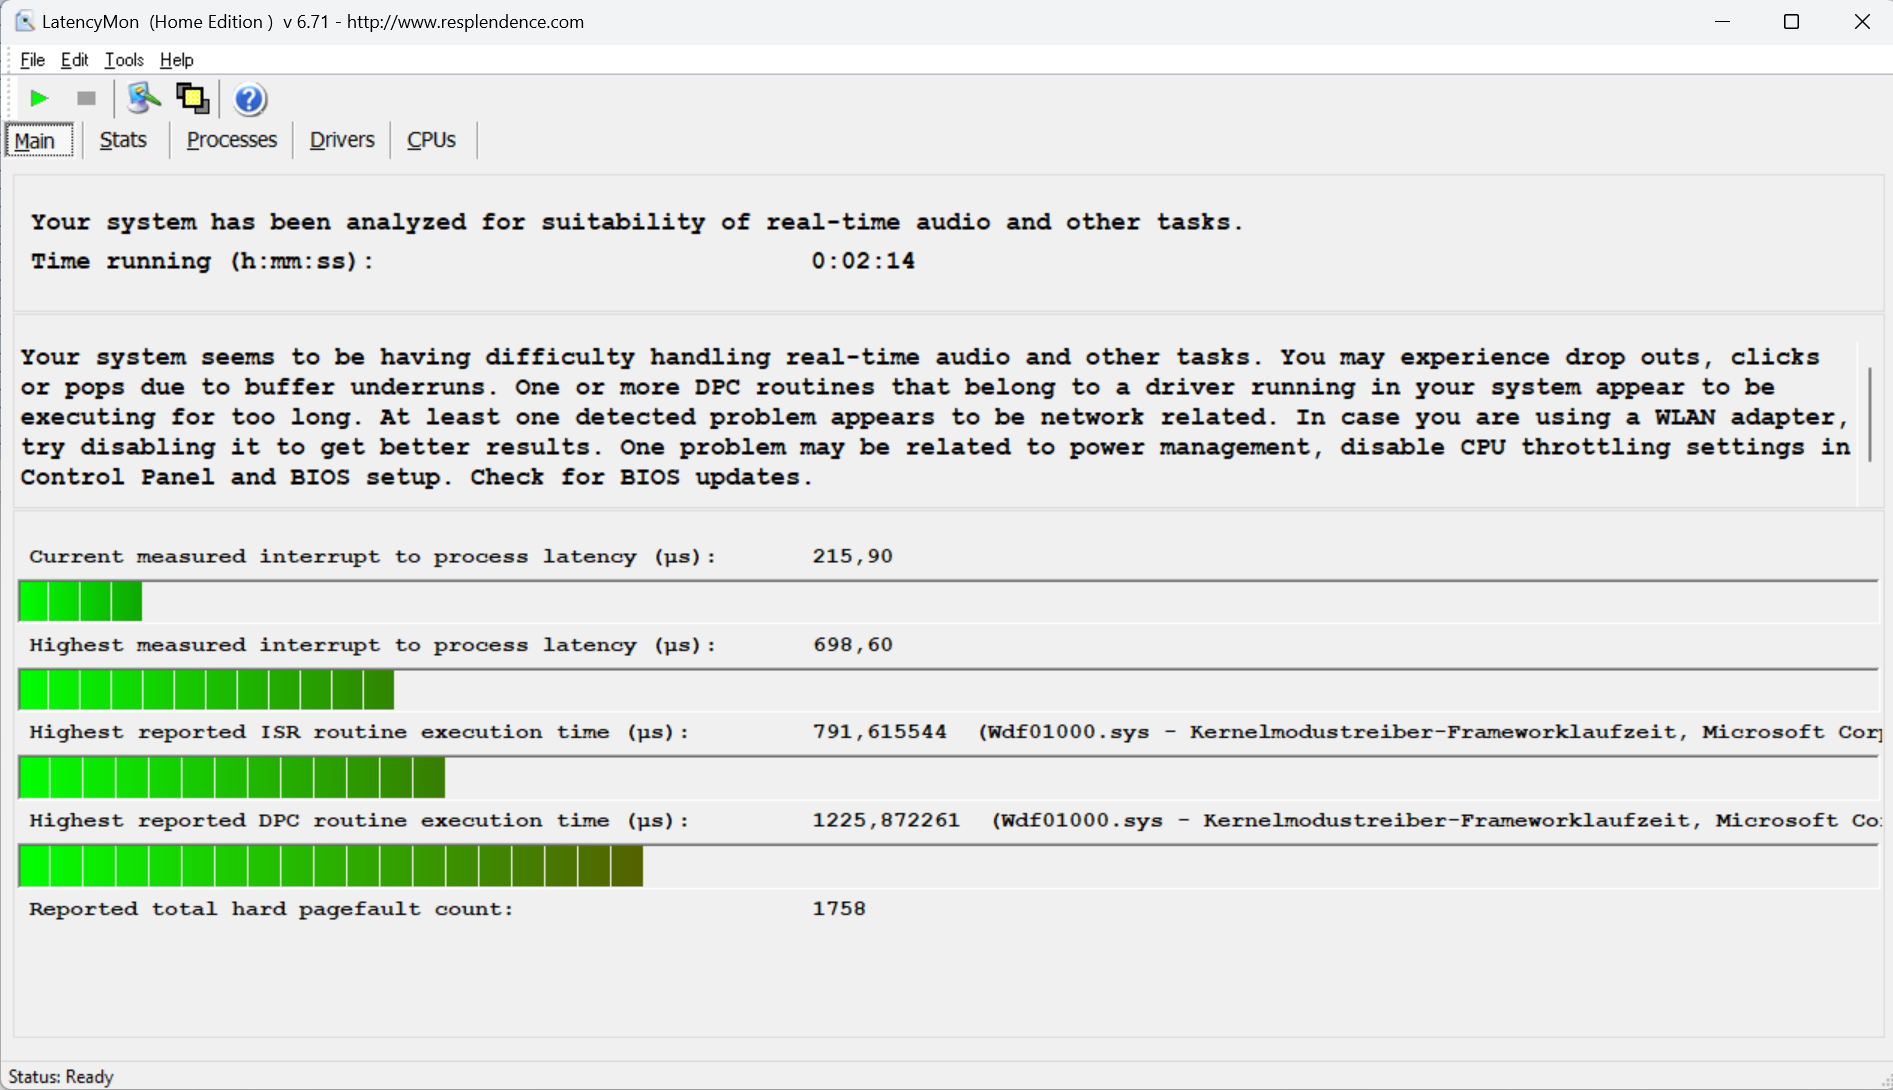
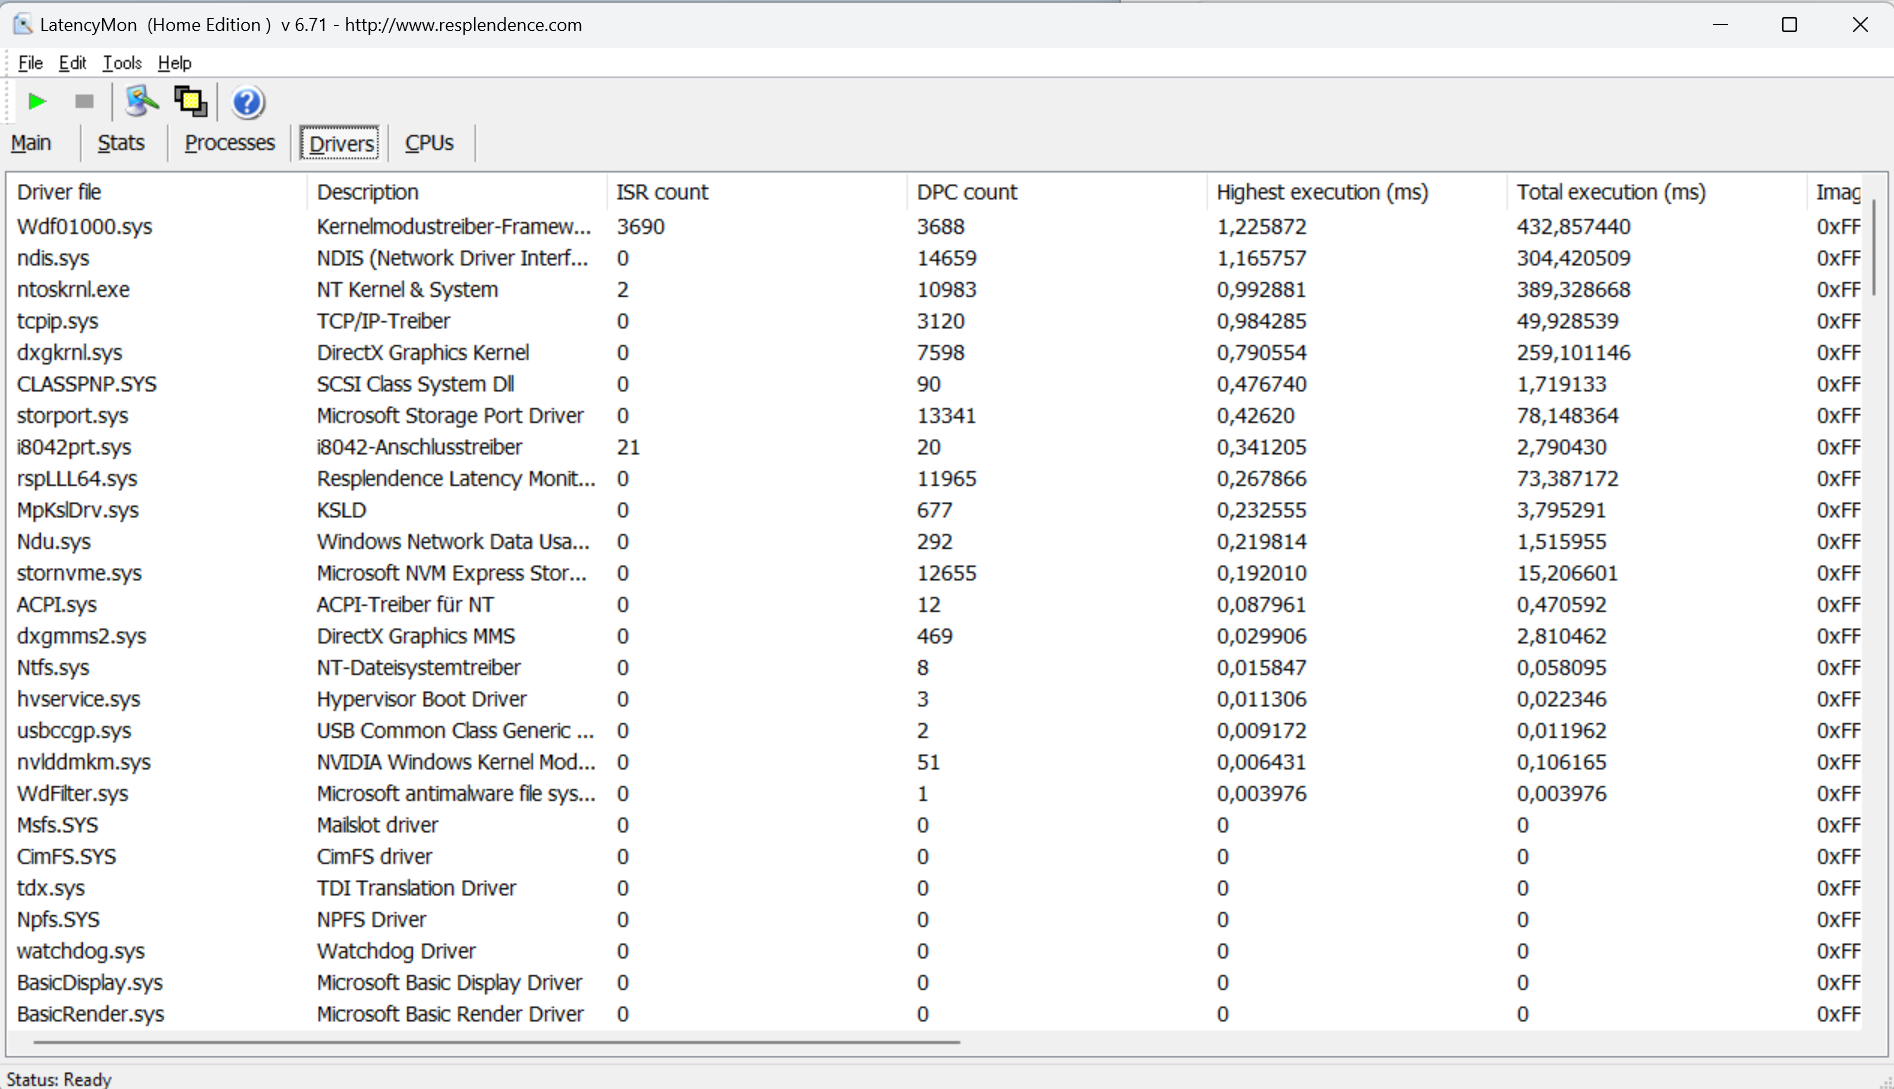
DPC-latenstider
Det standardiserade latensmonitortestet (surfing på webben, 4k-videouppspelning, Prime95 hög belastning) avslöjade vissa avvikelser. Systemet verkar inte vara lämpligt för video- och ljudredigering i realtid. Framtida programuppdateringar kan leda till förbättringar eller till och med försämringar.
| DPC Latencies / LatencyMon - interrupt to process latency (max), Web, Youtube, Prime95 | |
| Alienware m16 R2 | |
| HP Omen Transcend 16-u1095ng | |
| Aorus 16X 2024 | |
| Lenovo Legion Pro 5 16IRX9 | |
| Schenker XMG Fusion 15 (Early 24) | |
* ... mindre är bättre
Lagringsenheter
Fusion har plats för totalt två PCIe-4 SSD-enheter i M.2-2280-format. RAID-0/1 stöds. Samsung SSD (1 TB) i vår testenhet levererade utmärkta datahastigheter. Positivt: Vi noterade inte någon termisk strypning.


* ... mindre är bättre
Reading continuous performance: DiskSpd Read Loop, Queue Depth 8
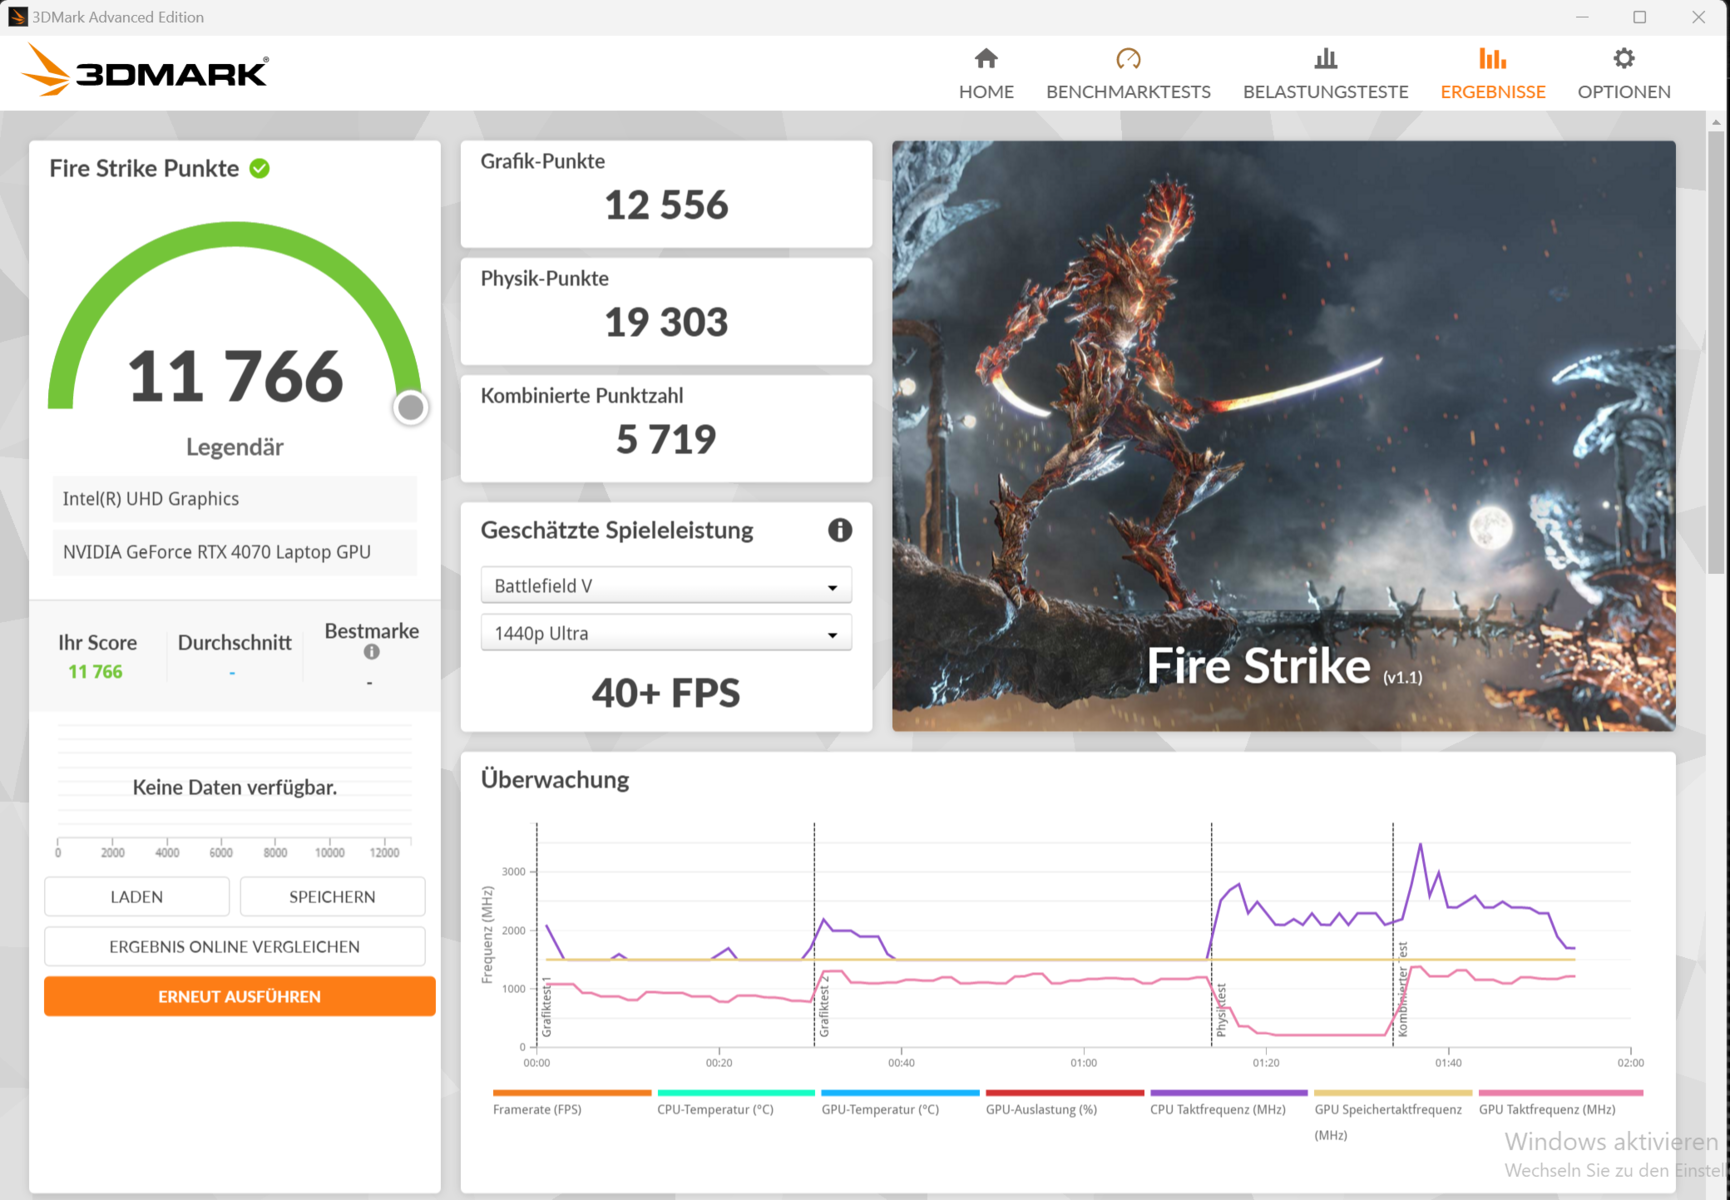
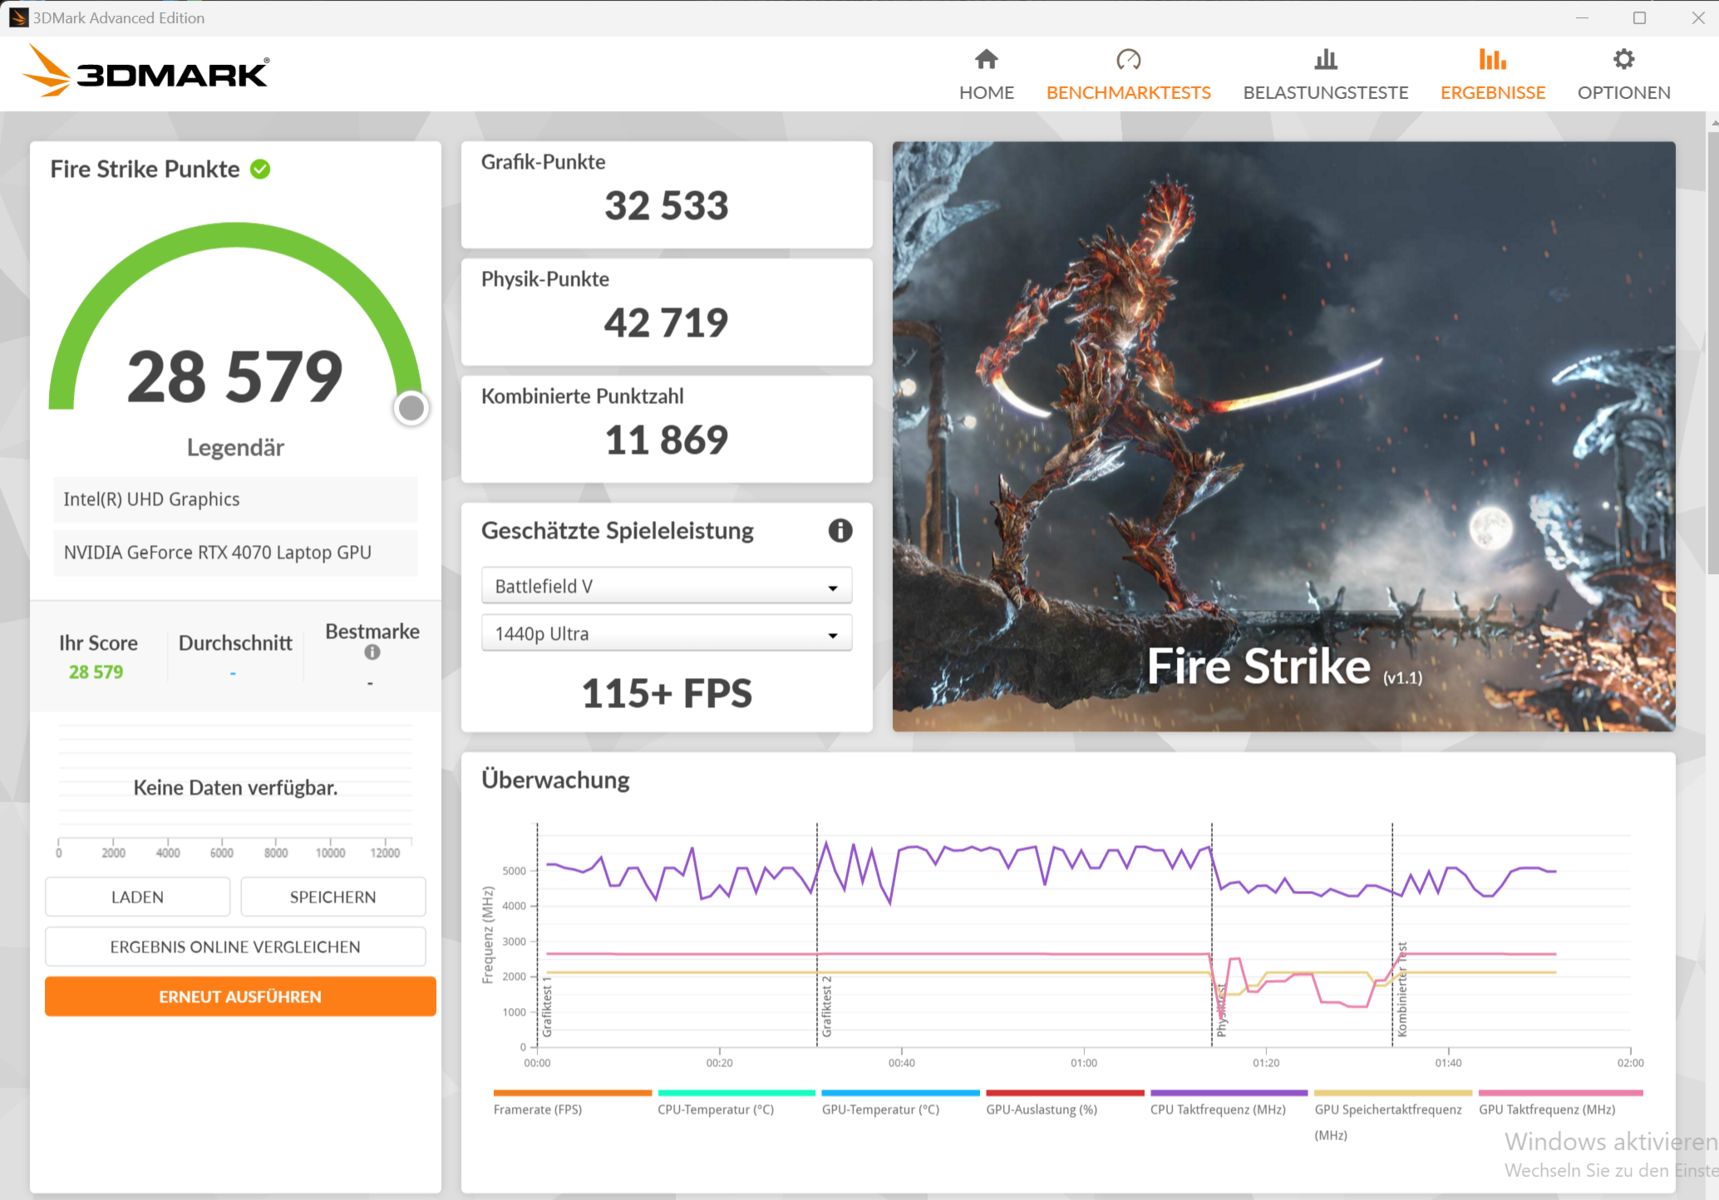
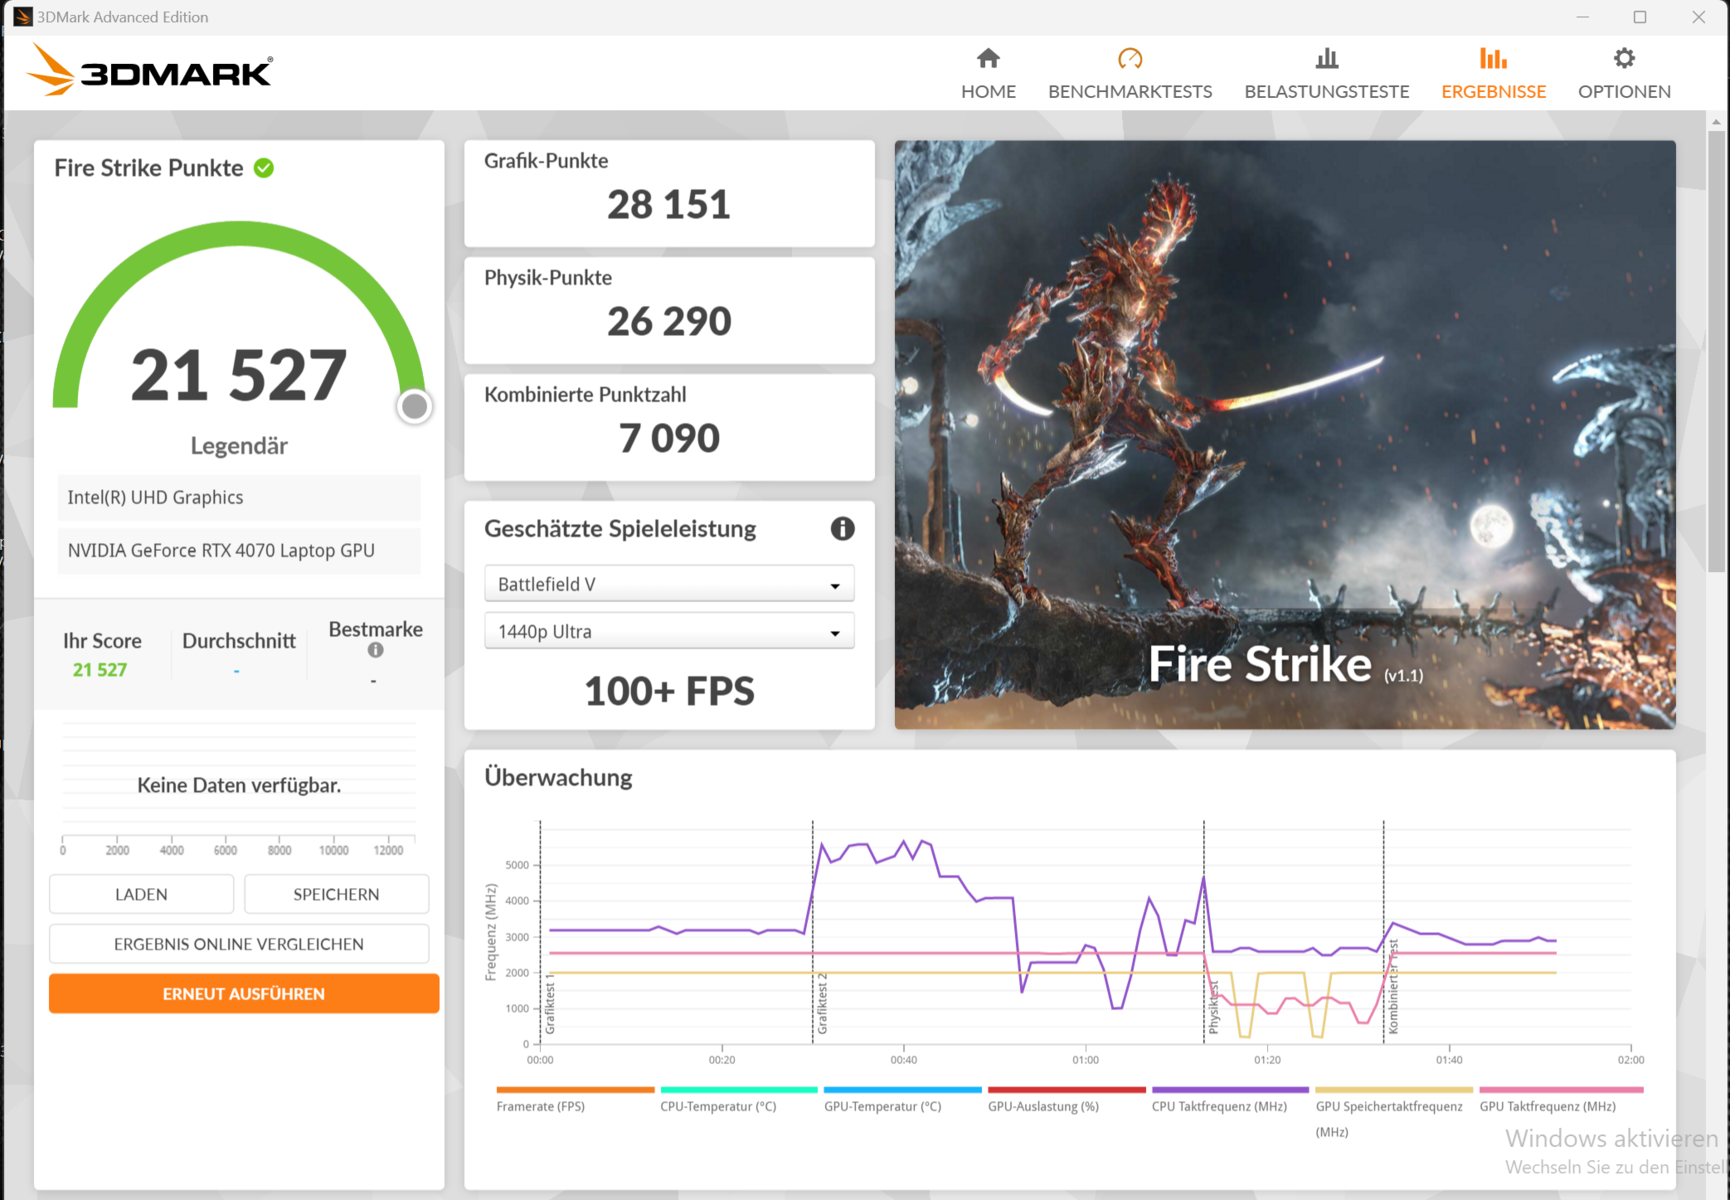
Grafikkort
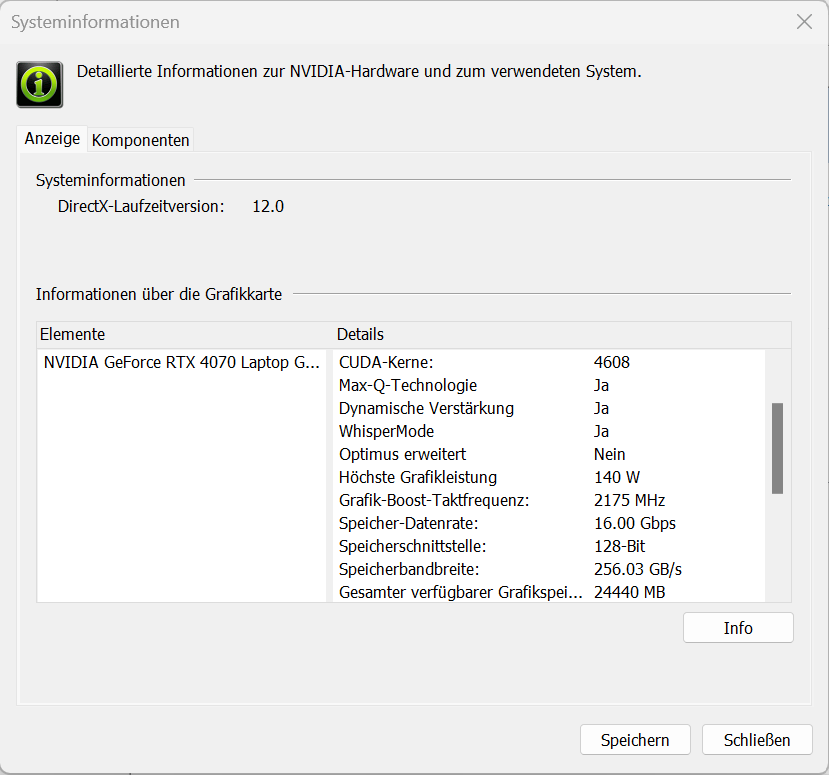
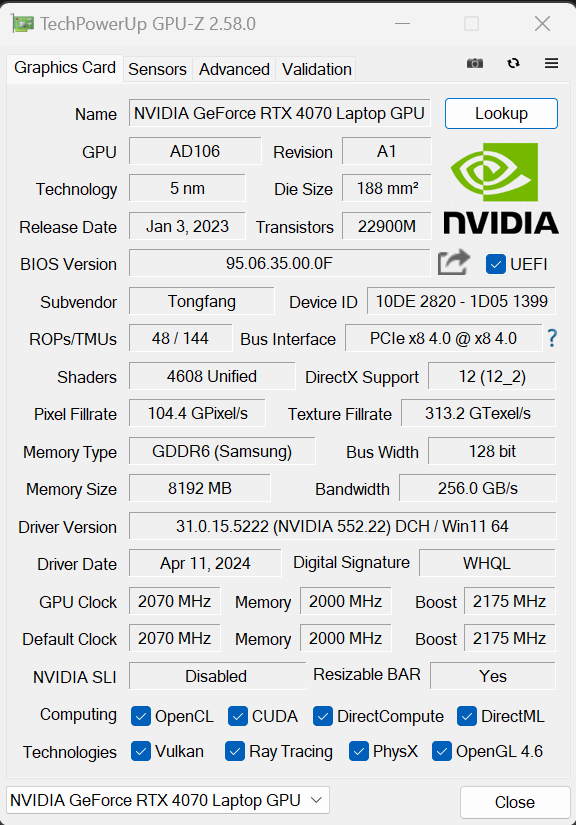
Schenker har låtit den bärbara datorns GeForce RTX 4070 en maximal TGP på 140 watt (115 watt + 25 watt Dynamic Boost) - mer rekommenderas inte av Nvidia. GPU:n har tillgång till 8 GB VRAM (GDDR6) - lite i underkant för dagens krav. Riktmärkena levererade resultat över RTX-4070-genomsnittet (Enthusiast) och Overboost resulterade bara i en liten fördel. Att växla mellan dGPU och Optimus kräver en omstart.

| 3DMark Performance rating - Percent | |
| Genomsnitt av klass Gaming | |
| Schenker XMG Fusion 15 (Early 24) | |
| Lenovo Legion Pro 5 16IRX9 | |
| Schenker XMG Fusion 15 (Early 24) | |
| Alienware m16 R2 | |
| Aorus 16X 2024 | |
| Genomsnitt NVIDIA GeForce RTX 4070 Laptop GPU | |
| HP Omen Transcend 16-u1095ng | |
| 3DMark 11 - 1280x720 Performance GPU | |
| Genomsnitt av klass Gaming (21841 - 80022, n=107, senaste 2 åren) | |
| Schenker XMG Fusion 15 (Early 24) (Overboost) | |
| Schenker XMG Fusion 15 (Early 24) | |
| Lenovo Legion Pro 5 16IRX9 | |
| Alienware m16 R2 | |
| Aorus 16X 2024 | |
| Genomsnitt NVIDIA GeForce RTX 4070 Laptop GPU (24229 - 46434, n=67) | |
| HP Omen Transcend 16-u1095ng | |
| 3DMark | |
| 1920x1080 Fire Strike Graphics | |
| Genomsnitt av klass Gaming (12242 - 62849, n=119, senaste 2 åren) | |
| Schenker XMG Fusion 15 (Early 24) (Overboost) | |
| Schenker XMG Fusion 15 (Early 24) | |
| Lenovo Legion Pro 5 16IRX9 | |
| Alienware m16 R2 | |
| Aorus 16X 2024 | |
| Genomsnitt NVIDIA GeForce RTX 4070 Laptop GPU (12242 - 33451, n=71) | |
| HP Omen Transcend 16-u1095ng | |
| 2560x1440 Time Spy Graphics | |
| Genomsnitt av klass Gaming (5012 - 26212, n=118, senaste 2 åren) | |
| Schenker XMG Fusion 15 (Early 24) (Overboost) | |
| Lenovo Legion Pro 5 16IRX9 | |
| Alienware m16 R2 | |
| Schenker XMG Fusion 15 (Early 24) | |
| Aorus 16X 2024 | |
| Genomsnitt NVIDIA GeForce RTX 4070 Laptop GPU (5012 - 13391, n=70) | |
| HP Omen Transcend 16-u1095ng | |
| 3DMark 06 Standard Score | 63892 poäng | |
| 3DMark 11 Performance | 36008 poäng | |
| 3DMark Fire Strike Score | 26661 poäng | |
| 3DMark Time Spy Score | 13067 poäng | |
Hjälp | ||
| Geekbench 5.5 | |
| OpenCL Score | |
| Genomsnitt av klass Gaming (80702 - 277970, n=105, senaste 2 åren) | |
| Schenker XMG Fusion 15 (Early 24) | |
| Schenker XMG Fusion 15 (Early 24) (Overboost) | |
| Aorus 16X 2024 | |
| HP Omen Transcend 16-u1095ng | |
| Genomsnitt NVIDIA GeForce RTX 4070 Laptop GPU (17391 - 132836, n=68) | |
| Lenovo Legion Pro 5 16IRX9 | |
| Alienware m16 R2 | |
| Vulkan Score 5.5 | |
| Genomsnitt av klass Gaming (9296 - 246759, n=81, senaste 2 åren) | |
| Schenker XMG Fusion 15 (Early 24) (Overboost) | |
| Aorus 16X 2024 | |
| Schenker XMG Fusion 15 (Early 24) | |
| Genomsnitt NVIDIA GeForce RTX 4070 Laptop GPU (28158 - 102618, n=37) | |
| Alienware m16 R2 | |
| Lenovo Legion Pro 5 16IRX9 | |
| Geekbench 6.7 | |
| GPU OpenCL | |
| Genomsnitt av klass Gaming (67235 - 253130, n=106, senaste 2 åren) | |
| Schenker XMG Fusion 15 (Early 24) (6.2.1) | |
| Schenker XMG Fusion 15 (Early 24) (6.2.1, Overboost) | |
| HP Omen Transcend 16-u1095ng (6.2.1) | |
| Aorus 16X 2024 (6.2.1) | |
| Lenovo Legion Pro 5 16IRX9 (6.2.1) | |
| Genomsnitt NVIDIA GeForce RTX 4070 Laptop GPU (85488 - 129836, n=45) | |
| Alienware m16 R2 (6.2.1) | |
| GPU Vulkan | |
| Schenker XMG Fusion 15 (Early 24) (6.2.1, Overboost) | |
| Genomsnitt av klass Gaming (20128 - 231659, n=58, senaste 2 åren) | |
| Alienware m16 R2 (6.2.1) | |
| Lenovo Legion Pro 5 16IRX9 (6.2.1) | |
| Genomsnitt NVIDIA GeForce RTX 4070 Laptop GPU (89638 - 120033, n=24) | |
| Schenker XMG Fusion 15 (Early 24) (6.2.1) | |
| Aorus 16X 2024 (6.2.1) | |
| V-Ray 5 Benchmark | |
| GPU RTX | |
| Genomsnitt av klass Gaming (1146 - 4363, n=35, senaste 2 åren) | |
| Lenovo Legion Pro 5 16IRX9 (5.0.1) | |
| Schenker XMG Fusion 15 (Early 24) (5.0.1, Overboost) | |
| Schenker XMG Fusion 15 (Early 24) (5.0.1) | |
| Alienware m16 R2 (5.0.1) | |
| Aorus 16X 2024 (5.0.1) | |
| Genomsnitt NVIDIA GeForce RTX 4070 Laptop GPU (171 - 1872, n=39) | |
| GPU CUDA | |
| Genomsnitt av klass Gaming (887 - 3288, n=35, senaste 2 åren) | |
| Lenovo Legion Pro 5 16IRX9 (5.0.1) | |
| Schenker XMG Fusion 15 (Early 24) (5.0.1, Overboost) | |
| Schenker XMG Fusion 15 (Early 24) (5.0.1) | |
| Alienware m16 R2 (5.0.1) | |
| Aorus 16X 2024 (5.0.1) | |
| Genomsnitt NVIDIA GeForce RTX 4070 Laptop GPU (120 - 1356, n=39) | |
| CPU | |
| Schenker XMG Fusion 15 (Early 24) (5.0.1, Overboost) | |
| Lenovo Legion Pro 5 16IRX9 (5.0.1) | |
| Genomsnitt av klass Gaming (5864 - 30302, n=34, senaste 2 åren) | |
| Aorus 16X 2024 (5.0.1) | |
| Schenker XMG Fusion 15 (Early 24) (5.0.1) | |
| Genomsnitt NVIDIA GeForce RTX 4070 Laptop GPU (9339 - 20388, n=38) | |
| Alienware m16 R2 (5.0.1) | |
| V-Ray Benchmark Next 4.10 | |
| GPU | |
| Genomsnitt av klass Gaming (427 - 1333, n=103, senaste 2 åren) | |
| Lenovo Legion Pro 5 16IRX9 (v4.10.07 ) | |
| Schenker XMG Fusion 15 (Early 24) (v4.10.07, Overboost) | |
| Genomsnitt NVIDIA GeForce RTX 4070 Laptop GPU (434 - 686, n=52) | |
| Schenker XMG Fusion 15 (Early 24) (v4.10.07 ) | |
| HP Omen Transcend 16-u1095ng (v4.10.07 ) | |
| Aorus 16X 2024 (v4.10.07 ) | |
| CPU | |
| Schenker XMG Fusion 15 (Early 24) (v4.10.07, Overboost) | |
| Lenovo Legion Pro 5 16IRX9 (v4.10.07 ) | |
| Aorus 16X 2024 (v4.10.07 ) | |
| Genomsnitt av klass Gaming (10048 - 45327, n=102, senaste 2 åren) | |
| Schenker XMG Fusion 15 (Early 24) (v4.10.07 ) | |
| HP Omen Transcend 16-u1095ng (v4.10.07 ) | |
| Genomsnitt NVIDIA GeForce RTX 4070 Laptop GPU (12638 - 35173, n=52) | |
* ... mindre är bättre
Prestanda för spel
Hårdvaran är avsedd för QHD-spel med höga till maximala inställningar. Genom att använda DLSS 3 och Frame Generation kan du spela spel med högre upplösningar och maximala inställningar inklusive raytracing - men bara med spel som stöder dessa funktioner. Vi noterade bildfrekvenser över genomsnittet för RTX-4070 (Enthusiast) och Overboost resulterade i en liten fördel.
| Performance rating - Percent | |
| Schenker XMG Fusion 15 (Early 24) | |
| Genomsnitt av klass Gaming | |
| Lenovo Legion Pro 5 16IRX9 | |
| Schenker XMG Fusion 15 (Early 24) | |
| Aorus 16X 2024 | |
| HP Omen Transcend 16-u1095ng | |
| Alienware m16 R2 -1! | |
| Genomsnitt NVIDIA GeForce RTX 4070 Laptop GPU | |
| The Witcher 3 - 1920x1080 Ultra Graphics & Postprocessing (HBAO+) | |
| Genomsnitt av klass Gaming (95 - 240, n=8, senaste 2 åren) | |
| Lenovo Legion Pro 5 16IRX9 | |
| Schenker XMG Fusion 15 (Early 24) (Overboost) | |
| Schenker XMG Fusion 15 (Early 24) | |
| Aorus 16X 2024 | |
| Alienware m16 R2 | |
| HP Omen Transcend 16-u1095ng | |
| Genomsnitt NVIDIA GeForce RTX 4070 Laptop GPU (69.8 - 133.7, n=57) | |
| GTA V - 1920x1080 Highest AA:4xMSAA + FX AF:16x | |
| Schenker XMG Fusion 15 (Early 24) (Overboost) | |
| Schenker XMG Fusion 15 (Early 24) | |
| Genomsnitt av klass Gaming (48.3 - 186.9, n=100, senaste 2 åren) | |
| Lenovo Legion Pro 5 16IRX9 | |
| HP Omen Transcend 16-u1095ng | |
| Genomsnitt NVIDIA GeForce RTX 4070 Laptop GPU (48.3 - 141.6, n=63) | |
| Aorus 16X 2024 | |
| Final Fantasy XV Benchmark - 1920x1080 High Quality | |
| Genomsnitt av klass Gaming (41 - 215, n=101, senaste 2 åren) | |
| Schenker XMG Fusion 15 (Early 24) (1.3, Overboost) | |
| Lenovo Legion Pro 5 16IRX9 (1.3) | |
| Schenker XMG Fusion 15 (Early 24) (1.3) | |
| Alienware m16 R2 (1.3) | |
| Aorus 16X 2024 (1.3) | |
| Genomsnitt NVIDIA GeForce RTX 4070 Laptop GPU (41 - 131.9, n=65) | |
| HP Omen Transcend 16-u1095ng (1.3) | |
| Strange Brigade - 1920x1080 ultra AA:ultra AF:16 | |
| Genomsnitt av klass Gaming (76.3 - 456, n=91, senaste 2 åren) | |
| Lenovo Legion Pro 5 16IRX9 (1.47.22.14 D3D12) | |
| Schenker XMG Fusion 15 (Early 24) (1.47.22.14 D3D12, Overboost) | |
| Alienware m16 R2 (1.47.22.14 D3D12) | |
| Schenker XMG Fusion 15 (Early 24) (1.47.22.14 D3D12) | |
| Aorus 16X 2024 (1.47.22.14 D3D12) | |
| Genomsnitt NVIDIA GeForce RTX 4070 Laptop GPU (76.3 - 234, n=63) | |
| HP Omen Transcend 16-u1095ng (1.47.22.14 D3D12) | |
| Dota 2 Reborn - 1920x1080 ultra (3/3) best looking | |
| Schenker XMG Fusion 15 (Early 24) (Overboost) | |
| Lenovo Legion Pro 5 16IRX9 | |
| Schenker XMG Fusion 15 (Early 24) | |
| Aorus 16X 2024 | |
| HP Omen Transcend 16-u1095ng | |
| Genomsnitt av klass Gaming (84.8 - 248, n=110, senaste 2 åren) | |
| Genomsnitt NVIDIA GeForce RTX 4070 Laptop GPU (89.7 - 191.2, n=67) | |
| Alienware m16 R2 | |
| X-Plane 11.11 - 1920x1080 high (fps_test=3) | |
| Schenker XMG Fusion 15 (Early 24) (Overboost) | |
| Lenovo Legion Pro 5 16IRX9 | |
| Schenker XMG Fusion 15 (Early 24) | |
| Aorus 16X 2024 | |
| HP Omen Transcend 16-u1095ng | |
| Genomsnitt NVIDIA GeForce RTX 4070 Laptop GPU (52.1 - 147.9, n=69) | |
| Genomsnitt av klass Gaming (52.1 - 143.5, n=113, senaste 2 åren) | |
| Alienware m16 R2 | |
| Alone in the Dark | |
| 1920x1080 Cinematic Preset | |
| Genomsnitt av klass Gaming (n=1senaste 2 åren) | |
| Schenker XMG Fusion 15 (Early 24) | |
| Aorus 16X 2024 | |
| Genomsnitt NVIDIA GeForce RTX 4070 Laptop GPU (105.5 - 126, n=5) | |
| 2560x1440 Cinematic Preset | |
| Schenker XMG Fusion 15 (Early 24) | |
| Genomsnitt NVIDIA GeForce RTX 4070 Laptop GPU (37.4 - 76.6, n=5) | |
| Aorus 16X 2024 | |
| The Witcher 3 v4 | |
| 1920x1080 Ultra Preset / On AA:FX | |
| Schenker XMG Fusion 15 (Early 24) | |
| Genomsnitt NVIDIA GeForce RTX 4070 Laptop GPU (85 - 86.5, n=2) | |
| 1920x1080 RT Ultra Preset / On AA:FX | |
| Schenker XMG Fusion 15 (Early 24) | |
| Genomsnitt NVIDIA GeForce RTX 4070 Laptop GPU (36 - 40.4, n=2) | |
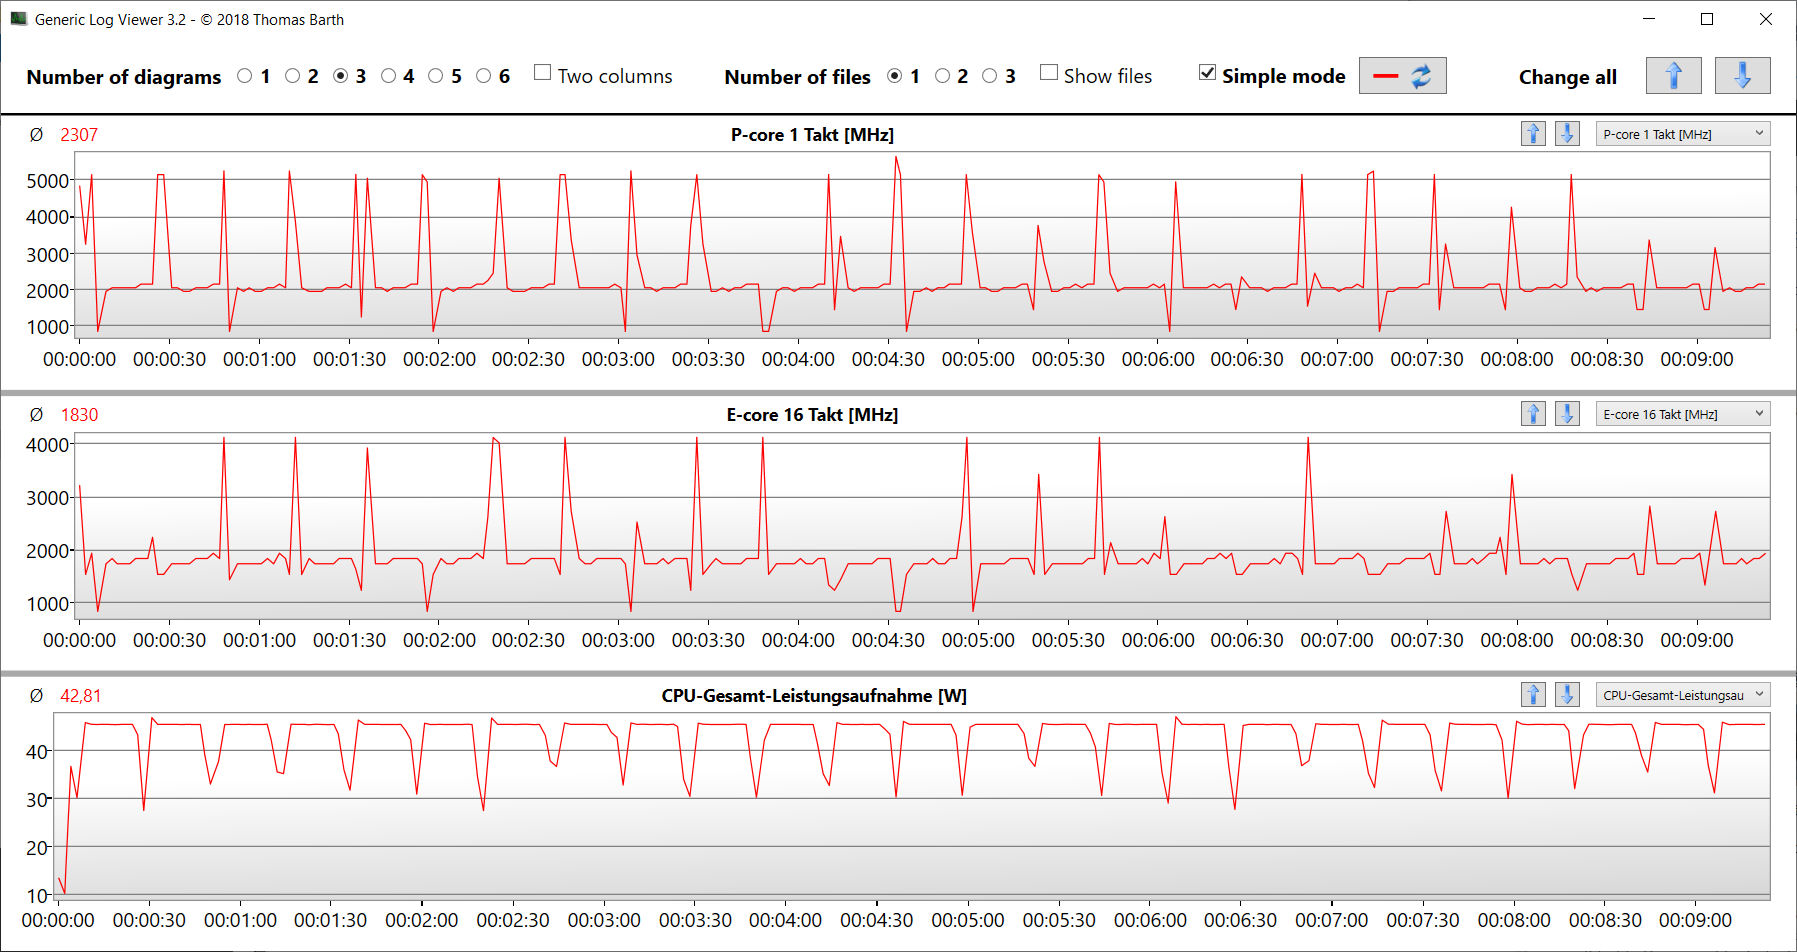
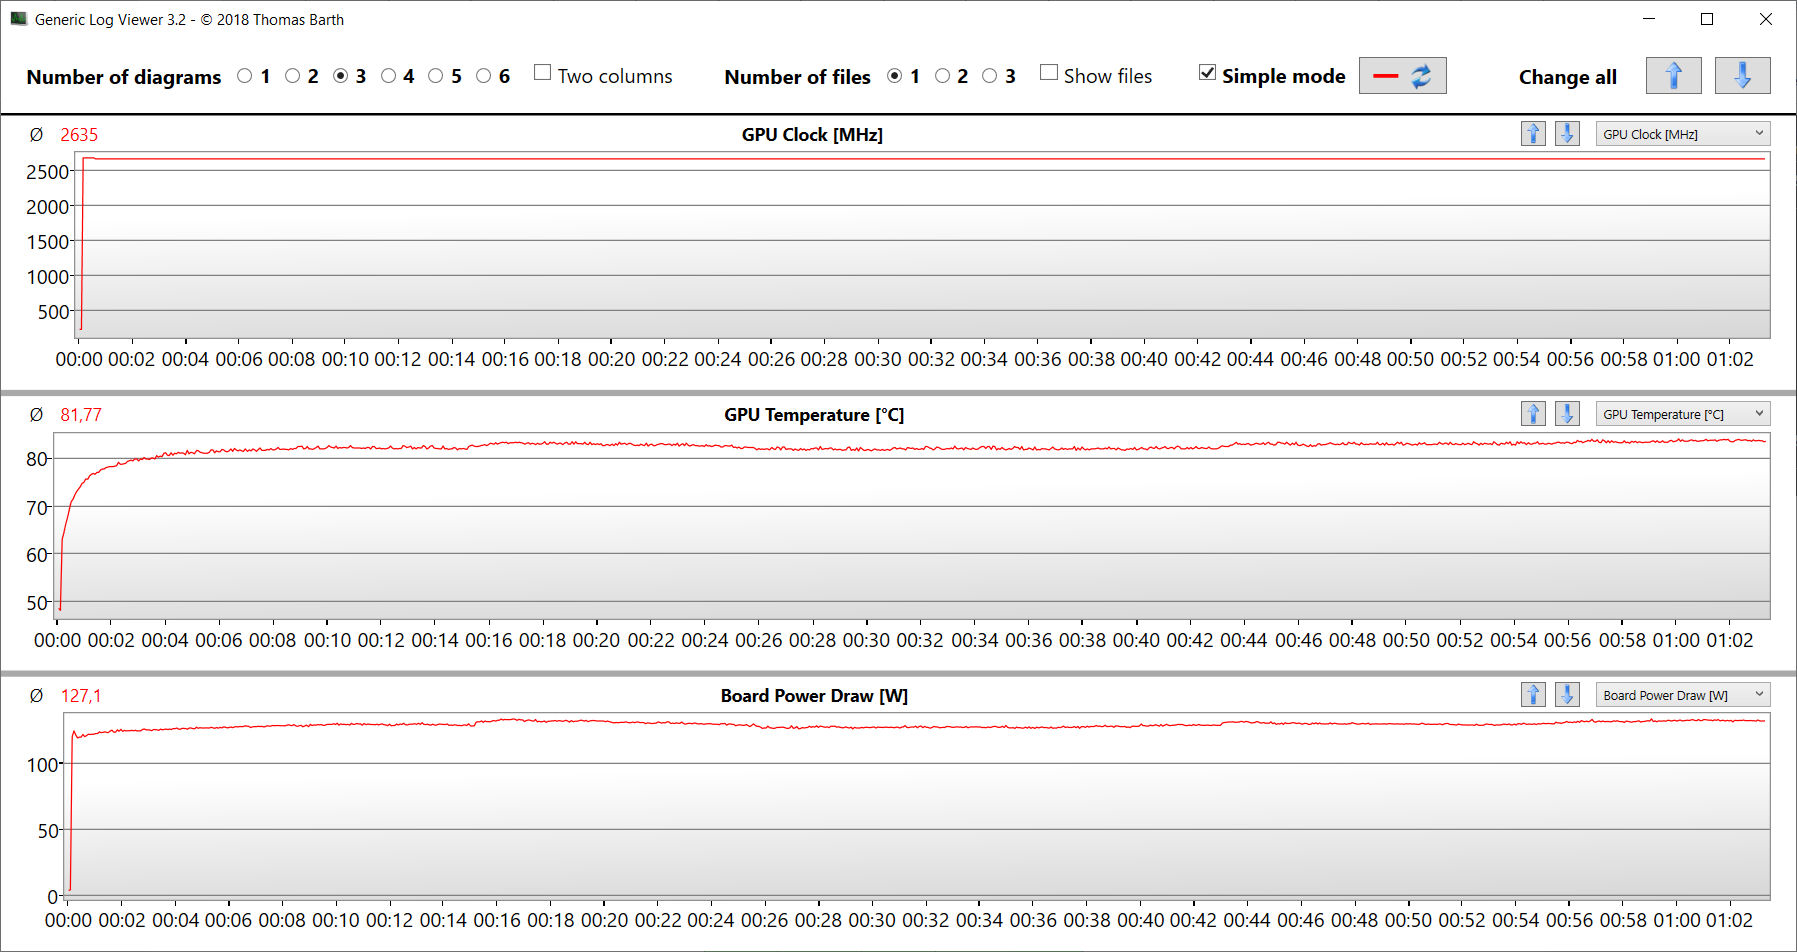
För att testa om bildfrekvenserna förblir stabila under en längre tid lät vi spelet The Witcher 3 köra i cirka 60 minuter i Full HD och med inställningarna inställda på max. Vi flyttade inte spelkaraktären. Vi noterade ingen kollaps i bildfrekvensen, men den sjönk med några procent efter cirka 50 minuter (Enthusiast). Med profilen Overboost aktiverad uppstod inte detta beteende.
Witcher 3 FPS diagram
| låg | med. | hög | ultra | QHD | |
|---|---|---|---|---|---|
| GTA V (2015) | 187.8 | 187 | 186.4 | 137.6 | 98.2 |
| The Witcher 3 (2015) | 603.3 | 418.4 | 246.2 | 128 | 92.2 |
| Dota 2 Reborn (2015) | 234 | 207 | 196.5 | 182.1 | |
| Final Fantasy XV Benchmark (2018) | 226 | 175.5 | 124.6 | 90.5 | |
| X-Plane 11.11 (2018) | 205 | 173.3 | 136.9 | ||
| Far Cry 5 (2018) | 204 | 176 | 166 | 157 | 124 |
| Strange Brigade (2018) | 558 | 313 | 245 | 214 | 139.2 |
| The Witcher 3 v4 (2023) | 271 | 215 | 176.2 | 86.5 | |
| Baldur's Gate 3 (2023) | 157.2 | 121.2 | 106.1 | 105 | 82.1 |
| Cyberpunk 2077 (2023) | 156.6 | 124.5 | 103.6 | 87 | 52.6 |
| Alan Wake 2 (2023) | 74.3 | 71.4 | 70.1 | 42.8 | |
| Alone in the Dark (2024) | 222 | 209 | 196.5 | 126 | 76.6 |
| Dragon's Dogma 2 (2024) | 83.9 | 80 | 61.3 |
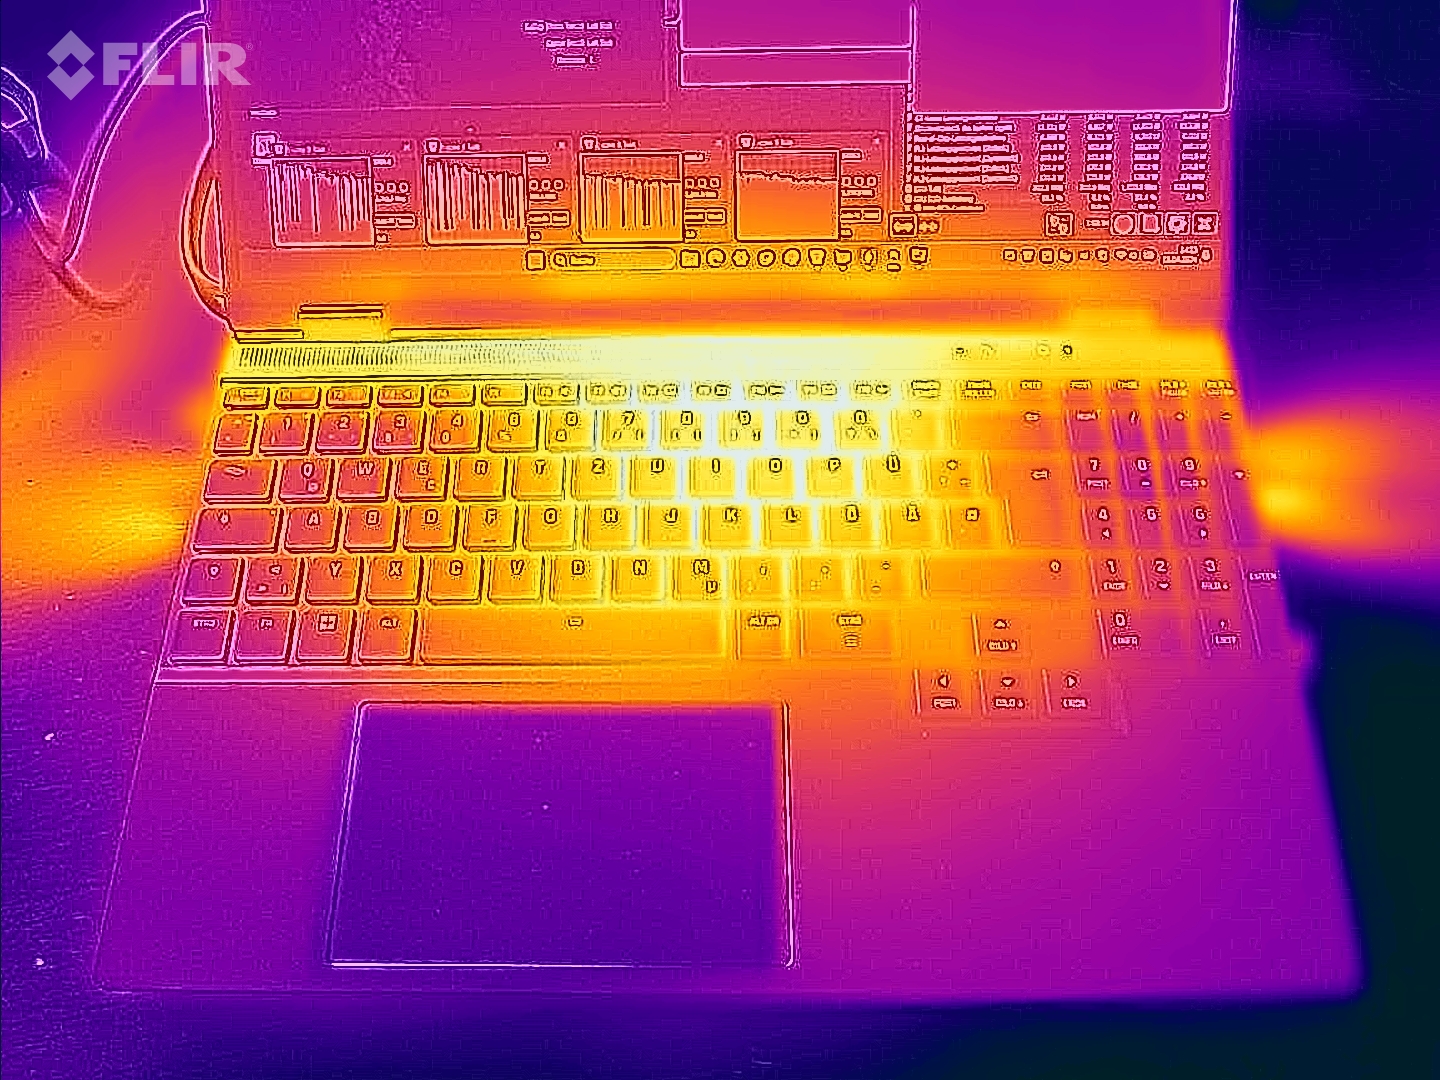
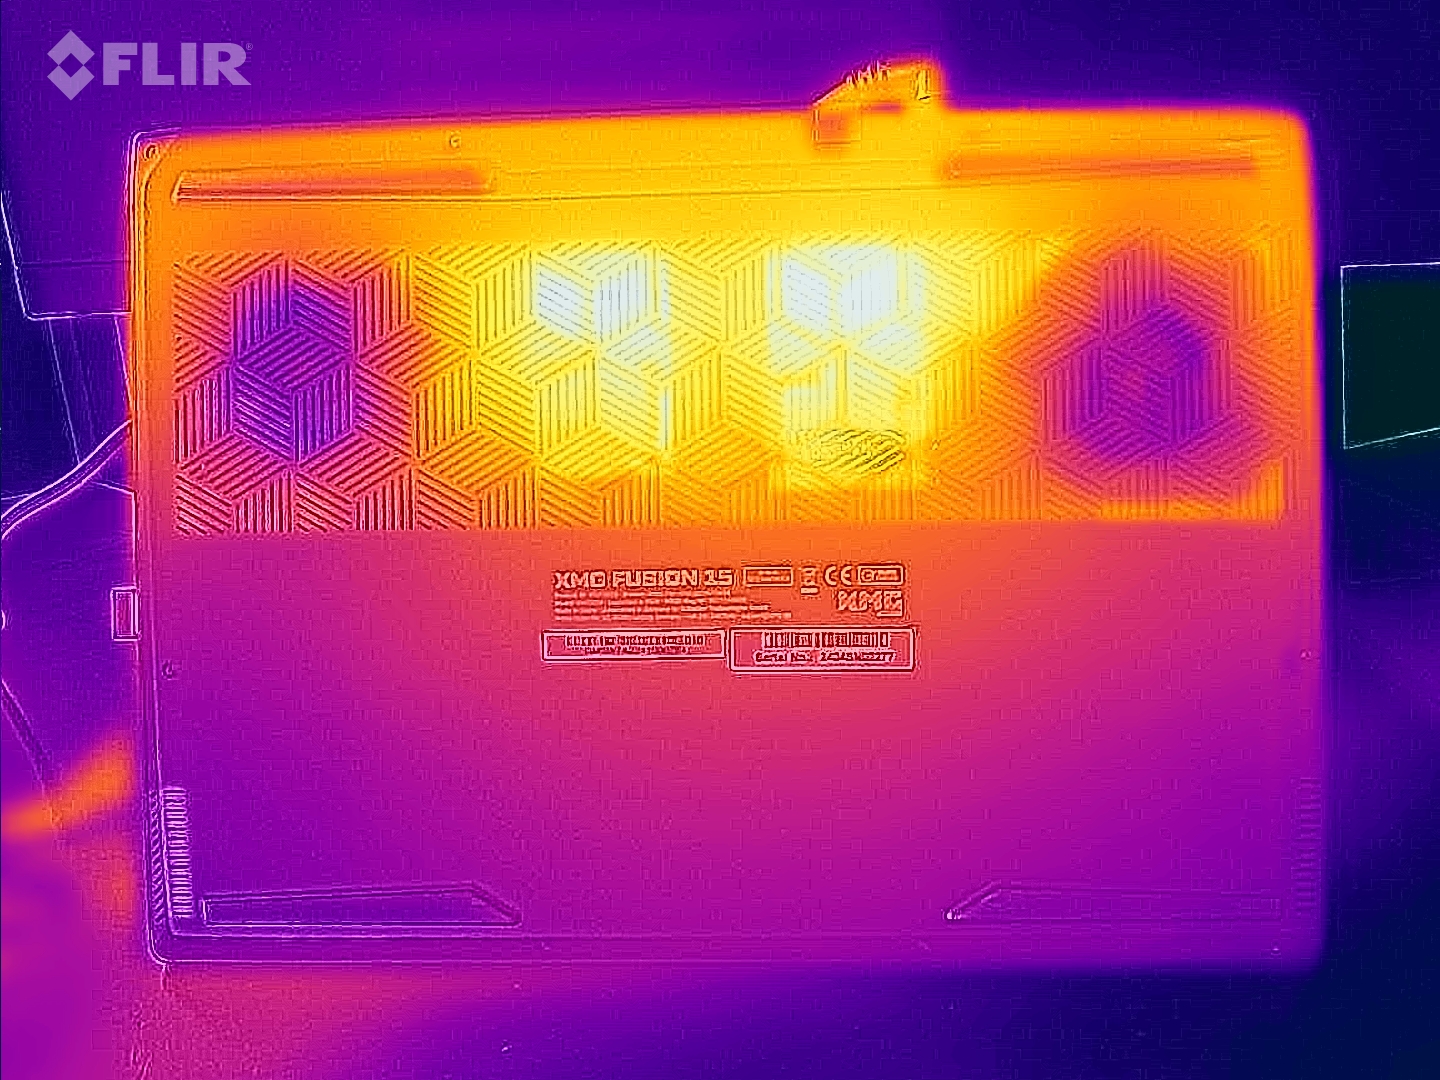
Utsläpp - Schenkers laptop blir ganska varm
Bullerutsläpp
I vardagen och vid tomgångskörning är den bärbara datorn mycket tyst. Fläktarna är visserligen permanent aktiverade (de kan avaktiveras via BIOS), men de hörs bara i mycket tysta miljöer. Under belastning förändras saker och ting snabbt: Vi noterade näsutsläpp på upp till 53 dB(A) (Enthusiast). Läget Overboost resulterade i ännu högre värden. Enheten är betydligt tystare när du använder läget Balanced- på bekostnad av viss prestanda.
Ljudnivå
| Låg belastning |
| 27 / 28 / 33 dB(A) |
| Hög belastning |
| 52 / 53 dB(A) |
 | ||
30 dB tyst 40 dB(A) hörbar 50 dB(A) högt ljud |
||
min: | ||
| Schenker XMG Fusion 15 (Early 24) i9-14900HX, GeForce RTX 4070 Laptop GPU | Aorus 16X 2024 i9-14900HX, GeForce RTX 4070 Laptop GPU | Alienware m16 R2 Ultra 7 155H, GeForce RTX 4070 Laptop GPU | HP Omen Transcend 16-u1095ng i9-14900HX, GeForce RTX 4070 Laptop GPU | Lenovo Legion Pro 5 16IRX9 i9-14900HX, GeForce RTX 4070 Laptop GPU | |
|---|---|---|---|---|---|
| Noise | -5% | 8% | 5% | 6% | |
| av / miljö * (dB) | 25 | 26 -4% | 24.7 1% | 24 4% | 23.9 4% |
| Idle Minimum * (dB) | 27 | 26 4% | 25.3 6% | 29 -7% | 24.3 10% |
| Idle Average * (dB) | 28 | 32 -14% | 25.3 10% | 30 -7% | 24.3 13% |
| Idle Maximum * (dB) | 33 | 38 -15% | 25.3 23% | 31 6% | 28.9 12% |
| Load Average * (dB) | 52 | 54 -4% | 31.7 39% | 45 13% | 45.8 12% |
| Witcher 3 ultra * (dB) | 51 | 50 2% | 53.8 -5% | 44 14% | 51 -0% |
| Load Maximum * (dB) | 53 | 55 -4% | 62 -17% | 47 11% | 56.6 -7% |
* ... mindre är bättre
Temperatur
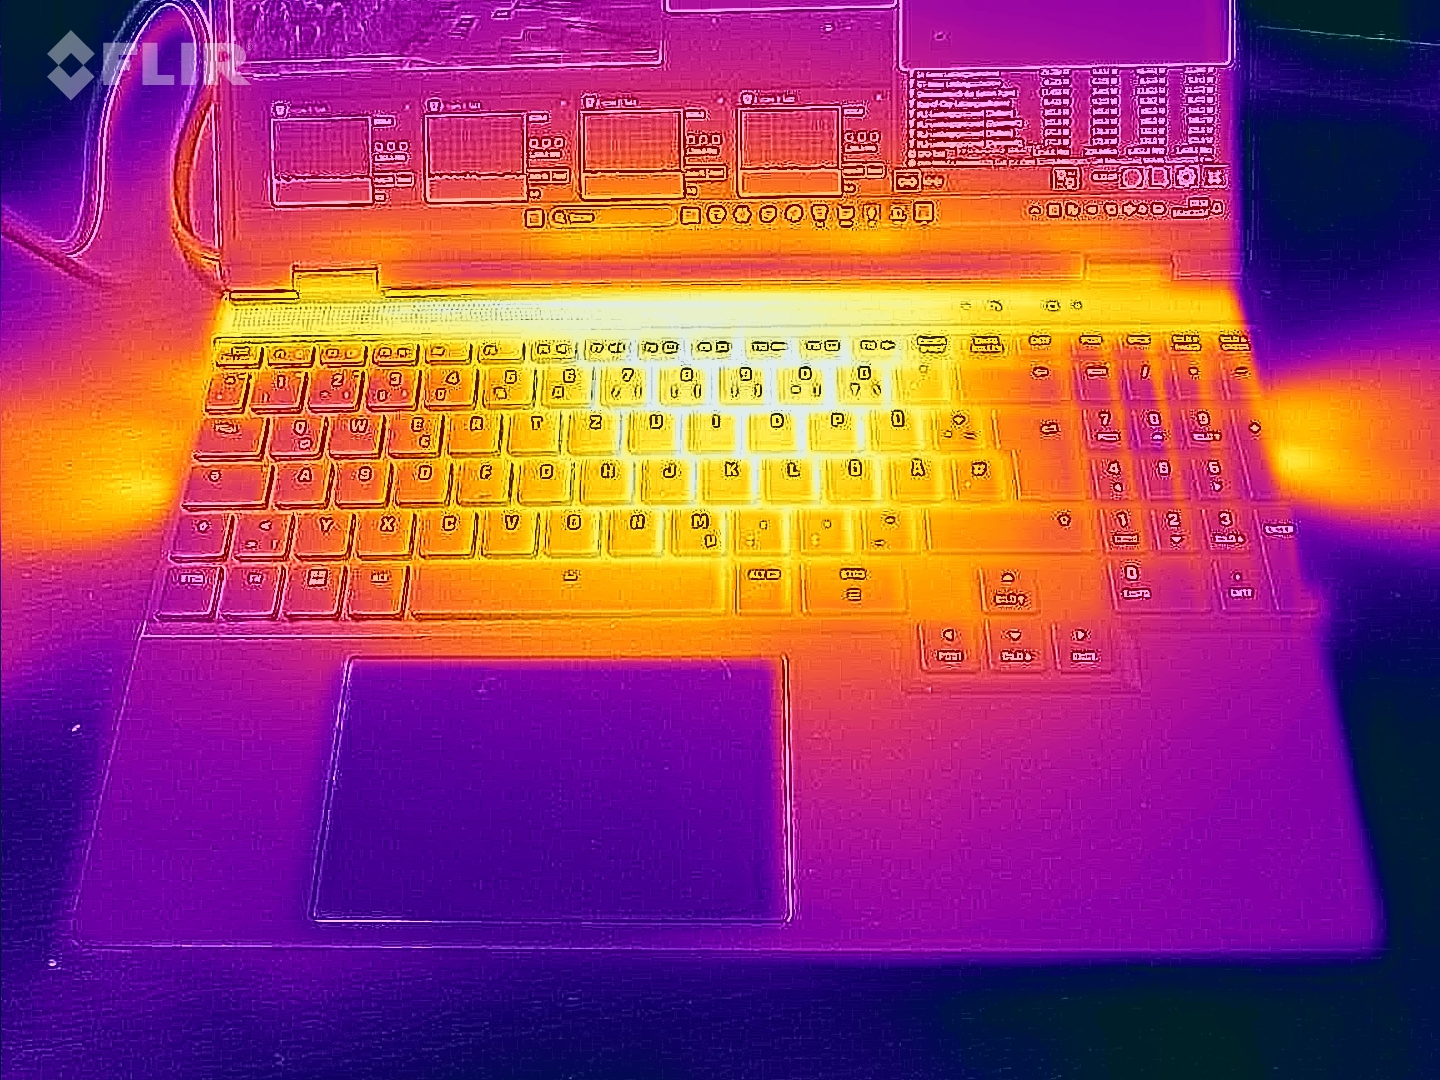
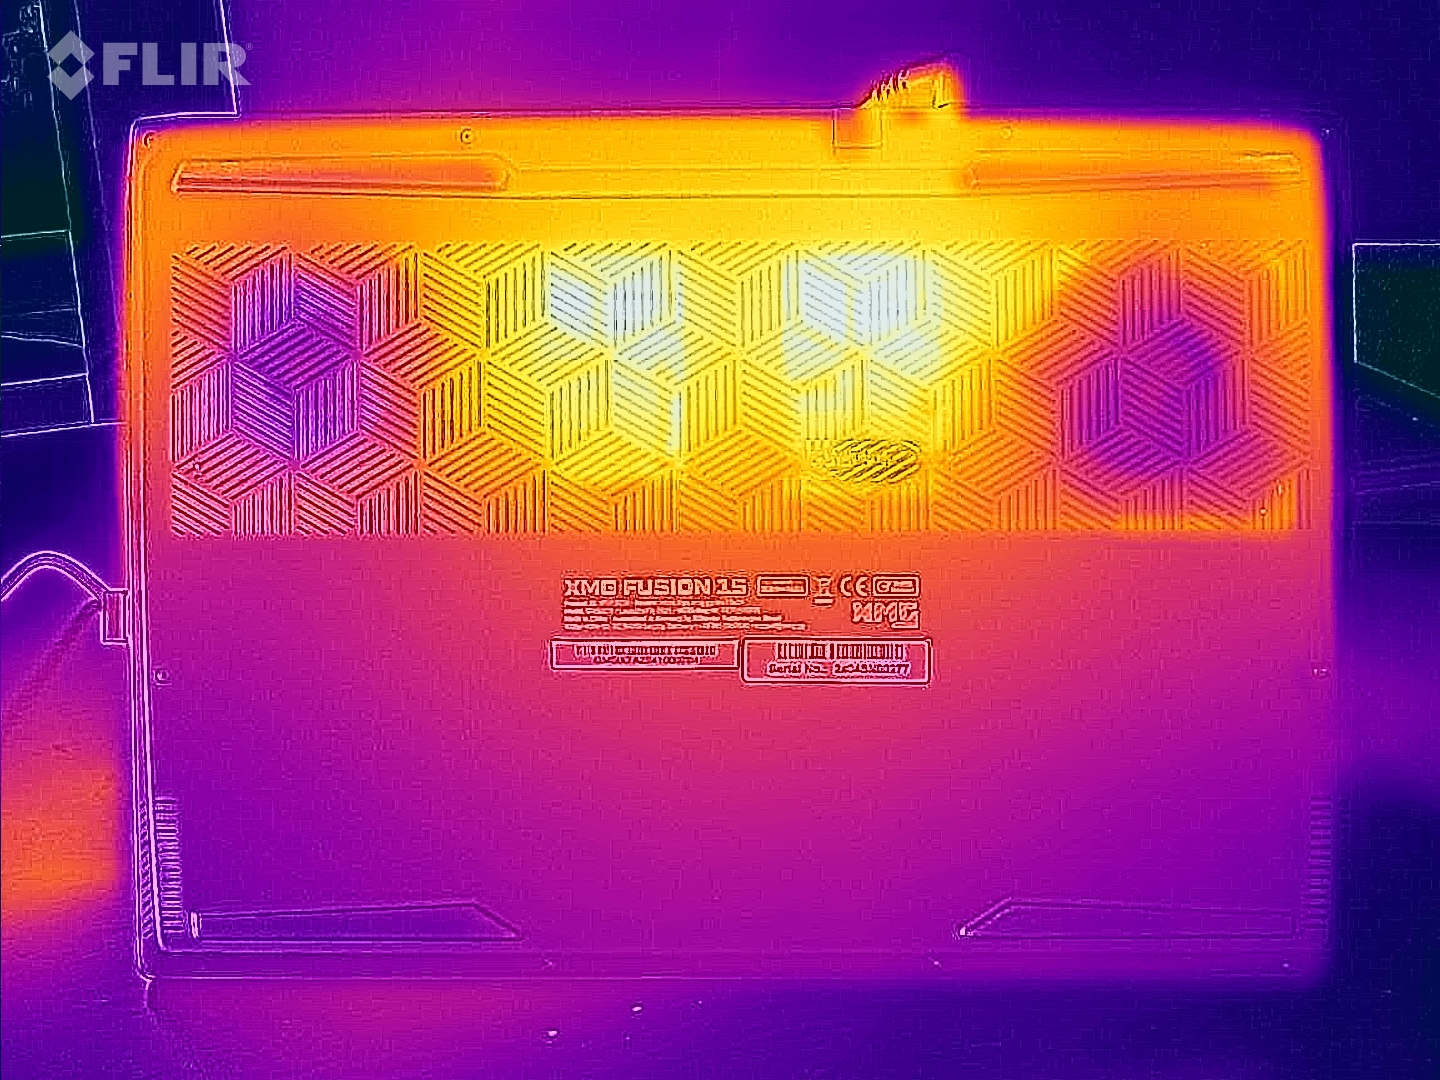
Stresstestet och Witcher 3 testet ledde till att den bärbara datorn värmdes upp avsevärt. Ibland nådde den värden inom det övre 50-graders celciusområdet. Vid daglig användning (kontor, internet) ligger värdena i allmänhet kvar inom den gröna zonen.
(-) Den maximala temperaturen på ovansidan är 48 °C / 118 F, jämfört med genomsnittet av 40.4 °C / 105 F , allt från 21.2 till 68.8 °C för klassen Gaming.
(-) Botten värms upp till maximalt 56 °C / 133 F, jämfört med genomsnittet av 43.2 °C / 110 F
(+) Vid tomgångsbruk är medeltemperaturen för ovansidan 26.6 °C / 80 F, jämfört med enhetsgenomsnittet på 33.9 °C / ### class_avg_f### F.
(-) När du spelar The Witcher 3 är medeltemperaturen för ovansidan 40.4 °C / 105 F, jämfört med enhetsgenomsnittet på 33.9 °C / ## #class_avg_f### F.
(+) Handledsstöden och pekplattan når maximal hudtemperatur (34 °C / 93.2 F) och är därför inte varma.
(-) Medeltemperaturen för handledsstödsområdet på liknande enheter var 28.8 °C / 83.8 F (-5.2 °C / -9.4 F).
| Schenker XMG Fusion 15 (Early 24) Intel Core i9-14900HX, NVIDIA GeForce RTX 4070 Laptop GPU | Aorus 16X 2024 Intel Core i9-14900HX, NVIDIA GeForce RTX 4070 Laptop GPU | Alienware m16 R2 Intel Core Ultra 7 155H, NVIDIA GeForce RTX 4070 Laptop GPU | HP Omen Transcend 16-u1095ng Intel Core i9-14900HX, NVIDIA GeForce RTX 4070 Laptop GPU | Lenovo Legion Pro 5 16IRX9 Intel Core i9-14900HX, NVIDIA GeForce RTX 4070 Laptop GPU | |
|---|---|---|---|---|---|
| Heat | -5% | -14% | -6% | -8% | |
| Maximum Upper Side * (°C) | 48 | 41 15% | 44.8 7% | 49 -2% | 43.8 9% |
| Maximum Bottom * (°C) | 56 | 41 27% | 48 14% | 63 -13% | 55.4 1% |
| Idle Upper Side * (°C) | 28 | 37 -32% | 37.2 -33% | 30 -7% | 32.8 -17% |
| Idle Bottom * (°C) | 29 | 38 -31% | 42 -45% | 29 -0% | 36 -24% |
* ... mindre är bättre
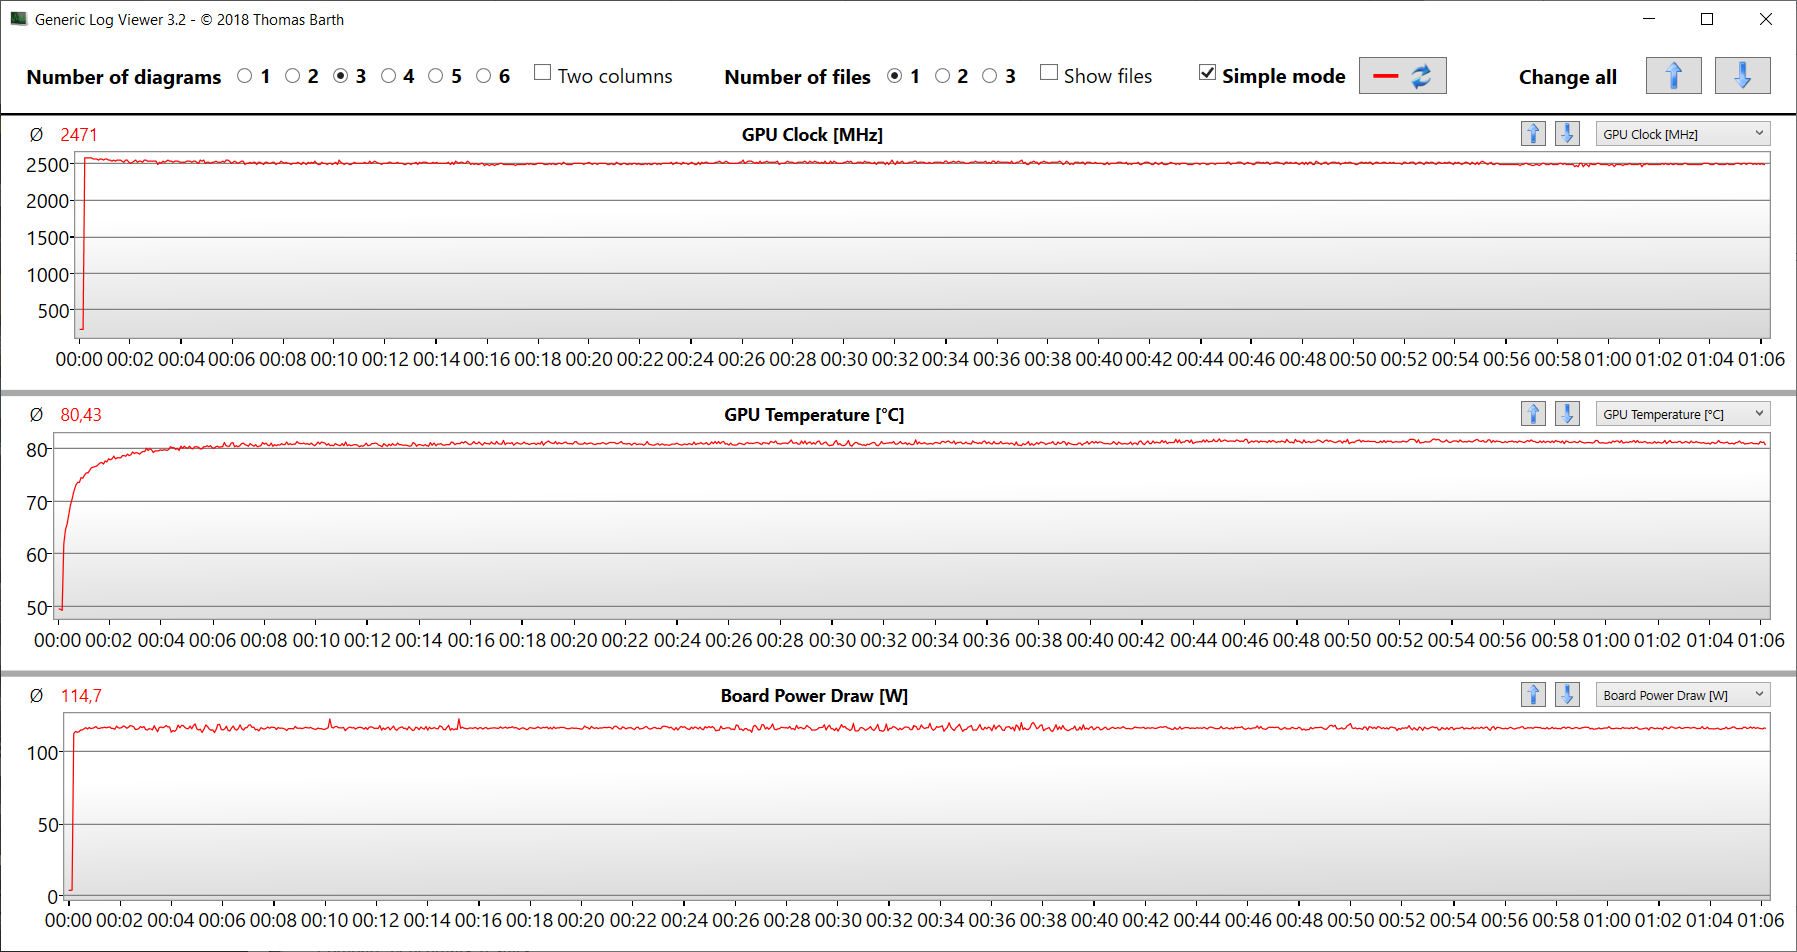
Stresstest
Det extrema scenario som simuleras av stresstestet (Prime95 och Furmark i kontinuerlig drift) kontrollerar systemets stabilitet under full belastning. CPU-klockan sjönk långsamt och kontinuerligt från värden något över basklockfrekvensen till värden under den. Grafikkärnan kördes med höga hastigheter hela tiden.
Högtalare
Den bärbara datorns stereohögtalare ger ett hyfsat ljud, men de saknar bas. En bättre ljudupplevelse kan uppnås genom att ansluta hörlurar eller externa högtalare.
Schenker XMG Fusion 15 (Early 24) ljudanalys
(+) | högtalare kan spela relativt högt (85 dB)
Bas 100 - 315 Hz
(-) | nästan ingen bas - i genomsnitt 15.8% lägre än medianen
(±) | linjäriteten för basen är genomsnittlig (12.5% delta till föregående frekvens)
Mellan 400 - 2000 Hz
(+) | balanserad mellan - endast 4.4% från medianen
(+) | mids är linjära (5.9% delta till föregående frekvens)
Högsta 2 - 16 kHz
(+) | balanserade toppar - endast 2% från medianen
(+) | toppar är linjära (4.8% delta till föregående frekvens)
Totalt 100 - 16 000 Hz
(+) | det totala ljudet är linjärt (11.5% skillnad mot median)
Jämfört med samma klass
» 10% av alla testade enheter i den här klassen var bättre, 3% liknande, 87% sämre
» Den bästa hade ett delta på 6%, genomsnittet var 18%, sämst var 132%
Jämfört med alla testade enheter
» 8% av alla testade enheter var bättre, 2% liknande, 90% sämre
» Den bästa hade ett delta på 4%, genomsnittet var 24%, sämst var 134%
Aorus 16X 2024 ljudanalys
(+) | högtalare kan spela relativt högt (85 dB)
Bas 100 - 315 Hz
(±) | reducerad bas - i genomsnitt 8.5% lägre än medianen
(±) | linjäriteten för basen är genomsnittlig (8.3% delta till föregående frekvens)
Mellan 400 - 2000 Hz
(+) | balanserad mellan - endast 3.1% från medianen
(+) | mids är linjära (5.8% delta till föregående frekvens)
Högsta 2 - 16 kHz
(+) | balanserade toppar - endast 2.5% från medianen
(±) | linjäriteten för toppar är genomsnittlig (7% delta till föregående frekvens)
Totalt 100 - 16 000 Hz
(+) | det totala ljudet är linjärt (8.4% skillnad mot median)
Jämfört med samma klass
» 2% av alla testade enheter i den här klassen var bättre, 1% liknande, 97% sämre
» Den bästa hade ett delta på 6%, genomsnittet var 18%, sämst var 132%
Jämfört med alla testade enheter
» 2% av alla testade enheter var bättre, 1% liknande, 97% sämre
» Den bästa hade ett delta på 4%, genomsnittet var 24%, sämst var 134%
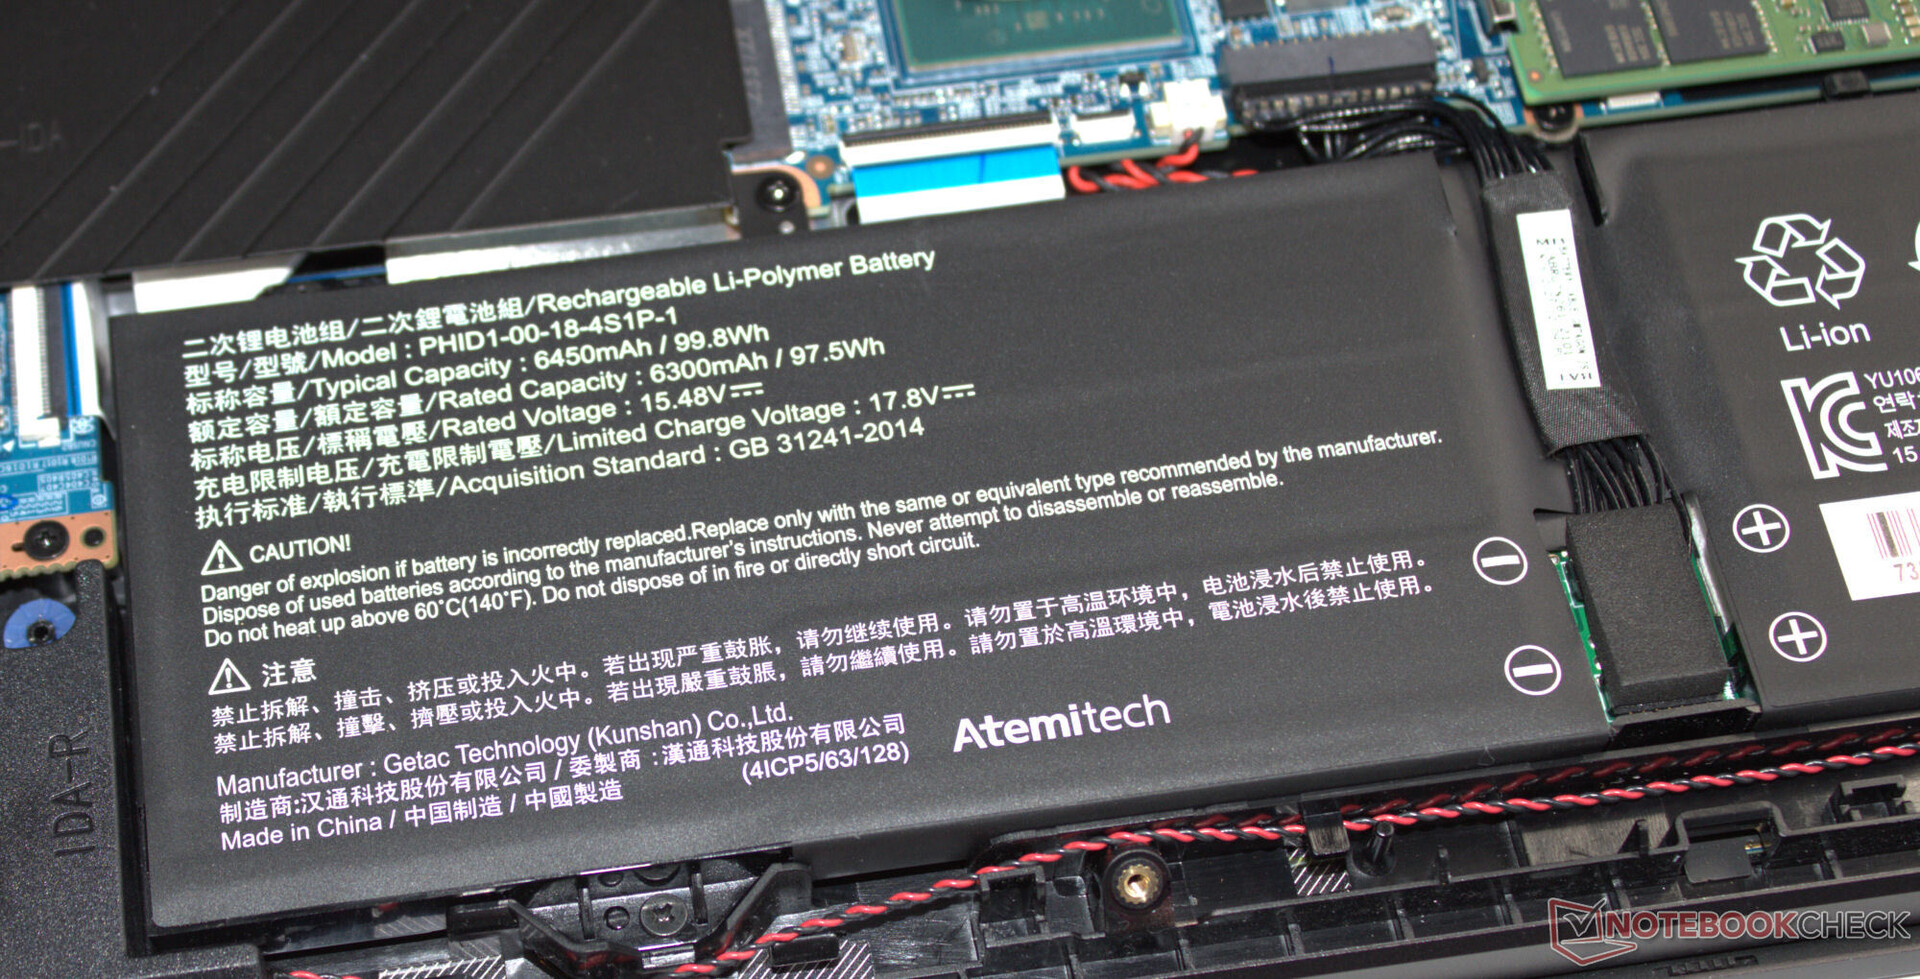
Energihantering - Fusion 15 levererar mycket bra drifttider
Strömförbrukning
Dess strömbehov är i stort sett normalt för den installerade hårdvaran. Undantag: Trots ett fulladdat batteri uppmätte vi ett strömförbrukningsvärde på ca 20 watt när den bärbara datorn var avstängd. Detta är sannolikt en bugg. Testet Witcher 3 test och stresstest kördes med något sjunkande strömförbrukningsvärden. Strömförsörjningen (280 watt) är tillräckligt kraftfull.
| Låg belastning | |
| Hög belastning |
|
Förklaring:
min: | |
| Schenker XMG Fusion 15 (Early 24) i9-14900HX, GeForce RTX 4070 Laptop GPU | Aorus 16X 2024 i9-14900HX, GeForce RTX 4070 Laptop GPU | Alienware m16 R2 Ultra 7 155H, GeForce RTX 4070 Laptop GPU | HP Omen Transcend 16-u1095ng i9-14900HX, GeForce RTX 4070 Laptop GPU | Genomsnitt av klass Gaming | |
|---|---|---|---|---|---|
| Power Consumption | -21% | -3% | -10% | -18% | |
| Idle Minimum * (Watt) | 8 | 13 -63% | 8.1 -1% | 10 -25% | 13.2 ? -65% |
| Idle Average * (Watt) | 14 | 18 -29% | 13 7% | 18 -29% | 18.9 ? -35% |
| Idle Maximum * (Watt) | 26 | 35 -35% | 40.3 -55% | 32 -23% | 24.3 ? 7% |
| Load Average * (Watt) | 118 | 138 -17% | 79 33% | 128 -8% | 108.3 ? 8% |
| Witcher 3 ultra * (Watt) | 192.7 | 172.6 10% | 188.1 2% | 148.4 23% | |
| Load Maximum * (Watt) | 244 | 222 9% | 254.9 -4% | 242 1% | 254 ? -4% |
* ... mindre är bättre
Power consumption Witcher 3 / stress test
Power consumption with external monitor
Körtider
Under vårt WiFi-test (laddning av webbplatser via ett skript) och videotest (kortfilmen Big Buck Bunny (H.264-kodning, FHD) i en loop) uppmätte vi körtider på 8:00 timmar respektive 10:02 timmar. Det här är mycket bra värden.
| Schenker XMG Fusion 15 (Early 24) i9-14900HX, GeForce RTX 4070 Laptop GPU, 99.8 Wh | Aorus 16X 2024 i9-14900HX, GeForce RTX 4070 Laptop GPU, 99 Wh | Alienware m16 R2 Ultra 7 155H, GeForce RTX 4070 Laptop GPU, 90 Wh | HP Omen Transcend 16-u1095ng i9-14900HX, GeForce RTX 4070 Laptop GPU, 97 Wh | Lenovo Legion Pro 5 16IRX9 i9-14900HX, GeForce RTX 4070 Laptop GPU, 80 Wh | Genomsnitt av klass Gaming | |
|---|---|---|---|---|---|---|
| Batteridrifttid | -16% | -26% | -39% | -52% | -30% | |
| Reader / Idle (h) | 15.2 | 12.6 -17% | 12.6 -17% | 6.7 -56% | 8.71 ? -43% | |
| H.264 (h) | 10 | 9 -10% | 8.26 ? -17% | |||
| WiFi v1.3 (h) | 8 | 8 0% | 8.1 1% | 4.9 -39% | 4.8 -40% | 7.04 ? -12% |
| Load (h) | 2.7 | 1.7 -37% | 1 -63% | 1.1 -59% | 1.47 ? -46% |
För
Emot
Omdöme - Bärbar, kraftfull, uthållig
Kompakta mått och låg vikt (ca 2,1 kg) innebär inte att hårdvarans prestanda försämras. Den nya Core i9 processorn och GeForce RTX 4070 kan arbeta med genomgående höga klockfrekvenser. Den bärbara datorns kombination av prestanda och bärbarhet kan betecknas som en framgång.
XMG Fusion 15 (Early 24) - en kraftfull, bärbar bärbar dator för spelare och kreatörer.
Den bärbara datorn blir ganska varm under belastning och när den gör det producerar den en hel del buller. Mer måttliga utsläpp kräver att man offrar en del datorkraft. Dess 15,3-tumsskärm (2 560 x 1 600 pixlar, IPS, 240 Hz, Adaptive Sync) med ett bildförhållande på 16:10 är överlag imponerande. Den höga ljusstyrkan är anmärkningsvärd.
En full laddning (99,8 Wh) räcker för en praktisk drifttid på cirka 8-10 timmar - mycket bra värden. Positiva egenskaper: Batteriet kan laddas via en USB-C-strömförsörjning (min. 100 watt, 20 V) - den bärbara datorns TB4-port stöder Power Delivery. Därmed behöver du inte nödvändigtvis bära med dig den egenutvecklade strömförsörjningen (280 watt) hela tiden.
Ett alternativ skulle kunna vara Aorus 16X (2024). Denna bärbara dator erbjuder jämförbar datorkraft såväl som lika bra körtider.
Pris och tillgänglighet
XMG Fusion 15 (Early 24) kan konfigureras och beställas direkt via Schenkers webbshop. Den aktuella testenheten kostar ca 2.500 US-dollar. Priserna börjar från ca 1.700 USD.
Schenker XMG Fusion 15 (Early 24)
- 05/01/2024 v7 (old)
Sascha Mölck
Genomskinlighet
Valet av enheter som ska granskas görs av vår redaktion. Testprovet gavs till författaren som ett lån av tillverkaren eller återförsäljaren för denna recension. Långivaren hade inget inflytande på denna recension och inte heller fick tillverkaren en kopia av denna recension innan publiceringen. Det fanns ingen skyldighet att publicera denna recension. Som ett oberoende medieföretag är Notebookcheck inte föremål för auktoritet från tillverkare, återförsäljare eller förlag.
This is how Notebookcheck is testingEvery year, Notebookcheck independently reviews hundreds of laptops and smartphones using standardized procedures to ensure that all results are comparable. We have continuously developed our test methods for around 20 years and set industry standards in the process. In our test labs, high-quality measuring equipment is utilized by experienced technicians and editors. These tests involve a multi-stage validation process. Our complex rating system is based on hundreds of well-founded measurements and benchmarks, which maintains objectivity.
Price comparison

