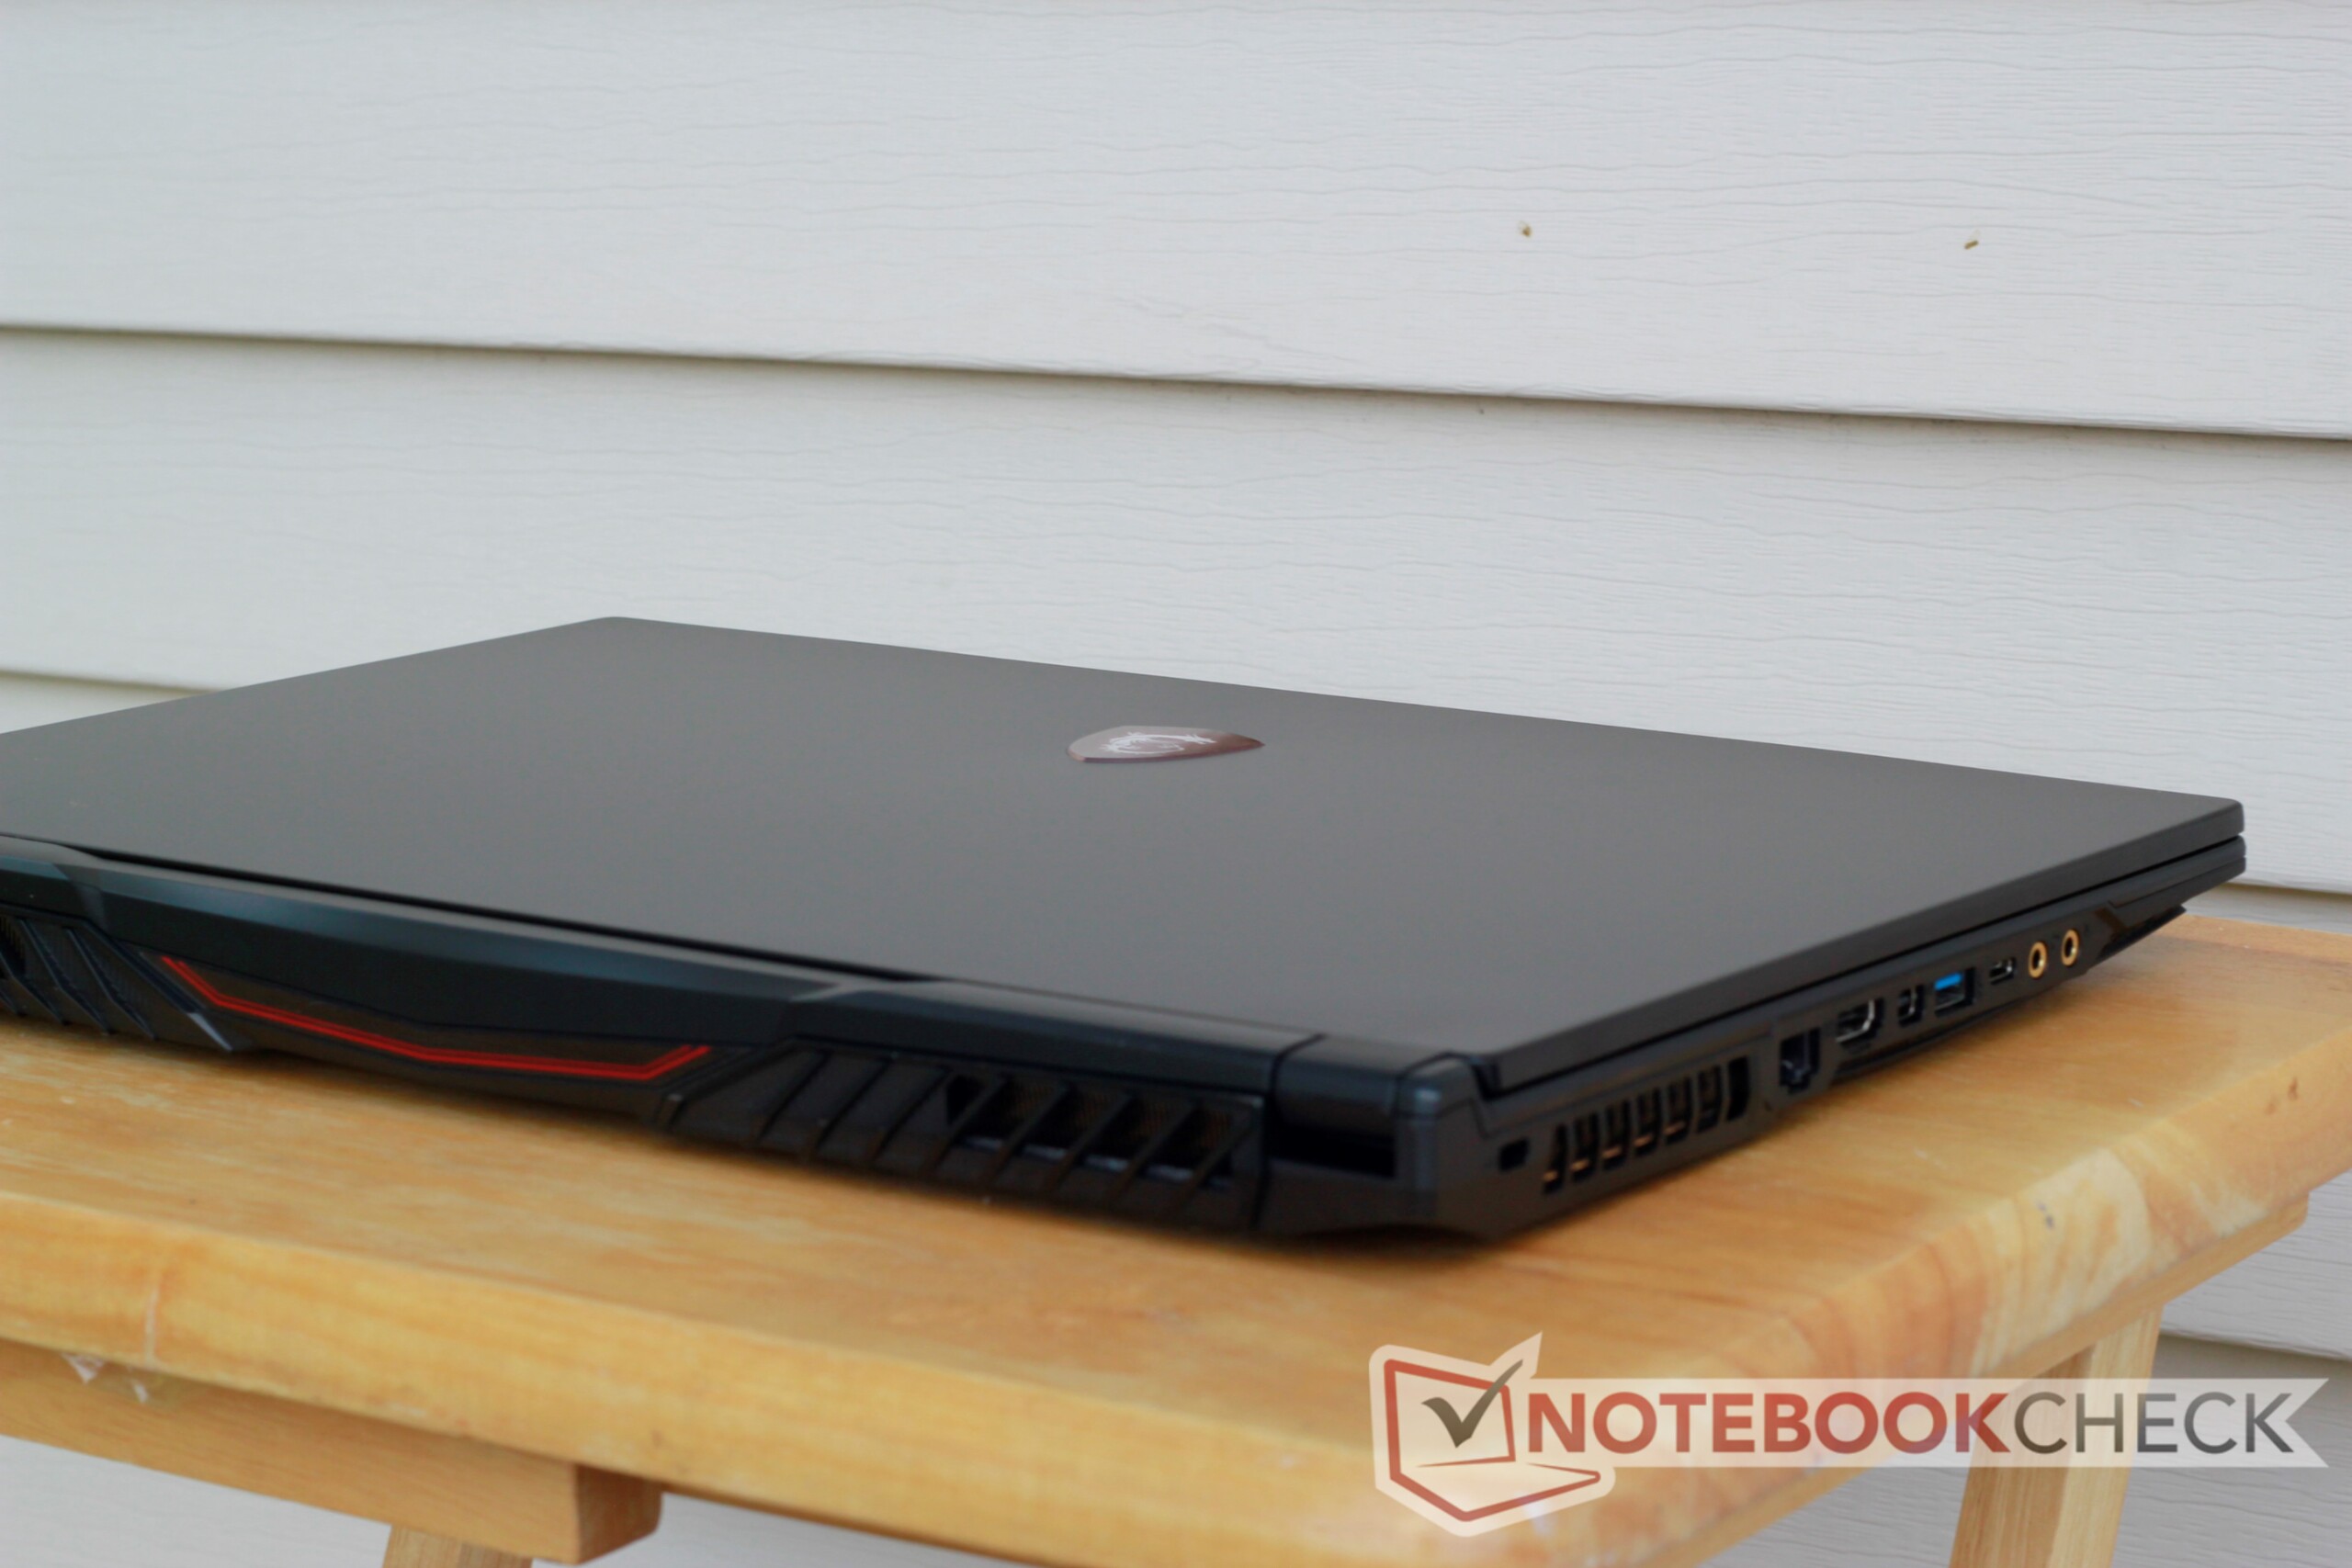
Test: MSI GL75 9SEK - En genomsnittlig spellaptop från mittenskiktet som lider av högljudda fläktar (Sammanfattning)

| SD Card Reader | |
| average JPG Copy Test (av. of 3 runs) | |
| Genomsnitt av klass Gaming (20.9 - 210, n=55, senaste 2 åren) | |
| HP Omen 17t-3AW55AV_1 (Toshiba Exceria Pro SDXC 64 GB UHS-II) | |
| HP Omen 15-dc1020ng (Toshiba Exceria Pro SDXC 64 GB UHS-II) | |
| HP Pavilion Gaming 17-cd0085cl (Toshiba Exceria Pro SDXC 64 GB UHS-II) | |
| MSI GL73 8SE-010US (Toshiba Exceria Pro SDXC 64 GB UHS-II) | |
| MSI GL75 9SEK-056US | |
| maximum AS SSD Seq Read Test (1GB) | |
| Genomsnitt av klass Gaming (25.5 - 261, n=52, senaste 2 åren) | |
| HP Omen 15-dc1020ng (Toshiba Exceria Pro SDXC 64 GB UHS-II) | |
| HP Omen 17t-3AW55AV_1 (Toshiba Exceria Pro SDXC 64 GB UHS-II) | |
| HP Pavilion Gaming 17-cd0085cl (Toshiba Exceria Pro SDXC 64 GB UHS-II) | |
| MSI GL73 8SE-010US (Toshiba Exceria Pro SDXC 64 GB UHS-II) | |
| MSI GL75 9SEK-056US | |
| Networking | |
| iperf3 transmit AX12 | |
| Acer Predator Helios 500 PH517-51-79BY | |
| HP Omen 15-dc1020ng | |
| Asus Strix Hero III G731GV | |
| HP Pavilion Gaming 17-cd0085cl | |
| MSI GL75 9SEK-056US | |
| HP Omen 17t-3AW55AV_1 | |
| MSI GL73 8SE-010US | |
| iperf3 receive AX12 | |
| MSI GL75 9SEK-056US | |
| Acer Predator Helios 500 PH517-51-79BY | |
| Asus Strix Hero III G731GV | |
| HP Pavilion Gaming 17-cd0085cl | |
| MSI GL73 8SE-010US | |
| HP Omen 15-dc1020ng | |
| HP Omen 17t-3AW55AV_1 | |
| |||||||||||||||||||||||||
Distribution av ljusstyrkan: 93 %
Mitt på batteriet: 259.1 cd/m²
Kontrast: 1036:1 (Svärta: 0.25 cd/m²)
ΔE ColorChecker Calman: 4.23 | ∀{0.5-29.43 Ø4.73}
calibrated: 3.9
ΔE Greyscale Calman: 1.3 | ∀{0.09-98 Ø4.97}
61% sRGB (Argyll 1.6.3 3D)
39% AdobeRGB 1998 (Argyll 1.6.3 3D)
42.49% AdobeRGB 1998 (Argyll 3D)
61.1% sRGB (Argyll 3D)
41.12% Display P3 (Argyll 3D)
Gamma: 2.076
CCT: 6542 K
| MSI GL75 9SEK-056US AU Optronics AUO479D (B173HAN04.7), IPS, 17.3", 1920x1080 | Asus Strix Hero III G731GV AU Optronics AUO B173HAN04.0, IPS, 17.3", 1920x1080 | MSI GL73 8SE-010US CMN1747, TN LED, 17.3", 1920x1080 | Acer Predator Helios 500 PH517-51-79BY AUO_B173HAN03, IPS, 17.3", 1920x1080 | HP Omen 17t-3AW55AV_1 AU Optronics AUO309D, IPS, 17.3", 1920x1080 | HP Omen 15-dc1020ng LGD05CE, IPS, 15.6", 1920x1080 | HP Pavilion Gaming 17-cd0085cl BOE0825, IPS, 17.3", 1920x1080 | |
|---|---|---|---|---|---|---|---|
| Display | 49% | 96% | 53% | 54% | -7% | 51% | |
| Display P3 Coverage (%) | 41.12 | 62.9 53% | 91.1 122% | 64.4 57% | 65.4 59% | 38.37 -7% | 63.3 54% |
| sRGB Coverage (%) | 61.1 | 87.2 43% | 100 64% | 91.3 49% | 90 47% | 57.6 -6% | 90.2 48% |
| AdobeRGB 1998 Coverage (%) | 42.49 | 63.8 50% | 85.4 101% | 65.6 54% | 65.8 55% | 39.69 -7% | 64.3 51% |
| Response Times | 63% | 59% | 55% | 46% | -38% | -1% | |
| Response Time Grey 50% / Grey 80% * (ms) | 26 ? | 6.8 ? 74% | 12.8 ? 51% | 14 ? 46% | 17.6 ? 32% | 40 ? -54% | 31.6 ? -22% |
| Response Time Black / White * (ms) | 24.4 ? | 12 ? 51% | 8.2 ? 66% | 9 ? 63% | 10 ? 59% | 29.6 ? -21% | 19.6 ? 20% |
| PWM Frequency (Hz) | 25770 ? | ||||||
| Screen | 12% | -50% | -28% | 2% | -22% | -2% | |
| Brightness middle (cd/m²) | 259.1 | 312.3 21% | 326.4 26% | 335 29% | 343.6 33% | 251 -3% | 299.6 16% |
| Brightness (cd/m²) | 261 | 297 14% | 317 21% | 300 15% | 320 23% | 232 -11% | 285 9% |
| Brightness Distribution (%) | 93 | 91 -2% | 90 -3% | 82 -12% | 87 -6% | 76 -18% | 86 -8% |
| Black Level * (cd/m²) | 0.25 | 0.21 16% | 0.28 -12% | 0.7 -180% | 0.34 -36% | 0.17 32% | 0.33 -32% |
| Contrast (:1) | 1036 | 1487 44% | 1166 13% | 479 -54% | 1011 -2% | 1476 42% | 908 -12% |
| Colorchecker dE 2000 * | 4.23 | 3.6 15% | 7.83 -85% | 4.99 -18% | 3.74 12% | 6.2 -47% | 3.68 13% |
| Colorchecker dE 2000 max. * | 23.39 | 6.74 71% | 13.36 43% | 9.32 60% | 5.33 77% | 18.6 20% | 8.05 66% |
| Colorchecker dE 2000 calibrated * | 3.9 | 3.95 -1% | 2.83 27% | 1.93 51% | 3.49 11% | 4.8 -23% | 3.15 19% |
| Greyscale dE 2000 * | 1.3 | 3.1 -138% | 10.9 -738% | 5.2 -300% | 3.7 -185% | 4.2 -223% | 3.8 -192% |
| Gamma | 2.076 106% | 2.26 97% | 1.97 112% | 2.49 88% | 2.36 93% | 2.32 95% | 2.12 104% |
| CCT | 6542 99% | 7002 93% | 11056 59% | 7719 84% | 6388 102% | 7454 87% | 7240 90% |
| Color Space (Percent of AdobeRGB 1998) (%) | 39 | 56.6 45% | 75.8 94% | 59 51% | 58 49% | 36.5 -6% | 58.1 49% |
| Color Space (Percent of sRGB) (%) | 61 | 86.6 42% | 100 64% | 91 49% | 90 48% | 57.4 -6% | 89.8 47% |
| Totalt genomsnitt (program/inställningar) | 41% /
25% | 35% /
-9% | 27% /
-3% | 34% /
17% | -22% /
-21% | 16% /
8% |
* ... mindre är bättre
Visa svarstider
| ↔ Svarstid svart till vitt | ||
|---|---|---|
| 24.4 ms ... stiga ↗ och falla ↘ kombinerat | ↗ 12.8 ms stiga | 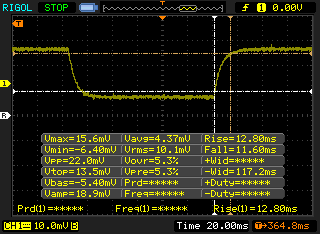 |
| ↘ 11.6 ms hösten | ||
| Skärmen visar bra svarsfrekvens i våra tester, men kan vara för långsam för konkurrenskraftiga spelare. I jämförelse sträcker sig alla testade enheter från 0.1 (minst) till 240 (maximalt) ms. » 57 % av alla enheter är bättre. Detta innebär att den uppmätta svarstiden är sämre än genomsnittet av alla testade enheter (19.9 ms). | ||
| ↔ Svarstid 50 % grått till 80 % grått | ||
| 26 ms ... stiga ↗ och falla ↘ kombinerat | ↗ 11.6 ms stiga | 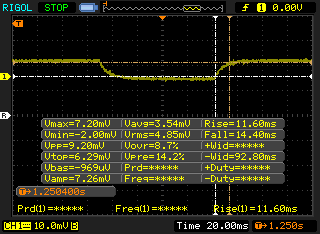 |
| ↘ 14.4 ms hösten | ||
| Skärmen visar relativt långsamma svarsfrekvenser i våra tester och kan vara för långsam för spelare. I jämförelse sträcker sig alla testade enheter från 0.165 (minst) till 636 (maximalt) ms. » 36 % av alla enheter är bättre. Det betyder att den uppmätta svarstiden är bättre än genomsnittet av alla testade enheter (31.1 ms). | ||
Skärmflimmer / PWM (Puls-Width Modulation)
| Skärmflimmer / PWM upptäcktes inte | 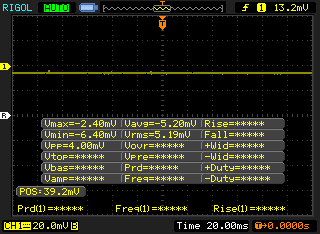 | ||
Som jämförelse: 52 % av alla testade enheter använder inte PWM för att dämpa skärmen. Om PWM upptäcktes mättes ett medelvärde av 7801 (minst: 5 - maximum: 343500) Hz. | |||
| Cinebench R10 | |
| Rendering Multiple CPUs 32Bit | |
| Genomsnitt av klass Gaming (42932 - 81339, n=8, senaste 2 åren) | |
| Genomsnitt Intel Core i7-9750H (28251 - 36304, n=13) | |
| Lenovo Legion Y540-17IRH | |
| Rendering Single 32Bit | |
| Genomsnitt av klass Gaming (7457 - 11779, n=8, senaste 2 åren) | |
| Genomsnitt Intel Core i7-9750H (6659 - 7214, n=13) | |
| Lenovo Legion Y540-17IRH | |
| PCMark 8 Home Score Accelerated v2 | 4241 poäng | |
| PCMark 8 Work Score Accelerated v2 | 5428 poäng | |
| PCMark 10 Score | 5748 poäng | |
Hjälp | ||
| MSI GL75 9SEK-056US WDC PC SN520 SDAPNUW-512G | Asus Strix Hero III G731GV Intel SSD 660p SSDPEKNW512G8 | MSI GL73 8SE-010US Kingston RBUSNS8154P3128GJ | Acer Predator Helios 500 PH517-51-79BY SK hynix SSD Canvas SC300 HFS256GD9MNE-6200A | HP Omen 17t-3AW55AV_1 Samsung SSD PM981 MZVLB512HAJQ | HP Pavilion Gaming 17-cd0085cl Samsung SSD PM981 MZVLB256HAHQ | |
|---|---|---|---|---|---|---|
| AS SSD | -29% | -79% | -33% | 17% | 5% | |
| Seq Read (MB/s) | 1296 | 940 -27% | 794 -39% | 972 -25% | 1473 14% | 1709 32% |
| Seq Write (MB/s) | 1391 | 921 -34% | 427.6 -69% | 838 -40% | 1962 41% | 1345 -3% |
| 4K Read (MB/s) | 29.67 | 48.05 62% | 21.91 -26% | 38.57 30% | 31.66 7% | 49.73 68% |
| 4K Write (MB/s) | 104.3 | 56.6 | 80.7 | 84.4 | 108.2 | |
| 4K-64 Read (MB/s) | 1042 | 320.1 -69% | 354.3 -66% | 723 -31% | 1125 8% | 731 -30% |
| 4K-64 Write (MB/s) | 1284 | 703 -45% | 285.7 -78% | 647 -50% | 1866 45% | 1233 -4% |
| Access Time Read * (ms) | 0.108 | 0.079 27% | 0.237 -119% | 0.071 34% | 0.073 32% | |
| Access Time Write * (ms) | 0.031 | 0.046 -48% | 0.09 -190% | 0.054 -74% | 0.047 -52% | 0.034 -10% |
| Score Read (Points) | 1201 | 462 -62% | 456 -62% | 859 -28% | 1304 9% | 951 -21% |
| Score Write (Points) | 1542 | 900 -42% | 385 -75% | 812 -47% | 2147 39% | 1476 -4% |
| Score Total (Points) | 3363 | 1616 -52% | 1061 -68% | 4142 23% | 2909 -13% | |
| Copy ISO MB/s (MB/s) | 1416 | 811 | 868 | 1080 | 1284 | |
| Copy Program MB/s (MB/s) | 569 | 278 | 337 | 481.1 | 589 | |
| Copy Game MB/s (MB/s) | 971 | 556 | 590 | 875 | 1107 | |
| CrystalDiskMark 5.2 / 6 | -13% | -49% | -37% | -6% | 22% | |
| Write 4K (MB/s) | 149.1 | 129.3 -13% | 71.2 -52% | 79.2 -47% | 110.7 -26% | 135.3 -9% |
| Read 4K (MB/s) | 48.58 | 54.4 12% | 32.7 -33% | 39.69 -18% | 35.49 -27% | 63.7 31% |
| Write Seq (MB/s) | 978 | 404.5 | 950 | 1665 | 1337 | |
| Read Seq (MB/s) | 1447 | 8.3 | 1087 | 1284 | 1617 | |
| Write 4K Q32T1 (MB/s) | 462 | 476.8 3% | 204 -56% | 189.6 -59% | 340.2 -26% | 568 23% |
| Read 4K Q32T1 (MB/s) | 606 | 338.1 -44% | 303.2 -50% | 304 -50% | 407.5 -33% | 645 6% |
| Write Seq Q32T1 (MB/s) | 1454 | 982 -32% | 386.5 -73% | 948 -35% | 2038 40% | 1428 -2% |
| Read Seq Q32T1 (MB/s) | 1724 | 1622 -6% | 1214 -30% | 1488 -14% | 2367 37% | 3184 85% |
| Write 4K Q8T8 (MB/s) | 1211 | |||||
| Read 4K Q8T8 (MB/s) | 1104 | |||||
| Totalt genomsnitt (program/inställningar) | -21% /
-23% | -64% /
-68% | -35% /
-35% | 6% /
8% | 14% /
11% |
* ... mindre är bättre

| 3DMark 11 | |
| 1280x720 Performance GPU | |
| Genomsnitt av klass Gaming (21841 - 80022, n=109, senaste 2 åren) | |
| Asus Strix Scar III G531GW-AZ062T | |
| MSI GL75 9SEK-056US | |
| Genomsnitt NVIDIA GeForce RTX 2060 Mobile (19143 - 24662, n=40) | |
| Razer Blade 15 GTX 1660 Ti | |
| HP Omen X 2S 15-dg0075cl | |
| Asus ZenBook 15 UX534FT-DB77 | |
| Asus TUF FX705DY-AU072 | |
| Asus ZenBook Flip 14 UM462DA-AI023T | |
| 1280x720 Performance Combined | |
| Genomsnitt av klass Gaming (10258 - 30851, n=109, senaste 2 åren) | |
| MSI GL75 9SEK-056US | |
| HP Omen X 2S 15-dg0075cl | |
| Genomsnitt NVIDIA GeForce RTX 2060 Mobile (1107 - 14726, n=40) | |
| Razer Blade 15 GTX 1660 Ti | |
| Asus Strix Scar III G531GW-AZ062T | |
| Asus ZenBook 15 UX534FT-DB77 | |
| Asus TUF FX705DY-AU072 | |
| Asus ZenBook Flip 14 UM462DA-AI023T | |
| 3DMark 11 Performance | 18769 poäng | |
| 3DMark Cloud Gate Standard Score | 38284 poäng | |
| 3DMark Fire Strike Score | 15035 poäng | |
| 3DMark Time Spy Score | 6245 poäng | |
Hjälp | ||
| låg | med. | hög | ultra | |
|---|---|---|---|---|
| The Witcher 3 (2015) | 262 | 182 | 115 | 58 |
| Rocket League (2017) | 252 | 249 | 246 | |
| Shadow of the Tomb Raider (2018) | 120 | 96 | 90 | 80 |
| F1 2019 (2019) | 209 | 166 | 138 | 99 |
| MSI GL75 9SEK-056US GeForce RTX 2060 Mobile, i7-9750H, WDC PC SN520 SDAPNUW-512G | Asus Strix Hero III G731GV GeForce RTX 2060 Mobile, i7-9750H, Intel SSD 660p SSDPEKNW512G8 | MSI GL73 8SE-010US GeForce RTX 2060 Mobile, i7-8750H, Kingston RBUSNS8154P3128GJ | Acer Predator Helios 500 PH517-51-79BY GeForce GTX 1070 Mobile, i7-8750H, SK hynix SSD Canvas SC300 HFS256GD9MNE-6200A | HP Omen 17t-3AW55AV_1 GeForce GTX 1070 Mobile, i7-8750H, Samsung SSD PM981 MZVLB512HAJQ | HP Omen 15-dc1020ng GeForce GTX 1650 Mobile, i5-9300H, WDC PC SN720 SDAQNTW-512G | HP Pavilion Gaming 17-cd0085cl GeForce GTX 1660 Ti Max-Q, i7-9750H, Samsung SSD PM981 MZVLB256HAHQ | |
|---|---|---|---|---|---|---|---|
| Noise | -2% | -2% | -2% | 1% | 11% | 11% | |
| av / miljö * (dB) | 28.1 | 28.2 -0% | 28.6 -2% | 30.4 -8% | 27.8 1% | 28.8 -2% | 28.2 -0% |
| Idle Minimum * (dB) | 30.9 | 29.5 5% | 33.8 -9% | 31.2 -1% | 31.1 -1% | 28.8 7% | 30.1 3% |
| Idle Average * (dB) | 30.9 | 30.3 2% | 34 -10% | 35.3 -14% | 31.1 -1% | 29.5 5% | 30.1 3% |
| Idle Maximum * (dB) | 31 | 31.9 -3% | 34.1 -10% | 35.3 -14% | 35 -13% | 31.1 -0% | 30.1 3% |
| Load Average * (dB) | 39 | 50.4 -29% | 36.5 6% | 44.4 -14% | 42 -8% | 35.2 10% | 34.2 12% |
| Witcher 3 ultra * (dB) | 53.5 | 50.1 6% | 47.8 11% | 41 23% | 44.5 17% | 35.2 34% | 34.2 36% |
| Load Maximum * (dB) | 53.5 | 50.1 6% | 52.2 2% | 45.2 16% | 46.5 13% | 41 23% | 43.8 18% |
* ... mindre är bättre
Ljudnivå
| Låg belastning |
| 30.9 / 30.9 / 31 dB(A) |
| Hög belastning |
| 39 / 53.5 dB(A) |
 | ||
30 dB tyst 40 dB(A) hörbar 50 dB(A) högt ljud |
||
min: | ||
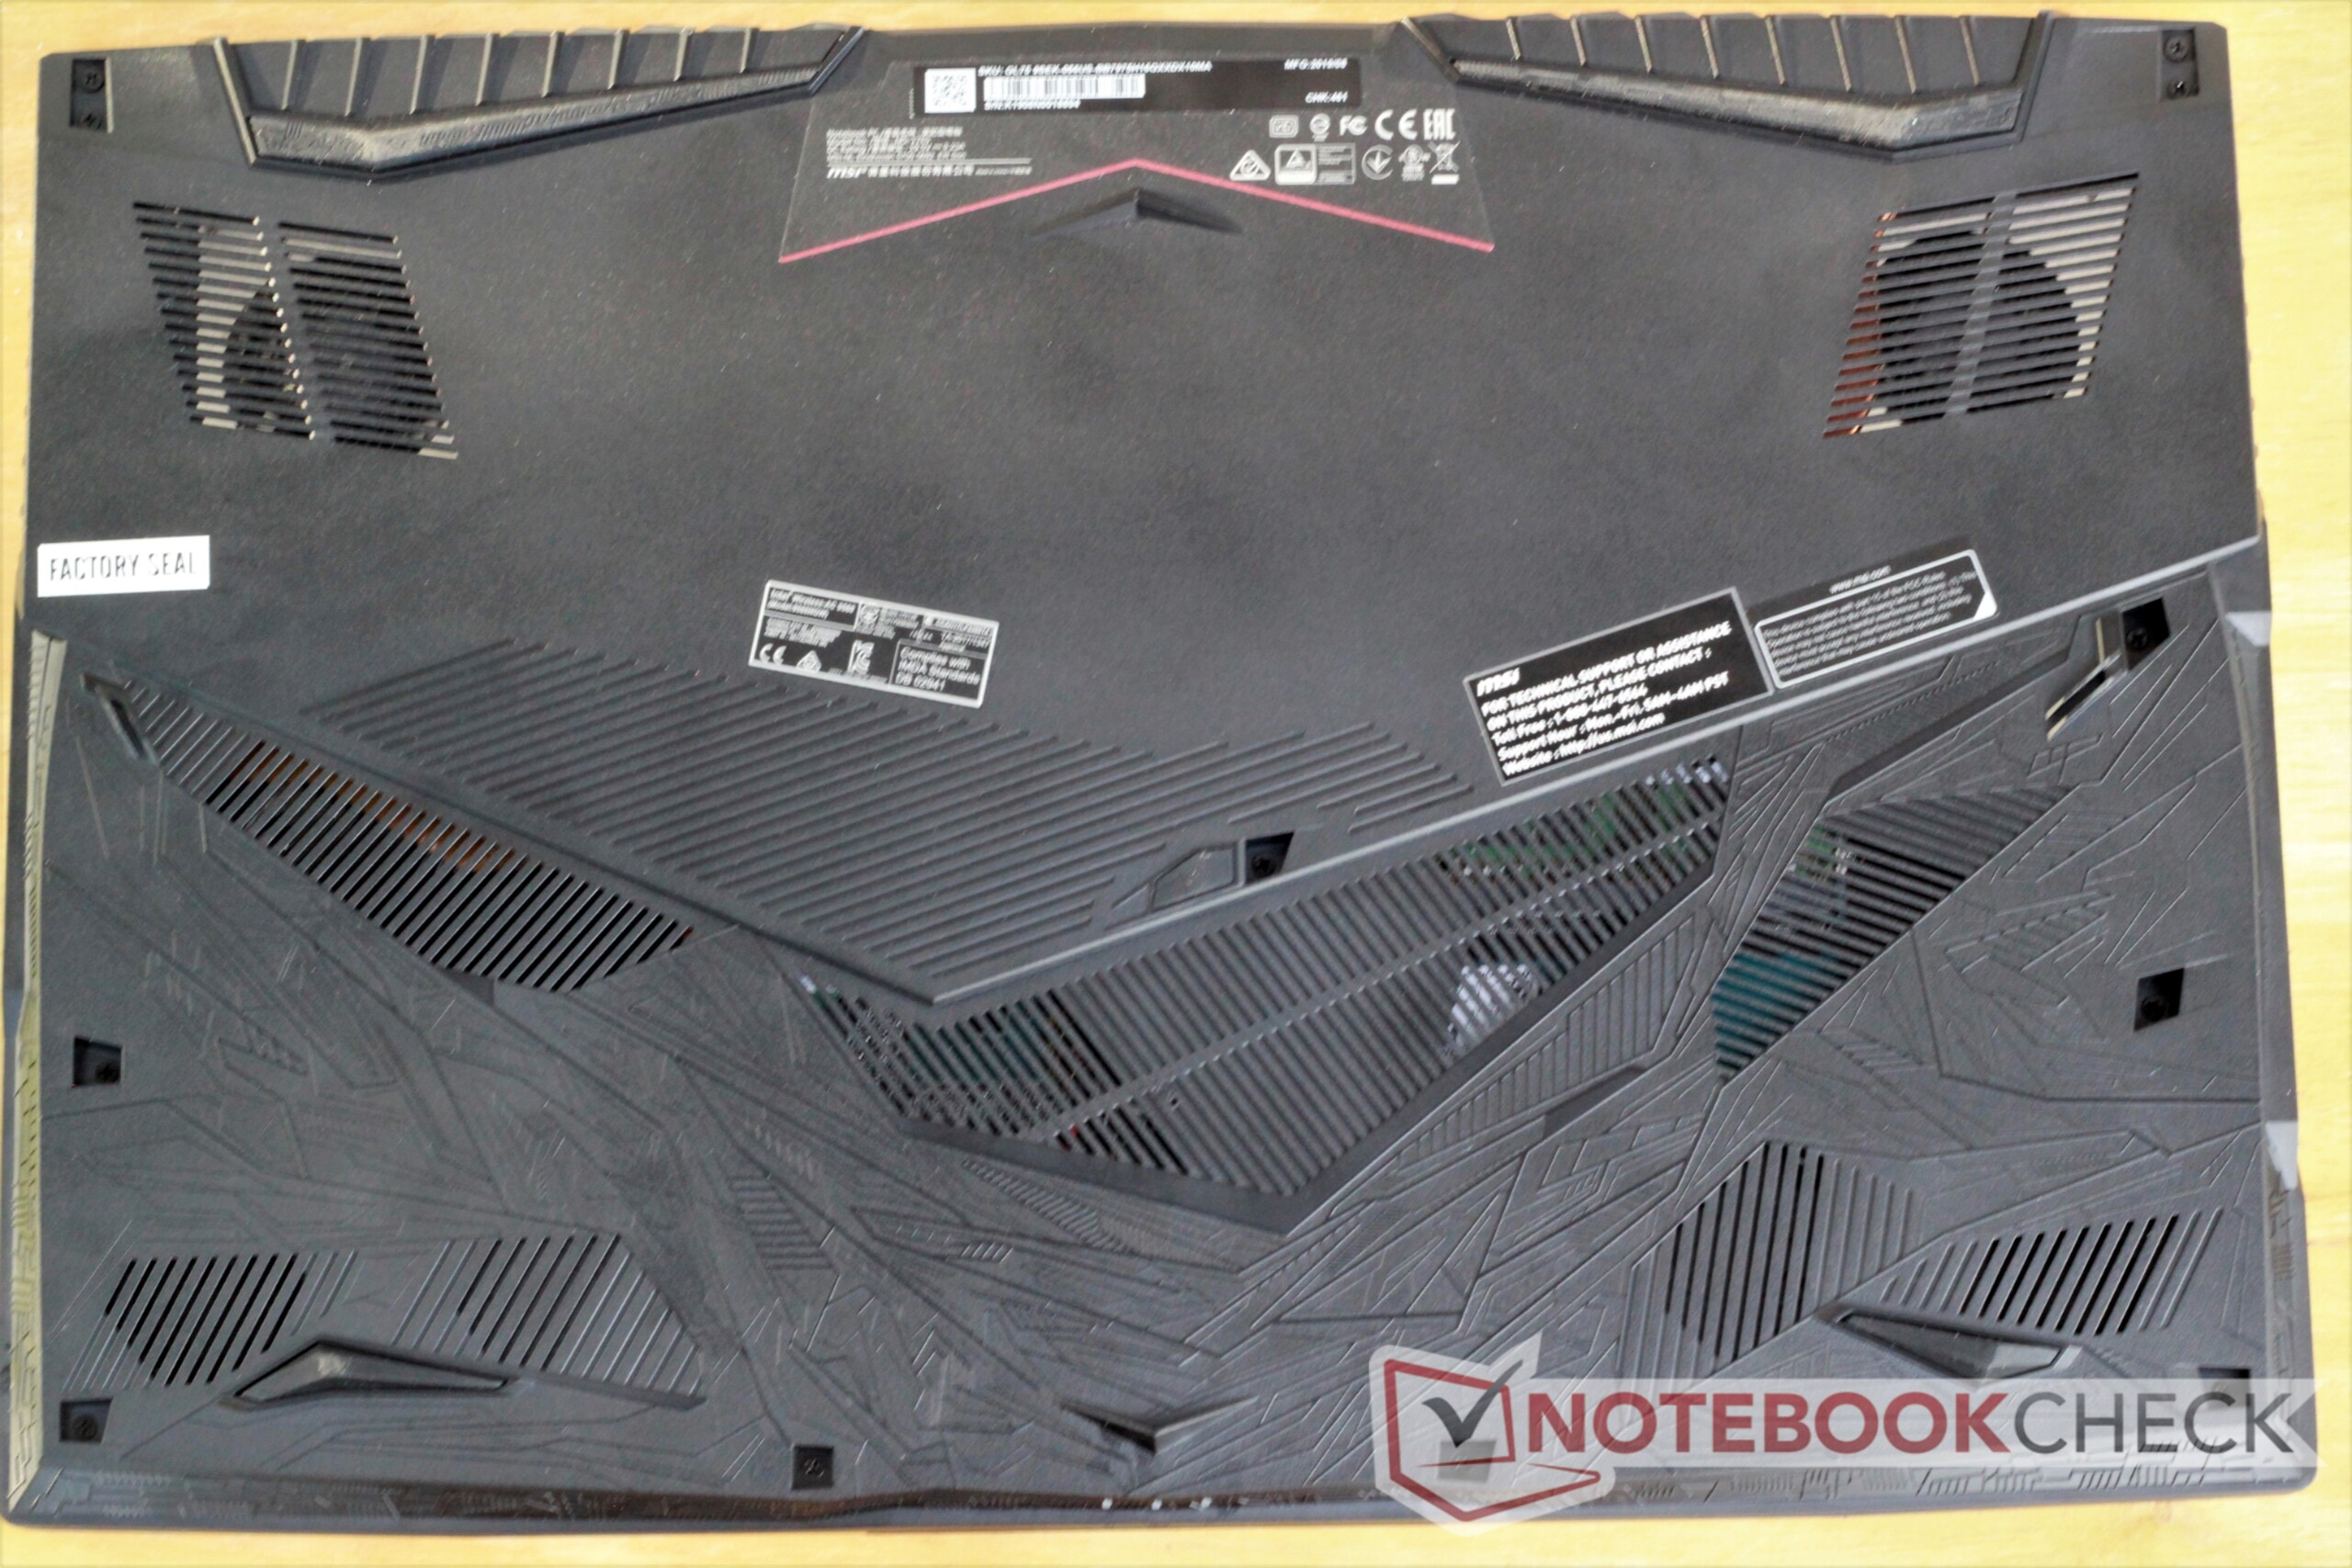
(-) Den maximala temperaturen på ovansidan är 49.4 °C / 121 F, jämfört med genomsnittet av 40.4 °C / 105 F , allt från 21.2 till 68.8 °C för klassen Gaming.
(-) Botten värms upp till maximalt 50.6 °C / 123 F, jämfört med genomsnittet av 43.2 °C / 110 F
(±) Vid tomgångsbruk är medeltemperaturen för ovansidan 35 °C / 95 F, jämfört med enhetsgenomsnittet på 33.9 °C / ### class_avg_f### F.
(-) När du spelar The Witcher 3 är medeltemperaturen för ovansidan 39.2 °C / 103 F, jämfört med enhetsgenomsnittet på 33.9 °C / ## #class_avg_f### F.
(+) Handledsstöden och pekplattan är kallare än hudtemperaturen med maximalt 31.6 °C / 88.9 F och är därför svala att ta på.
(-) Medeltemperaturen för handledsstödsområdet på liknande enheter var 28.8 °C / 83.8 F (-2.8 °C / -5.1 F).
MSI GL75 9SEK-056US ljudanalys
(±) | högtalarljudstyrkan är genomsnittlig men bra (81.7 dB)
Bas 100 - 315 Hz
(-) | nästan ingen bas - i genomsnitt 19% lägre än medianen
(±) | linjäriteten för basen är genomsnittlig (10.3% delta till föregående frekvens)
Mellan 400 - 2000 Hz
(+) | balanserad mellan - endast 2.9% från medianen
(+) | mids är linjära (6.7% delta till föregående frekvens)
Högsta 2 - 16 kHz
(+) | balanserade toppar - endast 1.5% från medianen
(+) | toppar är linjära (3.4% delta till föregående frekvens)
Totalt 100 - 16 000 Hz
(+) | det totala ljudet är linjärt (14.5% skillnad mot median)
Jämfört med samma klass
» 27% av alla testade enheter i den här klassen var bättre, 7% liknande, 66% sämre
» Den bästa hade ett delta på 6%, genomsnittet var 18%, sämst var 132%
Jämfört med alla testade enheter
» 18% av alla testade enheter var bättre, 4% liknande, 78% sämre
» Den bästa hade ett delta på 4%, genomsnittet var 24%, sämst var 134%
Asus Strix Hero III G731GV ljudanalys
(±) | högtalarljudstyrkan är genomsnittlig men bra (81 dB)
Bas 100 - 315 Hz
(±) | reducerad bas - i genomsnitt 6.6% lägre än medianen
(±) | linjäriteten för basen är genomsnittlig (11.8% delta till föregående frekvens)
Mellan 400 - 2000 Hz
(+) | balanserad mellan - endast 2.8% från medianen
(+) | mids är linjära (6.7% delta till föregående frekvens)
Högsta 2 - 16 kHz
(+) | balanserade toppar - endast 1.8% från medianen
(+) | toppar är linjära (5.4% delta till föregående frekvens)
Totalt 100 - 16 000 Hz
(+) | det totala ljudet är linjärt (13.4% skillnad mot median)
Jämfört med samma klass
» 19% av alla testade enheter i den här klassen var bättre, 7% liknande, 74% sämre
» Den bästa hade ett delta på 6%, genomsnittet var 18%, sämst var 132%
Jämfört med alla testade enheter
» 14% av alla testade enheter var bättre, 4% liknande, 83% sämre
» Den bästa hade ett delta på 4%, genomsnittet var 24%, sämst var 134%
HP Omen 17t-3AW55AV_1 ljudanalys
(±) | högtalarljudstyrkan är genomsnittlig men bra (72.8 dB)
Bas 100 - 315 Hz
(-) | nästan ingen bas - i genomsnitt 17.6% lägre än medianen
(±) | linjäriteten för basen är genomsnittlig (14.3% delta till föregående frekvens)
Mellan 400 - 2000 Hz
(+) | balanserad mellan - endast 2% från medianen
(+) | mids är linjära (5.2% delta till föregående frekvens)
Högsta 2 - 16 kHz
(+) | balanserade toppar - endast 2.4% från medianen
(+) | toppar är linjära (6.5% delta till föregående frekvens)
Totalt 100 - 16 000 Hz
(±) | linjäriteten för det totala ljudet är genomsnittlig (16% skillnad mot median)
Jämfört med samma klass
» 38% av alla testade enheter i den här klassen var bättre, 6% liknande, 55% sämre
» Den bästa hade ett delta på 6%, genomsnittet var 18%, sämst var 132%
Jämfört med alla testade enheter
» 25% av alla testade enheter var bättre, 5% liknande, 70% sämre
» Den bästa hade ett delta på 4%, genomsnittet var 24%, sämst var 134%
| Av/Standby | |
| Låg belastning | |
| Hög belastning |
|
Förklaring:
min: | |
| MSI GL75 9SEK-056US i7-9750H, GeForce RTX 2060 Mobile, WDC PC SN520 SDAPNUW-512G, IPS, 1920x1080, 17.3" | Asus Strix Hero III G731GV i7-9750H, GeForce RTX 2060 Mobile, Intel SSD 660p SSDPEKNW512G8, IPS, 1920x1080, 17.3" | MSI GL73 8SE-010US i7-8750H, GeForce RTX 2060 Mobile, Kingston RBUSNS8154P3128GJ, TN LED, 1920x1080, 17.3" | Acer Predator Helios 500 PH517-51-79BY i7-8750H, GeForce GTX 1070 Mobile, SK hynix SSD Canvas SC300 HFS256GD9MNE-6200A, IPS, 1920x1080, 17.3" | HP Omen 17t-3AW55AV_1 i7-8750H, GeForce GTX 1070 Mobile, Samsung SSD PM981 MZVLB512HAJQ, IPS, 1920x1080, 17.3" | HP Omen 15-dc1020ng i5-9300H, GeForce GTX 1650 Mobile, WDC PC SN720 SDAQNTW-512G, IPS, 1920x1080, 15.6" | HP Pavilion Gaming 17-cd0085cl i7-9750H, GeForce GTX 1660 Ti Max-Q, Samsung SSD PM981 MZVLB256HAHQ, IPS, 1920x1080, 17.3" | |
|---|---|---|---|---|---|---|---|
| Power Consumption | -37% | 4% | -58% | -37% | 38% | 26% | |
| Idle Minimum * (Watt) | 10.7 | 16.2 -51% | 8.8 18% | 20.4 -91% | 17.8 -66% | 4.04 62% | 5.4 50% |
| Idle Average * (Watt) | 15.2 | 24.8 -63% | 16.2 -7% | 26.5 -74% | 24.7 -63% | 7.2 53% | 9.2 39% |
| Idle Maximum * (Watt) | 17.8 | 28.6 -61% | 18.3 -3% | 37 -108% | 29.6 -66% | 11.4 36% | 13 27% |
| Load Average * (Watt) | 88.2 | 127.6 -45% | 86.1 2% | 129 -46% | 110 -25% | 80.8 8% | 85.9 3% |
| Witcher 3 ultra * (Watt) | 147.8 | 147.1 -0% | 146.7 1% | 186 -26% | 167.8 -14% | 93.6 37% | 107.9 27% |
| Load Maximum * (Watt) | 206.5 | 212.7 -3% | 186.4 10% | 216 -5% | 178.6 14% | 144.5 30% | 182.2 12% |
* ... mindre är bättre
| MSI GL75 9SEK-056US i7-9750H, GeForce RTX 2060 Mobile, 51 Wh | MSI GL73 8SE-010US i7-8750H, GeForce RTX 2060 Mobile, 41 Wh | Acer Predator Helios 500 PH517-51-79BY i7-8750H, GeForce GTX 1070 Mobile, 72 Wh | HP Omen 17t-3AW55AV_1 i7-8750H, GeForce GTX 1070 Mobile, 86 Wh | HP Pavilion Gaming 17-cd0085cl i7-9750H, GeForce GTX 1660 Ti Max-Q, 52.5 Wh | Asus Strix Hero III G731GV i7-9750H, GeForce RTX 2060 Mobile, 66 Wh | |
|---|---|---|---|---|---|---|
| Batteridrifttid | -30% | -9% | 6% | 28% | 7% | |
| Reader / Idle (h) | 7.9 | 6.5 -18% | 4.2 -47% | 4.5 -43% | 11.6 47% | |
| WiFi v1.3 (h) | 4.2 | 2.8 -33% | 2.9 -31% | 4.2 0% | 5.7 36% | 4.5 7% |
| Load (h) | 1 | 0.6 -40% | 1.5 50% | 1.6 60% | 1 0% | |
| Witcher 3 ultra (h) | 1.1 |
För
Emot

Läs den fullständiga versionen av den här recensionen på engelska här.
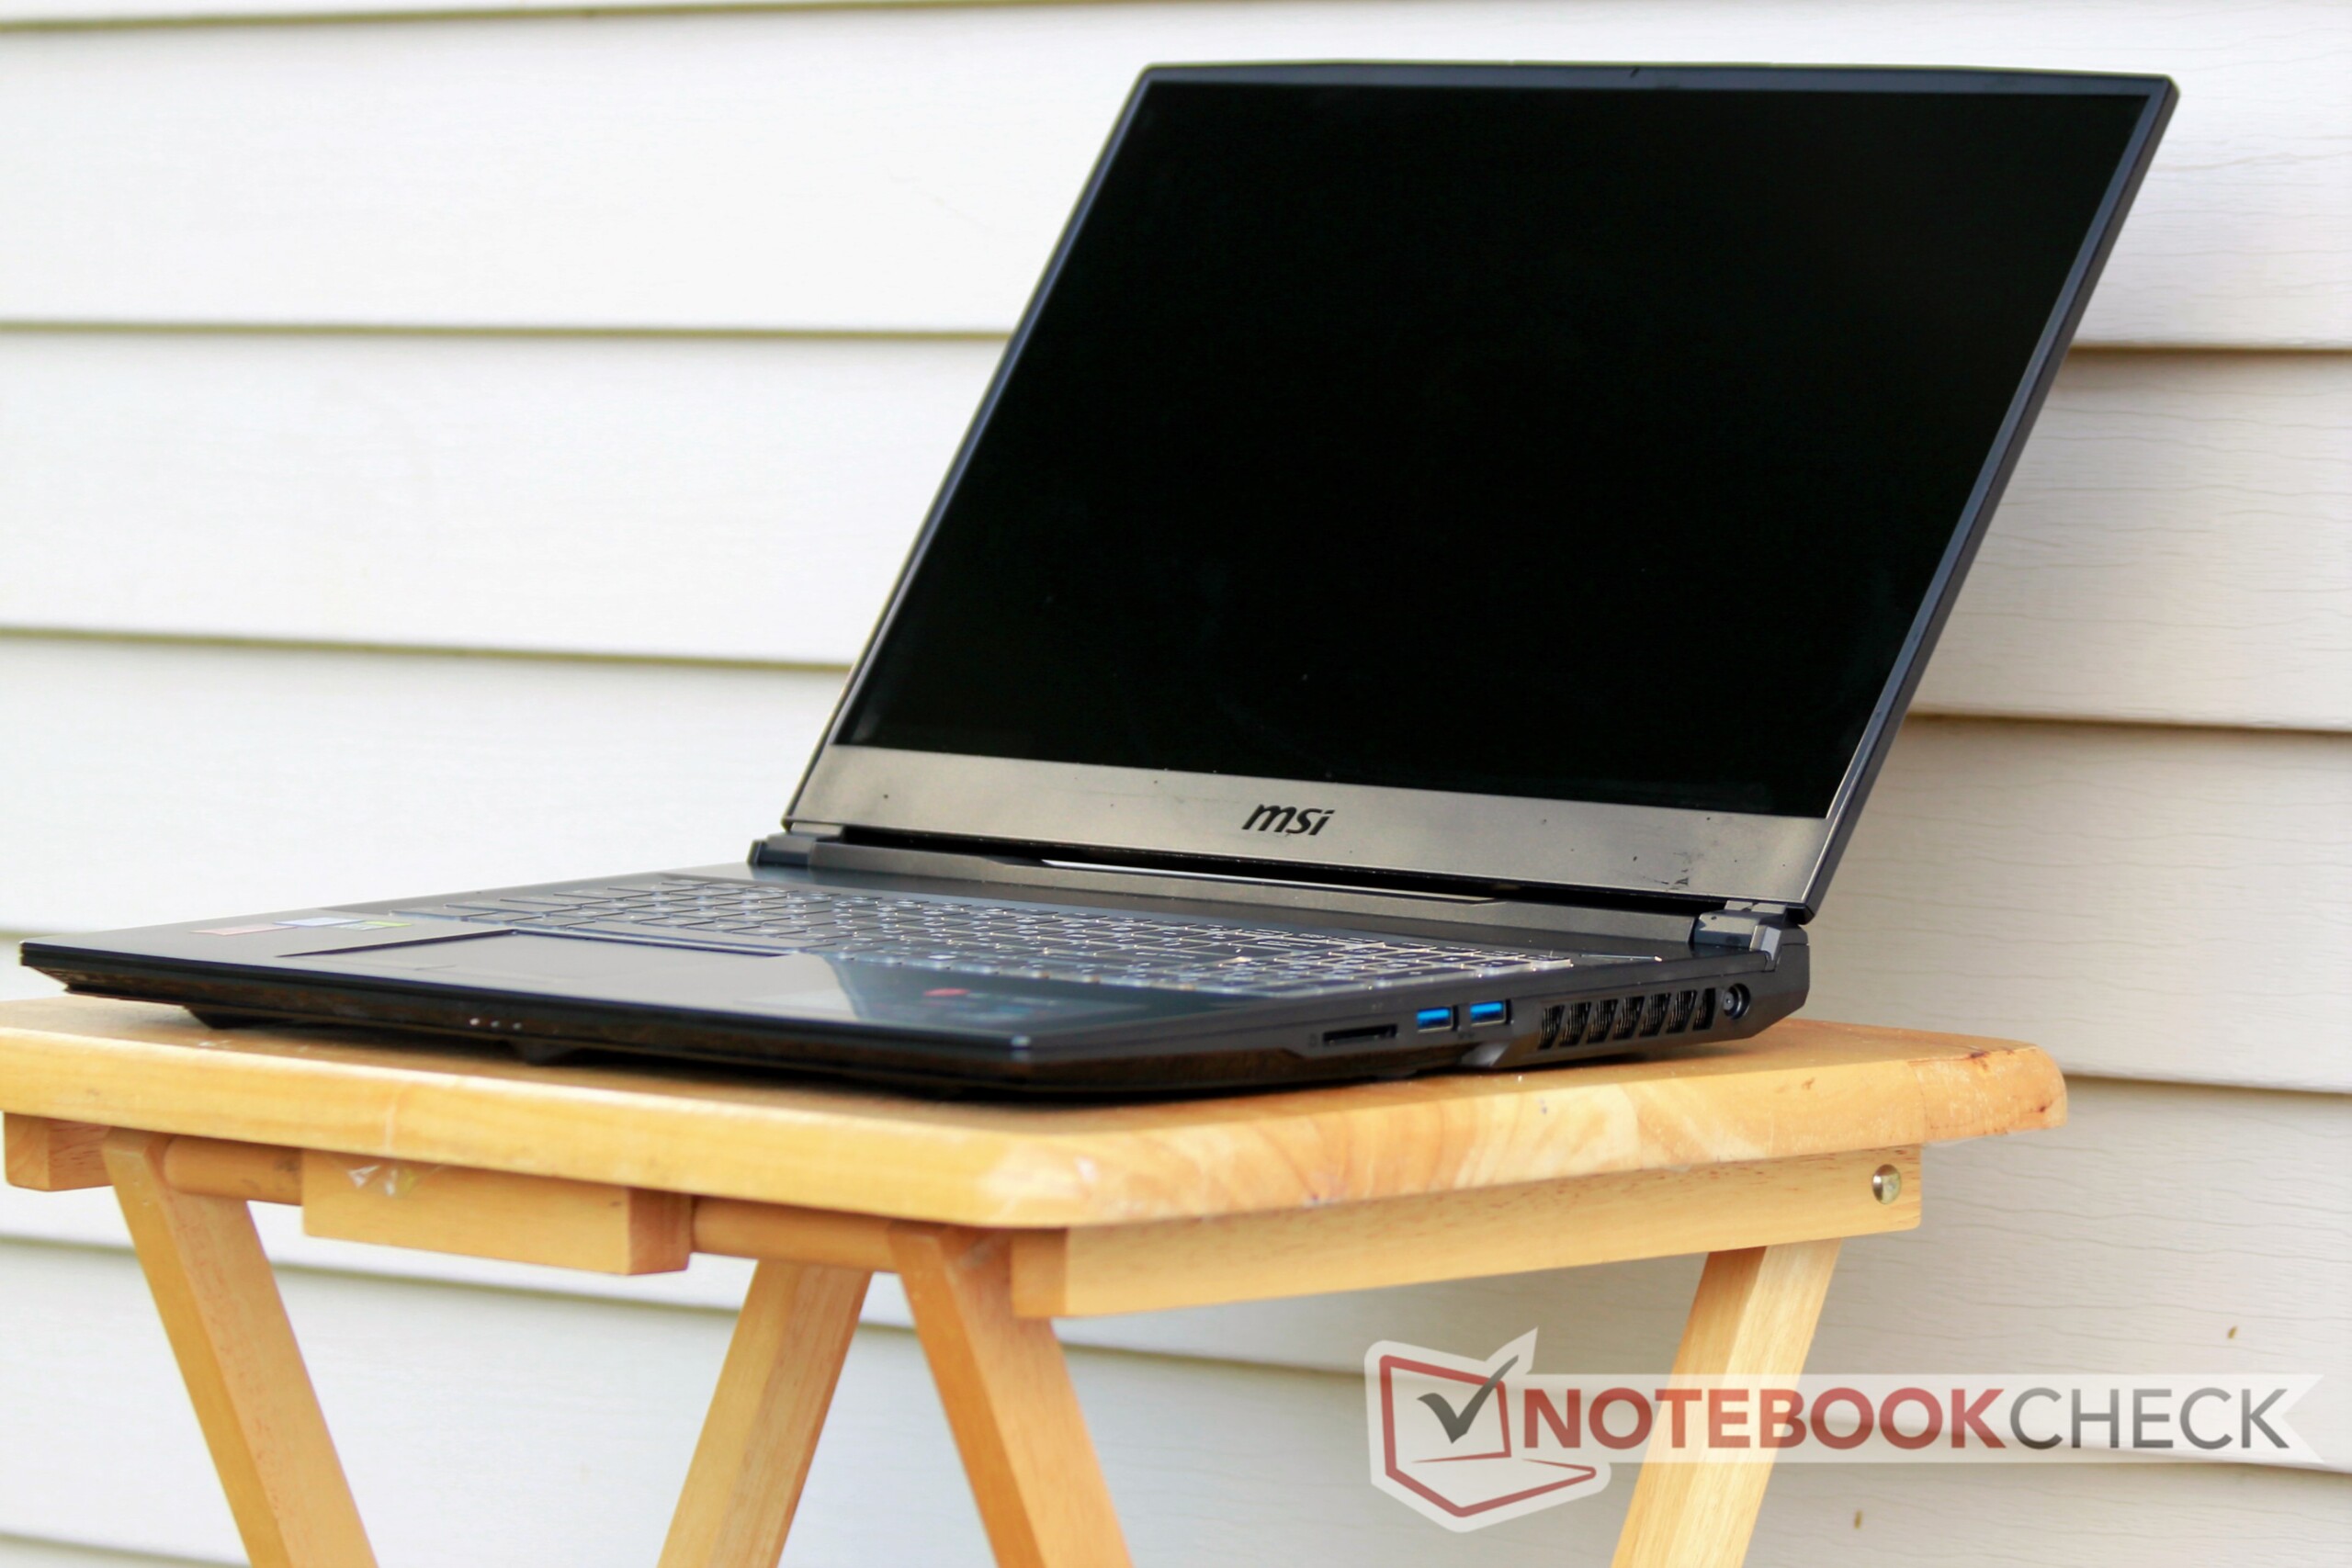
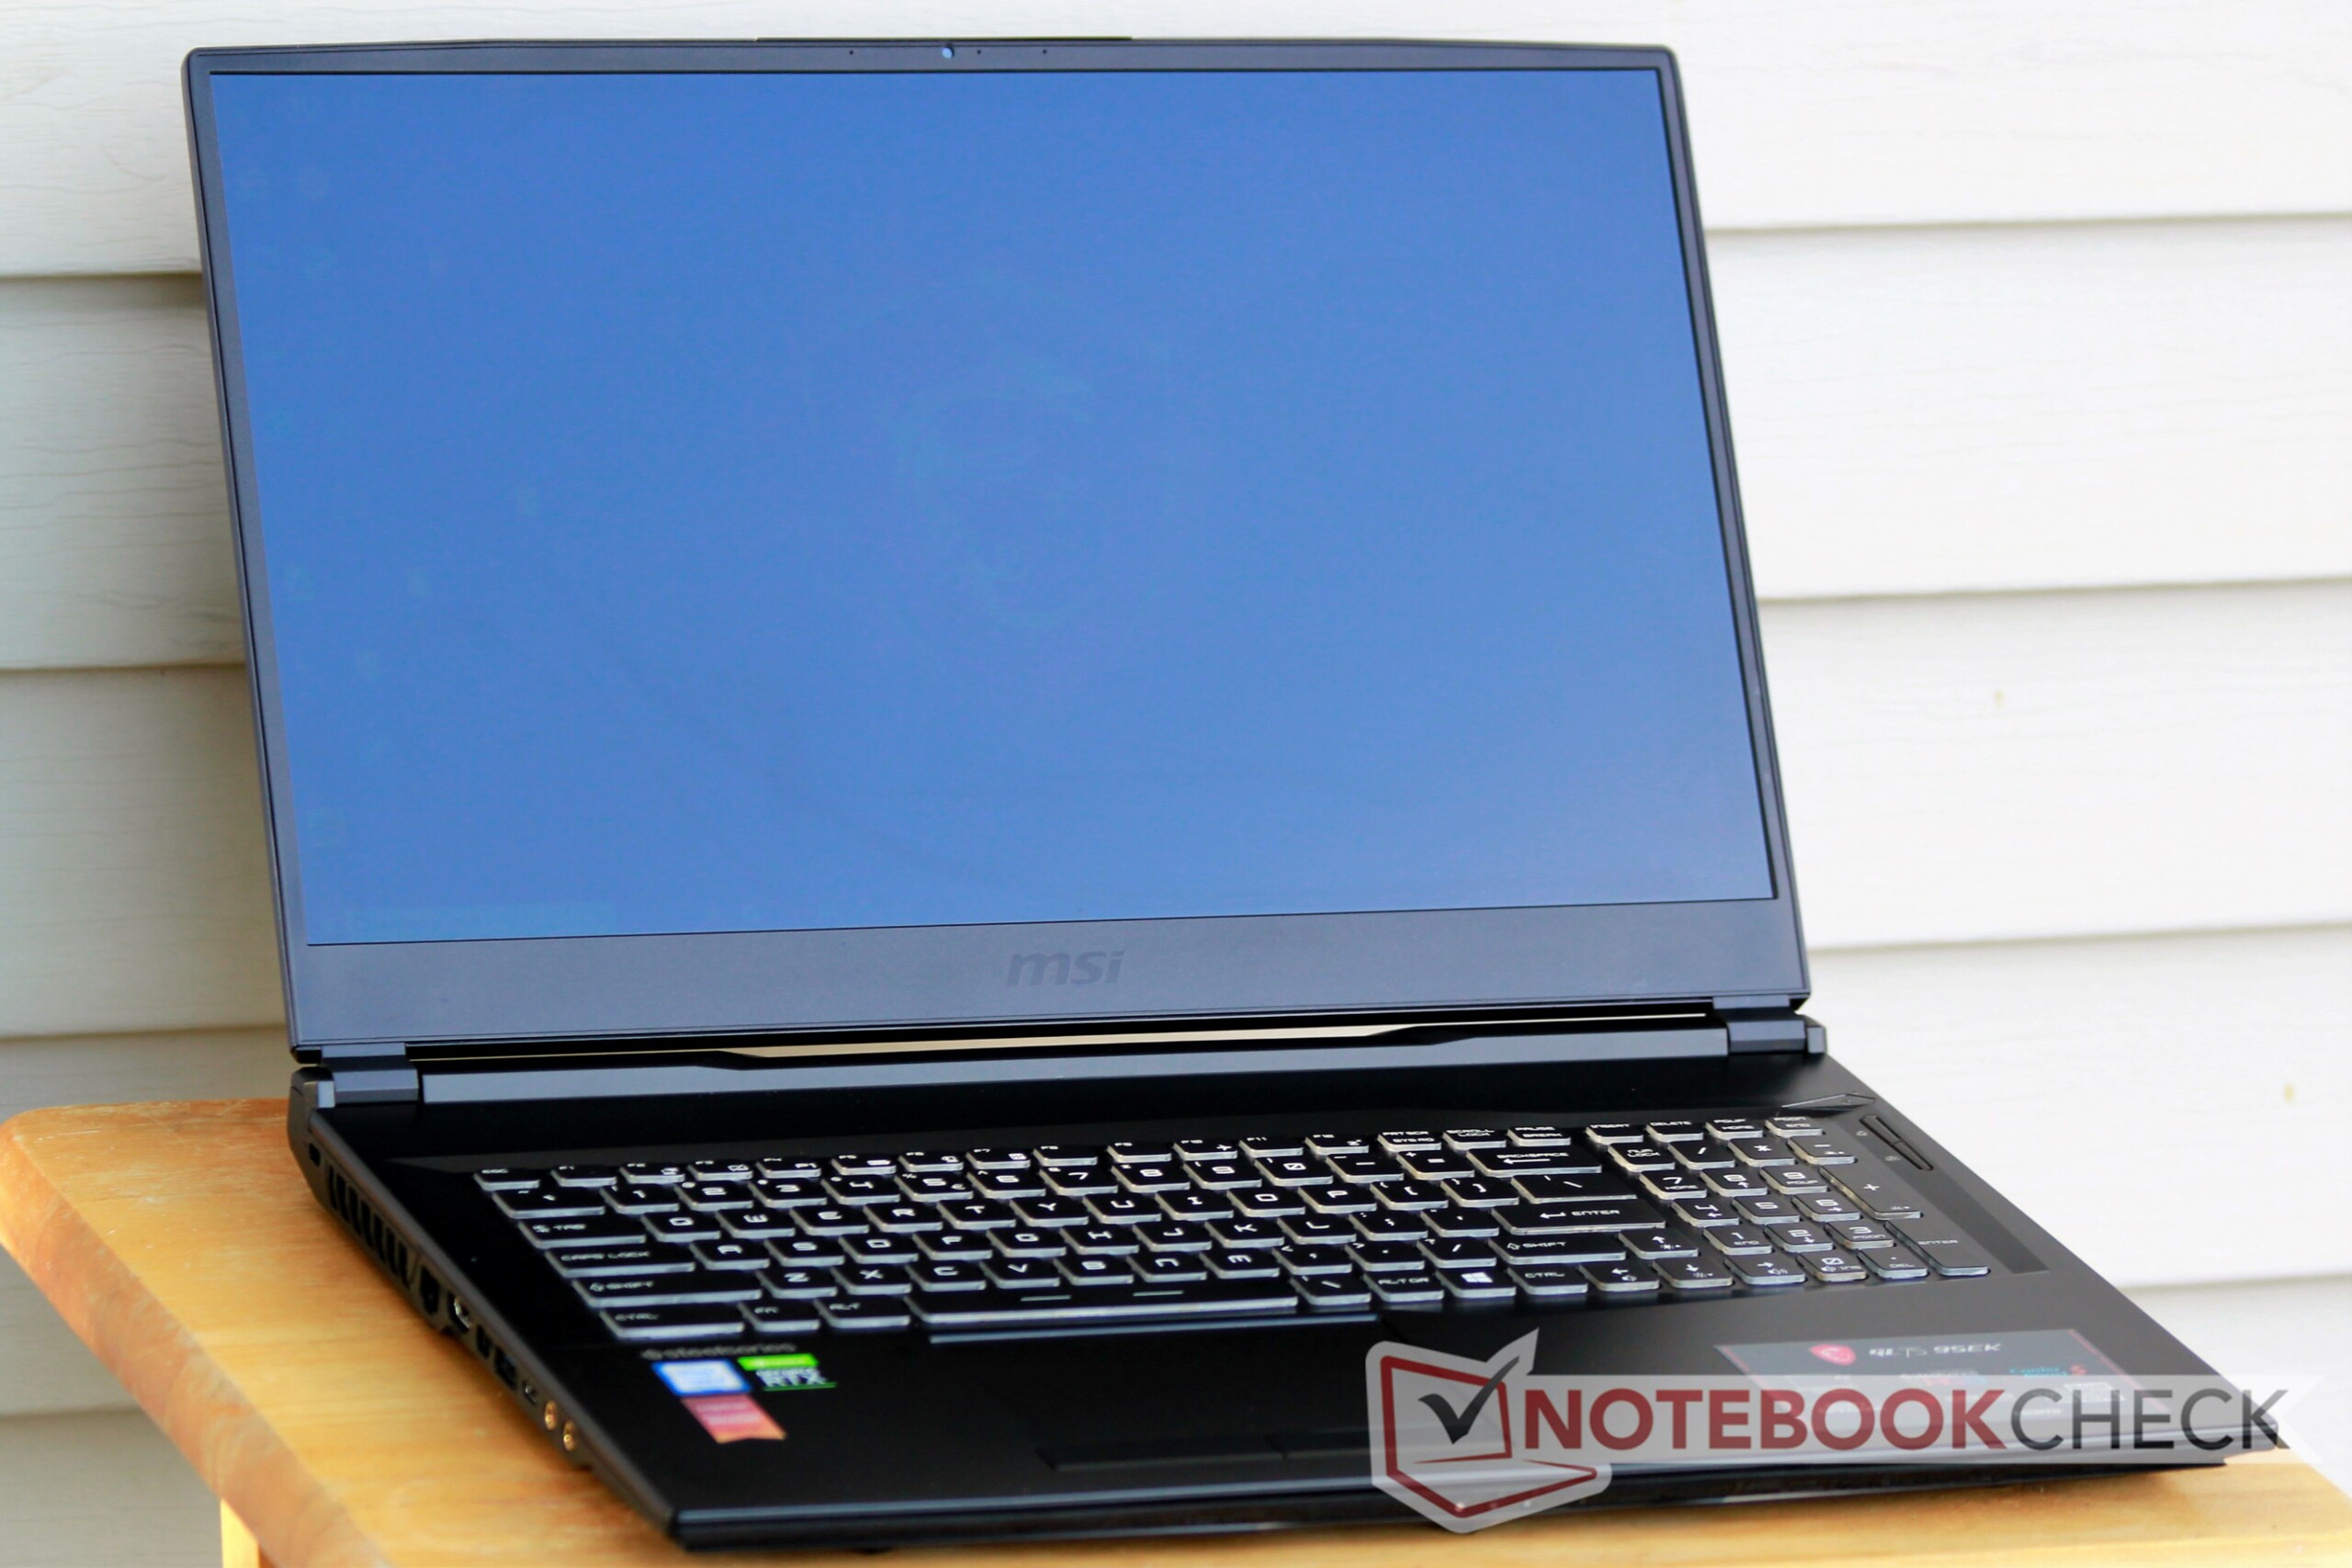
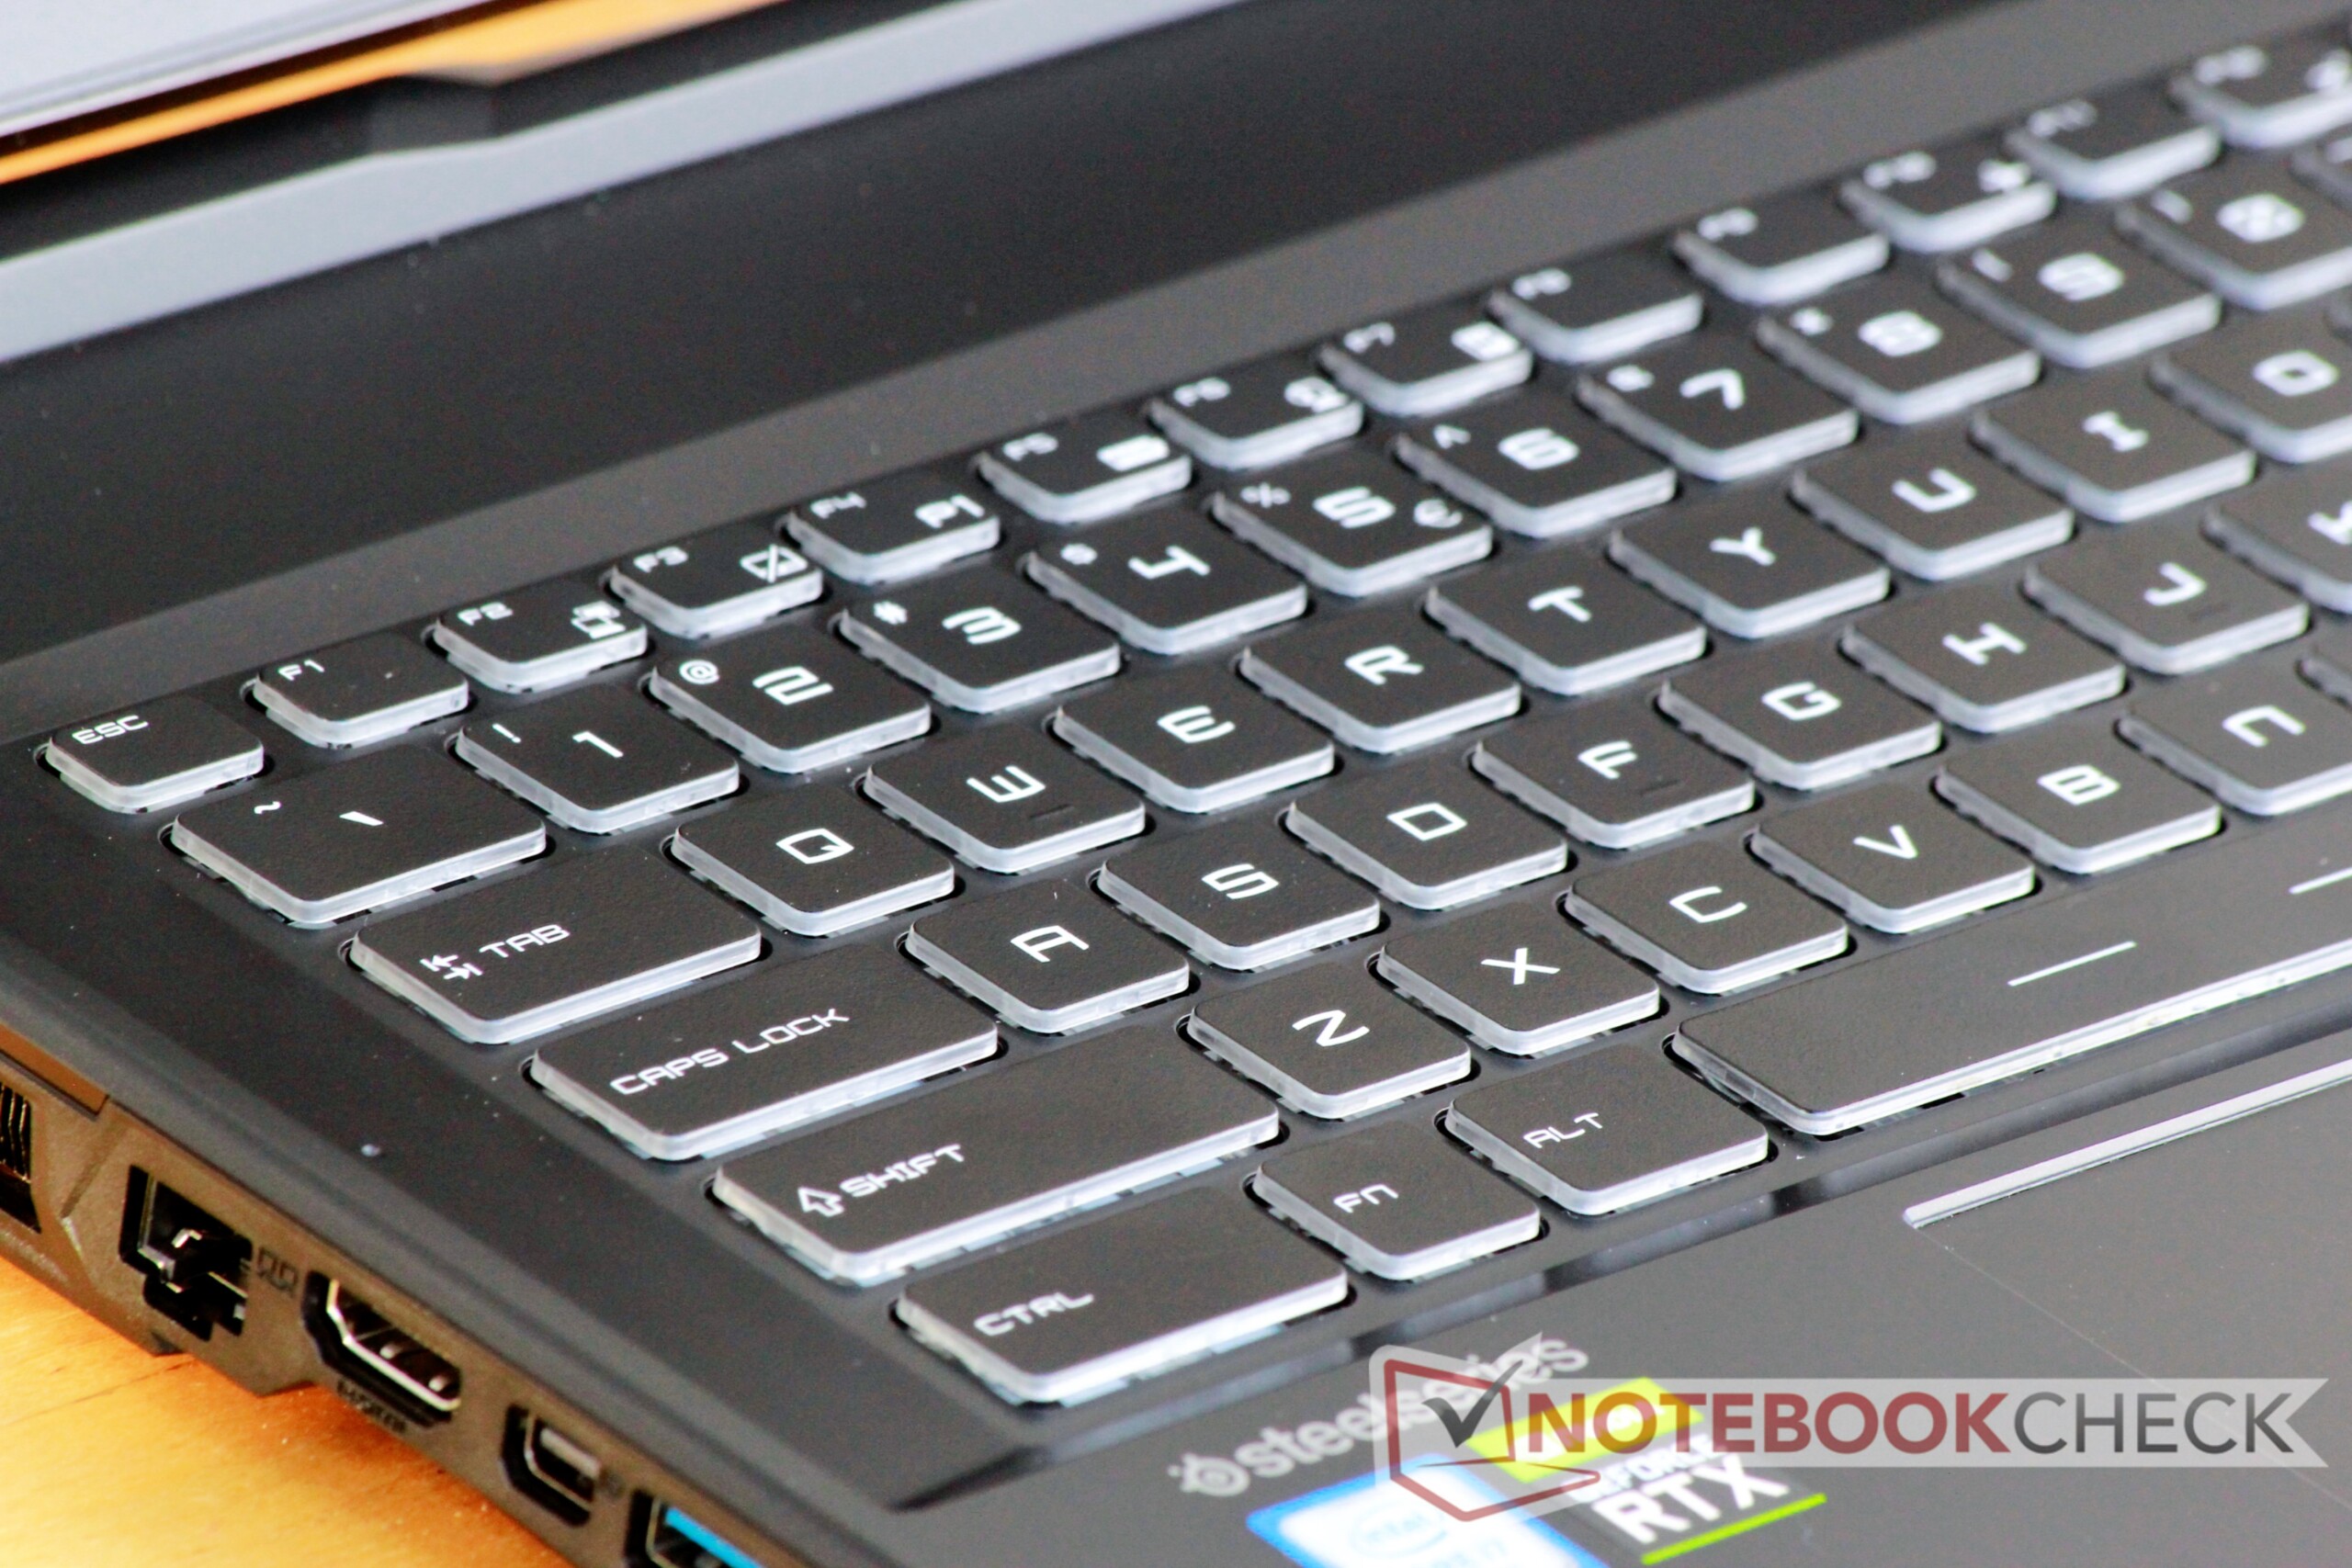
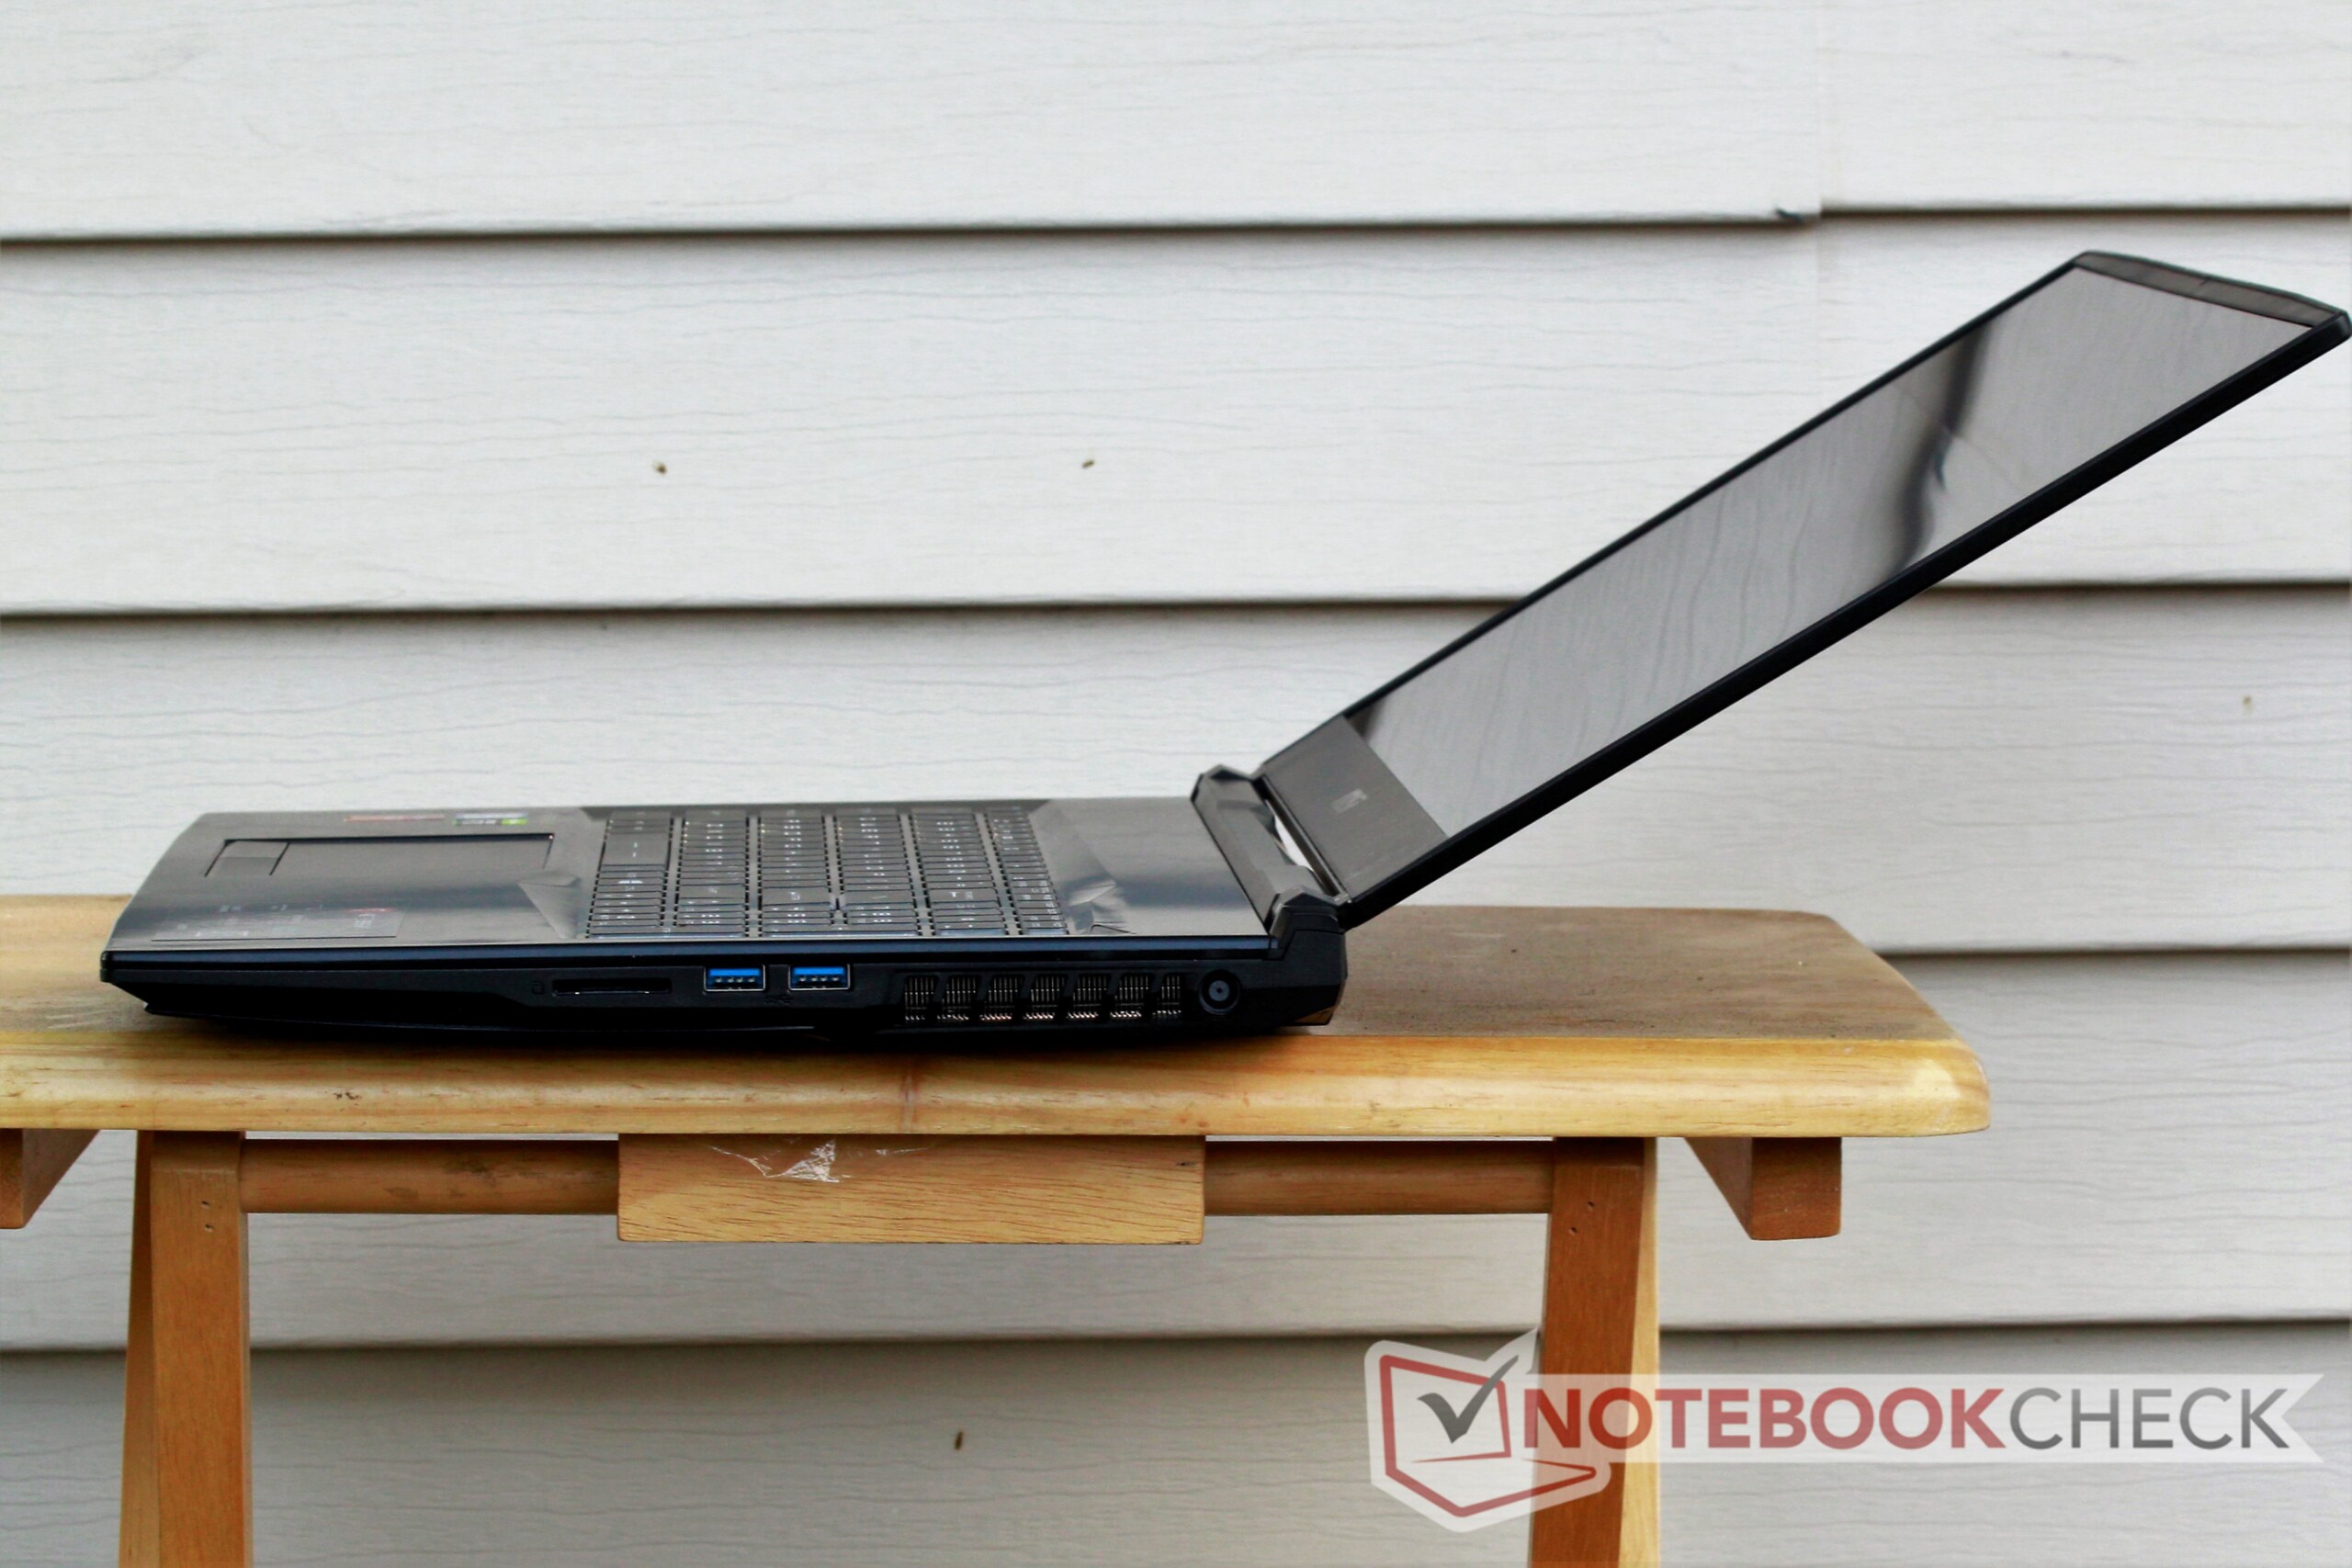
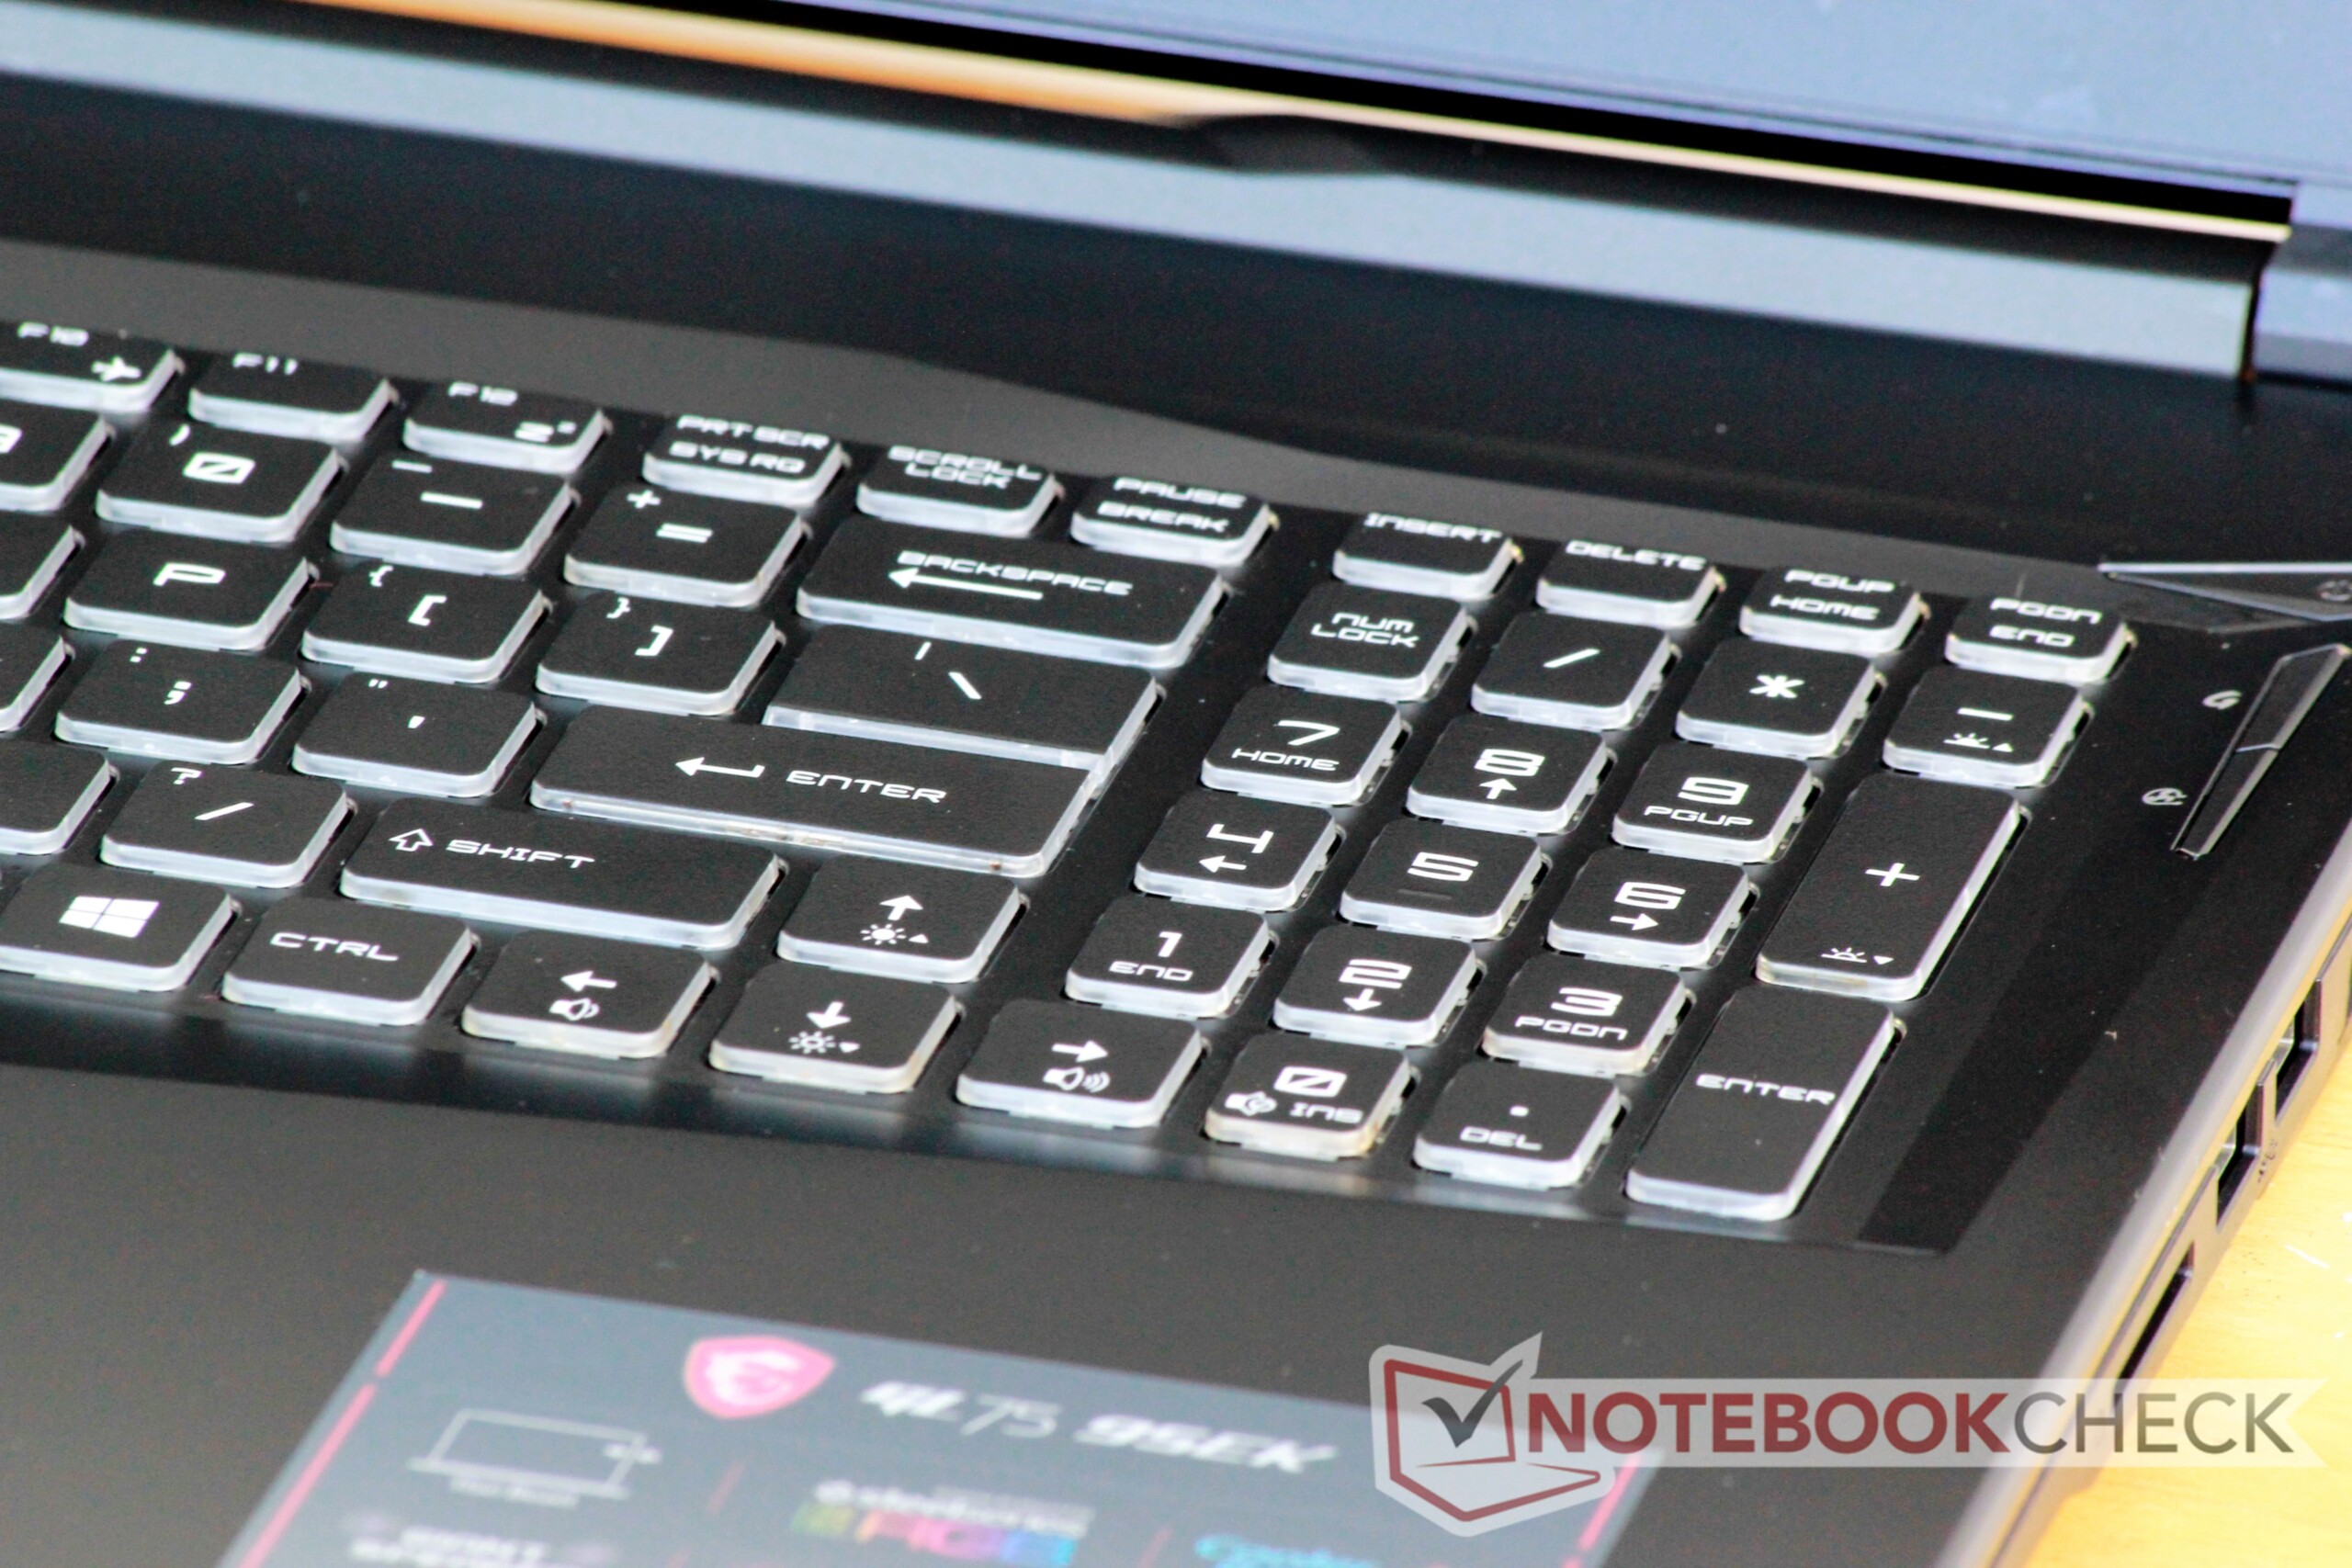
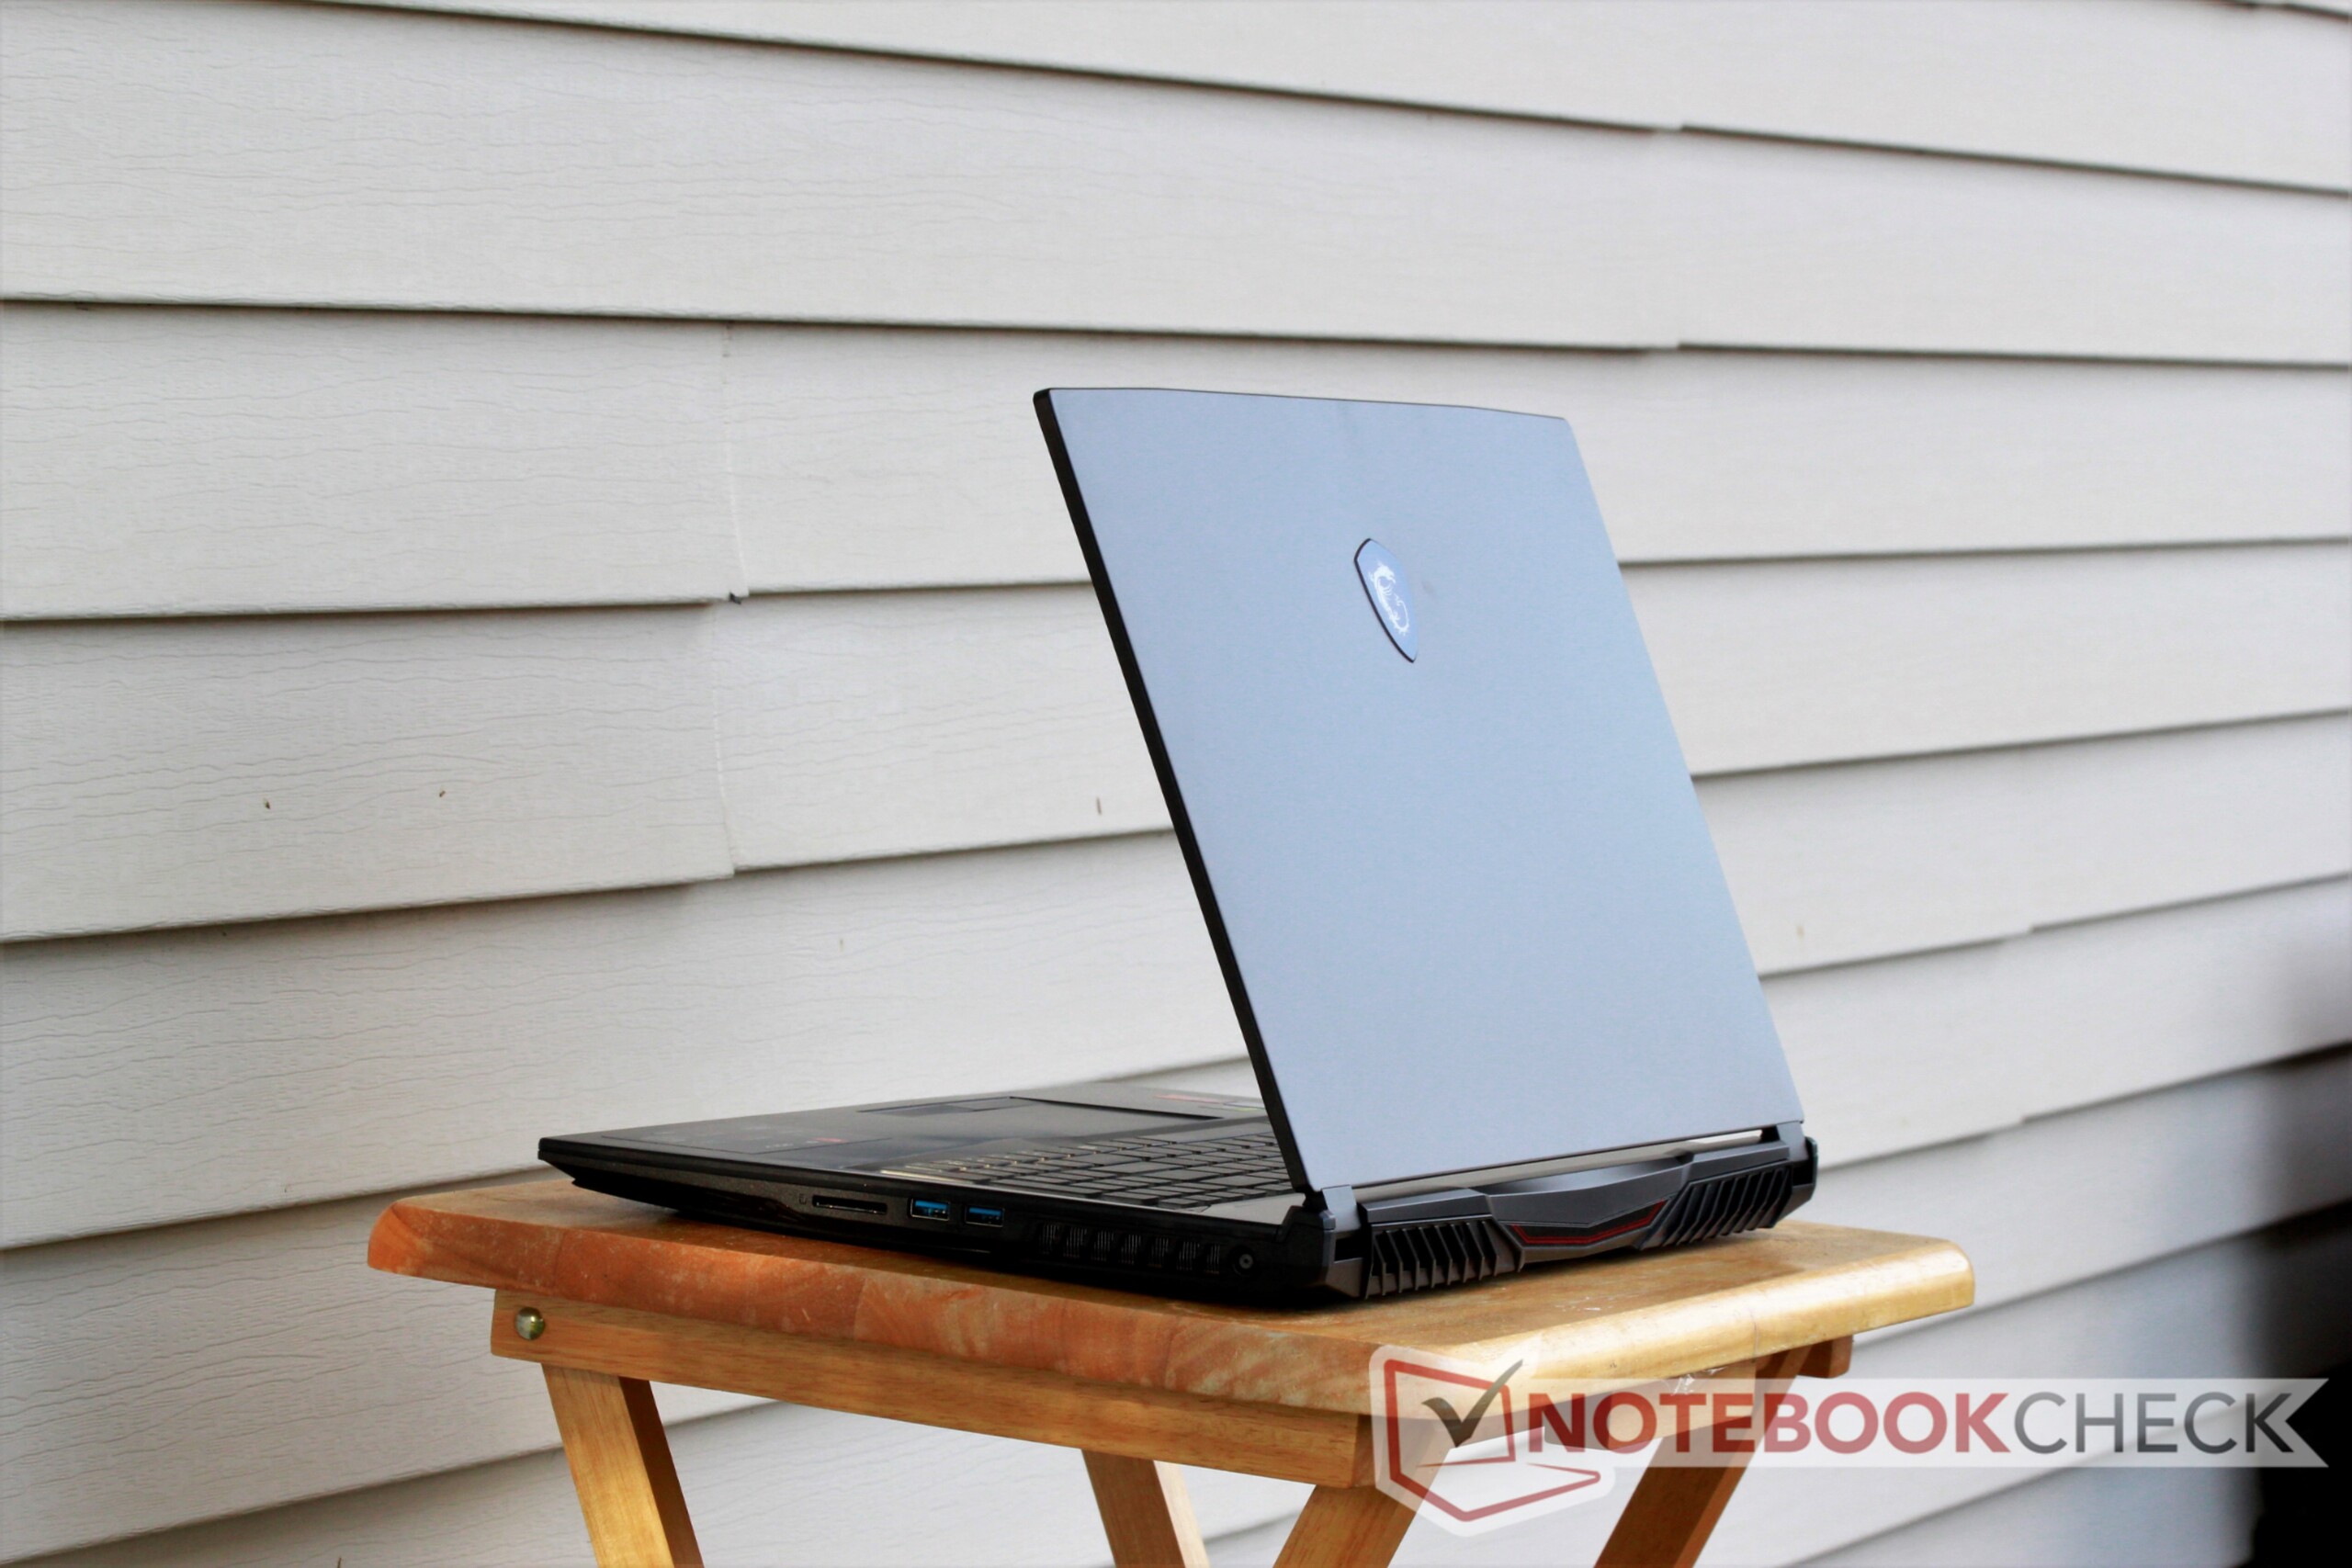
MSI GL75 är nog definitionen av en blandad kompott. För 15.000 kronor finns det förstås en hel del att gilla. Skärmens bilduppdateringsfrekvens på 120 Hz passar bra ihop med den kraftfulla hårdvaran vilket gör detta till en utmärkt maskin att spela spel i FHD på. Det utmärkta tangentbordet och den tangentspecifika RGB-belysningen är fantastiska tillägg för den här prisnivån och högtalarna gör det trevligt att ta del av multimedia.
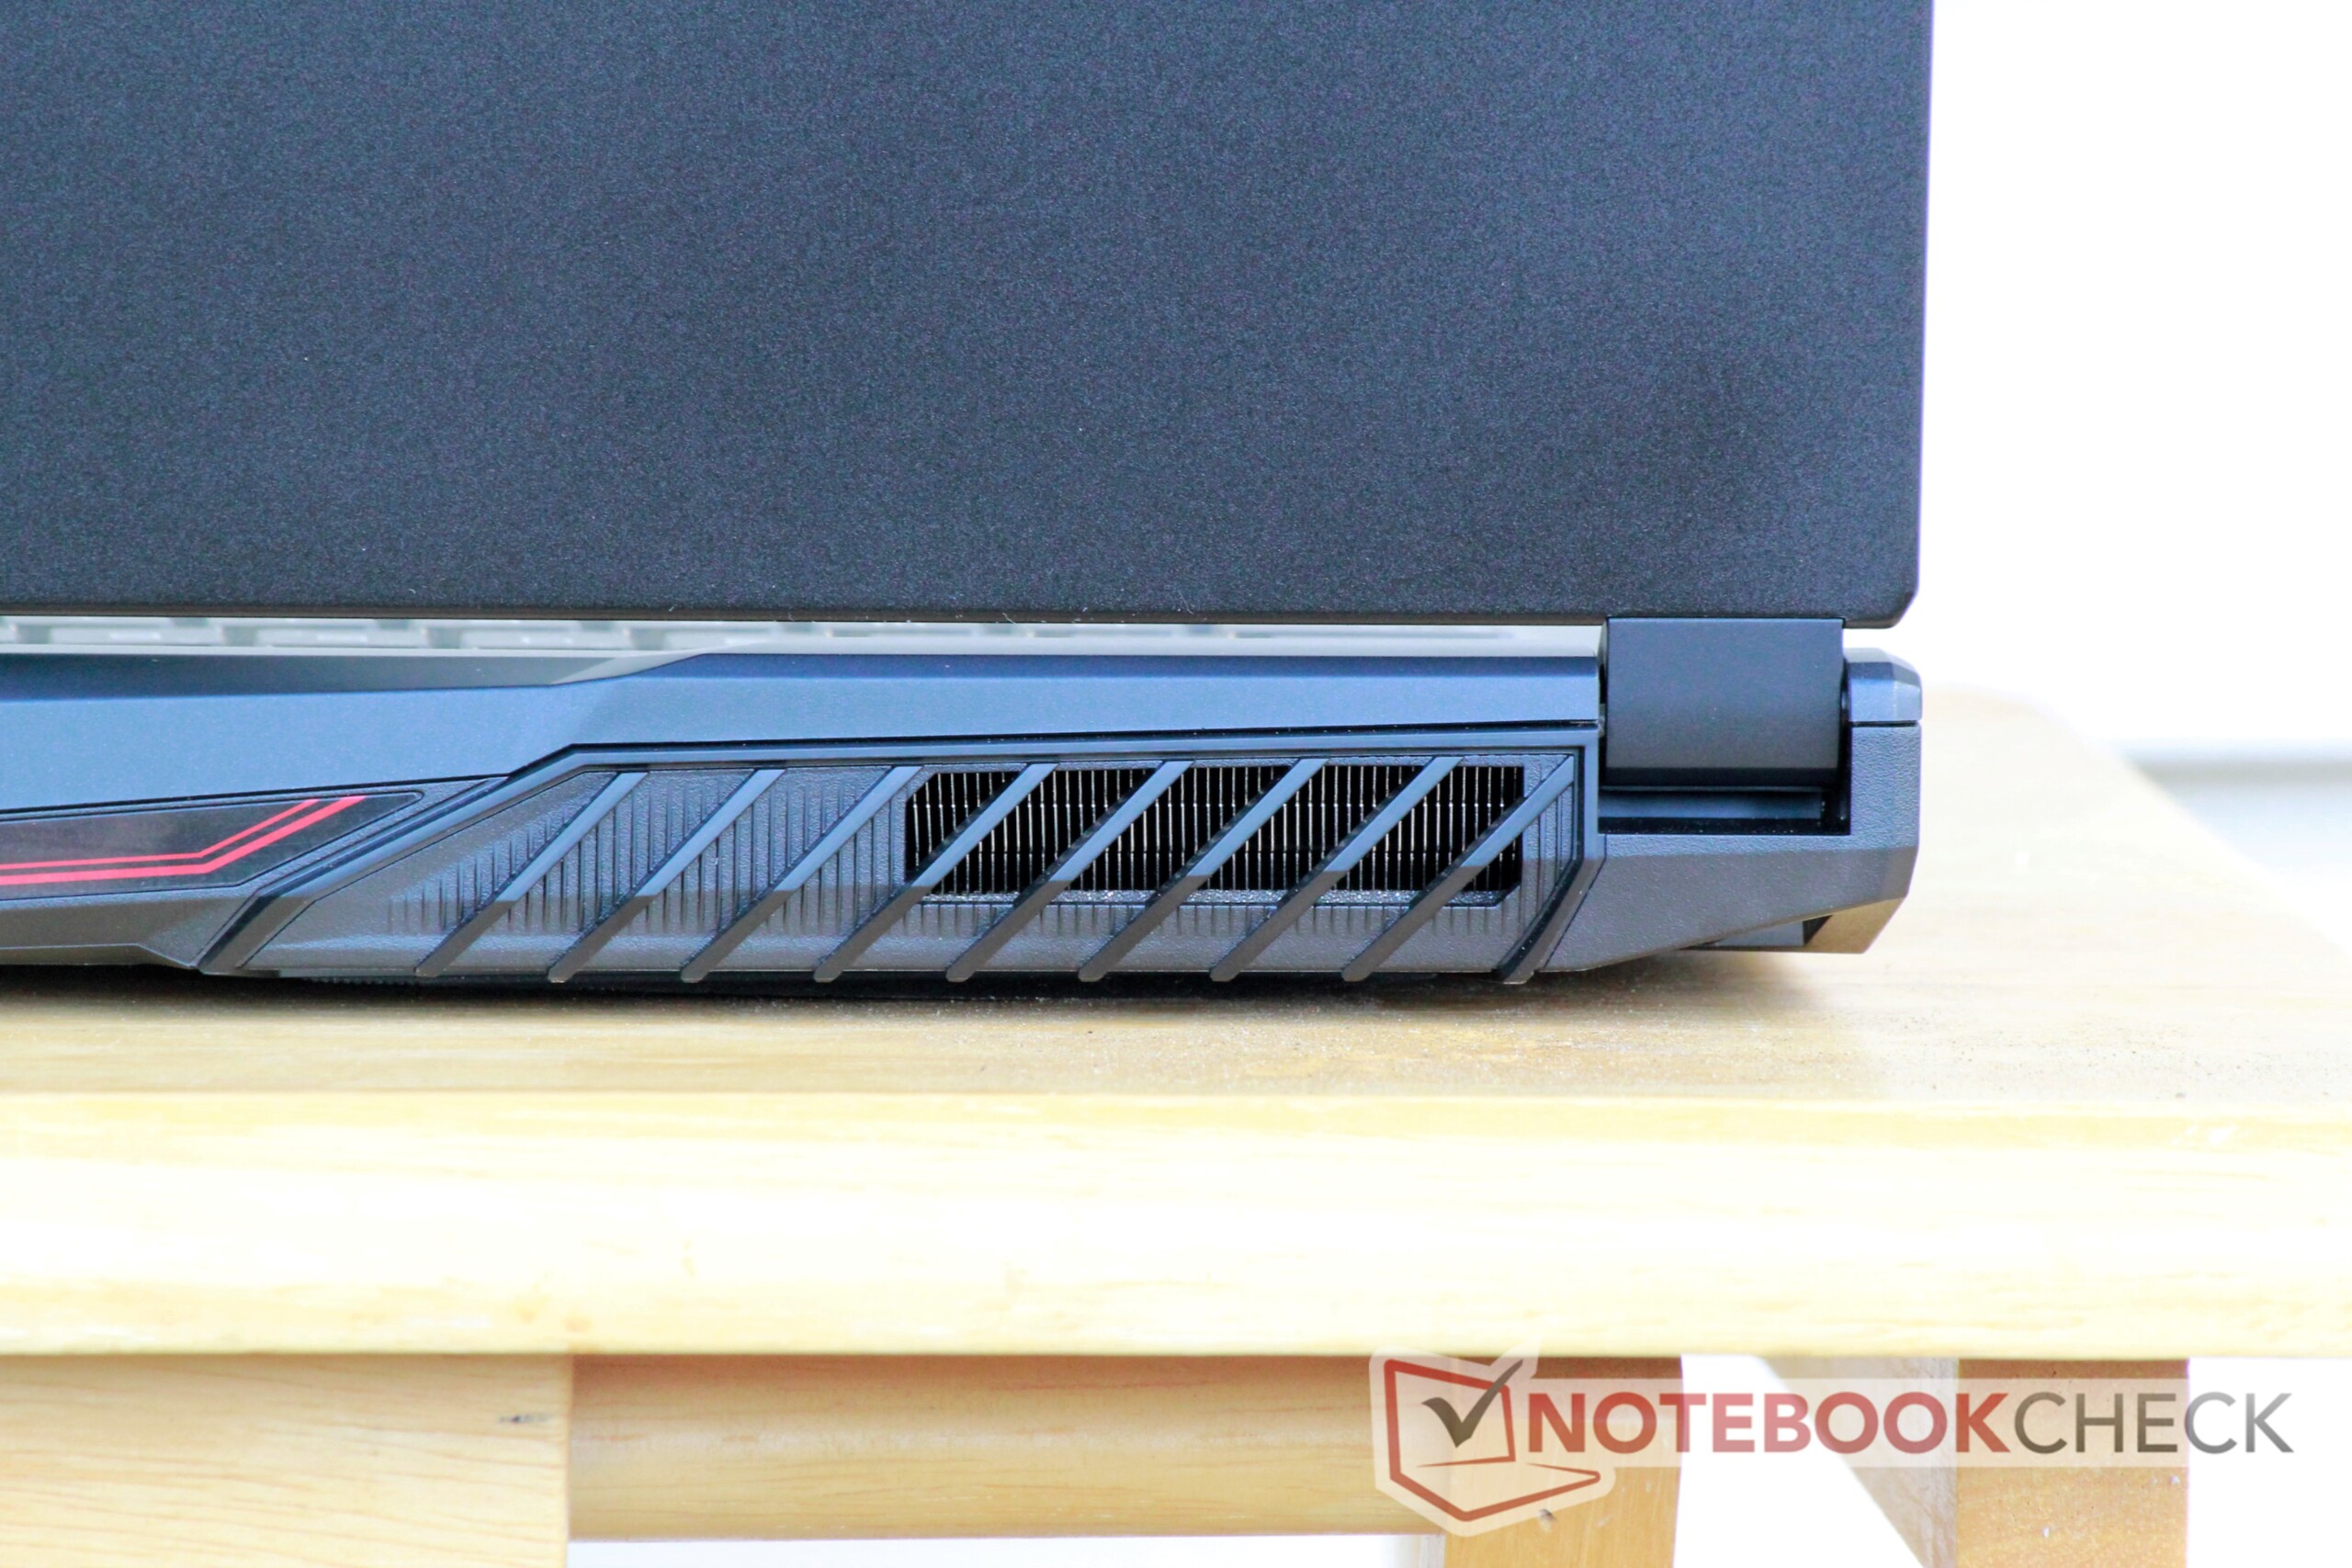
Men en del problem och irritationsmoment skadar datorn och hindrar den från att nå framgång. Fläktarna låter högt och varma områden längs chassits bas gör det obekvämt att ha datorn i knät. Dessutom är skärmens bakgrundsbelysning mörk och svag.
På grund av det kan intresserade köpare tänkas vilja ta en titt på konkurrenterna. Asus ROG Strix G GL731GU har mycket bättre konstruktionskvalitet, bättre värmehantering och fläktar med ett jämnare tonfall på bekostnad av aningen lägre grafikprestanda. MSI:s egna GP65 Leopard har liknande prestanda, samma tangentbord och en vida överlägsen skärm i ett mindre paket, men även den lider av varma områden och tjutande fläktar. Dessa enheter bevisar att man inte är utan alternativ på den här prisnivån, vilket dock gör valet en aning svårare.
För att sammanfatta så lyckas GL75 inte imponera. Det är en fin maskin, men om du inte behöver en spellaptop på 17.3 tum med ett bra RGB-tangentbord och starka högtalare så finns det bättre alternativ.
MSI GL75 9SEK-056US
- 09/30/2019 v7 (old)
Sam Medley
Price comparison
