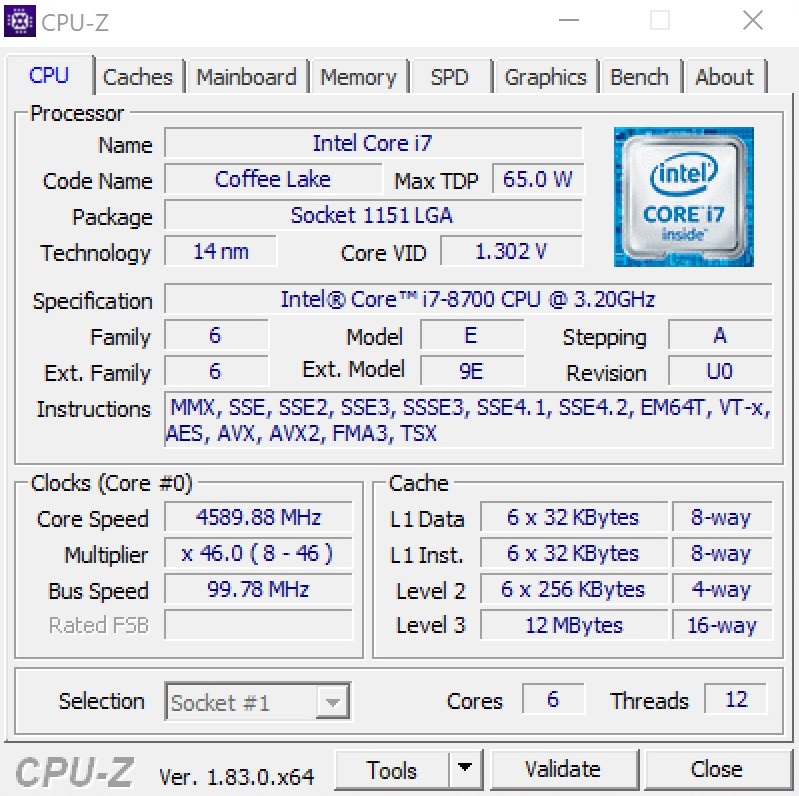
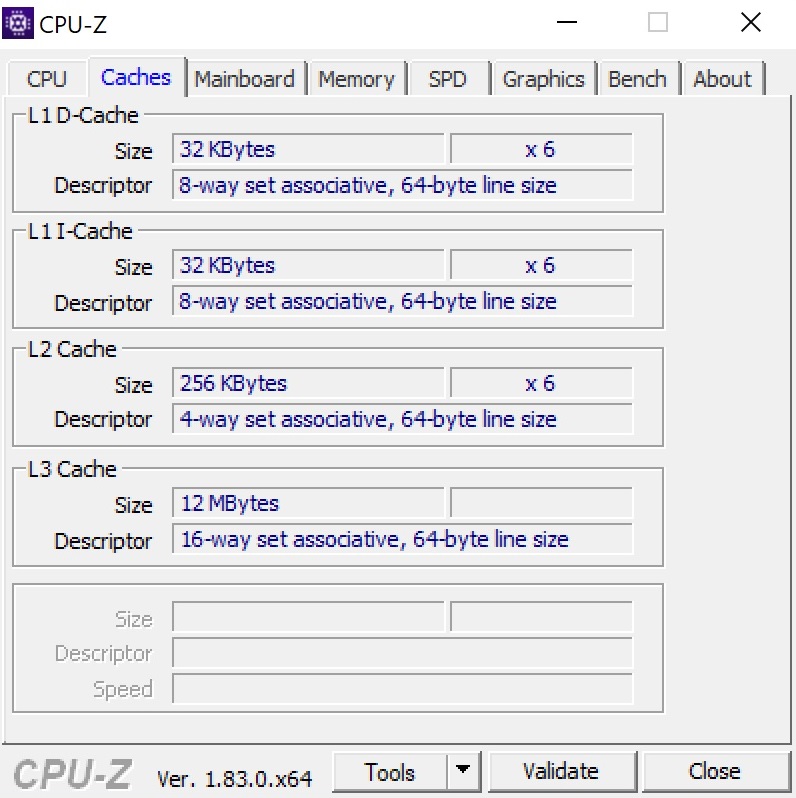
Test: Schenker XMG Ultra 17 (Clevo P775TM1-G) Laptop (Sammanfattning)
| SD Card Reader | |
| average JPG Copy Test (av. of 3 runs) | |
| Guru Mars K (Toshiba Exceria Pro SDXC 64 GB UHS-II) | |
| Schenker XMG Ultra 17 (Toshiba Exceria Pro SDXC 64 GB UHS-II) | |
| Genomsnitt av klass Gaming (20.9 - 210, n=54, senaste 2 åren) | |
| MSI GT75VR 7RF-012 Titan Pro (Toshiba Exceria Pro SDXC 64 GB UHS-II) | |
| Acer Predator 17 X GX-792-76DL (Toshiba Exceria Pro SDXC 64 GB UHS-II) | |
| maximum AS SSD Seq Read Test (1GB) | |
| Schenker XMG Ultra 17 (Toshiba Exceria Pro SDXC 64 GB UHS-II) | |
| Guru Mars K (Toshiba Exceria Pro SDXC 64 GB UHS-II) | |
| Genomsnitt av klass Gaming (25.5 - 261, n=51, senaste 2 åren) | |
| Acer Predator 17 X GX-792-76DL (Toshiba Exceria Pro SDXC 64 GB UHS-II) | |
| MSI GT75VR 7RF-012 Titan Pro (Toshiba Exceria Pro SDXC 64 GB UHS-II) | |
| |||||||||||||||||||||||||
Distribution av ljusstyrkan: 88 %
Mitt på batteriet: 332 cd/m²
Kontrast: 1186:1 (Svärta: 0.28 cd/m²)
ΔE ColorChecker Calman: 3.86 | ∀{0.5-29.43 Ø4.73}
ΔE Greyscale Calman: 4.33 | ∀{0.09-98 Ø4.97}
100% sRGB (Argyll 1.6.3 3D)
88% AdobeRGB 1998 (Argyll 1.6.3 3D)
99.1% AdobeRGB 1998 (Argyll 3D)
100% sRGB (Argyll 3D)
86.4% Display P3 (Argyll 3D)
Gamma: 2.41
CCT: 6595 K
| Schenker XMG Ultra 17 AU Optronics B173ZAN01.0 (AUO109B), IPS, 3840x2160 | Guru Mars K LGD046E, IPS, 1920x1080 | Acer Predator 17 X GX-792-76DL LP173WF4-SPF5 (LGD056D), IPS, 1920x1080 | MSI GT75VR 7RF-012 Titan Pro CMN N173HHE-G32 (CMN1747), TN LED, 1920x1080 | Alienware 17 R4 TN LED, 2560x1440 | |
|---|---|---|---|---|---|
| Display | -25% | -26% | -2% | -28% | |
| Display P3 Coverage (%) | 86.4 | 67.3 -22% | 66 -24% | 90.3 5% | 61.2 -29% |
| sRGB Coverage (%) | 100 | 85.1 -15% | 83.7 -16% | 99.6 0% | 82.9 -17% |
| AdobeRGB 1998 Coverage (%) | 99.1 | 62.3 -37% | 61.2 -38% | 86.8 -12% | 60.5 -39% |
| Response Times | 5% | -8% | 74% | 40% | |
| Response Time Grey 50% / Grey 80% * (ms) | 44 ? | 37.6 ? 15% | 45 ? -2% | 11.6 ? 74% | 30 ? 32% |
| Response Time Black / White * (ms) | 24.8 ? | 26.4 ? -6% | 28 ? -13% | 6.8 ? 73% | 12.8 ? 48% |
| PWM Frequency (Hz) | 133.3 ? | 25000 ? | |||
| Screen | -7% | -10% | 13% | -31% | |
| Brightness middle (cd/m²) | 332 | 343 3% | 380 14% | 274 -17% | 402.3 21% |
| Brightness (cd/m²) | 313 | 330 5% | 362 16% | 262 -16% | 372 19% |
| Brightness Distribution (%) | 88 | 91 3% | 91 3% | 87 -1% | 86 -2% |
| Black Level * (cd/m²) | 0.28 | 0.32 -14% | 0.37 -32% | 0.26 7% | 0.62 -121% |
| Contrast (:1) | 1186 | 1072 -10% | 1027 -13% | 1054 -11% | 649 -45% |
| Colorchecker dE 2000 * | 3.86 | 3.61 6% | 4.12 -7% | 1.36 65% | 5.6 -45% |
| Colorchecker dE 2000 max. * | 5.88 | 8.16 -39% | 8.19 -39% | 4.1 30% | 9.8 -67% |
| Greyscale dE 2000 * | 4.33 | 3.03 30% | 3.95 9% | 0.64 85% | 4.7 -9% |
| Gamma | 2.41 91% | 2.41 91% | 2.47 89% | 2.19 100% | 2.14 103% |
| CCT | 6595 99% | 6568 99% | 6539 99% | 6551 99% | 7519 86% |
| Color Space (Percent of AdobeRGB 1998) (%) | 88 | 56 -36% | 55 -37% | 77 -12% | 53.7 -39% |
| Color Space (Percent of sRGB) (%) | 100 | 85 -15% | 84 -16% | 100 0% | 82.2 -18% |
| Totalt genomsnitt (program/inställningar) | -9% /
-9% | -15% /
-13% | 28% /
18% | -6% /
-21% |
* ... mindre är bättre
Visa svarstider
| ↔ Svarstid svart till vitt | ||
|---|---|---|
| 24.8 ms ... stiga ↗ och falla ↘ kombinerat | ↗ 11.6 ms stiga | 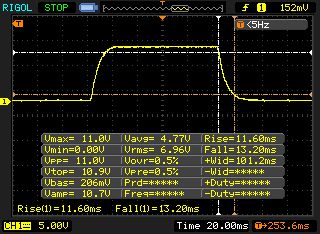 |
| ↘ 13.2 ms hösten | ||
| Skärmen visar bra svarsfrekvens i våra tester, men kan vara för långsam för konkurrenskraftiga spelare. I jämförelse sträcker sig alla testade enheter från 0.1 (minst) till 240 (maximalt) ms. » 58 % av alla enheter är bättre. Detta innebär att den uppmätta svarstiden är sämre än genomsnittet av alla testade enheter (19.9 ms). | ||
| ↔ Svarstid 50 % grått till 80 % grått | ||
| 44 ms ... stiga ↗ och falla ↘ kombinerat | ↗ 22.8 ms stiga | 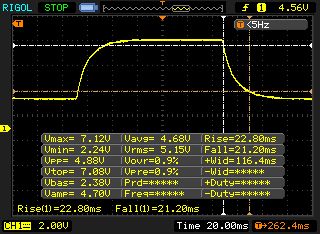 |
| ↘ 21.2 ms hösten | ||
| Skärmen visar långsamma svarsfrekvenser i våra tester och kommer att vara otillfredsställande för spelare. I jämförelse sträcker sig alla testade enheter från 0.165 (minst) till 636 (maximalt) ms. » 73 % av alla enheter är bättre. Detta innebär att den uppmätta svarstiden är sämre än genomsnittet av alla testade enheter (31.1 ms). | ||
Skärmflimmer / PWM (Puls-Width Modulation)
| Skärmflimmer / PWM upptäcktes inte | 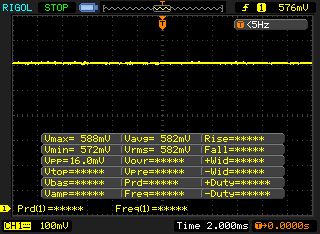 | ||
Som jämförelse: 52 % av alla testade enheter använder inte PWM för att dämpa skärmen. Om PWM upptäcktes mättes ett medelvärde av 7791 (minst: 5 - maximum: 343500) Hz. | |||
| PCMark 8 Home Score Accelerated v2 | 4865 poäng | |
| PCMark 8 Work Score Accelerated v2 | 4849 poäng | |
| PCMark 10 Score | 5976 poäng | |
Hjälp | ||
| Schenker XMG Ultra 17 Samsung SSD 960 Evo 500GB m.2 NVMe | Guru Mars K Samsung SSD 960 Evo 500GB m.2 NVMe | Acer Predator 17 X GX-792-76DL Toshiba NVMe THNSN5512GPU7 | MSI GT75VR 7RF-012 Titan Pro 2x Samsung SM961 MZVPW256HEGL NVMe (RAID 0) | Alienware 17 R4 SK Hynix PC300 NVMe 512 GB | Genomsnitt Samsung SSD 960 Evo 500GB m.2 NVMe | |
|---|---|---|---|---|---|---|
| AS SSD | -23% | 1% | -39% | -3% | ||
| Seq Read (MB/s) | 2533 | 2261 -11% | 3137 24% | 1752 -31% | 2433 ? -4% | |
| Seq Write (MB/s) | 1771 | 1338 -24% | 2352 33% | 735 -58% | 1647 ? -7% | |
| 4K Read (MB/s) | 43.65 | 39.52 -9% | 50.1 15% | 35.61 -18% | 45.5 ? 4% | |
| 4K Write (MB/s) | 139.5 | 133.8 -4% | 128.8 -8% | 113.4 -19% | 142.4 ? 2% | |
| Score Read (Points) | 1716 | 1118 -35% | 1412 -18% | 831 -52% | 1645 ? -4% | |
| Score Write (Points) | 1615 | 930 -42% | 1289 -20% | 858 -47% | 1518 ? -6% | |
| Score Total (Points) | 4173 | 2581 -38% | 3392 -19% | 2072 -50% | 3968 ? -5% |

| 3DMark 06 Standard Score | 30222 poäng | |
| 3DMark 11 Performance | 22034 poäng | |
| 3DMark Cloud Gate Standard Score | 37952 poäng | |
| 3DMark Fire Strike Score | 17997 poäng | |
| 3DMark Time Spy Score | 6942 poäng | |
Hjälp | ||
| The Witcher 3 | |
| 3840x2160 High Graphics & Postprocessing (Nvidia HairWorks Off) | |
| Genomsnitt av klass Gaming (114 - 169.8, n=3, senaste 2 åren) | |
| Guru Mars K | |
| MSI GT75VR 7RF-012 Titan Pro | |
| Schenker XMG Ultra 17 | |
| Genomsnitt NVIDIA GeForce GTX 1080 Mobile (44.4 - 55.8, n=11) | |
| Acer Predator 17 X GX-792-76DL | |
| 1920x1080 Ultra Graphics & Postprocessing (HBAO+) | |
| Genomsnitt av klass Gaming (95 - 240, n=8, senaste 2 åren) | |
| Alienware 17 R4 | |
| MSI GT75VR 7RF-012 Titan Pro | |
| Guru Mars K | |
| Schenker XMG Ultra 17 | |
| Genomsnitt NVIDIA GeForce GTX 1080 Mobile (61.7 - 78.1, n=23) | |
| Acer Predator 17 X GX-792-76DL | |
| låg | med. | hög | ultra | 4K | |
|---|---|---|---|---|---|
| The Witcher 3 (2015) | 142 | 75.6 | 51.3 | ||
| FIFA 18 (2017) | 289 | 286 | 249 | ||
| Wolfenstein II: The New Colossus (2017) | 136 | 127 | 52.1 | ||
| Assassin´s Creed Origins (2017) | 86 | 76 | 39 | ||
| Call of Duty WWII (2017) | 160 | 131 | 63.2 | ||
| Need for Speed Payback (2017) | 137 | 131 | 48.9 | ||
| Star Wars Battlefront 2 (2017) | 137 | 115 | 39.6 | ||
| Fortnite (2018) | 194 | 141 | 41.4 | ||
| Final Fantasy XV Benchmark (2018) | 74.4 | 31.8 | |||
| Kingdom Come: Deliverance (2018) | 104 | 76.8 | 25.8 |
Ljudnivå
| Låg belastning |
| 34 / 35 / 40 dB(A) |
| Hög belastning |
| 45 / 60 dB(A) |
 | ||
30 dB tyst 40 dB(A) hörbar 50 dB(A) högt ljud |
||
min: | ||
| Schenker XMG Ultra 17 GeForce GTX 1080 Mobile, i7-8700 | Guru Mars K GeForce GTX 1080 Mobile, i7-7700 | Acer Predator 17 X GX-792-76DL GeForce GTX 1080 Mobile, i7-7820HK | MSI GT75VR 7RF-012 Titan Pro GeForce GTX 1080 Mobile, i7-7820HK | Alienware 17 R4 GeForce GTX 1080 Mobile, i7-7820HK | |
|---|---|---|---|---|---|
| Noise | 0% | 6% | 0% | 2% | |
| av / miljö * (dB) | 30 | 29 3% | 30 -0% | 30 -0% | 28.2 6% |
| Idle Minimum * (dB) | 34 | 36 -6% | 33 3% | 33 3% | 35.6 -5% |
| Idle Average * (dB) | 35 | 37 -6% | 35 -0% | 34 3% | 35.6 -2% |
| Idle Maximum * (dB) | 40 | 40 -0% | 37 7% | 38 5% | 35.7 11% |
| Load Average * (dB) | 45 | 45 -0% | 40 11% | 44 2% | 50.2 -12% |
| Witcher 3 ultra * (dB) | 52 | 50 4% | 56 -8% | 50.2 3% | |
| Load Maximum * (dB) | 60 | 55 8% | 50 17% | 62 -3% | 50.2 16% |
* ... mindre är bättre
(±) Den maximala temperaturen på ovansidan är 41 °C / 106 F, jämfört med genomsnittet av 40.4 °C / 105 F , allt från 21.2 till 68.8 °C för klassen Gaming.
(-) Botten värms upp till maximalt 48 °C / 118 F, jämfört med genomsnittet av 43.2 °C / 110 F
(+) Vid tomgångsbruk är medeltemperaturen för ovansidan 27.8 °C / 82 F, jämfört med enhetsgenomsnittet på 33.9 °C / ### class_avg_f### F.
(±) När du spelar The Witcher 3 är medeltemperaturen för ovansidan 35.2 °C / 95 F, jämfört med enhetsgenomsnittet på 33.9 °C / ## #class_avg_f### F.
(+) Handledsstöden och pekplattan är kallare än hudtemperaturen med maximalt 30 °C / 86 F och är därför svala att ta på.
(±) Medeltemperaturen för handledsstödsområdet på liknande enheter var 28.8 °C / 83.8 F (-1.2 °C / -2.2 F).
| Schenker XMG Ultra 17 GeForce GTX 1080 Mobile, i7-8700 | Guru Mars K GeForce GTX 1080 Mobile, i7-7700 | Acer Predator 17 X GX-792-76DL GeForce GTX 1080 Mobile, i7-7820HK | MSI GT75VR 7RF-012 Titan Pro GeForce GTX 1080 Mobile, i7-7820HK | Alienware 17 R4 GeForce GTX 1080 Mobile, i7-7820HK | |
|---|---|---|---|---|---|
| Heat | -1% | 0% | -11% | -5% | |
| Maximum Upper Side * (°C) | 41 | 46 -12% | 44.2 -8% | 46 -12% | 49.6 -21% |
| Maximum Bottom * (°C) | 48 | 46 4% | 43 10% | 57 -19% | 56 -17% |
| Idle Upper Side * (°C) | 30 | 32 -7% | 32.4 -8% | 34 -13% | 29.6 1% |
| Idle Bottom * (°C) | 35 | 31 11% | 32.8 6% | 35 -0% | 29.2 17% |
* ... mindre är bättre
Schenker XMG Ultra 17 ljudanalys
(±) | högtalarljudstyrkan är genomsnittlig men bra (79 dB)
Bas 100 - 315 Hz
(+) | bra bas - bara 4.1% från medianen
(±) | linjäriteten för basen är genomsnittlig (12.2% delta till föregående frekvens)
Mellan 400 - 2000 Hz
(±) | högre mellan - i genomsnitt 5.5% högre än median
(+) | mids är linjära (6.5% delta till föregående frekvens)
Högsta 2 - 16 kHz
(+) | balanserade toppar - endast 1.4% från medianen
(+) | toppar är linjära (2% delta till föregående frekvens)
Totalt 100 - 16 000 Hz
(+) | det totala ljudet är linjärt (11% skillnad mot median)
Jämfört med samma klass
» 7% av alla testade enheter i den här klassen var bättre, 3% liknande, 89% sämre
» Den bästa hade ett delta på 6%, genomsnittet var 18%, sämst var 132%
Jämfört med alla testade enheter
» 6% av alla testade enheter var bättre, 2% liknande, 92% sämre
» Den bästa hade ett delta på 4%, genomsnittet var 24%, sämst var 134%
Acer Predator 17 X GX-792-76DL ljudanalys
(+) | högtalare kan spela relativt högt (86 dB)
Bas 100 - 315 Hz
(±) | reducerad bas - i genomsnitt 9.6% lägre än medianen
(±) | linjäriteten för basen är genomsnittlig (9.3% delta till föregående frekvens)
Mellan 400 - 2000 Hz
(+) | balanserad mellan - endast 2.6% från medianen
(+) | mids är linjära (4.9% delta till föregående frekvens)
Högsta 2 - 16 kHz
(+) | balanserade toppar - endast 3.9% från medianen
(+) | toppar är linjära (6.7% delta till föregående frekvens)
Totalt 100 - 16 000 Hz
(+) | det totala ljudet är linjärt (11.1% skillnad mot median)
Jämfört med samma klass
» 8% av alla testade enheter i den här klassen var bättre, 3% liknande, 89% sämre
» Den bästa hade ett delta på 6%, genomsnittet var 18%, sämst var 132%
Jämfört med alla testade enheter
» 7% av alla testade enheter var bättre, 2% liknande, 92% sämre
» Den bästa hade ett delta på 4%, genomsnittet var 24%, sämst var 134%
| Av/Standby | |
| Låg belastning | |
| Hög belastning |
|
Förklaring:
min: | |
| Schenker XMG Ultra 17 GeForce GTX 1080 Mobile, i7-8700 | Guru Mars K GeForce GTX 1080 Mobile, i7-7700 | Acer Predator 17 X GX-792-76DL GeForce GTX 1080 Mobile, i7-7820HK | MSI GT75VR 7RF-012 Titan Pro GeForce GTX 1080 Mobile, i7-7820HK | Alienware 17 R4 GeForce GTX 1080 Mobile, i7-7820HK | |
|---|---|---|---|---|---|
| Power Consumption | -3% | 12% | -7% | 2% | |
| Idle Minimum * (Watt) | 32 | 31 3% | 27 16% | 34 -6% | 37.5 -17% |
| Idle Average * (Watt) | 38 | 37 3% | 32 16% | 41 -8% | 37.6 1% |
| Idle Maximum * (Watt) | 45 | 44 2% | 41 9% | 50 -11% | 37.6 16% |
| Load Average * (Watt) | 96 | 116 -21% | 102 -6% | 106 -10% | 122.4 -28% |
| Witcher 3 ultra * (Watt) | 237 | 259 -9% | 257 -8% | 180.3 24% | |
| Load Maximum * (Watt) | 331 | 312 6% | 248 25% | 320 3% | 277.4 16% |
* ... mindre är bättre
| Schenker XMG Ultra 17 GeForce GTX 1080 Mobile, i7-8700, 82 Wh | Guru Mars K GeForce GTX 1080 Mobile, i7-7700, 82 Wh | Acer Predator 17 X GX-792-76DL GeForce GTX 1080 Mobile, i7-7820HK, 88.8 Wh | MSI GT75VR 7RF-012 Titan Pro GeForce GTX 1080 Mobile, i7-7820HK, 75 Wh | Alienware 17 R4 GeForce GTX 1080 Mobile, i7-7820HK, 99 Wh | Genomsnitt av klass Gaming | |
|---|---|---|---|---|---|---|
| Batteridrifttid | 25% | 57% | 1% | 32% | 167% | |
| Reader / Idle (h) | 2.7 | 3.3 22% | 5.2 93% | 3 11% | 4.6 70% | 8.71 ? 223% |
| H.264 (h) | 2.5 | 2.6 4% | 3.4 36% | 2.5 0% | 8.26 ? 230% | |
| WiFi v1.3 (h) | 2.4 | 4.2 75% | 2.4 0% | 3 25% | 7.04 ? 193% | |
| Load (h) | 1.2 | 1.8 50% | 1.5 25% | 1.1 -8% | 1.2 0% | 1.47 ? 23% |
För
Emot
Läs den fullständiga versionen av den här recensionen på engelska här.
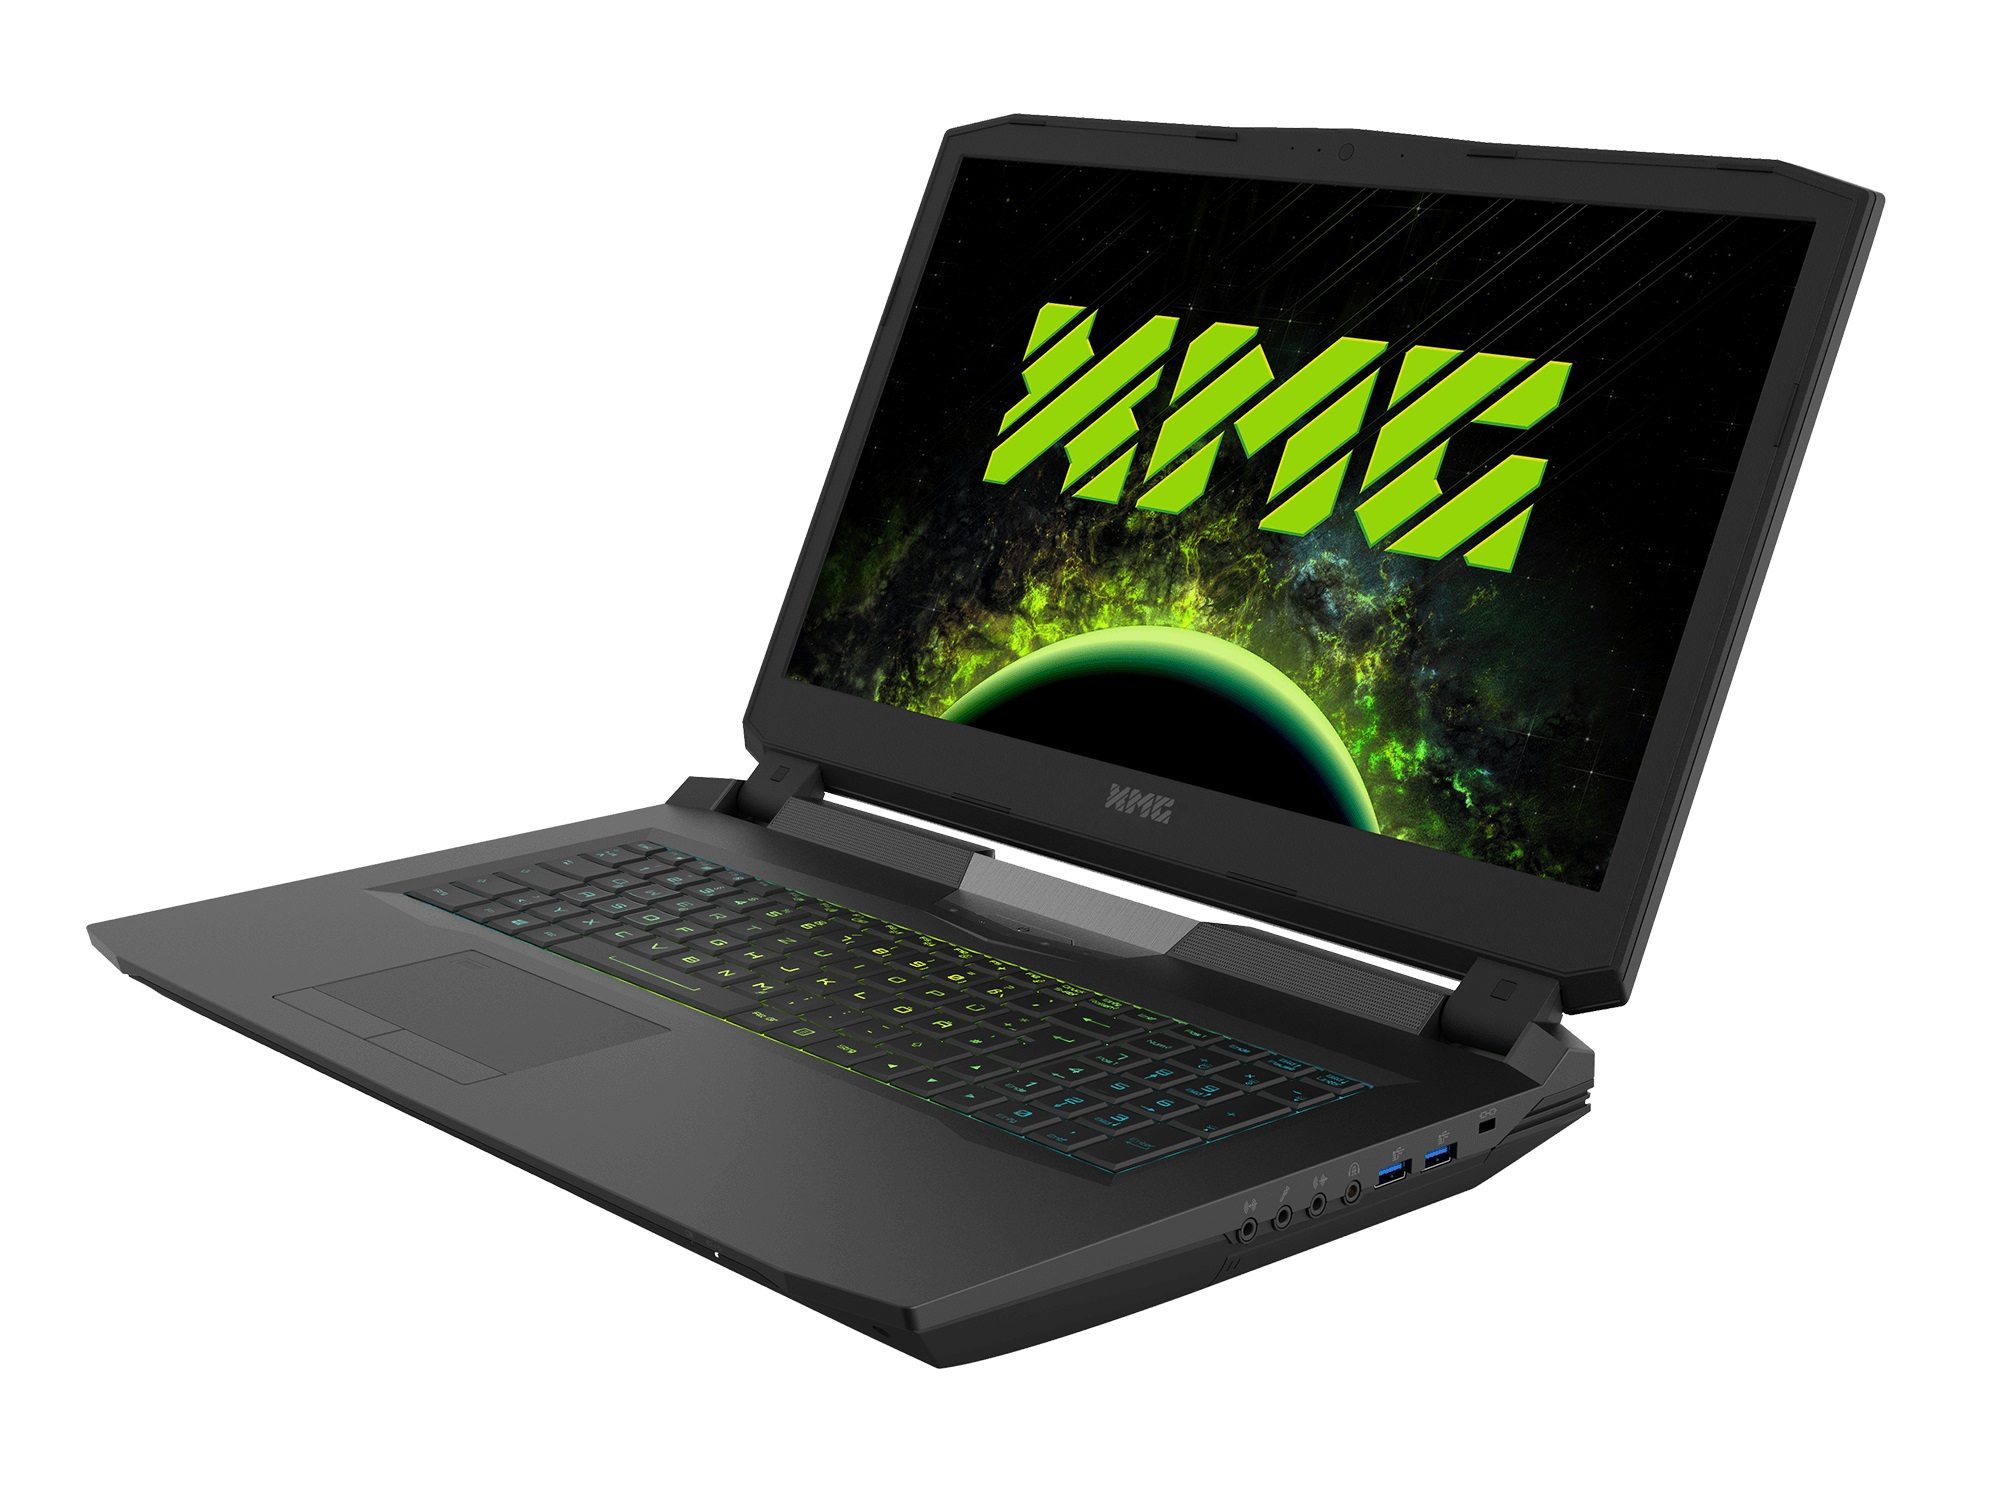
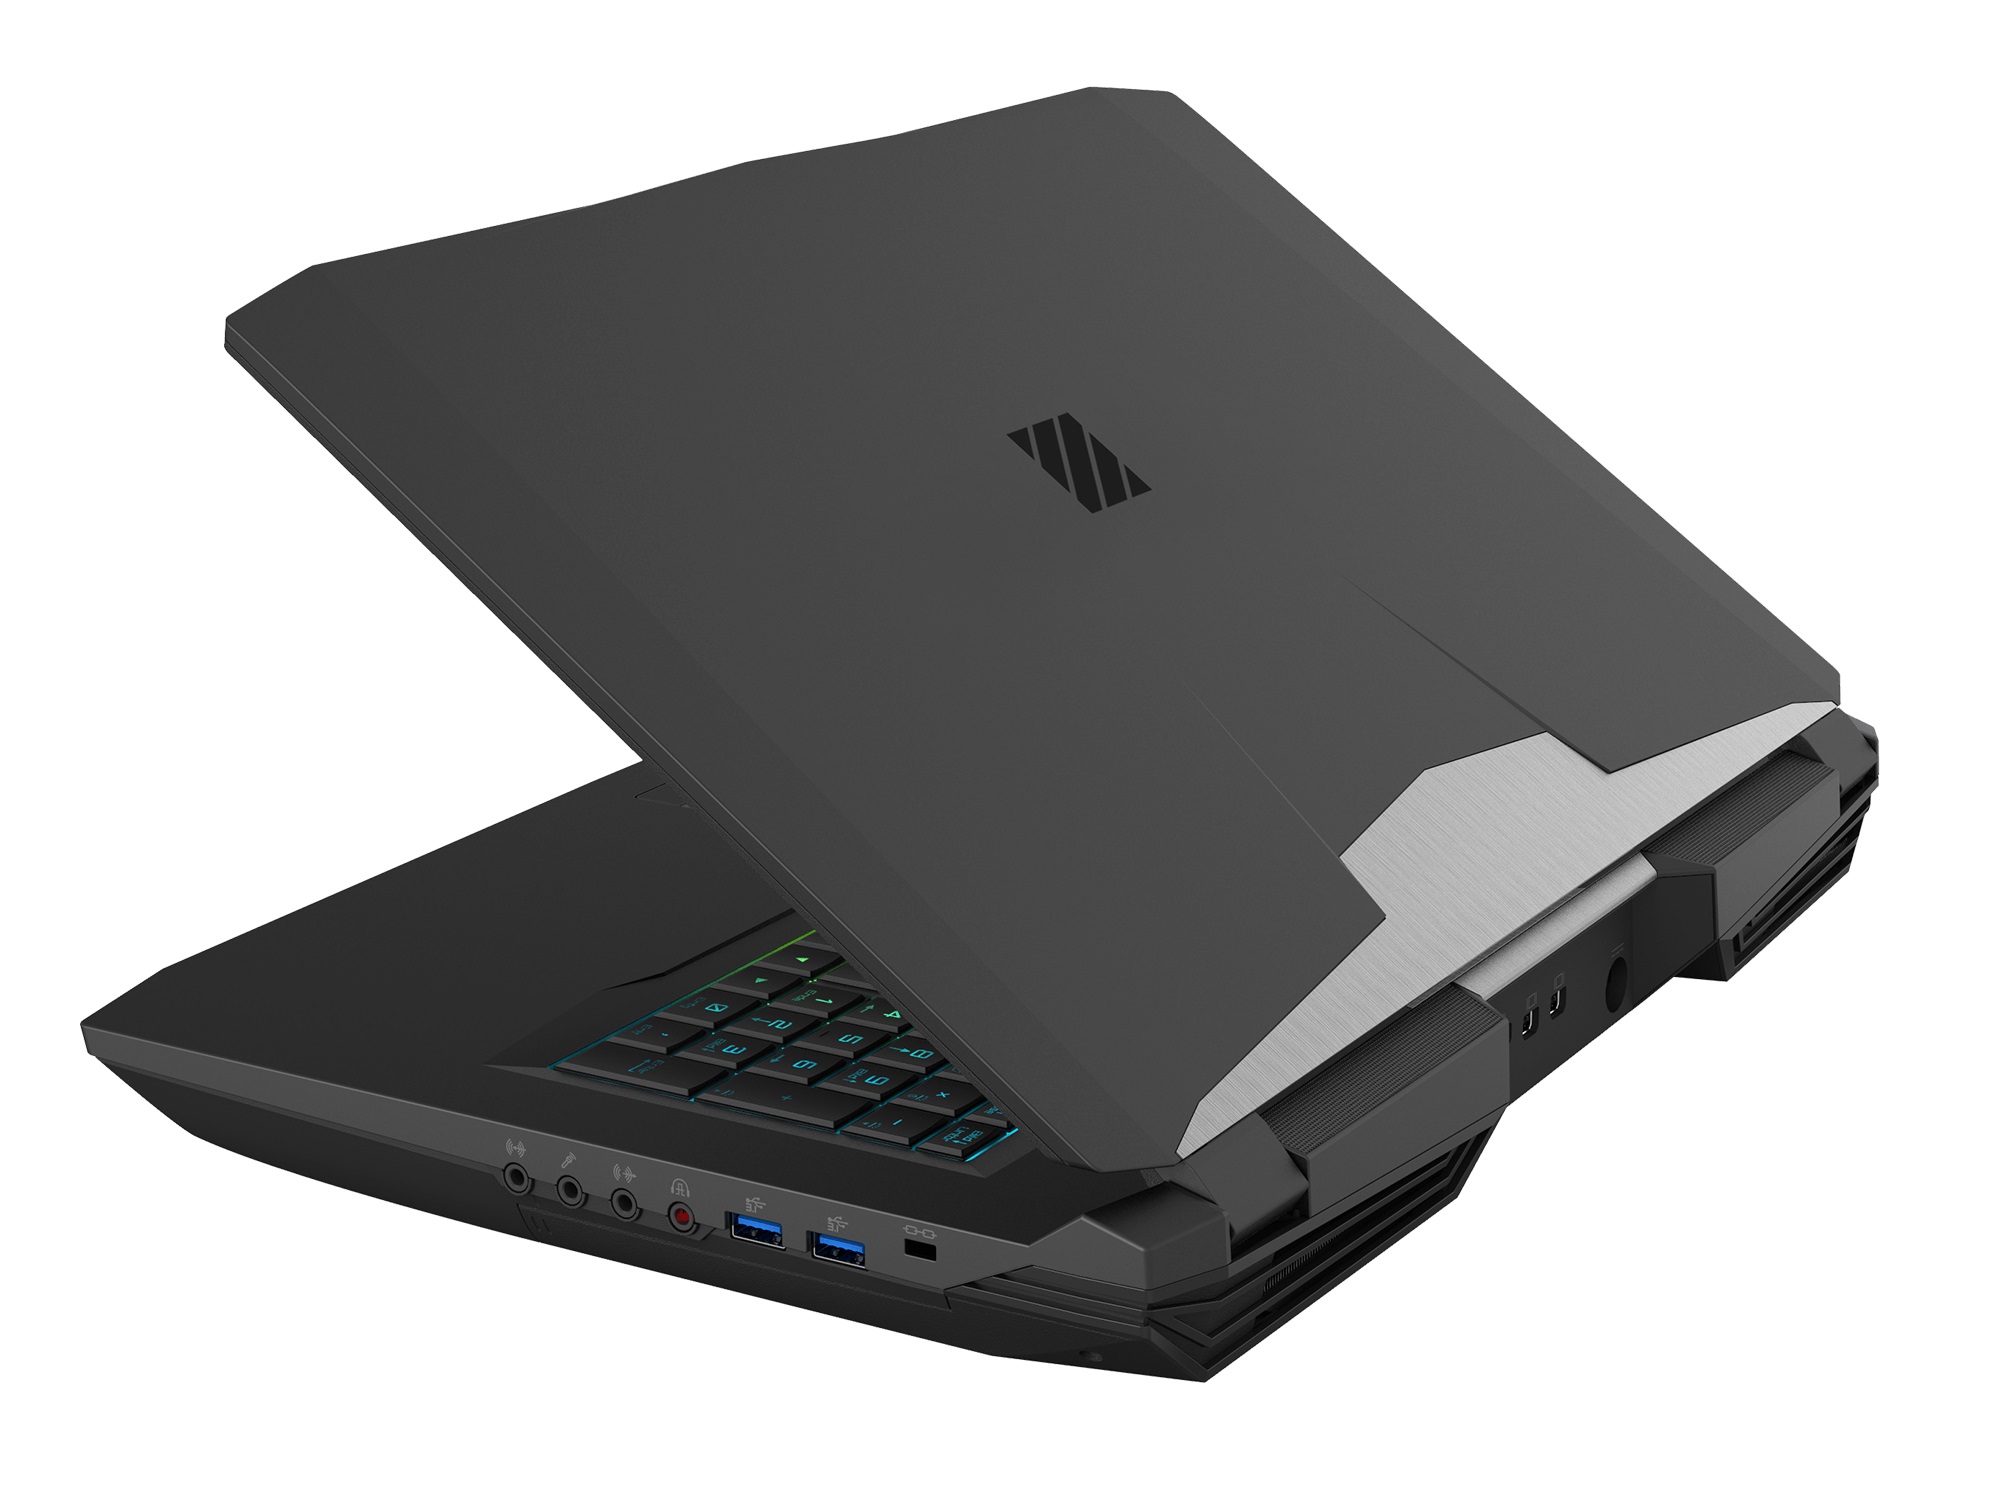
XMG Ultra 17 är designad för krävande gamers som inte (längre) vill ha en tower-PC men gillar uppgraderbarheten och anslutningarna som finns på en klassisk desktop. Det är den typen av köpare som Schenker Technologies försöker attrahera med detta monster på 17 tum.
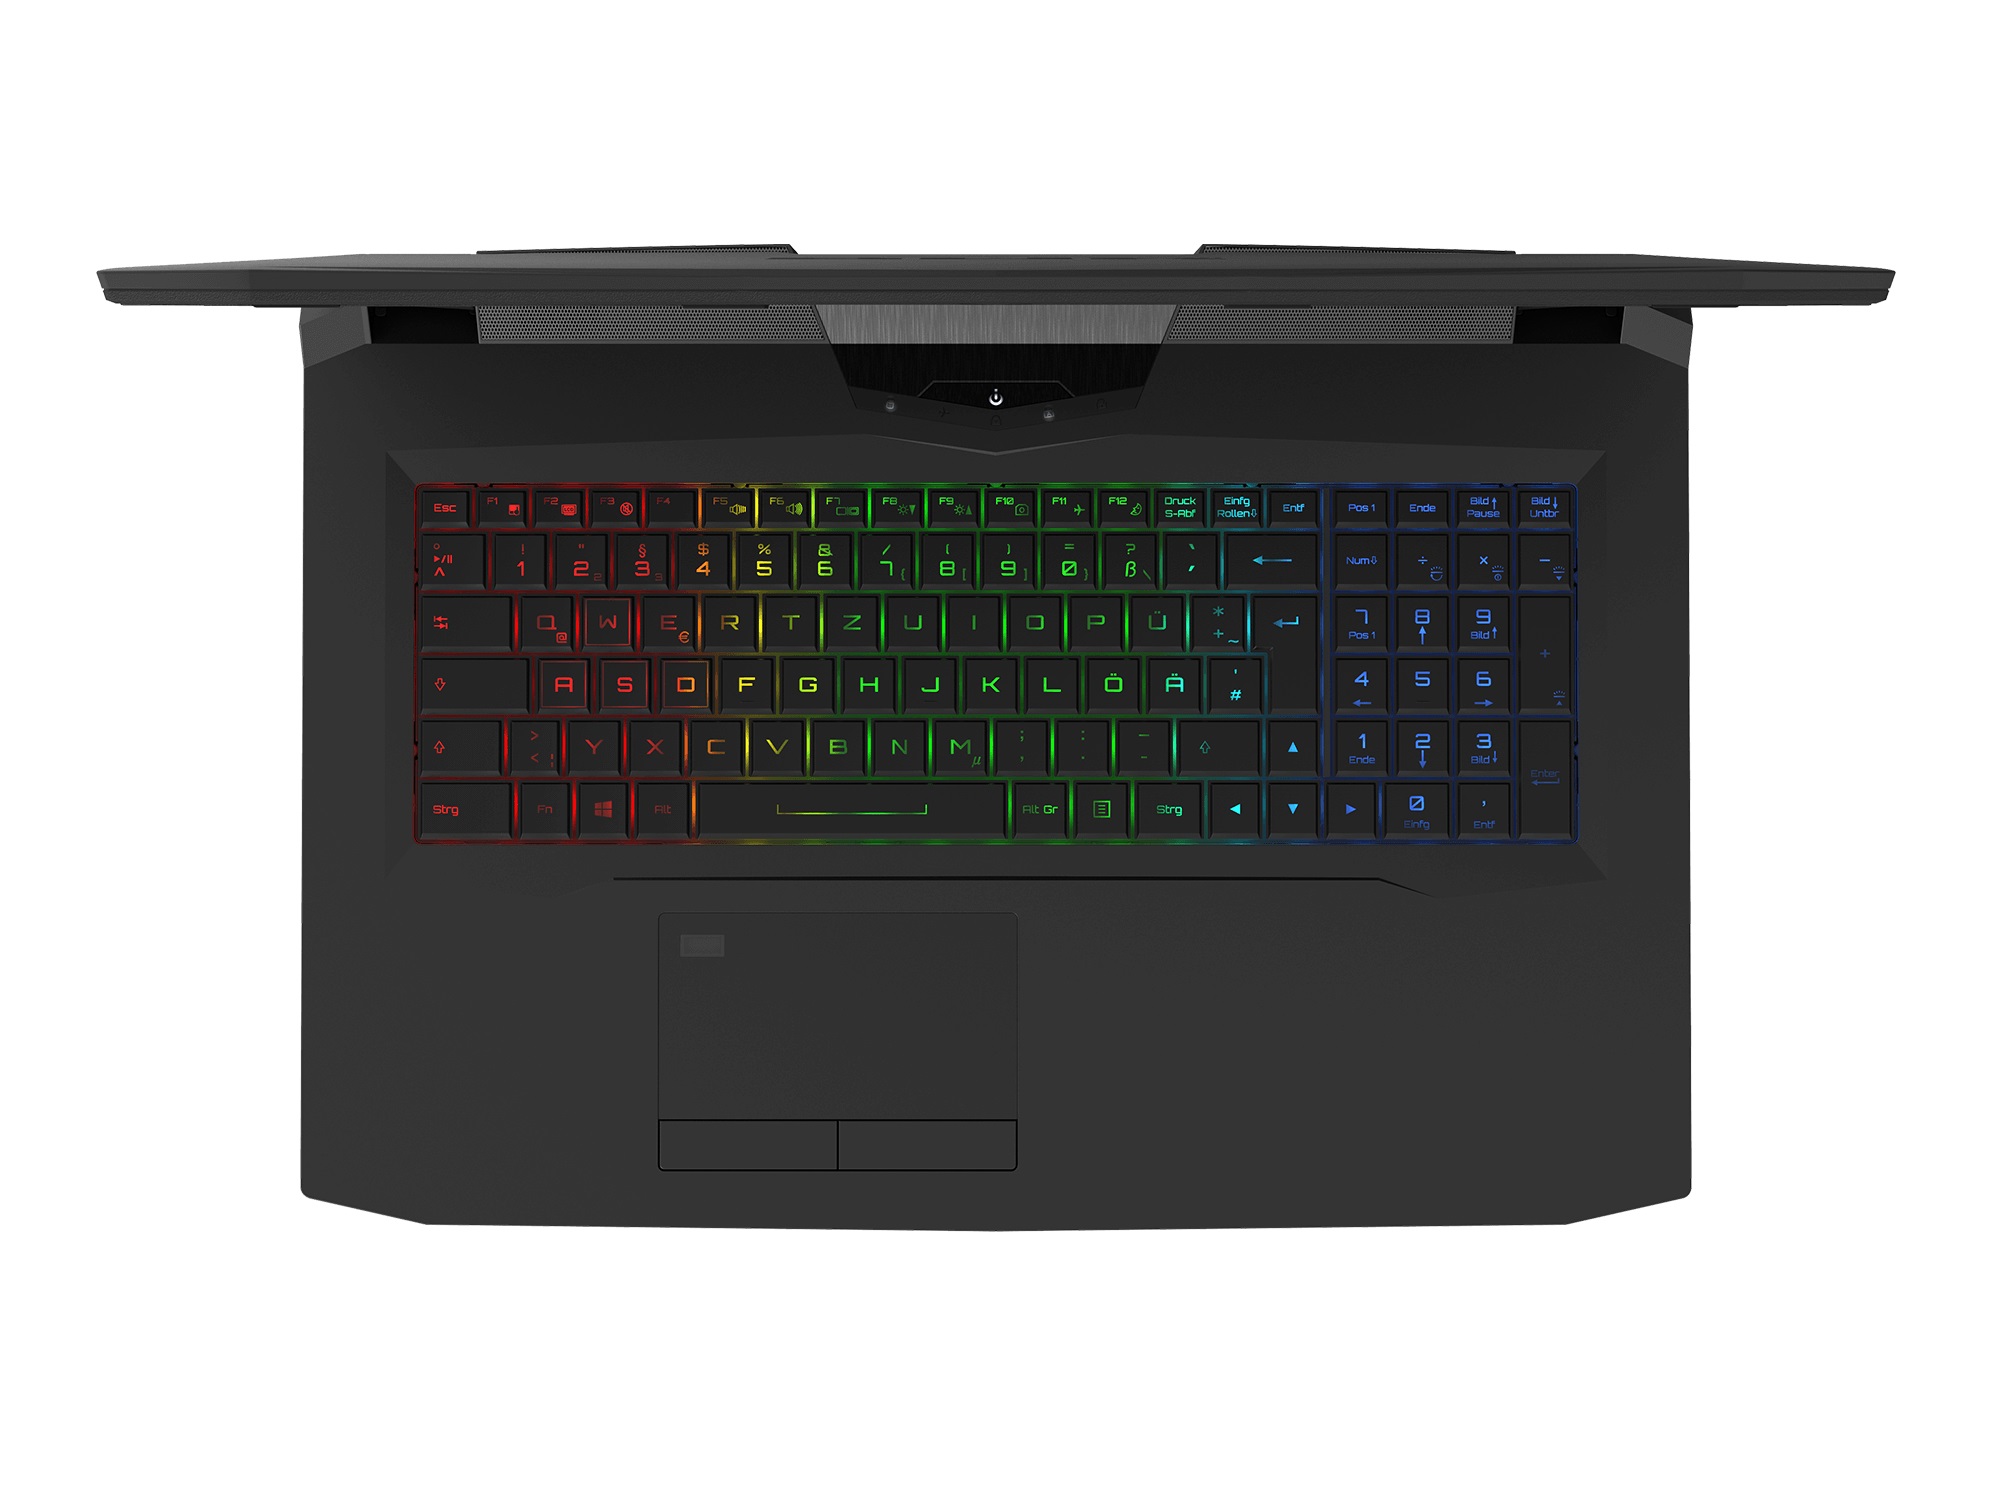
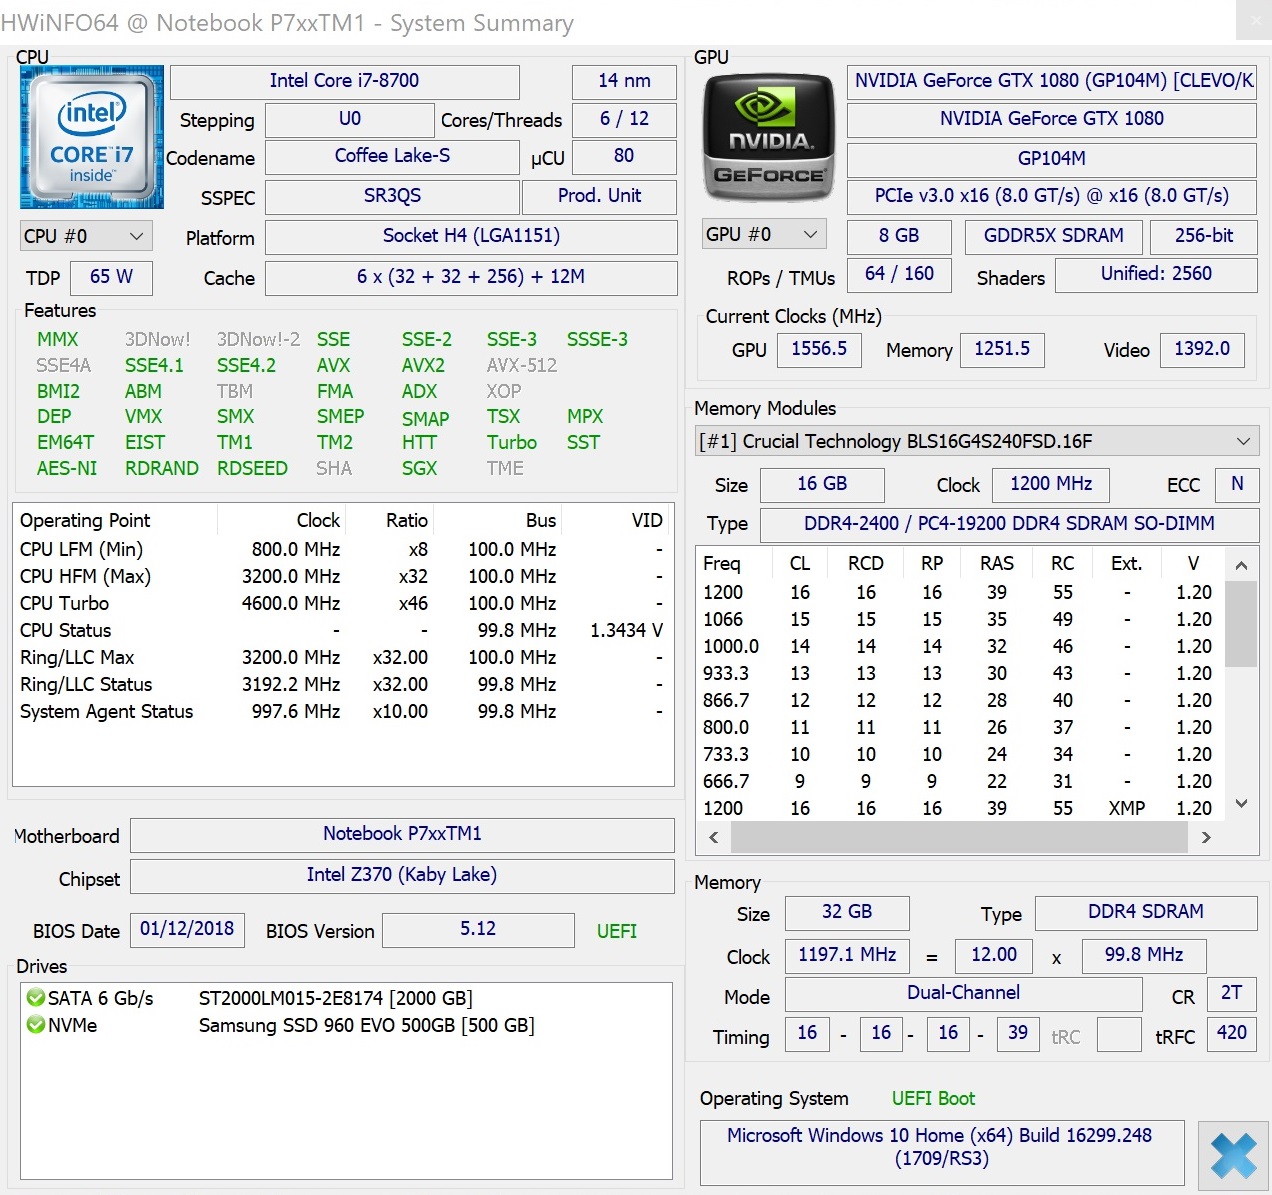
På plus-sidan så finns det utmärkta inmatningenheter och en exceptionell UHD-skärm med stöd för G-Sync, vars färgåtergivning är bäst i klassen. Prestandan är också utmärkt: Intels Coffee Lake-CPU och Nvidias Pascal-GPU garanterar hög prestanda, även om dagens spel sällan drar nytta av sex kärnor så länge processorn stödjer SMT.
Förbättringar kunde ha gjorts när det gäller fläktkontrollenheten, som, typiskt för Barebone-tillverkaren Clevo, är långt ifrån perfekt. Hyfsad batteritid kan man heller inte förvänta sig.
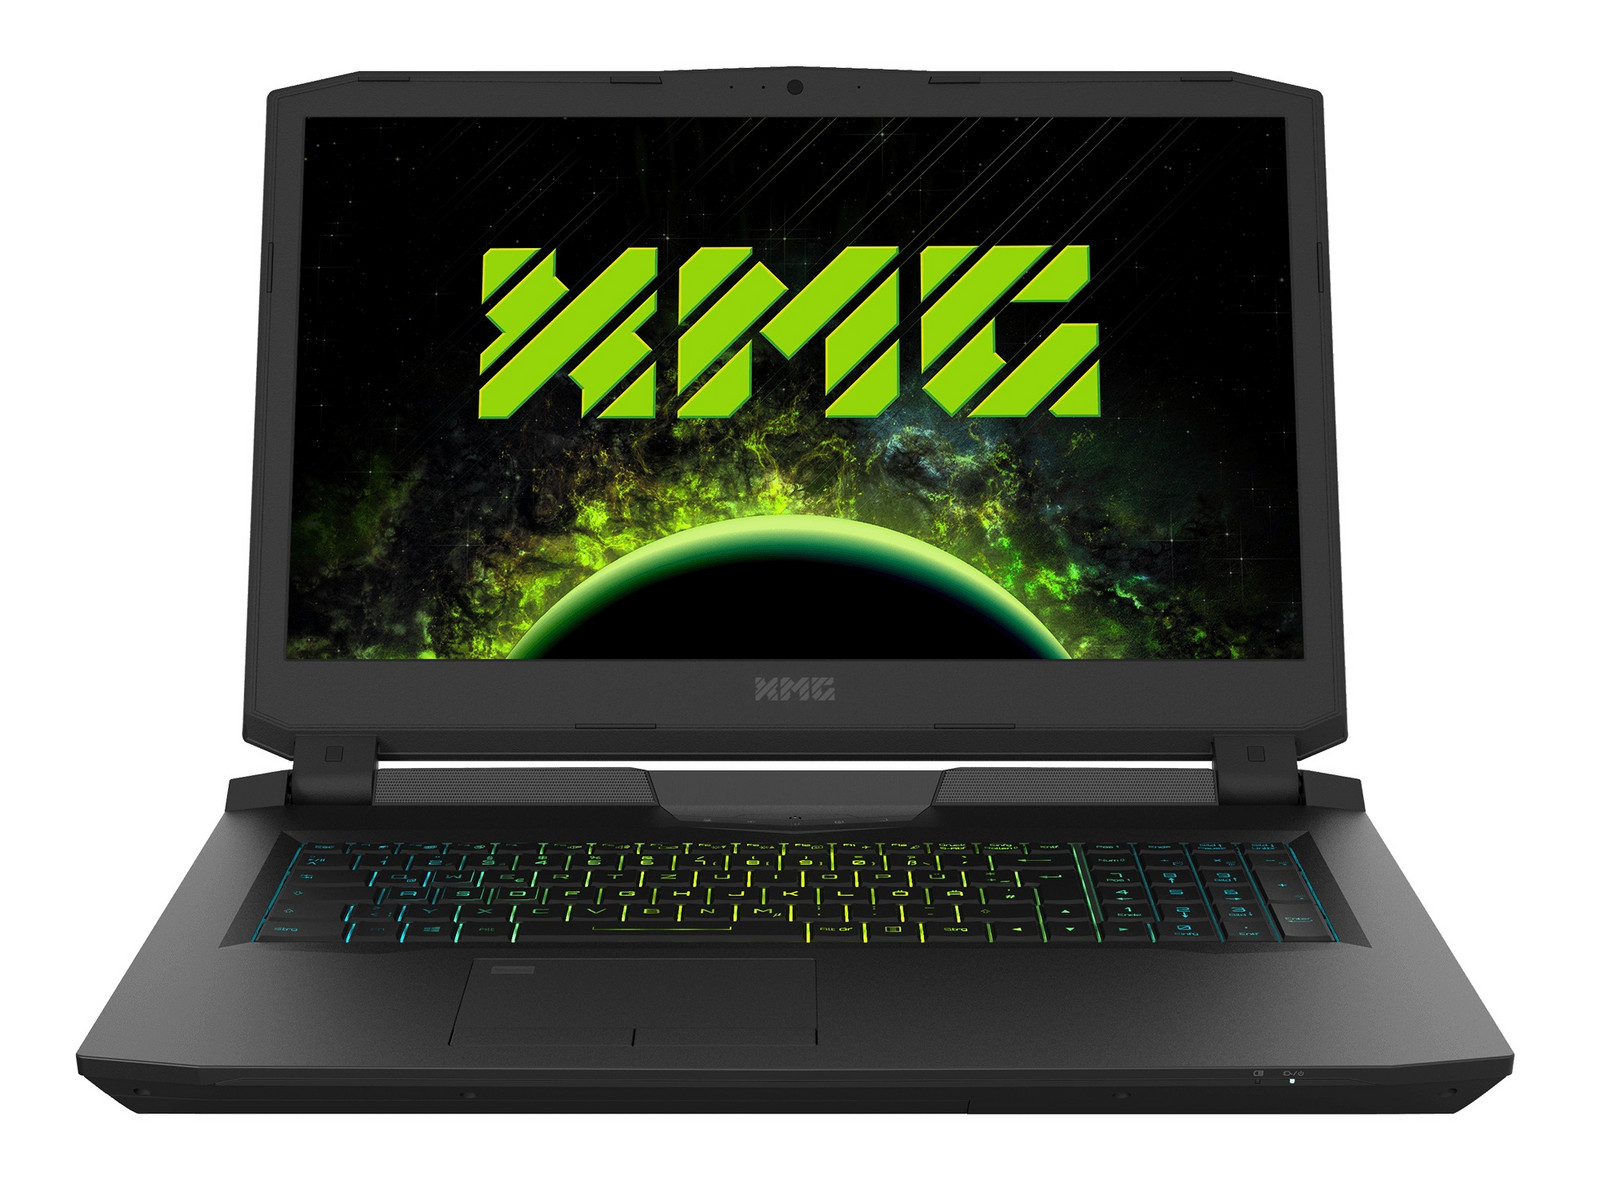
Schenker XMG Ultra 17
- 02/23/2018 v6 (old)
Florian Glaser
Price comparison