Test: Lenovo Legion Y740-17IRH - Spelkomet som får höga poäng för bra prestandaleverans och låg värmeutveckling (Sammanfattning)
Gradering | Datum | Modell | Vikt | Höjd | Storlek | Upplösning | Pris |
|---|---|---|---|---|---|---|---|
| 83.2 % v7 (old) | 10/2019 | Lenovo Legion Y740-17IRH i7-9750H, GeForce RTX 2060 Mobile | 3 kg | 23 mm | 17.30" | 1920x1080 | |
| 85.6 % v6 (old) | 03/2019 | Lenovo Legion Y740-17ICH i7-8750H, GeForce RTX 2080 Max-Q | 2.8 kg | 23 mm | 17.30" | 1920x1080 | |
| 86 % v7 (old) | 10/2019 | Asus Strix Hero III G731GV i7-9750H, GeForce RTX 2060 Mobile | 2.9 kg | 26.2 mm | 17.30" | 1920x1080 | |
| 82.9 % v7 (old) | 10/2019 | MSI GL75 9SEK-056US i7-9750H, GeForce RTX 2060 Mobile | 2.5 kg | 28 mm | 17.30" | 1920x1080 | |
| 86.7 % v6 (old) | 07/2019 | Schenker XMG Core 17 i7-9750H, GeForce GTX 1660 Ti Mobile | 2.5 kg | 30 mm | 17.30" | 1920x1080 | |
| 85.3 % v6 (old) | 06/2019 | Dell G7 17 7790 i7-8750H, GeForce RTX 2070 Max-Q | 3.2 kg | 25 mm | 17.30" | 1920x1080 | |
| 81.6 % v7 (old) | 07/2019 | HP Pavilion Gaming 17-cd0085cl i7-9750H, GeForce GTX 1660 Ti Max-Q | 2.8 kg | 25 mm | 17.30" | 1920x1080 |

| |||||||||||||||||||||||||
Distribution av ljusstyrkan: 87 %
Mitt på batteriet: 282 cd/m²
Kontrast: 1044:1 (Svärta: 0.27 cd/m²)
ΔE ColorChecker Calman: 3.18 | ∀{0.5-29.43 Ø4.73}
calibrated: 0.95
ΔE Greyscale Calman: 4.1 | ∀{0.09-98 Ø4.97}
96% sRGB (Argyll 1.6.3 3D)
61% AdobeRGB 1998 (Argyll 1.6.3 3D)
65.8% AdobeRGB 1998 (Argyll 3D)
96% sRGB (Argyll 3D)
64.8% Display P3 (Argyll 3D)
Gamma: 2.55
CCT: 7260 K
| Lenovo Legion Y740-17IRH LG Philips LP173WFG-SPD2 (LGD05E0), IPS, 1920x1080 | Lenovo Legion Y740-17ICH AU Optronics B173HAN03.2, IPS, 1920x1080 | Asus Strix Hero III G731GV AU Optronics AUO B173HAN04.0, IPS, 1920x1080 | MSI GL75 9SEK-056US AU Optronics AUO479D (B173HAN04.7), IPS, 1920x1080 | Schenker XMG Core 17 LG Philips LP173WFG-SPB1 (LGD0615), IPS, 1920x1080 | Dell G7 17 7790 AU Optronics AUO409D, B173HAN, IPS, 1920x1080 | HP Pavilion Gaming 17-cd0085cl BOE0825, IPS, 1920x1080 | |
|---|---|---|---|---|---|---|---|
| Display | -3% | -5% | -36% | -0% | -5% | -3% | |
| Display P3 Coverage (%) | 64.8 | 64 -1% | 62.9 -3% | 41.12 -37% | 64.4 -1% | 61.9 -4% | 63.3 -2% |
| sRGB Coverage (%) | 96 | 90.4 -6% | 87.2 -9% | 61.1 -36% | 95.6 0% | 89.6 -7% | 90.2 -6% |
| AdobeRGB 1998 Coverage (%) | 65.8 | 64.8 -2% | 63.8 -3% | 42.49 -35% | 65.6 0% | 63.2 -4% | 64.3 -2% |
| Response Times | -10% | 24% | -97% | 9% | -12% | -95% | |
| Response Time Grey 50% / Grey 80% * (ms) | 14.8 ? | 15.6 ? -5% | 6.8 ? 54% | 26 ? -76% | 14.4 ? 3% | 17.2 ? -16% | 31.6 ? -114% |
| Response Time Black / White * (ms) | 11.2 ? | 12.8 ? -14% | 12 ? -7% | 24.4 ? -118% | 9.6 ? 14% | 12 ? -7% | 19.6 ? -75% |
| PWM Frequency (Hz) | |||||||
| Screen | -36% | -19% | -47% | 3% | -22% | -24% | |
| Brightness middle (cd/m²) | 282 | 299.1 6% | 312.3 11% | 259.1 -8% | 329 17% | 308.6 9% | 299.6 6% |
| Brightness (cd/m²) | 261 | 273 5% | 297 14% | 261 0% | 286 10% | 299 15% | 285 9% |
| Brightness Distribution (%) | 87 | 81 -7% | 91 5% | 93 7% | 79 -9% | 92 6% | 86 -1% |
| Black Level * (cd/m²) | 0.27 | 0.27 -0% | 0.21 22% | 0.25 7% | 0.3 -11% | 0.29 -7% | 0.33 -22% |
| Contrast (:1) | 1044 | 1108 6% | 1487 42% | 1036 -1% | 1097 5% | 1064 2% | 908 -13% |
| Colorchecker dE 2000 * | 3.18 | 5.07 -59% | 3.6 -13% | 4.23 -33% | 2.52 21% | 4.26 -34% | 3.68 -16% |
| Colorchecker dE 2000 max. * | 8.39 | 10.55 -26% | 6.74 20% | 23.39 -179% | 6.9 18% | 7.83 7% | 8.05 4% |
| Colorchecker dE 2000 calibrated * | 0.95 | 3.31 -248% | 3.95 -316% | 3.9 -311% | 1.31 -38% | 2.93 -208% | 3.15 -232% |
| Greyscale dE 2000 * | 4.1 | 6.8 -66% | 3.1 24% | 1.3 68% | 2.98 27% | 5 -22% | 3.8 7% |
| Gamma | 2.55 86% | 2.46 89% | 2.26 97% | 2.076 106% | 2.38 92% | 2.07 106% | 2.12 104% |
| CCT | 7260 90% | 7805 83% | 7002 93% | 6542 99% | 6738 96% | 7488 87% | 7240 90% |
| Color Space (Percent of AdobeRGB 1998) (%) | 61 | 58.5 -4% | 56.6 -7% | 39 -36% | 60 -2% | 57.8 -5% | 58.1 -5% |
| Color Space (Percent of sRGB) (%) | 96 | 89.9 -6% | 86.6 -10% | 61 -36% | 95 -1% | 89.2 -7% | 89.8 -6% |
| Totalt genomsnitt (program/inställningar) | -16% /
-27% | 0% /
-11% | -60% /
-52% | 4% /
3% | -13% /
-18% | -41% /
-29% |
* ... mindre är bättre
Visa svarstider
| ↔ Svarstid svart till vitt | ||
|---|---|---|
| 11.2 ms ... stiga ↗ och falla ↘ kombinerat | ↗ 6 ms stiga | 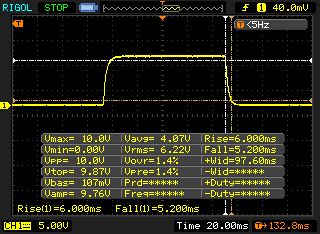 |
| ↘ 5.2 ms hösten | ||
| Skärmen visar bra svarsfrekvens i våra tester, men kan vara för långsam för konkurrenskraftiga spelare. I jämförelse sträcker sig alla testade enheter från 0.1 (minst) till 240 (maximalt) ms. » 30 % av alla enheter är bättre. Det betyder att den uppmätta svarstiden är bättre än genomsnittet av alla testade enheter (19.9 ms). | ||
| ↔ Svarstid 50 % grått till 80 % grått | ||
| 14.8 ms ... stiga ↗ och falla ↘ kombinerat | ↗ 7.6 ms stiga | 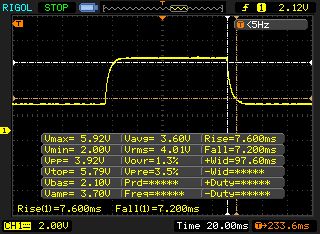 |
| ↘ 7.2 ms hösten | ||
| Skärmen visar bra svarsfrekvens i våra tester, men kan vara för långsam för konkurrenskraftiga spelare. I jämförelse sträcker sig alla testade enheter från 0.165 (minst) till 636 (maximalt) ms. » 29 % av alla enheter är bättre. Det betyder att den uppmätta svarstiden är bättre än genomsnittet av alla testade enheter (31.1 ms). | ||
Skärmflimmer / PWM (Puls-Width Modulation)
| Skärmflimmer / PWM upptäcktes inte | 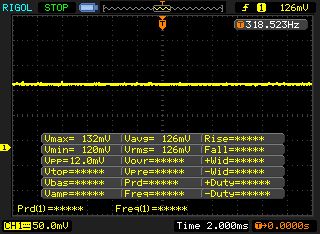 | ||
Som jämförelse: 52 % av alla testade enheter använder inte PWM för att dämpa skärmen. Om PWM upptäcktes mättes ett medelvärde av 7798 (minst: 5 - maximum: 343500) Hz. | |||

| Cinebench R10 | |
| Rendering Single 32Bit | |
| Genomsnitt av klass Gaming (7457 - 11779, n=8, senaste 2 åren) | |
| Lenovo Legion Y740-17IRH | |
| Schenker XMG Core 17 | |
| Rendering Multiple CPUs 32Bit | |
| Genomsnitt av klass Gaming (42932 - 81339, n=8, senaste 2 åren) | |
| Lenovo Legion Y740-17IRH | |
| Schenker XMG Core 17 | |
| Geekbench 3 | |
| 32 Bit Multi-Core Score | |
| Lenovo Legion Y740-17IRH | |
| Schenker XMG Core 17 | |
| 32 Bit Single-Core Score | |
| Schenker XMG Core 17 | |
| Lenovo Legion Y740-17IRH | |
| Geekbench 4.4 | |
| 64 Bit Multi-Core Score | |
| Genomsnitt av klass Gaming (89200 - 97490, n=2, senaste 2 åren) | |
| Lenovo Legion Y740-17IRH | |
| Schenker XMG Core 17 | |
| 64 Bit Single-Core Score | |
| Genomsnitt av klass Gaming (9335 - 9492, n=2, senaste 2 åren) | |
| Schenker XMG Core 17 | |
| Lenovo Legion Y740-17IRH | |
| Geekbench 5.0 | |
| 5.0 Multi-Core | |
| Genomsnitt av klass Gaming (11903 - 23588, n=4, senaste 2 åren) | |
| Lenovo Legion Y740-17IRH | |
| 5.0 Single-Core | |
| Genomsnitt av klass Gaming (1927 - 2270, n=4, senaste 2 åren) | |
| Lenovo Legion Y740-17IRH | |
| Mozilla Kraken 1.1 - Total | |
| Asus Strix Hero III G731GV (Edge 44.17763.1.0) | |
| Lenovo Legion Y740-17ICH (Edge 44.17763.1.0) | |
| MSI GL75 9SEK-056US (Microsoft Edge 44.17763.1.0) | |
| Lenovo Legion Y740-17IRH (Edge 44) | |
| Schenker XMG Core 17 (Edge 44) | |
| HP Pavilion Gaming 17-cd0085cl (Edge 44.17763.1.0) | |
| Genomsnitt av klass Gaming (391 - 590, n=105, senaste 2 åren) | |
| Octane V2 - Total Score | |
| Genomsnitt av klass Gaming (87588 - 139447, n=30, senaste 2 åren) | |
| HP Pavilion Gaming 17-cd0085cl (Edge 44.17763.1.0) | |
| Schenker XMG Core 17 (Edge 44) | |
| Lenovo Legion Y740-17IRH (Edge 44) | |
| MSI GL75 9SEK-056US (Microsoft Edge 44.17763.1.0) | |
| Lenovo Legion Y740-17ICH (Edge 44.17763.1.0) | |
| Asus Strix Hero III G731GV (Edge 44.17763.1.0) | |
| JetStream 1.1 - 1.1 Total | |
| Genomsnitt av klass Gaming (518 - 647, n=5, senaste 2 åren) | |
| Schenker XMG Core 17 (Edge 44) | |
| HP Pavilion Gaming 17-cd0085cl (Edge 44.17763.1.0) | |
| MSI GL75 9SEK-056US (Microsoft Edge 44.17763.1.0) | |
| Lenovo Legion Y740-17IRH (Edge 44) | |
| Lenovo Legion Y740-17ICH (Edge 44.17763.1.0) | |
| Asus Strix Hero III G731GV (Edge 44.17763.1.0) | |
* ... mindre är bättre
| PCMark 8 Home Score Accelerated v2 | 4993 poäng | |
| PCMark 8 Creative Score Accelerated v2 | 6080 poäng | |
| PCMark 8 Work Score Accelerated v2 | 5931 poäng | |
| PCMark 10 Score | 5894 poäng | |
Hjälp | ||

| Lenovo Legion Y740-17IRH WDC PC SN520 SDAPMUW-128G | Lenovo Legion Y740-17ICH Samsung SSD PM981 MZVLB256HAHQ | Asus Strix Hero III G731GV Intel SSD 660p SSDPEKNW512G8 | MSI GL75 9SEK-056US WDC PC SN520 SDAPNUW-512G | Schenker XMG Core 17 Samsung SSD 970 EVO Plus 500GB | Dell G7 17 7790 Toshiba BG3 KBG30ZMS256G | HP Pavilion Gaming 17-cd0085cl Samsung SSD PM981 MZVLB256HAHQ | |
|---|---|---|---|---|---|---|---|
| CrystalDiskMark 5.2 / 6 | 86% | 52% | 57% | 104% | -25% | 106% | |
| Write 4K (MB/s) | 102.7 | 99.8 -3% | 129.3 26% | 149.1 45% | 99.3 -3% | 78.6 -23% | 135.3 32% |
| Read 4K (MB/s) | 29.12 | 40.81 40% | 54.4 87% | 48.58 67% | 38.47 32% | 31.89 10% | 63.7 119% |
| Write Seq (MB/s) | 362.2 | 1385 282% | 978 170% | 1449 300% | 230.4 -36% | 1337 269% | |
| Read Seq (MB/s) | 1010 | 2089 107% | 1447 43% | 1237 22% | 925 -8% | 1617 60% | |
| Write 4K Q32T1 (MB/s) | 298.1 | 380 27% | 476.8 60% | 462 55% | 364.4 22% | 159.1 -47% | 568 91% |
| Read 4K Q32T1 (MB/s) | 349.6 | 445.5 27% | 338.1 -3% | 606 73% | 421.9 21% | 315.6 -10% | 645 84% |
| Write Seq Q32T1 (MB/s) | 788 | 1380 75% | 982 25% | 1454 85% | 3276 316% | 230.7 -71% | 1428 81% |
| Read Seq Q32T1 (MB/s) | 1490 | 3471 133% | 1622 9% | 1724 16% | 3338 124% | 1323 -11% | 3184 114% |
| 3DMark 06 Standard Score | 40086 poäng | |
| 3DMark 11 Performance | 17637 poäng | |
| 3DMark Ice Storm Standard Score | 163805 poäng | |
| 3DMark Cloud Gate Standard Score | 35897 poäng | |
| 3DMark Fire Strike Score | 14256 poäng | |
| 3DMark Time Spy Score | 6118 poäng | |
Hjälp | ||
| The Witcher 3 - 1920x1080 Ultra Graphics & Postprocessing (HBAO+) | |
| Genomsnitt av klass Gaming (95 - 240, n=8, senaste 2 åren) | |
| Lenovo Legion Y740-17ICH | |
| Dell G7 17 7790 | |
| Lenovo Legion Y740-17IRH | |
| MSI GL75 9SEK-056US | |
| Asus Strix Hero III G731GV | |
| Schenker XMG Core 17 | |
| HP Pavilion Gaming 17-cd0085cl | |
| BioShock Infinite - 1920x1080 Ultra Preset, DX11 (DDOF) | |
| Lenovo Legion Y740-17ICH | |
| Lenovo Legion Y740-17IRH | |
| Asus Strix Hero III G731GV | |
| Schenker XMG Core 17 | |
| Dell G7 17 7790 | |
| HP Pavilion Gaming 17-cd0085cl | |
| Far Cry New Dawn - 1920x1080 Ultra Preset | |
| Lenovo Legion Y740-17IRH | |
| Schenker XMG Core 17 | |
| Far Cry 5 - 1920x1080 Ultra Preset AA:T | |
| Genomsnitt av klass Gaming (70 - 151, n=10, senaste 2 åren) | |
| Lenovo Legion Y740-17IRH | |
| Schenker XMG Core 17 | |
| Metro Exodus - 1920x1080 Ultra Quality AF:16x | |
| Lenovo Legion Y740-17IRH | |
| Total War: Three Kingdoms - 1920x1080 Ultra (incl textures) | |
| Lenovo Legion Y740-17IRH | |
| låg | med. | hög | ultra | |
|---|---|---|---|---|
| BioShock Infinite (2013) | 357 | 293.1 | 294.9 | 148.2 |
| The Witcher 3 (2015) | 282.4 | 198.4 | 114.6 | 58.4 |
| Far Cry 5 (2018) | 125 | 96 | 92 | 87 |
| Shadow of the Tomb Raider (2018) | 120 | 96 | 88 | 78 |
| Far Cry New Dawn (2019) | 124 | 96 | 93 | 83 |
| Metro Exodus (2019) | 136 | 73.8 | 56.3 | 46 |
| Total War: Three Kingdoms (2019) | 249.8 | 113 | 73.4 | 53.7 |
| Control (2019) | 215.9 | 77.6 | 57.4 | |
| Borderlands 3 (2019) | 119.9 | 93.7 | 67.6 | 52 |
| Ghost Recon Breakpoint (2019) | 120 | 84 | 79 | 57 |
Ljudnivå
| Låg belastning |
| 33 / 34 / 35 dB(A) |
| Hårddisk |
| 34 dB(A) |
| Hög belastning |
| 48 / 49 dB(A) |
 | ||
30 dB tyst 40 dB(A) hörbar 50 dB(A) högt ljud |
||
min: | ||
| Lenovo Legion Y740-17IRH i7-9750H, GeForce RTX 2060 Mobile | Lenovo Legion Y740-17ICH i7-8750H, GeForce RTX 2080 Max-Q | Asus Strix Hero III G731GV i7-9750H, GeForce RTX 2060 Mobile | MSI GL75 9SEK-056US i7-9750H, GeForce RTX 2060 Mobile | Schenker XMG Core 17 i7-9750H, GeForce GTX 1660 Ti Mobile | Dell G7 17 7790 i7-8750H, GeForce RTX 2070 Max-Q | HP Pavilion Gaming 17-cd0085cl i7-9750H, GeForce GTX 1660 Ti Max-Q | |
|---|---|---|---|---|---|---|---|
| Noise | 11% | 3% | 4% | 1% | 10% | 15% | |
| av / miljö * (dB) | 30 | 28.3 6% | 28.2 6% | 28.1 6% | 30 -0% | 28.2 6% | 28.2 6% |
| Idle Minimum * (dB) | 33 | 31.5 5% | 29.5 11% | 30.9 6% | 30 9% | 28.6 13% | 30.1 9% |
| Idle Average * (dB) | 34 | 31.6 7% | 30.3 11% | 30.9 9% | 32 6% | 28.6 16% | 30.1 11% |
| Idle Maximum * (dB) | 35 | 31.6 10% | 31.9 9% | 31 11% | 35 -0% | 28.6 18% | 30.1 14% |
| Load Average * (dB) | 48 | 32.3 33% | 50.4 -5% | 39 19% | 47 2% | 31.8 34% | 34.2 29% |
| Witcher 3 ultra * (dB) | 46 | 43 7% | 50.1 -9% | 53.5 -16% | 48 -4% | 50.6 -10% | 34.2 26% |
| Load Maximum * (dB) | 49 | 45.5 7% | 50.1 -2% | 53.5 -9% | 51 -4% | 50.8 -4% | 43.8 11% |
* ... mindre är bättre
(±) Den maximala temperaturen på ovansidan är 43 °C / 109 F, jämfört med genomsnittet av 40.4 °C / 105 F , allt från 21.2 till 68.8 °C för klassen Gaming.
(-) Botten värms upp till maximalt 46 °C / 115 F, jämfört med genomsnittet av 43.2 °C / 110 F
(+) Vid tomgångsbruk är medeltemperaturen för ovansidan 28.9 °C / 84 F, jämfört med enhetsgenomsnittet på 33.9 °C / ### class_avg_f### F.
(±) När du spelar The Witcher 3 är medeltemperaturen för ovansidan 36.3 °C / 97 F, jämfört med enhetsgenomsnittet på 33.9 °C / ## #class_avg_f### F.
(+) Handledsstöden och pekplattan är kallare än hudtemperaturen med maximalt 31 °C / 87.8 F och är därför svala att ta på.
(-) Medeltemperaturen för handledsstödsområdet på liknande enheter var 28.8 °C / 83.8 F (-2.2 °C / -4 F).
| Lenovo Legion Y740-17IRH i7-9750H, GeForce RTX 2060 Mobile | Lenovo Legion Y740-17ICH i7-8750H, GeForce RTX 2080 Max-Q | Asus Strix Hero III G731GV i7-9750H, GeForce RTX 2060 Mobile | MSI GL75 9SEK-056US i7-9750H, GeForce RTX 2060 Mobile | Schenker XMG Core 17 i7-9750H, GeForce GTX 1660 Ti Mobile | Dell G7 17 7790 i7-8750H, GeForce RTX 2070 Max-Q | HP Pavilion Gaming 17-cd0085cl i7-9750H, GeForce GTX 1660 Ti Max-Q | |
|---|---|---|---|---|---|---|---|
| Heat | 4% | -6% | -19% | -6% | -11% | -8% | |
| Maximum Upper Side * (°C) | 43 | 38.6 10% | 47.2 -10% | 49.4 -15% | 47 -9% | 46.6 -8% | 42.6 1% |
| Maximum Bottom * (°C) | 46 | 43.6 5% | 51 -11% | 50.6 -10% | 50 -9% | 57 -24% | 49 -7% |
| Idle Upper Side * (°C) | 31 | 30.2 3% | 30.2 3% | 39 -26% | 34 -10% | 34.4 -11% | 34 -10% |
| Idle Bottom * (°C) | 34 | 35 -3% | 35.4 -4% | 42 -24% | 32 6% | 34.6 -2% | 39.4 -16% |
* ... mindre är bättre
Lenovo Legion Y740-17IRH ljudanalys
(±) | högtalarljudstyrkan är genomsnittlig men bra (81 dB)
Bas 100 - 315 Hz
(±) | reducerad bas - i genomsnitt 9.8% lägre än medianen
(±) | linjäriteten för basen är genomsnittlig (13.2% delta till föregående frekvens)
Mellan 400 - 2000 Hz
(+) | balanserad mellan - endast 2.6% från medianen
(+) | mids är linjära (4.8% delta till föregående frekvens)
Högsta 2 - 16 kHz
(+) | balanserade toppar - endast 1.2% från medianen
(+) | toppar är linjära (2.7% delta till föregående frekvens)
Totalt 100 - 16 000 Hz
(+) | det totala ljudet är linjärt (10.6% skillnad mot median)
Jämfört med samma klass
» 7% av alla testade enheter i den här klassen var bättre, 2% liknande, 92% sämre
» Den bästa hade ett delta på 6%, genomsnittet var 18%, sämst var 132%
Jämfört med alla testade enheter
» 6% av alla testade enheter var bättre, 1% liknande, 93% sämre
» Den bästa hade ett delta på 4%, genomsnittet var 24%, sämst var 134%
Asus Strix Hero III G731GV ljudanalys
(±) | högtalarljudstyrkan är genomsnittlig men bra (81 dB)
Bas 100 - 315 Hz
(±) | reducerad bas - i genomsnitt 6.6% lägre än medianen
(±) | linjäriteten för basen är genomsnittlig (11.8% delta till föregående frekvens)
Mellan 400 - 2000 Hz
(+) | balanserad mellan - endast 2.8% från medianen
(+) | mids är linjära (6.7% delta till föregående frekvens)
Högsta 2 - 16 kHz
(+) | balanserade toppar - endast 1.8% från medianen
(+) | toppar är linjära (5.4% delta till föregående frekvens)
Totalt 100 - 16 000 Hz
(+) | det totala ljudet är linjärt (13.4% skillnad mot median)
Jämfört med samma klass
» 19% av alla testade enheter i den här klassen var bättre, 7% liknande, 74% sämre
» Den bästa hade ett delta på 6%, genomsnittet var 18%, sämst var 132%
Jämfört med alla testade enheter
» 14% av alla testade enheter var bättre, 4% liknande, 83% sämre
» Den bästa hade ett delta på 4%, genomsnittet var 24%, sämst var 134%
| Av/Standby | |
| Låg belastning | |
| Hög belastning |
|
Förklaring:
min: | |
| Lenovo Legion Y740-17IRH i7-9750H, GeForce RTX 2060 Mobile | Lenovo Legion Y740-17ICH i7-8750H, GeForce RTX 2080 Max-Q | Asus Strix Hero III G731GV i7-9750H, GeForce RTX 2060 Mobile | MSI GL75 9SEK-056US i7-9750H, GeForce RTX 2060 Mobile | Schenker XMG Core 17 i7-9750H, GeForce GTX 1660 Ti Mobile | Dell G7 17 7790 i7-8750H, GeForce RTX 2070 Max-Q | HP Pavilion Gaming 17-cd0085cl i7-9750H, GeForce GTX 1660 Ti Max-Q | |
|---|---|---|---|---|---|---|---|
| Power Consumption | -7% | -12% | 15% | 20% | 11% | 34% | |
| Idle Minimum * (Watt) | 20 | 20.2 -1% | 16.2 19% | 10.7 47% | 10 50% | 9.5 52% | 5.4 73% |
| Idle Average * (Watt) | 21 | 27.2 -30% | 24.8 -18% | 15.2 28% | 13 38% | 16.2 23% | 9.2 56% |
| Idle Maximum * (Watt) | 26 | 28.7 -10% | 28.6 -10% | 17.8 32% | 21 19% | 23.8 8% | 13 50% |
| Load Average * (Watt) | 97 | 90.8 6% | 127.6 -32% | 88.2 9% | 89 8% | 101.7 -5% | 85.9 11% |
| Witcher 3 ultra * (Watt) | 139 | 152.1 -9% | 147.1 -6% | 147.8 -6% | 128 8% | 155 -12% | 107.9 22% |
| Load Maximum * (Watt) | 168 | 165.4 2% | 212.7 -27% | 206.5 -23% | 177 -5% | 172.2 -2% | 182.2 -8% |
* ... mindre är bättre
| Lenovo Legion Y740-17IRH i7-9750H, GeForce RTX 2060 Mobile, 76 Wh | Lenovo Legion Y740-17ICH i7-8750H, GeForce RTX 2080 Max-Q, 76 Wh | Asus Strix Hero III G731GV i7-9750H, GeForce RTX 2060 Mobile, 66 Wh | MSI GL75 9SEK-056US i7-9750H, GeForce RTX 2060 Mobile, 51 Wh | Schenker XMG Core 17 i7-9750H, GeForce GTX 1660 Ti Mobile, 46.74 Wh | Dell G7 17 7790 i7-8750H, GeForce RTX 2070 Max-Q, 60 Wh | HP Pavilion Gaming 17-cd0085cl i7-9750H, GeForce GTX 1660 Ti Max-Q, 52.5 Wh | |
|---|---|---|---|---|---|---|---|
| Batteridrifttid | -26% | 5% | 1% | 17% | 32% | 31% | |
| Reader / Idle (h) | 6.9 | 7.9 14% | 8.1 17% | 8.5 23% | 11.6 68% | ||
| H.264 (h) | 4.3 | 5.3 23% | |||||
| WiFi v1.3 (h) | 4.3 | 3.2 -26% | 4.5 5% | 4.2 -2% | 4.7 9% | 3.9 -9% | 5.7 33% |
| Load (h) | 1.1 | 1 -9% | 1.3 18% | 2 82% | 1 -9% |
För
Emot
Läs den fullständiga versionen av den här recensionen på engelska här.
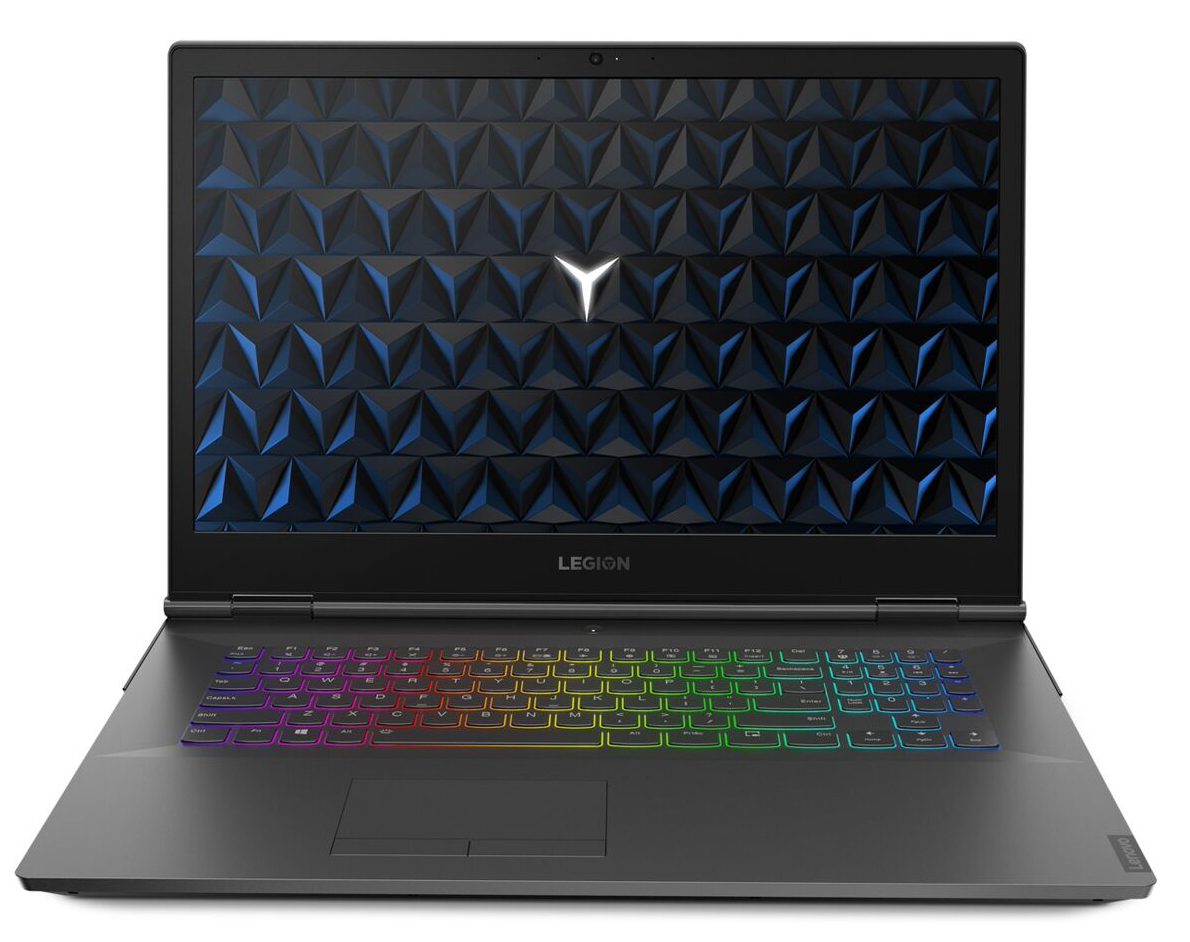
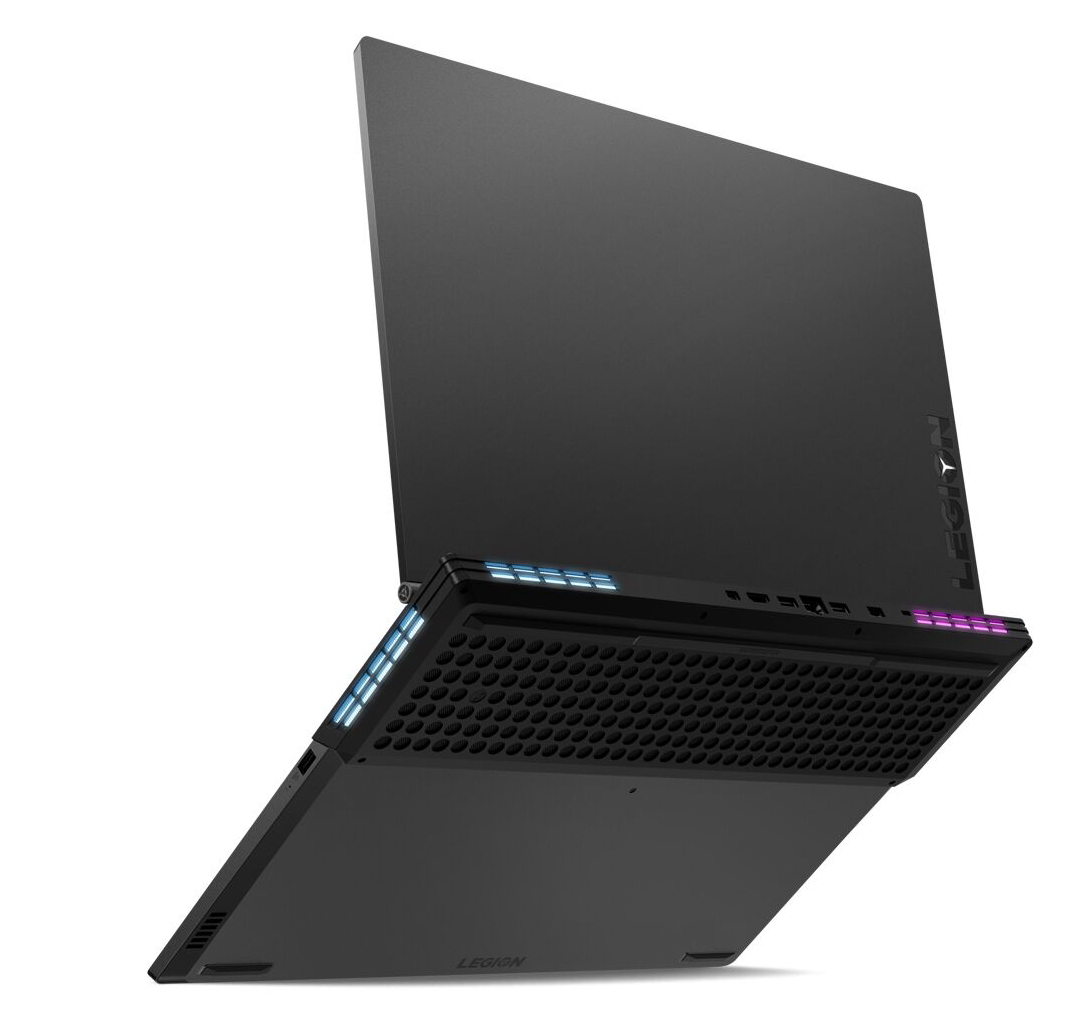
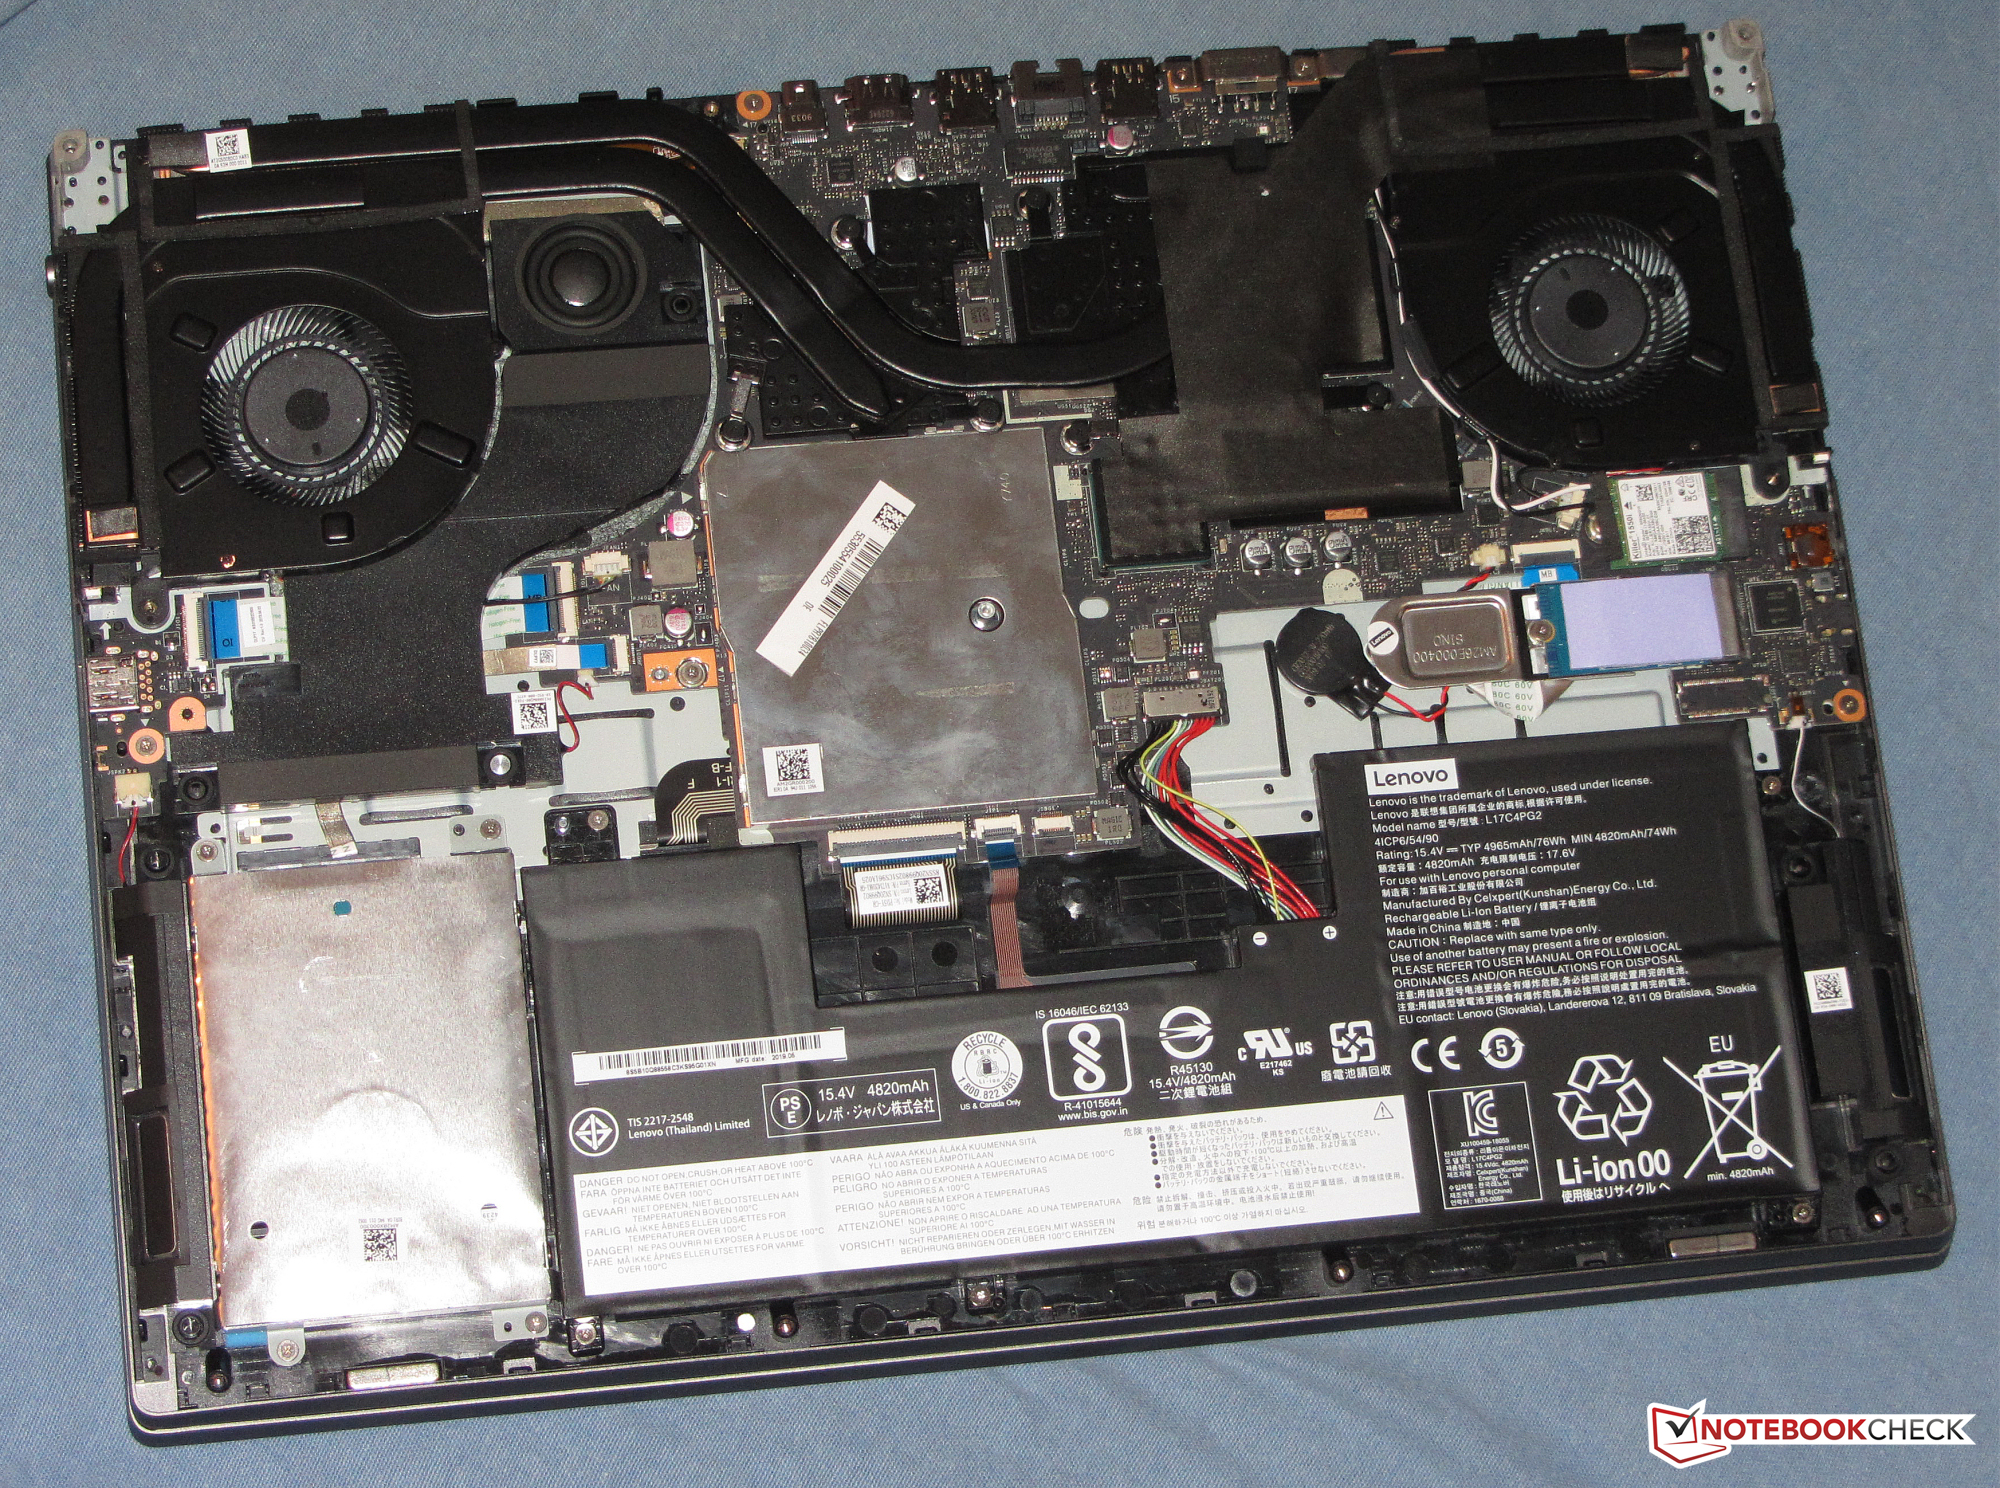
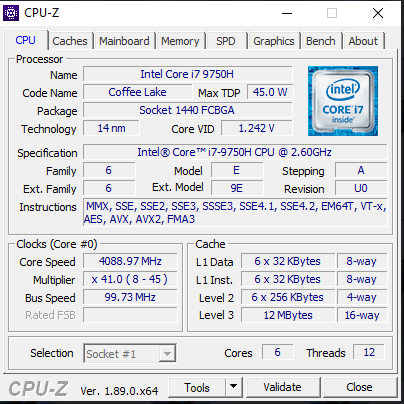
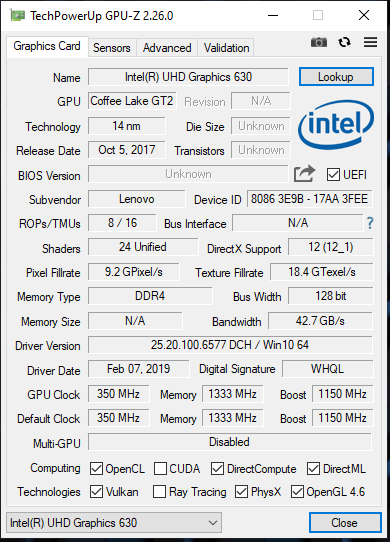
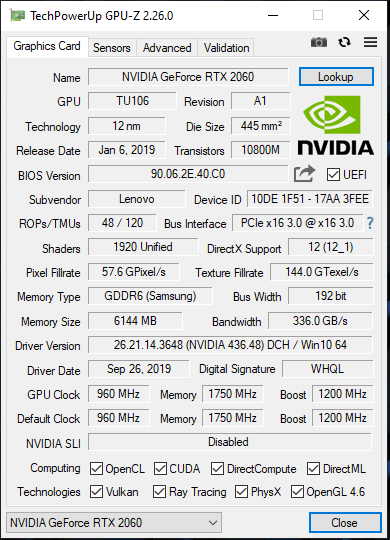
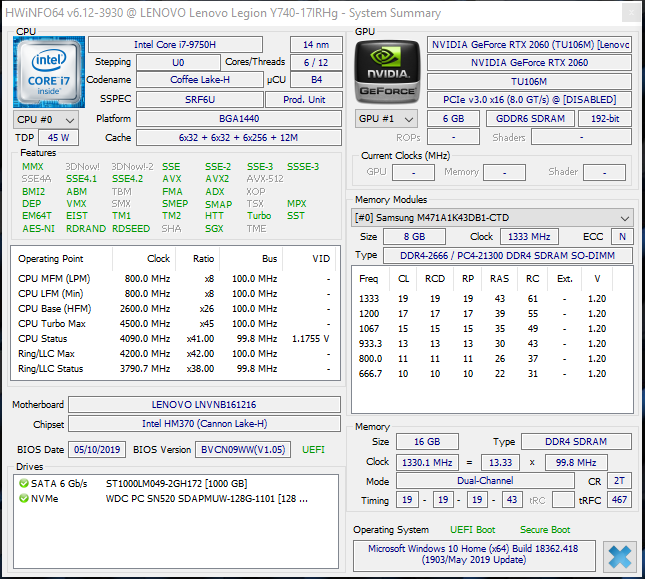
Lenovo har skapat en spellaptop på 17.3 tum som klarar av att visa alla moderna spel smidigt på sin matta Full HD-skärm tack vare en Core i7-9750H-processor och en GeForce RTX 2060 GPU. Spel kan spelas med höga till maximala inställningar. En annan höjdpunkt: enheten håller sig till rimliga temperaturer.
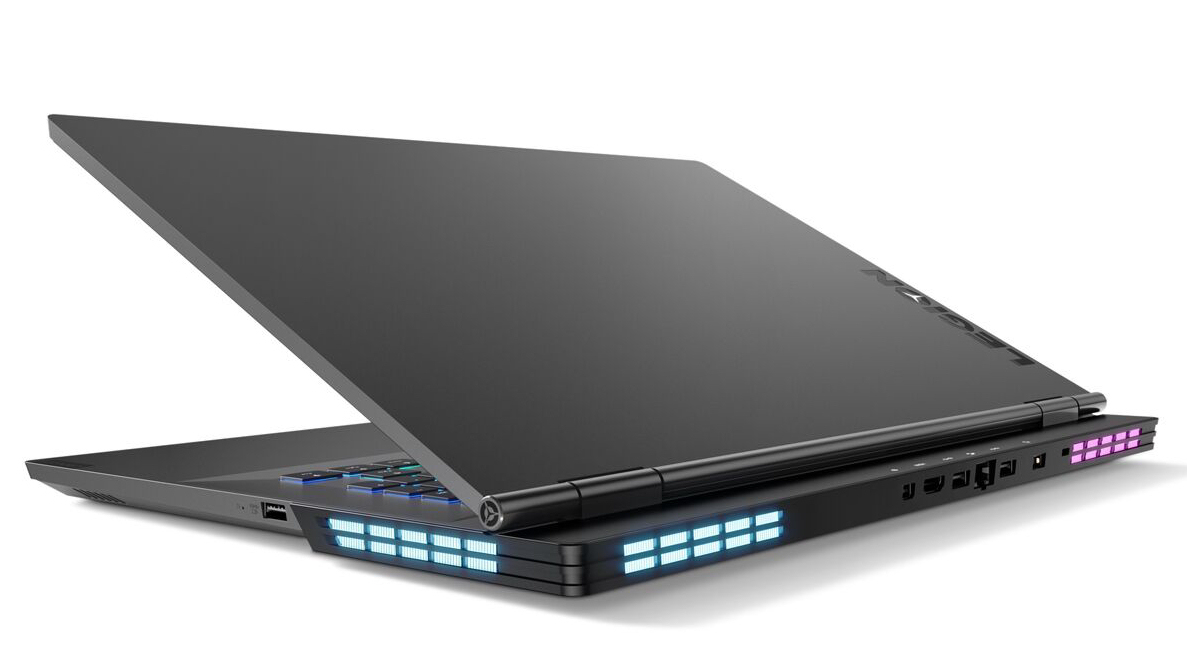
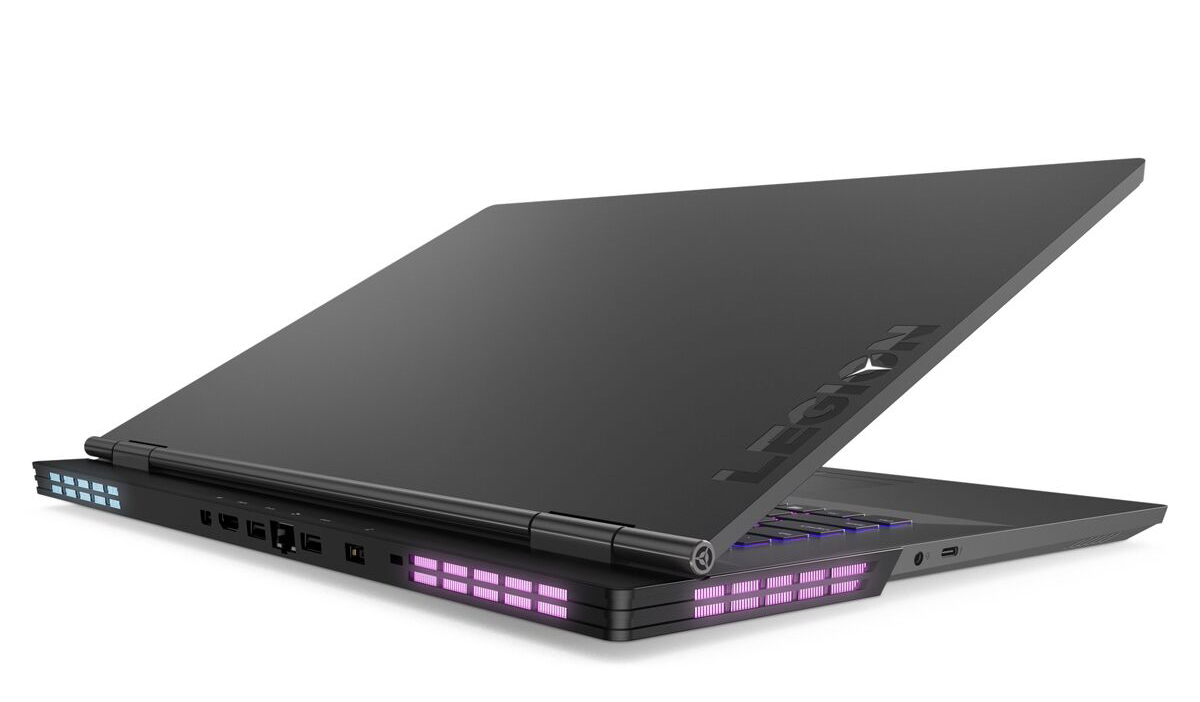
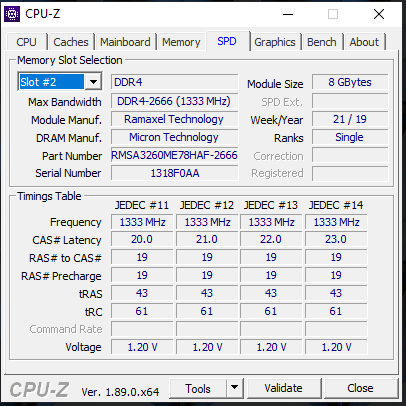
En NVMe SSD säkrar ett snabbt system. Utöver SSD-enheten kommer enheten med en hårddisk på 1 TB. Båda lagringsenheterna går att byta av användaren även om man då behöver ta bort basenhetens undersida.
Legion Y740-17IRHg gjorde ett totalt sett gott intryck och verkar inte ha några större svagheter.
IPS-skärmen med 144 Hz bilduppdatering har korta responstider, stabila betraktningsvinklar, bra kontrastförhållande och bra färgåtergivning. Dessutom har enheten stöd för G-Sync. Skärmen har dock relativt låg ljusstyrka - vi förväntar oss högre ljusstyrka från en enhet i det här prisskiktet.
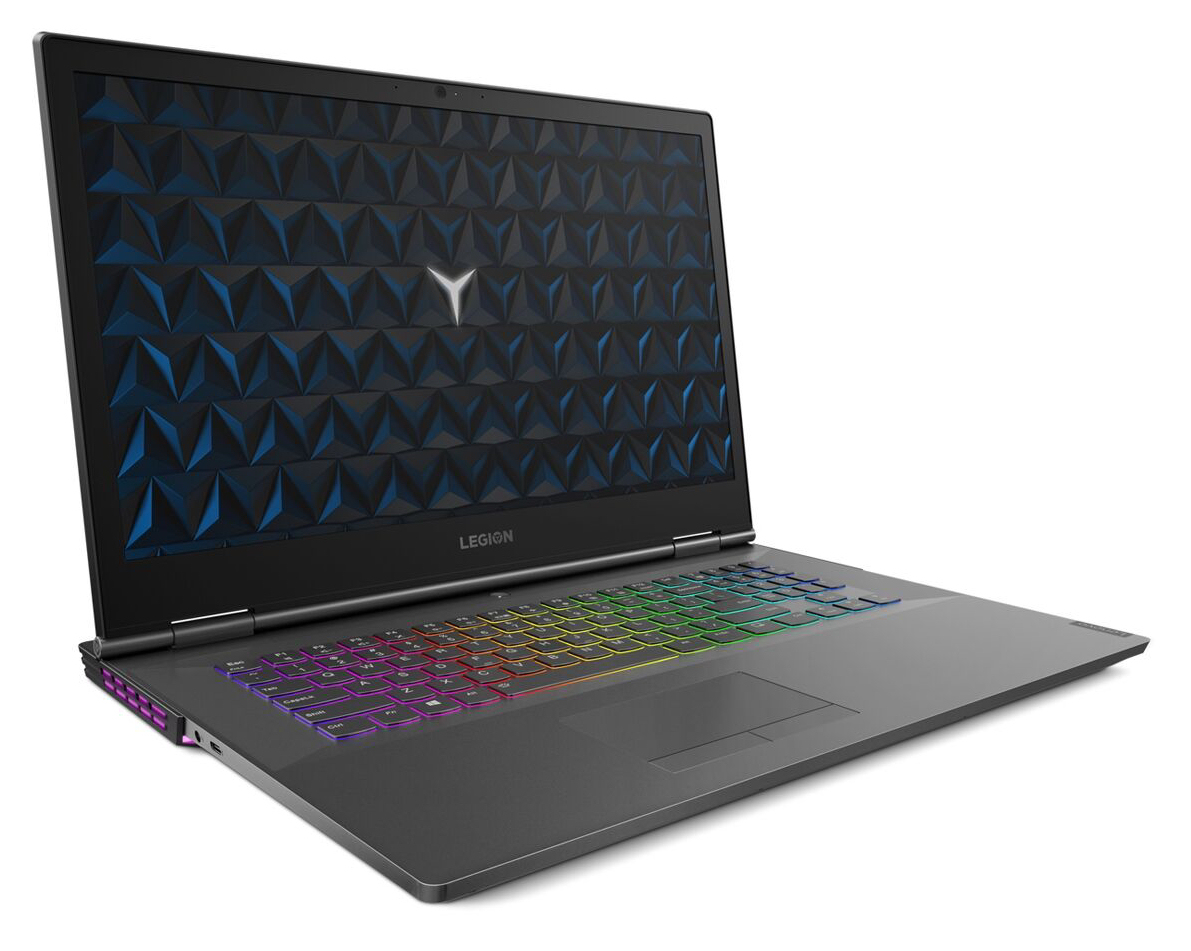
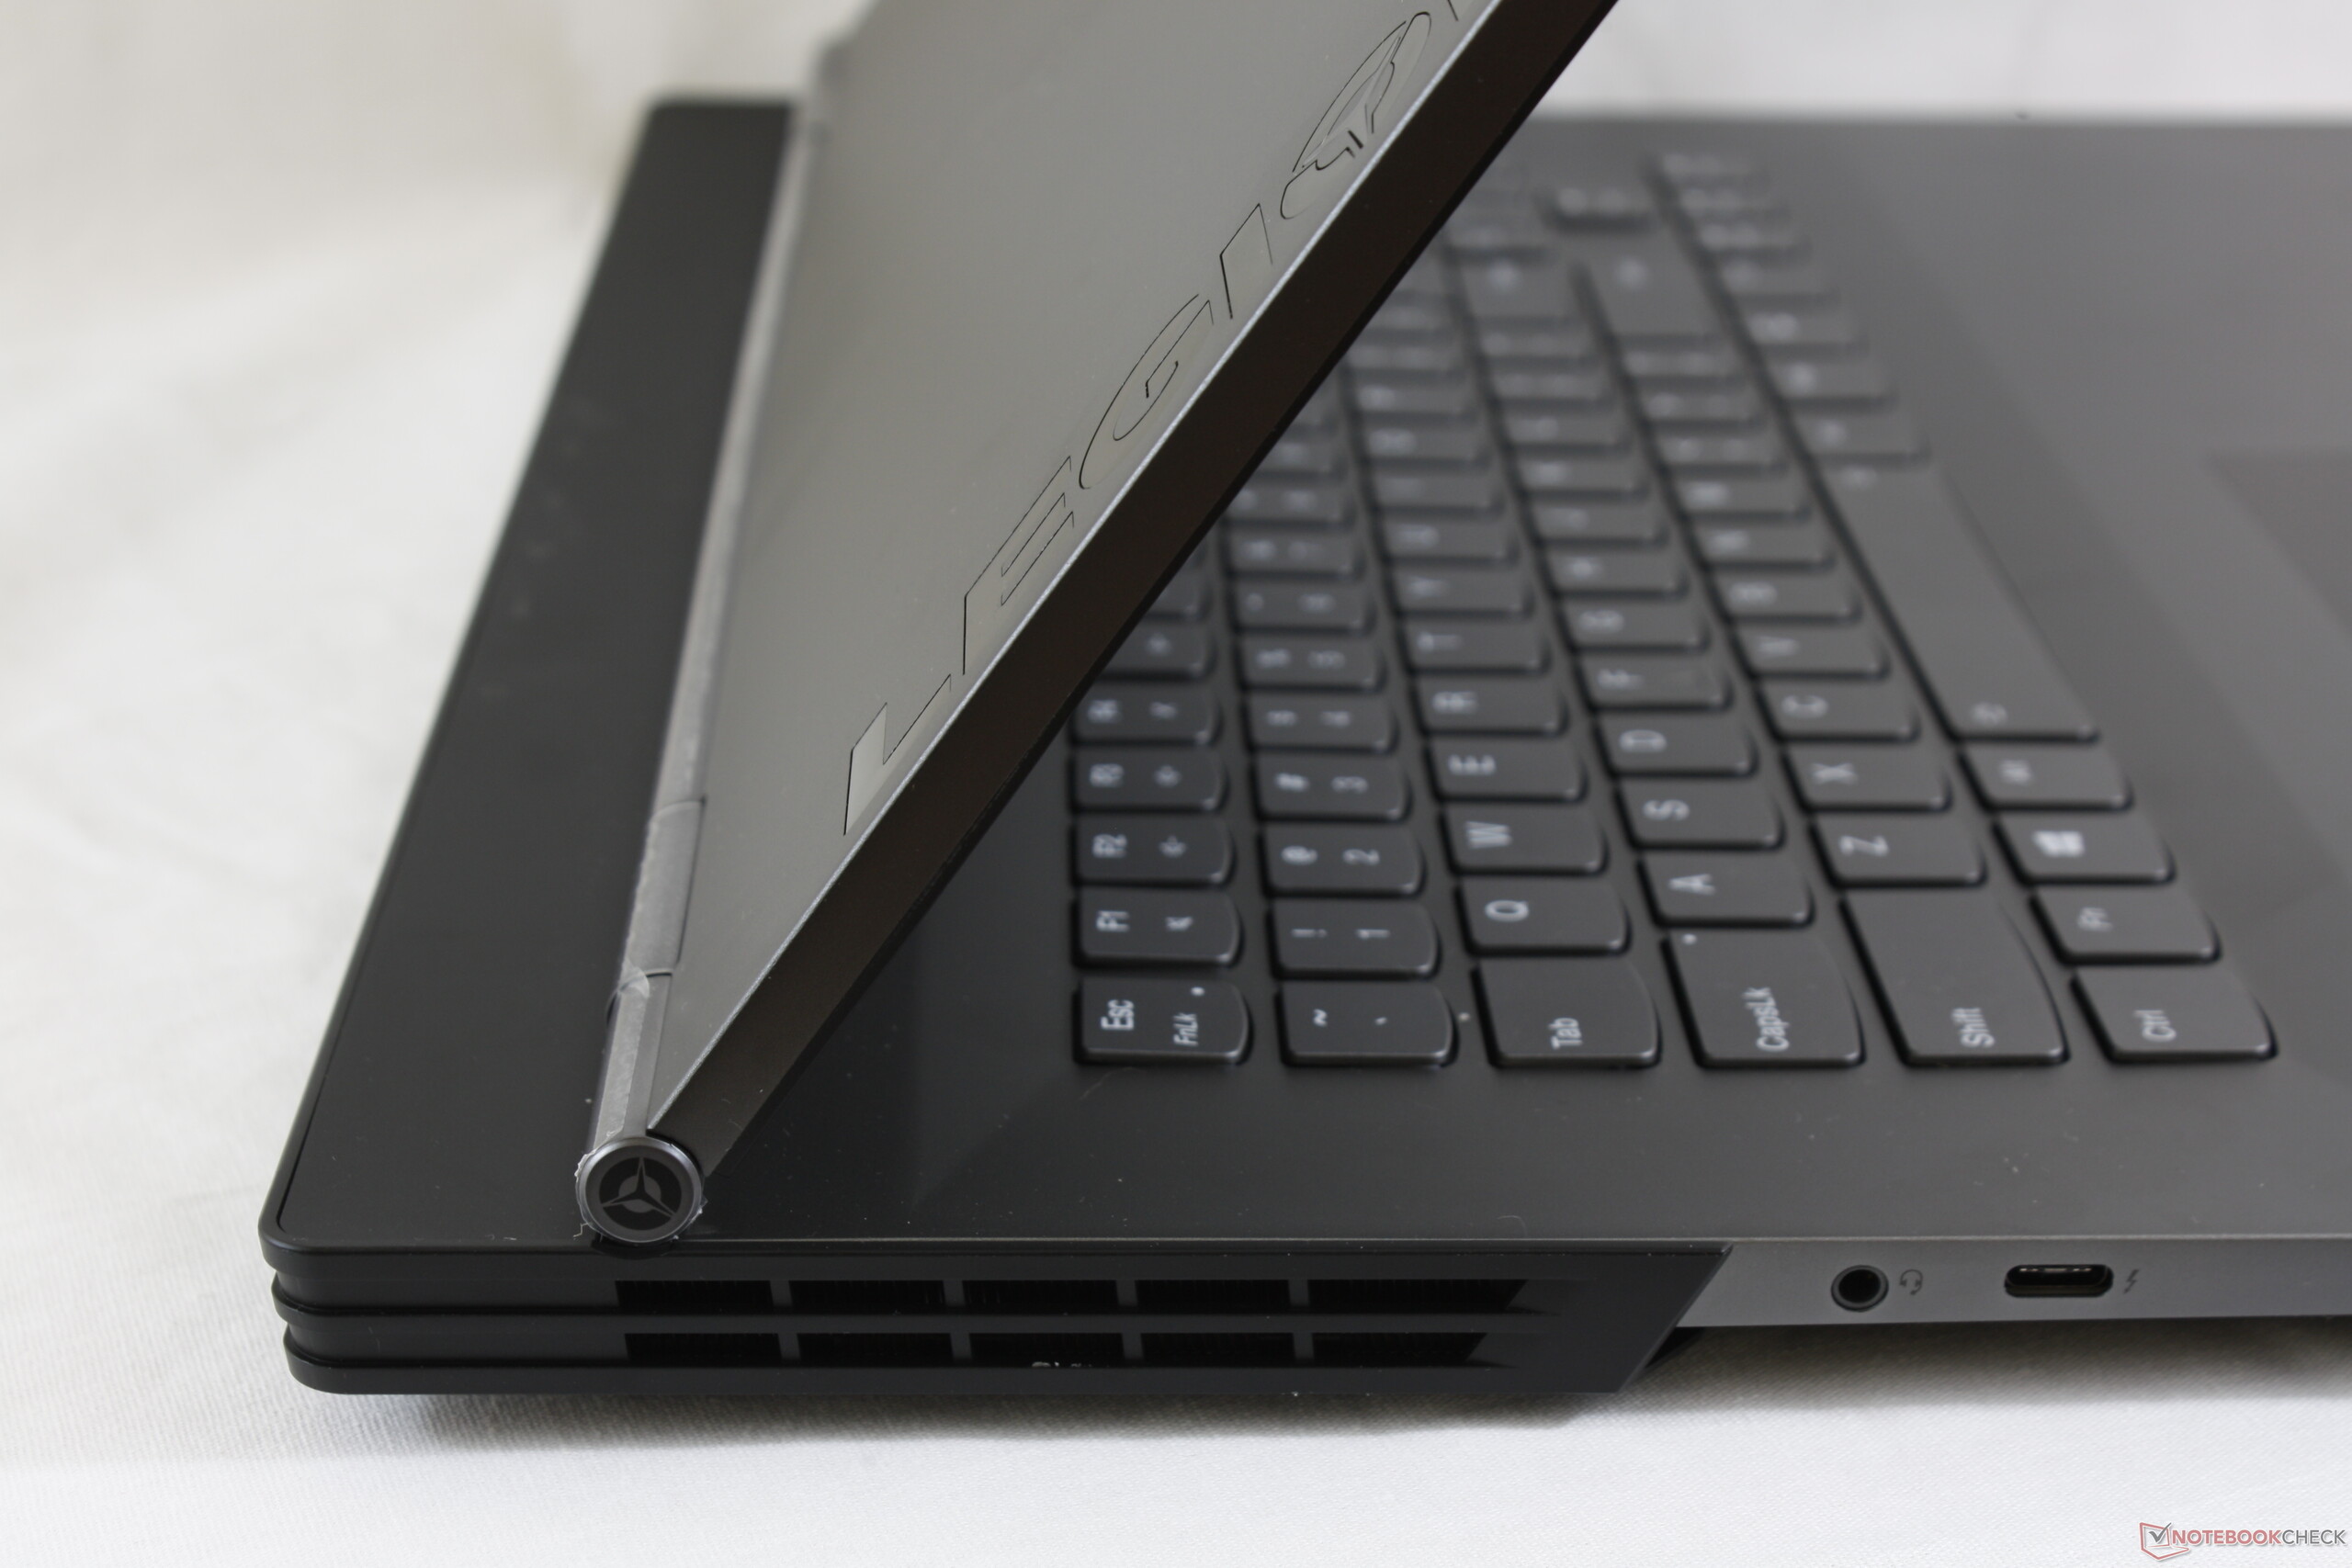
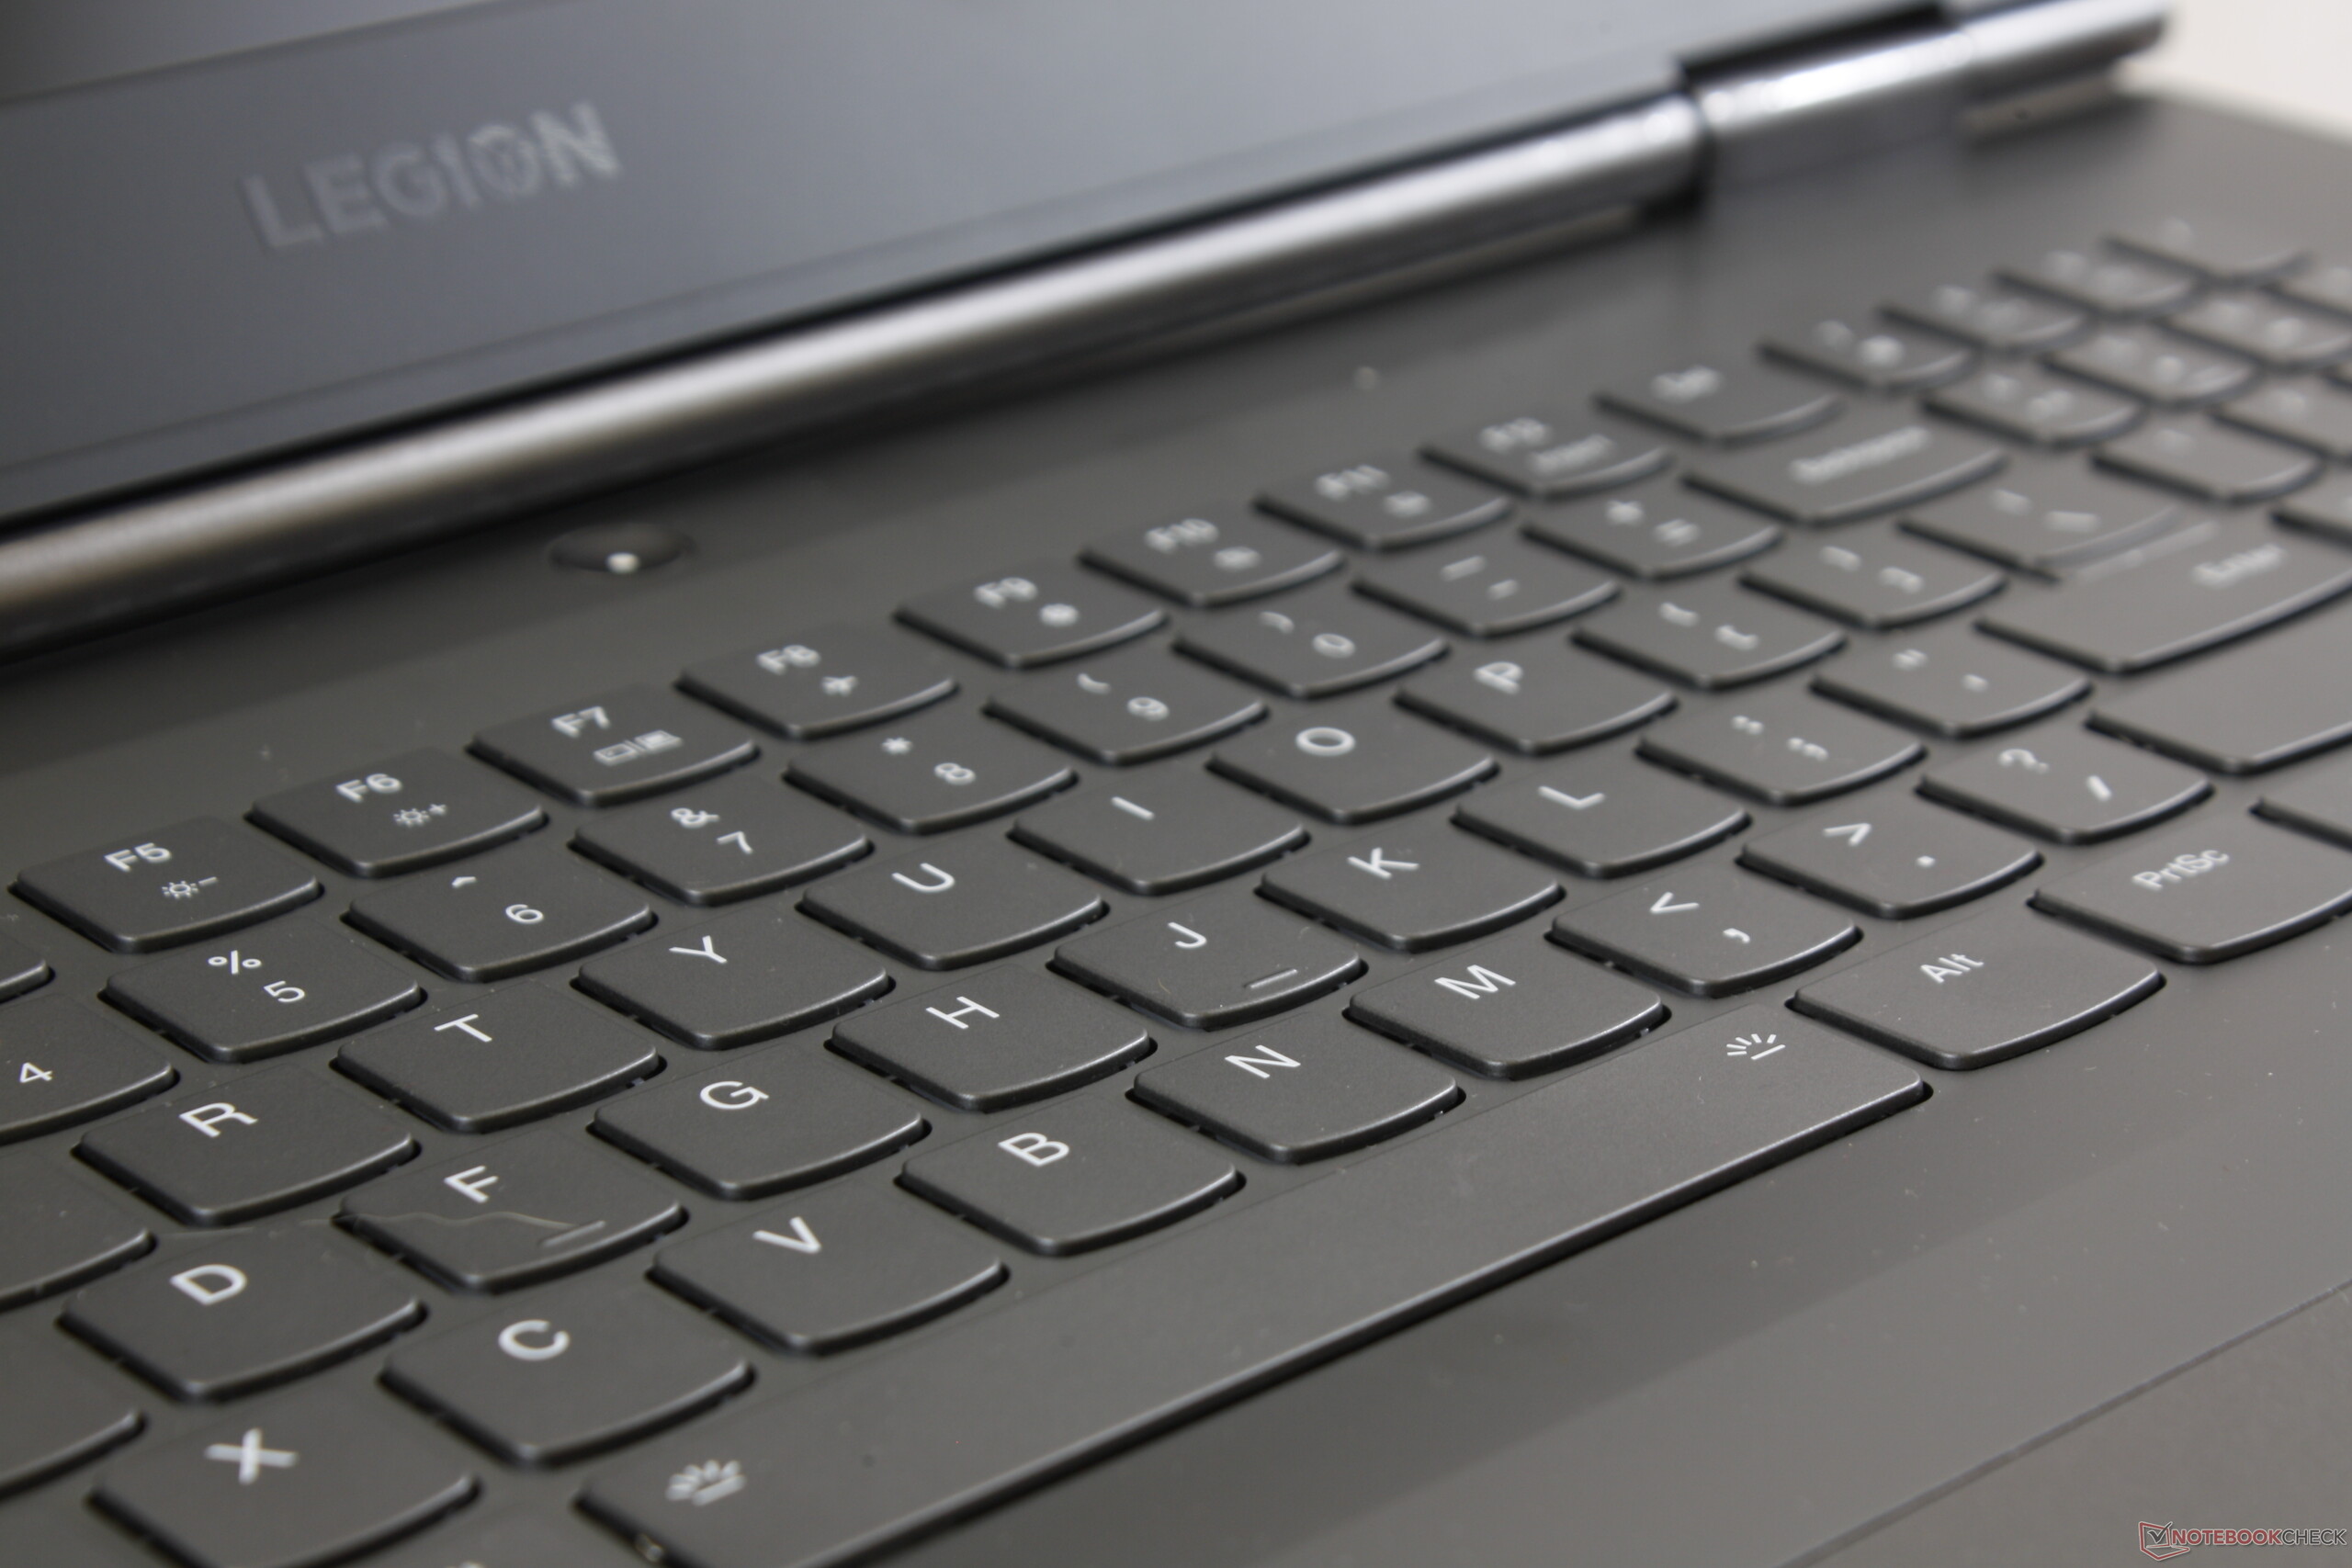
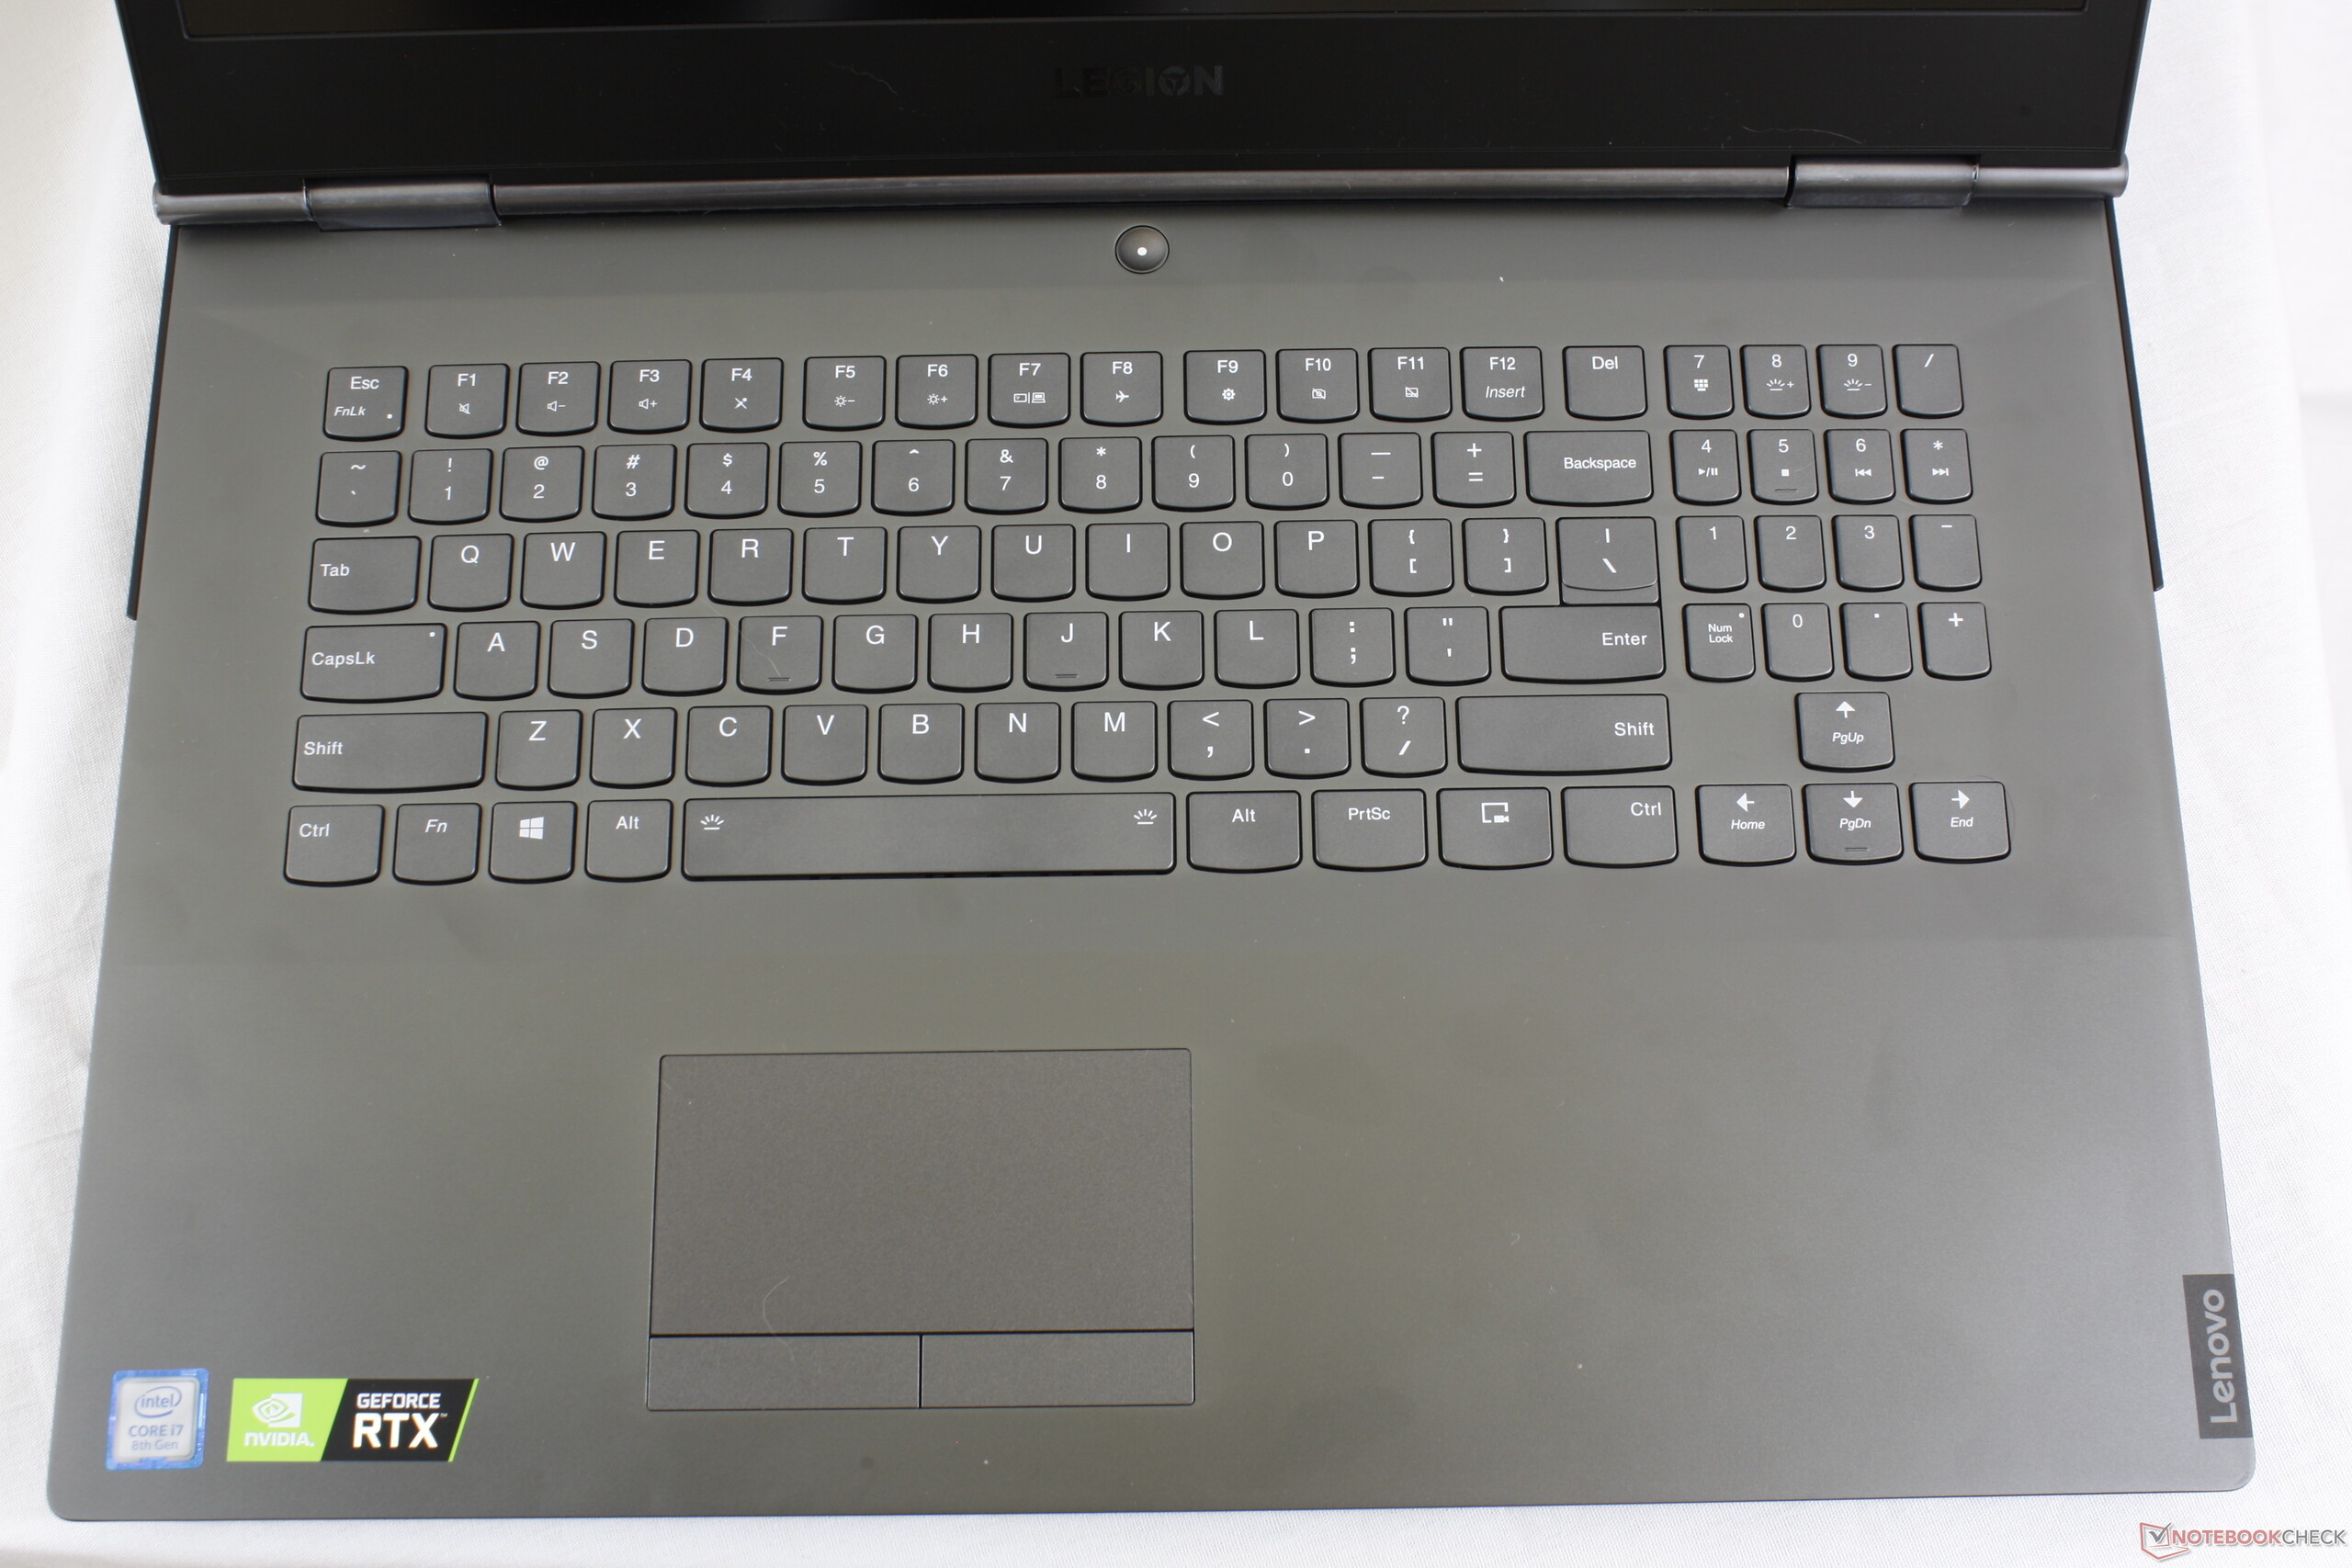
Tangentbordet (som har RGB-bakgrundsbelysning) visar sig passa bra för daglig användning. Batteritiden imponerar dock inte, men det går att ändra på det. Genom att slå på den inbyggda GPU:n går det att förbättra WiFi-batteritiden från 4:16 timmar till 6:11 timmar.
Lenovo Legion Y740-17IRH
- 05/14/2020 v7 (old)
Sascha Mölck
Price comparison
