Test: MSI GS75 8SG Stealth (i7-8750H, RTX 2080 Max-Q) Laptop (Sammanfattning)
| Networking | |
| iperf3 transmit AX12 | |
| MSI GE75 8SF | |
| Schenker XMG Neo 17 | |
| MSI GS75 8SG Stealth | |
| Asus Zephyrus S GX701GX | |
| Lenovo Legion Y740-17ICH | |
| iperf3 receive AX12 | |
| MSI GS75 8SG Stealth | |
| Asus Zephyrus S GX701GX | |
| Schenker XMG Neo 17 | |
| MSI GE75 8SF | |
| Lenovo Legion Y740-17ICH | |

| |||||||||||||||||||||||||
Distribution av ljusstyrkan: 85 %
Mitt på batteriet: 355 cd/m²
Kontrast: 1365:1 (Svärta: 0.26 cd/m²)
ΔE ColorChecker Calman: 1.54 | ∀{0.5-29.43 Ø4.72}
calibrated: 0.77
ΔE Greyscale Calman: 2.19 | ∀{0.09-98 Ø4.97}
95% sRGB (Argyll 1.6.3 3D)
61% AdobeRGB 1998 (Argyll 1.6.3 3D)
65.5% AdobeRGB 1998 (Argyll 3D)
95.4% sRGB (Argyll 3D)
63.6% Display P3 (Argyll 3D)
Gamma: 2.42
CCT: 6893 K
| MSI GS75 8SG Stealth N173HCE-G33 (CMN175C), IPS, 1920x1080 | Asus Zephyrus S GX701GX B173HAN04.0 (AUO409D), IPS, 1920x1080 | Lenovo Legion Y740-17ICH AU Optronics B173HAN03.2, IPS, 1920x1080 | Schenker XMG Neo 17 BOEhydis NV173FHM-N44 (BOE07B6), IPS, 1920x1080 | MSI GE75 8SF Chi Mei N173HCE-G33, IPS, 1920x1080 | |
|---|---|---|---|---|---|
| Display | -4% | -2% | 1% | -1% | |
| Display P3 Coverage (%) | 63.6 | 62.9 -1% | 64 1% | 65.2 3% | 63.1 -1% |
| sRGB Coverage (%) | 95.4 | 87.8 -8% | 90.4 -5% | 92.2 -3% | 94.4 -1% |
| AdobeRGB 1998 Coverage (%) | 65.5 | 63.9 -2% | 64.8 -1% | 66.5 2% | 65.2 0% |
| Response Times | 3% | -69% | -86% | -17% | |
| Response Time Grey 50% / Grey 80% * (ms) | 7.6 ? | 7.2 ? 5% | 15.6 ? -105% | 18.8 ? -147% | 9.6 ? -26% |
| Response Time Black / White * (ms) | 9.6 ? | 9.6 ? -0% | 12.8 ? -33% | 12 ? -25% | 10.4 ? -8% |
| PWM Frequency (Hz) | 25510 ? | 971 ? | 25770 ? | ||
| Screen | -29% | -99% | -31% | -1% | |
| Brightness middle (cd/m²) | 355 | 288 -19% | 299.1 -16% | 304 -14% | 370.4 4% |
| Brightness (cd/m²) | 327 | 287 -12% | 273 -17% | 289 -12% | 348 6% |
| Brightness Distribution (%) | 85 | 91 7% | 81 -5% | 90 6% | 89 5% |
| Black Level * (cd/m²) | 0.26 | 0.2 23% | 0.27 -4% | 0.26 -0% | 0.29 -12% |
| Contrast (:1) | 1365 | 1440 5% | 1108 -19% | 1169 -14% | 1277 -6% |
| Colorchecker dE 2000 * | 1.54 | 2.33 -51% | 5.07 -229% | 2.65 -72% | 1.26 18% |
| Colorchecker dE 2000 max. * | 3 | 5.34 -78% | 10.55 -252% | 6.11 -104% | 3.02 -1% |
| Colorchecker dE 2000 calibrated * | 0.77 | 2.47 -221% | 3.31 -330% | 1.5 -95% | 1.21 -57% |
| Greyscale dE 2000 * | 2.19 | 1.19 46% | 6.8 -211% | 2.75 -26% | 1.4 36% |
| Gamma | 2.42 91% | 2.41 91% | 2.46 89% | 2.46 89% | 2.2 100% |
| CCT | 6893 94% | 6710 97% | 7805 83% | 6763 96% | 6747 96% |
| Color Space (Percent of AdobeRGB 1998) (%) | 61 | 57 -7% | 58.5 -4% | 60 -2% | 59.7 -2% |
| Color Space (Percent of sRGB) (%) | 95 | 88 -7% | 89.9 -5% | 92 -3% | 94.4 -1% |
| Totalt genomsnitt (program/inställningar) | -10% /
-20% | -57% /
-77% | -39% /
-32% | -6% /
-3% |
* ... mindre är bättre
Visa svarstider
| ↔ Svarstid svart till vitt | ||
|---|---|---|
| 9.6 ms ... stiga ↗ och falla ↘ kombinerat | ↗ 5.2 ms stiga | 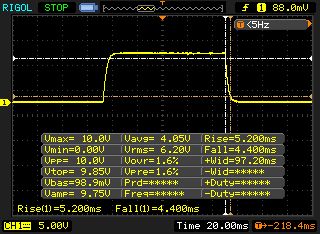 |
| ↘ 4.4 ms hösten | ||
| Skärmen visar snabba svarsfrekvenser i våra tester och bör passa för spel. I jämförelse sträcker sig alla testade enheter från 0.1 (minst) till 240 (maximalt) ms. » 26 % av alla enheter är bättre. Det betyder att den uppmätta svarstiden är bättre än genomsnittet av alla testade enheter (19.8 ms). | ||
| ↔ Svarstid 50 % grått till 80 % grått | ||
| 7.6 ms ... stiga ↗ och falla ↘ kombinerat | ↗ 3.8 ms stiga | 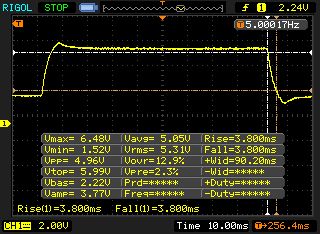 |
| ↘ 3.8 ms hösten | ||
| Skärmen visar väldigt snabba svarsfrekvenser i våra tester och borde vara mycket väl lämpad för fartfyllt spel. I jämförelse sträcker sig alla testade enheter från 0.165 (minst) till 636 (maximalt) ms. » 20 % av alla enheter är bättre. Det betyder att den uppmätta svarstiden är bättre än genomsnittet av alla testade enheter (31 ms). | ||
Skärmflimmer / PWM (Puls-Width Modulation)
| Skärmflimmer / PWM upptäckt | 25510 Hz | ≤ 17 % ljusstyrka inställning | 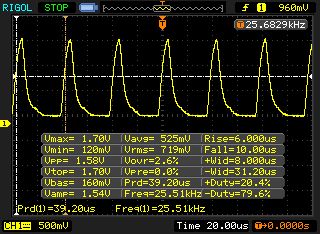 |
Displayens bakgrundsbelysning flimrar vid 25510 Hz (i värsta fall, t.ex. med PWM) Flimrande upptäckt vid en ljusstyrkeinställning på 17 % och lägre. Det ska inte finnas något flimmer eller PWM över denna ljusstyrkeinställning. Frekvensen för 25510 Hz är ganska hög, så de flesta användare som är känsliga för PWM bör inte märka något flimmer. Som jämförelse: 52 % av alla testade enheter använder inte PWM för att dämpa skärmen. Om PWM upptäcktes mättes ett medelvärde av 7769 (minst: 5 - maximum: 343500) Hz. | |||
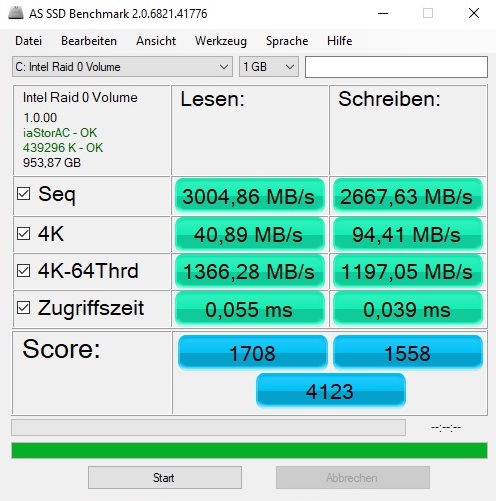
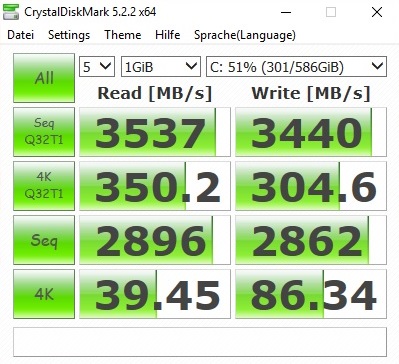
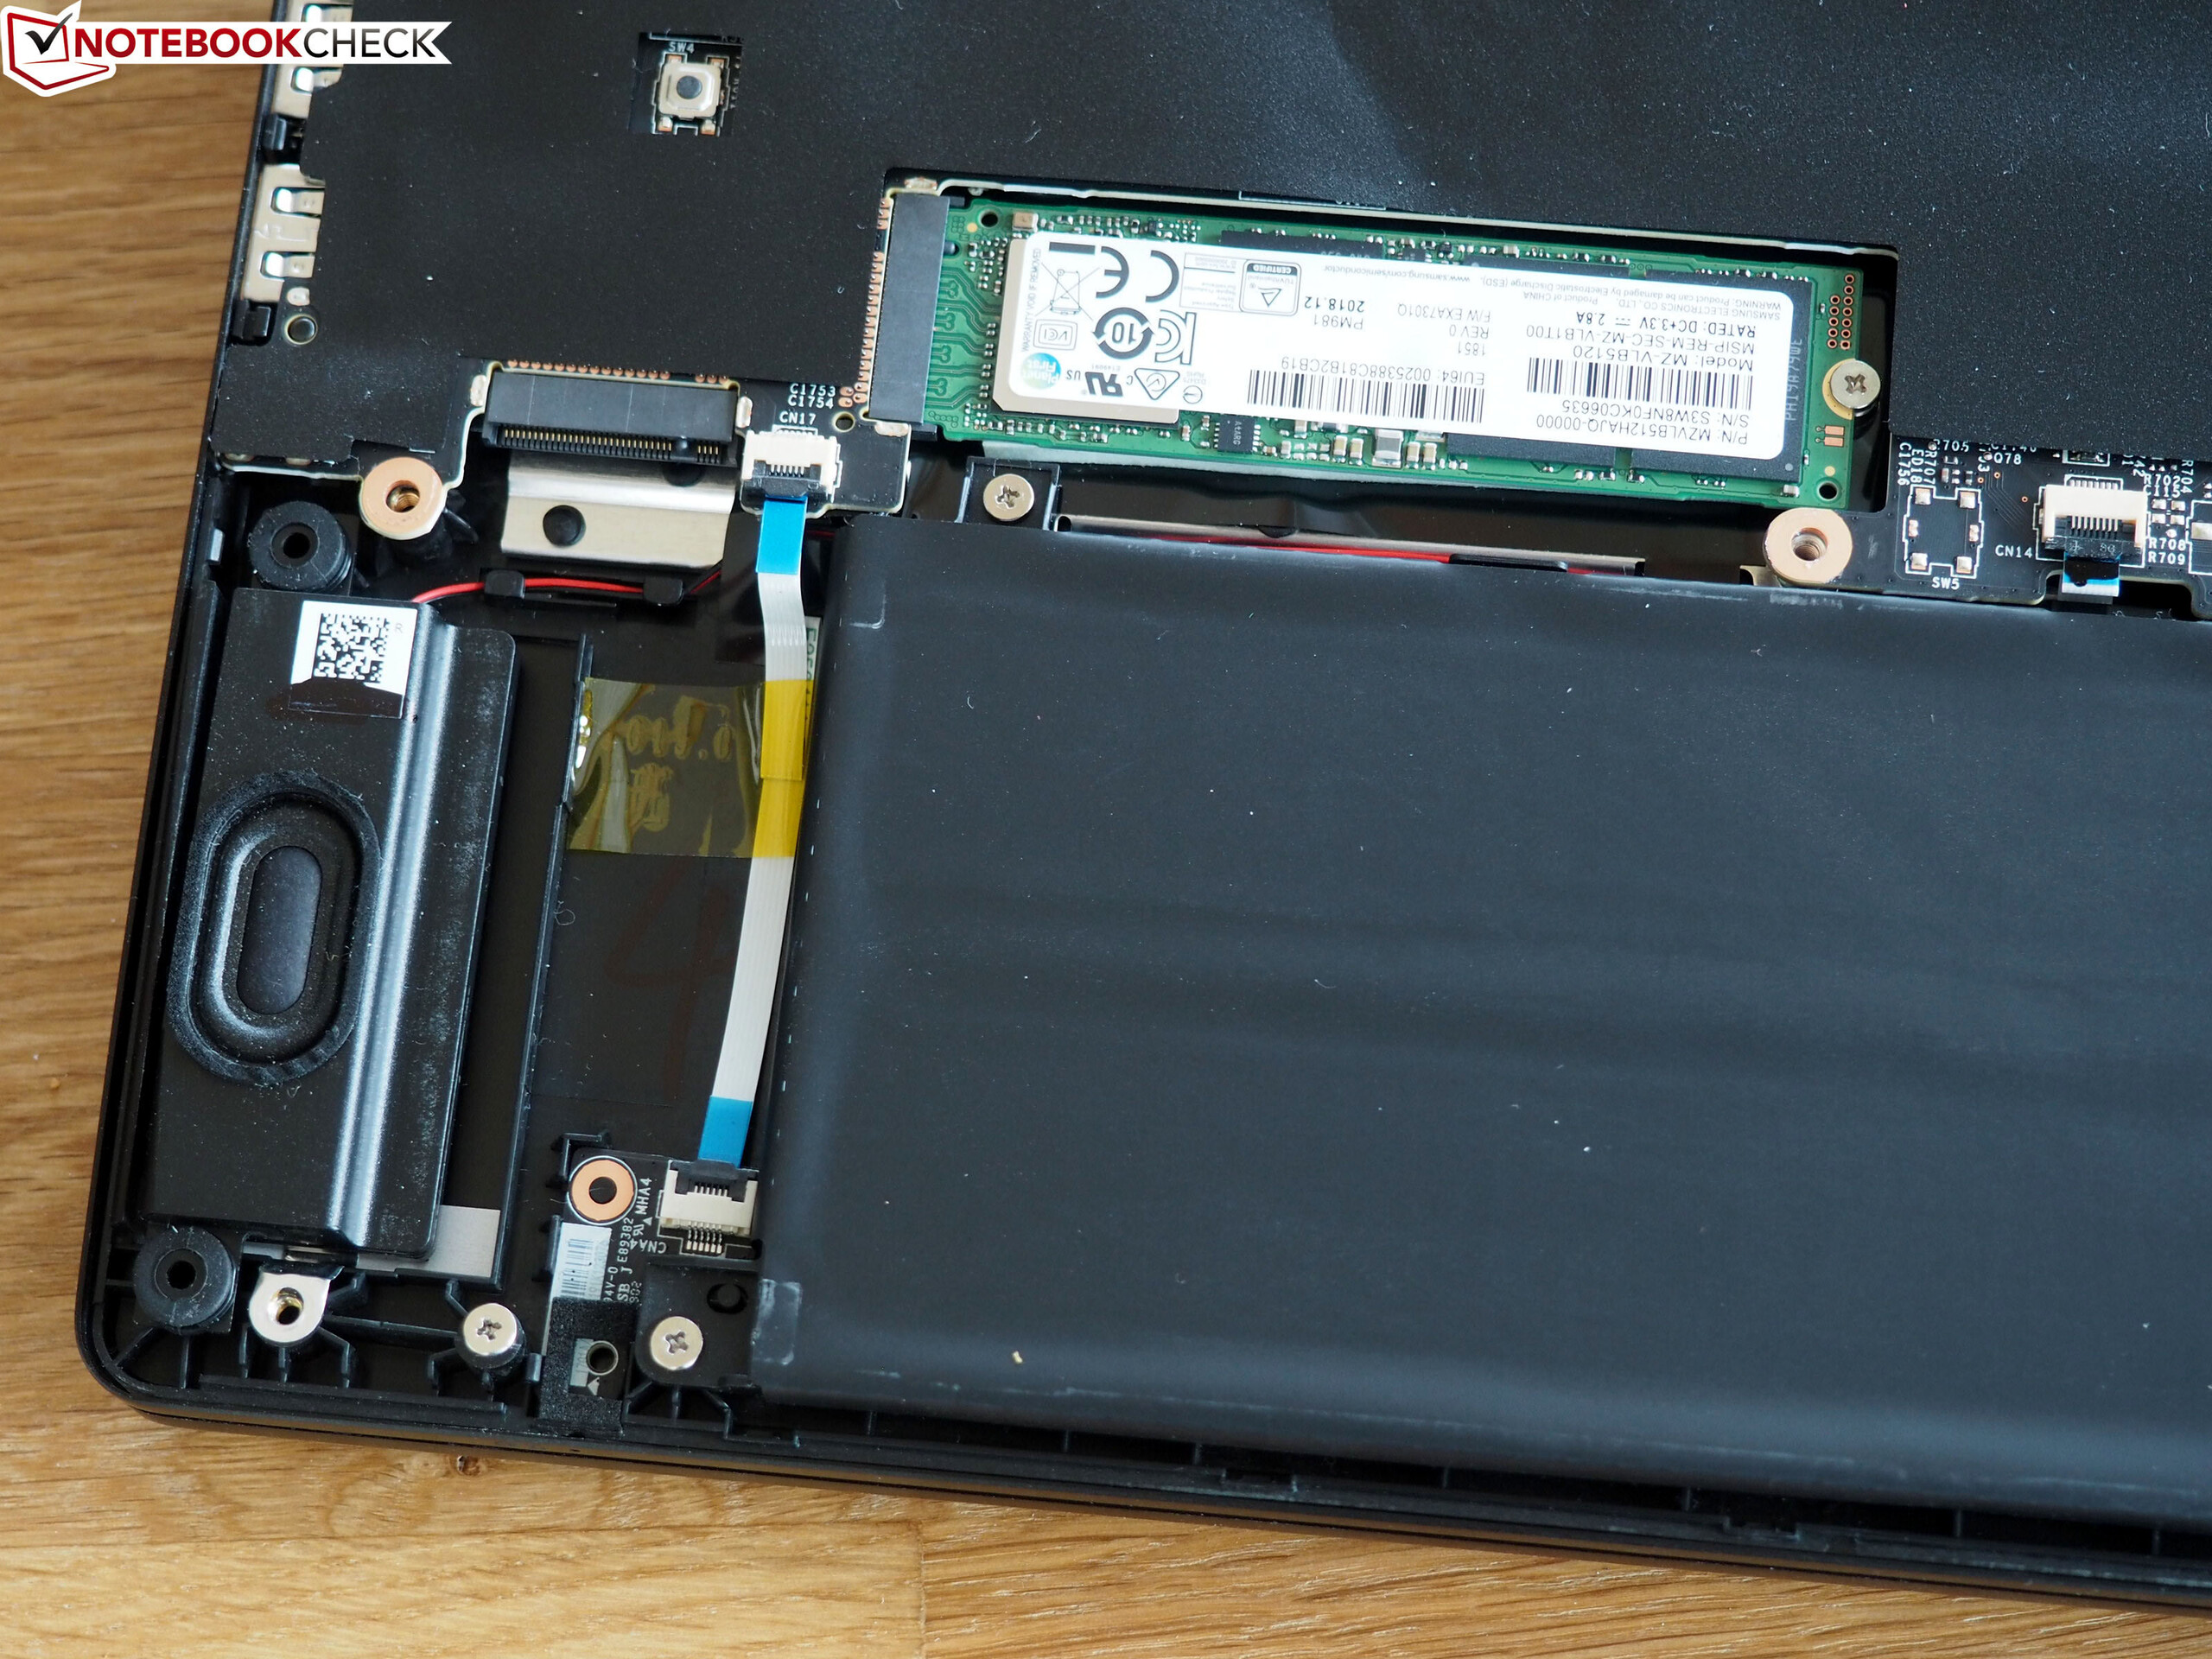
| MSI GS75 8SG Stealth 2x Samsung SSD PM981 MZVLB512HAJQ (RAID 0) | Asus Zephyrus S GX701GX Samsung SSD PM981 MZVLB1T0HALR | Lenovo Legion Y740-17ICH Samsung SSD PM981 MZVLB256HAHQ | Schenker XMG Neo 17 Samsung SSD 970 EVO Plus 1TB | MSI GE75 8SF Kingston RBUSNS8154P3256GJ1 | |
|---|---|---|---|---|---|
| AS SSD | 10% | -29% | 23% | -49% | |
| Seq Read (MB/s) | 3005 | 911 -70% | 1153 -62% | 2359 -21% | 949 -68% |
| Seq Write (MB/s) | 2668 | 2347 -12% | 1328 -50% | 2469 -7% | 823 -69% |
| 4K Read (MB/s) | 40.89 | 53 30% | 35.05 -14% | 53.5 31% | 25.36 -38% |
| 4K Write (MB/s) | 94.4 | 122.5 30% | 96 2% | 117.6 25% | 67.1 -29% |
| 4K-64 Read (MB/s) | 1366 | 1577 15% | 727 -47% | 1579 16% | 748 -45% |
| 4K-64 Write (MB/s) | 1197 | 1734 45% | 1212 1% | 2048 71% | 650 -46% |
| Score Read (Points) | 1708 | 1721 1% | 878 -49% | 1869 9% | 869 -49% |
| Score Write (Points) | 1558 | 2091 34% | 1441 -8% | 2413 55% | 799 -49% |
| Score Total (Points) | 4123 | 4771 16% | 2784 -32% | 5248 27% | 2109 -49% |

| 3DMark 11 - 1280x720 Performance GPU | |
| Genomsnitt av klass Gaming (21841 - 80022, n=106, senaste 2 åren) | |
| Asus Zephyrus S GX701GX | |
| MSI GS75 8SG Stealth | |
| MSI GE75 8SF | |
| Lenovo Legion Y740-17ICH | |
| Schenker XMG Neo 17 | |
| 3DMark 11 Performance | 19735 poäng | |
| 3DMark Fire Strike Score | 15962 poäng | |
| 3DMark Time Spy Score | 7180 poäng | |
Hjälp | ||
| The Witcher 3 | |
| 1920x1080 Ultra Graphics & Postprocessing (HBAO+) | |
| Genomsnitt av klass Gaming (95 - 240, n=8, senaste 2 åren) | |
| Asus Zephyrus S GX701GX | |
| MSI GS75 8SG Stealth | |
| Lenovo Legion Y740-17ICH | |
| Schenker XMG Neo 17 | |
| MSI GE75 8SF | |
| 3840x2160 High Graphics & Postprocessing (Nvidia HairWorks Off) | |
| Genomsnitt av klass Gaming (114 - 169.8, n=3, senaste 2 åren) | |
| Asus Zephyrus S GX701GX | |
| MSI GS75 8SG Stealth | |
| Schenker XMG Neo 17 | |
| låg | med. | hög | ultra | QHD | 4K | |
|---|---|---|---|---|---|---|
| The Witcher 3 (2015) | 75.4 | 50.6 | ||||
| Shadow of the Tomb Raider (2018) | 75 | 58 | 33 | |||
| Battlefield V (2018) | 112 | 91.2 | 52.4 | |||
| Apex Legends (2019) | 130 | 128 | ||||
| Far Cry New Dawn (2019) | 92 | 82 | ||||
| Metro Exodus (2019) | 66.4 | 54 | ||||
| Anthem (2019) | 86.1 | 78.9 | ||||
| Dirt Rally 2.0 (2019) | 143 | 85.1 | ||||
| The Division 2 (2019) | 93 | 77 |
Ljudnivå
| Låg belastning |
| 31 / 32 / 41 dB(A) |
| Hög belastning |
| 47 / 48 dB(A) |
 | ||
30 dB tyst 40 dB(A) hörbar 50 dB(A) högt ljud |
||
min: | ||
| MSI GS75 8SG Stealth GeForce RTX 2080 Max-Q, i7-8750H | Asus Zephyrus S GX701GX GeForce RTX 2080 Max-Q, i7-8750H | Lenovo Legion Y740-17ICH GeForce RTX 2080 Max-Q, i7-8750H | Schenker XMG Neo 17 GeForce RTX 2070 Mobile, i7-8750H | MSI GE75 8SF GeForce RTX 2070 Mobile, i7-8750H | Genomsnitt av klass Gaming | |
|---|---|---|---|---|---|---|
| Noise | 3% | 10% | 5% | 0% | 12% | |
| av / miljö * (dB) | 30 | 29 3% | 28.3 6% | 29 3% | 28.3 6% | 24.1 ? 20% |
| Idle Minimum * (dB) | 31 | 29 6% | 31.5 -2% | 29 6% | 33.5 -8% | 25.9 ? 16% |
| Idle Average * (dB) | 32 | 32 -0% | 31.6 1% | 32 -0% | 33.6 -5% | 27.4 ? 14% |
| Idle Maximum * (dB) | 41 | 33 20% | 31.6 23% | 33 20% | 35 15% | 29.9 ? 27% |
| Load Average * (dB) | 47 | 47 -0% | 32.3 31% | 42 11% | 38 19% | 43 ? 9% |
| Witcher 3 ultra * (dB) | 47 | 49 -4% | 43 9% | 49 -4% | 50 -6% | |
| Load Maximum * (dB) | 48 | 51 -6% | 45.5 5% | 49 -2% | 56.9 -19% | 54.1 ? -13% |
* ... mindre är bättre
(-) Den maximala temperaturen på ovansidan är 48 °C / 118 F, jämfört med genomsnittet av 40.4 °C / 105 F , allt från 21.2 till 68.8 °C för klassen Gaming.
(-) Botten värms upp till maximalt 58 °C / 136 F, jämfört med genomsnittet av 43.2 °C / 110 F
(+) Vid tomgångsbruk är medeltemperaturen för ovansidan 25.4 °C / 78 F, jämfört med enhetsgenomsnittet på 33.9 °C / ### class_avg_f### F.
(-) När du spelar The Witcher 3 är medeltemperaturen för ovansidan 42.1 °C / 108 F, jämfört med enhetsgenomsnittet på 33.9 °C / ## #class_avg_f### F.
(-) Handledsstöden och pekplattan kan bli väldigt varma vid beröring med maximalt 40 °C / 104 F.
(-) Medeltemperaturen för handledsstödsområdet på liknande enheter var 28.8 °C / 83.8 F (-11.2 °C / -20.2 F).
| MSI GS75 8SG Stealth GeForce RTX 2080 Max-Q, i7-8750H | Asus Zephyrus S GX701GX GeForce RTX 2080 Max-Q, i7-8750H | Lenovo Legion Y740-17ICH GeForce RTX 2080 Max-Q, i7-8750H | Schenker XMG Neo 17 GeForce RTX 2070 Mobile, i7-8750H | MSI GE75 8SF GeForce RTX 2070 Mobile, i7-8750H | Genomsnitt av klass Gaming | |
|---|---|---|---|---|---|---|
| Heat | 1% | 4% | 0% | 9% | -2% | |
| Maximum Upper Side * (°C) | 48 | 53 -10% | 38.6 20% | 47 2% | 41.2 14% | 45.2 ? 6% |
| Maximum Bottom * (°C) | 58 | 50 14% | 43.6 25% | 56 3% | 46 21% | 48.1 ? 17% |
| Idle Upper Side * (°C) | 29 | 27 7% | 30.2 -4% | 28 3% | 26.2 10% | 31.1 ? -7% |
| Idle Bottom * (°C) | 28 | 30 -7% | 35 -25% | 30 -7% | 30.2 -8% | 34.3 ? -22% |
* ... mindre är bättre
MSI GS75 8SG Stealth ljudanalys
(±) | högtalarljudstyrkan är genomsnittlig men bra (78 dB)
Bas 100 - 315 Hz
(-) | nästan ingen bas - i genomsnitt 23.2% lägre än medianen
(±) | linjäriteten för basen är genomsnittlig (7% delta till föregående frekvens)
Mellan 400 - 2000 Hz
(±) | högre mellan - i genomsnitt 8.8% högre än median
(±) | linjäriteten för mids är genomsnittlig (8.5% delta till föregående frekvens)
Högsta 2 - 16 kHz
(+) | balanserade toppar - endast 2.9% från medianen
(+) | toppar är linjära (6% delta till föregående frekvens)
Totalt 100 - 16 000 Hz
(±) | linjäriteten för det totala ljudet är genomsnittlig (27.3% skillnad mot median)
Jämfört med samma klass
» 93% av alla testade enheter i den här klassen var bättre, 1% liknande, 6% sämre
» Den bästa hade ett delta på 6%, genomsnittet var 18%, sämst var 132%
Jämfört med alla testade enheter
» 83% av alla testade enheter var bättre, 4% liknande, 13% sämre
» Den bästa hade ett delta på 4%, genomsnittet var 24%, sämst var 134%
MSI GS65 8RF-019DE Stealth Thin ljudanalys
(±) | högtalarljudstyrkan är genomsnittlig men bra (76 dB)
Bas 100 - 315 Hz
(-) | nästan ingen bas - i genomsnitt 16.4% lägre än medianen
(±) | linjäriteten för basen är genomsnittlig (9.7% delta till föregående frekvens)
Mellan 400 - 2000 Hz
(+) | balanserad mellan - endast 4.9% från medianen
(+) | mids är linjära (5.6% delta till föregående frekvens)
Högsta 2 - 16 kHz
(+) | balanserade toppar - endast 2.5% från medianen
(±) | linjäriteten för toppar är genomsnittlig (7.1% delta till föregående frekvens)
Totalt 100 - 16 000 Hz
(±) | linjäriteten för det totala ljudet är genomsnittlig (18.5% skillnad mot median)
Jämfört med samma klass
» 60% av alla testade enheter i den här klassen var bättre, 8% liknande, 32% sämre
» Den bästa hade ett delta på 6%, genomsnittet var 18%, sämst var 132%
Jämfört med alla testade enheter
» 41% av alla testade enheter var bättre, 8% liknande, 51% sämre
» Den bästa hade ett delta på 4%, genomsnittet var 24%, sämst var 134%
| Av/Standby | |
| Låg belastning | |
| Hög belastning |
|
Förklaring:
min: | |
| MSI GS75 8SG Stealth GeForce RTX 2080 Max-Q, i7-8750H | Asus Zephyrus S GX701GX GeForce RTX 2080 Max-Q, i7-8750H | Lenovo Legion Y740-17ICH GeForce RTX 2080 Max-Q, i7-8750H | Schenker XMG Neo 17 GeForce RTX 2070 Mobile, i7-8750H | MSI GE75 8SF GeForce RTX 2070 Mobile, i7-8750H | Genomsnitt av klass Gaming | |
|---|---|---|---|---|---|---|
| Power Consumption | -22% | -20% | 0% | -18% | -12% | |
| Idle Minimum * (Watt) | 13 | 19 -46% | 20.2 -55% | 13 -0% | 16.4 -26% | 13.2 ? -2% |
| Idle Average * (Watt) | 17 | 22 -29% | 27.2 -60% | 16 6% | 21.9 -29% | 18.9 ? -11% |
| Idle Maximum * (Watt) | 23 | 30 -30% | 28.7 -25% | 21 9% | 25.4 -10% | 24.5 ? -7% |
| Load Average * (Watt) | 90 | 104 -16% | 90.8 -1% | 96 -7% | 90.7 -1% | 108.8 ? -21% |
| Witcher 3 ultra * (Watt) | 147 | 167 -14% | 152.1 -3% | 172 -17% | 203.3 -38% | |
| Load Maximum * (Watt) | 215 | 203 6% | 165.4 23% | 191 11% | 222.9 -4% | 254 ? -18% |
* ... mindre är bättre
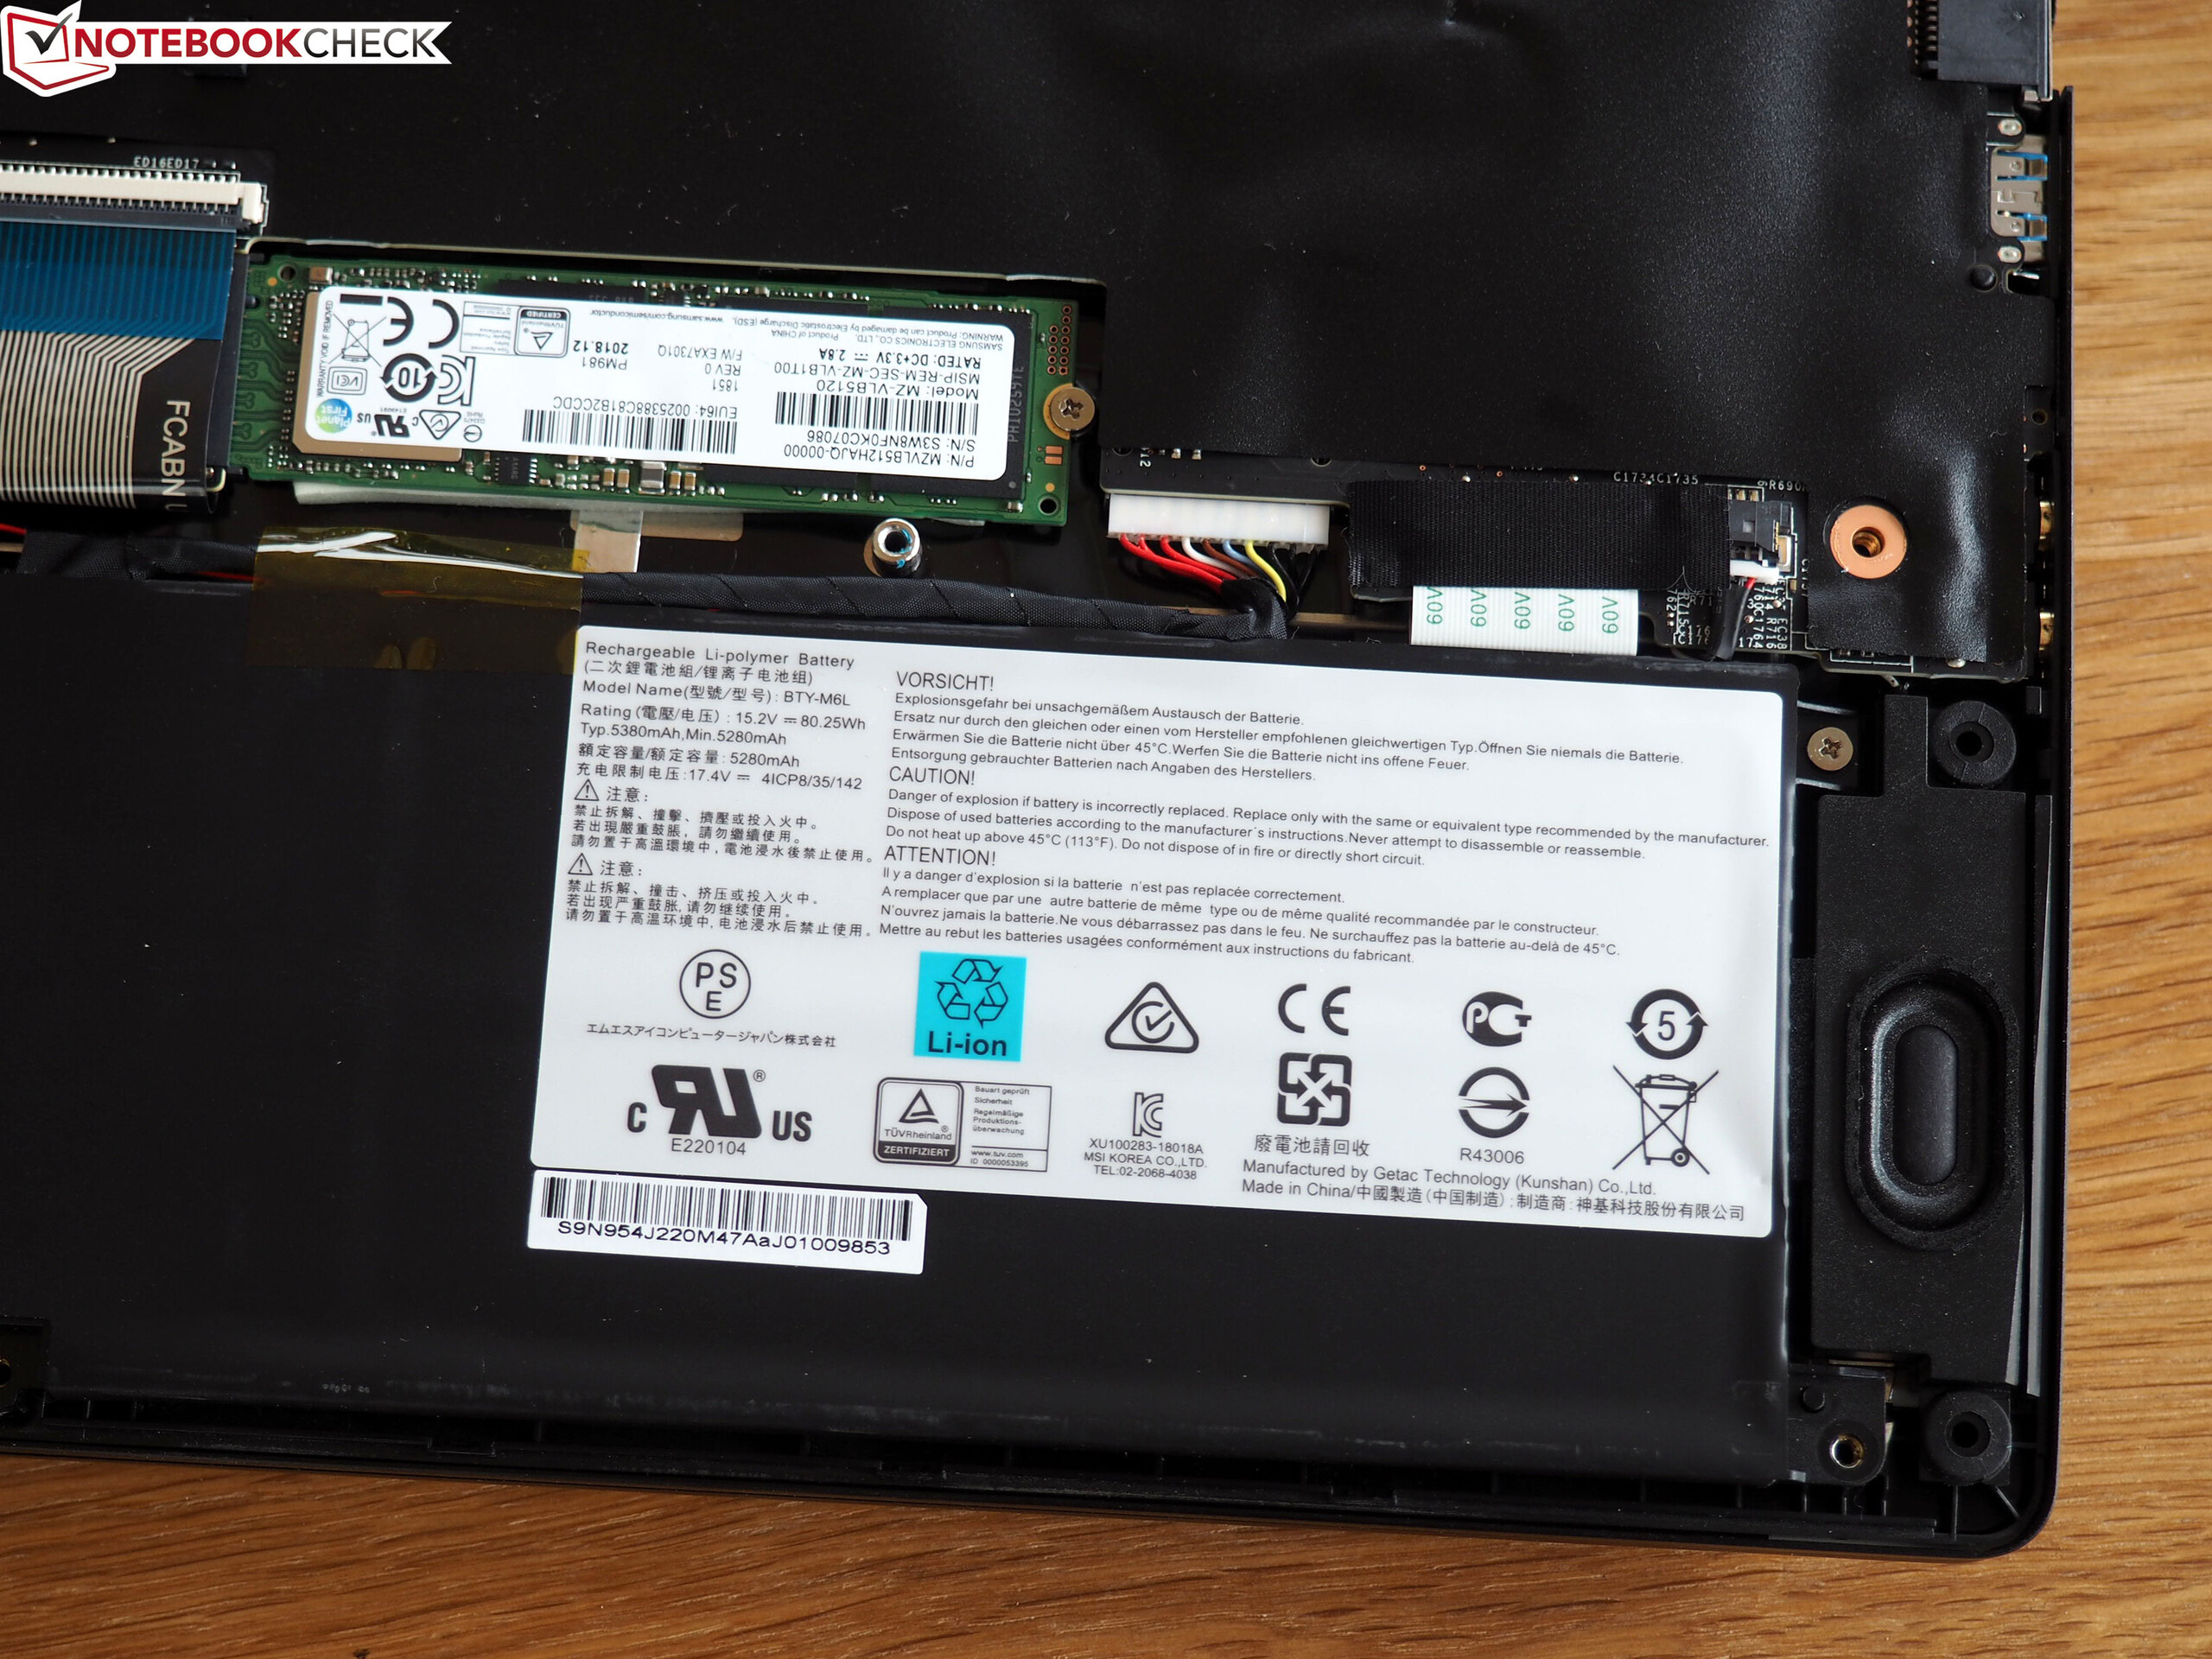
| MSI GS75 8SG Stealth GeForce RTX 2080 Max-Q, i7-8750H, 80.25 Wh | Asus Zephyrus S GX701GX GeForce RTX 2080 Max-Q, i7-8750H, 76 Wh | Lenovo Legion Y740-17ICH GeForce RTX 2080 Max-Q, i7-8750H, 76 Wh | Schenker XMG Neo 17 GeForce RTX 2070 Mobile, i7-8750H, 46.74 Wh | MSI GE75 8SF GeForce RTX 2070 Mobile, i7-8750H, 65 Wh | Genomsnitt av klass Gaming | |
|---|---|---|---|---|---|---|
| Batteridrifttid | -21% | -40% | -20% | -34% | 36% | |
| Reader / Idle (h) | 7.7 | 5 -35% | 5.3 -31% | 8.71 ? 13% | ||
| WiFi v1.3 (h) | 5.3 | 3.8 -28% | 3.2 -40% | 3.7 -30% | 3.5 -34% | 6.96 ? 31% |
| Load (h) | 0.9 | 0.9 0% | 0.9 0% | 1.47 ? 63% |
För
Emot
Läs den fullständiga versionen av den här recensionen på engelska här.
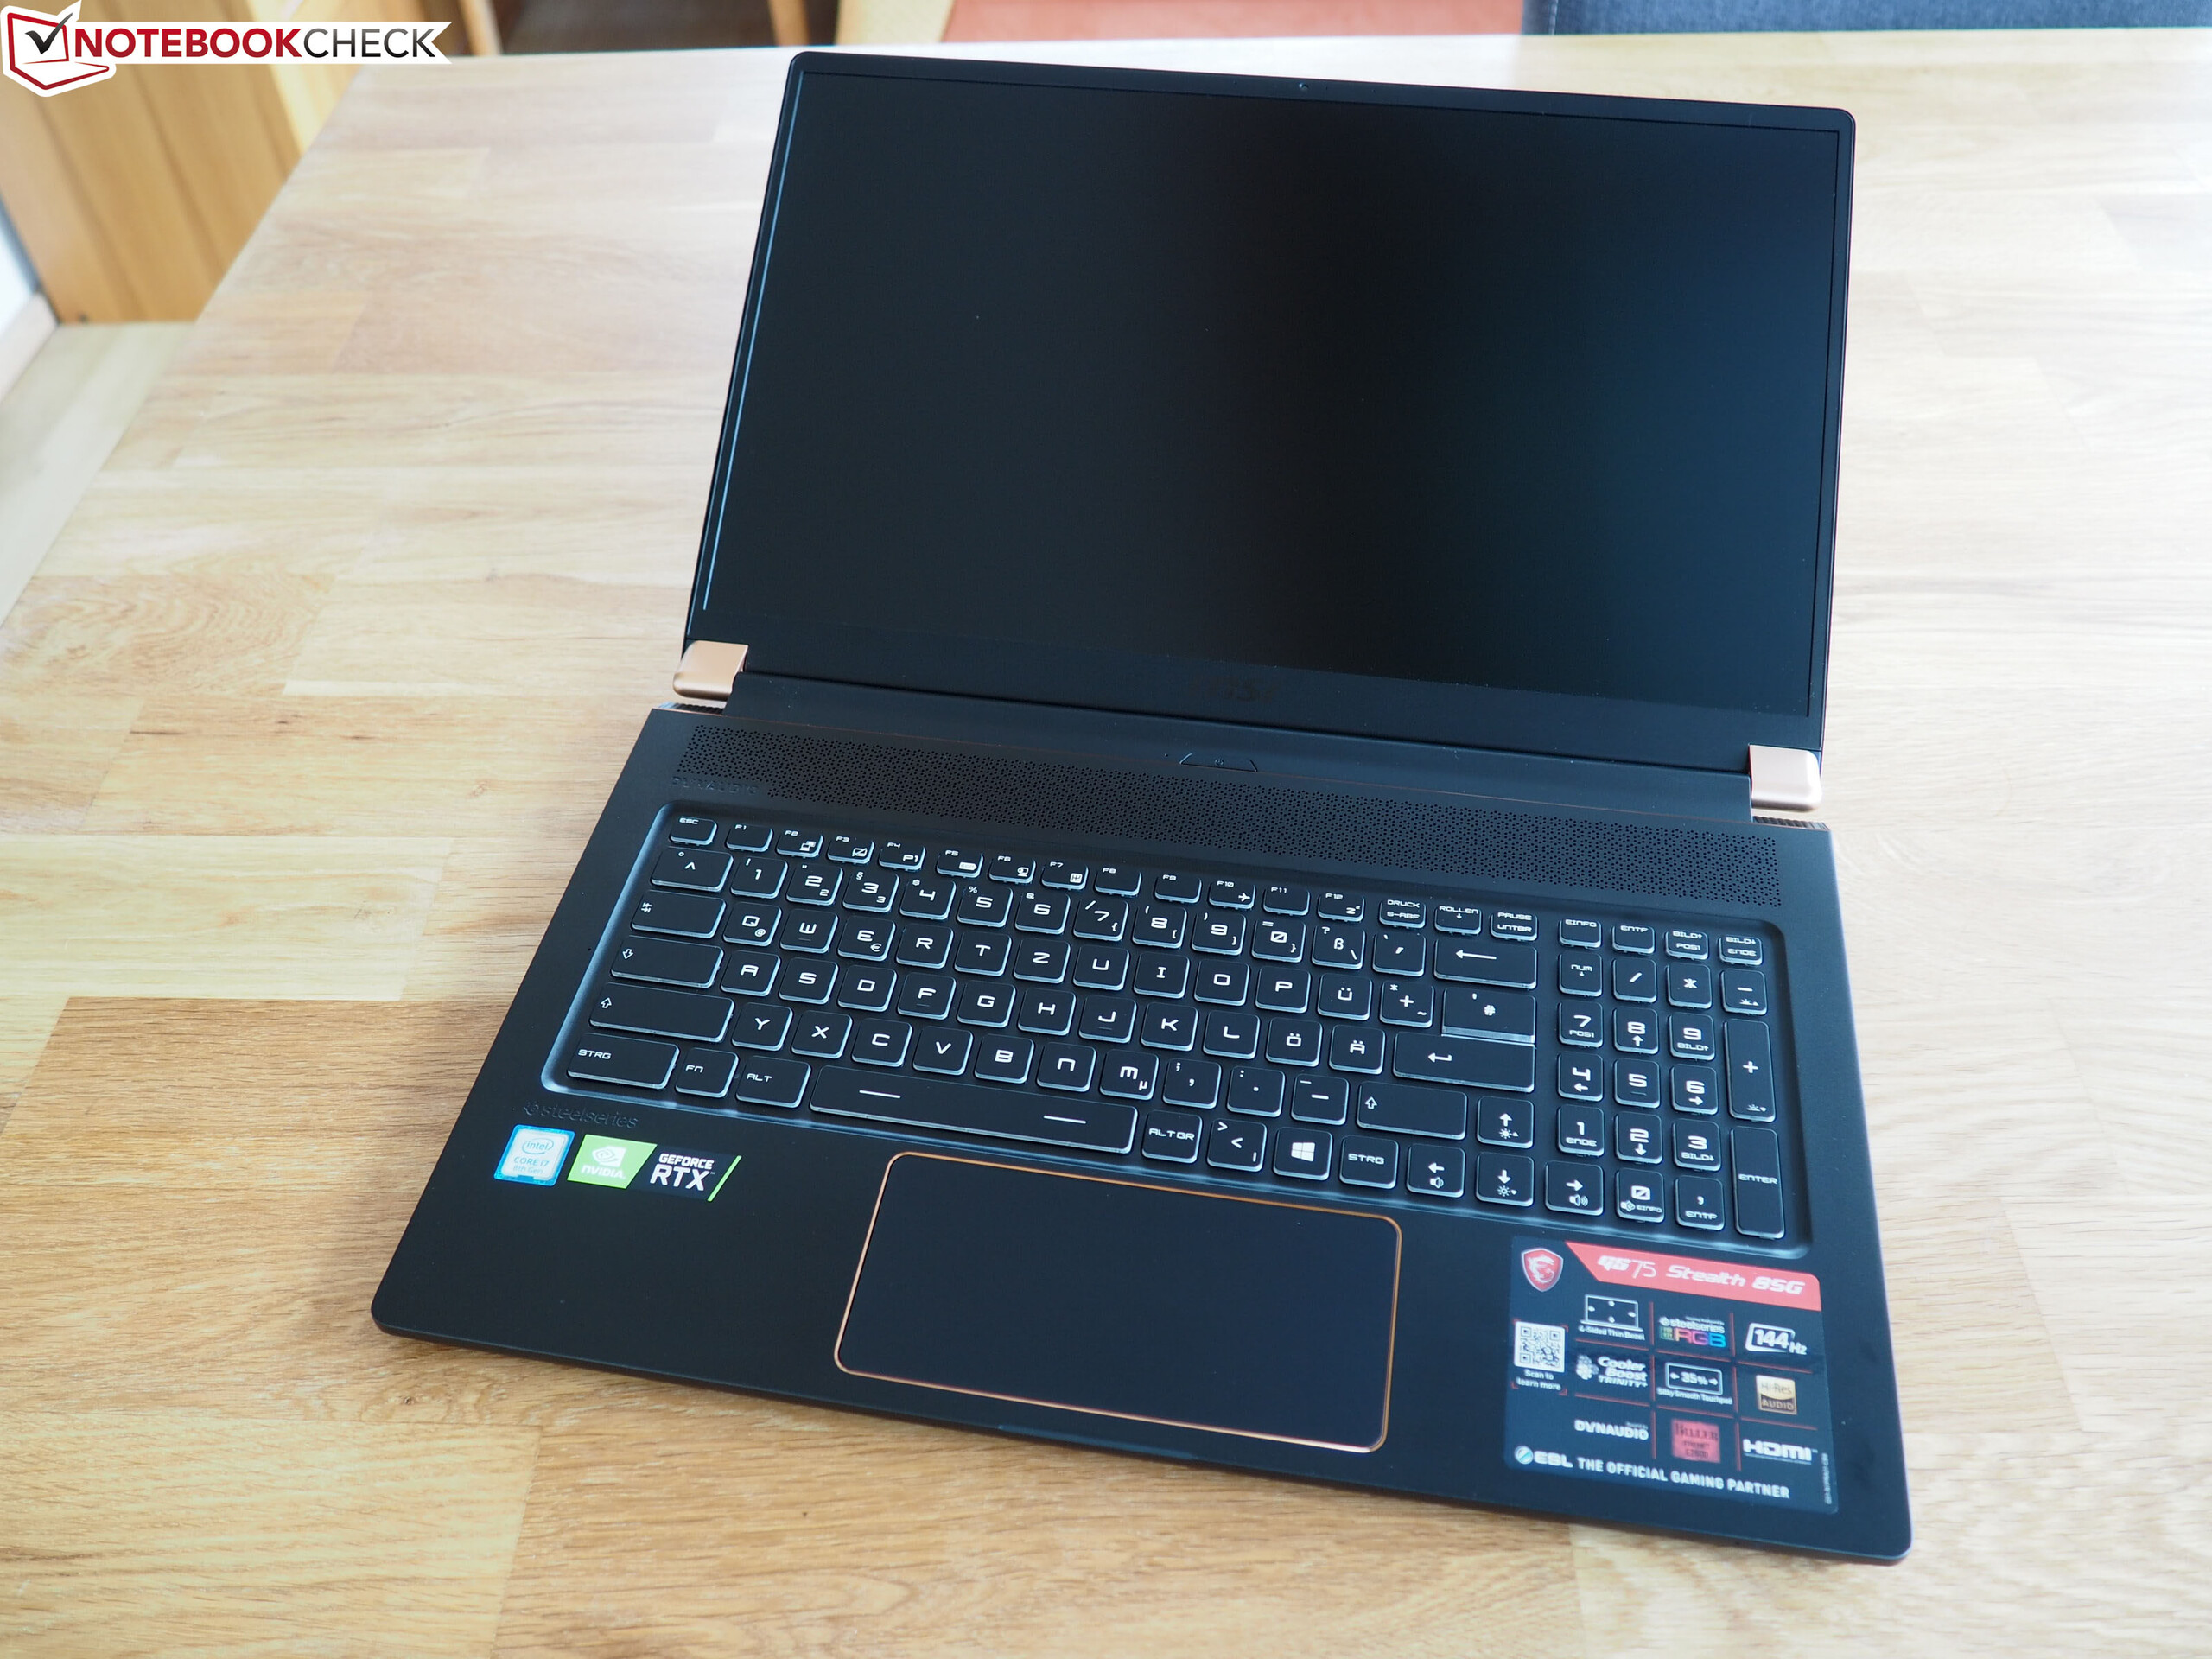
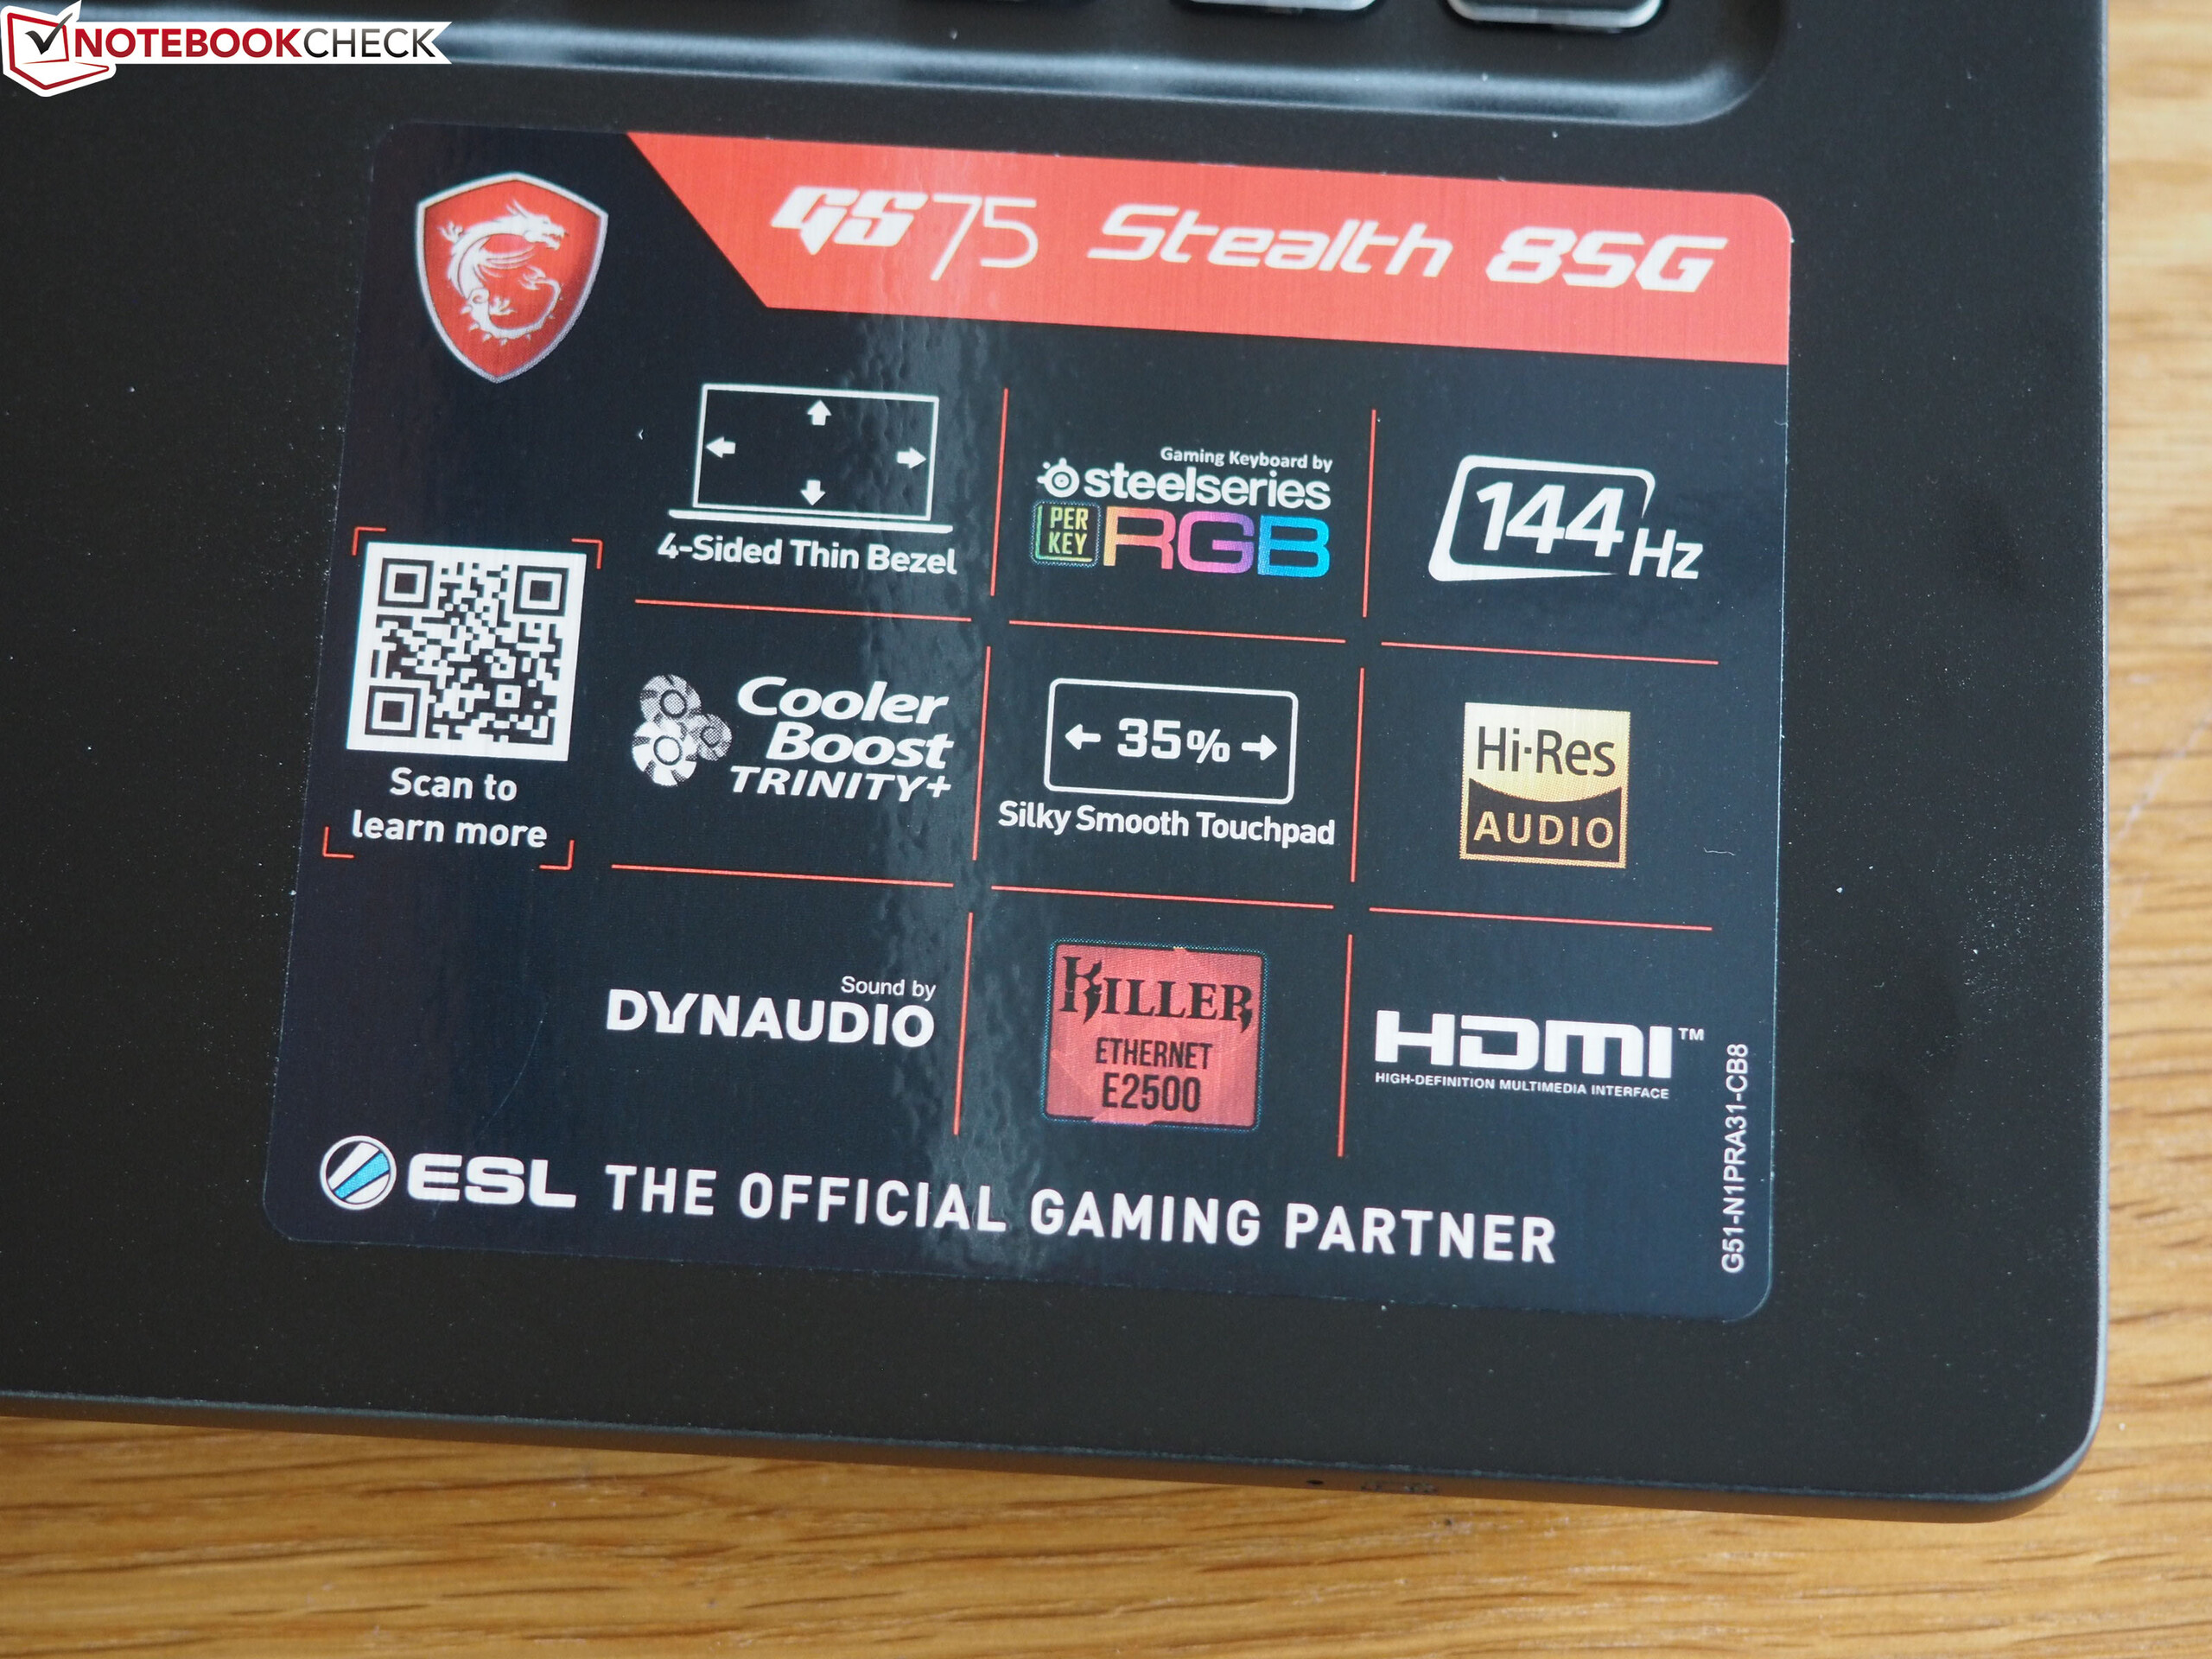
Med sin GS75 8SG Stealth släpper MSI en i huvudsak framgångsrik spellaptop med tunn infattning.
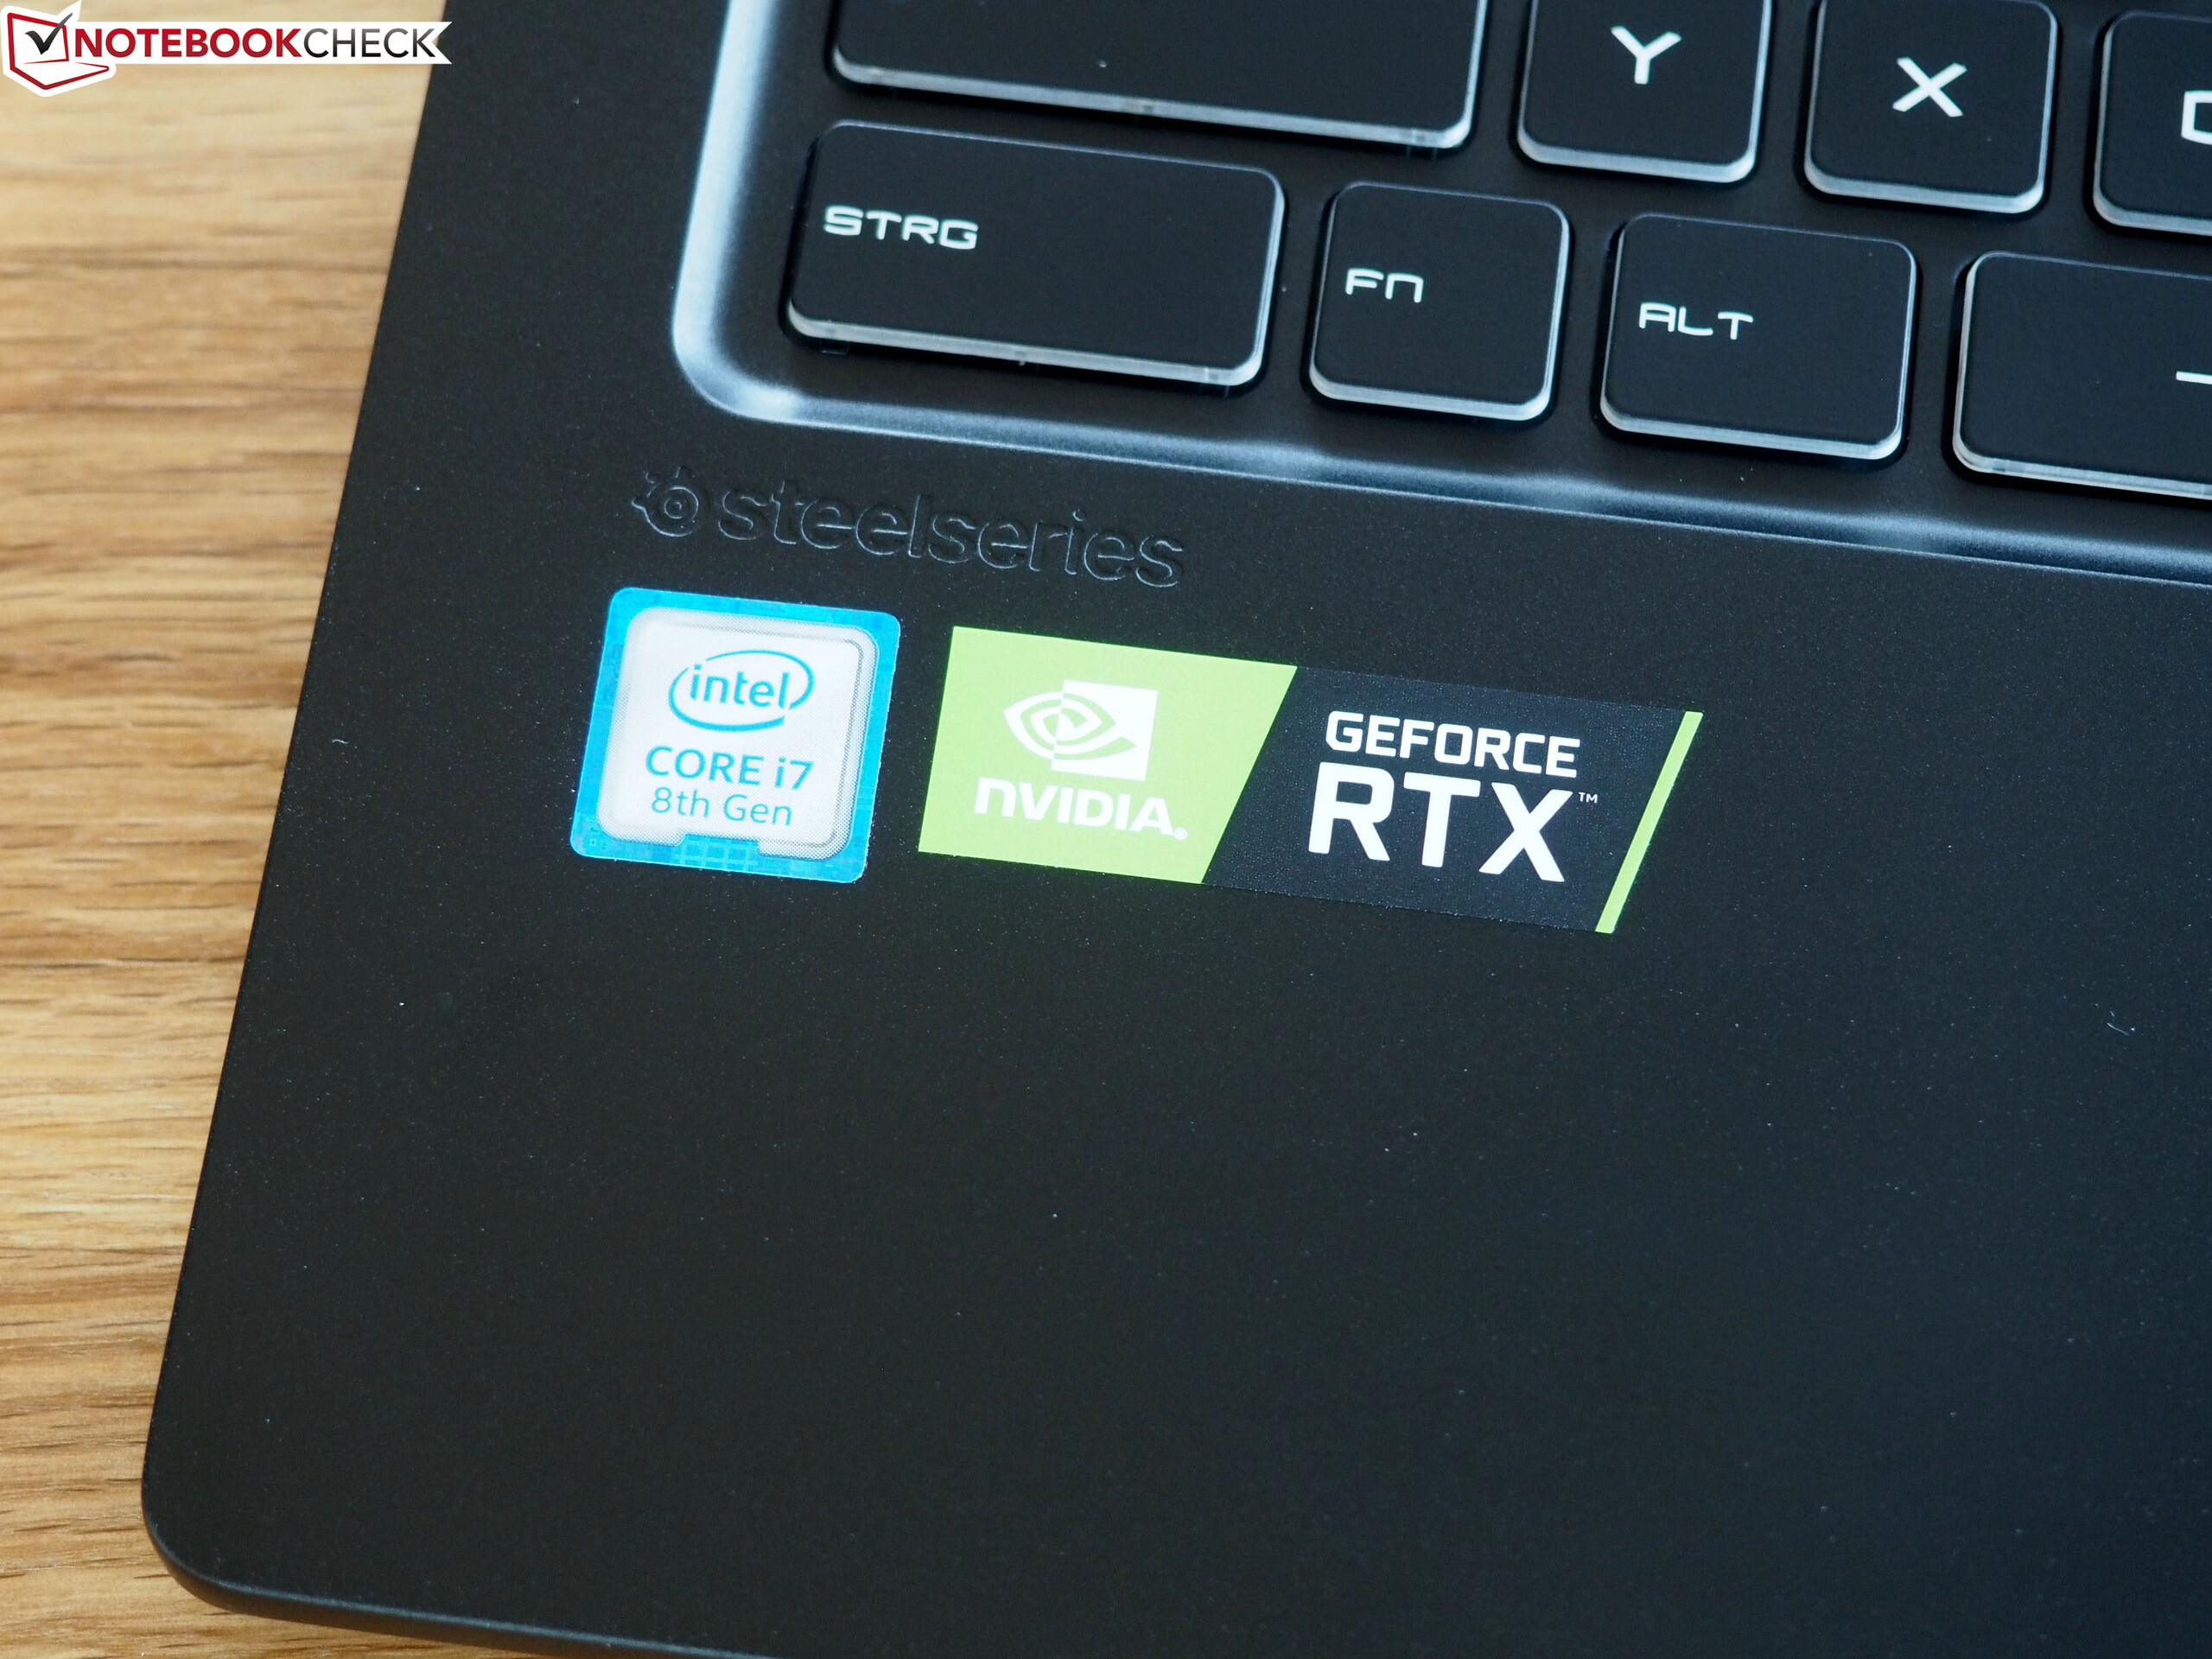
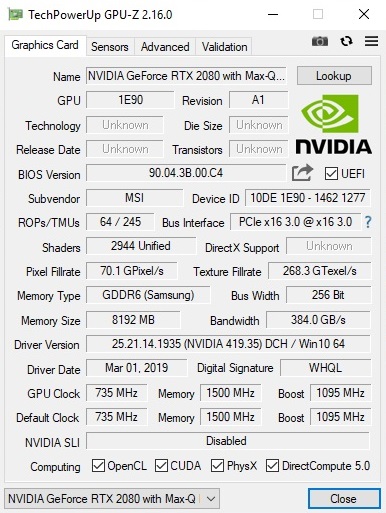
Kombinationen av en Core i7-8750H och ett GeForce RTX 2080 Max-Q fixar alla moderna spel utan problem - åtminstone i datorns egna Full HD-upplösning. Generellt kördes 3D-innehåll riktigt smidigt på den snabbt reagerande och kontrastrika 144 Hz-skärmen, trots att den saknar stöd för Nvidias G-Sync teknik.
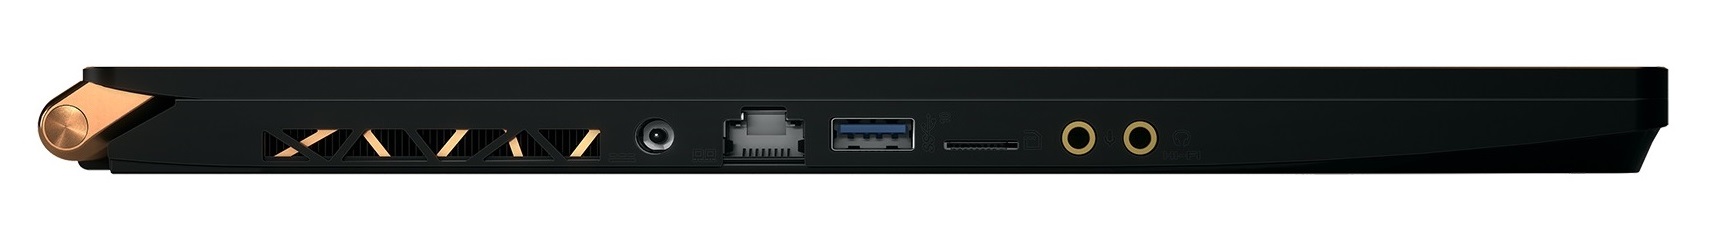
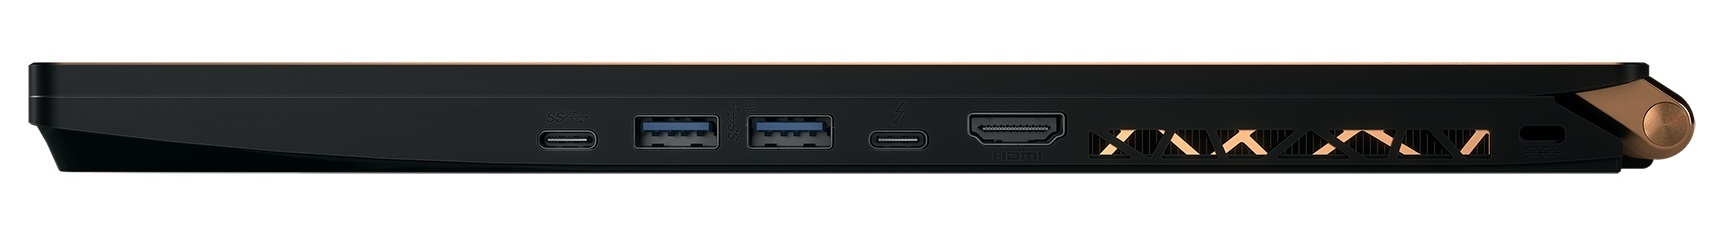
Ytterligare en styrka med denna 17-tummare är att den är så portabel. Utöver vikt och höjd lyckas också batteritiden imponera. Moderna portar, som inkluderar Thunderbolt 3, förtjänar också beröm.
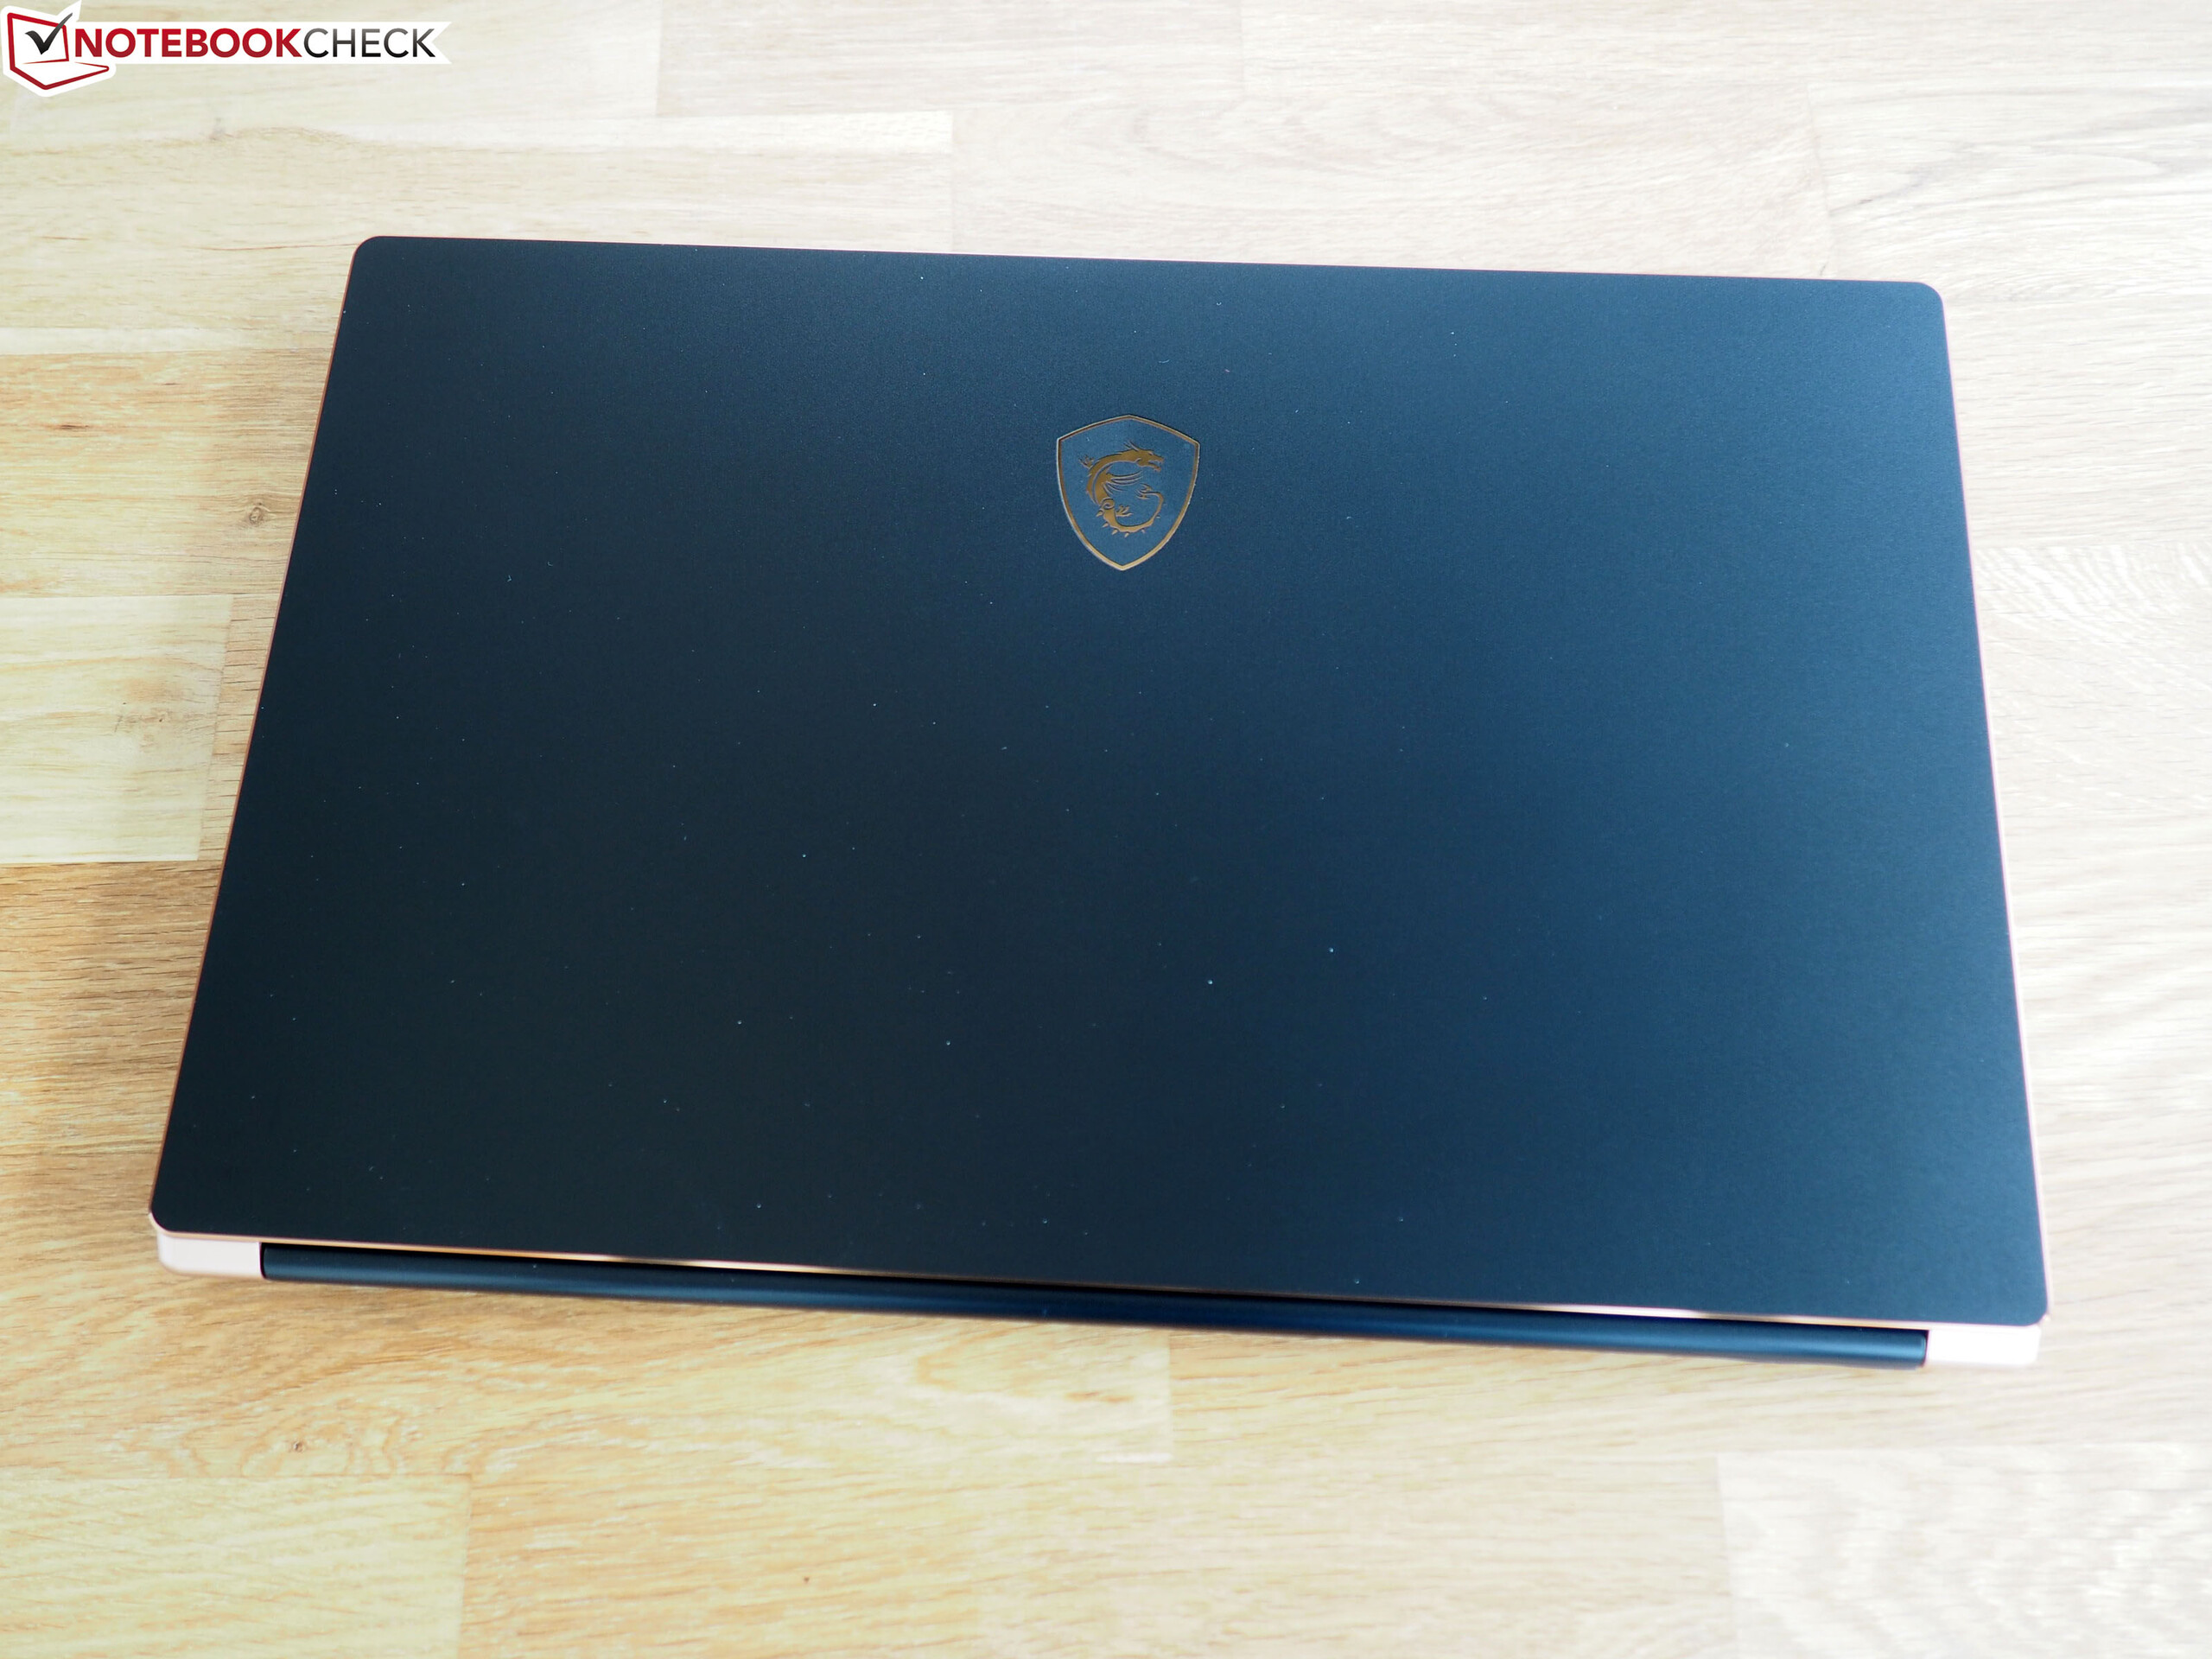
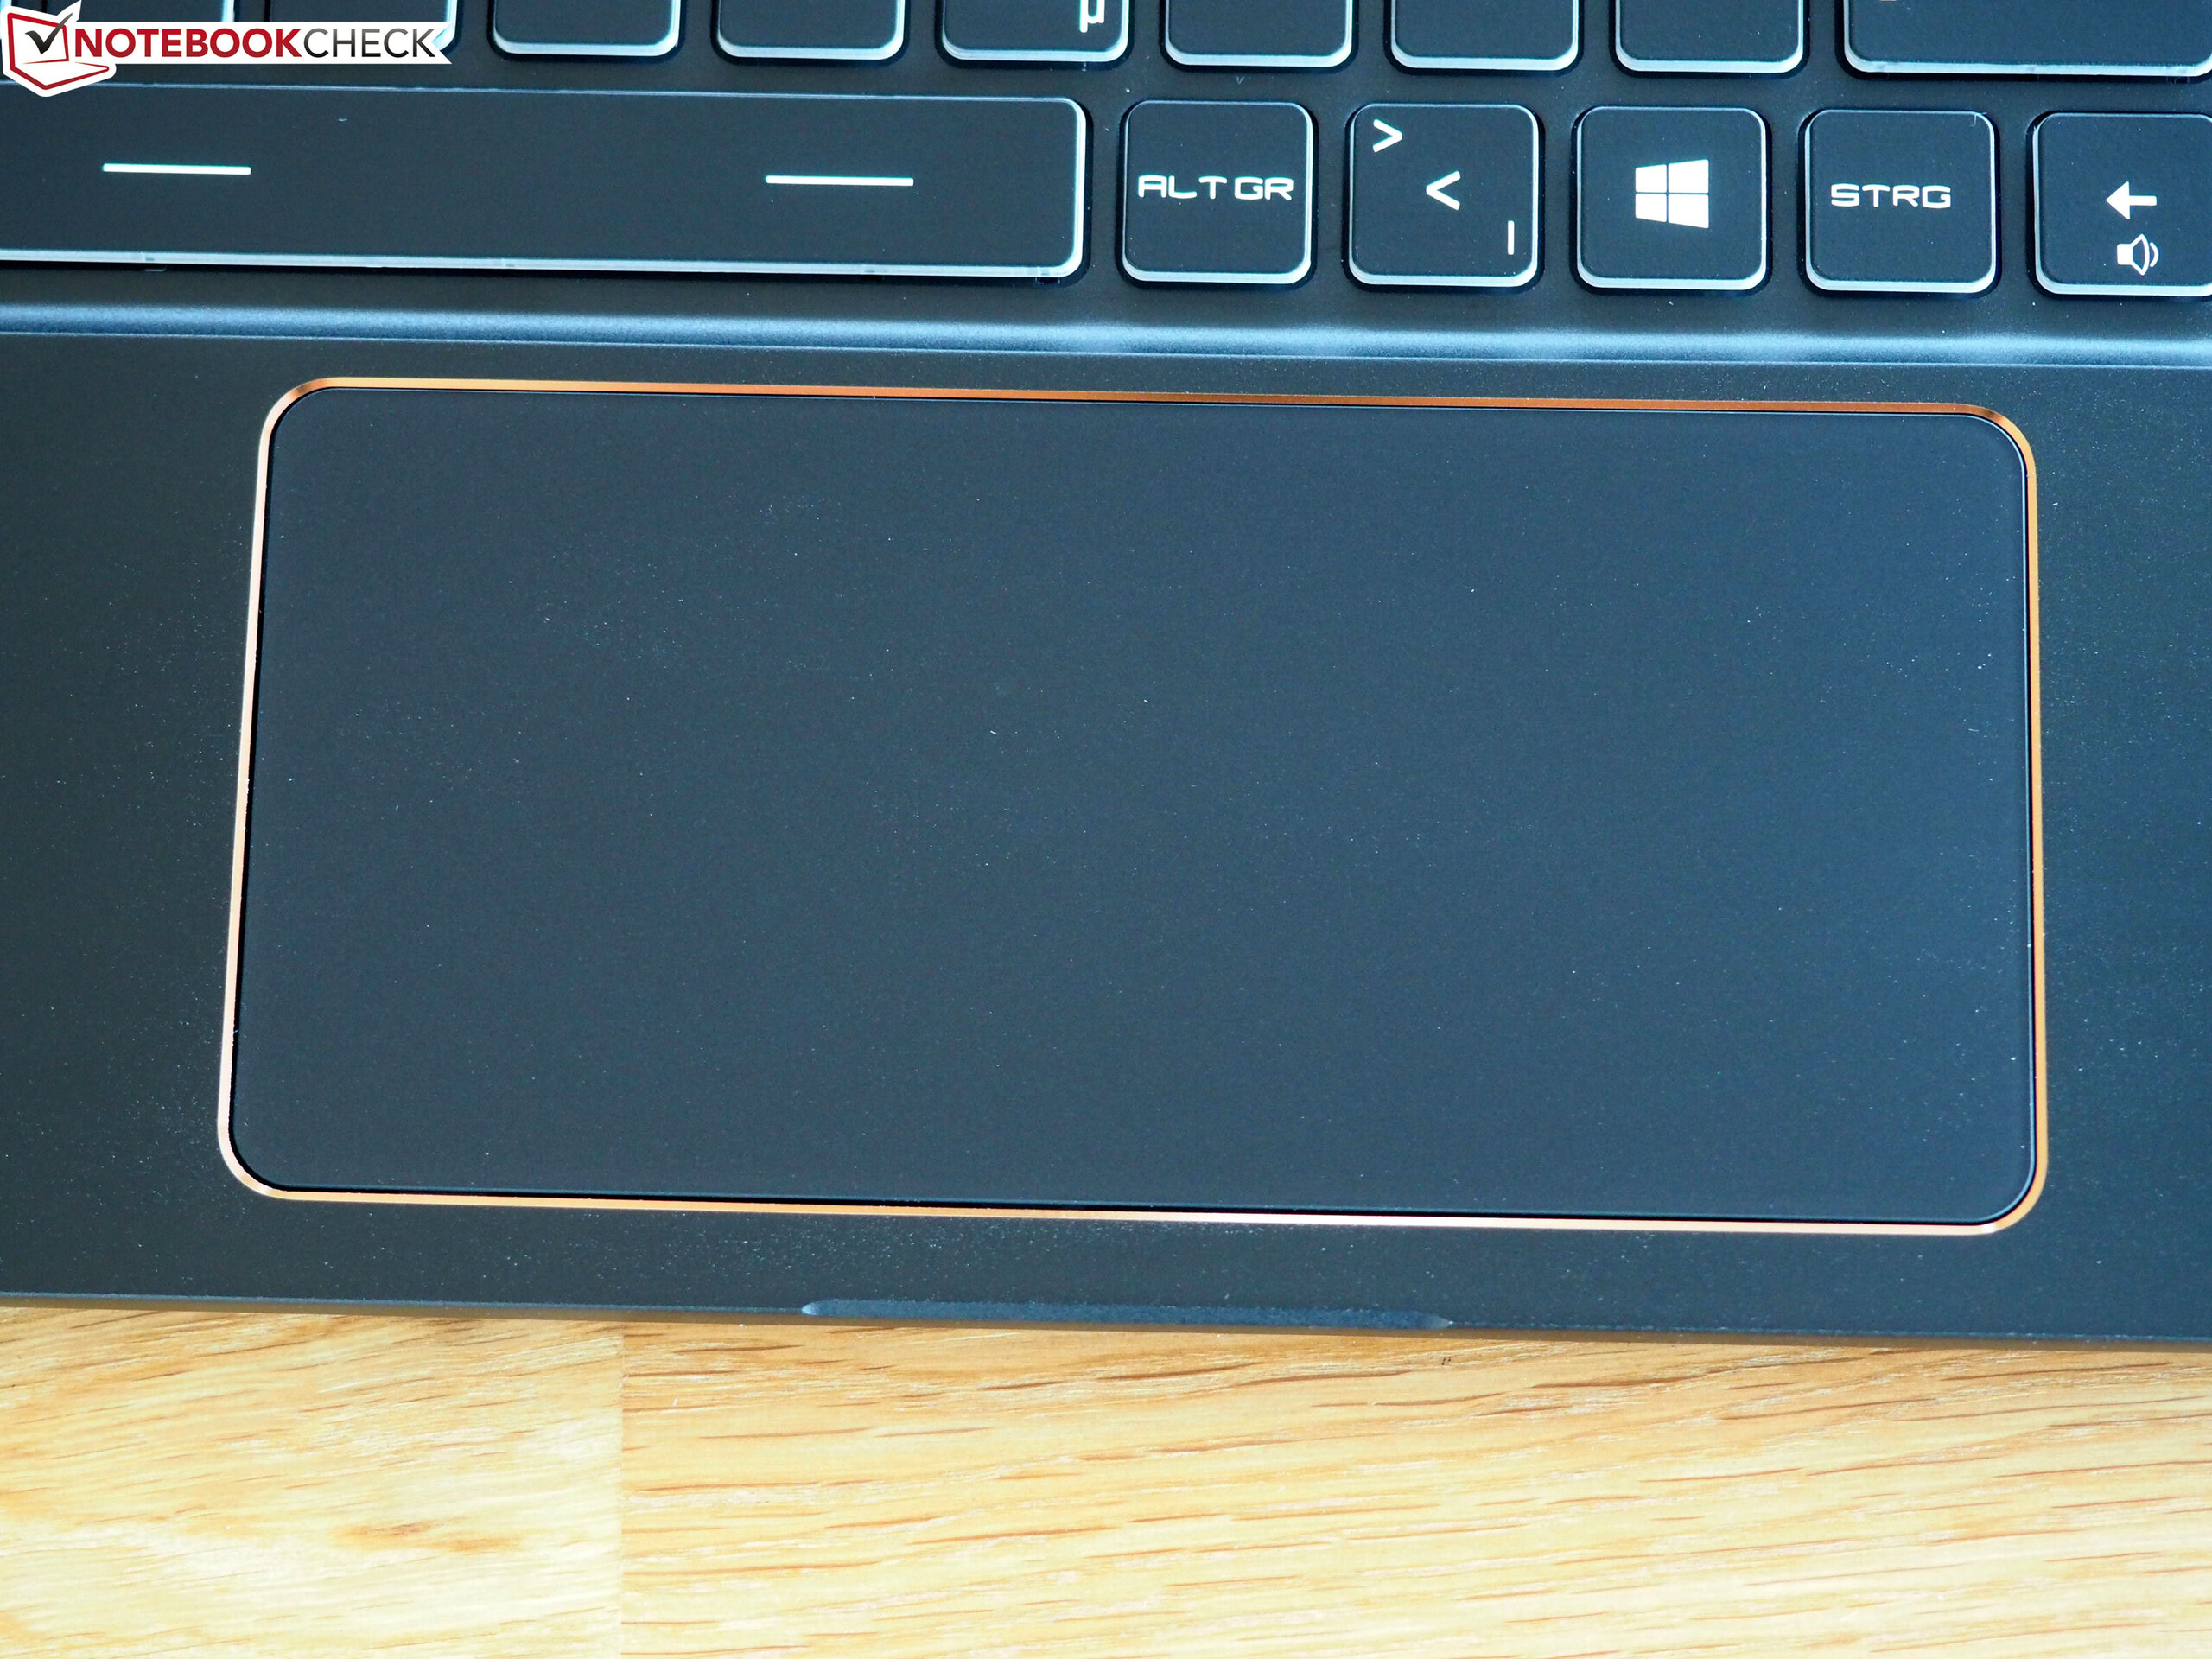
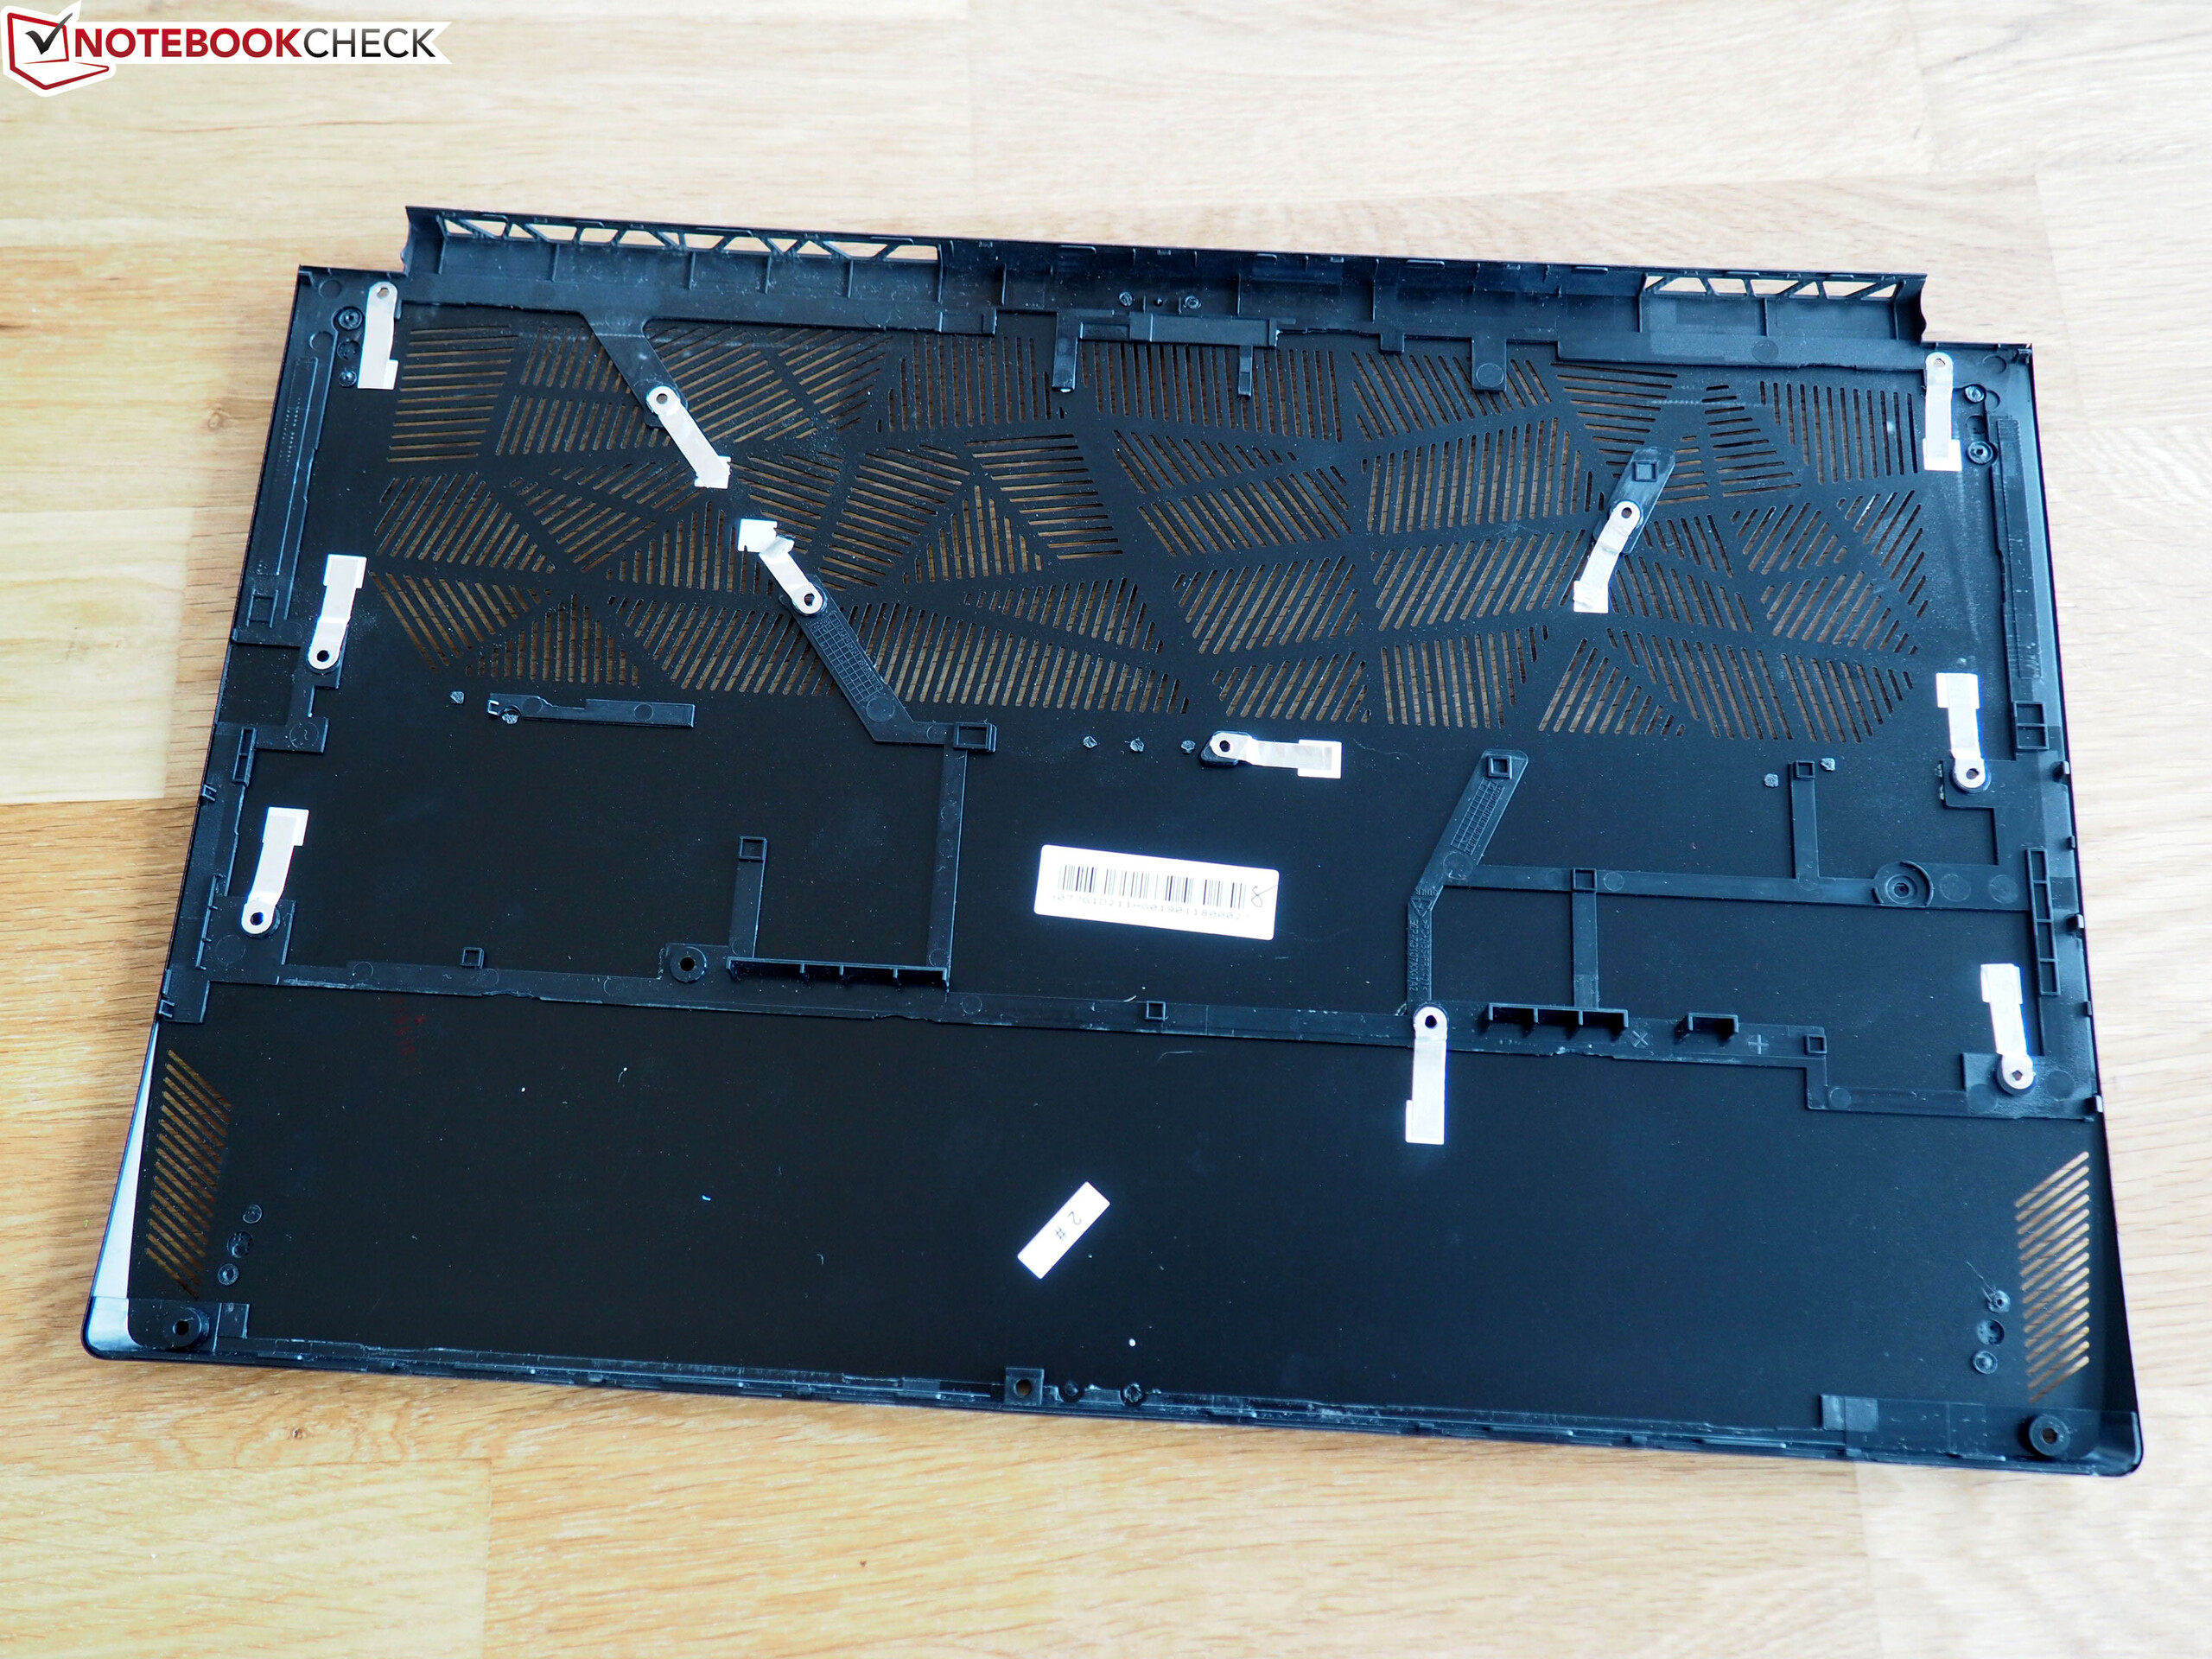
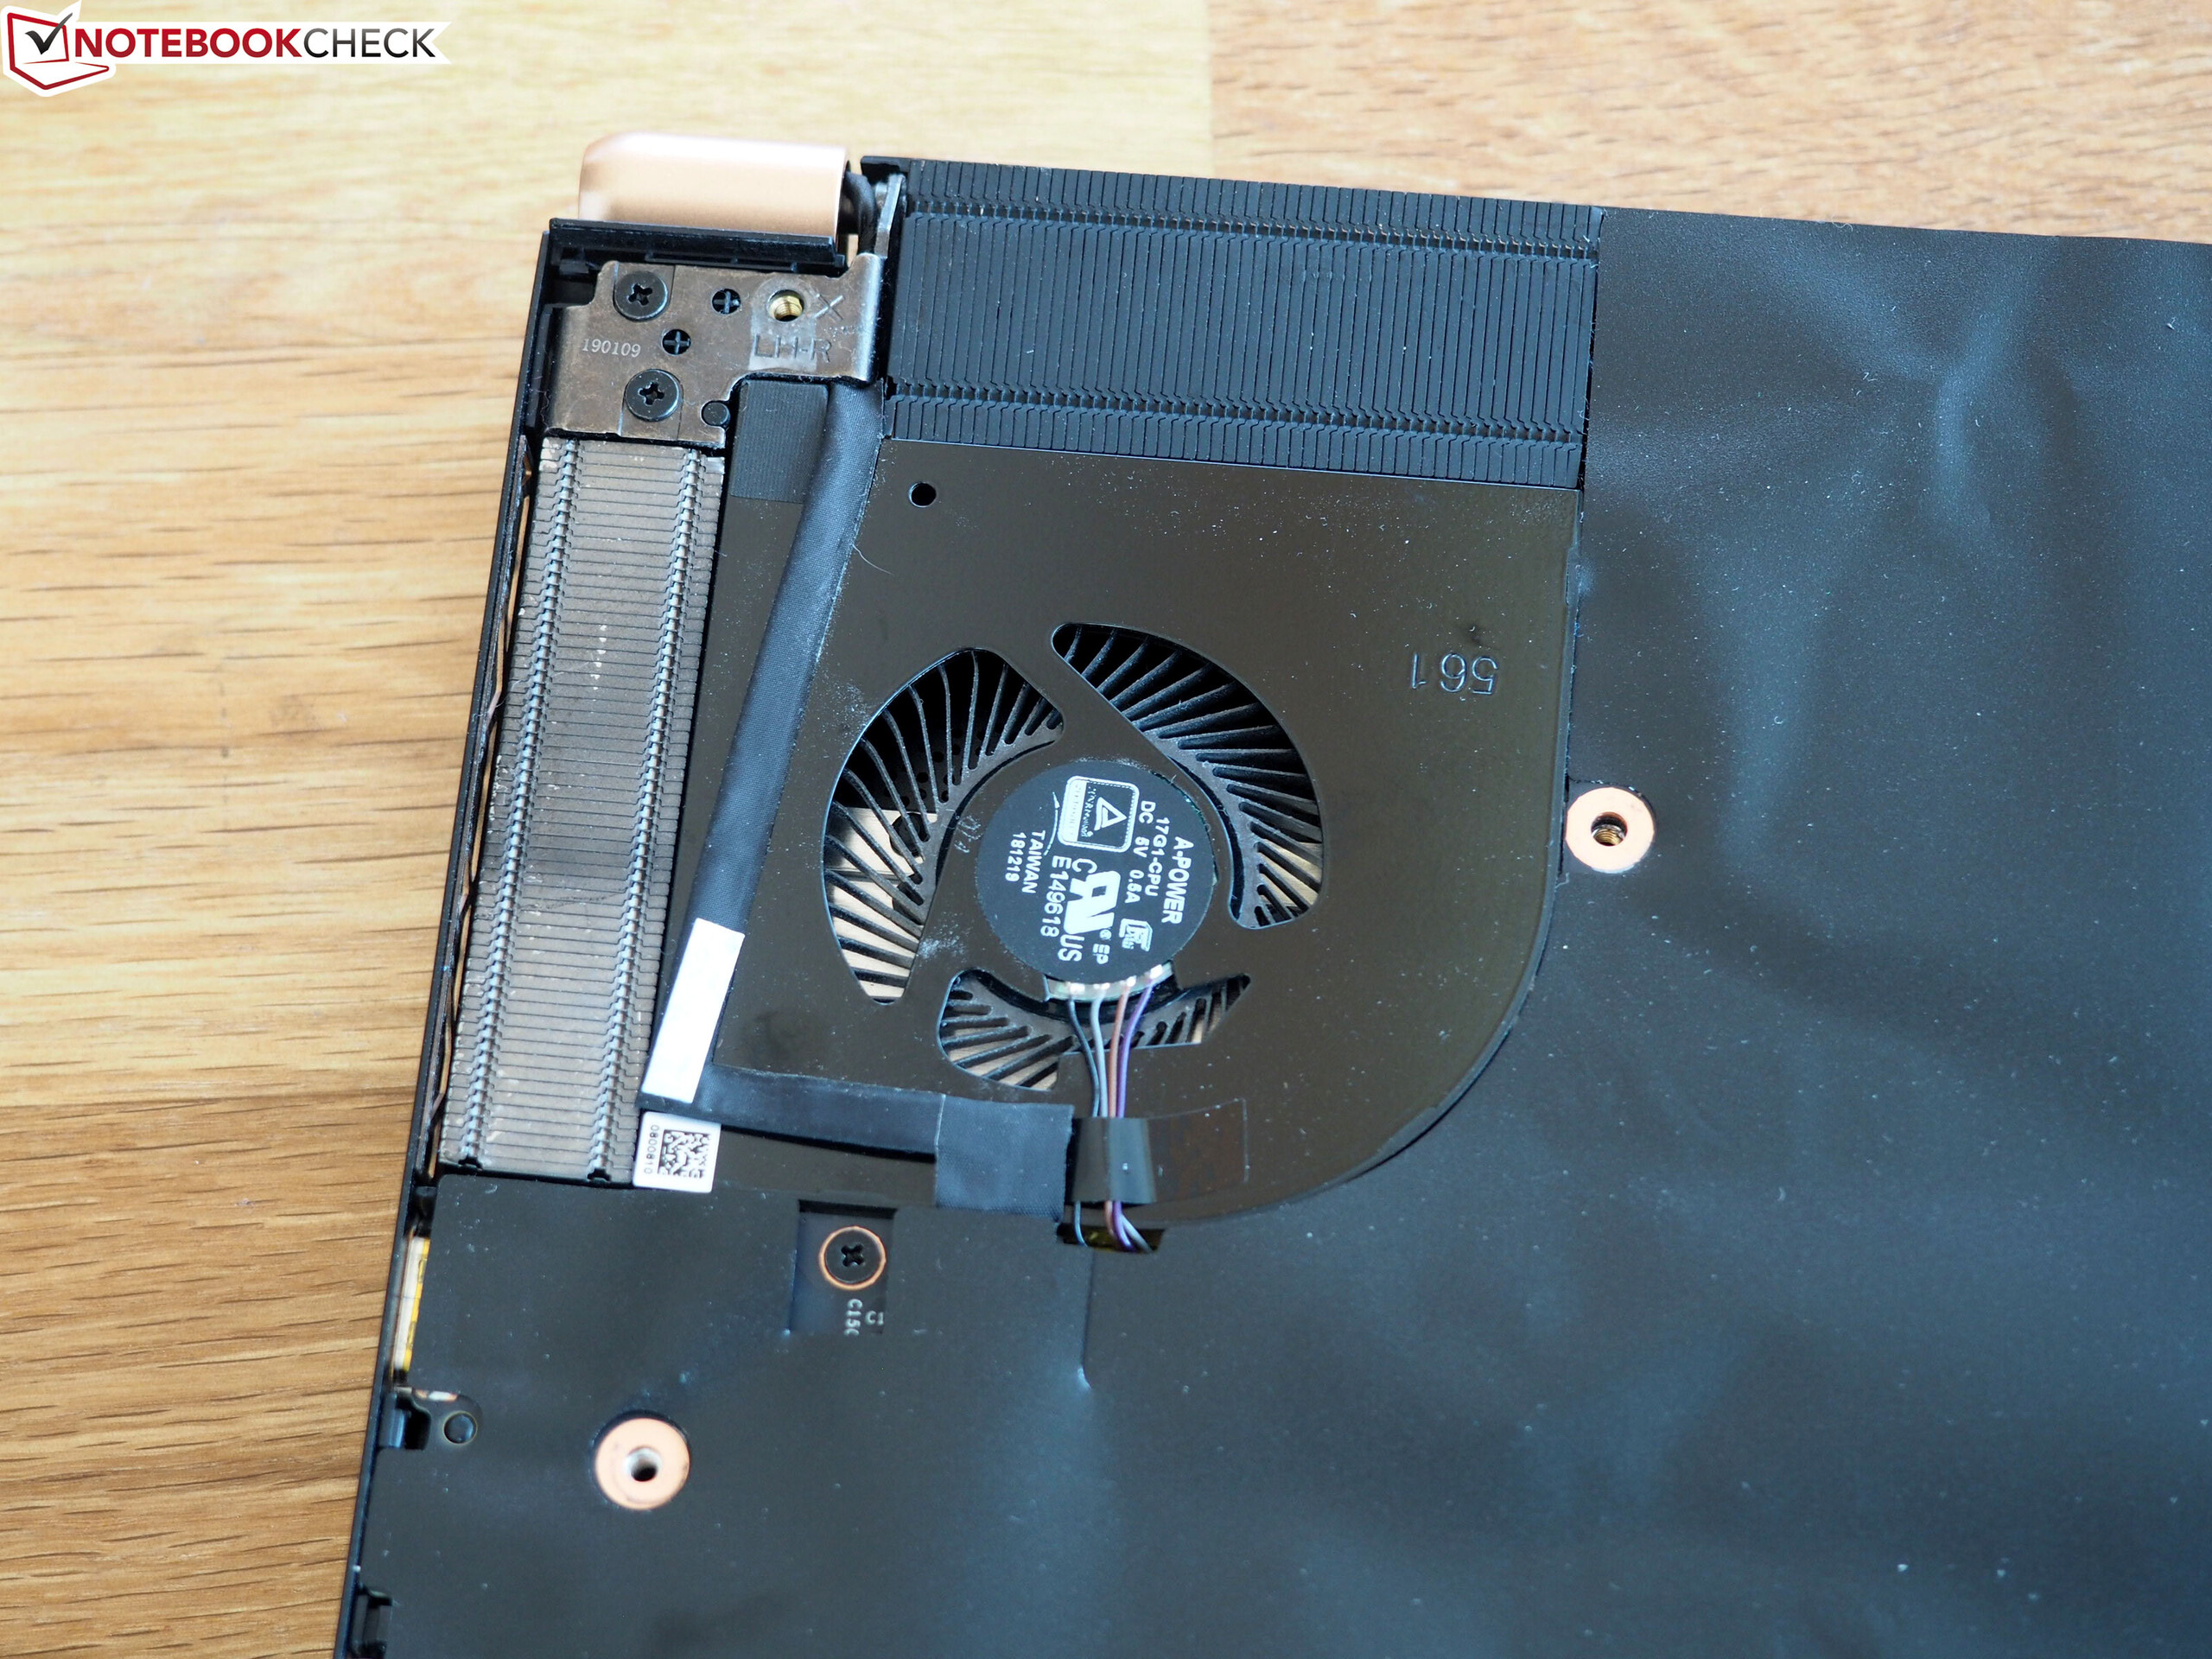
Vi var inte helt nöjda med höljet. Även om designen och materialens kvalitet låg på en hög nivå så lämnade stabiliteten en del att önska. För att kunna uppnå ett "riktigt bra" omdöme så hade MSI också behövt förbättra ljudkvaliteten och fläktkontrollen.
Det höga priset (38.000 kronor för den mest avancerade modellen) kommer att avråda en del intresserade köpare. För det mesta är likvärdigt snabba modeller med RTX 2070 GPU:er betydligt billigare.
MSI GS75 8SG Stealth
- 03/27/2019 v6 (old)
Florian Glaser
Price comparison