Test: Lenovo IdeaPad 330 15 (Ryzen 5 2500U) Laptop (Sammanfattning)
| SD Card Reader | |
| average JPG Copy Test (av. of 3 runs) | |
| Lenovo IdeaPad 330-15ARR 81D2005CUS (Toshiba Exceria Pro SDXC 64 GB UHS-II) | |
| Acer TravelMate P2510-G2-MG-50WE (Toshiba Exceria Pro SDXC 64 GB UHS-II) | |
| Lenovo Ideapad 530S-15IKB (Toshiba Exceria Pro SDXC 64 GB UHS-II) | |
| maximum AS SSD Seq Read Test (1GB) | |
| Lenovo IdeaPad 330-15ARR 81D2005CUS (Toshiba Exceria Pro SDXC 64 GB UHS-II) | |
| Lenovo Ideapad 530S-15IKB (Toshiba Exceria Pro SDXC 64 GB UHS-II) | |
| Acer TravelMate P2510-G2-MG-50WE (Toshiba Exceria Pro SDXC 64 GB UHS-II) | |
| Networking | |
| iperf3 transmit AX12 | |
| Lenovo Ideapad 530S-15IKB | |
| Huawei MateBook D 15-53010BAJ | |
| Lenovo IdeaPad 330-15ARR 81D2005CUS | |
| iperf3 receive AX12 | |
| Lenovo Ideapad 530S-15IKB | |
| Huawei MateBook D 15-53010BAJ | |
| Lenovo IdeaPad 330-15ARR 81D2005CUS | |
| |||||||||||||||||||||||||
Distribution av ljusstyrkan: 84 %
Mitt på batteriet: 252.2 cd/m²
Kontrast: 467:1 (Svärta: 0.54 cd/m²)
ΔE ColorChecker Calman: 12.36 | ∀{0.5-29.43 Ø4.72}
calibrated: 4.43
ΔE Greyscale Calman: 12.2 | ∀{0.09-98 Ø4.97}
54.5% sRGB (Argyll 1.6.3 3D)
34.6% AdobeRGB 1998 (Argyll 1.6.3 3D)
37.57% AdobeRGB 1998 (Argyll 3D)
54.7% sRGB (Argyll 3D)
36.36% Display P3 (Argyll 3D)
Gamma: 1.83
CCT: 13028 K
| Lenovo IdeaPad 330-15ARR 81D2005CUS AUO B156HTN03.8, TN LED, 15.6", 1920x1080 | Huawei MateBook D 15-53010BAJ AU Optronics B156HW02, IPS, 15.6", 1920x1080 | HP Pavilion 15-cs0053cl AU Optronics B156XW02 V0, TN LED, 15.6", 1366x768 | Asus VivoBook 15 F510UF-ES71 LG Philips LP156WF9-SPK2, IPS, 15.6", 1920x1080 | Lenovo Ideapad 530S-15IKB N156HCA-EAB, IPS, 15.6", 1920x1080 | |
|---|---|---|---|---|---|
| Display | 12% | 6% | 8% | 15% | |
| Display P3 Coverage (%) | 36.36 | 40.96 13% | 38.37 6% | 39.35 8% | 41.84 15% |
| sRGB Coverage (%) | 54.7 | 60.9 11% | 57.7 5% | 59.2 8% | 62.4 14% |
| AdobeRGB 1998 Coverage (%) | 37.57 | 42.24 12% | 39.65 6% | 40.65 8% | 43.32 15% |
| Response Times | -17% | 5% | 2% | -31% | |
| Response Time Grey 50% / Grey 80% * (ms) | 38.8 ? | 36.4 ? 6% | 43.6 ? -12% | 27.2 ? 30% | 37.2 ? 4% |
| Response Time Black / White * (ms) | 19.6 ? | 27.2 ? -39% | 15.2 ? 22% | 24.8 ? -27% | 32.4 ? -65% |
| PWM Frequency (Hz) | 25770 ? | ||||
| Screen | 29% | 10% | 27% | 34% | |
| Brightness middle (cd/m²) | 252.2 | 265.7 5% | 220.1 -13% | 257 2% | 285.1 13% |
| Brightness (cd/m²) | 251 | 258 3% | 210 -16% | 246 -2% | 271 8% |
| Brightness Distribution (%) | 84 | 91 8% | 93 11% | 89 6% | 88 5% |
| Black Level * (cd/m²) | 0.54 | 0.31 43% | 0.29 46% | 0.34 37% | 0.28 48% |
| Contrast (:1) | 467 | 857 84% | 759 63% | 756 62% | 1018 118% |
| Colorchecker dE 2000 * | 12.36 | 6.01 51% | 11.4 8% | 4.54 63% | 4.38 65% |
| Colorchecker dE 2000 max. * | 24.75 | 18.87 24% | 25.96 -5% | 16 35% | 24.07 3% |
| Colorchecker dE 2000 calibrated * | 4.43 | 3.94 11% | 4.09 8% | 3.61 19% | 3.95 11% |
| Greyscale dE 2000 * | 12.2 | 5 59% | 12 2% | 4.6 62% | 3.1 75% |
| Gamma | 1.83 120% | 2.7 81% | 2.09 105% | 2.44 90% | 2.24 98% |
| CCT | 13028 50% | 6569 99% | 12625 51% | 7096 92% | 6705 97% |
| Color Space (Percent of AdobeRGB 1998) (%) | 34.6 | 42.24 22% | 36.5 5% | 37.5 8% | 40 16% |
| Color Space (Percent of sRGB) (%) | 54.5 | 60.92 12% | 57.5 6% | 59.2 9% | 62 14% |
| Totalt genomsnitt (program/inställningar) | 8% /
20% | 7% /
9% | 12% /
21% | 6% /
22% |
* ... mindre är bättre
Visa svarstider
| ↔ Svarstid svart till vitt | ||
|---|---|---|
| 19.6 ms ... stiga ↗ och falla ↘ kombinerat | ↗ 15.6 ms stiga | 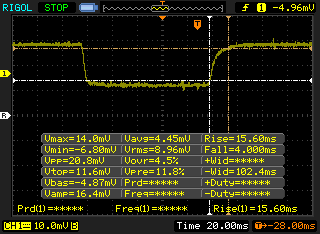 |
| ↘ 4 ms hösten | ||
| Skärmen visar bra svarsfrekvens i våra tester, men kan vara för långsam för konkurrenskraftiga spelare. I jämförelse sträcker sig alla testade enheter från 0.1 (minst) till 240 (maximalt) ms. » 43 % av alla enheter är bättre. Det betyder att den uppmätta svarstiden liknar genomsnittet av alla testade enheter (19.8 ms). | ||
| ↔ Svarstid 50 % grått till 80 % grått | ||
| 38.8 ms ... stiga ↗ och falla ↘ kombinerat | ↗ 20 ms stiga | 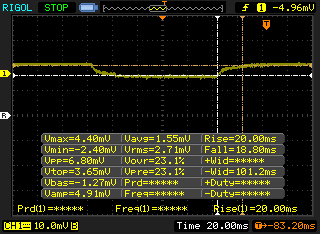 |
| ↘ 18.8 ms hösten | ||
| Skärmen visar långsamma svarsfrekvenser i våra tester och kommer att vara otillfredsställande för spelare. I jämförelse sträcker sig alla testade enheter från 0.165 (minst) till 636 (maximalt) ms. » 58 % av alla enheter är bättre. Detta innebär att den uppmätta svarstiden är sämre än genomsnittet av alla testade enheter (31 ms). | ||
Skärmflimmer / PWM (Puls-Width Modulation)
| Skärmflimmer / PWM upptäcktes inte | 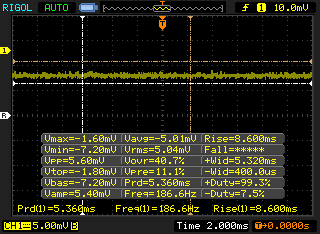 | ||
Som jämförelse: 52 % av alla testade enheter använder inte PWM för att dämpa skärmen. Om PWM upptäcktes mättes ett medelvärde av 7772 (minst: 5 - maximum: 343500) Hz. | |||
| Cinebench R11.5 | |
| CPU Single 64Bit | |
| Lenovo ThinkPad 25 | |
| Acer Swift 3 SF315-41-R6J9 | |
| Genomsnitt AMD Ryzen 5 2500U (1.53 - 1.61, n=4) | |
| Lenovo ThinkPad X380 Yoga-20LH000LUS | |
| Acer TravelMate P449-M-7407 | |
| Dell Inspiron 15 5575-98MH4 | |
| CPU Multi 64Bit | |
| Genomsnitt AMD Ryzen 5 2500U (5.71 - 6.91, n=4) | |
| Acer Swift 3 SF315-41-R6J9 | |
| Lenovo ThinkPad X380 Yoga-20LH000LUS | |
| Acer TravelMate P449-M-7407 | |
| Lenovo ThinkPad 25 | |
| Dell Inspiron 15 5575-98MH4 | |
| Cinebench R10 | |
| Rendering Multiple CPUs 32Bit | |
| Lenovo ThinkPad X380 Yoga-20LH000LUS | |
| Genomsnitt AMD Ryzen 5 2500U (13850 - 16471, n=6) | |
| Acer Swift 3 SF315-41-R6J9 | |
| Lenovo ThinkPad 25 | |
| Acer TravelMate P449-M-7407 | |
| Dell Inspiron 15 5575-98MH4 | |
| Rendering Single 32Bit | |
| Lenovo ThinkPad 25 | |
| Lenovo ThinkPad X380 Yoga-20LH000LUS | |
| Acer TravelMate P449-M-7407 | |
| Acer Swift 3 SF315-41-R6J9 | |
| Genomsnitt AMD Ryzen 5 2500U (4103 - 4473, n=6) | |
| Dell Inspiron 15 5575-98MH4 | |
| wPrime 2.10 - 1024m | |
| Acer TravelMate P449-M-7407 | |
| Lenovo ThinkPad 25 | |
| Genomsnitt AMD Ryzen 5 2500U (251 - 376, n=2) | |
| Lenovo ThinkPad X380 Yoga-20LH000LUS | |
| Acer Swift 3 SF315-41-R6J9 | |
* ... mindre är bättre
| PCMark 8 Home Score Accelerated v2 | 3049 poäng | |
| PCMark 8 Work Score Accelerated v2 | 3437 poäng | |
| PCMark 10 Score | 2881 poäng | |
Hjälp | ||
| Lenovo IdeaPad 330-15ARR 81D2005CUS SK Hynix Canvas SC311 256GB HFS256G32TNF | Lenovo Ideapad 530S-15IKB SK hynix PC401 HFS256GD9TNG | Acer Swift 3 SF315-41-R6J9 Micron SSD 1100 SED 512GB, M.2 (MTFDDAV512TBN) | Asus VivoBook E200HA-FD0041TS Hynix HBG4a2 32 GB eMMC | Lenovo IdeaPad Flex-1570 81CA000RUS SK Hynix PC401 512GB M.2 (HFS512GD9TNG) | |
|---|---|---|---|---|---|
| AS SSD | 80% | -8% | -120% | 143% | |
| Copy Game MB/s (MB/s) | 262.4 | 301.1 15% | 221.7 -16% | 56.8 -78% | 684 161% |
| Copy Program MB/s (MB/s) | 334 | 233.5 -30% | 174.4 -48% | 38.74 -88% | 495.6 48% |
| Copy ISO MB/s (MB/s) | 434.5 | 868 100% | 262.5 -40% | 60.7 -86% | 1013 133% |
| Score Total (Points) | 752 | 1387 84% | 727 -3% | 135 -82% | 2123 182% |
| Score Write (Points) | 295 | 415 41% | 275 -7% | 48 -84% | 832 182% |
| Score Read (Points) | 296 | 690 133% | 297 0% | 54 -82% | 860 191% |
| Access Time Write * (ms) | 0.08 | 0.051 36% | 0.072 10% | 0.575 -619% | 0.051 36% |
| Access Time Read * (ms) | 0.102 | 0.06 41% | 0.078 24% | 0.228 -124% | 0.045 56% |
| 4K-64 Write (MB/s) | 203.6 | 271.6 33% | 187 -8% | 25.33 -88% | 612 201% |
| 4K-64 Read (MB/s) | 228.5 | 431.3 89% | 231.8 1% | 23.97 -90% | 660 189% |
| 4K Write (MB/s) | 45.41 | 88.4 95% | 49.43 9% | 10.55 -77% | 99.5 119% |
| 4K Read (MB/s) | 23.4 | 38.69 65% | 20.27 -13% | 14.01 -40% | 40.59 73% |
| Seq Write (MB/s) | 459.6 | 550 20% | 384.7 -16% | 124.7 -73% | 1209 163% |
| Seq Read (MB/s) | 441.6 | 2205 399% | 448.1 1% | 160.8 -64% | 1596 261% |
* ... mindre är bättre

| 3DMark 11 | |
| 1280x720 Performance GPU | |
| Lenovo IdeaPad 530s-14IKB | |
| Acer Swift 3 SF315-41-R6J9 | |
| Genomsnitt AMD Radeon RX Vega 8 (Ryzen 2000/3000) (1668 - 4317, n=44) | |
| Apple MacBook Pro 13 2018 Touchbar i5 | |
| Asus VivoBook S410UQ-NH74 | |
| Lenovo IdeaPad Flex-1570 81CA000RUS | |
| Lenovo IdeaPad 330-15ARR 81D2005CUS | |
| Asus VivoBook E200HA-FD0041TS | |
| 1280x720 Performance Combined | |
| Lenovo IdeaPad 530s-14IKB | |
| Lenovo IdeaPad Flex-1570 81CA000RUS | |
| Acer Swift 3 SF315-41-R6J9 | |
| Apple MacBook Pro 13 2018 Touchbar i5 | |
| Genomsnitt AMD Radeon RX Vega 8 (Ryzen 2000/3000) (1232 - 3871, n=44) | |
| Asus VivoBook S410UQ-NH74 | |
| Lenovo IdeaPad 330-15ARR 81D2005CUS | |
| Asus VivoBook E200HA-FD0041TS | |
| 3DMark 11 Performance | 2241 poäng | |
| 3DMark Cloud Gate Standard Score | 7161 poäng | |
| 3DMark Fire Strike Score | 1066 poäng | |
Hjälp | ||
| låg | med. | hög | ultra | |
|---|---|---|---|---|
| BioShock Infinite (2013) | 68.9 | 7.6 | ||
| The Witcher 3 (2015) | 22 |
Ljudnivå
| Låg belastning |
| 28.1 / 31.6 / 32.8 dB(A) |
| Hög belastning |
| 36.5 / 32.8 dB(A) |
 | ||
30 dB tyst 40 dB(A) hörbar 50 dB(A) högt ljud |
||
min: | ||
| Lenovo IdeaPad 330-15ARR 81D2005CUS Vega 8, R5 2500U, SK Hynix Canvas SC311 256GB HFS256G32TNF | Lenovo Ideapad 530S-15IKB UHD Graphics 620, i5-8250U, SK hynix PC401 HFS256GD9TNG | Huawei MateBook D 15-53010BAJ GeForce MX150, i5-8250U, Samsung SSD PM981 MZVLB512HAJQ | HP Pavilion 15-cs0053cl UHD Graphics 620, i5-8250U, Toshiba MQ04ABF100 | Asus VivoBook 15 F510UF-ES71 GeForce MX130, i5-8550U, Seagate Mobile HDD 1TB ST1000LM035 | |
|---|---|---|---|---|---|
| Noise | 6% | -11% | -1% | -16% | |
| av / miljö * (dB) | 28.1 | 28 -0% | 27.8 1% | 28.2 -0% | 28.5 -1% |
| Idle Minimum * (dB) | 28.1 | 28 -0% | 29.4 -5% | 31.7 -13% | 30.8 -10% |
| Idle Average * (dB) | 31.6 | 28 11% | 29.6 6% | 31.7 -0% | 30.8 3% |
| Idle Maximum * (dB) | 32.8 | 30.1 8% | 29.6 10% | 32 2% | 31 5% |
| Load Average * (dB) | 36.5 | 30.2 17% | 43.5 -19% | 32.8 10% | 45.6 -25% |
| Witcher 3 ultra * (dB) | 32.8 | 43.5 -33% | 45.6 -39% | ||
| Load Maximum * (dB) | 32.8 | 33.2 -1% | 45.8 -40% | 35 -7% | 46.7 -42% |
* ... mindre är bättre
(+) Den maximala temperaturen på ovansidan är 36.8 °C / 98 F, jämfört med genomsnittet av 34.3 °C / 94 F , allt från 21.2 till 62.5 °C för klassen Office.
(±) Botten värms upp till maximalt 42 °C / 108 F, jämfört med genomsnittet av 36.8 °C / 98 F
(+) Vid tomgångsbruk är medeltemperaturen för ovansidan 26.4 °C / 80 F, jämfört med enhetsgenomsnittet på 29.5 °C / ### class_avg_f### F.
(+) När du spelar The Witcher 3 är medeltemperaturen för ovansidan 30.7 °C / 87 F, jämfört med enhetsgenomsnittet på 29.5 °C / ## #class_avg_f### F.
(+) Handledsstöden och pekplattan når maximal hudtemperatur (34 °C / 93.2 F) och är därför inte varma.
(-) Medeltemperaturen för handledsstödsområdet på liknande enheter var 27.5 °C / 81.5 F (-6.5 °C / -11.7 F).
Lenovo IdeaPad 330-15ARR 81D2005CUS ljudanalys
(-) | inte särskilt höga högtalare (70.3 dB)
Bas 100 - 315 Hz
(-) | nästan ingen bas - i genomsnitt 22% lägre än medianen
(±) | linjäriteten för basen är genomsnittlig (11.9% delta till föregående frekvens)
Mellan 400 - 2000 Hz
(+) | balanserad mellan - endast 3.6% från medianen
(±) | linjäriteten för mids är genomsnittlig (10.2% delta till föregående frekvens)
Högsta 2 - 16 kHz
(+) | balanserade toppar - endast 3.8% från medianen
(±) | linjäriteten för toppar är genomsnittlig (10.7% delta till föregående frekvens)
Totalt 100 - 16 000 Hz
(±) | linjäriteten för det totala ljudet är genomsnittlig (25.4% skillnad mot median)
Jämfört med samma klass
» 77% av alla testade enheter i den här klassen var bättre, 6% liknande, 17% sämre
» Den bästa hade ett delta på 7%, genomsnittet var 21%, sämst var 53%
Jämfört med alla testade enheter
» 78% av alla testade enheter var bättre, 5% liknande, 17% sämre
» Den bästa hade ett delta på 4%, genomsnittet var 24%, sämst var 134%
Apple MacBook 12 (Early 2016) 1.1 GHz ljudanalys
(+) | högtalare kan spela relativt högt (83.6 dB)
Bas 100 - 315 Hz
(±) | reducerad bas - i genomsnitt 11.3% lägre än medianen
(±) | linjäriteten för basen är genomsnittlig (14.2% delta till föregående frekvens)
Mellan 400 - 2000 Hz
(+) | balanserad mellan - endast 2.4% från medianen
(+) | mids är linjära (5.5% delta till föregående frekvens)
Högsta 2 - 16 kHz
(+) | balanserade toppar - endast 2% från medianen
(+) | toppar är linjära (4.5% delta till föregående frekvens)
Totalt 100 - 16 000 Hz
(+) | det totala ljudet är linjärt (10.2% skillnad mot median)
Jämfört med samma klass
» 7% av alla testade enheter i den här klassen var bättre, 2% liknande, 91% sämre
» Den bästa hade ett delta på 5%, genomsnittet var 18%, sämst var 53%
Jämfört med alla testade enheter
» 5% av alla testade enheter var bättre, 1% liknande, 94% sämre
» Den bästa hade ett delta på 4%, genomsnittet var 24%, sämst var 134%
| Av/Standby | |
| Låg belastning | |
| Hög belastning |
|
Förklaring:
min: | |
| Lenovo IdeaPad 330-15ARR 81D2005CUS R5 2500U, Vega 8, SK Hynix Canvas SC311 256GB HFS256G32TNF, TN LED, 1920x1080, 15.6" | Lenovo Ideapad 530S-15IKB i5-8250U, UHD Graphics 620, SK hynix PC401 HFS256GD9TNG, IPS, 1920x1080, 15.6" | Huawei MateBook D 15-53010BAJ i5-8250U, GeForce MX150, Samsung SSD PM981 MZVLB512HAJQ, IPS, 1920x1080, 15.6" | HP Pavilion 15-cs0053cl i5-8250U, UHD Graphics 620, Toshiba MQ04ABF100, TN LED, 1366x768, 15.6" | Asus VivoBook 15 F510UF-ES71 i5-8550U, GeForce MX130, Seagate Mobile HDD 1TB ST1000LM035, IPS, 1920x1080, 15.6" | |
|---|---|---|---|---|---|
| Power Consumption | 20% | -27% | 16% | -25% | |
| Idle Minimum * (Watt) | 7.6 | 3.5 54% | 4.2 45% | 5.6 26% | 5.9 22% |
| Idle Average * (Watt) | 10.6 | 5.6 47% | 7.2 32% | 7.1 33% | 7 34% |
| Idle Maximum * (Watt) | 11.8 | 10.3 13% | 12.1 -3% | 7.9 33% | 8.5 28% |
| Load Average * (Watt) | 24.1 | 30.5 -27% | 51.1 -112% | 32.8 -36% | 54.5 -126% |
| Witcher 3 ultra * (Watt) | 30.3 | 52.7 -74% | 50.6 -67% | ||
| Load Maximum * (Watt) | 39.4 | 33.8 14% | 59.9 -52% | 30.5 23% | 55.7 -41% |
* ... mindre är bättre
| Lenovo IdeaPad 330-15ARR 81D2005CUS R5 2500U, Vega 8, 35 Wh | Lenovo Ideapad 530S-15IKB i5-8250U, UHD Graphics 620, 45 Wh | Huawei MateBook D 15-53010BAJ i5-8250U, GeForce MX150, 43.3 Wh | HP Pavilion 15-cs0053cl i5-8250U, UHD Graphics 620, 41 Wh | Asus VivoBook 15 F510UF-ES71 i5-8550U, GeForce MX130, 42 Wh | |
|---|---|---|---|---|---|
| Batteridrifttid | 63% | 93% | 75% | -2% | |
| WiFi v1.3 (h) | 4 | 6.5 63% | 7.7 93% | 7 75% | 3.9 -2% |
| Reader / Idle (h) | 15.2 | 12 | |||
| Load (h) | 1.2 | 2.2 |
För
Emot
Läs den fullständiga versionen av den här recensionen på engelska här.
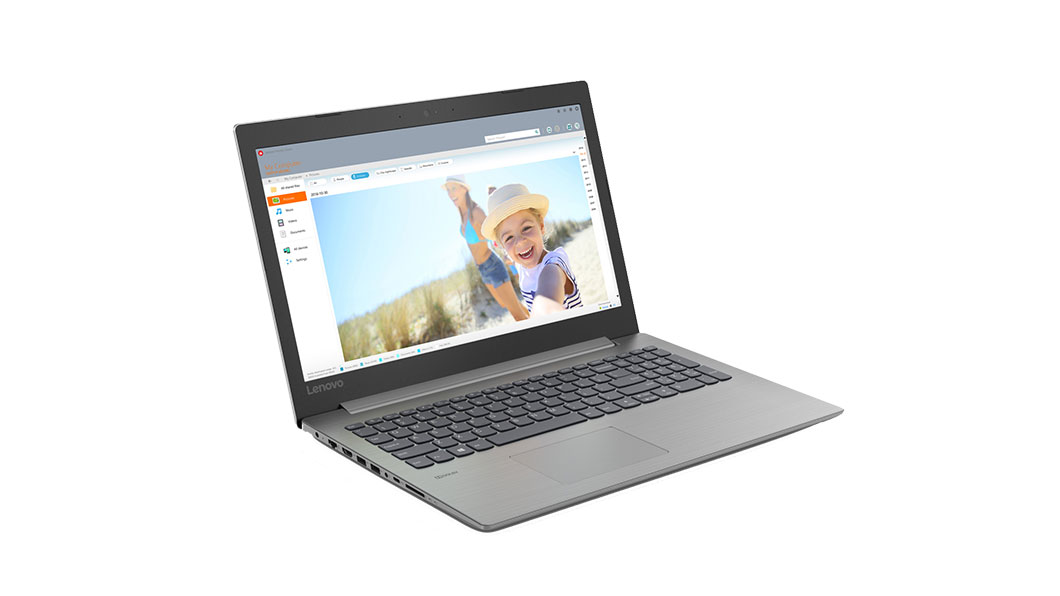
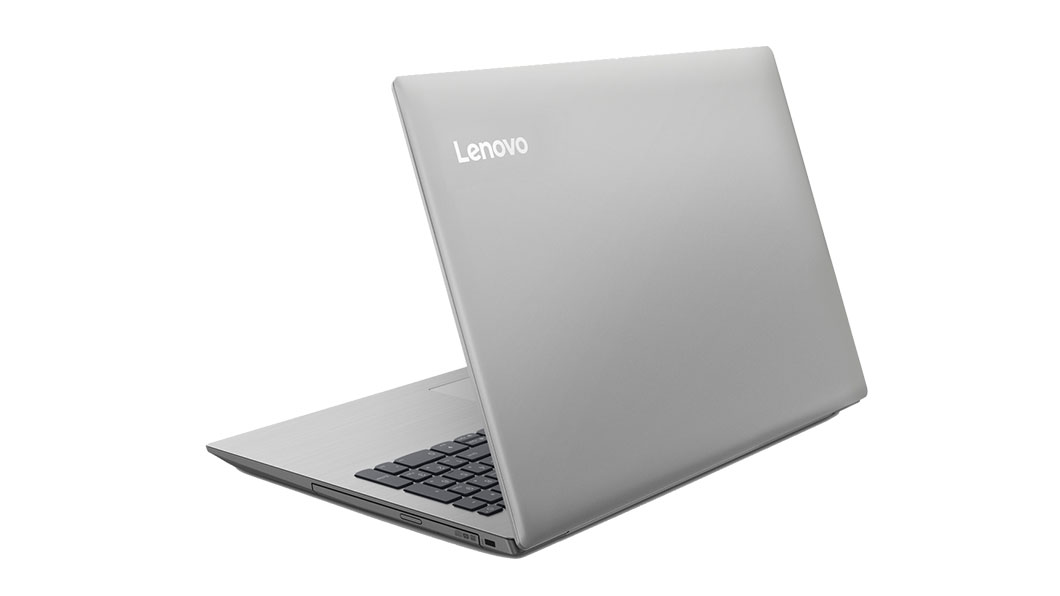
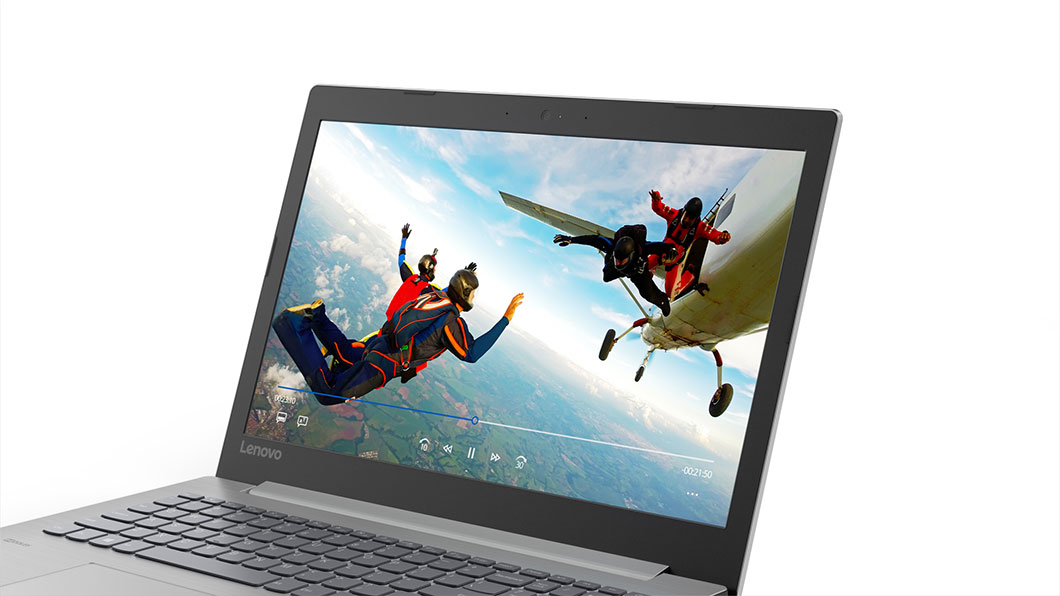
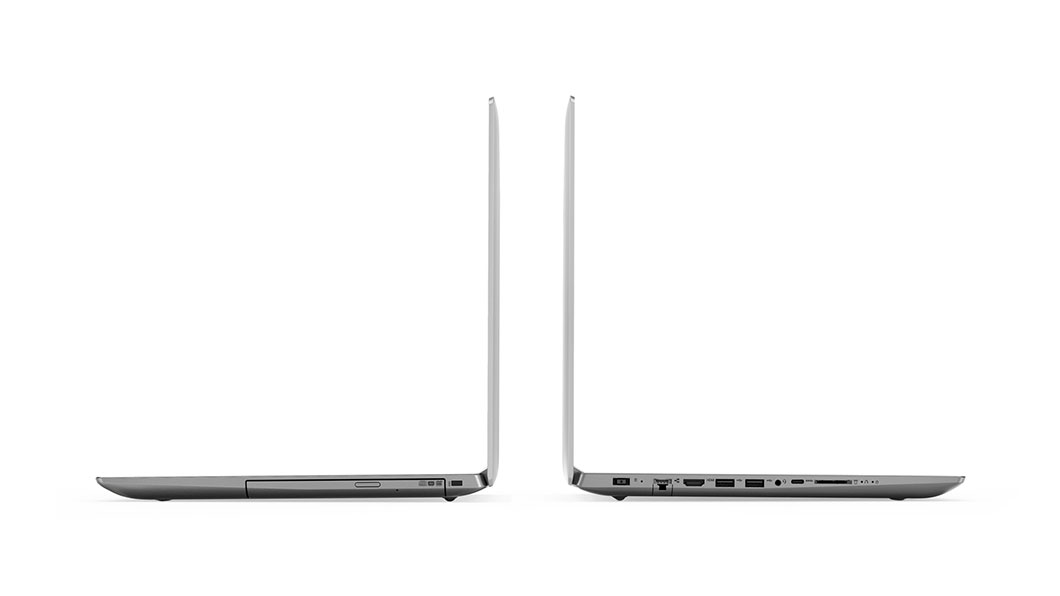
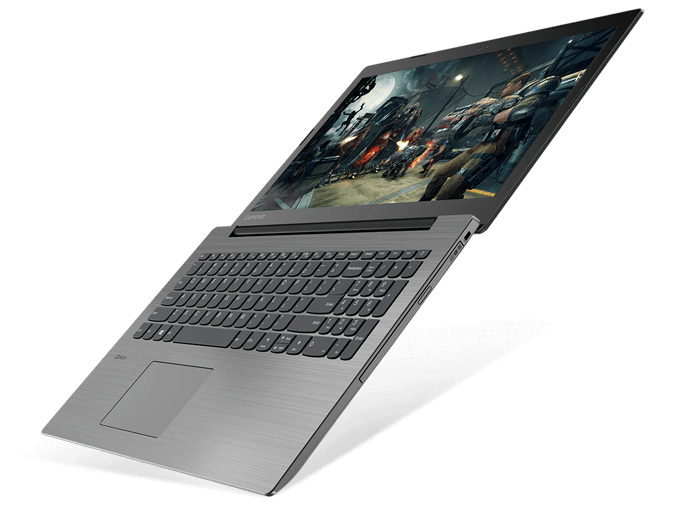
Ideapad 330 på 15 tum är en billig multimedialösning och vi förväntar oss därför inte särskilt mycket från systemet. Dess chassi är smidigt om än slätstruket och den matta skärmen är riktigt bra på att reducera reflektioner. Det är också en av få bärbara datorer som kommer med både USB Typ C och en optisk enhet, för användare som vill ha en sådan.
Det finns ändå en lång lista över egenskaper som är en besvikelse trots det låga utgångspriset. Färgerna och RGB-balansen är katastrofala vid leverans så en användar-kalibrering rekommenderas för en bättre upplevelse, särskilt för videouppspelning. Strypningen är kraftig på nästan 41% enligt vårt CineBench R15 loop-test. Så även om Ryzen 5 2500U på papperet är ett kraftfullt alternativ till Intel så kommer ägaren av den här datorn inte kunna dra fullständig nytta av AMD-processorn till spel eller tungt arbete. Den dyrare varianten med en kraftigare Ryzen 7 2700U kan potentiellt sett vara ett sämre köp då redan den mindre krävande Ryzen 5 2500U-konfigurationen stryps så kraftigt. Dessutom är batteritiden kort vilket gör Ideapad 330 till en dålig resekamrat.
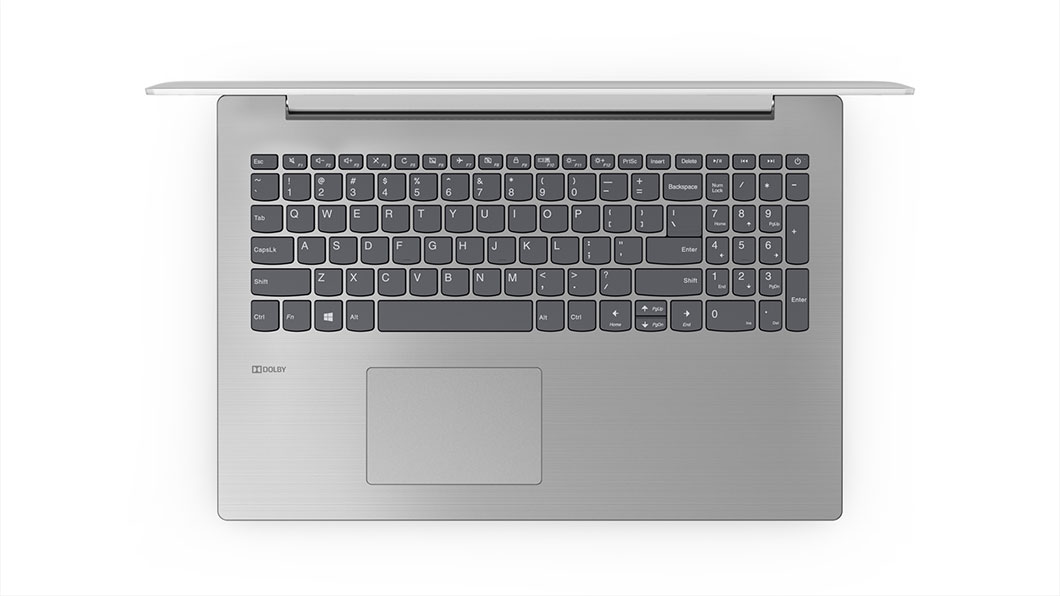
Till kommande revideringar hoppas vi på att se USB Typ C-laddning istället för en propretiär AC-adapter och kanske även ytterligare en USB Typ A-port på högra kanten. En mer ljusstark skärm, längre batteritid och mindre prestandastrypning hade också gjort mycket för den här maskinen. Den nya uppfräschningen av HP Pavilion 15 är generellt ett bättre alternativ i samma prisskikt.
Det finns några grundläggande faktorer som Ideapad 330 kunde ha gjort bättre utan att det överkomliga priset hade behövt öka. En bättre kalibrerad skärm, manuella fläktkontroller för tyst strömning, minskad prestandastrypning och en USB Typ A-port på högra sidan hade gjort Ideapad 330 till ett bättre köp för sitt pris. Som det ser ut nu är den bara medelmåttig.
Lenovo IdeaPad 330-15ARR 81D2005CUS
- 09/20/2018 v6 (old)
Allen Ngo
Price comparison
