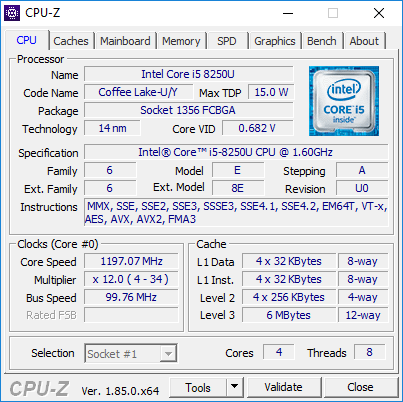
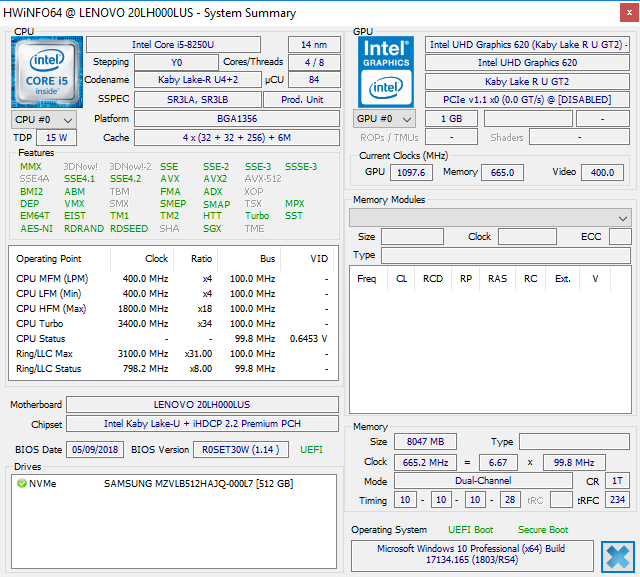
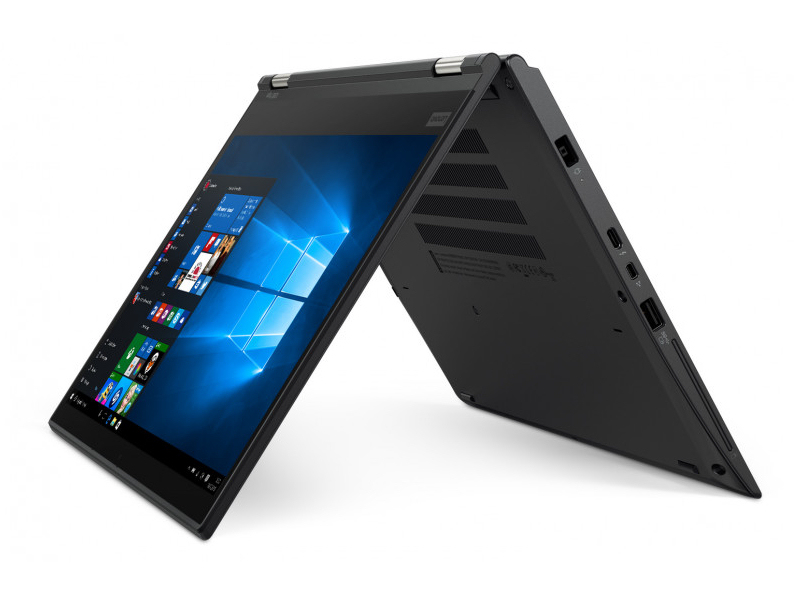
Test: Lenovo ThinkPad X380 Yoga (i5-8250U, FHD) Omvandlingsbar (Sammanfattning)
| SD Card Reader | |
| average JPG Copy Test (av. of 3 runs) | |
| Lenovo ThinkPad X1 Yoga 2018-20LD0015US | |
| Dell Latitude 7390 2-in-1 (Toshiba Exceria Pro M501 UHS-II) | |
| Microsoft Surface Book 2 (Toshiba Exceria Pro SDXC 64 GB UHS-II) | |
| HP Spectre x360 13-ae048ng (Toshiba Exceria Pro M501 microSDXC 64GB) | |
| Lenovo ThinkPad X380 Yoga-20LH000LUS (Toshiba Exceria Pro M501 UHS-II) | |
| Genomsnitt av klass Convertible (28.1 - 197, n=23, senaste 2 åren) | |
| Lenovo ThinkPad X380 Yoga 20LJS02W00 (Toshiba Exceria Pro SDXC 64 GB UHS-II) | |
| maximum AS SSD Seq Read Test (1GB) | |
| Microsoft Surface Book 2 (Toshiba Exceria Pro SDXC 64 GB UHS-II) | |
| Dell Latitude 7390 2-in-1 (Toshiba Exceria Pro M501 UHS-II) | |
| Lenovo ThinkPad X1 Yoga 2018-20LD0015US | |
| HP Spectre x360 13-ae048ng (Toshiba Exceria Pro M501 microSDXC 64GB) | |
| Genomsnitt av klass Convertible (28.9 - 254, n=22, senaste 2 åren) | |
| Lenovo ThinkPad X380 Yoga 20LJS02W00 (Toshiba Exceria Pro SDXC 64 GB UHS-II) | |
| Lenovo ThinkPad X380 Yoga-20LH000LUS (Toshiba Exceria Pro M501 UHS-II) | |
| |||||||||||||||||||||||||
Distribution av ljusstyrkan: 91 %
Mitt på batteriet: 336.3 cd/m²
Kontrast: 989:1 (Svärta: 0.34 cd/m²)
ΔE ColorChecker Calman: 5.77 | ∀{0.5-29.43 Ø4.73}
calibrated: 1.46
ΔE Greyscale Calman: 7.8 | ∀{0.09-98 Ø4.97}
96% sRGB (Argyll 1.6.3 3D)
61% AdobeRGB 1998 (Argyll 1.6.3 3D)
67.2% AdobeRGB 1998 (Argyll 3D)
95.8% sRGB (Argyll 3D)
65.4% Display P3 (Argyll 3D)
Gamma: 1.99
CCT: 6408 K
| Lenovo ThinkPad X380 Yoga-20LH000LUS Lenovo LEN4094, IPS, 13.3", 1920x1080 | Lenovo ThinkPad X380 Yoga 20LJS02W00 Lenovo M133NWF4 R3, IPS, 13.3", 1920x1080 | Lenovo ThinkPad X1 Yoga 2018-20LD0015US Lenovo LEN40A9, IPS, 14", 1920x1080 | HP Spectre x360 13-ae048ng Chi Mei (CMN1376), IPS, 13.3", 1920x1080 | Dell Latitude 7390 2-in-1 AUO462D, IPS, 13.3", 1920x1080 | Microsoft Surface Book 2 Panasonic MEI96A2 , IPS, 13.5", 3000x2000 | |
|---|---|---|---|---|---|---|
| Display | 1% | -8% | 4% | -7% | 2% | |
| Display P3 Coverage (%) | 65.4 | 65.9 1% | 60.9 -7% | 68.1 4% | 62.5 -4% | 67.9 4% |
| sRGB Coverage (%) | 95.8 | 95.8 0% | 86.4 -10% | 99.5 4% | 86.1 -10% | 95.7 0% |
| AdobeRGB 1998 Coverage (%) | 67.2 | 67.8 1% | 61.9 -8% | 70.2 4% | 62.9 -6% | 69.4 3% |
| Response Times | -6% | 6% | 14% | -7% | -11% | |
| Response Time Grey 50% / Grey 80% * (ms) | 44 ? | 50 ? -14% | 40.4 ? 8% | 36 ? 18% | 48.8 ? -11% | 52.8 ? -20% |
| Response Time Black / White * (ms) | 29.6 ? | 29 ? 2% | 28.8 ? 3% | 27 ? 9% | 30.4 ? -3% | 30 ? -1% |
| PWM Frequency (Hz) | 962 ? | 1000 ? | 25000 ? | |||
| Screen | 14% | -6% | 15% | -10% | 37% | |
| Brightness middle (cd/m²) | 336.3 | 314 -7% | 267.2 -21% | 311 -8% | 318.2 -5% | 385 14% |
| Brightness (cd/m²) | 322 | 302 -6% | 239 -26% | 278 -14% | 312 -3% | 372 16% |
| Brightness Distribution (%) | 91 | 84 -8% | 75 -18% | 82 -10% | 83 -9% | 89 -2% |
| Black Level * (cd/m²) | 0.34 | 0.16 53% | 0.27 21% | 0.2 41% | 0.3 12% | 0.21 38% |
| Contrast (:1) | 989 | 1963 98% | 990 0% | 1555 57% | 1061 7% | 1833 85% |
| Colorchecker dE 2000 * | 5.77 | 5.73 1% | 3.5 39% | 3.98 31% | 4.25 26% | 1.6 72% |
| Colorchecker dE 2000 max. * | 10.59 | 10.43 2% | 6.4 40% | 8.48 20% | 9.49 10% | 4.5 58% |
| Colorchecker dE 2000 calibrated * | 1.46 | 3.81 -161% | 4.38 -200% | |||
| Greyscale dE 2000 * | 7.8 | 7.39 5% | 1.3 83% | 5.57 29% | 2.1 73% | 1.5 81% |
| Gamma | 1.99 111% | 2.14 103% | 2.146 103% | 2.51 88% | 2.311 95% | 2.22 99% |
| CCT | 6408 101% | 6351 102% | 6523 100% | 7810 83% | 6588 99% | 6502 100% |
| Color Space (Percent of AdobeRGB 1998) (%) | 61 | 61 0% | 56 -8% | 64 5% | 56 -8% | 64 5% |
| Color Space (Percent of sRGB) (%) | 96 | 96 0% | 86 -10% | 99 3% | 85 -11% | 95.9 0% |
| Totalt genomsnitt (program/inställningar) | 3% /
9% | -3% /
-5% | 11% /
13% | -8% /
-9% | 9% /
24% |
* ... mindre är bättre
Visa svarstider
| ↔ Svarstid svart till vitt | ||
|---|---|---|
| 29.6 ms ... stiga ↗ och falla ↘ kombinerat | ↗ 15.6 ms stiga | 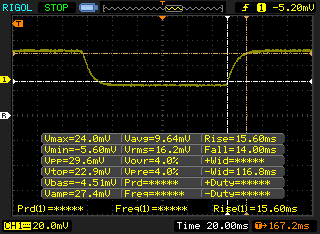 |
| ↘ 14 ms hösten | ||
| Skärmen visar relativt långsamma svarsfrekvenser i våra tester och kan vara för långsam för spelare. I jämförelse sträcker sig alla testade enheter från 0.1 (minst) till 240 (maximalt) ms. » 79 % av alla enheter är bättre. Detta innebär att den uppmätta svarstiden är sämre än genomsnittet av alla testade enheter (19.9 ms). | ||
| ↔ Svarstid 50 % grått till 80 % grått | ||
| 44 ms ... stiga ↗ och falla ↘ kombinerat | ↗ 21.2 ms stiga | 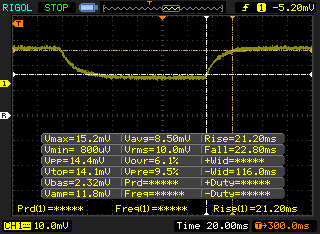 |
| ↘ 22.8 ms hösten | ||
| Skärmen visar långsamma svarsfrekvenser i våra tester och kommer att vara otillfredsställande för spelare. I jämförelse sträcker sig alla testade enheter från 0.165 (minst) till 636 (maximalt) ms. » 73 % av alla enheter är bättre. Detta innebär att den uppmätta svarstiden är sämre än genomsnittet av alla testade enheter (31.1 ms). | ||
Skärmflimmer / PWM (Puls-Width Modulation)
| Skärmflimmer / PWM upptäckt | 962 Hz | ≤ 99 % ljusstyrka inställning | 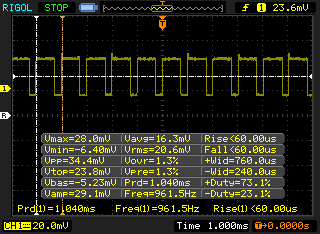 |
Displayens bakgrundsbelysning flimrar vid 962 Hz (i värsta fall, t.ex. med PWM) Flimrande upptäckt vid en ljusstyrkeinställning på 99 % och lägre. Det ska inte finnas något flimmer eller PWM över denna ljusstyrkeinställning. Frekvensen för 962 Hz är ganska hög, så de flesta användare som är känsliga för PWM bör inte märka något flimmer. Som jämförelse: 52 % av alla testade enheter använder inte PWM för att dämpa skärmen. Om PWM upptäcktes mättes ett medelvärde av 7794 (minst: 5 - maximum: 343500) Hz. | |||
* ... mindre är bättre
| PCMark 8 Home Score Accelerated v2 | 3760 poäng | |
| PCMark 8 Work Score Accelerated v2 | 4781 poäng | |
| PCMark 10 Score | 3538 poäng | |
Hjälp | ||
| Lenovo ThinkPad X380 Yoga-20LH000LUS Samsung SSD PM981 MZVLB512HAJQ | Lenovo ThinkPad X380 Yoga 20LJS02W00 Samsung SSD PM981 MZVLB512HAJQ | Lenovo ThinkPad X1 Yoga 2018-20LD0015US Samsung SSD PM981 MZVLB512HAJQ | HP Spectre x360 13-ae048ng Toshiba NVMe THNSN51T02DUK | Dell Latitude 7390 2-in-1 SK hynix PC401 NVMe 500 GB | Genomsnitt Samsung SSD PM981 MZVLB512HAJQ | |
|---|---|---|---|---|---|---|
| AS SSD | -7% | 11% | -596% | -25% | 6% | |
| Copy Game MB/s (MB/s) | 962 | 607 | 856 | 473.6 | 1057 ? | |
| Copy Program MB/s (MB/s) | 343 | 233.5 | 281.8 | 223.5 | 454 ? | |
| Copy ISO MB/s (MB/s) | 1770 | 917 | 1205 | 1377 | 1755 ? | |
| Score Total (Points) | 3487 | 2543 -27% | 3594 3% | 455 -87% | 2057 -41% | 3966 ? 14% |
| Score Write (Points) | 1099 | 1165 6% | 1359 24% | 42 -96% | 781 -29% | 1780 ? 62% |
| Score Read (Points) | 1619 | 896 -45% | 1487 -8% | 305 -81% | 877 -46% | 1451 ? -10% |
| Access Time Write * (ms) | 0.04 | 0.032 20% | 0.037 7% | 2.391 -5878% | 0.052 -30% | 0.08337 ? -108% |
| Access Time Read * (ms) | 0.04 | 0.039 2% | 0.043 -8% | 0.044 -10% | 0.045 -13% | 0.05092 ? -27% |
| 4K-64 Write (MB/s) | 907 | 926 2% | 1072 18% | 2.09 -100% | 606 -33% | 1504 ? 66% |
| 4K-64 Read (MB/s) | 1350 | 735 -46% | 1216 -10% | 115.6 -91% | 643 -52% | 1203 ? -11% |
| 4K Write (MB/s) | 91.3 | 111.6 22% | 102.3 12% | 1.73 -98% | 103.4 13% | 112 ? 23% |
| 4K Read (MB/s) | 43.1 | 51.5 19% | 49.11 14% | 31.73 -26% | 42.12 -2% | 50.5 ? 17% |
| Seq Write (MB/s) | 1044 | 1272 22% | 1840 76% | 377.1 -64% | 711 -32% | 1637 ? 57% |
| Seq Read (MB/s) | 2260 | 1099 -51% | 2218 -2% | 1574 -30% | 1911 -15% | 1976 ? -13% |
* ... mindre är bättre

| 3DMark 11 | |
| 1280x720 Performance GPU | |
| Genomsnitt av klass Convertible (1505 - 40732, n=48, senaste 2 åren) | |
| Dell XPS 15 2018 i5 FHD 97Wh | |
| HP Spectre x360 15-ch011nr | |
| Asus VivoBook 15 F510UF-ES71 | |
| Asus VivoBook S410UQ-NH74 | |
| Genomsnitt Intel UHD Graphics 620 (1144 - 3432, n=244) | |
| HP Elitebook 1040 G4-2XU40UT | |
| Lenovo ThinkPad X380 Yoga-20LH000LUS | |
| Huawei Matebook E | |
| Fujitsu Lifebook E756 | |
| 1280x720 Performance Combined | |
| Genomsnitt av klass Convertible (1952 - 17837, n=47, senaste 2 åren) | |
| Dell XPS 15 2018 i5 FHD 97Wh | |
| HP Spectre x360 15-ch011nr | |
| Asus VivoBook 15 F510UF-ES71 | |
| Asus VivoBook S410UQ-NH74 | |
| HP Elitebook 1040 G4-2XU40UT | |
| Genomsnitt Intel UHD Graphics 620 (927 - 2505, n=244) | |
| Lenovo ThinkPad X380 Yoga-20LH000LUS | |
| Fujitsu Lifebook E756 | |
| Huawei Matebook E | |
| 3DMark 06 Standard Score | 10245 poäng | |
| 3DMark 11 Performance | 1790 poäng | |
| 3DMark Cloud Gate Standard Score | 7672 poäng | |
| 3DMark Fire Strike Score | 1030 poäng | |
Hjälp | ||
Ljudnivå
| Låg belastning |
| 28 / 28 / 29.1 dB(A) |
| Hög belastning |
| 34.5 / 36.4 dB(A) |
 | ||
30 dB tyst 40 dB(A) hörbar 50 dB(A) högt ljud |
||
min: | ||
| Lenovo ThinkPad X380 Yoga-20LH000LUS UHD Graphics 620, i5-8250U, Samsung SSD PM981 MZVLB512HAJQ | Lenovo ThinkPad X380 Yoga 20LJS02W00 UHD Graphics 620, i5-8550U, Samsung SSD PM981 MZVLB512HAJQ | Lenovo ThinkPad X1 Yoga 2018-20LD0015US UHD Graphics 620, i5-8250U, Samsung SSD PM981 MZVLB512HAJQ | HP Spectre x360 13-ae048ng UHD Graphics 620, i5-8550U, Toshiba NVMe THNSN51T02DUK | Dell Latitude 7390 2-in-1 UHD Graphics 620, i7-8650U, SK hynix PC401 NVMe 500 GB | Microsoft Surface Book 2 GeForce GTX 1050 Mobile, i7-8650U, Samsung PM961 MZVLW256HEHP | |
|---|---|---|---|---|---|---|
| Noise | -5% | -0% | -3% | -1% | -7% | |
| av / miljö * (dB) | 28 | 30.4 -9% | 27.8 1% | 30.13 -8% | 28.2 -1% | 29.4 -5% |
| Idle Minimum * (dB) | 28 | 30.4 -9% | 27.8 1% | 30.13 -8% | 28.2 -1% | 29.4 -5% |
| Idle Average * (dB) | 28 | 30.4 -9% | 27.8 1% | 30 -7% | 28.2 -1% | 29.4 -5% |
| Idle Maximum * (dB) | 29.1 | 30.4 -4% | 27.8 4% | 30.13 -4% | 28.2 3% | 29.4 -1% |
| Load Average * (dB) | 34.5 | 34.2 1% | 33.9 2% | 33.4 3% | 32 7% | 31.4 9% |
| Load Maximum * (dB) | 36.4 | 35.2 3% | 39.9 -10% | 33 9% | 41.6 -14% | 49 -35% |
| Witcher 3 ultra * (dB) | 49 |
* ... mindre är bättre
(±) Den maximala temperaturen på ovansidan är 40.4 °C / 105 F, jämfört med genomsnittet av 35.4 °C / 96 F , allt från 19.6 till 60 °C för klassen Convertible.
(-) Botten värms upp till maximalt 51 °C / 124 F, jämfört med genomsnittet av 36.9 °C / 98 F
(+) Vid tomgångsbruk är medeltemperaturen för ovansidan 27.2 °C / 81 F, jämfört med enhetsgenomsnittet på 30.3 °C / ### class_avg_f### F.
(+) Handledsstöden och pekplattan är kallare än hudtemperaturen med maximalt 31.4 °C / 88.5 F och är därför svala att ta på.
(-) Medeltemperaturen för handledsstödsområdet på liknande enheter var 28 °C / 82.4 F (-3.4 °C / -6.1 F).
Lenovo ThinkPad X380 Yoga-20LH000LUS ljudanalys
(-) | inte särskilt höga högtalare (68.1 dB)
Bas 100 - 315 Hz
(-) | nästan ingen bas - i genomsnitt 19.2% lägre än medianen
(±) | linjäriteten för basen är genomsnittlig (12.2% delta till föregående frekvens)
Mellan 400 - 2000 Hz
(±) | högre mellan - i genomsnitt 6.7% högre än median
(±) | linjäriteten för mids är genomsnittlig (11.5% delta till föregående frekvens)
Högsta 2 - 16 kHz
(±) | högre toppar - i genomsnitt 5.4% högre än medianen
(±) | linjäriteten för toppar är genomsnittlig (9.8% delta till föregående frekvens)
Totalt 100 - 16 000 Hz
(-) | det totala ljudet är inte linjärt (35.9% skillnad mot median)
Jämfört med samma klass
» 95% av alla testade enheter i den här klassen var bättre, 1% liknande, 4% sämre
» Den bästa hade ett delta på 6%, genomsnittet var 20%, sämst var 57%
Jämfört med alla testade enheter
» 94% av alla testade enheter var bättre, 1% liknande, 5% sämre
» Den bästa hade ett delta på 4%, genomsnittet var 24%, sämst var 134%
Apple MacBook 12 (Early 2016) 1.1 GHz ljudanalys
(+) | högtalare kan spela relativt högt (83.6 dB)
Bas 100 - 315 Hz
(±) | reducerad bas - i genomsnitt 11.3% lägre än medianen
(±) | linjäriteten för basen är genomsnittlig (14.2% delta till föregående frekvens)
Mellan 400 - 2000 Hz
(+) | balanserad mellan - endast 2.4% från medianen
(+) | mids är linjära (5.5% delta till föregående frekvens)
Högsta 2 - 16 kHz
(+) | balanserade toppar - endast 2% från medianen
(+) | toppar är linjära (4.5% delta till föregående frekvens)
Totalt 100 - 16 000 Hz
(+) | det totala ljudet är linjärt (10.2% skillnad mot median)
Jämfört med samma klass
» 7% av alla testade enheter i den här klassen var bättre, 2% liknande, 91% sämre
» Den bästa hade ett delta på 5%, genomsnittet var 18%, sämst var 53%
Jämfört med alla testade enheter
» 5% av alla testade enheter var bättre, 1% liknande, 94% sämre
» Den bästa hade ett delta på 4%, genomsnittet var 24%, sämst var 134%
| Av/Standby | |
| Låg belastning | |
| Hög belastning |
|
Förklaring:
min: | |
| Lenovo ThinkPad X380 Yoga-20LH000LUS i5-8250U, UHD Graphics 620, Samsung SSD PM981 MZVLB512HAJQ, IPS, 1920x1080, 13.3" | Lenovo ThinkPad X1 Yoga 2018-20LD0015US i5-8250U, UHD Graphics 620, Samsung SSD PM981 MZVLB512HAJQ, IPS, 1920x1080, 14" | HP Spectre x360 13-ae048ng i5-8550U, UHD Graphics 620, Toshiba NVMe THNSN51T02DUK, IPS, 1920x1080, 13.3" | Dell Latitude 7390 2-in-1 i7-8650U, UHD Graphics 620, SK hynix PC401 NVMe 500 GB, IPS, 1920x1080, 13.3" | Microsoft Surface Book 2 i7-8650U, GeForce GTX 1050 Mobile, Samsung PM961 MZVLW256HEHP, IPS, 3000x2000, 13.5" | Lenovo ThinkPad X380 Yoga 20LJS02W00 i5-8550U, UHD Graphics 620, Samsung SSD PM981 MZVLB512HAJQ, IPS, 1920x1080, 13.3" | |
|---|---|---|---|---|---|---|
| Power Consumption | -0% | 12% | 20% | -82% | 12% | |
| Idle Minimum * (Watt) | 3.7 | 3 19% | 3.2 14% | 2.6 30% | 4.7 -27% | 4 -8% |
| Idle Average * (Watt) | 6.9 | 5.4 22% | 6 13% | 5.7 17% | 10.6 -54% | 4.9 29% |
| Idle Maximum * (Watt) | 11.3 | 7.5 34% | 9.2 19% | 6 47% | 12.3 -9% | 6.9 39% |
| Load Average * (Watt) | 34.2 | 40.1 -17% | 29.5 14% | 29.2 15% | 81 -137% | 36 -5% |
| Load Maximum * (Watt) | 35.6 | 57.1 -60% | 35.6 -0% | 38.8 -9% | 100.3 -182% | 34.4 3% |
| Witcher 3 ultra * (Watt) | 97 |
* ... mindre är bättre
| Lenovo ThinkPad X380 Yoga-20LH000LUS i5-8250U, UHD Graphics 620, 51 Wh | Lenovo ThinkPad X380 Yoga 20LJS02W00 i5-8550U, UHD Graphics 620, 51 Wh | Lenovo ThinkPad X1 Yoga 2018-20LD0015US i5-8250U, UHD Graphics 620, 54 Wh | HP Spectre x360 13-ae048ng i5-8550U, UHD Graphics 620, 60 Wh | Dell Latitude 7390 2-in-1 i7-8650U, UHD Graphics 620, 60 Wh | Microsoft Surface Book 2 i7-8650U, GeForce GTX 1050 Mobile, 75 Wh | |
|---|---|---|---|---|---|---|
| Batteridrifttid | -7% | 1% | 6% | -3% | 20% | |
| Reader / Idle (h) | 22.2 | 20.8 -6% | 20.3 -9% | 24.5 10% | ||
| WiFi v1.3 (h) | 9.4 | 8.5 -10% | 10.9 16% | 8.8 -6% | 9.2 -2% | 11.1 18% |
| Load (h) | 2.4 | 2.3 -4% | 2.3 -4% | 2.8 17% | 2.3 -4% | 3.2 33% |
| Witcher 3 ultra (h) | 3.8 |
För
Emot
Läs den fullständiga versionen av den här recensionen på engelska här.
Lenovos X380 Yoga klarade sig bra i vår ursprungliga recension men hade en del brister. Även om Core i7-8550U på papperet har 18% högre klockfrekvens än Core i5-8250U, så visade den sig vara en aning för mycket för X380 Yoga. För dom flesta typer av arbete verkar 8250U vara en bättre kollega åt denna flexibla enhet. Datorn är utmärkt på nästan alla områden, undantaget är långvarig CPU-prestanda. Höljet är robust, portutbudet är utmärkt och dom hållbara gångjärnen och det infällbara tangentbordet gör surfplattan lätt och bekväm att använda.
Som en kontorsmaskin är X380 utmärkt. Lenovos ThinkPad Yoga-serie har länge varit bland dom bästa för proffs som letar efter en välbyggd omvandlingsbar. Men konkurrenterna har nått fram till och ibland även passerat Lenovo på en del punkter. HP:s Spectre x360 13 är en vackert konstruerad maskin som inte lider av samma kraftiga strypning som X380 Yoga gör. Dells Latitude 7390 har tillräckligt med rum för två lagringsenheter och har ett kompakt fotavtryck. Microsofts Surface Book 2 får plats med massor av kraft i en omvandlingsbar och krossar konkurrenterna när det kommer till grafikintensivt arbete.
Men med det sagt, alla dessa har sina egna brister. Spectre x360 har ett begränsat portutbud, Latitude 7390 har en dålig skärm med en kraftigt reflekterande yta och Surface Book 2 har ett begränsande högt pris. X380 Yoga är en välavrundad maskin med en rimlig prislapp och är totalt sett en fröjd att använda.
X380 Yoga, i synnerhet Core i5 8250U-varianten, kan vara den totalt sett bästa kompakta omvandlingsbara modellen för företagskunder. Även om den har några brister så kombinerar den ett välbyggt hölje med ett utmärkt utbud av portar och slänger dessutom in utmärkt batteritid och en vacker och färgexakt skärm. Andra omvandlingsbara modeller för kontoret kan klara av ett specifikt område av laptop-upplevelsen utmärkt, men X380 Yoga klarar av alla områden bra utan att behöva lämna något därhän.
Lenovo ThinkPad X380 Yoga-20LH000LUS
- 07/18/2018 v6 (old)
Sam Medley
Price comparison
