Test: Gigabyte Aero 15 OLED XC - 4K OLED och motsvarande prestanda (Sammanfattning)
Testgrupp
Gradering | Datum | Modell | Vikt | Höjd | Storlek | Upplösning | Pris |
|---|---|---|---|---|---|---|---|
| 85.6 % v7 (old) | 03/2021 | Gigabyte Aero 15 OLED XC i7-10870H, GeForce RTX 3070 Laptop GPU | 2.2 kg | 20 mm | 15.60" | 3840x2160 | |
| 86.6 % v7 (old) | 02/2021 | Asus ROG Zephyrus Duo 15 SE GX551QS R9 5900HX, GeForce RTX 3080 Laptop GPU | 2.5 kg | 20.9 mm | 15.60" | 3840x2160 | |
| 84 % v7 (old) | 09/2021 | MSI GS66 Stealth 10UG i7-10870H, GeForce RTX 3070 Laptop GPU | 2.1 kg | 19.8 mm | 15.60" | 1920x1080 | |
| 90.1 % v7 (old) | Lenovo ThinkPad X1 Extreme Gen3-20TLS0UV00 i7-10750H, GeForce GTX 1650 Ti Max-Q | 1.7 kg | 18.7 mm | 15.60" | 1920x1080 | ||
| 85.8 % v7 (old) | 05/2020 | Gigabyte Aero 15 OLED XB-8DE51B0SP i7-10875H, GeForce RTX 2070 Super Max-Q | 2.2 kg | 20 mm | 15.60" | 3840x2160 | |
| 83 % v7 (old) | 08/2020 | HP Envy 15-ep0098nr i7-10750H, GeForce RTX 2060 Max-Q | 2 kg | 19 mm | 15.60" | 3840x2160 |
| SD Card Reader | |
| average JPG Copy Test (av. of 3 runs) | |
| Gigabyte Aero 15 OLED XB-8DE51B0SP (Toshiba Exceria Pro SDXC 64 GB UHS-II) | |
| Gigabyte Aero 15 OLED XC (Toshiba Exceria Pro SDXC 64 GB UHS-II) | |
| Asus ROG Zephyrus Duo 15 SE GX551QS (Toshiba Exceria Pro M501 microSDXC 32GB) | |
| Genomsnitt av klass Multimedia (23 - 531, n=36, senaste 2 åren) | |
| Lenovo ThinkPad X1 Extreme Gen3-20TLS0UV00 (Toshiba Exceria Pro SDXC 64 GB UHS-II) | |
| HP Envy 15-ep0098nr (Toshiba Exceria Pro M501 UHS-II) | |
| maximum AS SSD Seq Read Test (1GB) | |
| Gigabyte Aero 15 OLED XB-8DE51B0SP (Toshiba Exceria Pro SDXC 64 GB UHS-II) | |
| Asus ROG Zephyrus Duo 15 SE GX551QS (Toshiba Exceria Pro M501 microSDXC 32GB) | |
| Gigabyte Aero 15 OLED XC (Toshiba Exceria Pro SDXC 64 GB UHS-II) | |
| Lenovo ThinkPad X1 Extreme Gen3-20TLS0UV00 (Toshiba Exceria Pro SDXC 64 GB UHS-II) | |
| Genomsnitt av klass Multimedia (37.3 - 1455, n=35, senaste 2 åren) | |
| HP Envy 15-ep0098nr (Toshiba Exceria Pro M501 UHS-II) | |
| Networking | |
| iperf3 transmit AX12 | |
| Lenovo ThinkPad X1 Extreme Gen3-20TLS0UV00 | |
| Genomsnitt Intel Wi-Fi 6 AX200 (447 - 1645, n=127) | |
| Gigabyte Aero 15 OLED XC | |
| MSI GS66 Stealth 10UG | |
| Asus ROG Zephyrus Duo 15 SE GX551QS | |
| iperf3 receive AX12 | |
| Lenovo ThinkPad X1 Extreme Gen3-20TLS0UV00 | |
| Asus ROG Zephyrus Duo 15 SE GX551QS | |
| MSI GS66 Stealth 10UG | |
| Genomsnitt Intel Wi-Fi 6 AX200 (523 - 1684, n=128) | |
| Gigabyte Aero 15 OLED XC | |


")
")


| |||||||||||||||||||||||||
Distribution av ljusstyrkan: 95 %
Mitt på batteriet: 442 cd/m²
Kontrast: 8840:1 (Svärta: 0.05 cd/m²)
ΔE ColorChecker Calman: 2.69 | ∀{0.5-29.43 Ø4.71}
calibrated: 2.59
ΔE Greyscale Calman: 0.9 | ∀{0.09-98 Ø4.96}
100% sRGB (Argyll 1.6.3 3D)
99% AdobeRGB 1998 (Argyll 1.6.3 3D)
98.5% AdobeRGB 1998 (Argyll 3D)
100% sRGB (Argyll 3D)
99.9% Display P3 (Argyll 3D)
Gamma: 2.172
CCT: 6434 K
| Gigabyte Aero 15 OLED XC SDCA029, OLED, 3840x2160, 15.6" | HP Envy 15-ep0098nr Samsung SDC4145, AMOLED, 3840x2160, 15.6" | Gigabyte Aero 15 OLED XB-8DE51B0SP Samsung SDCA029, OLED, 3840x2160, 15.6" | Asus ROG Zephyrus Duo 15 SE GX551QS AU Optronics B156ZAN05.1, IPS, 3840x2160, 15.6" | Lenovo ThinkPad X1 Extreme Gen3-20TLS0UV00 N156HCE-GN1, IPS, 1920x1080, 15.6" | MSI GS66 Stealth 10UG AU Optronics B156HAN12.0, IPS, 1920x1080, 15.6" | |
|---|---|---|---|---|---|---|
| Display | -3% | 0% | -3% | -29% | -21% | |
| Display P3 Coverage (%) | 99.9 | 88.5 -11% | 99.9 0% | 89.1 -11% | 61 -39% | 67.7 -32% |
| sRGB Coverage (%) | 100 | 100 0% | 100 0% | 99.9 0% | 89.9 -10% | 98.4 -2% |
| AdobeRGB 1998 Coverage (%) | 98.5 | 99.9 1% | 98.2 0% | 99.1 1% | 62.2 -37% | 69.1 -30% |
| Response Times | 9% | 4% | -360% | -1222% | -522% | |
| Response Time Grey 50% / Grey 80% * (ms) | 2.4 ? | 0.8 ? 67% | 2.2 ? 8% | 8.2 ? -242% | 33.6 ? -1300% | 14.4 ? -500% |
| Response Time Black / White * (ms) | 1.8 ? | 2.7 ? -50% | 1.8 ? -0% | 10.4 ? -478% | 22.4 ? -1144% | 11.6 ? -544% |
| PWM Frequency (Hz) | 240 ? | 242.7 ? | 60 ? | 26040 ? | ||
| Screen | -42% | -3% | -109% | -78% | -58% | |
| Brightness middle (cd/m²) | 442 | 374.3 -15% | 385 -13% | 406 -8% | 518 17% | 259.5 -41% |
| Brightness (cd/m²) | 452 | 379 -16% | 390 -14% | 407 -10% | 513 13% | 264 -42% |
| Brightness Distribution (%) | 95 | 91 -4% | 93 -2% | 88 -7% | 88 -7% | 90 -5% |
| Black Level * (cd/m²) | 0.05 | 0.42 -740% | 0.38 -660% | 0.25 -400% | ||
| Contrast (:1) | 8840 | 967 -89% | 1363 -85% | 1038 -88% | ||
| Colorchecker dE 2000 * | 2.69 | 5.47 -103% | 2.46 9% | 4.36 -62% | 2.1 22% | 2.52 6% |
| Colorchecker dE 2000 max. * | 8.27 | 8.22 1% | 4.01 52% | 7.55 9% | 4.5 46% | 5.55 33% |
| Colorchecker dE 2000 calibrated * | 2.59 | 4.61 -78% | 2.6 -0% | 3.63 -40% | 1.3 50% | 1.93 25% |
| Greyscale dE 2000 * | 0.9 | 2.3 -156% | 1.39 -54% | 3.1 -244% | 2.7 -200% | 1.7 -89% |
| Gamma | 2.172 101% | 2.09 105% | 2.31 95% | 2.36 93% | 2.35 94% | 2.04 108% |
| CCT | 6434 101% | 6340 103% | 6395 102% | 6371 102% | 7042 92% | 6414 101% |
| Color Space (Percent of AdobeRGB 1998) (%) | 99 | 87.8 -11% | 98 -1% | 86.7 -12% | 57.7 -42% | 63.3 -36% |
| Color Space (Percent of sRGB) (%) | 100 | 100 0% | 100 0% | 99.9 0% | 90.4 -10% | 98.8 -1% |
| Totalt genomsnitt (program/inställningar) | -12% /
-27% | 0% /
-1% | -157% /
-121% | -443% /
-212% | -200% /
-109% |
* ... mindre är bättre
Visa svarstider
| ↔ Svarstid svart till vitt | ||
|---|---|---|
| 1.8 ms ... stiga ↗ och falla ↘ kombinerat | ↗ 1 ms stiga | 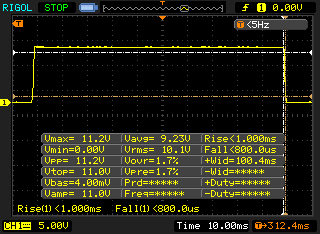 |
| ↘ 0.8 ms hösten | ||
| Skärmen visar väldigt snabba svarsfrekvenser i våra tester och borde vara mycket väl lämpad för fartfyllt spel. I jämförelse sträcker sig alla testade enheter från 0.1 (minst) till 240 (maximalt) ms. » 11 % av alla enheter är bättre. Det betyder att den uppmätta svarstiden är bättre än genomsnittet av alla testade enheter (19.8 ms). | ||
| ↔ Svarstid 50 % grått till 80 % grått | ||
| 2.4 ms ... stiga ↗ och falla ↘ kombinerat | ↗ 1.2 ms stiga | 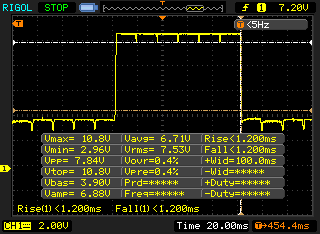 |
| ↘ 1.2 ms hösten | ||
| Skärmen visar väldigt snabba svarsfrekvenser i våra tester och borde vara mycket väl lämpad för fartfyllt spel. I jämförelse sträcker sig alla testade enheter från 0.165 (minst) till 636 (maximalt) ms. » 11 % av alla enheter är bättre. Det betyder att den uppmätta svarstiden är bättre än genomsnittet av alla testade enheter (30.9 ms). | ||
Skärmflimmer / PWM (Puls-Width Modulation)
| Skärmflimmer / PWM upptäckt | 240 Hz | ≤ 79 % ljusstyrka inställning | 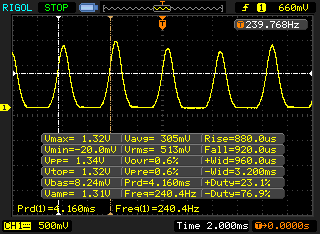 |
Displayens bakgrundsbelysning flimrar vid 240 Hz (i värsta fall, t.ex. med PWM) Flimrande upptäckt vid en ljusstyrkeinställning på 79 % och lägre. Det ska inte finnas något flimmer eller PWM över denna ljusstyrkeinställning. Frekvensen för 240 Hz är relativt låg, så känsliga användare kommer sannolikt att märka flimmer och uppleva ansträngda ögon vid den angivna ljusstyrkeinställningen och nedan. Som jämförelse: 52 % av alla testade enheter använder inte PWM för att dämpa skärmen. Om PWM upptäcktes mättes ett medelvärde av 7741 (minst: 5 - maximum: 343500) Hz. | |||
| Cinebench R15 | |
| CPU Single 64Bit | |
| Genomsnitt av klass Multimedia (184.8 - 326, n=58, senaste 2 åren) | |
| Asus ROG Zephyrus Duo 15 SE GX551QS | |
| Gigabyte Aero 15 OLED XB-8DE51B0SP | |
| Lenovo ThinkPad X1 Extreme Gen3-20TLS0UV00 | |
| Gigabyte Aero 15 OLED XC | |
| Genomsnitt Intel Core i7-10870H (196 - 204, n=11) | |
| MSI GS66 Stealth 10UG | |
| HP Envy 15-ep0098nr | |
| CPU Multi 64Bit | |
| Genomsnitt av klass Multimedia (856 - 5224, n=60, senaste 2 åren) | |
| Asus ROG Zephyrus Duo 15 SE GX551QS | |
| Gigabyte Aero 15 OLED XB-8DE51B0SP | |
| Gigabyte Aero 15 OLED XC | |
| MSI GS66 Stealth 10UG | |
| Genomsnitt Intel Core i7-10870H (1336 - 1740, n=14) | |
| HP Envy 15-ep0098nr | |
| Lenovo ThinkPad X1 Extreme Gen3-20TLS0UV00 | |
| Blender - v2.79 BMW27 CPU | |
| Lenovo ThinkPad X1 Extreme Gen3-20TLS0UV00 | |
| HP Envy 15-ep0098nr | |
| Gigabyte Aero 15 OLED XC | |
| Genomsnitt Intel Core i7-10870H (272 - 333, n=12) | |
| MSI GS66 Stealth 10UG | |
| Gigabyte Aero 15 OLED XB-8DE51B0SP | |
| Genomsnitt av klass Multimedia (100 - 557, n=57, senaste 2 åren) | |
| Asus ROG Zephyrus Duo 15 SE GX551QS | |
| 7-Zip 18.03 | |
| 7z b 4 -mmt1 | |
| Genomsnitt av klass Multimedia (3666 - 7545, n=55, senaste 2 åren) | |
| Asus ROG Zephyrus Duo 15 SE GX551QS | |
| Gigabyte Aero 15 OLED XB-8DE51B0SP | |
| Lenovo ThinkPad X1 Extreme Gen3-20TLS0UV00 | |
| MSI GS66 Stealth 10UG | |
| Gigabyte Aero 15 OLED XC | |
| Genomsnitt Intel Core i7-10870H (5145 - 5429, n=12) | |
| HP Envy 15-ep0098nr | |
| 7z b 4 | |
| Asus ROG Zephyrus Duo 15 SE GX551QS | |
| Genomsnitt av klass Multimedia (26062 - 130368, n=54, senaste 2 åren) | |
| Gigabyte Aero 15 OLED XB-8DE51B0SP | |
| Genomsnitt Intel Core i7-10870H (39581 - 46708, n=12) | |
| MSI GS66 Stealth 10UG | |
| Gigabyte Aero 15 OLED XC | |
| Lenovo ThinkPad X1 Extreme Gen3-20TLS0UV00 | |
| HP Envy 15-ep0098nr | |
| Cinebench R20 | |
| CPU (Single Core) | |
| Genomsnitt av klass Multimedia (425 - 853, n=56, senaste 2 åren) | |
| Asus ROG Zephyrus Duo 15 SE GX551QS | |
| Gigabyte Aero 15 OLED XB-8DE51B0SP | |
| Lenovo ThinkPad X1 Extreme Gen3-20TLS0UV00 | |
| Gigabyte Aero 15 OLED XC | |
| Genomsnitt Intel Core i7-10870H (460 - 484, n=12) | |
| MSI GS66 Stealth 10UG | |
| HP Envy 15-ep0098nr | |
| CPU (Multi Core) | |
| Genomsnitt av klass Multimedia (1887 - 12912, n=56, senaste 2 åren) | |
| Asus ROG Zephyrus Duo 15 SE GX551QS | |
| Gigabyte Aero 15 OLED XB-8DE51B0SP | |
| MSI GS66 Stealth 10UG | |
| Genomsnitt Intel Core i7-10870H (3027 - 4020, n=12) | |
| Gigabyte Aero 15 OLED XC | |
| HP Envy 15-ep0098nr | |
| Lenovo ThinkPad X1 Extreme Gen3-20TLS0UV00 | |
| Geekbench 5.5 | |
| Single-Core | |
| Genomsnitt av klass Multimedia (805 - 2974, n=55, senaste 2 åren) | |
| Asus ROG Zephyrus Duo 15 SE GX551QS | |
| Gigabyte Aero 15 OLED XB-8DE51B0SP | |
| Lenovo ThinkPad X1 Extreme Gen3-20TLS0UV00 | |
| Gigabyte Aero 15 OLED XC | |
| MSI GS66 Stealth 10UG | |
| HP Envy 15-ep0098nr | |
| Genomsnitt Intel Core i7-10870H (1191 - 1295, n=12) | |
| Multi-Core | |
| Genomsnitt av klass Multimedia (4652 - 20422, n=55, senaste 2 åren) | |
| Asus ROG Zephyrus Duo 15 SE GX551QS | |
| Gigabyte Aero 15 OLED XB-8DE51B0SP | |
| MSI GS66 Stealth 10UG | |
| Gigabyte Aero 15 OLED XC | |
| Genomsnitt Intel Core i7-10870H (6403 - 7882, n=12) | |
| HP Envy 15-ep0098nr | |
| Lenovo ThinkPad X1 Extreme Gen3-20TLS0UV00 | |
| HWBOT x265 Benchmark v2.2 - 4k Preset | |
| Genomsnitt av klass Multimedia (5.26 - 36.1, n=55, senaste 2 åren) | |
| Asus ROG Zephyrus Duo 15 SE GX551QS | |
| Gigabyte Aero 15 OLED XB-8DE51B0SP | |
| MSI GS66 Stealth 10UG | |
| Genomsnitt Intel Core i7-10870H (10.7 - 13.5, n=12) | |
| Gigabyte Aero 15 OLED XC | |
| HP Envy 15-ep0098nr | |
| Lenovo ThinkPad X1 Extreme Gen3-20TLS0UV00 | |
| LibreOffice - 20 Documents To PDF | |
| Gigabyte Aero 15 OLED XC | |
| Genomsnitt Intel Core i7-10870H (46 - 64.4, n=12) | |
| Gigabyte Aero 15 OLED XB-8DE51B0SP | |
| Genomsnitt av klass Multimedia (23.9 - 146.7, n=56, senaste 2 åren) | |
| Lenovo ThinkPad X1 Extreme Gen3-20TLS0UV00 | |
| MSI GS66 Stealth 10UG | |
| HP Envy 15-ep0098nr | |
| Asus ROG Zephyrus Duo 15 SE GX551QS | |
| R Benchmark 2.5 - Overall mean | |
| HP Envy 15-ep0098nr | |
| Lenovo ThinkPad X1 Extreme Gen3-20TLS0UV00 | |
| MSI GS66 Stealth 10UG | |
| Genomsnitt Intel Core i7-10870H (0.573 - 0.614, n=12) | |
| Gigabyte Aero 15 OLED XC | |
| Gigabyte Aero 15 OLED XB-8DE51B0SP | |
| Asus ROG Zephyrus Duo 15 SE GX551QS | |
| Genomsnitt av klass Multimedia (0.3604 - 0.947, n=55, senaste 2 åren) | |
* ... mindre är bättre
| PCMark 8 Home Score Accelerated v2 | 4246 poäng | |
| PCMark 8 Work Score Accelerated v2 | 4878 poäng | |
| PCMark 10 Score | 6442 poäng | |
Hjälp | ||
| DPC Latencies / LatencyMon - interrupt to process latency (max), Web, Youtube, Prime95 | |
| HP Envy 15-ep0098nr | |
| Gigabyte Aero 15 OLED XC | |
| Gigabyte Aero 15 OLED XB-8DE51B0SP | |
| Asus ROG Zephyrus Duo 15 SE GX551QS | |
| MSI GS66 Stealth 10UG | |
| Lenovo ThinkPad X1 Extreme Gen3-20TLS0UV00 | |
* ... mindre är bättre
| Gigabyte Aero 15 OLED XC WDC PC SN730 SDBPNTY-1T00 | Asus ROG Zephyrus Duo 15 SE GX551QS 2x Samsung PM981a MZVLB1T0HBLR (RAID 0) | MSI GS66 Stealth 10UG WDC PC SN730 SDBPNTY-1T00 | Lenovo ThinkPad X1 Extreme Gen3-20TLS0UV00 Toshiba XG6 KXG6AZNV1T02 | Gigabyte Aero 15 OLED XB-8DE51B0SP Intel Optane Memory H10 with Solid State Storage 32GB + 512GB HBRPEKNX0202A(L/H) | HP Envy 15-ep0098nr Intel Optane Memory H10 with Solid State Storage 32GB + 512GB HBRPEKNX0202A(L/H) | |
|---|---|---|---|---|---|---|
| CrystalDiskMark 5.2 / 6 | 54% | 5% | 5% | 6% | -10% | |
| Write 4K (MB/s) | 126 | 229.7 82% | 163.1 29% | 159.5 27% | 127.4 1% | 100.2 -20% |
| Read 4K (MB/s) | 44.94 | 47.13 5% | 48.97 9% | 53.1 18% | 147.5 228% | 112.8 151% |
| Write Seq (MB/s) | 2763 | 4455 61% | 2607 -6% | 1723 -38% | 485.9 -82% | 537 -81% |
| Read Seq (MB/s) | 1671 | 2933 76% | 2316 39% | 2164 30% | 1352 -19% | 1270 -24% |
| Write 4K Q32T1 (MB/s) | 451.6 | 597 32% | 338 -25% | 469.2 4% | 476.5 6% | 480.6 6% |
| Read 4K Q32T1 (MB/s) | 552 | 387 -30% | 475.6 -14% | 543 -2% | 531 -4% | 364.9 -34% |
| Write Seq Q32T1 (MB/s) | 3060 | 5623 84% | 3090 1% | 3055 0% | 1061 -65% | 1224 -60% |
| Read Seq Q32T1 (MB/s) | 3192 | 7042 121% | 3421 7% | 3296 3% | 2552 -20% | 2635 -17% |
| AS SSD | 7% | -7% | -5% | -30% | -57% | |
| Seq Read (MB/s) | 2331 | 3010 29% | 2198 -6% | 2553 10% | 1200 -49% | 1005 -57% |
| Seq Write (MB/s) | 2312 | 3116 35% | 2596 12% | 974 -58% | 836 -64% | 436.8 -81% |
| 4K Read (MB/s) | 39.13 | 49.58 27% | 43.81 12% | 49.69 27% | 65.8 68% | 51.5 32% |
| 4K Write (MB/s) | 98.1 | 185 89% | 115.5 18% | 139.5 42% | 103.8 6% | 88 -10% |
| 4K-64 Read (MB/s) | 1663 | 1401 -16% | 1692 2% | 1462 -12% | 789 -53% | 517 -69% |
| 4K-64 Write (MB/s) | 2138 | 1426 -33% | 2162 1% | 1474 -31% | 929 -57% | 839 -61% |
| Access Time Read * (ms) | 0.099 | 0.037 63% | 0.056 43% | 0.063 36% | 0.103 -4% | 0.088 11% |
| Access Time Write * (ms) | 0.038 | 0.061 -61% | 0.098 -158% | 0.031 18% | 0.045 -18% | 0.151 -297% |
| Score Read (Points) | 1935 | 1751 -10% | 1956 1% | 1767 -9% | 975 -50% | 669 -65% |
| Score Write (Points) | 2468 | 1923 -22% | 2537 3% | 1711 -31% | 1117 -55% | 970 -61% |
| Score Total (Points) | 5388 | 4580 -15% | 5513 2% | 4308 -20% | 2594 -52% | 1972 -63% |
| Copy ISO MB/s (MB/s) | 2903 | 3196 10% | 2236 -23% | 2094 -28% | 1173 -60% | |
| Copy Program MB/s (MB/s) | 686 | 710 3% | 690 1% | 657 -4% | 769 12% | |
| Copy Game MB/s (MB/s) | 1594 | 1669 5% | 1546 -3% | 1447 -9% | 1045 -34% | |
| Totalt genomsnitt (program/inställningar) | 31% /
24% | -1% /
-3% | 0% /
-1% | -12% /
-15% | -34% /
-40% |
* ... mindre är bättre

DiskSpd Read Loop, Queue Depth 8
| 3DMark 11 - 1280x720 Performance GPU | |
| Asus ROG Zephyrus Duo 15 SE GX551QS | |
| Genomsnitt NVIDIA GeForce RTX 3070 Laptop GPU (12535 - 38275, n=54) | |
| Gigabyte Aero 15 OLED XC | |
| MSI GS66 Stealth 10UG | |
| Gigabyte Aero 15 OLED XB-8DE51B0SP | |
| HP Envy 15-ep0098nr | |
| Genomsnitt av klass Multimedia (3749 - 60002, n=54, senaste 2 åren) | |
| Lenovo ThinkPad X1 Extreme Gen3-20TLS0UV00 | |
| 3DMark | |
| 1280x720 Cloud Gate Standard Graphics | |
| MSI GS66 Stealth 10UG | |
| Genomsnitt NVIDIA GeForce RTX 3070 Laptop GPU (45531 - 179716, n=33) | |
| Gigabyte Aero 15 OLED XB-8DE51B0SP | |
| Asus ROG Zephyrus Duo 15 SE GX551QS | |
| Gigabyte Aero 15 OLED XC | |
| Genomsnitt av klass Multimedia (16765 - 143501, n=32, senaste 2 åren) | |
| HP Envy 15-ep0098nr | |
| 1920x1080 Fire Strike Graphics | |
| Asus ROG Zephyrus Duo 15 SE GX551QS | |
| Genomsnitt NVIDIA GeForce RTX 3070 Laptop GPU (7178 - 29128, n=52) | |
| MSI GS66 Stealth 10UG | |
| Gigabyte Aero 15 OLED XC | |
| Gigabyte Aero 15 OLED XB-8DE51B0SP | |
| HP Envy 15-ep0098nr | |
| Genomsnitt av klass Multimedia (2328 - 48907, n=57, senaste 2 åren) | |
| Lenovo ThinkPad X1 Extreme Gen3-20TLS0UV00 | |
| 2560x1440 Time Spy Graphics | |
| Asus ROG Zephyrus Duo 15 SE GX551QS | |
| Gigabyte Aero 15 OLED XC | |
| Genomsnitt NVIDIA GeForce RTX 3070 Laptop GPU (2644 - 11019, n=53) | |
| MSI GS66 Stealth 10UG | |
| Gigabyte Aero 15 OLED XB-8DE51B0SP | |
| HP Envy 15-ep0098nr | |
| Genomsnitt av klass Multimedia (696 - 19403, n=57, senaste 2 åren) | |
| Lenovo ThinkPad X1 Extreme Gen3-20TLS0UV00 | |
| 3DMark 11 Performance | 25475 poäng | |
| 3DMark Cloud Gate Standard Score | 37238 poäng | |
| 3DMark Fire Strike Score | 19995 poäng | |
| 3DMark Time Spy Score | 9243 poäng | |
Hjälp | ||
| The Witcher 3 | |
| 1920x1080 High Graphics & Postprocessing (Nvidia HairWorks Off) | |
| Asus ROG Zephyrus Duo 15 SE GX551QS | |
| Gigabyte Aero 15 OLED XC | |
| Genomsnitt NVIDIA GeForce RTX 3070 Laptop GPU (122.1 - 207, n=34) | |
| MSI GS66 Stealth 10UG | |
| Gigabyte Aero 15 OLED XB-8DE51B0SP | |
| HP Envy 15-ep0098nr | |
| Genomsnitt av klass Multimedia (22 - 157, n=5, senaste 2 åren) | |
| Lenovo ThinkPad X1 Extreme Gen3-20TLS0UV00 | |
| 1920x1080 Ultra Graphics & Postprocessing (HBAO+) | |
| Asus ROG Zephyrus Duo 15 SE GX551QS | |
| Gigabyte Aero 15 OLED XC | |
| Genomsnitt NVIDIA GeForce RTX 3070 Laptop GPU (34.9 - 109, n=52) | |
| MSI GS66 Stealth 10UG | |
| Gigabyte Aero 15 OLED XB-8DE51B0SP | |
| HP Envy 15-ep0098nr | |
| Genomsnitt av klass Multimedia (11 - 107, n=5, senaste 2 åren) | |
| Lenovo ThinkPad X1 Extreme Gen3-20TLS0UV00 | |
| låg | med. | hög | ultra | QHD | 4K | |
|---|---|---|---|---|---|---|
| GTA V (2015) | 179 | 172 | 153 | 90.6 | 76.1 | |
| The Witcher 3 (2015) | 335 | 243 | 168 | 92.1 | 62.9 | |
| Dota 2 Reborn (2015) | 151 | 132 | 124 | 117 | 98.8 | |
| Final Fantasy XV Benchmark (2018) | 150 | 112 | 87.6 | 65.7 | 40.9 | |
| X-Plane 11.11 (2018) | 108 | 96.3 | 80.7 | 60.4 | ||
| Far Cry 5 (2018) | 50 | |||||
| Strange Brigade (2018) | 375 | 224 | 183 | 161 | 72 |
Ljudnivå
| Låg belastning |
| 29 / 31 / 33 dB(A) |
| Hög belastning |
| 43 / 51 dB(A) |
 | ||
30 dB tyst 40 dB(A) hörbar 50 dB(A) högt ljud |
||
min: | ||
(-) Den maximala temperaturen på ovansidan är 49 °C / 120 F, jämfört med genomsnittet av 36.8 °C / 98 F , allt från 21 till 71 °C för klassen Multimedia.
(-) Botten värms upp till maximalt 57 °C / 135 F, jämfört med genomsnittet av 39.1 °C / 102 F
(+) Vid tomgångsbruk är medeltemperaturen för ovansidan 25.6 °C / 78 F, jämfört med enhetsgenomsnittet på 31.3 °C / ### class_avg_f### F.
(-) När du spelar The Witcher 3 är medeltemperaturen för ovansidan 41.1 °C / 106 F, jämfört med enhetsgenomsnittet på 31.3 °C / ## #class_avg_f### F.
(±) Handledsstöden och pekplattan kan bli väldigt varma vid beröring med maximalt 37 °C / 98.6 F.
(-) Medeltemperaturen för handledsstödsområdet på liknande enheter var 28.7 °C / 83.7 F (-8.3 °C / -14.9 F).
Gigabyte Aero 15 OLED XC ljudanalys
(+) | högtalare kan spela relativt högt (84 dB)
Bas 100 - 315 Hz
(-) | nästan ingen bas - i genomsnitt 23.4% lägre än medianen
(±) | linjäriteten för basen är genomsnittlig (10.2% delta till föregående frekvens)
Mellan 400 - 2000 Hz
(±) | högre mellan - i genomsnitt 5.1% högre än median
(+) | mids är linjära (4.3% delta till föregående frekvens)
Högsta 2 - 16 kHz
(+) | balanserade toppar - endast 2.9% från medianen
(±) | linjäriteten för toppar är genomsnittlig (7.2% delta till föregående frekvens)
Totalt 100 - 16 000 Hz
(±) | linjäriteten för det totala ljudet är genomsnittlig (17.6% skillnad mot median)
Jämfört med samma klass
» 50% av alla testade enheter i den här klassen var bättre, 7% liknande, 43% sämre
» Den bästa hade ett delta på 5%, genomsnittet var 17%, sämst var 45%
Jämfört med alla testade enheter
» 35% av alla testade enheter var bättre, 8% liknande, 57% sämre
» Den bästa hade ett delta på 4%, genomsnittet var 23%, sämst var 134%
Lenovo ThinkPad X1 Extreme Gen3-20TLS0UV00 ljudanalys
(±) | högtalarljudstyrkan är genomsnittlig men bra (77.2 dB)
Bas 100 - 315 Hz
(±) | reducerad bas - i genomsnitt 9.1% lägre än medianen
(±) | linjäriteten för basen är genomsnittlig (11.6% delta till föregående frekvens)
Mellan 400 - 2000 Hz
(±) | högre mellan - i genomsnitt 7.2% högre än median
(+) | mids är linjära (5.4% delta till föregående frekvens)
Högsta 2 - 16 kHz
(+) | balanserade toppar - endast 3.9% från medianen
(+) | toppar är linjära (5.7% delta till föregående frekvens)
Totalt 100 - 16 000 Hz
(±) | linjäriteten för det totala ljudet är genomsnittlig (19.7% skillnad mot median)
Jämfört med samma klass
» 65% av alla testade enheter i den här klassen var bättre, 6% liknande, 29% sämre
» Den bästa hade ett delta på 5%, genomsnittet var 17%, sämst var 45%
Jämfört med alla testade enheter
» 50% av alla testade enheter var bättre, 7% liknande, 43% sämre
» Den bästa hade ett delta på 4%, genomsnittet var 23%, sämst var 134%
| Av/Standby | |
| Låg belastning | |
| Hög belastning |
|
Förklaring:
min: | |
| Gigabyte Aero 15 OLED XC i7-10870H, GeForce RTX 3070 Laptop GPU | Asus ROG Zephyrus Duo 15 SE GX551QS R9 5900HX, GeForce RTX 3080 Laptop GPU | MSI GS66 Stealth 10UG i7-10870H, GeForce RTX 3070 Laptop GPU | Lenovo ThinkPad X1 Extreme Gen3-20TLS0UV00 i7-10750H, GeForce GTX 1650 Ti Max-Q | Gigabyte Aero 15 OLED XB-8DE51B0SP i7-10875H, GeForce RTX 2070 Super Max-Q | HP Envy 15-ep0098nr i7-10750H, GeForce RTX 2060 Max-Q | Genomsnitt av klass Multimedia | |
|---|---|---|---|---|---|---|---|
| Power Consumption | -26% | -4% | 39% | -27% | 12% | 44% | |
| Idle Minimum * (Watt) | 11 | 16.3 -48% | 12.9 -17% | 5 55% | 18 -64% | 9.2 16% | 5.62 ? 49% |
| Idle Average * (Watt) | 14 | 22.5 -61% | 15.4 -10% | 9 36% | 21 -50% | 14.5 -4% | 10.2 ? 27% |
| Idle Maximum * (Watt) | 34 | 39.9 -17% | 27.1 20% | 12.2 64% | 38 -12% | 18 47% | 12.5 ? 63% |
| Load Average * (Watt) | 95 | 116.1 -22% | 98.2 -3% | 94.4 1% | 113 -19% | 110.9 -17% | 65 ? 32% |
| Witcher 3 ultra * (Watt) | 152 | 181.2 -19% | 164.9 -8% | 89 41% | 149 2% | 125.5 17% | |
| Load Maximum * (Watt) | 216 | 196.7 9% | 232.9 -8% | 133.9 38% | 256 -19% | 194.6 10% | 111.9 ? 48% |
* ... mindre är bättre
| Gigabyte Aero 15 OLED XC i7-10870H, GeForce RTX 3070 Laptop GPU, 99 Wh | Asus ROG Zephyrus Duo 15 SE GX551QS R9 5900HX, GeForce RTX 3080 Laptop GPU, 90 Wh | MSI GS66 Stealth 10UG i7-10870H, GeForce RTX 3070 Laptop GPU, 99.9 Wh | Lenovo ThinkPad X1 Extreme Gen3-20TLS0UV00 i7-10750H, GeForce GTX 1650 Ti Max-Q, 80 Wh | Gigabyte Aero 15 OLED XB-8DE51B0SP i7-10875H, GeForce RTX 2070 Super Max-Q, 94.2 Wh | HP Envy 15-ep0098nr i7-10750H, GeForce RTX 2060 Max-Q, 83 Wh | Genomsnitt av klass Multimedia | |
|---|---|---|---|---|---|---|---|
| Batteridrifttid | -43% | -15% | 29% | -14% | -32% | 56% | |
| H.264 (h) | 7.1 | 12.2 72% | 16.8 ? 137% | ||||
| WiFi v1.3 (h) | 6.7 | 5.3 -21% | 7.1 6% | 11.6 73% | 6.1 -9% | 6 -10% | 12.3 ? 84% |
| Load (h) | 3.4 | 1.2 -65% | 2.2 -35% | 1.4 -59% | 2.8 -18% | 1.6 -53% | 1.645 ? -52% |
| Reader / Idle (h) | 6.8 | 10.8 | 8.6 | 15 | 24.9 ? |
För
Emot
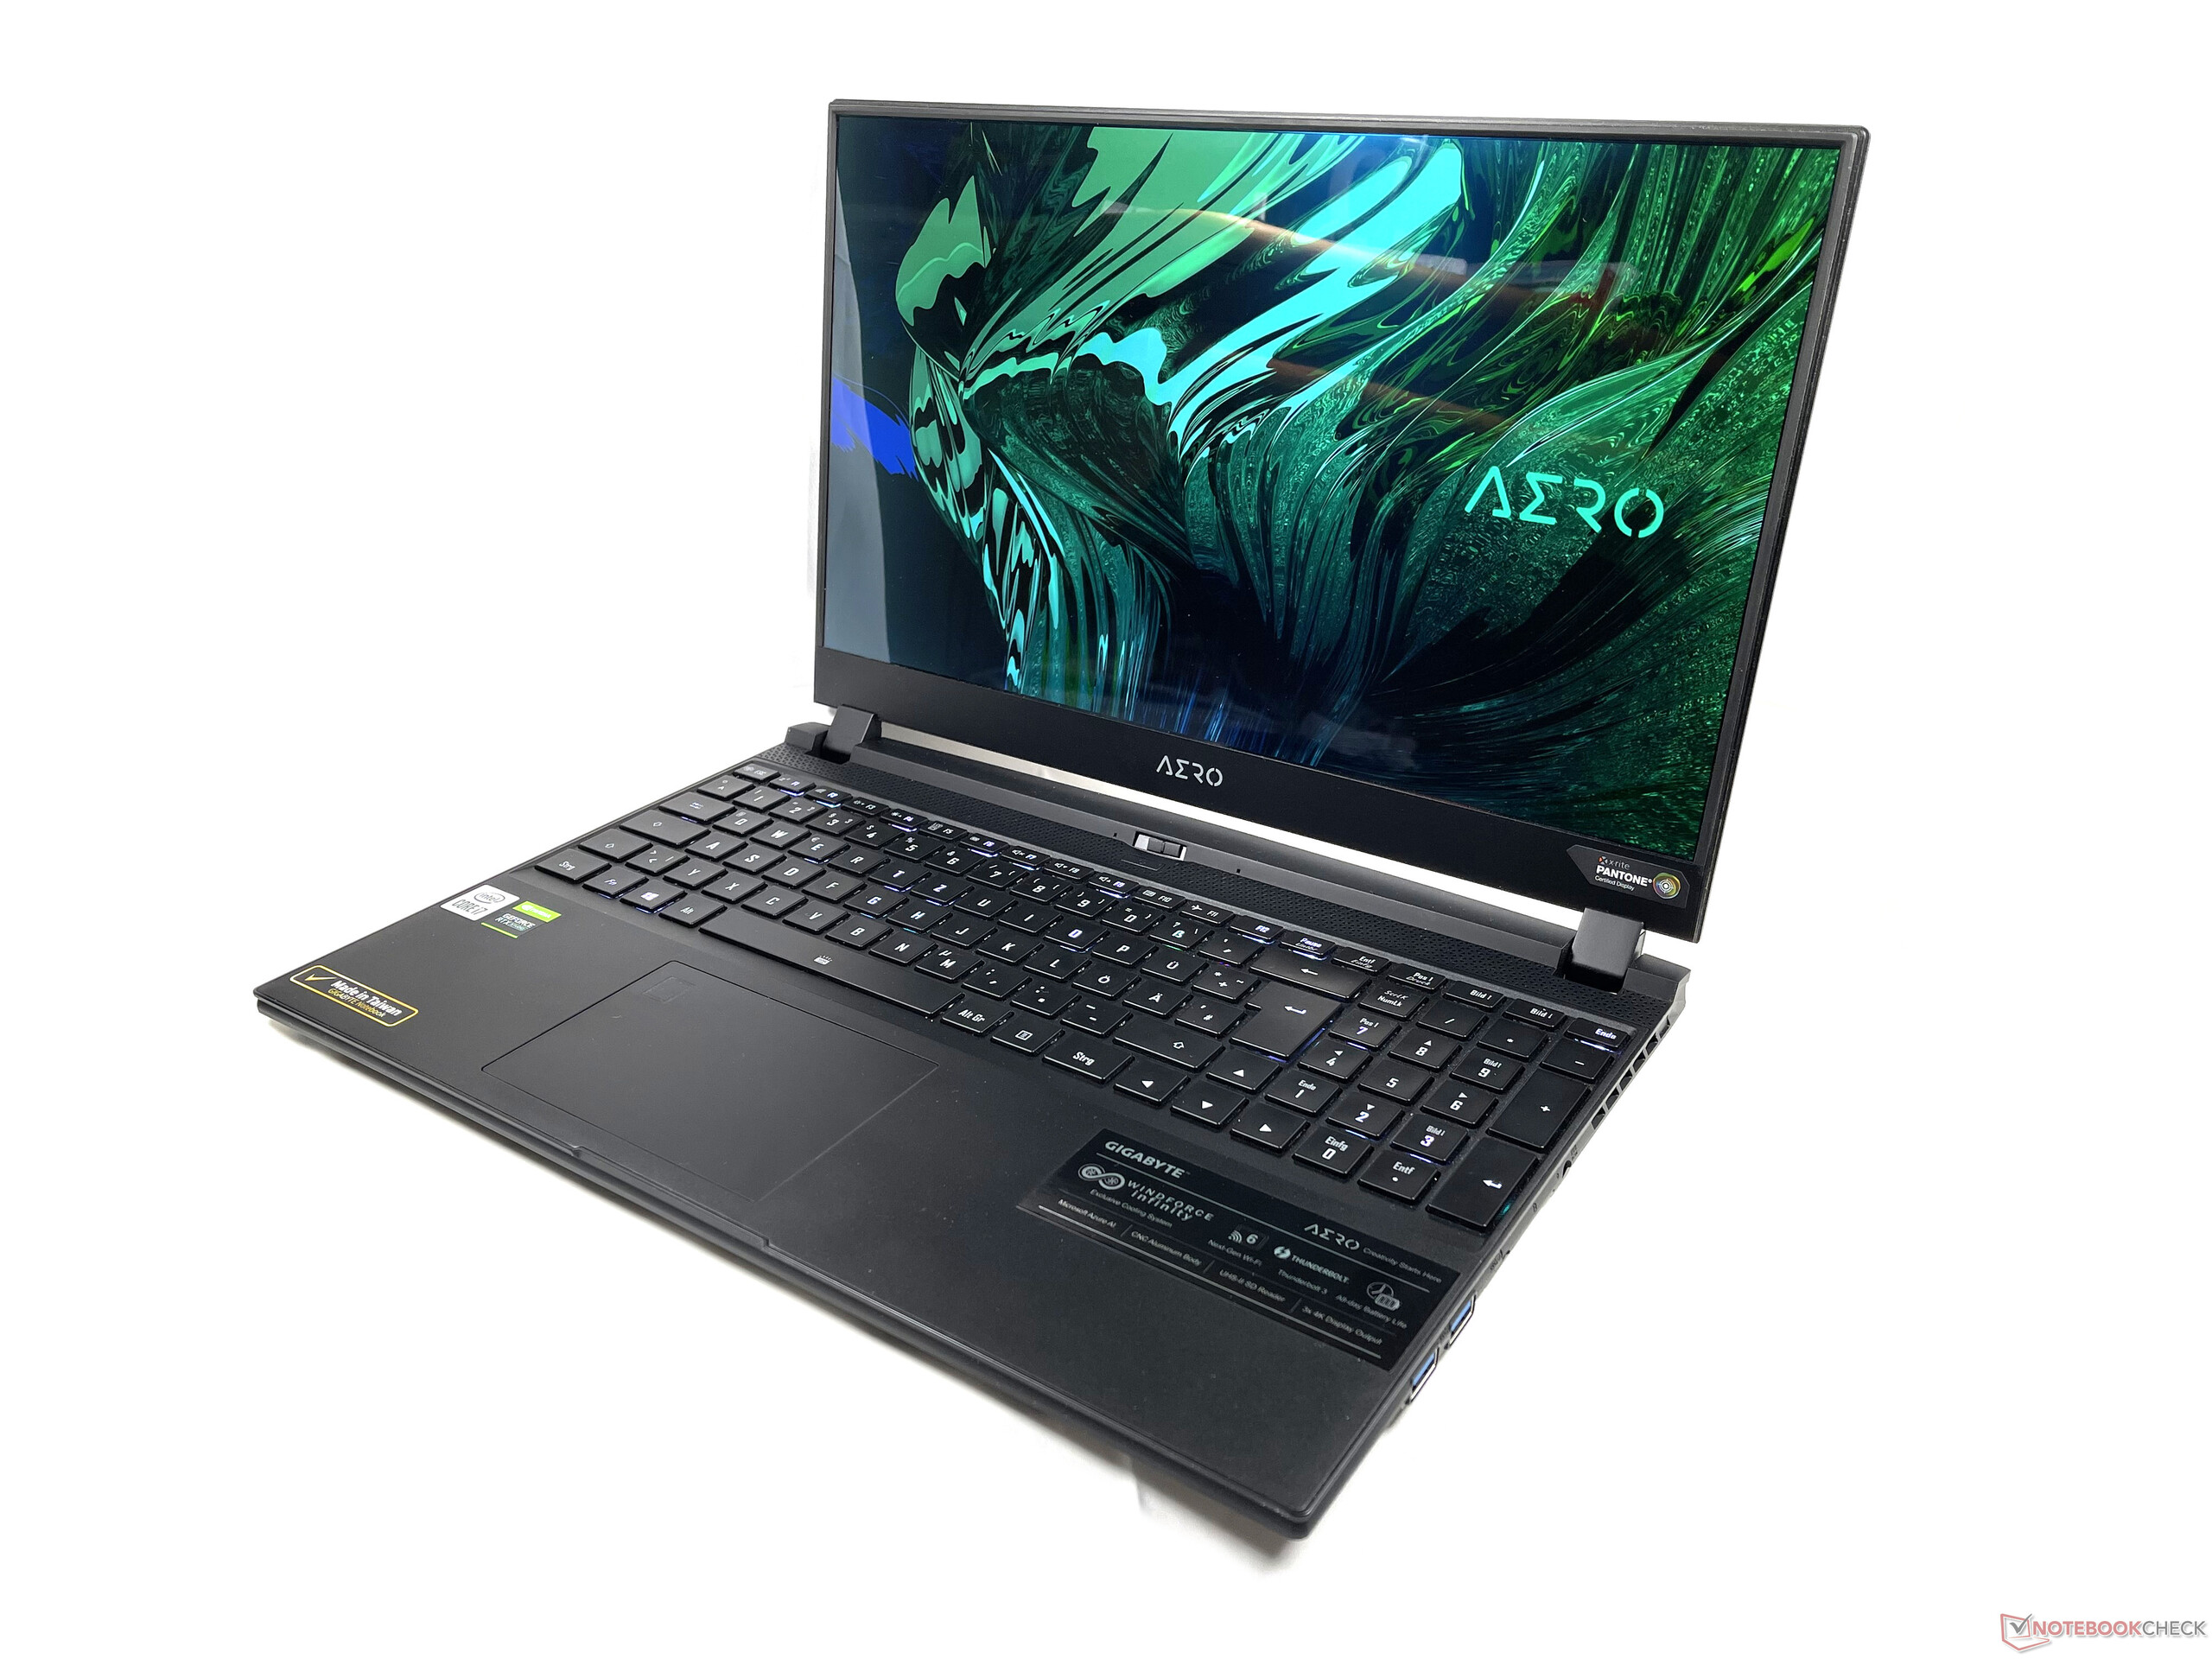
Omdöme - Gedigen laptop med Thunderbolt, OLED och RTX 3070
Läs den fullständiga versionen av den här recensionen på engelska här.
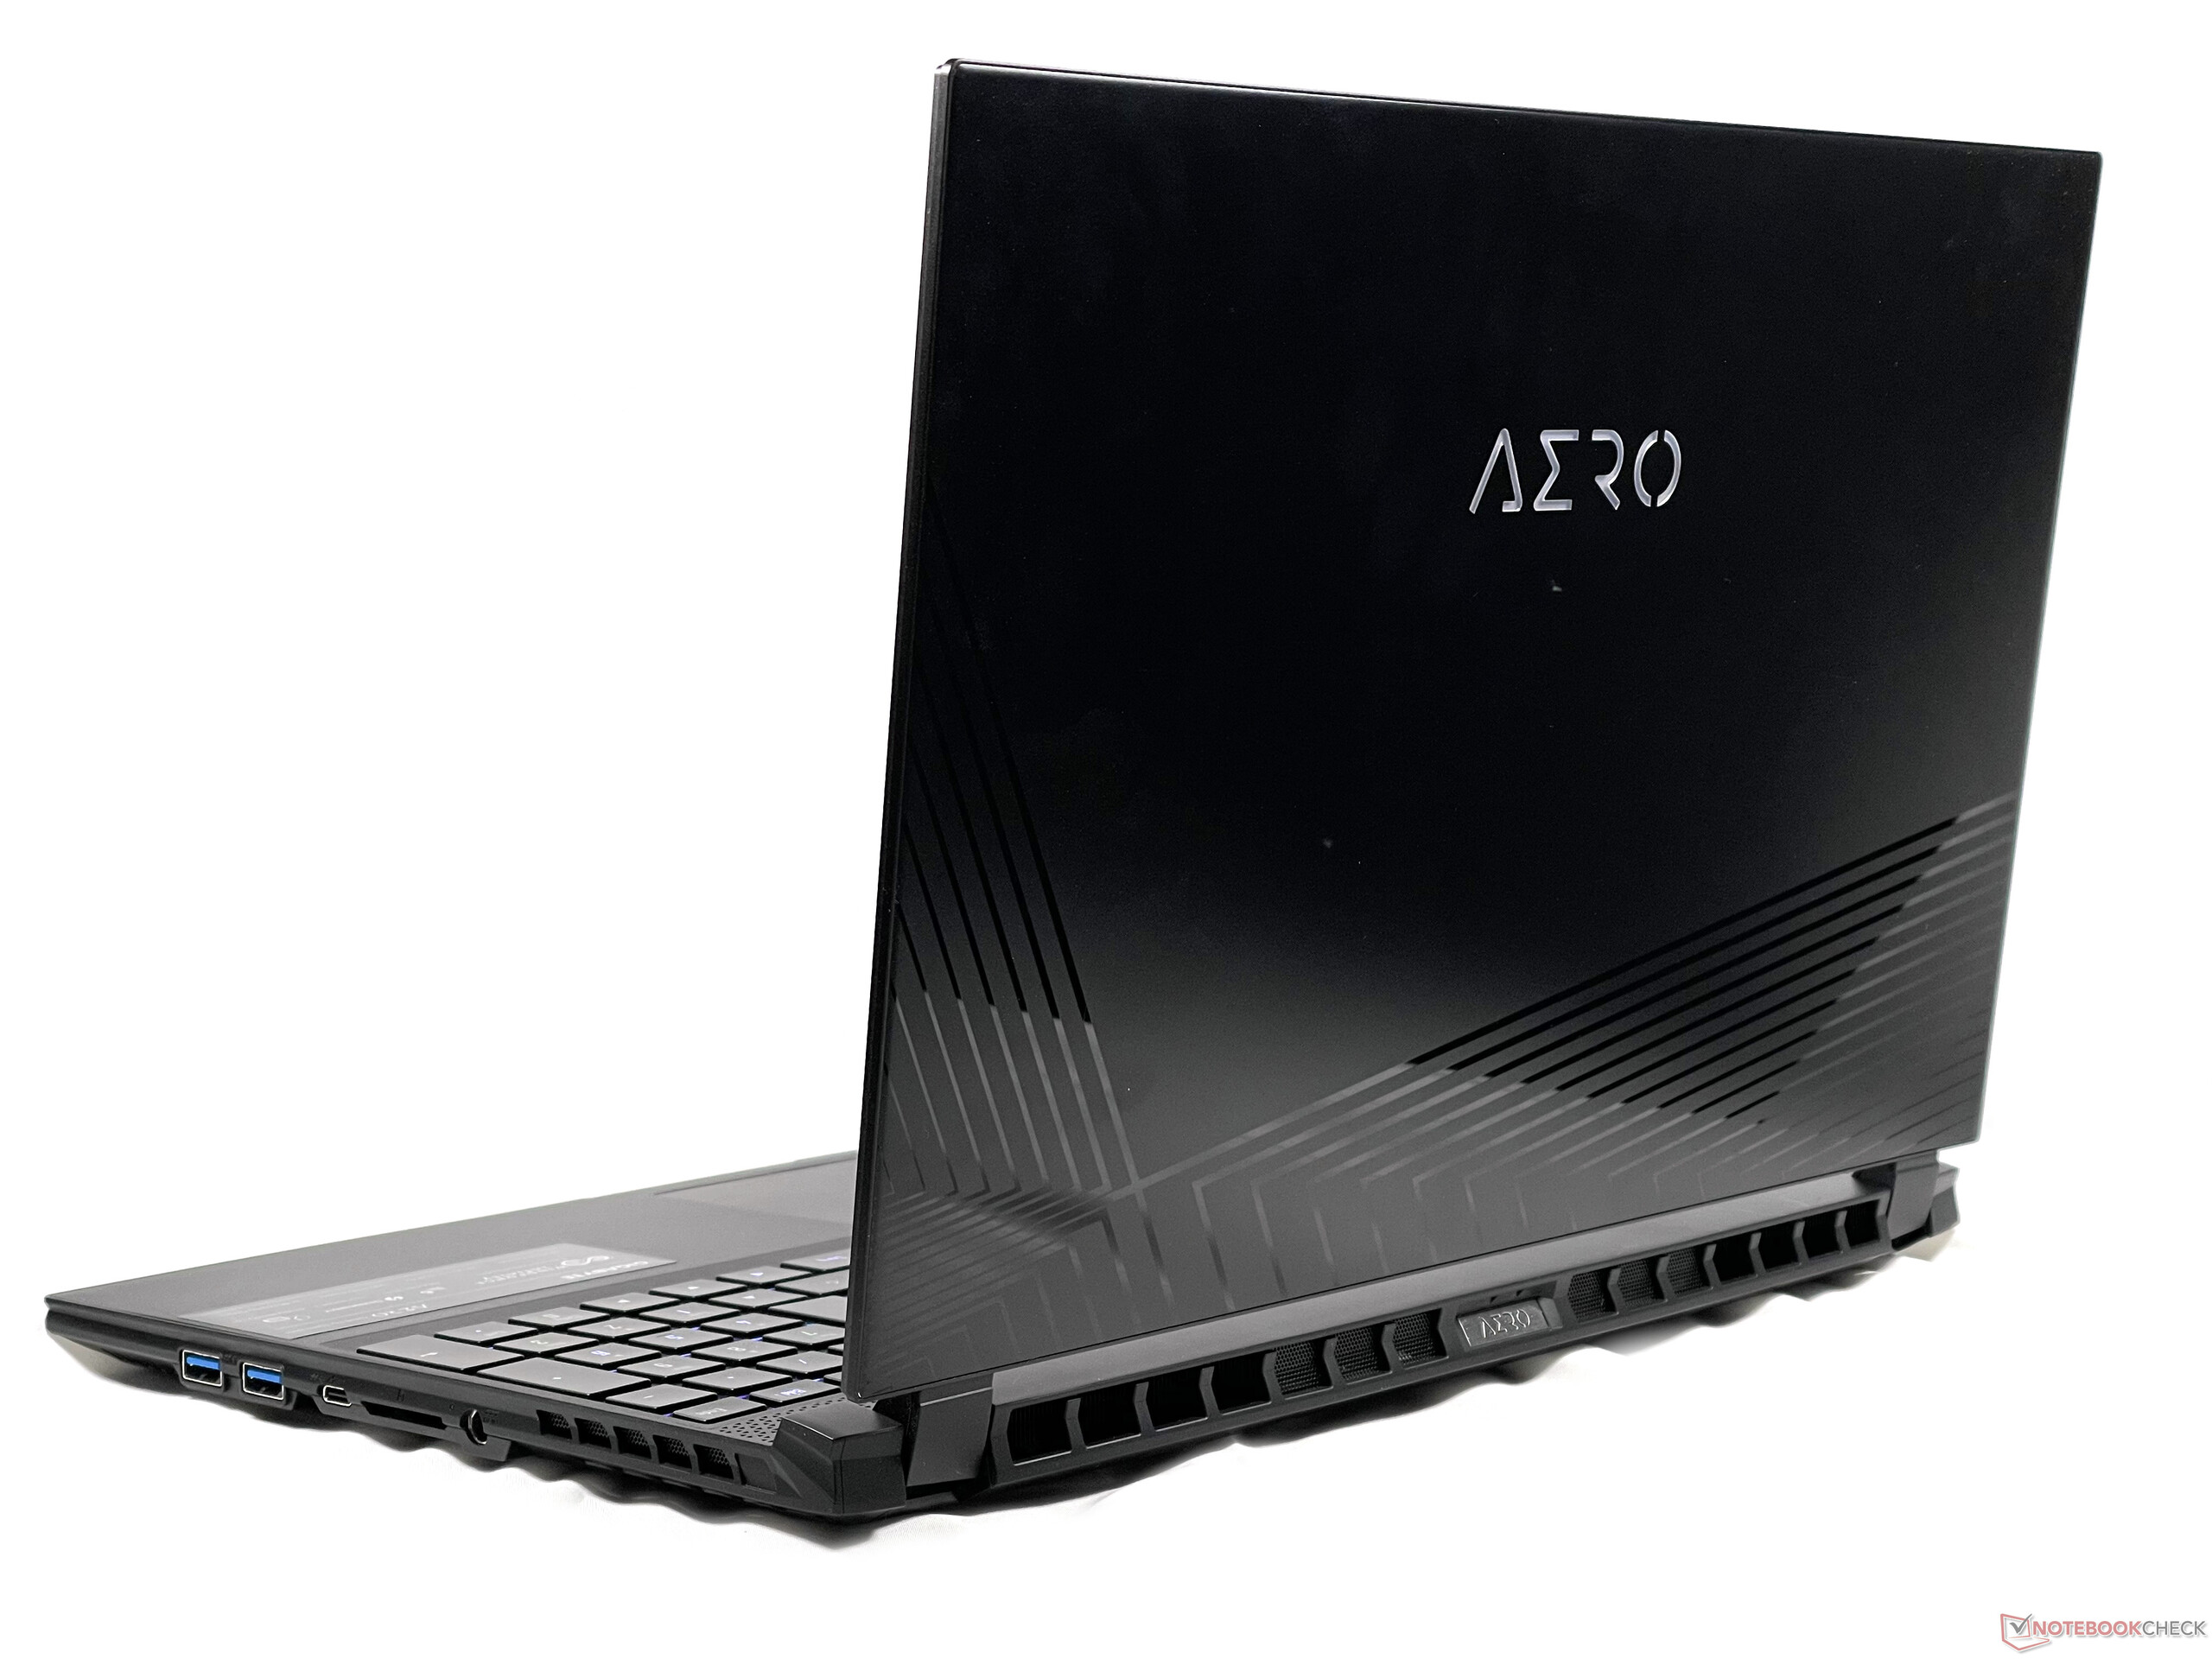
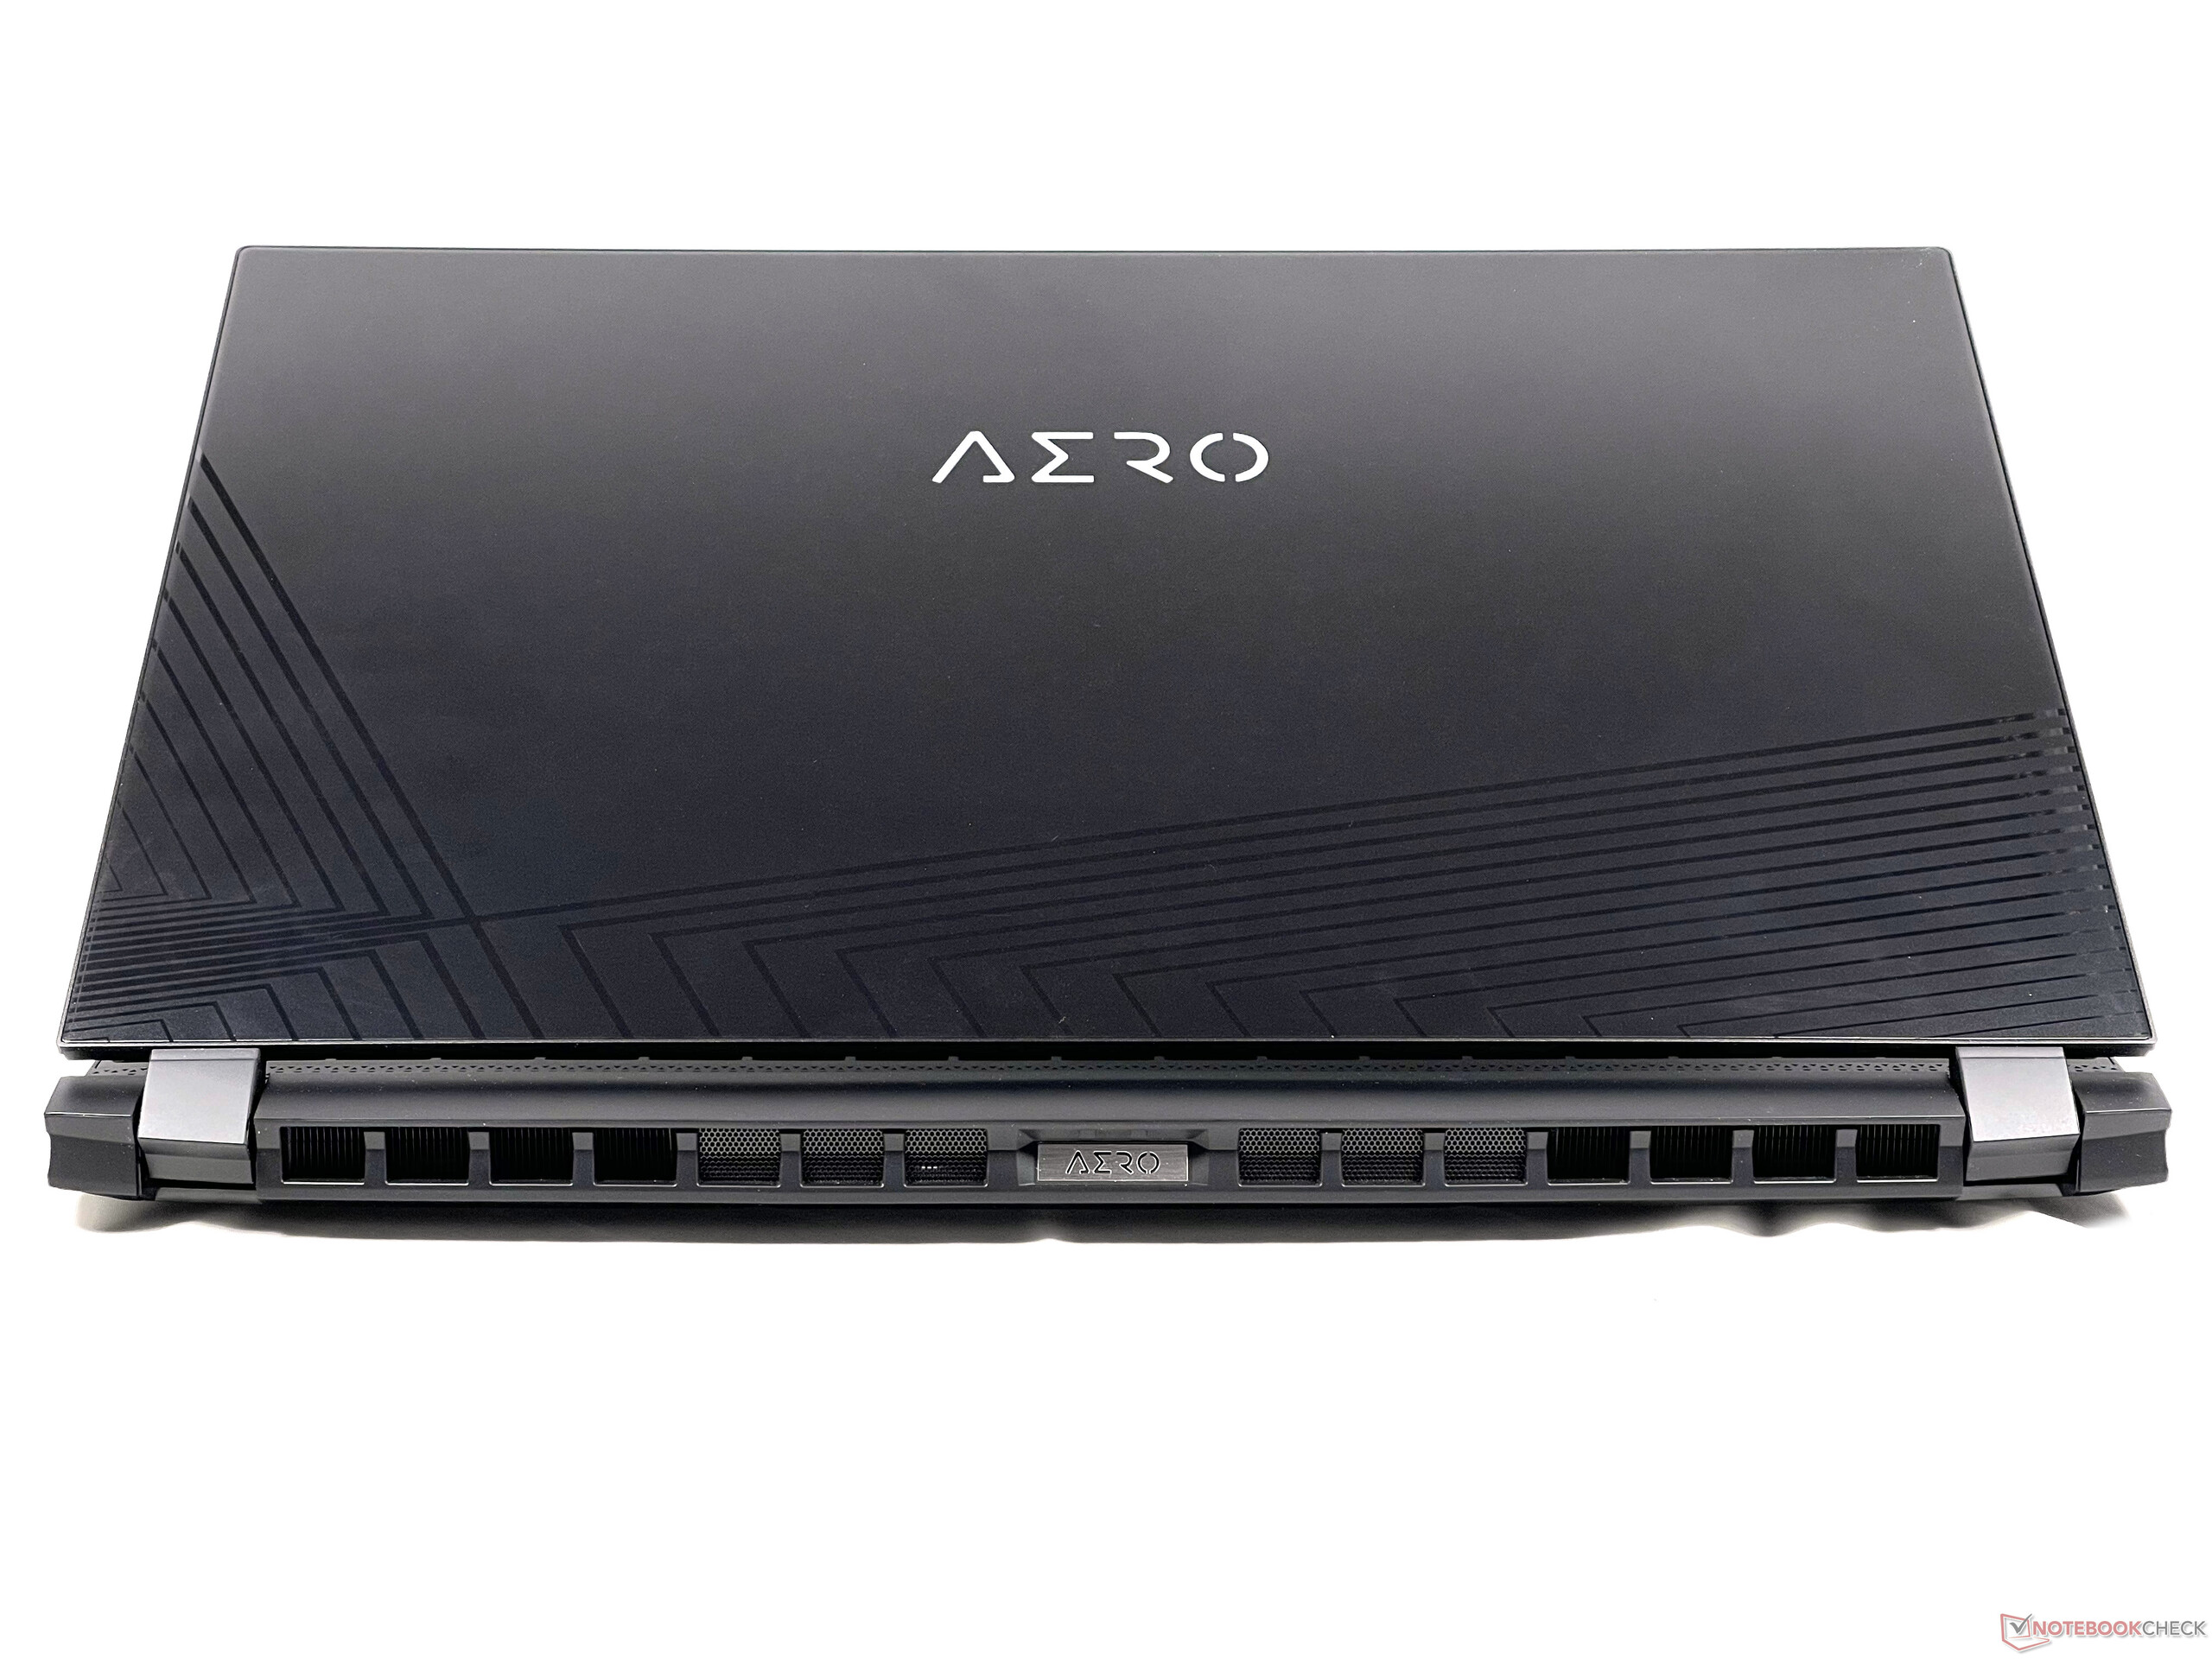
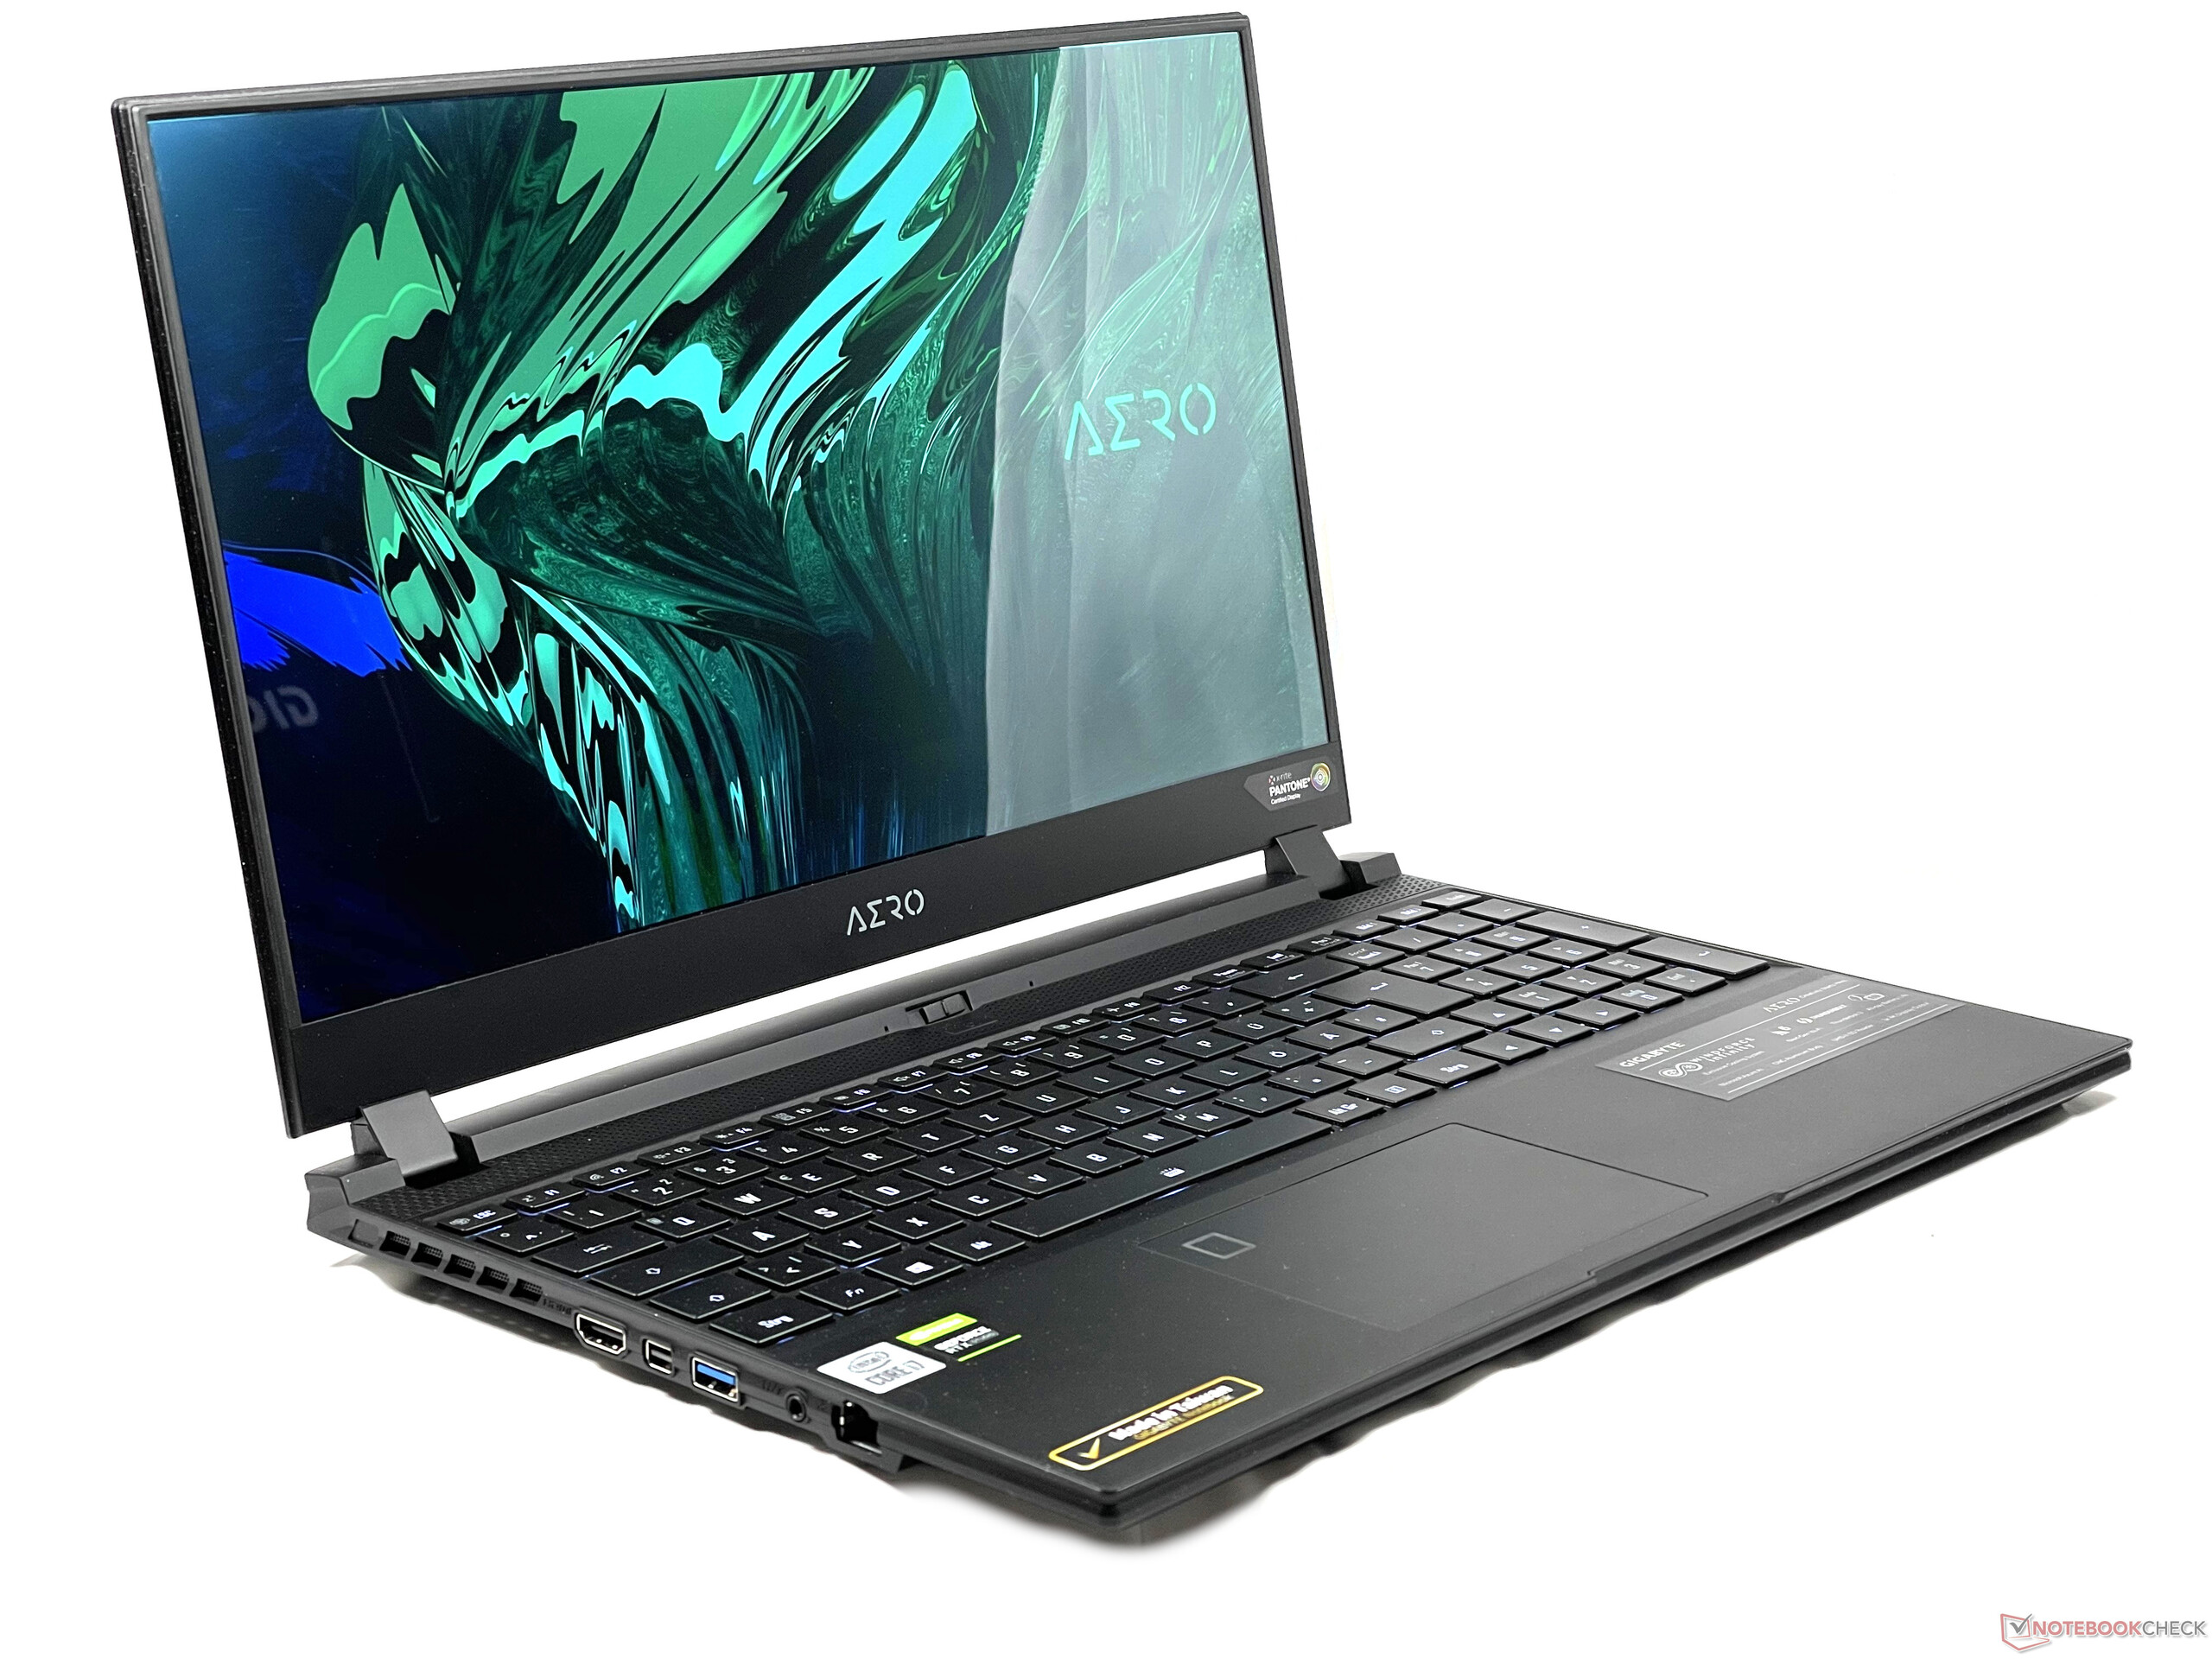
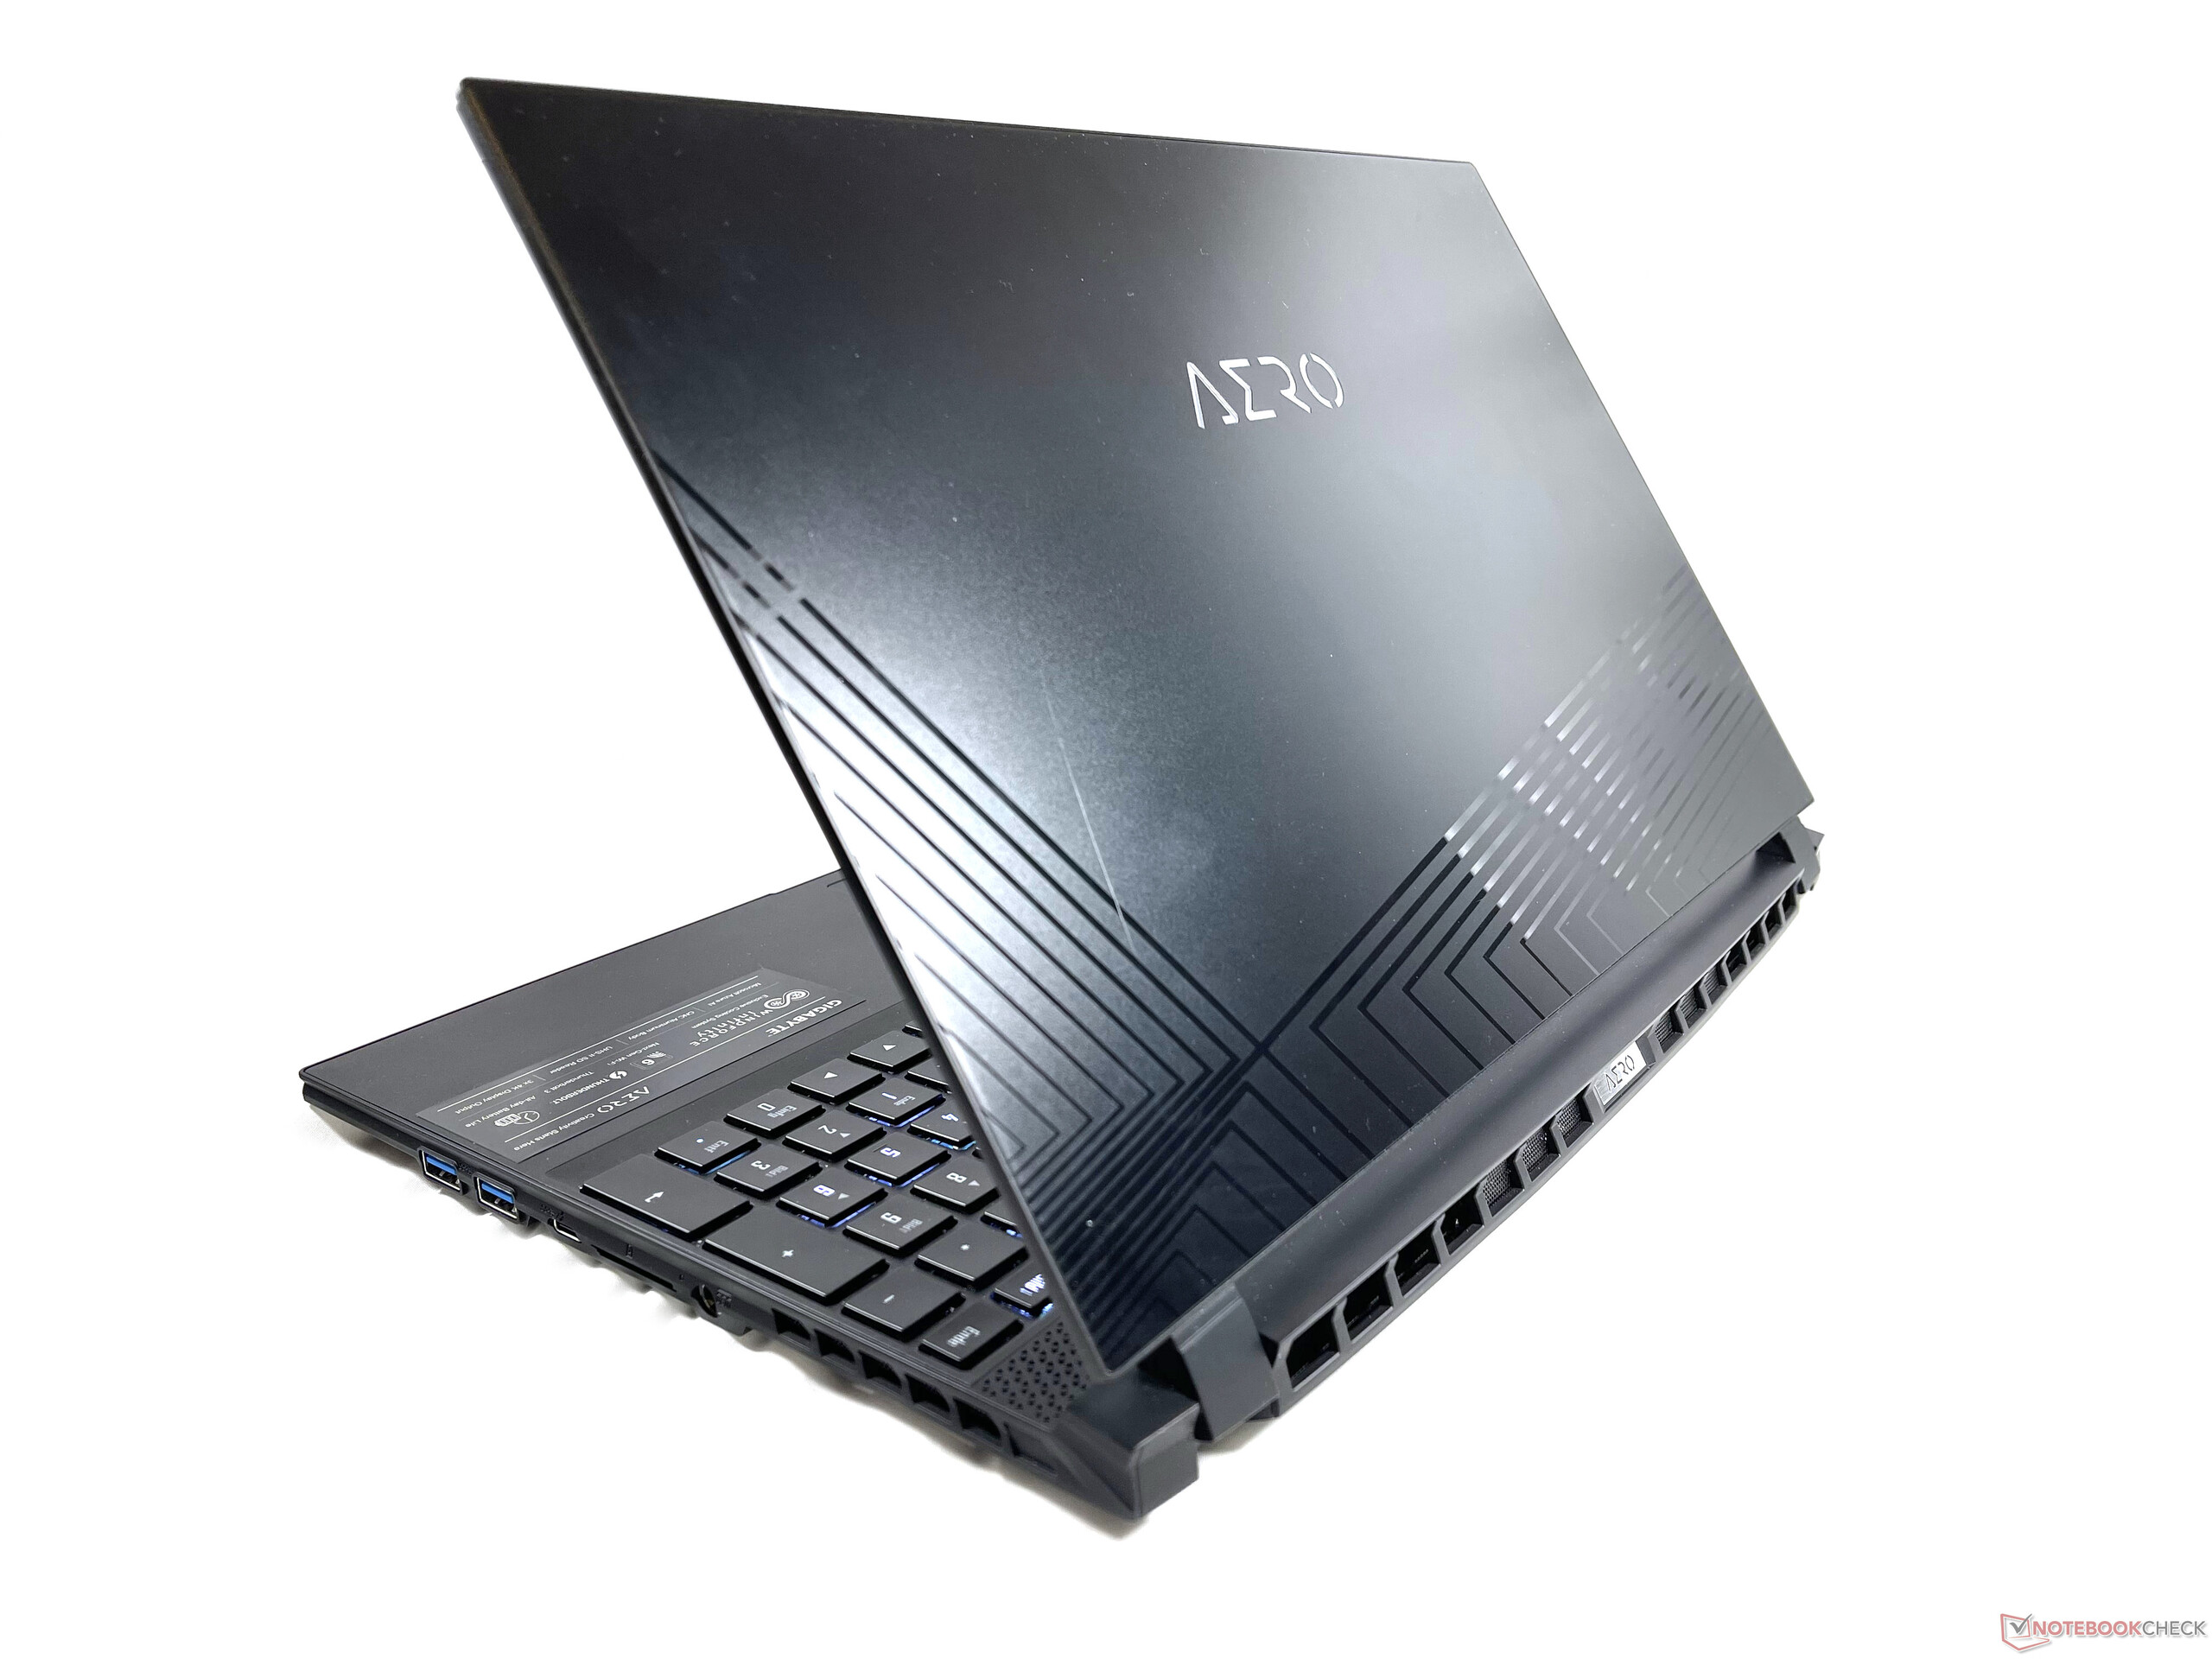
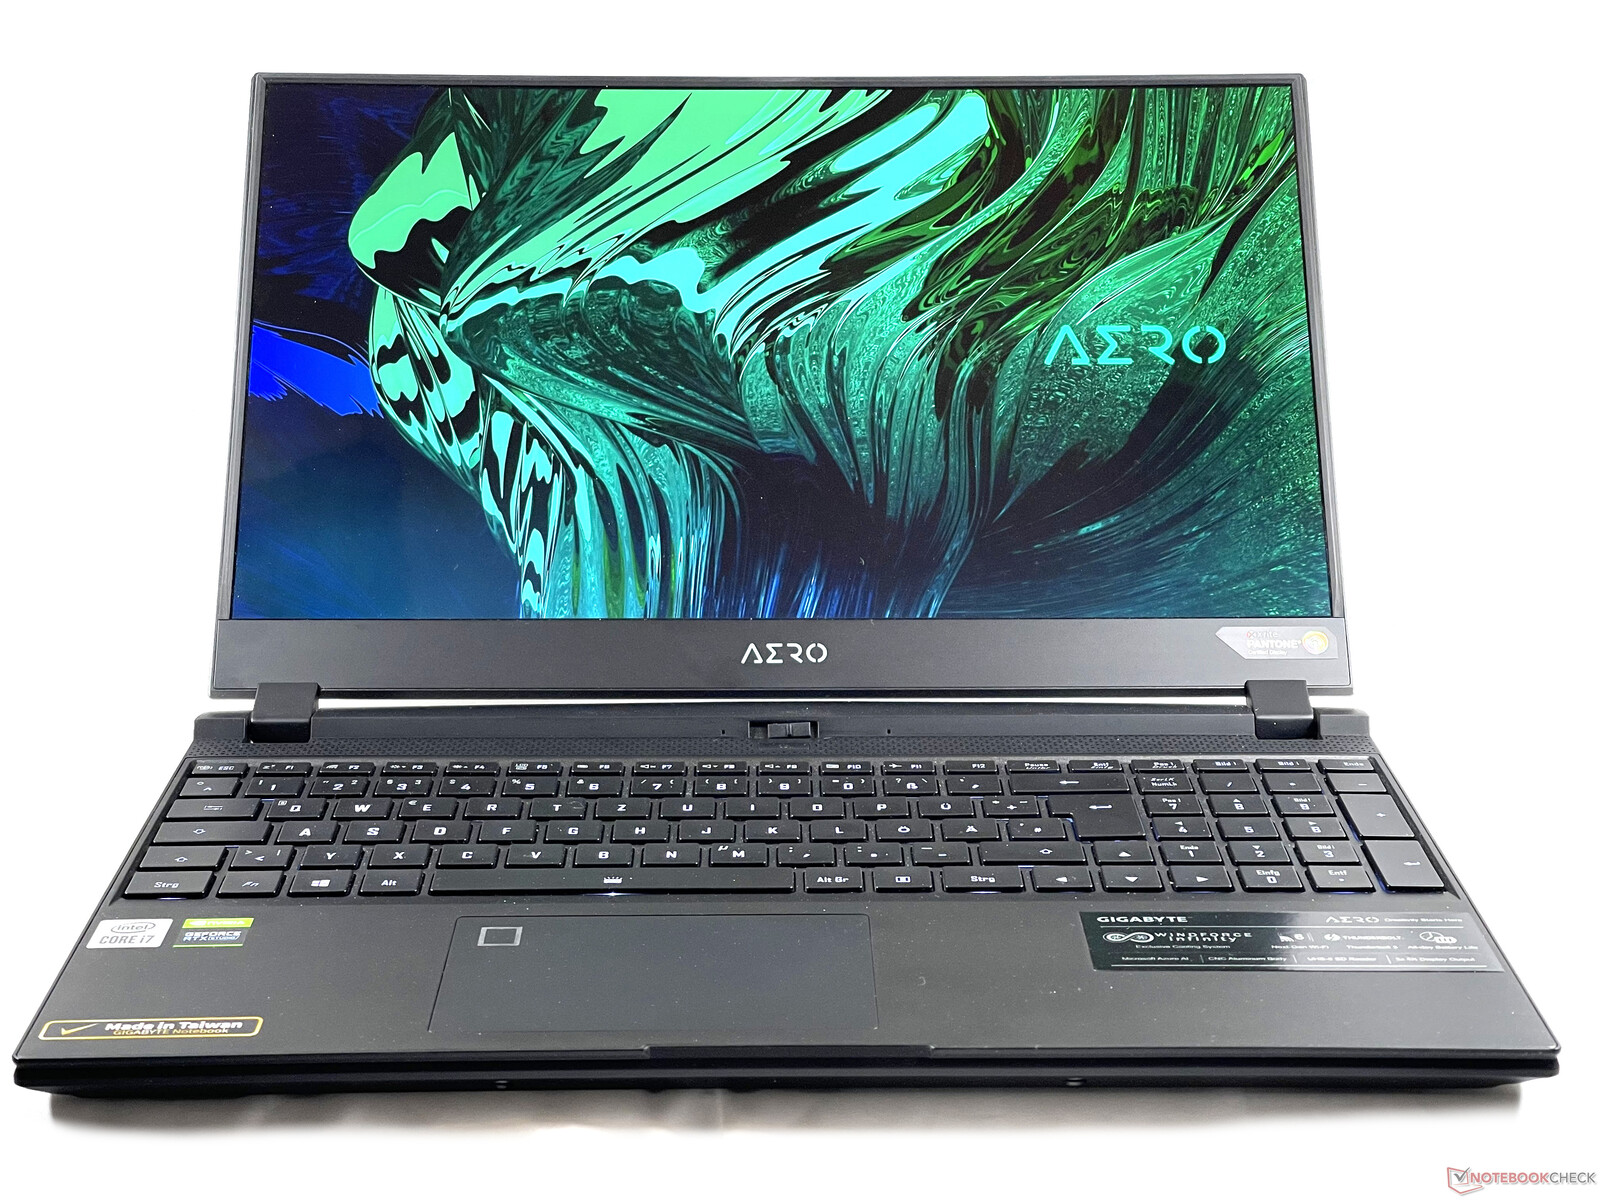
Aero 15 OLED XC ger ett utmärkt första intryck. Höljet ser robust ut, har en högkvalitativ konstruktion och klarar sig utan flashiga designelement eller LED-belysning. Med tanke på den installerade hårdvaran är den kompakt och relativt lätt. En Nvidia GPU på 105 Watt ger enormt mycket prestanda, vilket många som köper den här datorn nog inte ens kommer använda fullt ut. Men kraften finns där om den skulle behövas och kan få den ljusstarka och imponerande 4K OLED-skärmen att skina i all sin prakt. Men vi kan bara hoppas att den höga värmeutvecklingen i kombination med de slöa fläktarna inte kommer att påverka datorns livslängd negativt.
Det är bättre du tittar på film än att skriva text på Gigabyte Aero 15:s utmärkta OLED-skärm.
En av datorns större svagheter är det ganska svampiga tangentbordet, som gör det omständigt att skriva längre texter. En relativt liten styrplatta kan vi däremot stå ut med, särskilt med tanke på att de inbyggda knapparna övertygar.
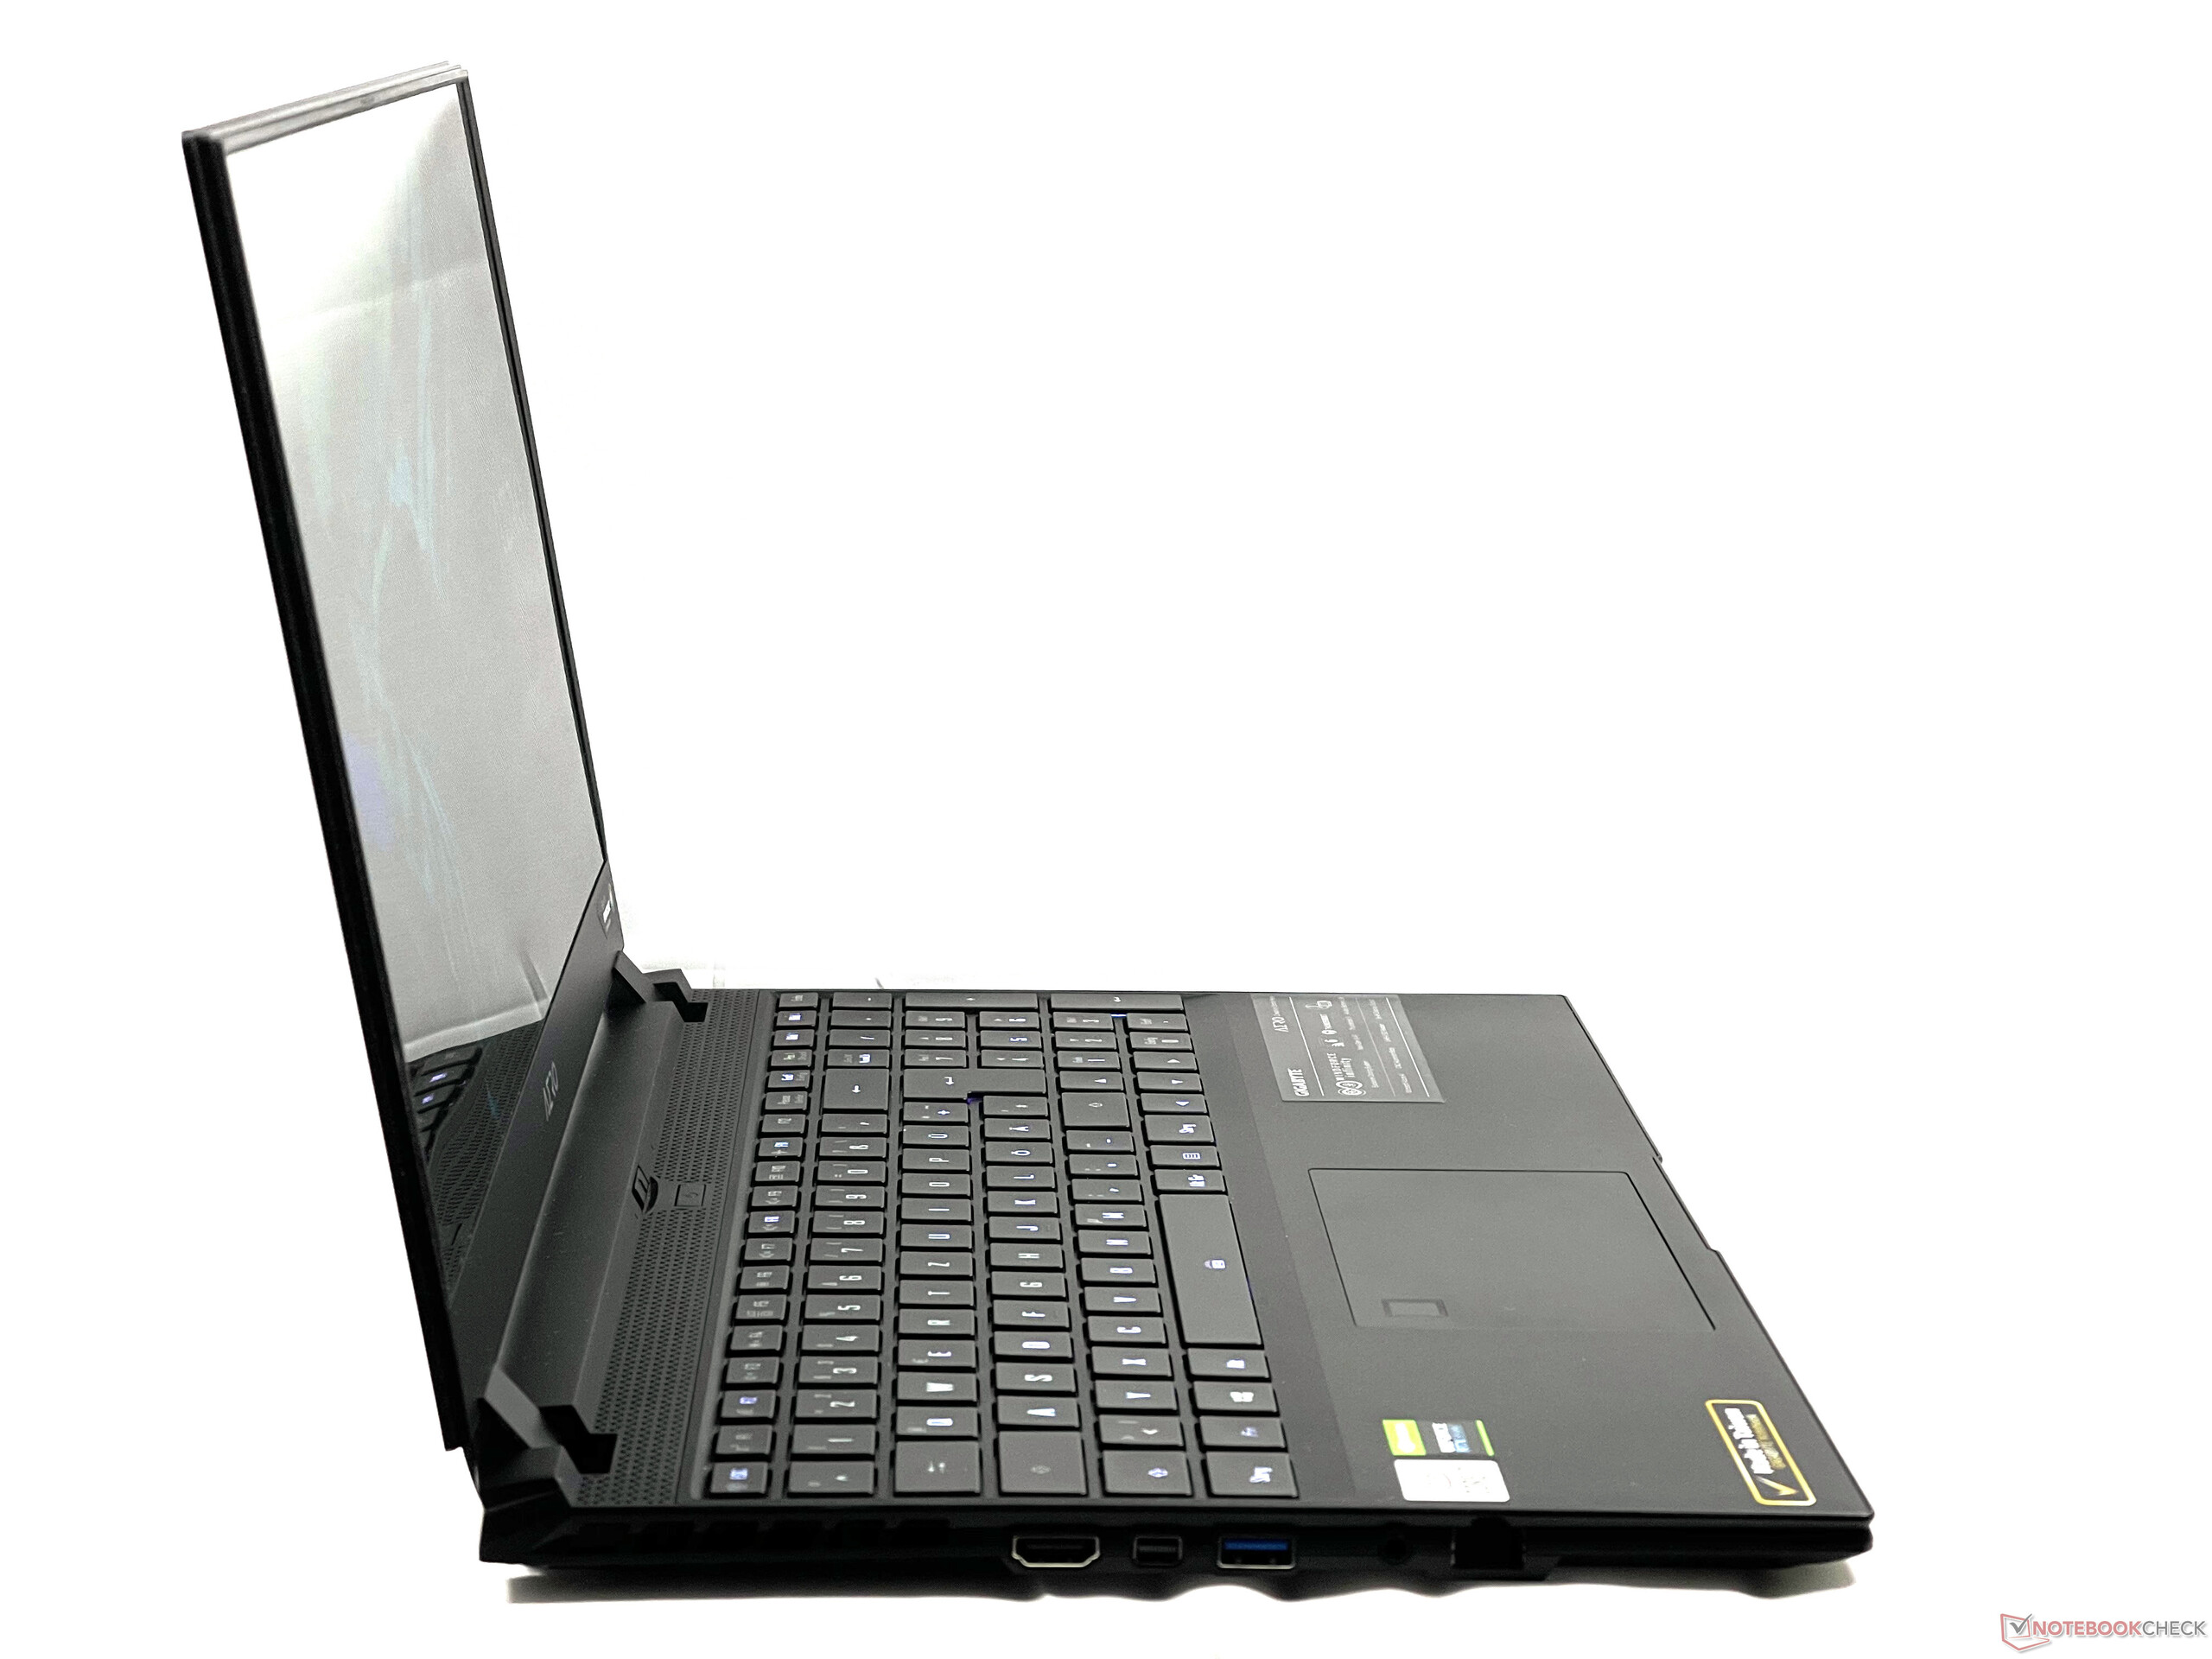
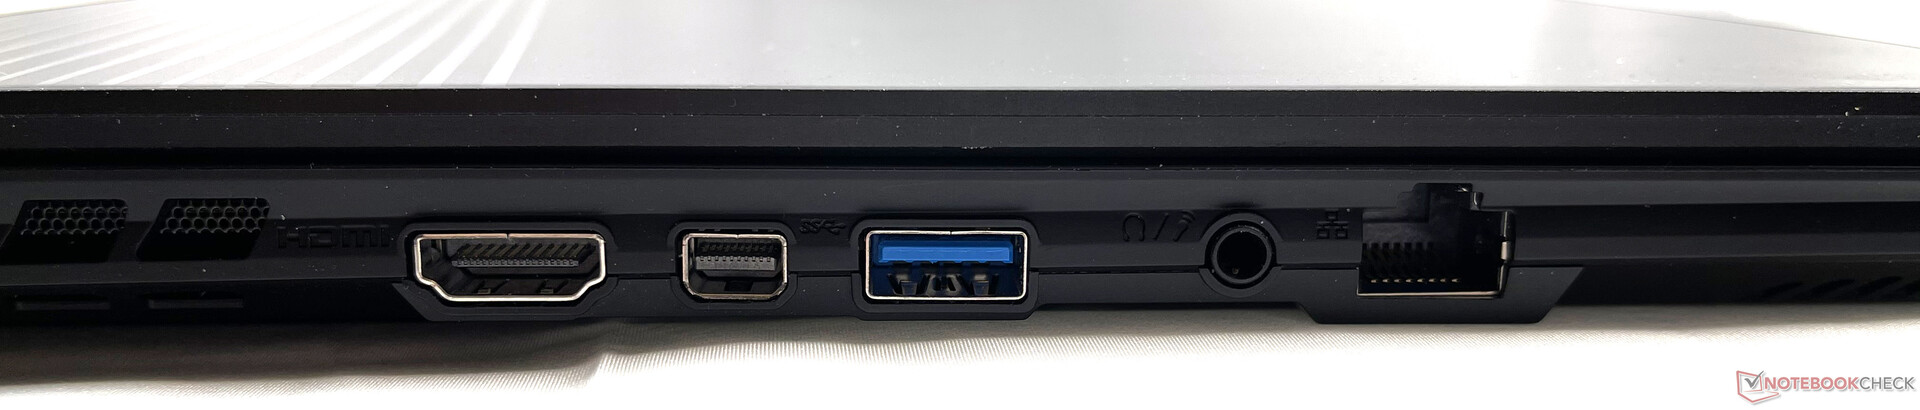
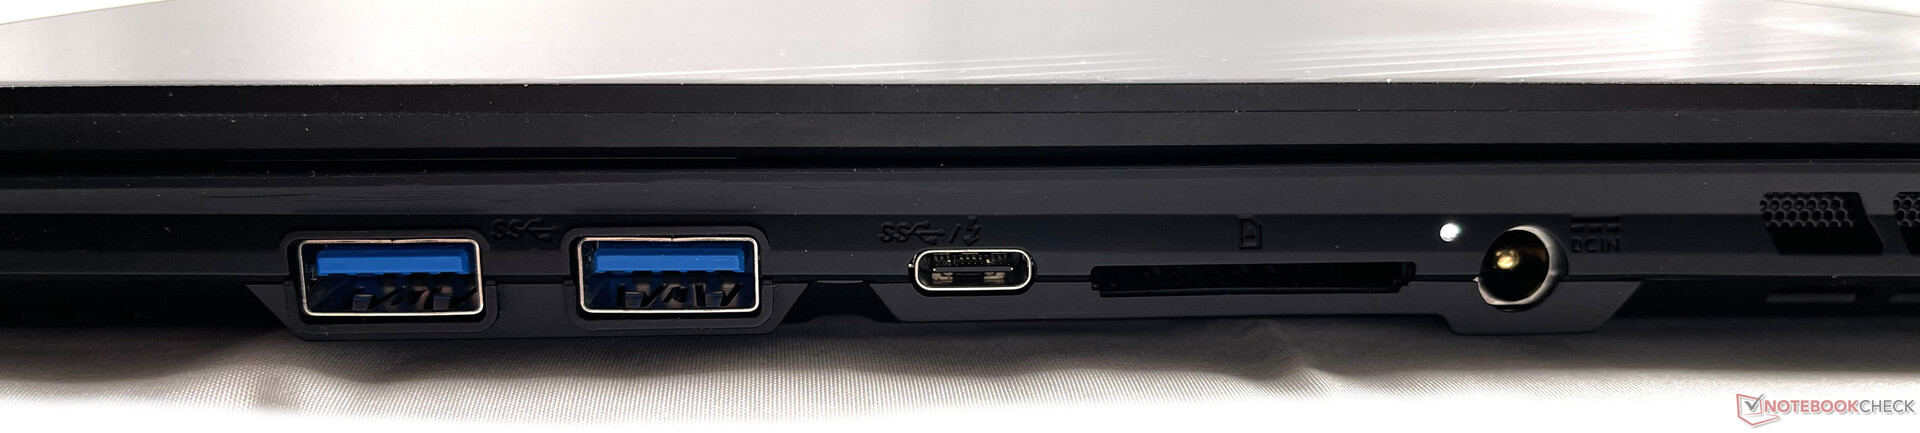
Gigabytes laptop har mycket att erbjuda i fråga om anslutningar: Utöver tre videoutgångar har den en snabb SD-kortläsare och en Thunderbolt 3-port, vilket gör den ännu mer flexibel. Tack vare en utmärkt skärm och starka resultat i flera grenar är Aero 15 OLED XC är ett bra val så länge du inte planerar att skriva några längre texter.
Gigabyte Aero 15 OLED XC
- 03/06/2021 v7 (old)
Marius Schell
Price comparison
