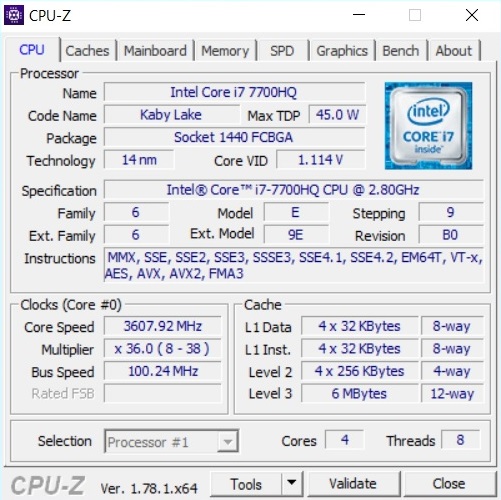
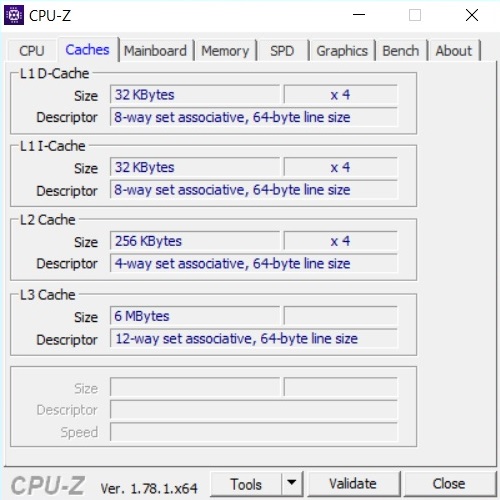
Test: Gigabyte Aero 15 (7700HQ, GTX 1060, FHD) (sammanfattning)
| SD Card Reader | |
| average JPG Copy Test (av. of 3 runs) | |
| Dell XPS 15 9560 (i7-7700HQ, UHD) | |
| Gigabyte Aero 15 | |
| MSI GS63VR 7RF-228US | |
| Acer Aspire VN7-593G-73HP V15 Nitro BE | |
| maximum AS SSD Seq Read Test (1GB) | |
| Dell XPS 15 9560 (i7-7700HQ, UHD) | |
| Gigabyte Aero 15 | |
| Acer Aspire VN7-593G-73HP V15 Nitro BE | |
| MSI GS63VR 7RF-228US | |
| |||||||||||||||||||||||||
Distribution av ljusstyrkan: 90 %
Mitt på batteriet: 320 cd/m²
Kontrast: 889:1 (Svärta: 0.36 cd/m²)
ΔE ColorChecker Calman: 4.62 | ∀{0.5-29.43 Ø4.72}
ΔE Greyscale Calman: 6 | ∀{0.09-98 Ø4.97}
92% sRGB (Argyll 1.6.3 3D)
60% AdobeRGB 1998 (Argyll 1.6.3 3D)
66.5% AdobeRGB 1998 (Argyll 3D)
92.5% sRGB (Argyll 3D)
65.2% Display P3 (Argyll 3D)
Gamma: 2.46
CCT: 6761 K
| Gigabyte Aero 15 N156HCA-EA1 (CMN15D7), 1920x1080, 15.6" | Dell XPS 15 9560 (i7-7700HQ, UHD) 3840x2160, 15.6" | MSI GS63VR 7RF-228US 3840x2160, 15.6" | Acer Aspire VN7-593G-73HP V15 Nitro BE LG Display LP156WF6-SPP1, 1920x1080, 15.6" | Razer Blade (2017) LP140WF3-SPD1, 1920x1080, 14" | |
|---|---|---|---|---|---|
| Display | 32% | -24% | -4% | ||
| Display P3 Coverage (%) | 65.2 | 89.7 38% | 48.21 -26% | 65.8 1% | |
| sRGB Coverage (%) | 92.5 | 100 8% | 72.6 -22% | 85.1 -8% | |
| AdobeRGB 1998 Coverage (%) | 66.5 | 100 50% | 49.81 -25% | 62.2 -6% | |
| Response Times | -29% | 31% | -1% | 32% | |
| Response Time Grey 50% / Grey 80% * (ms) | 42.8 ? | 57.2 ? -34% | 28 ? 35% | 41 ? 4% | 25.2 ? 41% |
| Response Time Black / White * (ms) | 32 ? | 39.2 ? -23% | 23.6 ? 26% | 34 ? -6% | 24.8 ? 22% |
| PWM Frequency (Hz) | 26000 ? | 962 | 1351 ? | 21370 | |
| Screen | 10% | -30% | 3% | 4% | |
| Brightness middle (cd/m²) | 320 | 370.1 16% | 274.2 -14% | 322 1% | 272 -15% |
| Brightness (cd/m²) | 316 | 356 13% | 263 -17% | 297 -6% | 277 -12% |
| Brightness Distribution (%) | 90 | 87 -3% | 92 2% | 86 -4% | 84 -7% |
| Black Level * (cd/m²) | 0.36 | 0.37 -3% | 0.44 -22% | 0.31 14% | 0.26 28% |
| Contrast (:1) | 889 | 1000 12% | 623 -30% | 1039 17% | 1046 18% |
| Colorchecker dE 2000 * | 4.62 | 5.3 -15% | 8 -73% | 4.73 -2% | 4.59 1% |
| Colorchecker dE 2000 max. * | 9.75 | 9.9 -2% | 14.6 -50% | 12.37 -27% | 8.49 13% |
| Greyscale dE 2000 * | 6 | 4.6 23% | 9.1 -52% | 2.99 50% | 4.28 29% |
| Gamma | 2.46 89% | 2.31 95% | 2.24 98% | 2.32 95% | 2.23 99% |
| CCT | 6761 96% | 6284 103% | 5020 129% | 6905 94% | 6848 95% |
| Color Space (Percent of AdobeRGB 1998) (%) | 60 | 88.3 47% | 45.7 -24% | 56 -7% | 55 -8% |
| Color Space (Percent of sRGB) (%) | 92 | 100 9% | 72.1 -22% | 85 -8% | 83 -10% |
| Totalt genomsnitt (program/inställningar) | 4% /
9% | -8% /
-21% | -1% /
1% | 18% /
8% |
* ... mindre är bättre
Visa svarstider
| ↔ Svarstid svart till vitt | ||
|---|---|---|
| 32 ms ... stiga ↗ och falla ↘ kombinerat | ↗ 18.8 ms stiga | 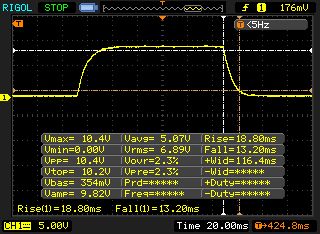 |
| ↘ 13.2 ms hösten | ||
| Skärmen visar långsamma svarsfrekvenser i våra tester och kommer att vara otillfredsställande för spelare. I jämförelse sträcker sig alla testade enheter från 0.1 (minst) till 240 (maximalt) ms. » 86 % av alla enheter är bättre. Detta innebär att den uppmätta svarstiden är sämre än genomsnittet av alla testade enheter (19.8 ms). | ||
| ↔ Svarstid 50 % grått till 80 % grått | ||
| 42.8 ms ... stiga ↗ och falla ↘ kombinerat | ↗ 23.6 ms stiga | 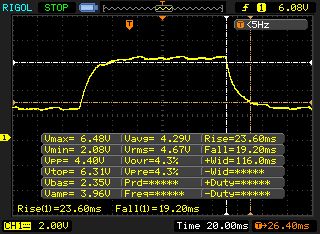 |
| ↘ 19.2 ms hösten | ||
| Skärmen visar långsamma svarsfrekvenser i våra tester och kommer att vara otillfredsställande för spelare. I jämförelse sträcker sig alla testade enheter från 0.165 (minst) till 636 (maximalt) ms. » 70 % av alla enheter är bättre. Detta innebär att den uppmätta svarstiden är sämre än genomsnittet av alla testade enheter (31 ms). | ||
Skärmflimmer / PWM (Puls-Width Modulation)
| Skärmflimmer / PWM upptäckt | 26000 Hz | ≤ 20 % ljusstyrka inställning | 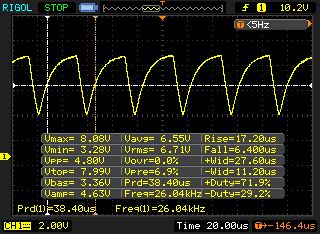 |
Displayens bakgrundsbelysning flimrar vid 26000 Hz (i värsta fall, t.ex. med PWM) Flimrande upptäckt vid en ljusstyrkeinställning på 20 % och lägre. Det ska inte finnas något flimmer eller PWM över denna ljusstyrkeinställning. Frekvensen för 26000 Hz är ganska hög, så de flesta användare som är känsliga för PWM bör inte märka något flimmer. Som jämförelse: 52 % av alla testade enheter använder inte PWM för att dämpa skärmen. Om PWM upptäcktes mättes ett medelvärde av 7781 (minst: 5 - maximum: 343500) Hz. | |||
| Cinebench R11.5 | |
| CPU Single 64Bit | |
| Gigabyte Aero 15 | |
| Dell XPS 15 9560 (i7-7700HQ, UHD) | |
| MSI GS63VR 7RF-228US | |
| CPU Multi 64Bit | |
| Gigabyte Aero 15 | |
| MSI GS63VR 7RF-228US | |
| Dell XPS 15 9560 (i7-7700HQ, UHD) | |
| PCMark 8 | |
| Home Score Accelerated v2 | |
| Gigabyte Aero 15 | |
| MSI GS63VR 7RF-228US | |
| Razer Blade (2017) | |
| Dell XPS 15 9560 (i7-7700HQ, UHD) | |
| Work Score Accelerated v2 | |
| Gigabyte Aero 15 | |
| MSI GS63VR 7RF-228US | |
| Razer Blade (2017) | |
| Dell XPS 15 9560 (i7-7700HQ, UHD) | |
| PCMark 7 Score | 6290 poäng | |
| PCMark 8 Home Score Accelerated v2 | 4248 poäng | |
| PCMark 8 Work Score Accelerated v2 | 5290 poäng | |
Hjälp | ||
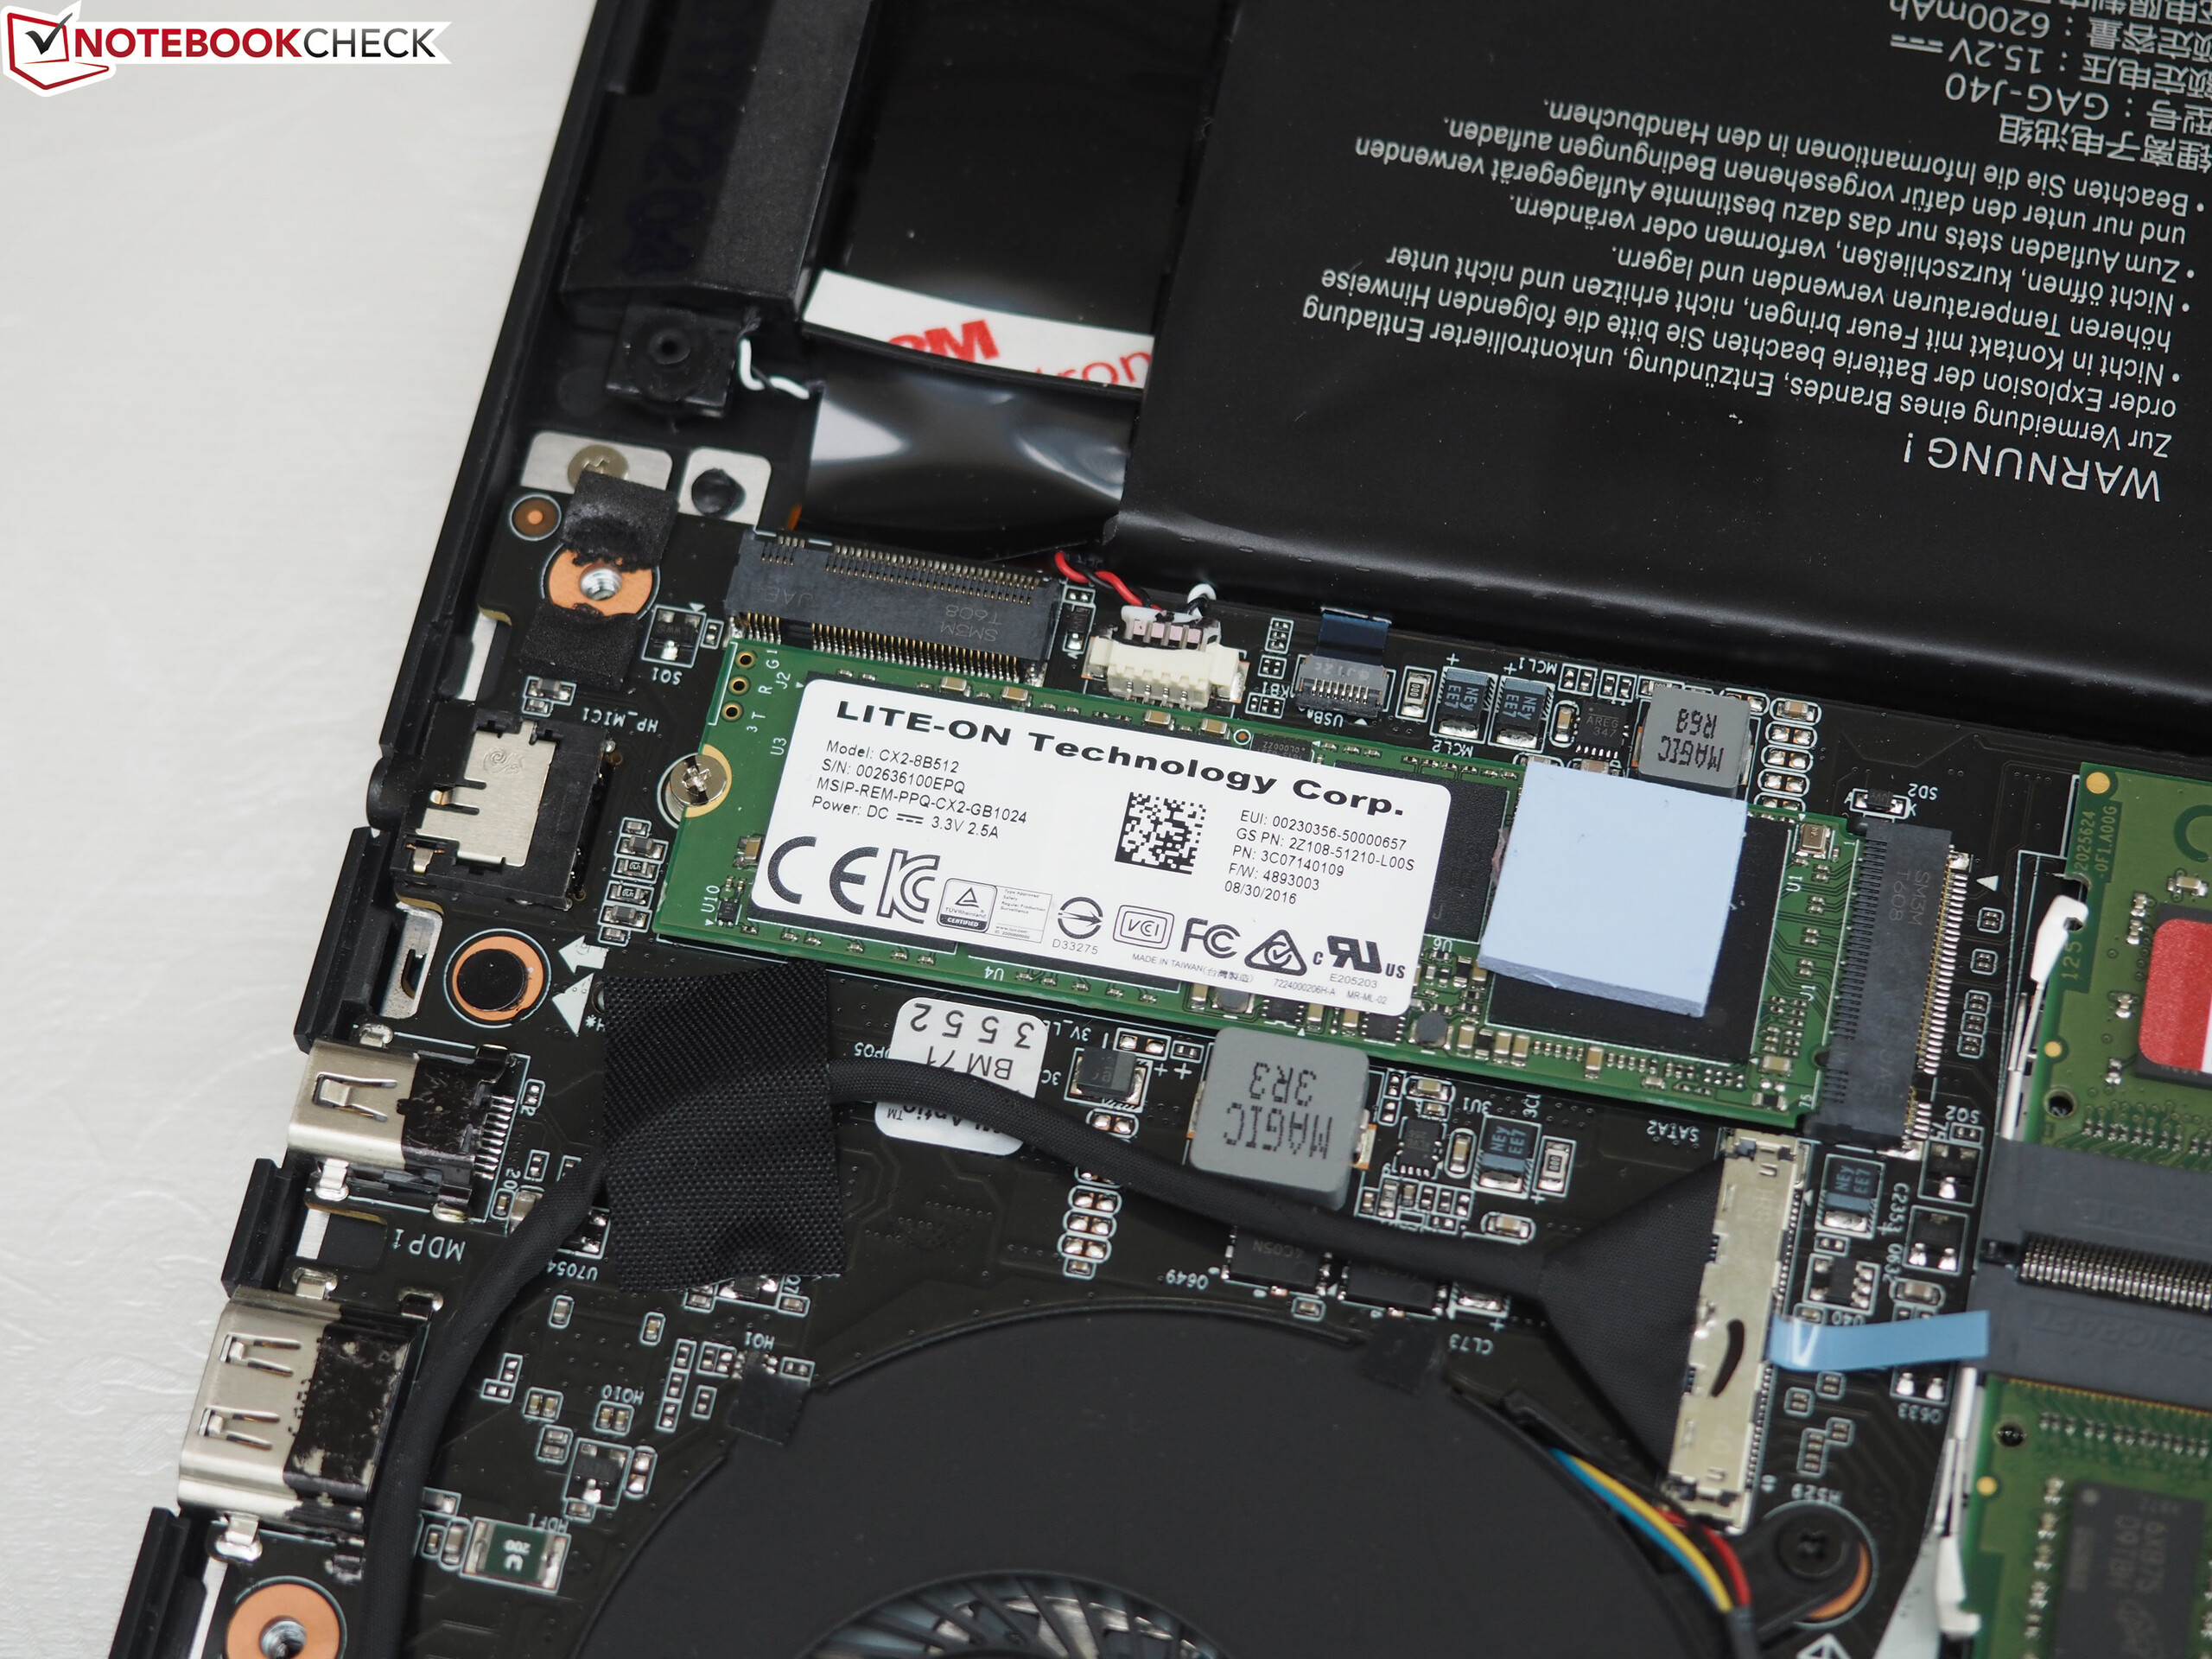
| Gigabyte Aero 15 Lite-On CX2-8B512-Q11 | Dell XPS 15 9560 (i7-7700HQ, UHD) Lite-On CX2-8B512-Q11 | MSI GS63VR 7RF-228US Samsung SM961 MZVKW512HMJP m.2 PCI-e | Acer Aspire VN7-593G-73HP V15 Nitro BE Seagate Mobile HDD 1TB ST1000LM035 | Razer Blade (2017) Samsung PM951 NVMe MZVLV256 | |
|---|---|---|---|---|---|
| CrystalDiskMark 3.0 | -3% | 15% | -96% | -33% | |
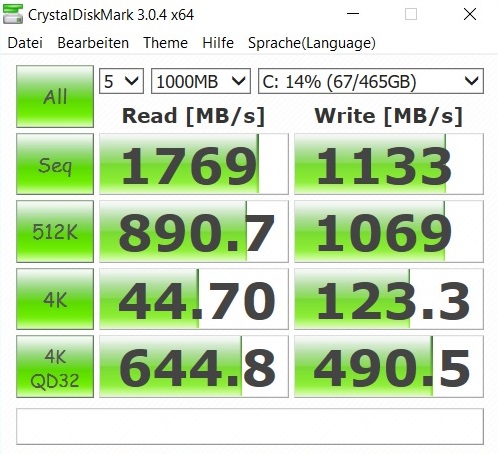
| Read Seq (MB/s) | 1769 | 1684 -5% | 2141 21% | 120.9 -93% | 1122 -37% |
| Write Seq (MB/s) | 1133 | 1106 -2% | 1621 43% | 101.8 -91% | 311 -73% |
| Read 512 (MB/s) | 891 | 977 10% | 499.7 -44% | 37.83 -96% | 682 -23% |
| Write 512 (MB/s) | 1069 | 1119 5% | 1531 43% | 84.4 -92% | 310 -71% |
| Read 4k (MB/s) | 44.7 | 45.14 1% | 54.2 21% | 0.473 -99% | 34.8 -22% |
| Write 4k (MB/s) | 123.3 | 134.1 9% | 158.2 28% | 0.313 -100% | 134.3 9% |
| Read 4k QD32 (MB/s) | 645 | 509 -21% | 632 -2% | 1.133 -100% | 565 -12% |
| Write 4k QD32 (MB/s) | 490.5 | 398.1 -19% | 527 7% | 0.274 -100% | 308 -37% |

| 3DMark - 1920x1080 Fire Strike Graphics | |
| Acer Aspire VN7-593G-73HP V15 Nitro BE | |
| MSI GS63VR 7RF-228US | |
| Gigabyte Aero 15 | |
| Razer Blade (2017) | |
| Dell XPS 15 9560 (i7-7700HQ, UHD) | |
| 3DMark 11 - 1280x720 Performance GPU | |
| Acer Aspire VN7-593G-73HP V15 Nitro BE | |
| MSI GS63VR 7RF-228US | |
| Gigabyte Aero 15 | |
| Razer Blade (2017) | |
| 3DMark 11 Performance | 12471 poäng | |
| 3DMark Ice Storm Standard Score | 111791 poäng | |
| 3DMark Cloud Gate Standard Score | 25949 poäng | |
| 3DMark Fire Strike Score | 9546 poäng | |
Hjälp | ||
| låg | med. | hög | ultra | |
|---|---|---|---|---|
| The Witcher 3 (2015) | 68.2 | 37.7 | ||
| XCOM 2 (2016) | 57.9 | 29.1 | ||
| Far Cry Primal (2016) | 74 | 57 | ||
| Mirror's Edge Catalyst (2016) | 72.8 | 65.8 | ||
| FIFA 17 (2016) | 223 | 213 | ||
| Call of Duty Infinite Warfare (2016) | 96.3 | 86.1 | ||
| Watch Dogs 2 (2016) | 60.9 | 42.8 | ||
| Resident Evil 7 (2017) | 98.9 | 81.5 | ||
| For Honor (2017) | 95.6 | 70.1 | ||
| Ghost Recon Wildlands (2017) | 62.9 | 34.5 | ||
| Mass Effect Andromeda (2017) | 51.4 | 46.4 |
Ljudnivå
| Låg belastning |
| 32 / 33 / 34 dB(A) |
| Hög belastning |
| 39 / 50 dB(A) |
 | ||
30 dB tyst 40 dB(A) hörbar 50 dB(A) högt ljud |
||
min: | ||
| Gigabyte Aero 15 i7-7700HQ, GeForce GTX 1060 Mobile | Dell XPS 15 9560 (i7-7700HQ, UHD) i7-7700HQ, GeForce GTX 1050 Mobile | MSI GS63VR 7RF-228US i7-7700HQ, GeForce GTX 1060 Mobile | Acer Aspire VN7-593G-73HP V15 Nitro BE i7-7700HQ, GeForce GTX 1060 Mobile | Razer Blade (2017) i7-7700HQ, GeForce GTX 1060 Mobile | |
|---|---|---|---|---|---|
| Noise | -0% | 1% | 3% | -1% | |
| av / miljö * (dB) | 31 | 28.4 8% | 28.8 7% | 30.4 2% | |
| Idle Minimum * (dB) | 32 | 29 9% | 33.1 -3% | 30.9 3% | 30 6% |
| Idle Average * (dB) | 33 | 29 12% | 33.1 -0% | 30.9 6% | 30 9% |
| Idle Maximum * (dB) | 34 | 32.2 5% | 34 -0% | 31.5 7% | 30 12% |
| Load Average * (dB) | 39 | 47.1 -21% | 37.2 5% | 40.7 -4% | 51 -31% |
| Witcher 3 ultra * (dB) | 43 | 52 -21% | 46.1 -7% | 45.5 -6% | |
| Load Maximum * (dB) | 50 | 47.1 6% | 47.1 6% | 43.9 12% | 51 -2% |
* ... mindre är bättre
(-) Den maximala temperaturen på ovansidan är 56 °C / 133 F, jämfört med genomsnittet av 36.8 °C / 98 F , allt från 21 till 71 °C för klassen Multimedia.
(-) Botten värms upp till maximalt 61 °C / 142 F, jämfört med genomsnittet av 39.1 °C / 102 F
(+) Vid tomgångsbruk är medeltemperaturen för ovansidan 23.8 °C / 75 F, jämfört med enhetsgenomsnittet på 31.3 °C / ### class_avg_f### F.
(-) När du spelar The Witcher 3 är medeltemperaturen för ovansidan 43.7 °C / 111 F, jämfört med enhetsgenomsnittet på 31.3 °C / ## #class_avg_f### F.
(-) Handledsstöden och pekplattan kan bli väldigt varma vid beröring med maximalt 40 °C / 104 F.
(-) Medeltemperaturen för handledsstödsområdet på liknande enheter var 28.7 °C / 83.7 F (-11.3 °C / -20.3 F).
| Gigabyte Aero 15 i7-7700HQ, GeForce GTX 1060 Mobile | Dell XPS 15 9560 (i7-7700HQ, UHD) i7-7700HQ, GeForce GTX 1050 Mobile | MSI GS63VR 7RF-228US i7-7700HQ, GeForce GTX 1060 Mobile | Acer Aspire VN7-593G-73HP V15 Nitro BE i7-7700HQ, GeForce GTX 1060 Mobile | Razer Blade (2017) i7-7700HQ, GeForce GTX 1060 Mobile | |
|---|---|---|---|---|---|
| Heat | 8% | -19% | -5% | ||
| Maximum Upper Side * (°C) | 56 | 48.8 13% | 51.9 7% | ||
| Maximum Bottom * (°C) | 61 | 42.6 30% | 54.6 10% | ||
| Idle Upper Side * (°C) | 25 | 26 -4% | 28.4 -14% | 29.1 -16% | |
| Idle Bottom * (°C) | 24 | 25.4 -6% | 29.6 -23% | 29.3 -22% |
* ... mindre är bättre
Gigabyte Aero 15 ljudanalys
(±) | högtalarljudstyrkan är genomsnittlig men bra (79 dB)
Bas 100 - 315 Hz
(-) | nästan ingen bas - i genomsnitt 23.3% lägre än medianen
(±) | linjäriteten för basen är genomsnittlig (10.7% delta till föregående frekvens)
Mellan 400 - 2000 Hz
(+) | balanserad mellan - endast 1.8% från medianen
(+) | mids är linjära (4.1% delta till föregående frekvens)
Högsta 2 - 16 kHz
(+) | balanserade toppar - endast 2.6% från medianen
(+) | toppar är linjära (5.1% delta till föregående frekvens)
Totalt 100 - 16 000 Hz
(±) | linjäriteten för det totala ljudet är genomsnittlig (18.3% skillnad mot median)
Jämfört med samma klass
» 56% av alla testade enheter i den här klassen var bättre, 7% liknande, 38% sämre
» Den bästa hade ett delta på 5%, genomsnittet var 17%, sämst var 45%
Jämfört med alla testade enheter
» 40% av alla testade enheter var bättre, 8% liknande, 52% sämre
» Den bästa hade ett delta på 4%, genomsnittet var 24%, sämst var 134%
Dell XPS 15 9560 (i7-7700HQ, UHD) ljudanalys
(-) | inte särskilt höga högtalare (70.9 dB)
Bas 100 - 315 Hz
(±) | reducerad bas - i genomsnitt 12.9% lägre än medianen
(±) | linjäriteten för basen är genomsnittlig (14.3% delta till föregående frekvens)
Mellan 400 - 2000 Hz
(+) | balanserad mellan - endast 3.5% från medianen
(±) | linjäriteten för mids är genomsnittlig (8.9% delta till föregående frekvens)
Högsta 2 - 16 kHz
(+) | balanserade toppar - endast 2.3% från medianen
(±) | linjäriteten för toppar är genomsnittlig (7.3% delta till föregående frekvens)
Totalt 100 - 16 000 Hz
(±) | linjäriteten för det totala ljudet är genomsnittlig (16.2% skillnad mot median)
Jämfört med samma klass
» 41% av alla testade enheter i den här klassen var bättre, 7% liknande, 51% sämre
» Den bästa hade ett delta på 5%, genomsnittet var 17%, sämst var 45%
Jämfört med alla testade enheter
» 26% av alla testade enheter var bättre, 6% liknande, 68% sämre
» Den bästa hade ett delta på 4%, genomsnittet var 24%, sämst var 134%
| Av/Standby | |
| Låg belastning | |
| Hög belastning |
|
Förklaring:
min: | |
| Gigabyte Aero 15 i7-7700HQ, GeForce GTX 1060 Mobile | Dell XPS 15 9560 (i7-7700HQ, UHD) i7-7700HQ, GeForce GTX 1050 Mobile | MSI GS63VR 7RF-228US i7-7700HQ, GeForce GTX 1060 Mobile | Acer Aspire VN7-593G-73HP V15 Nitro BE i7-7700HQ, GeForce GTX 1060 Mobile | Razer Blade (2017) i7-7700HQ, GeForce GTX 1060 Mobile | |
|---|---|---|---|---|---|
| Power Consumption | 3% | -10% | 14% | 22% | |
| Idle Minimum * (Watt) | 12 | 11.9 1% | 14.5 -21% | 7.2 40% | 7.5 37% |
| Idle Average * (Watt) | 15 | 17.1 -14% | 17.3 -15% | 10.5 30% | 12.1 19% |
| Idle Maximum * (Watt) | 20 | 17.3 13% | 17.4 13% | 16 20% | 14.3 28% |
| Load Average * (Watt) | 82 | 94.7 -15% | 93 -13% | 82 -0% | 73.5 10% |
| Witcher 3 ultra * (Watt) | 111 | 104.8 6% | 128.8 -16% | 124 -12% | 108 3% |
| Load Maximum * (Watt) | 161 | 122 24% | 155 4% | 110.2 32% |
* ... mindre är bättre
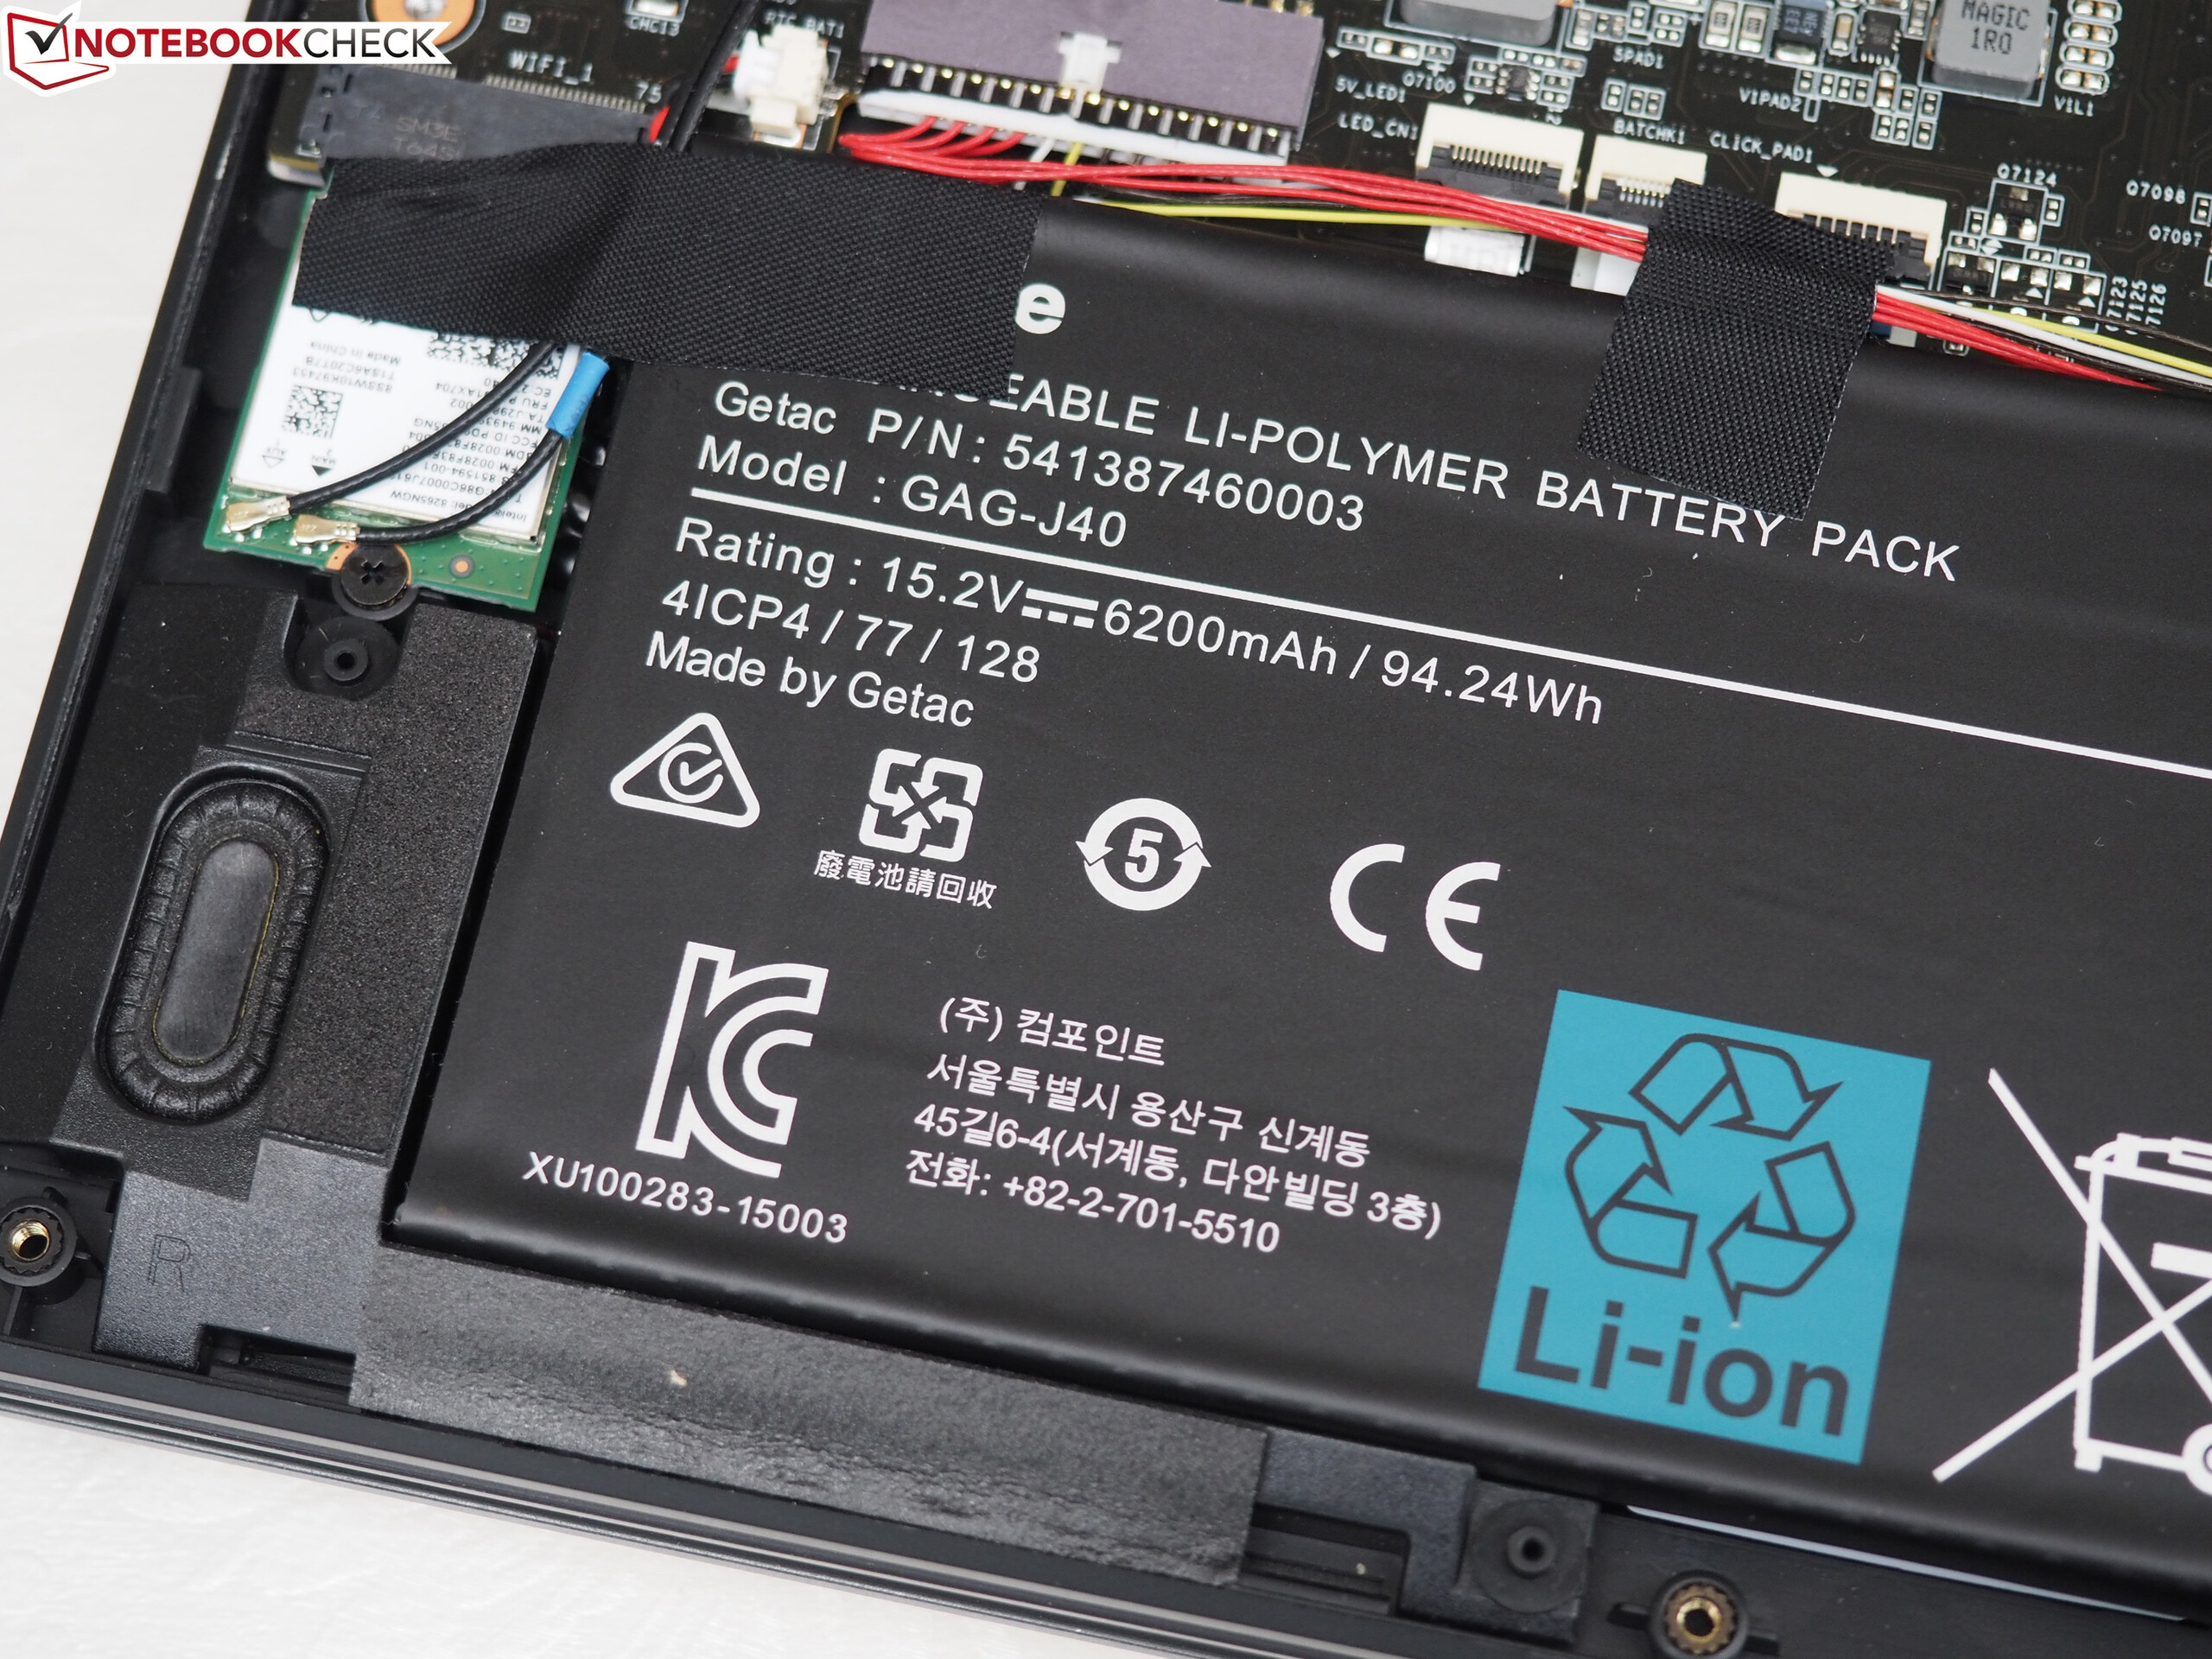
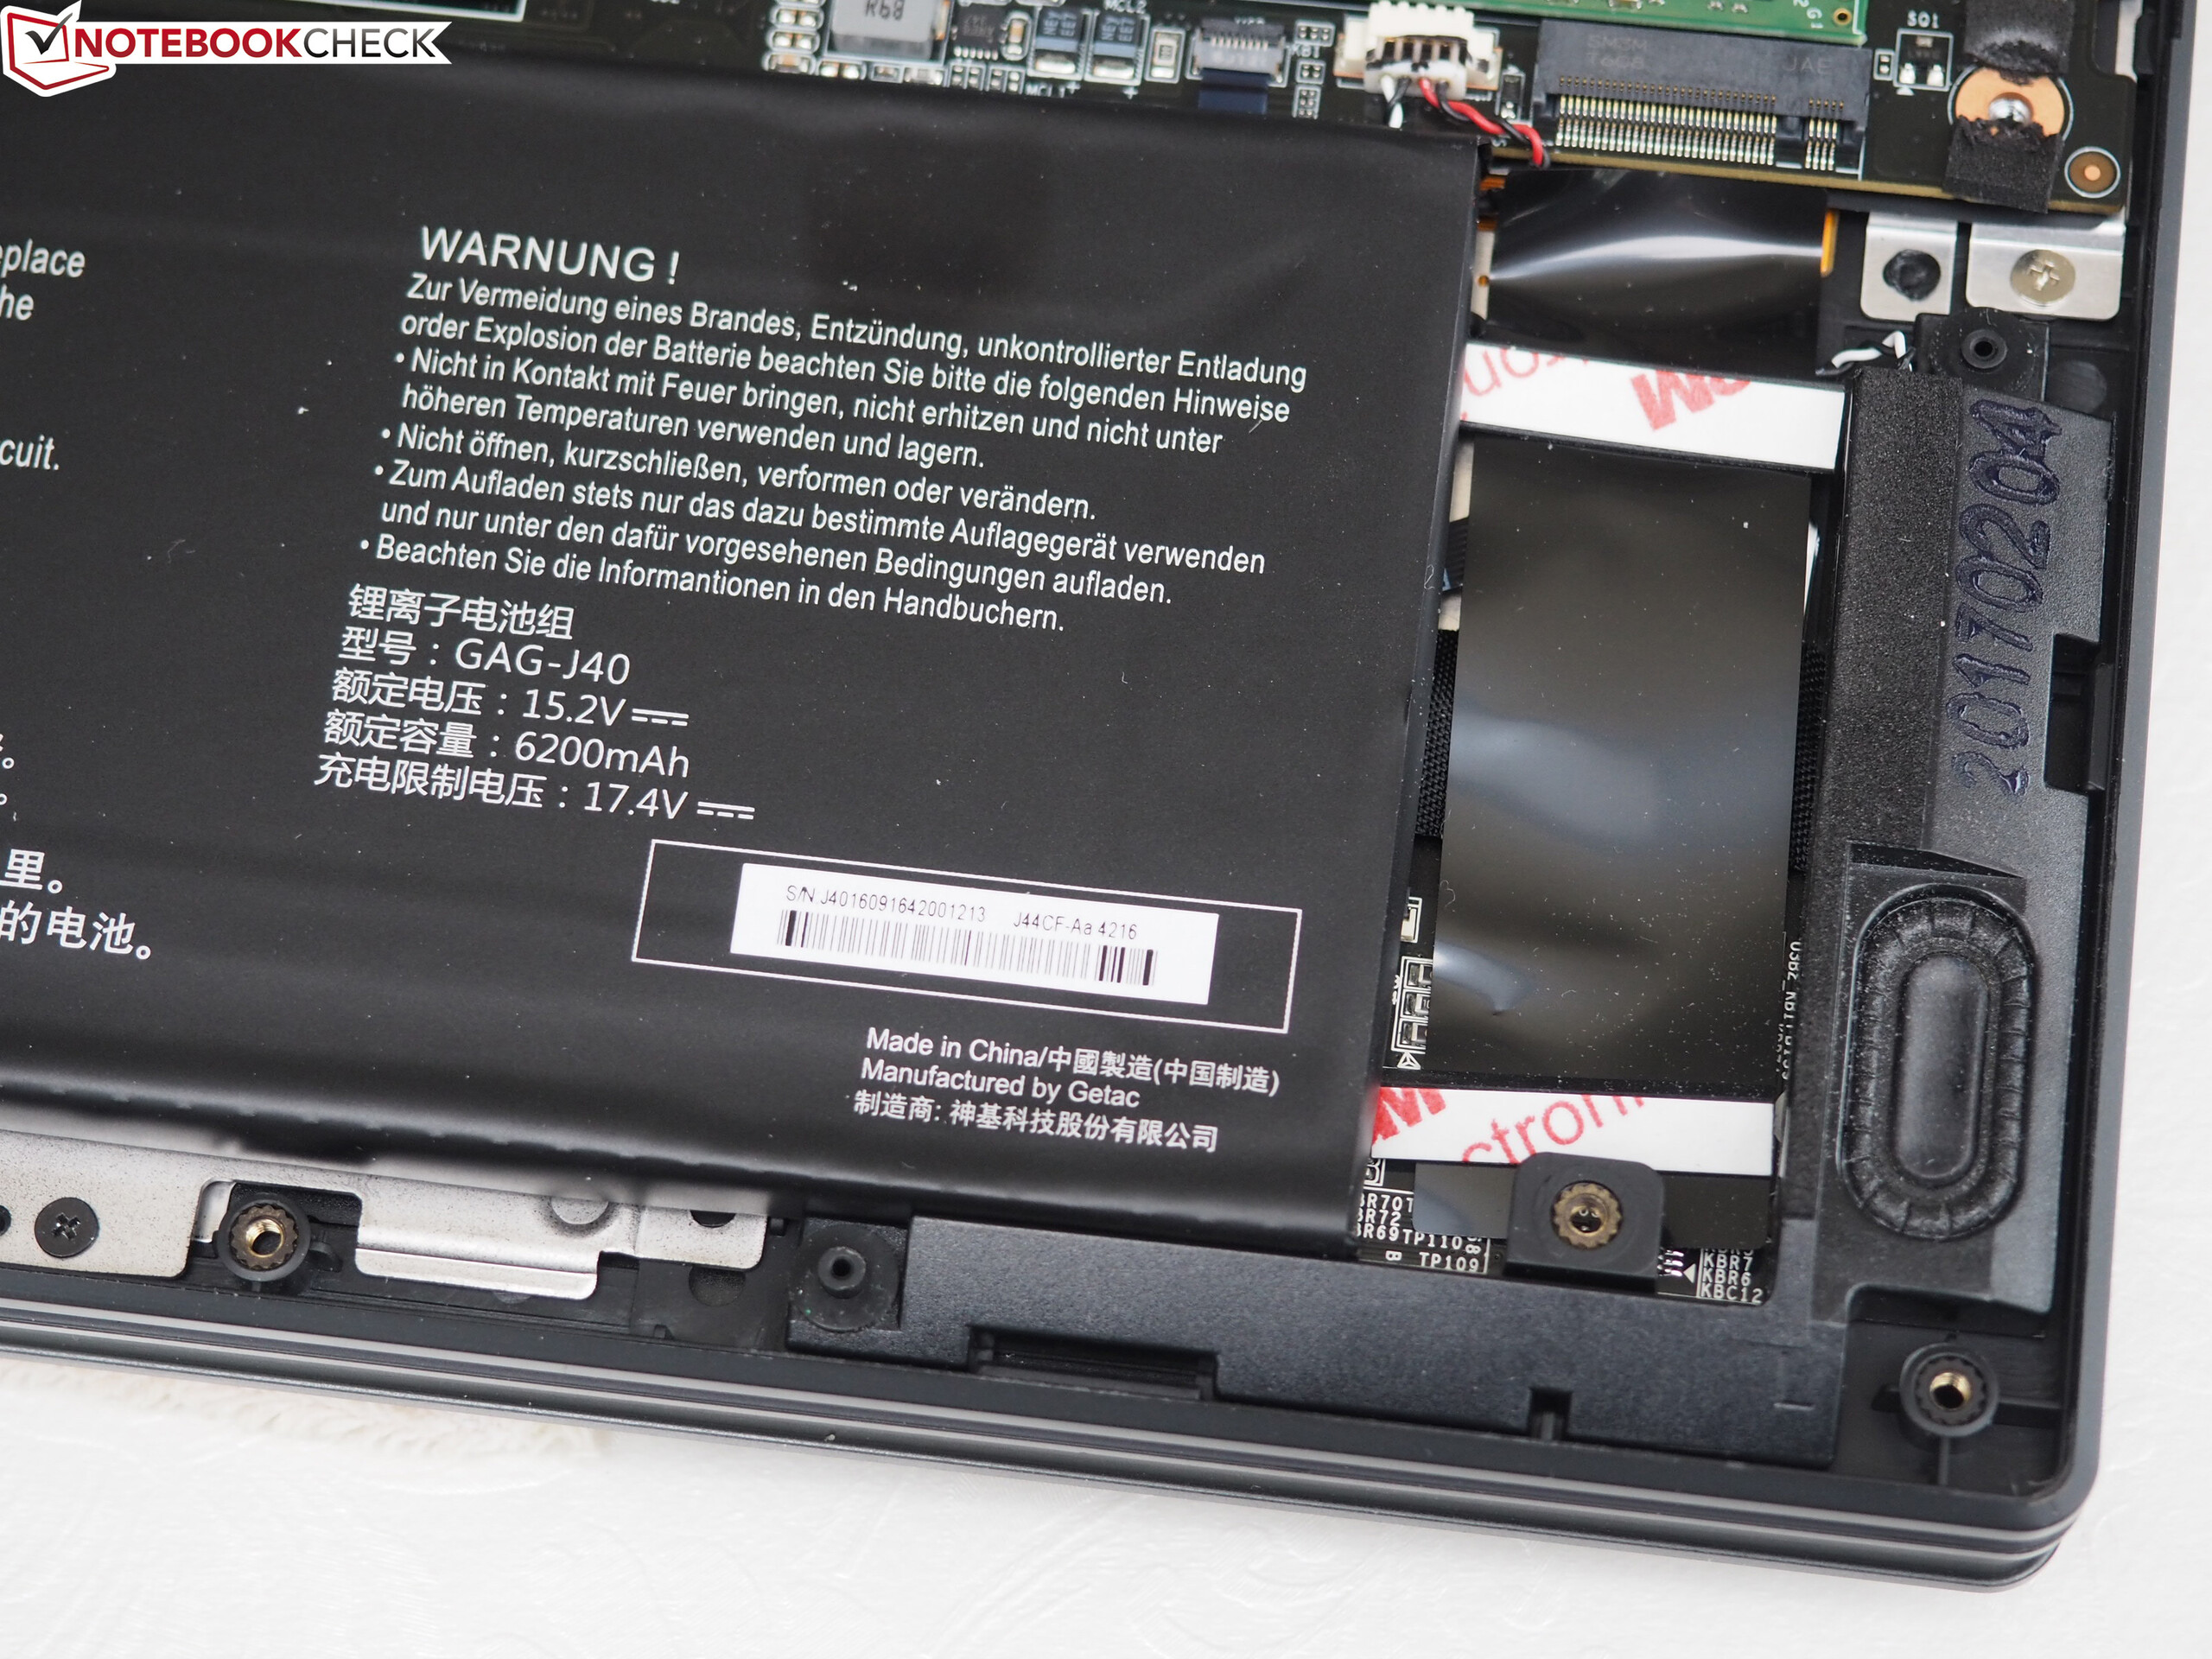
| Gigabyte Aero 15 i7-7700HQ, GeForce GTX 1060 Mobile, 94.24 Wh | Dell XPS 15 9560 (i7-7700HQ, UHD) i7-7700HQ, GeForce GTX 1050 Mobile, 97 Wh | MSI GS63VR 7RF-228US i7-7700HQ, GeForce GTX 1060 Mobile, 65 Wh | Acer Aspire VN7-593G-73HP V15 Nitro BE i7-7700HQ, GeForce GTX 1060 Mobile, 69 Wh | Razer Blade (2017) i7-7700HQ, GeForce GTX 1060 Mobile, 70 Wh | |
|---|---|---|---|---|---|
| Batteridrifttid | 8% | -39% | -3% | 30% | |
| Reader / Idle (h) | 10.6 | 13.9 31% | 6.4 -40% | 8.4 -21% | |
| H.264 (h) | 7.7 | ||||
| WiFi v1.3 (h) | 7 | 7.2 3% | 3.9 -44% | 6 -14% | 9.1 30% |
| Load (h) | 1.9 | 1.7 -11% | 1.3 -32% | 2.4 26% |
För
Emot
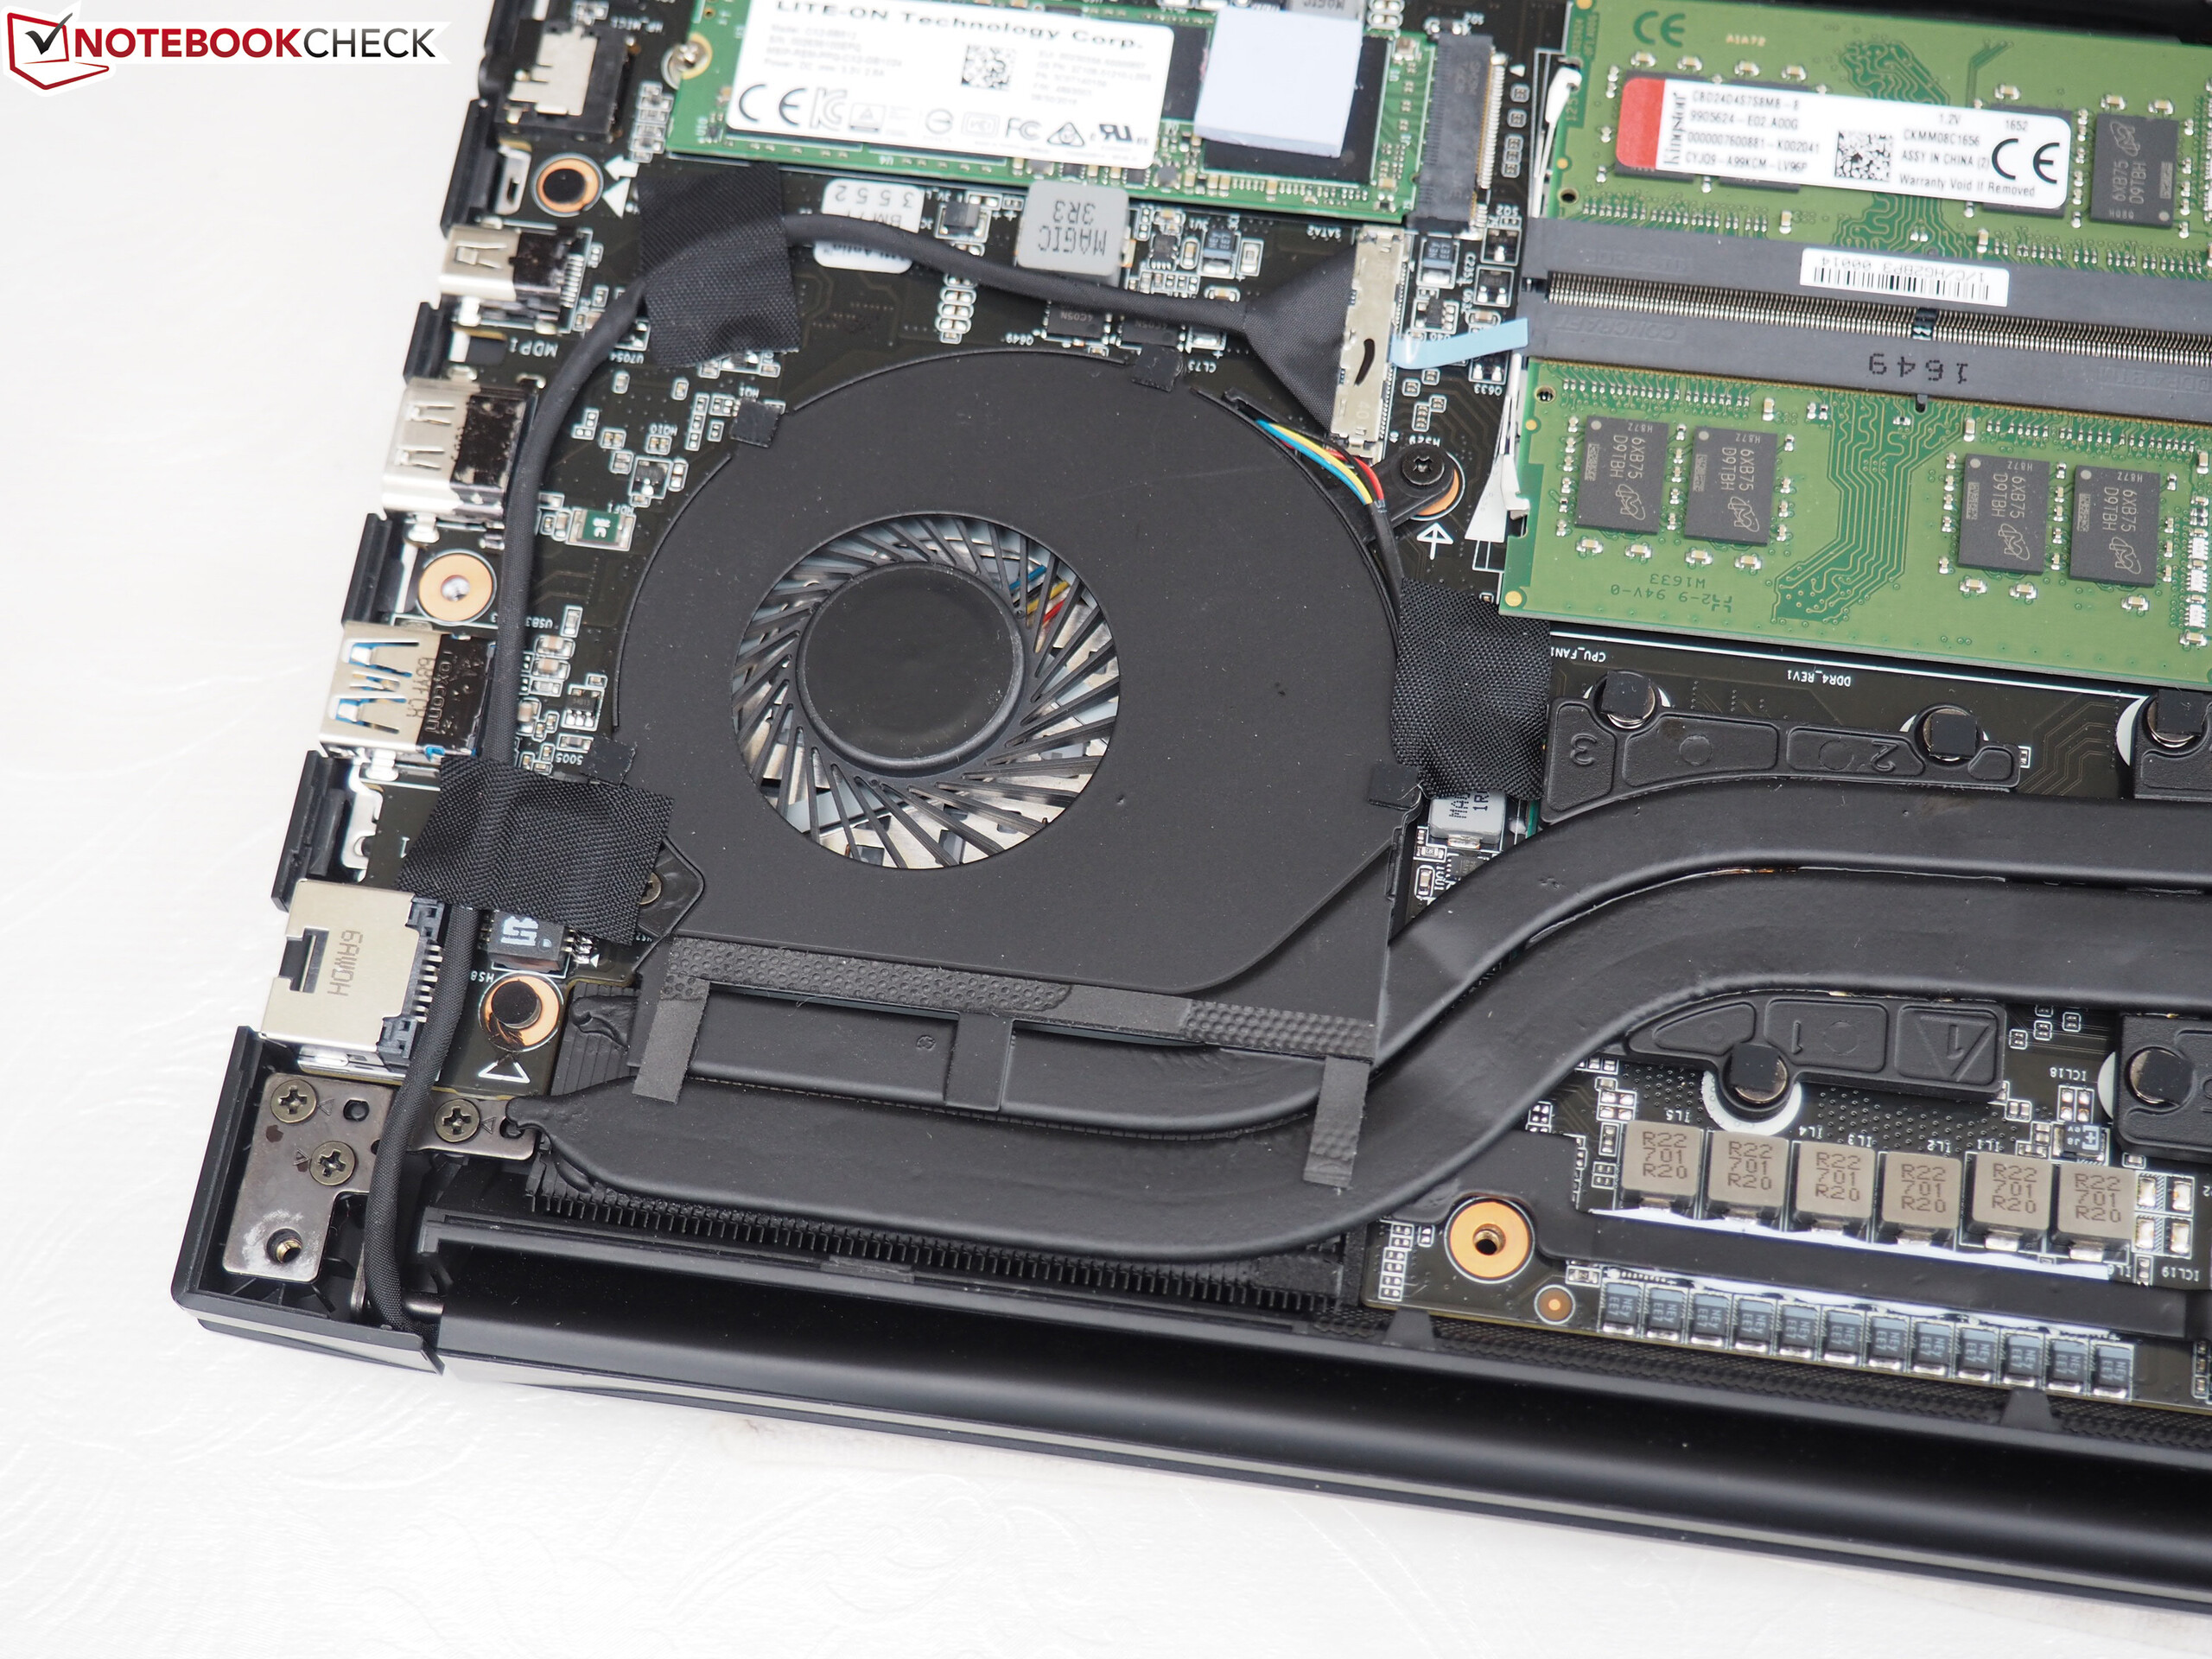
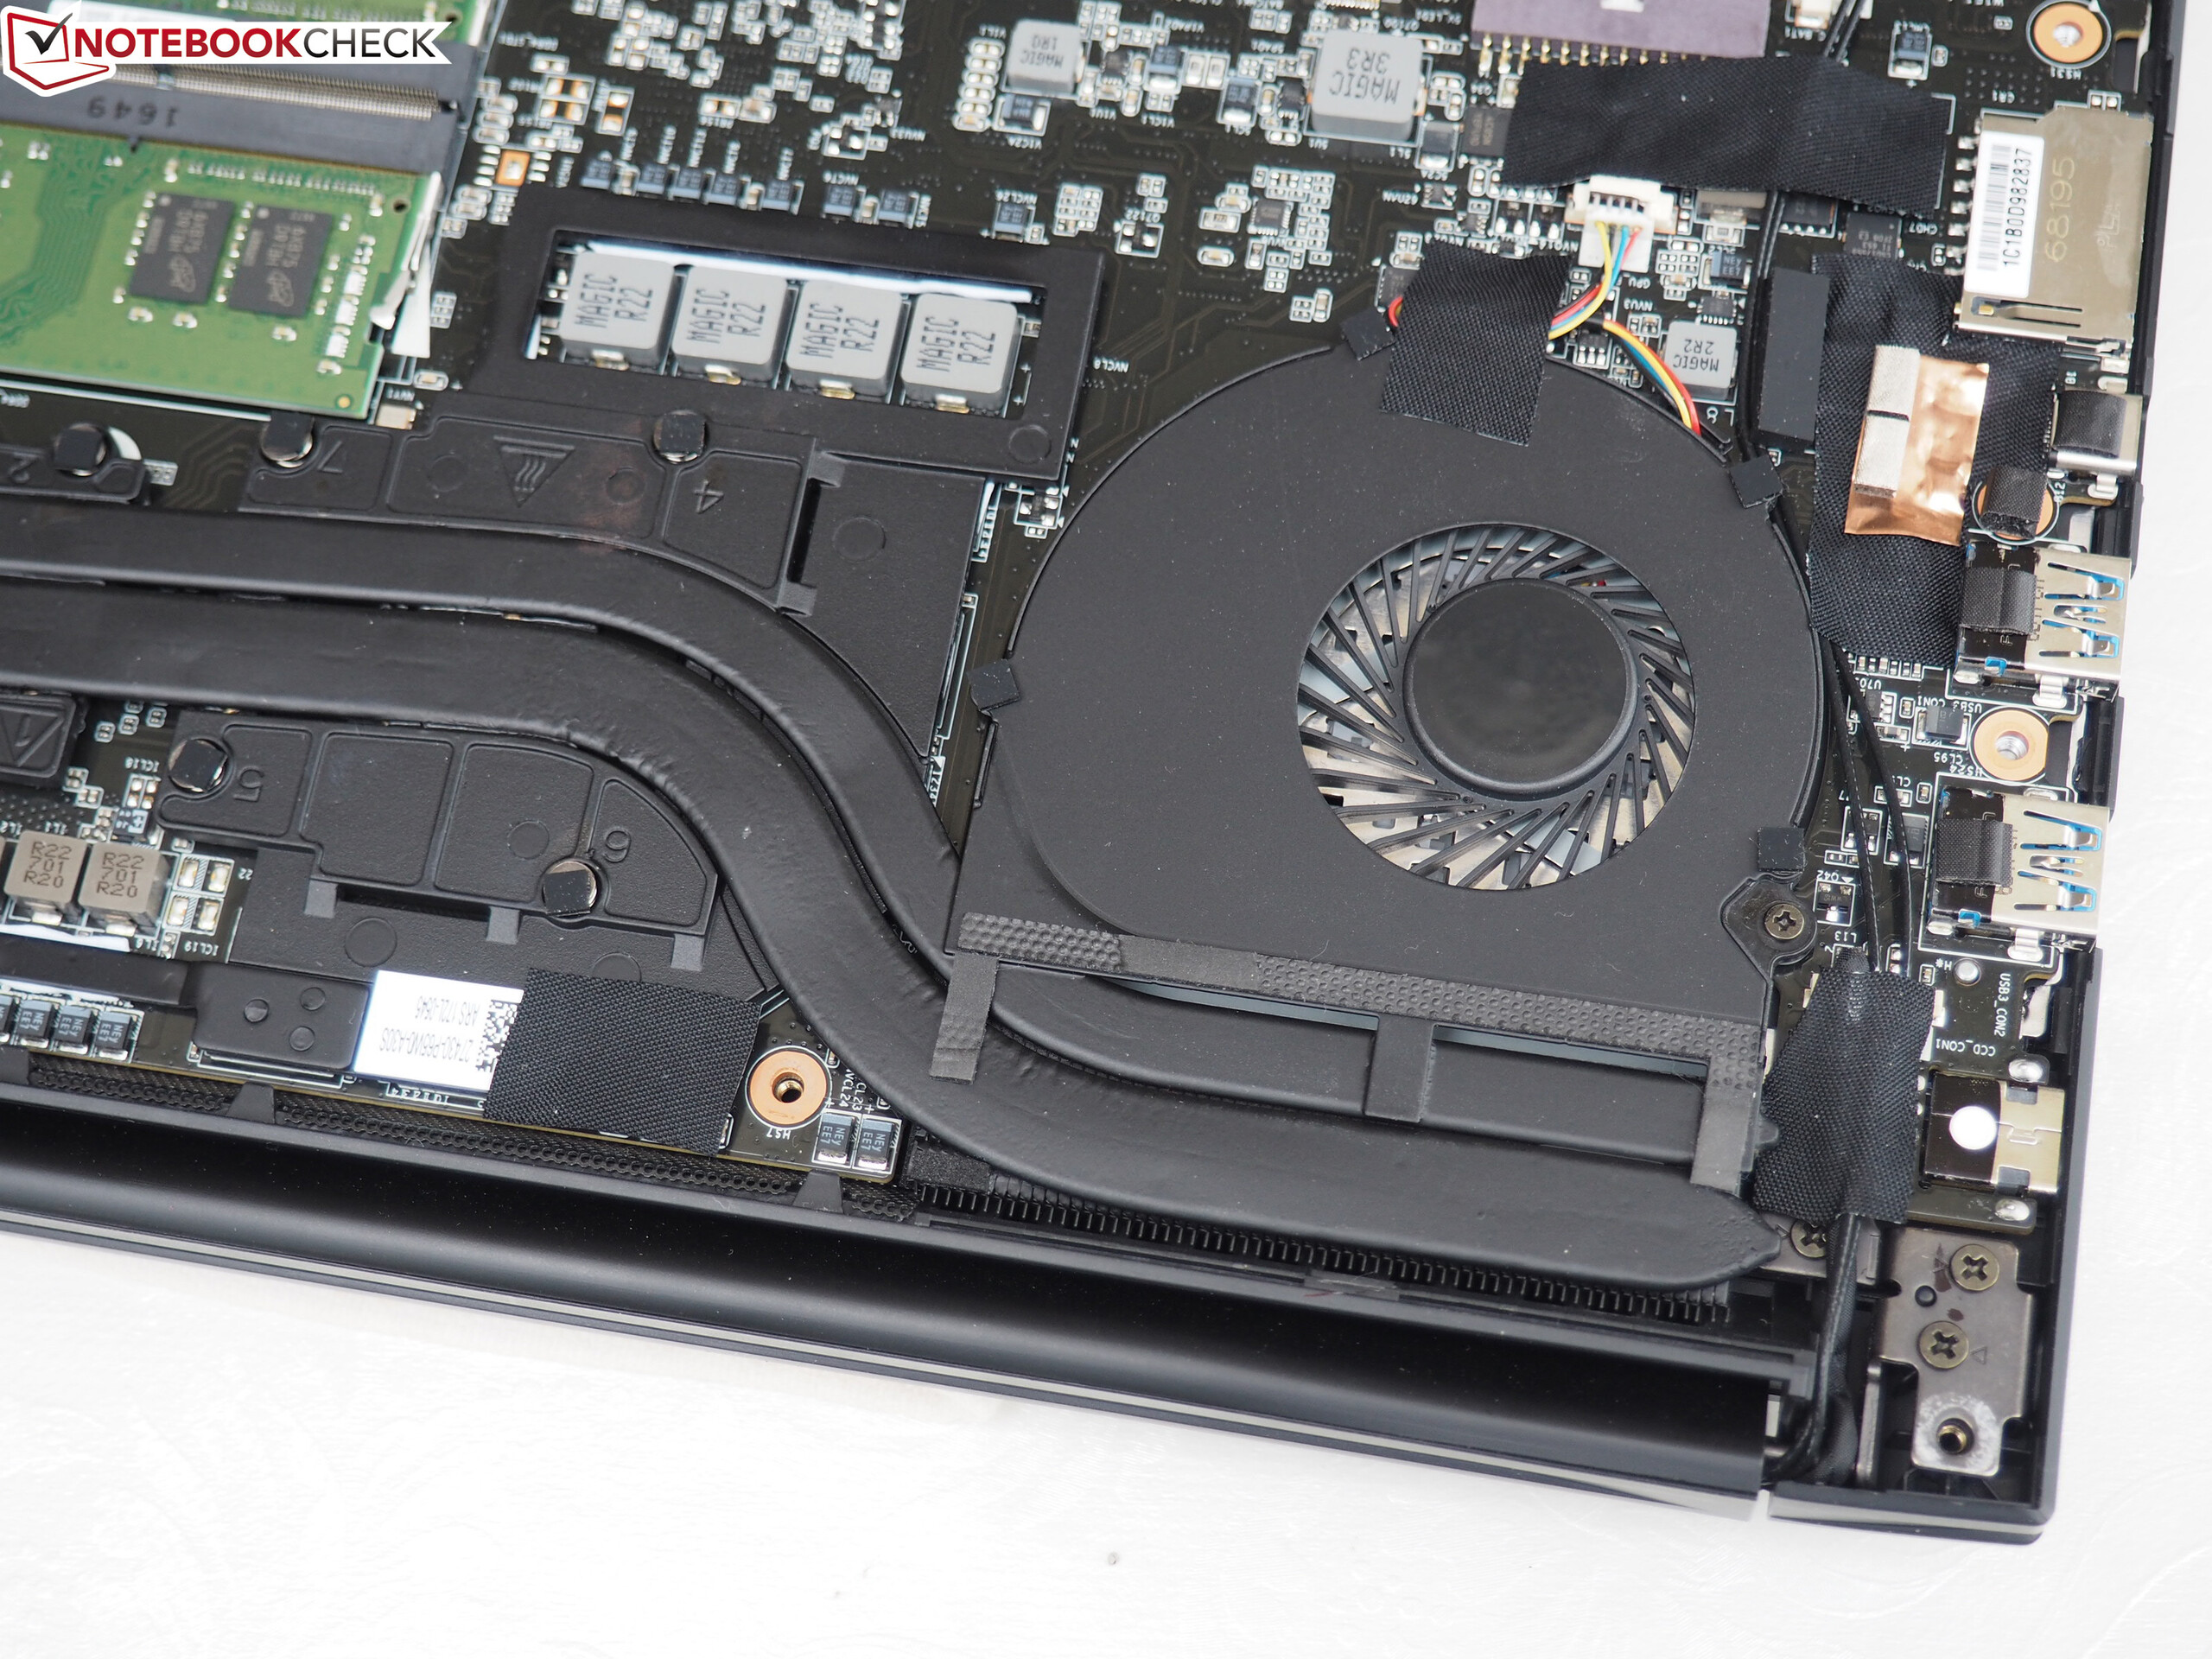
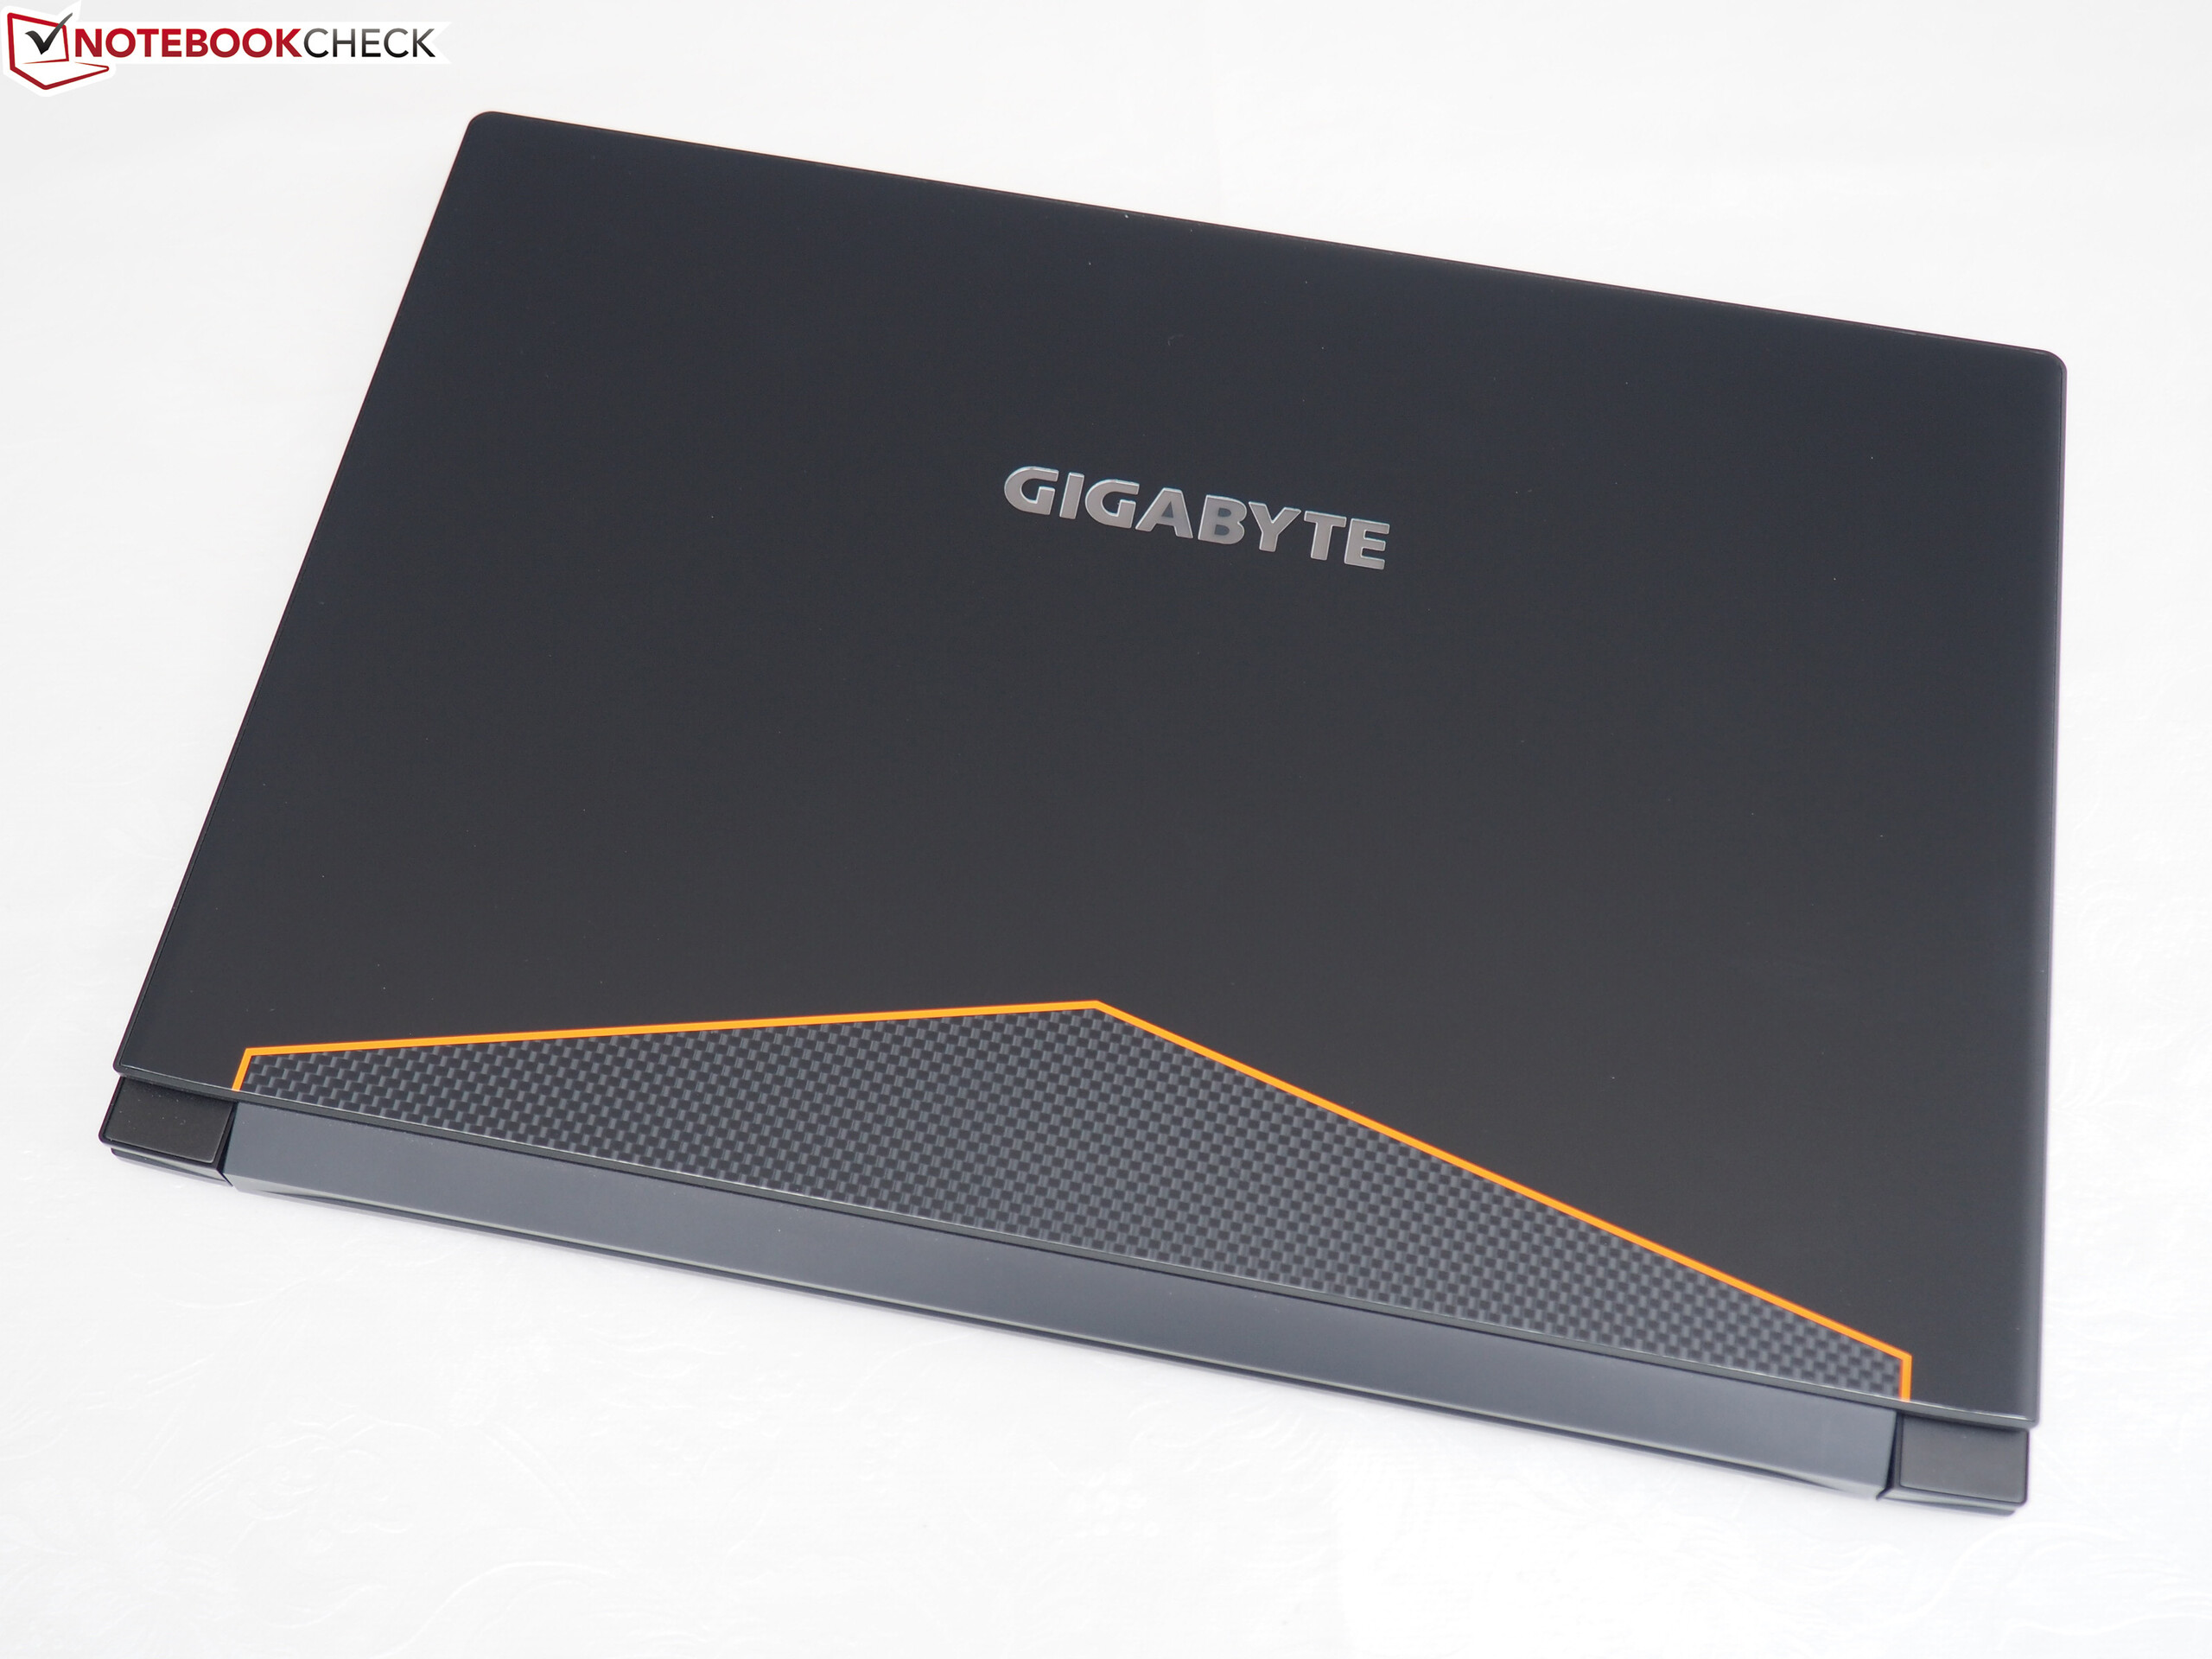
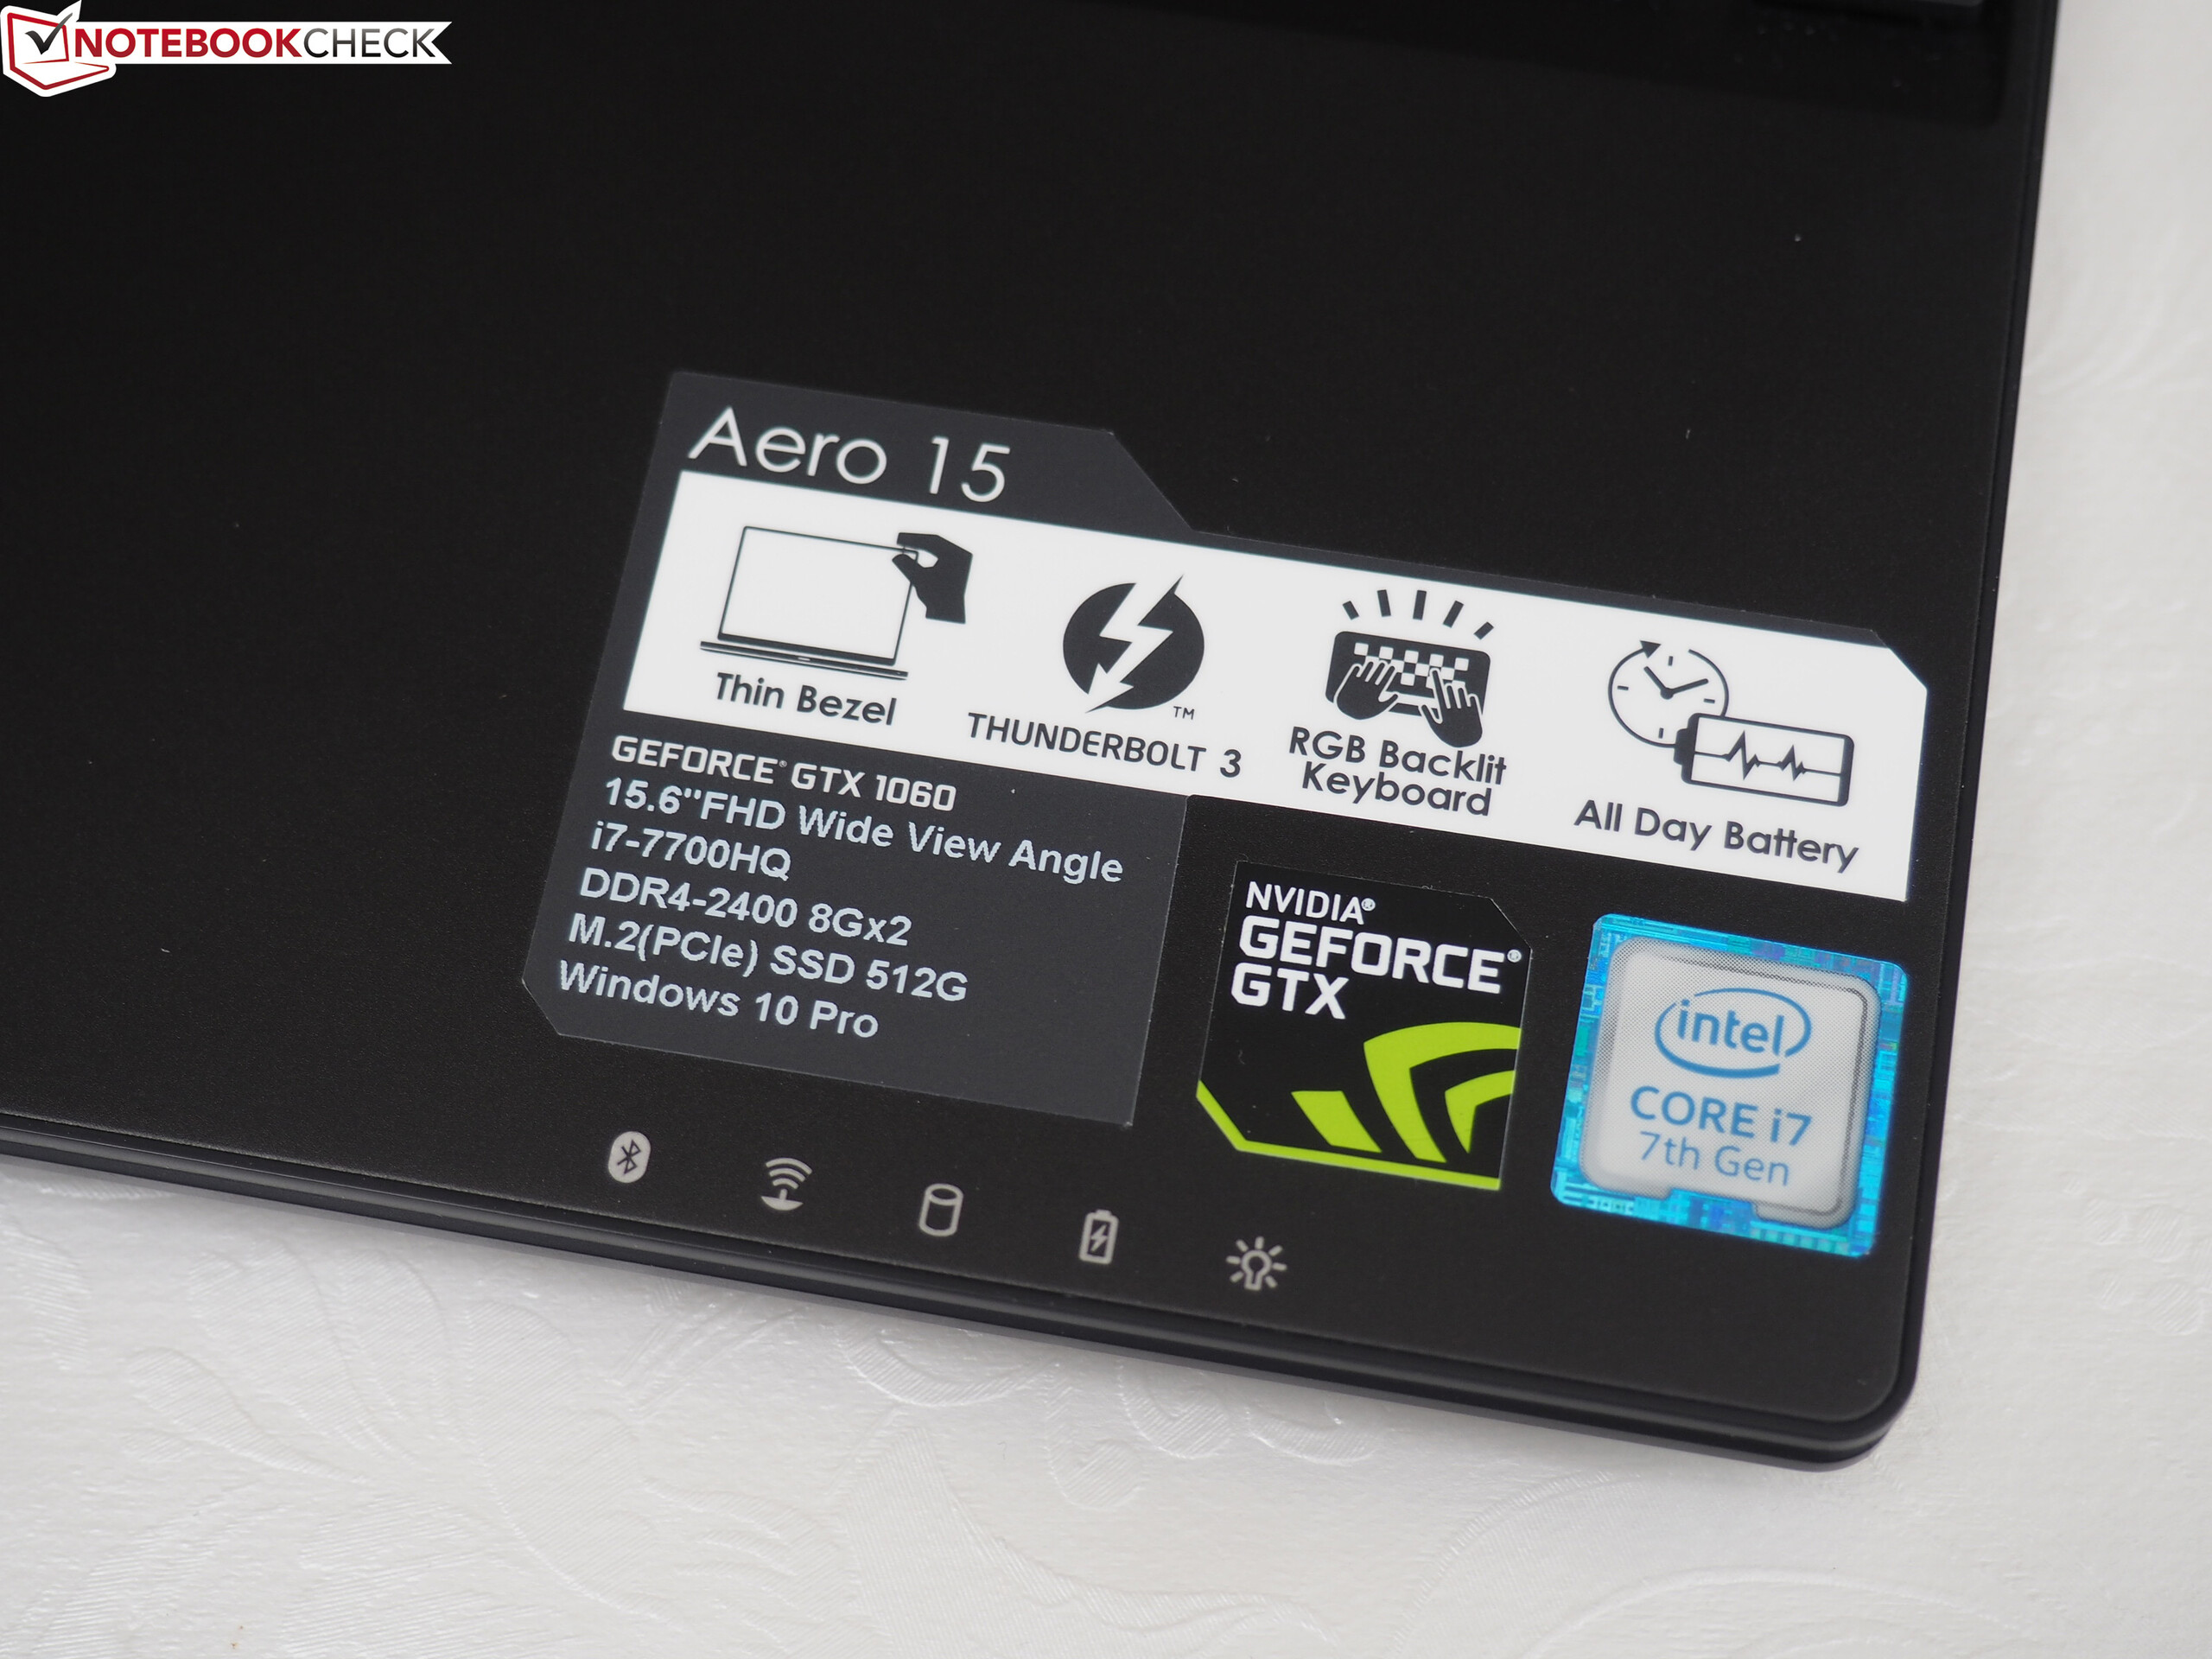
Oavsett om du klassificerar Aero 15 som en allround-maskin eller en speldator har Gigabyte tagit ett viktigt steg i sin utveckling av bärbara datorer. Den extremt tunna 15-tumsdatorn (19 mm) kan nå en topplacering i både multimedia- och spelkategorierna.
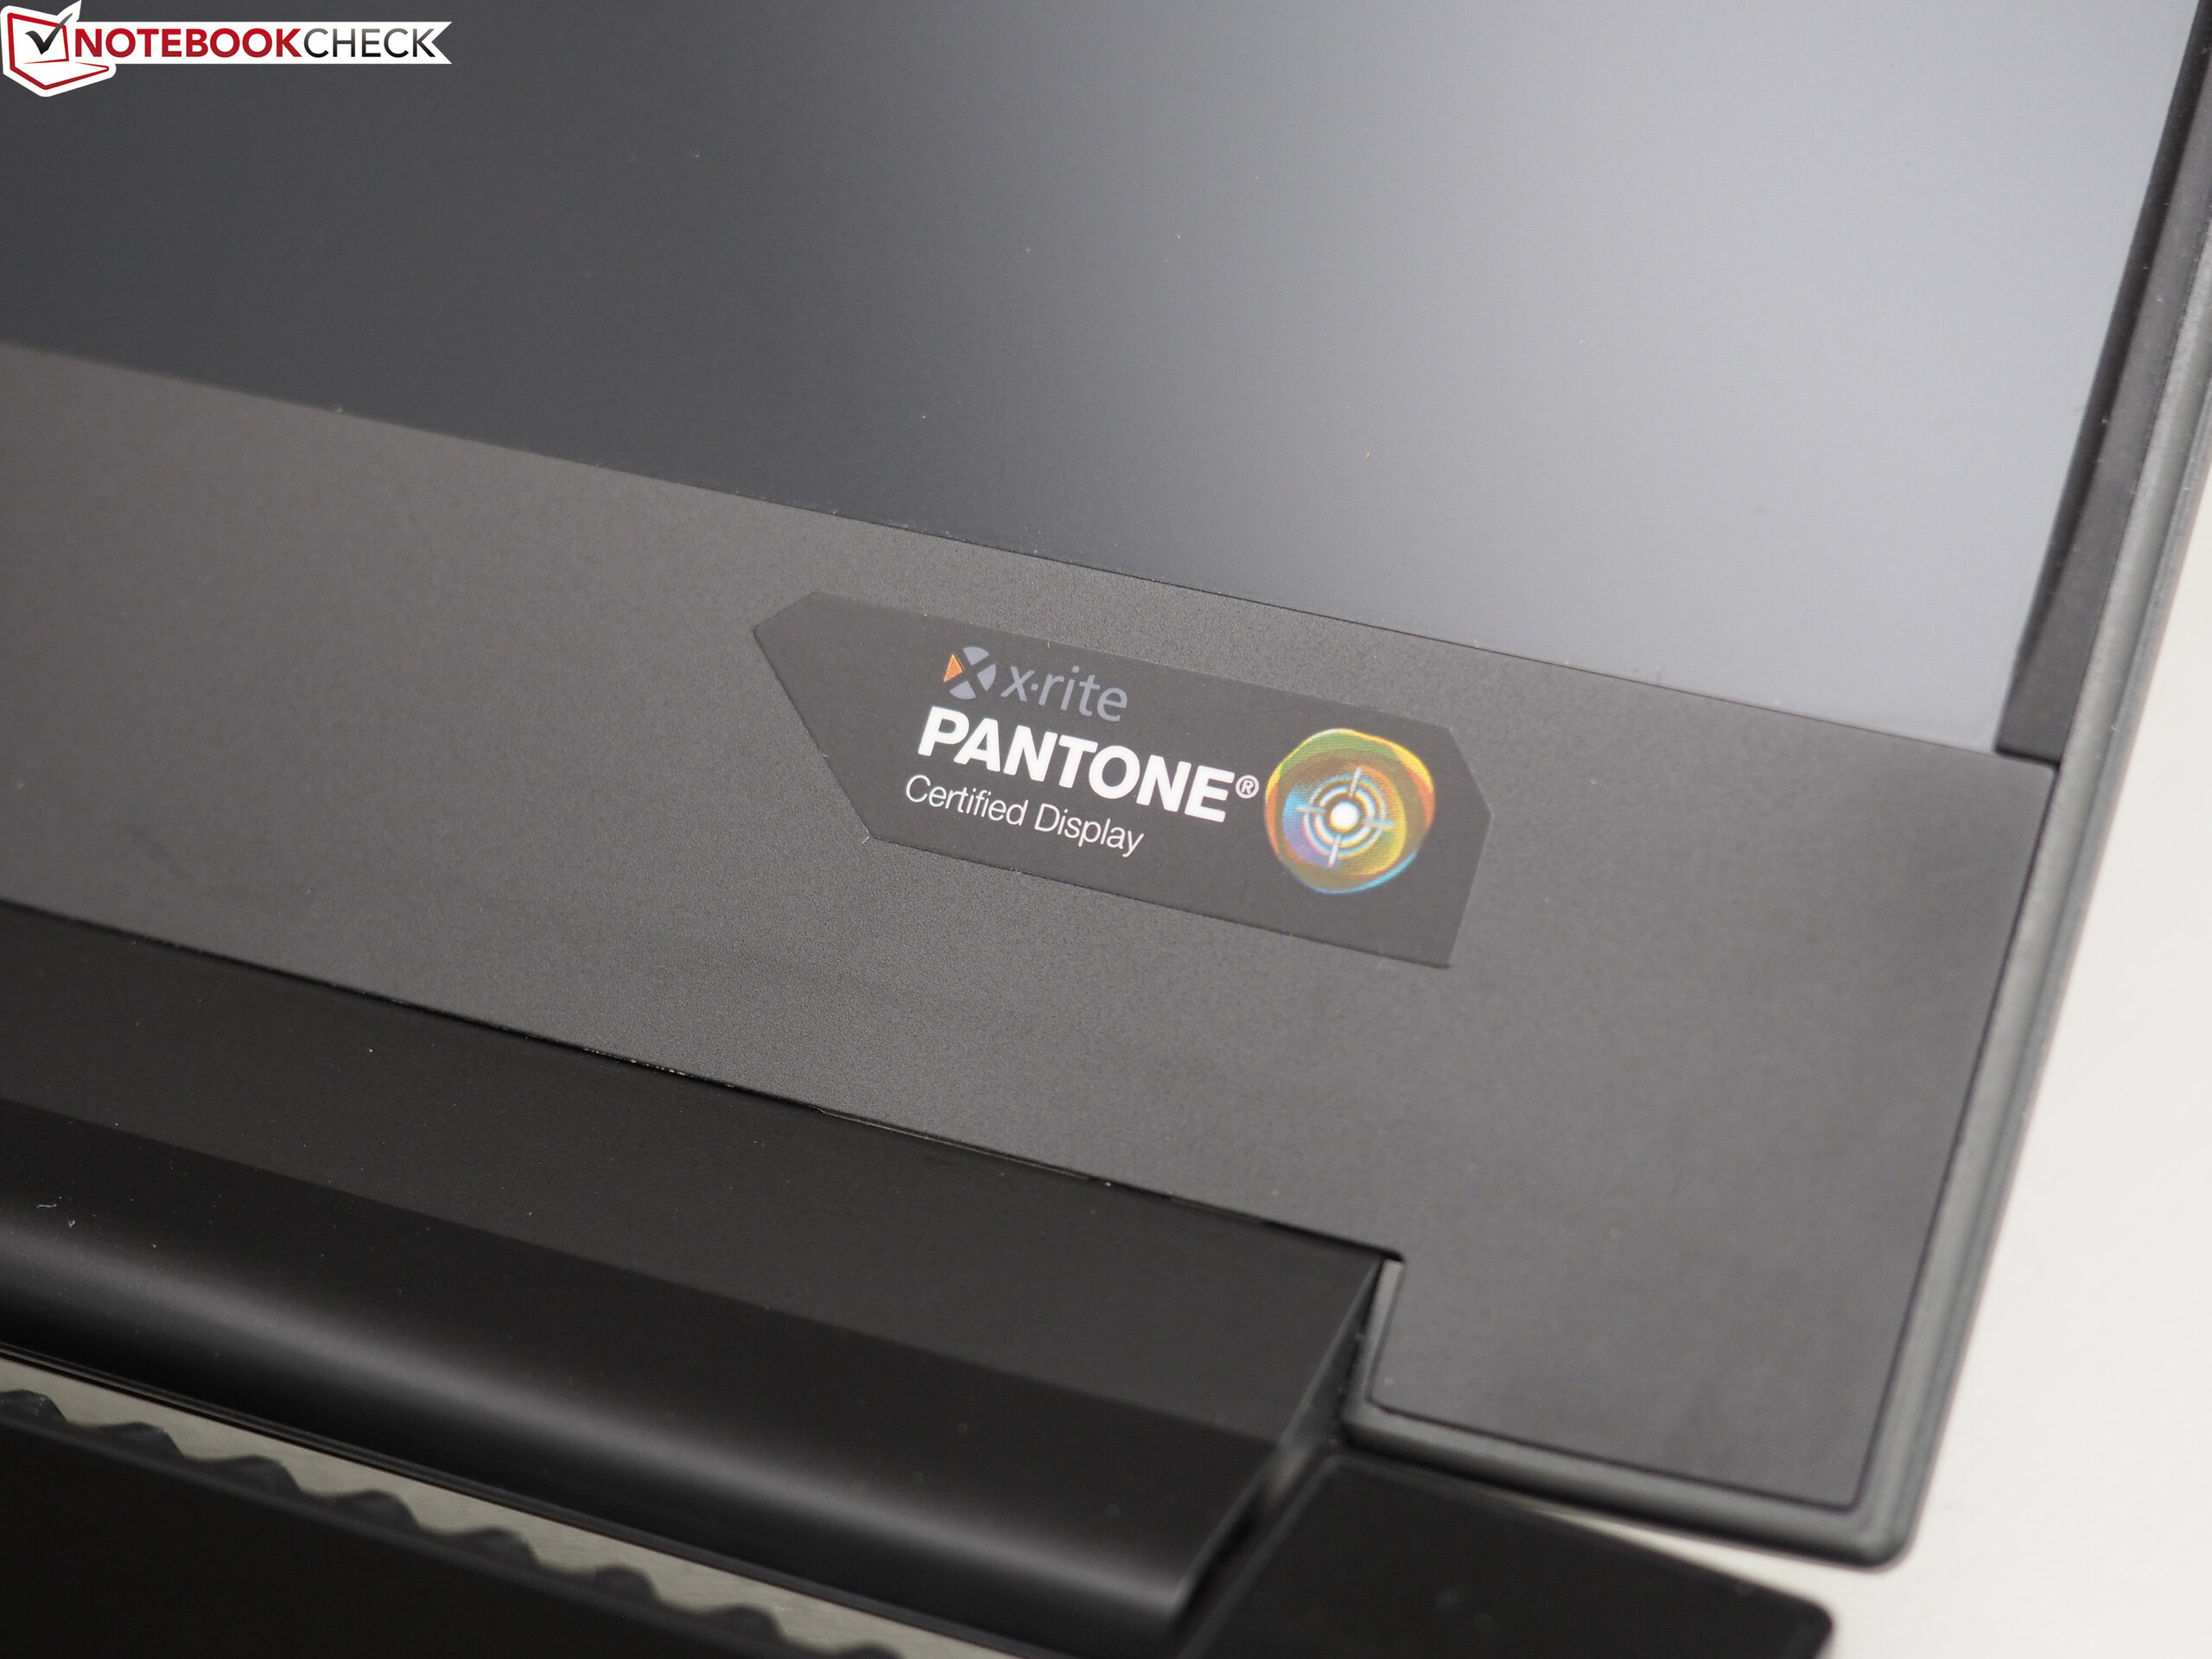
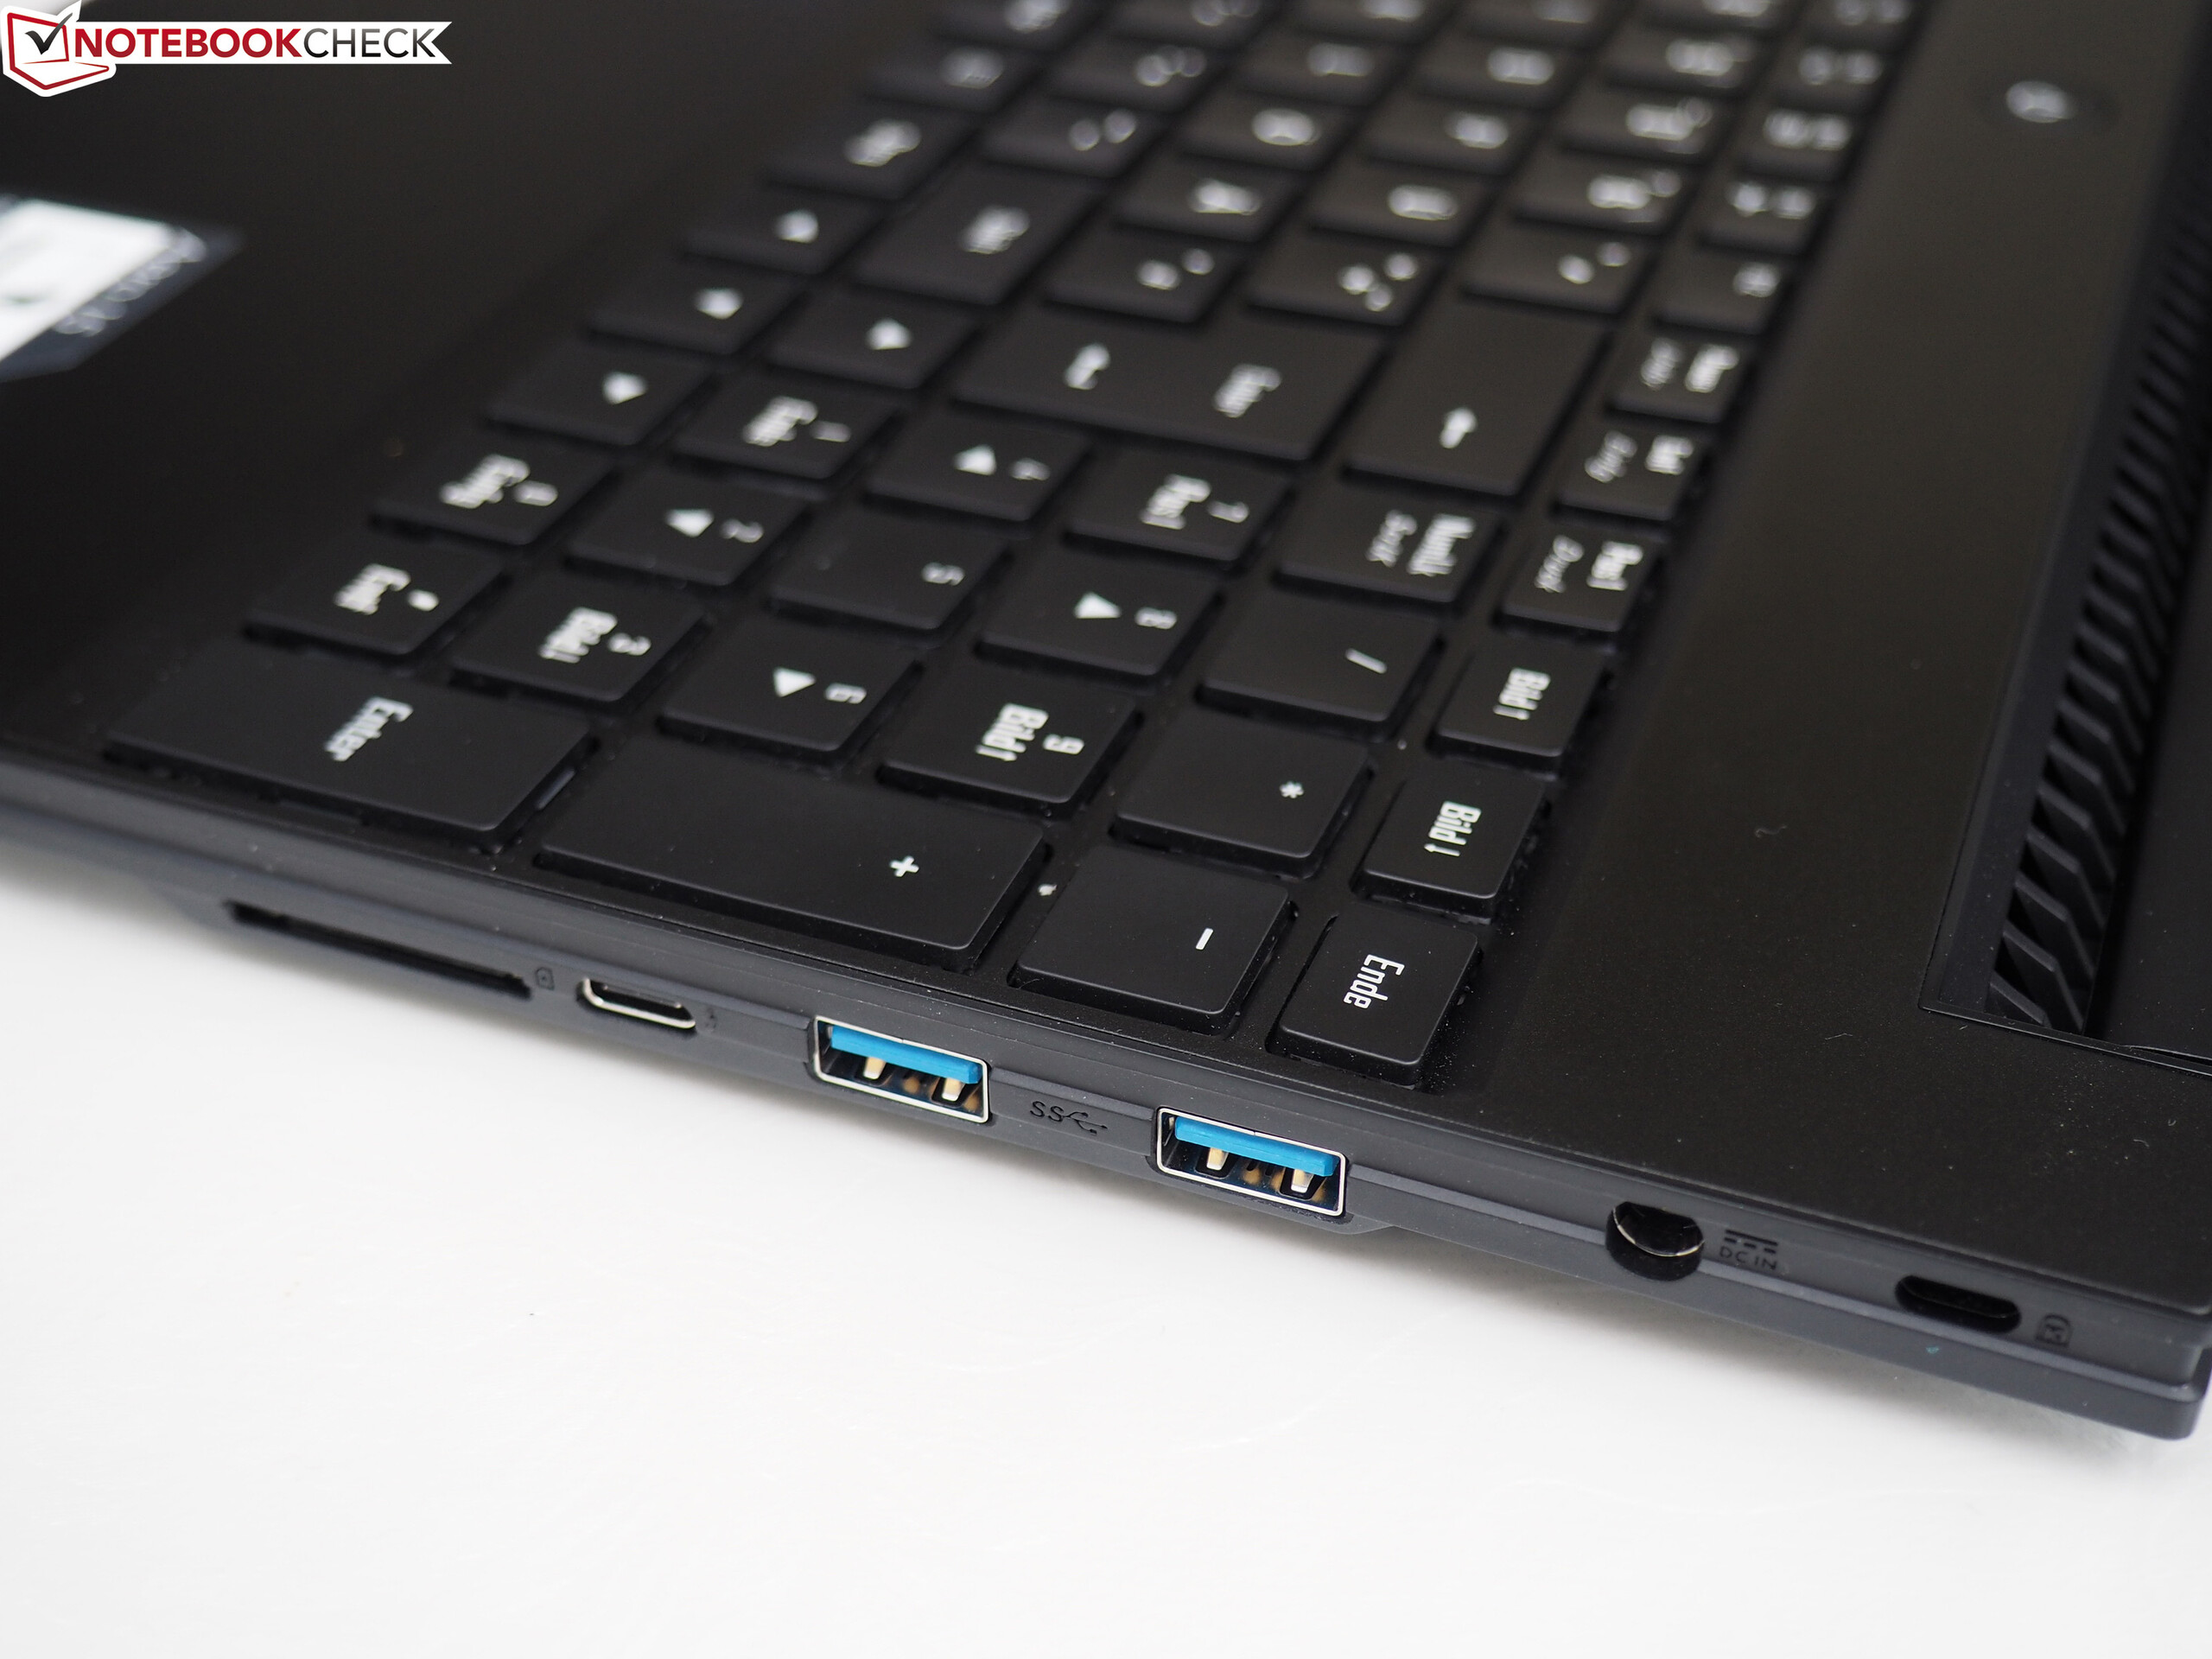
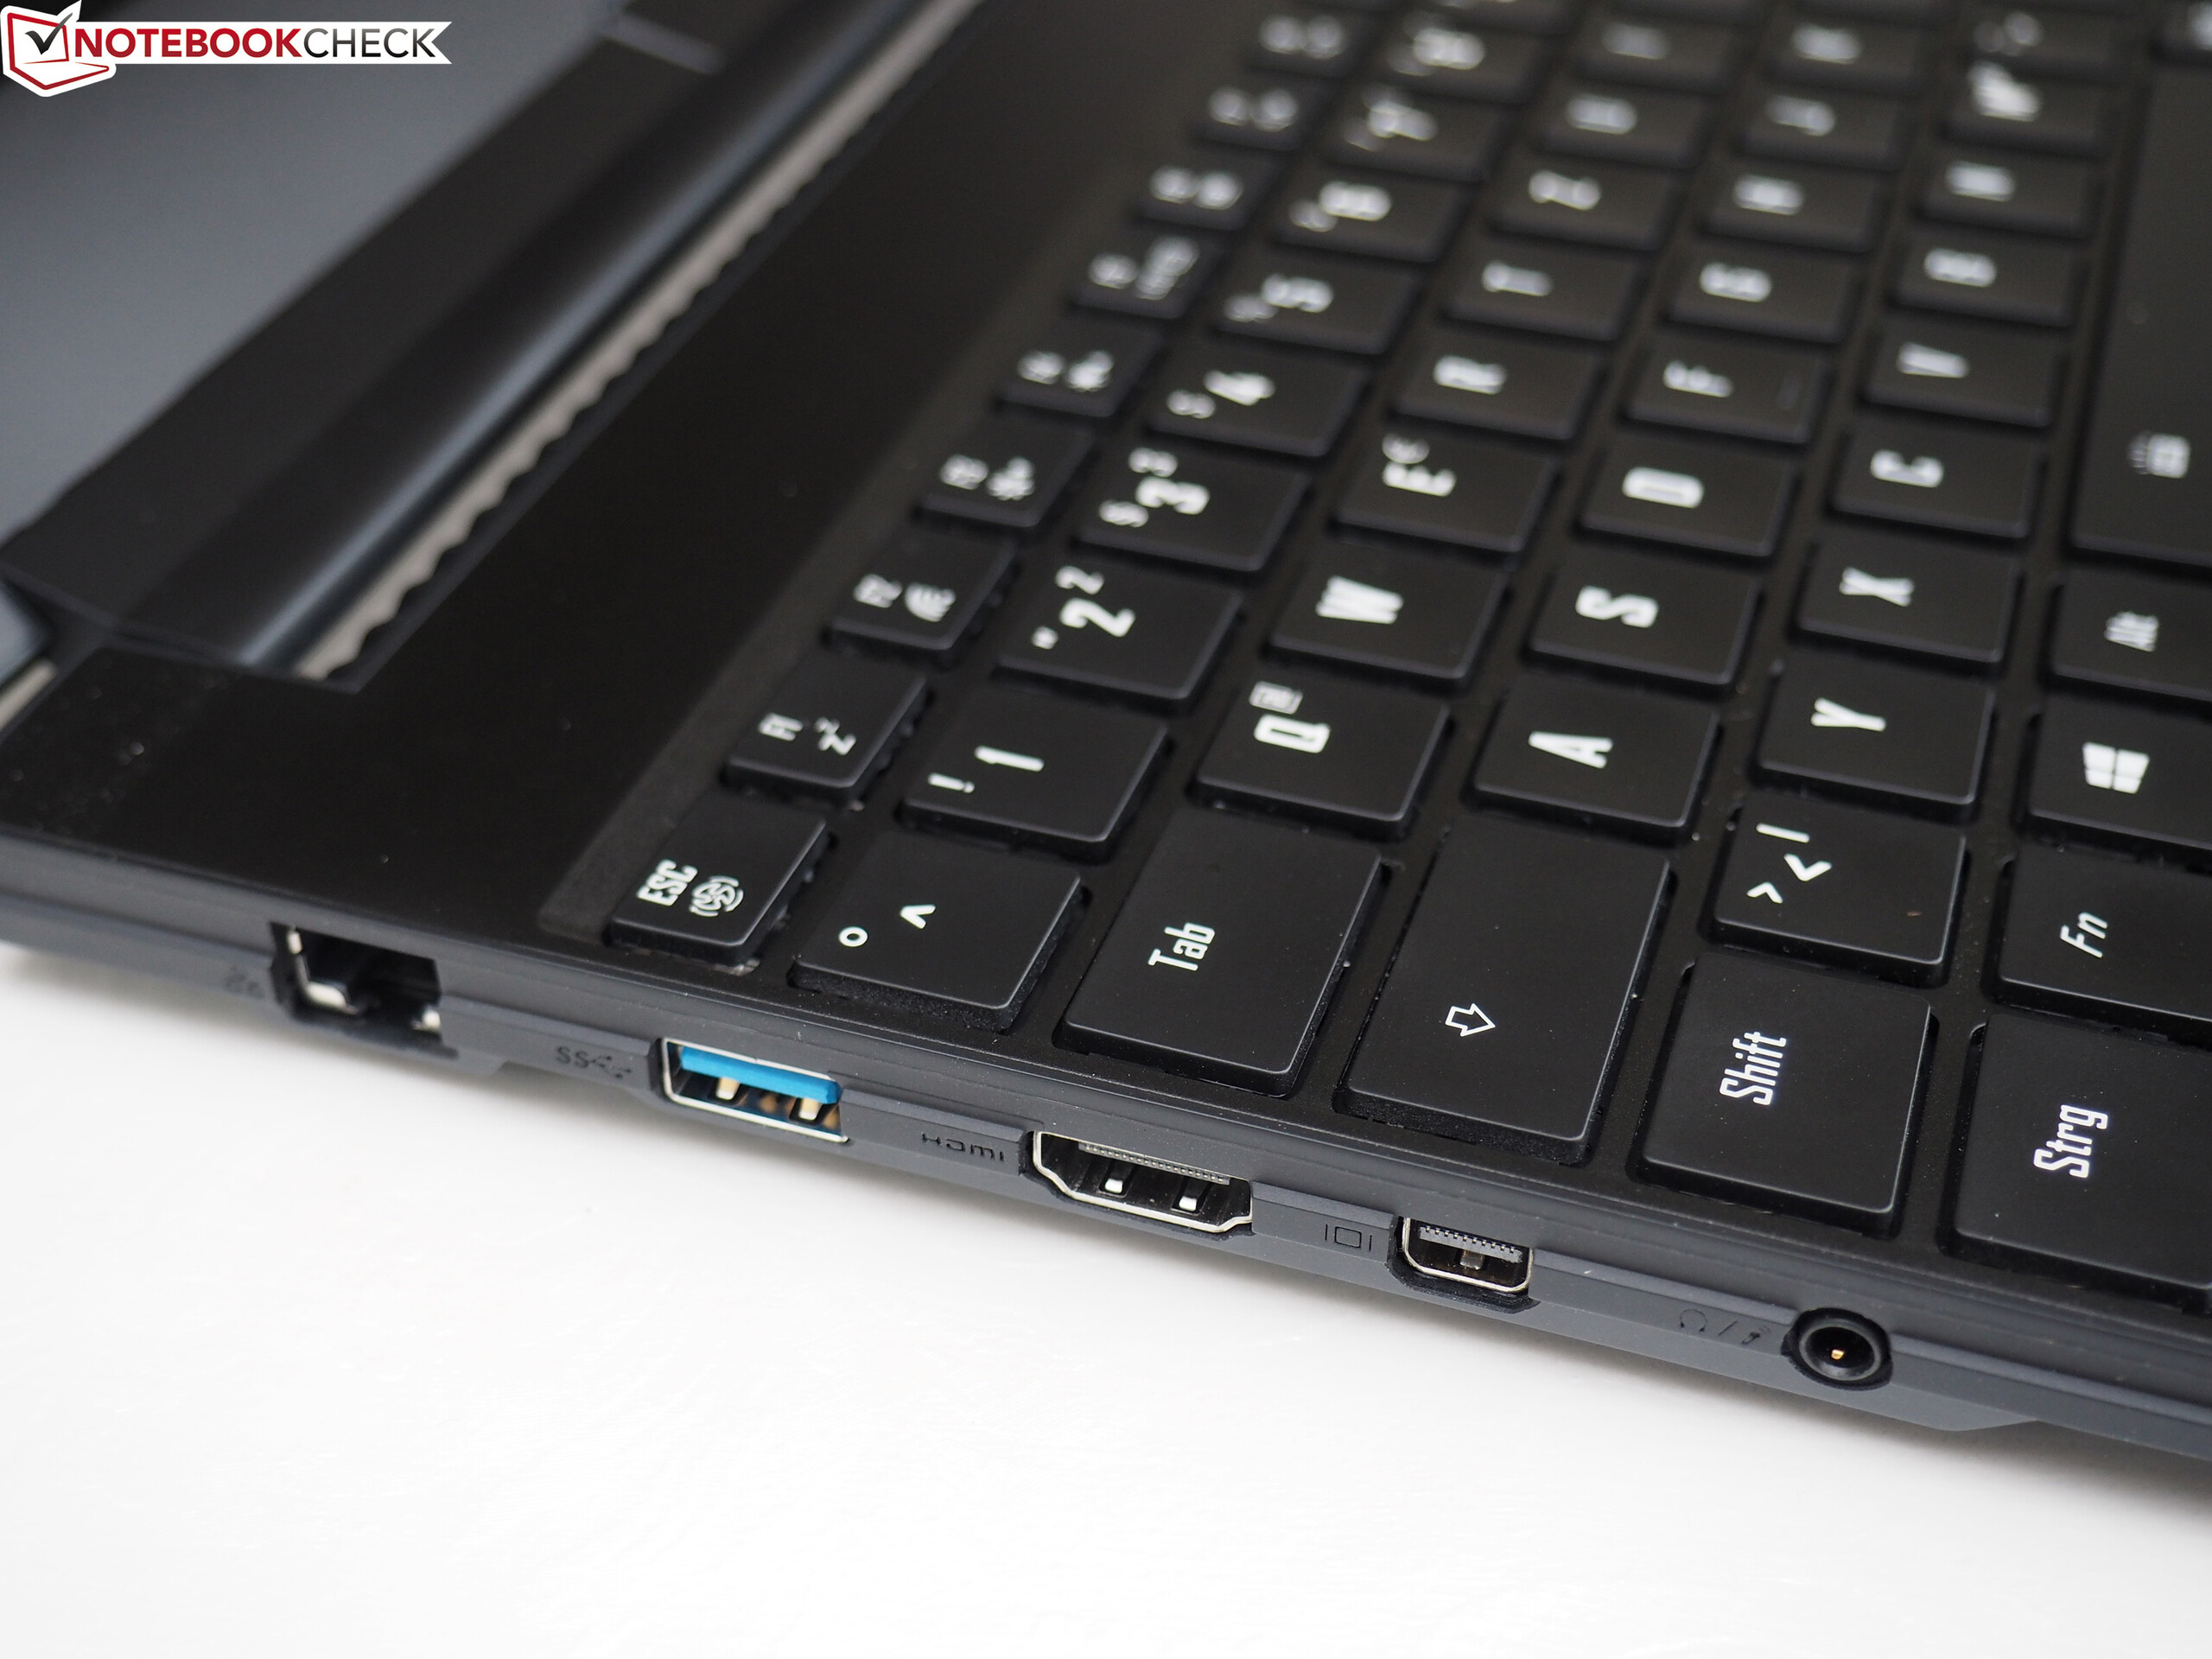
Inte bara hårdvaran är välbalanserad, utan också viss funktionalitet – som bara i undantagsfall återfinns i konkurrenterna – bidrar till vårt positiva intryck av Aero 15. Skärmen är kalibrerad från fabrik och Gigabyte har äntligen inkluderat en Thunderbolt 3-port, vilket förtjänar lovord. Batteritiden är också respektabel; bara några få bärbara datorer i prestandaklassen klarar 7–8 timmars normal Windowsanvändning.
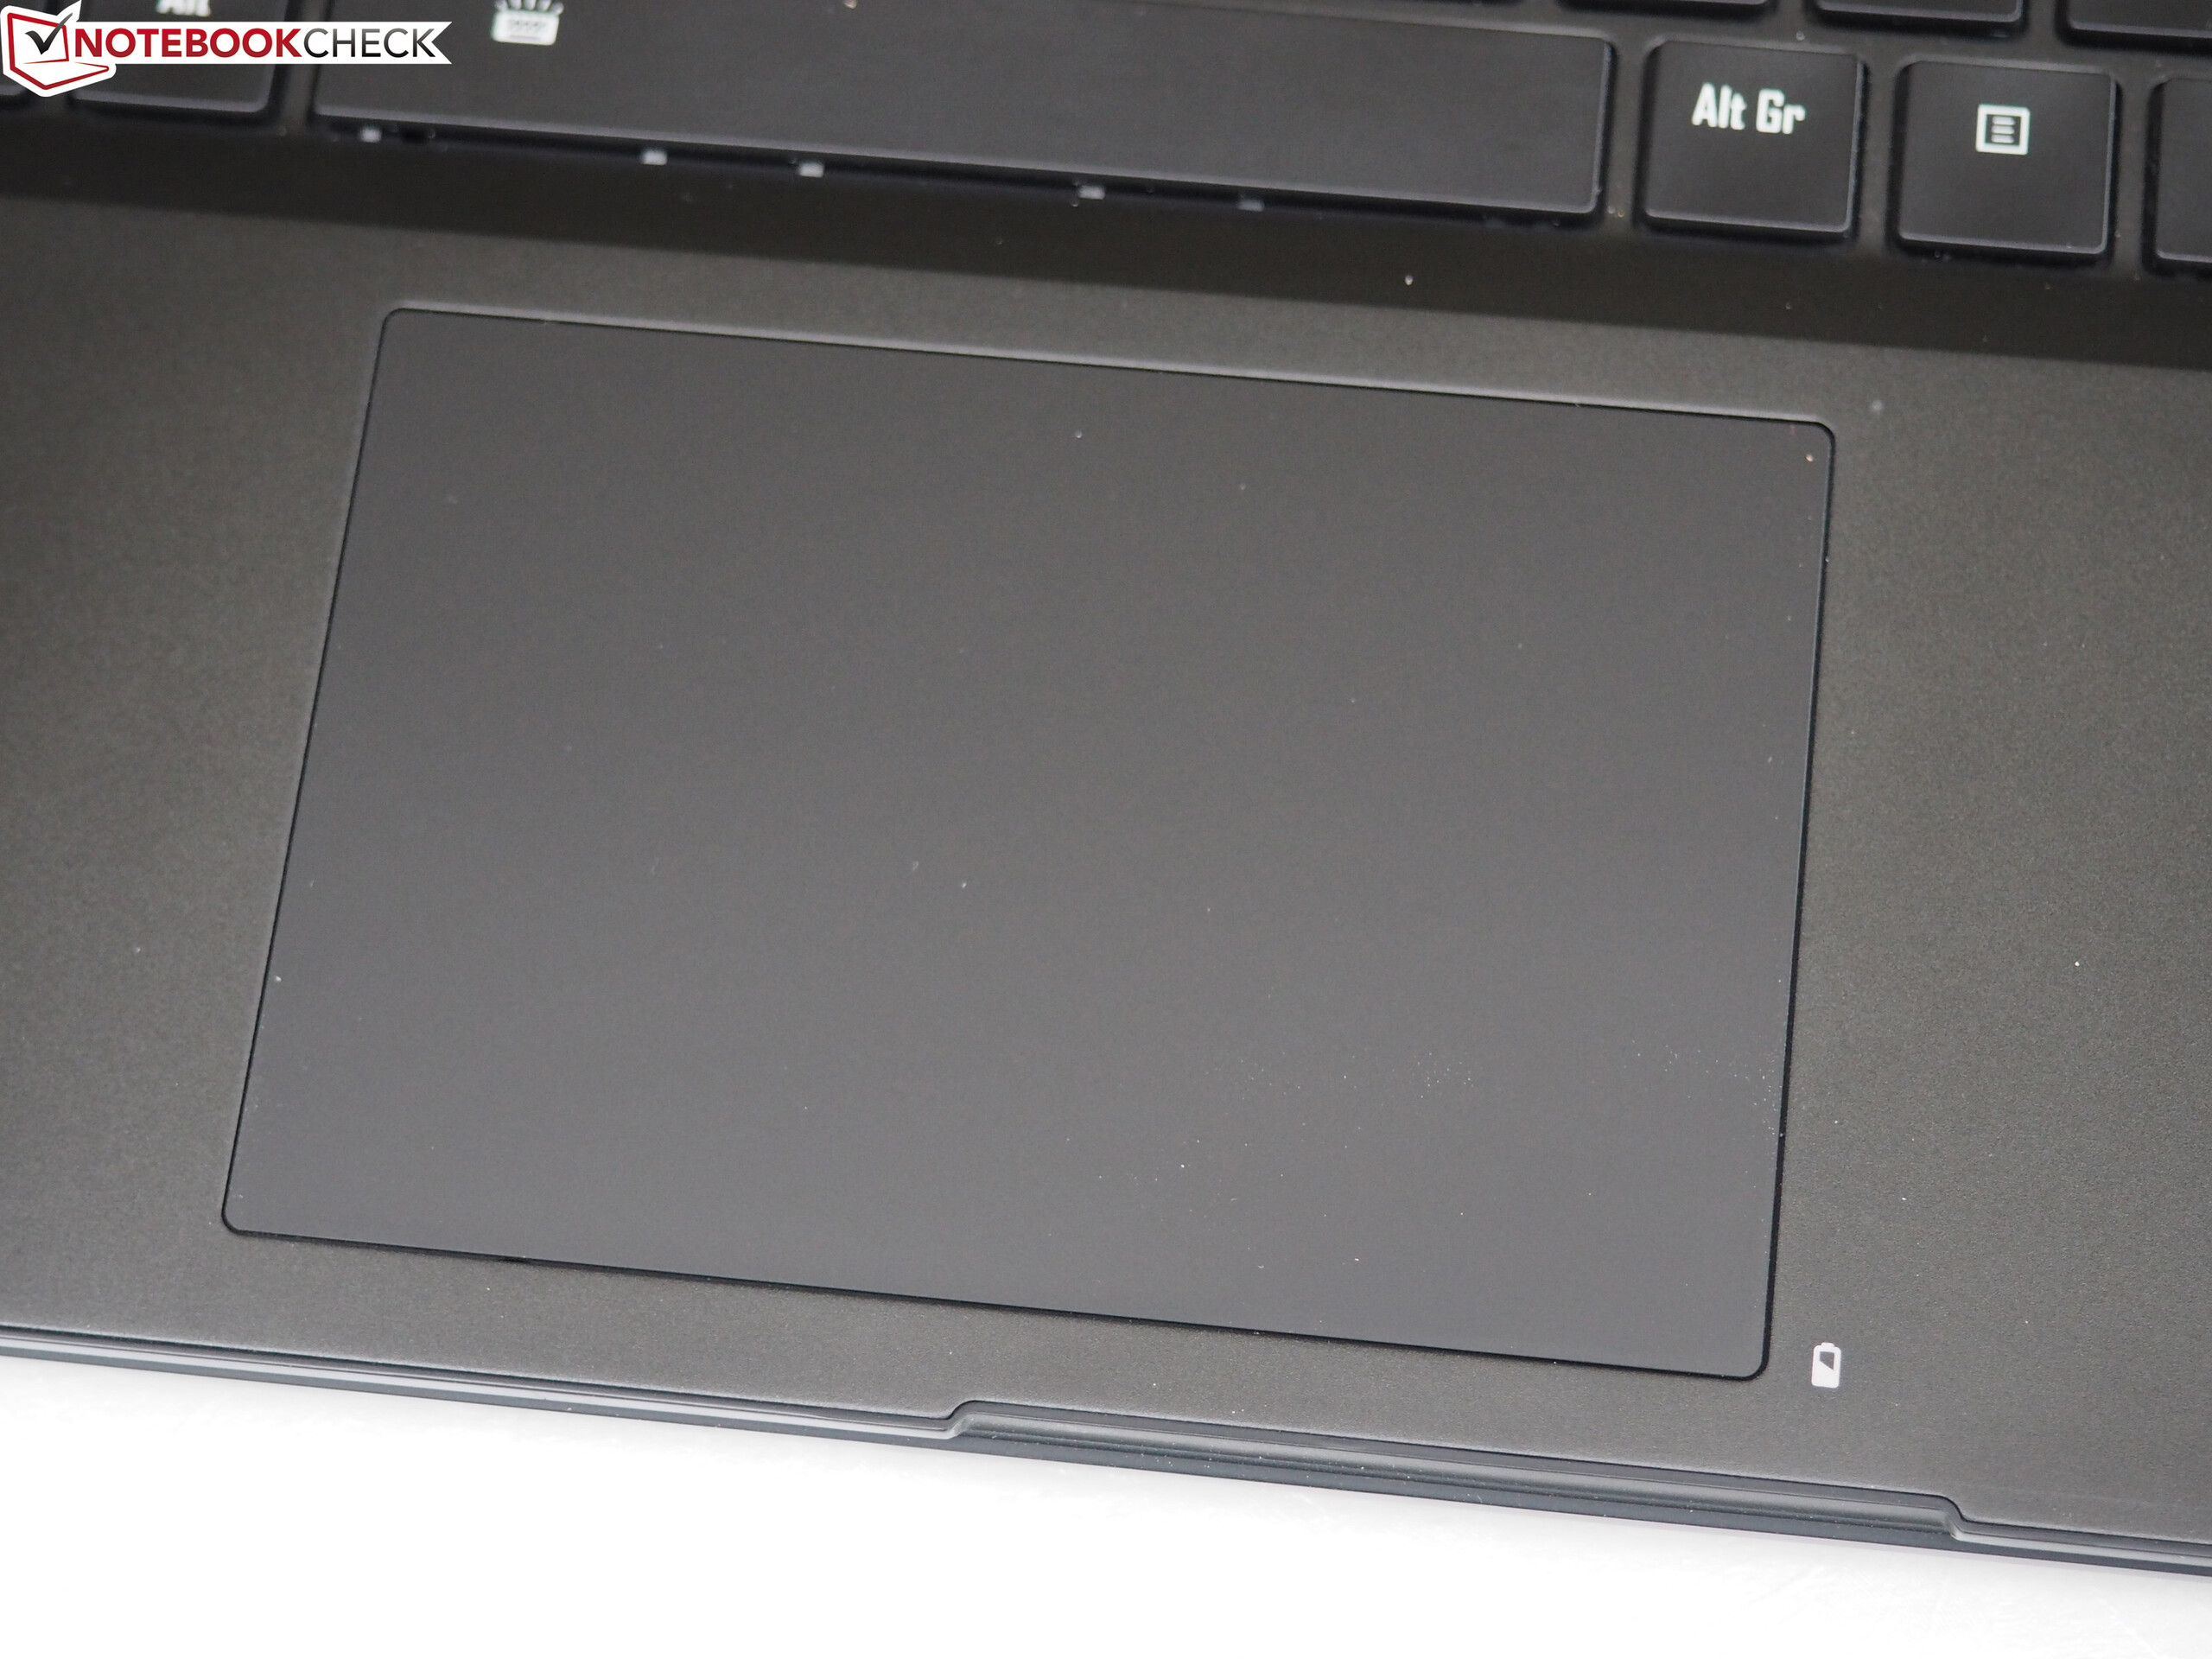
Vi har knappt något att invända mot. Utöver den medelmåttiga ljudkvaliteten måste vi också kritisera det höga priset och den inte helt tillförlitliga pekplattan.
På det stora hela är Aero 15 en värdig utmanare för konkurrenter som Dell XPS 15, Razer Blade 2017 och Acer V15 Nitro.
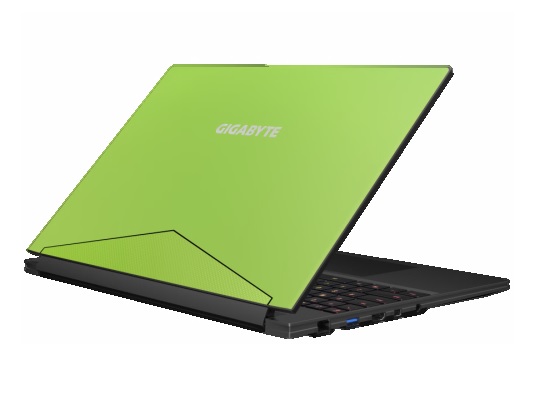
Gigabyte Aero 15
- 05/02/2017 v6 (old)
Florian Glaser
Price comparison