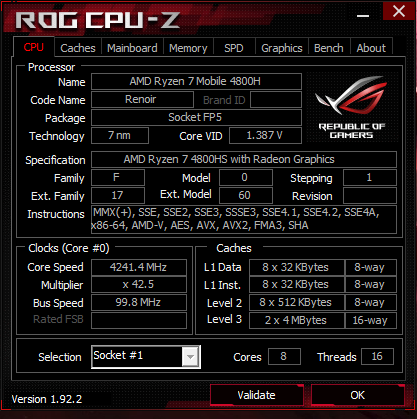
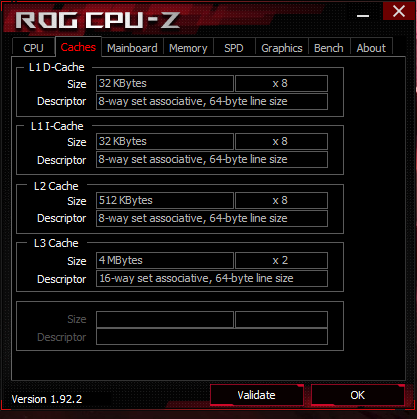
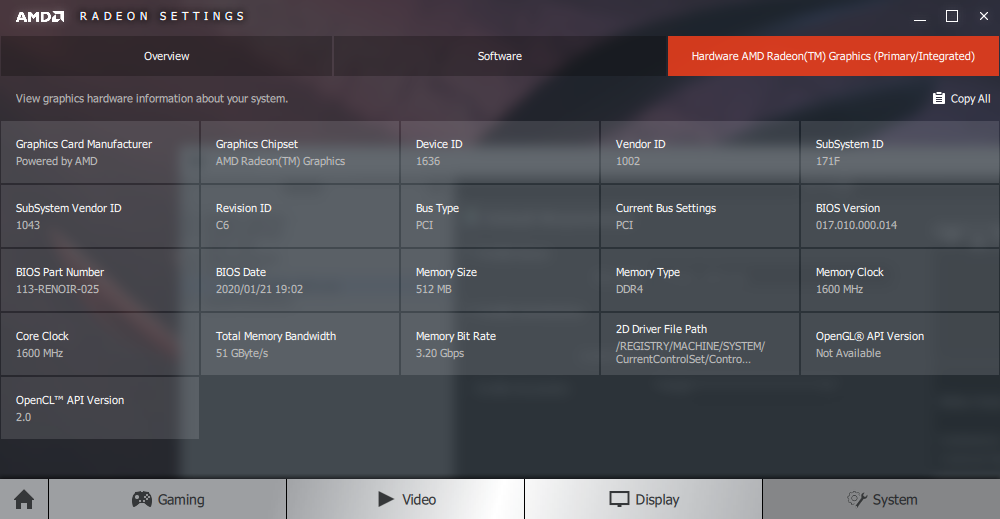
Test: Asus Zephyrus G15 GA502IU - Debut för AMD Ryzen 7 4800HS (Sammanfattning)
Gradering | Datum | Modell | Vikt | Höjd | Storlek | Upplösning | Pris |
|---|---|---|---|---|---|---|---|
| 81.2 % v7 (old) | 09/2020 | Asus ROG Zephyrus G15 GA502IU-ES76 R7 4800HS, GeForce GTX 1660 Ti Max-Q | 2.1 kg | 19.9 mm | 15.60" | 1920x1080 | |
| 84.5 % v7 (old) | 07/2020 | Asus ROG Zephyrus Duo 15 GX550LXS i9-10980HK, GeForce RTX 2080 Super Max-Q | 2.5 kg | 20 mm | 15.60" | 3840x2160 | |
| 83.3 % v6 (old) | 06/2019 | Asus ROG Zephyrus G15 GA502DU R7 3750H, GeForce GTX 1660 Ti Max-Q | 2.1 kg | 20.4 mm | 15.60" | 1920x1080 | |
| 86.9 % v7 (old) | Razer Blade 15 RTX 2070 Super Max-Q i7-10875H, GeForce RTX 2070 Super Max-Q | 2.1 kg | 17.8 mm | 15.60" | 1920x1080 | ||
| 83.3 % v7 (old) | 07/2020 | Lenovo Legion 5 15IMH05H i5-10300H, GeForce RTX 2060 Mobile | 2.5 kg | 26.1 mm | 15.60" | 1920x1080 | |
| 82.5 % v7 (old) | 08/2020 | MSI GS66 Stealth 10SE-045 i7-10750H, GeForce RTX 2060 Mobile | 2.2 kg | 19.8 mm | 15.60" | 1920x1080 | |
| 82.6 % v7 (old) | Eluktronics RP-15 R7 4800H, GeForce RTX 2060 Mobile | 1.9 kg | 20 mm | 15.60" | 1920x1080 |
| Networking | |
| iperf3 transmit AX12 | |
| Eluktronics RP-15 | |
| MSI GS66 Stealth 10SE-045 | |
| Asus ROG Zephyrus Duo 15 GX550LXS | |
| Razer Blade 15 RTX 2070 Super Max-Q | |
| Asus ROG Zephyrus G15 GA502IU-ES76 | |
| Lenovo Legion 5 15IMH05H | |
| iperf3 receive AX12 | |
| Eluktronics RP-15 | |
| Razer Blade 15 RTX 2070 Super Max-Q | |
| MSI GS66 Stealth 10SE-045 | |
| Asus ROG Zephyrus Duo 15 GX550LXS | |
| Asus ROG Zephyrus G15 GA502IU-ES76 | |
| Lenovo Legion 5 15IMH05H | |
| |||||||||||||||||||||||||
Distribution av ljusstyrkan: 89 %
Mitt på batteriet: 255.9 cd/m²
Kontrast: 1163:1 (Svärta: 0.22 cd/m²)
ΔE ColorChecker Calman: 5.15 | ∀{0.5-29.43 Ø4.73}
calibrated: 4.83
ΔE Greyscale Calman: 4.2 | ∀{0.09-98 Ø4.97}
58% sRGB (Argyll 1.6.3 3D)
36.9% AdobeRGB 1998 (Argyll 1.6.3 3D)
40.22% AdobeRGB 1998 (Argyll 3D)
58.5% sRGB (Argyll 3D)
38.9% Display P3 (Argyll 3D)
Gamma: 2.16
CCT: 7500 K
| Asus ROG Zephyrus G15 GA502IU-ES76 Panda LM156LF-2F01, IPS, 15.6", 1920x1080 | Asus ROG Zephyrus Duo 15 GX550LXS AU Optronics B156ZAN03.1, IPS, 15.6", 3840x2160 | Asus ROG Zephyrus G15 GA502DU Panda LM156LF-CL03, IPS, 15.6", 1920x1080 | Razer Blade 15 RTX 2070 Super Max-Q AU Optronics B156HAN12.0, IPS, 15.6", 1920x1080 | Lenovo Legion 5 15IMH05H BOE CQ NV156FHM-NX1, IPS, 15.6", 1920x1080 | MSI GS66 Stealth 10SE-045 Sharp LQ156M1JW03, IPS, 15.6", 1920x1080 | Eluktronics RP-15 BOE NV156FHM-N4G, IPS, 15.6", 1920x1080 | |
|---|---|---|---|---|---|---|---|
| Display | 114% | 4% | 74% | -0% | 71% | 61% | |
| Display P3 Coverage (%) | 38.9 | 87 124% | 40.33 4% | 69.4 78% | 38.8 0% | 67.5 74% | 63.7 64% |
| sRGB Coverage (%) | 58.5 | 100 71% | 60.6 4% | 98.8 69% | 57.8 -1% | 98.3 68% | 92 57% |
| AdobeRGB 1998 Coverage (%) | 40.22 | 99.9 148% | 41.69 4% | 70.5 75% | 40.09 0% | 68.9 71% | 65.2 62% |
| Response Times | -63% | -24% | 78% | 14% | 55% | 45% | |
| Response Time Grey 50% / Grey 80% * (ms) | 24.4 ? | 56.4 ? -131% | 34 ? -39% | 3.2 ? 87% | 26 ? -7% | 12 ? 51% | 17.2 ? 30% |
| Response Time Black / White * (ms) | 25.6 ? | 24.4 ? 5% | 28 ? -9% | 8 ? 69% | 17 ? 34% | 10.4 ? 59% | 10.4 ? 59% |
| PWM Frequency (Hz) | 21280 ? | 23580 ? | |||||
| Screen | 57% | -4% | 30% | 6% | 28% | 13% | |
| Brightness middle (cd/m²) | 255.9 | 398 56% | 240.1 -6% | 345.4 35% | 301 18% | 272 6% | 298.6 17% |
| Brightness (cd/m²) | 246 | 385 57% | 231 -6% | 342 39% | 277 13% | 259 5% | 289 17% |
| Brightness Distribution (%) | 89 | 90 1% | 85 -4% | 90 1% | 77 -13% | 91 2% | 90 1% |
| Black Level * (cd/m²) | 0.22 | 0.28 -27% | 0.34 -55% | 0.34 -55% | 0.26 -18% | 0.27 -23% | 0.35 -59% |
| Contrast (:1) | 1163 | 1421 22% | 706 -39% | 1016 -13% | 1158 0% | 1007 -13% | 853 -27% |
| Colorchecker dE 2000 * | 5.15 | 1.53 70% | 4.2 18% | 3.18 38% | 5.12 1% | 2.42 53% | 5.01 3% |
| Colorchecker dE 2000 max. * | 17.11 | 3.69 78% | 17.8 -4% | 6.57 62% | 8.86 48% | 6.93 59% | 7.06 59% |
| Colorchecker dE 2000 calibrated * | 4.83 | 0.77 84% | 4.09 15% | 1.77 63% | 4.88 -1% | 0.88 82% | 2.52 48% |
| Greyscale dE 2000 * | 4.2 | 2.4 43% | 2.8 33% | 3.8 10% | 3.47 17% | 4.5 -7% | 5.4 -29% |
| Gamma | 2.16 102% | 2.19 100% | 2.2 100% | 2.15 102% | 2.37 93% | 2.188 101% | 2.54 87% |
| CCT | 7500 87% | 6996 93% | 6925 94% | 7109 91% | 7062 92% | 7369 88% | 7461 87% |
| Color Space (Percent of AdobeRGB 1998) (%) | 36.9 | 100 171% | 38.4 4% | 64.3 74% | 37 0% | 69 87% | 59.1 60% |
| Color Space (Percent of sRGB) (%) | 58 | 100 72% | 60.4 4% | 99 71% | 57 -2% | 91 57% | 91.6 58% |
| Totalt genomsnitt (program/inställningar) | 36% /
53% | -8% /
-5% | 61% /
44% | 7% /
6% | 51% /
39% | 40% /
26% |
* ... mindre är bättre
Visa svarstider
| ↔ Svarstid svart till vitt | ||
|---|---|---|
| 25.6 ms ... stiga ↗ och falla ↘ kombinerat | ↗ 15.2 ms stiga | 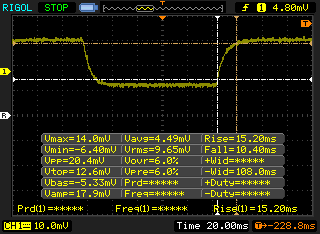 |
| ↘ 10.4 ms hösten | ||
| Skärmen visar relativt långsamma svarsfrekvenser i våra tester och kan vara för långsam för spelare. I jämförelse sträcker sig alla testade enheter från 0.1 (minst) till 240 (maximalt) ms. » 61 % av alla enheter är bättre. Detta innebär att den uppmätta svarstiden är sämre än genomsnittet av alla testade enheter (19.9 ms). | ||
| ↔ Svarstid 50 % grått till 80 % grått | ||
| 24.4 ms ... stiga ↗ och falla ↘ kombinerat | ↗ 11.6 ms stiga | 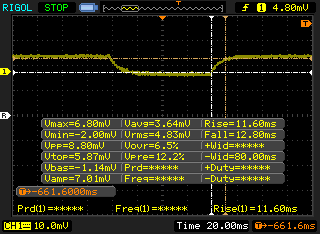 |
| ↘ 12.8 ms hösten | ||
| Skärmen visar bra svarsfrekvens i våra tester, men kan vara för långsam för konkurrenskraftiga spelare. I jämförelse sträcker sig alla testade enheter från 0.165 (minst) till 636 (maximalt) ms. » 35 % av alla enheter är bättre. Det betyder att den uppmätta svarstiden är bättre än genomsnittet av alla testade enheter (31.1 ms). | ||
Skärmflimmer / PWM (Puls-Width Modulation)
| Skärmflimmer / PWM upptäcktes inte | 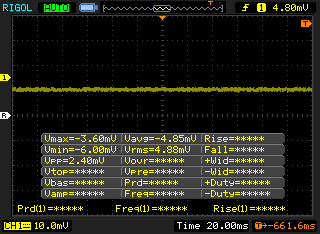 | ||
Som jämförelse: 52 % av alla testade enheter använder inte PWM för att dämpa skärmen. Om PWM upptäcktes mättes ett medelvärde av 7794 (minst: 5 - maximum: 343500) Hz. | |||
Cinebench R15: CPU Multi 64Bit | CPU Single 64Bit
Blender: v2.79 BMW27 CPU
7-Zip 18.03: 7z b 4 -mmt1 | 7z b 4
Geekbench 5.5: Single-Core | Multi-Core
HWBOT x265 Benchmark v2.2: 4k Preset
LibreOffice : 20 Documents To PDF
R Benchmark 2.5: Overall mean
| Cinebench R20 / CPU (Multi Core) | |
| Eluktronics RP-17 | |
| Alienware m17 R3 P45E | |
| Eurocom Sky X4C i9-9900KS | |
| Asus Zephyrus G14 GA401IV | |
| MSI GS75 10SF-609US | |
| Asus ROG Zephyrus G15 GA502IU-ES76 | |
| Alienware m15 R3 P87F | |
| HP Pavilion Gaming 15-ec1206ng | |
| Walmart EVOO Gaming 17 | |
| Dell G5 15 5590 | |
| Asus ROG Zephyrus G15 GA502DU | |
| Cinebench R20 / CPU (Single Core) | |
| Eurocom Sky X4C i9-9900KS | |
| Asus Zephyrus G14 GA401IV | |
| Eluktronics RP-17 | |
| Asus ROG Zephyrus G15 GA502IU-ES76 | |
| Alienware m15 R3 P87F | |
| MSI GS75 10SF-609US | |
| Alienware m17 R3 P45E | |
| Walmart EVOO Gaming 17 | |
| HP Pavilion Gaming 15-ec1206ng | |
| Dell G5 15 5590 | |
| Asus ROG Zephyrus G15 GA502DU | |
| Cinebench R15 / CPU Multi 64Bit | |
| Eurocom Sky X4C i9-9900KS | |
| Eluktronics RP-17 | |
| Asus Zephyrus G14 GA401IV | |
| Alienware m17 R3 P45E | |
| MSI GS75 10SF-609US | |
| Asus ROG Zephyrus G15 GA502IU-ES76 | |
| HP Pavilion Gaming 15-ec1206ng | |
| Alienware m15 R3 P87F | |
| Walmart EVOO Gaming 17 | |
| Dell G5 15 5590 | |
| Asus ROG Zephyrus G15 GA502DU | |
| Cinebench R15 / CPU Single 64Bit | |
| Eurocom Sky X4C i9-9900KS | |
| Alienware m17 R3 P45E | |
| Alienware m15 R3 P87F | |
| MSI GS75 10SF-609US | |
| Asus Zephyrus G14 GA401IV | |
| Eluktronics RP-17 | |
| Asus ROG Zephyrus G15 GA502IU-ES76 | |
| Walmart EVOO Gaming 17 | |
| HP Pavilion Gaming 15-ec1206ng | |
| Dell G5 15 5590 | |
| Asus ROG Zephyrus G15 GA502DU | |
| Blender / v2.79 BMW27 CPU | |
| Asus ROG Zephyrus G15 GA502DU | |
| HP Pavilion Gaming 15-ec1206ng | |
| Alienware m15 R3 P87F | |
| Asus Zephyrus G14 GA401IV | |
| Asus ROG Zephyrus G15 GA502IU-ES76 | |
| MSI GS75 10SF-609US | |
| Eluktronics RP-17 | |
| Eurocom Sky X4C i9-9900KS | |
| Alienware m17 R3 P45E | |
| 7-Zip 18.03 / 7z b 4 -mmt1 | |
| Eurocom Sky X4C i9-9900KS | |
| Alienware m17 R3 P45E | |
| MSI GS75 10SF-609US | |
| Asus ROG Zephyrus G15 GA502IU-ES76 | |
| Asus Zephyrus G14 GA401IV | |
| Eluktronics RP-17 | |
| Alienware m15 R3 P87F | |
| HP Pavilion Gaming 15-ec1206ng | |
| Asus ROG Zephyrus G15 GA502DU | |
| 7-Zip 18.03 / 7z b 4 | |
| Eurocom Sky X4C i9-9900KS | |
| Eluktronics RP-17 | |
| Asus Zephyrus G14 GA401IV | |
| MSI GS75 10SF-609US | |
| Asus ROG Zephyrus G15 GA502IU-ES76 | |
| Alienware m17 R3 P45E | |
| HP Pavilion Gaming 15-ec1206ng | |
| Alienware m15 R3 P87F | |
| Asus ROG Zephyrus G15 GA502DU | |
| Geekbench 5.5 / Single-Core | |
| Eurocom Sky X4C i9-9900KS | |
| Alienware m17 R3 P45E | |
| MSI GS75 10SF-609US | |
| Alienware m15 R3 P87F | |
| Asus Zephyrus G14 GA401IV | |
| Asus ROG Zephyrus G15 GA502IU-ES76 | |
| Eluktronics RP-17 | |
| HP Pavilion Gaming 15-ec1206ng | |
| Geekbench 5.5 / Multi-Core | |
| Eurocom Sky X4C i9-9900KS | |
| MSI GS75 10SF-609US | |
| Alienware m17 R3 P45E | |
| Eluktronics RP-17 | |
| Asus ROG Zephyrus G15 GA502IU-ES76 | |
| Asus Zephyrus G14 GA401IV | |
| Alienware m15 R3 P87F | |
| HP Pavilion Gaming 15-ec1206ng | |
| HWBOT x265 Benchmark v2.2 / 4k Preset | |
| Eurocom Sky X4C i9-9900KS | |
| Alienware m17 R3 P45E | |
| Eluktronics RP-17 | |
| MSI GS75 10SF-609US | |
| Asus Zephyrus G14 GA401IV | |
| Asus ROG Zephyrus G15 GA502IU-ES76 | |
| Alienware m15 R3 P87F | |
| HP Pavilion Gaming 15-ec1206ng | |
| Asus ROG Zephyrus G15 GA502DU | |
| LibreOffice / 20 Documents To PDF | |
| HP Pavilion Gaming 15-ec1206ng | |
| Alienware m15 R3 P87F | |
| Eluktronics RP-17 | |
| Asus ROG Zephyrus G15 GA502IU-ES76 | |
| MSI GS75 10SF-609US | |
| Alienware m17 R3 P45E | |
| R Benchmark 2.5 / Overall mean | |
| Alienware m15 R3 P87F | |
| HP Pavilion Gaming 15-ec1206ng | |
| MSI GS75 10SF-609US | |
| Eluktronics RP-17 | |
| Asus ROG Zephyrus G15 GA502IU-ES76 | |
| Alienware m17 R3 P45E | |
* ... mindre är bättre
| PCMark 10 | |
| Score | |
| Razer Blade 15 RTX 2070 Super Max-Q | |
| Eluktronics RP-15 | |
| Asus ROG Zephyrus G15 GA502IU-ES76 | |
| Asus ROG Zephyrus Duo 15 GX550LXS | |
| MSI GS66 Stealth 10SE-045 | |
| Lenovo Legion 5 15IMH05H | |
| Asus ROG Zephyrus G15 GA502DU | |
| Essentials | |
| Razer Blade 15 RTX 2070 Super Max-Q | |
| Eluktronics RP-15 | |
| MSI GS66 Stealth 10SE-045 | |
| Asus ROG Zephyrus Duo 15 GX550LXS | |
| Asus ROG Zephyrus G15 GA502IU-ES76 | |
| Lenovo Legion 5 15IMH05H | |
| Asus ROG Zephyrus G15 GA502DU | |
| Productivity | |
| Razer Blade 15 RTX 2070 Super Max-Q | |
| Lenovo Legion 5 15IMH05H | |
| Asus ROG Zephyrus Duo 15 GX550LXS | |
| MSI GS66 Stealth 10SE-045 | |
| Eluktronics RP-15 | |
| Asus ROG Zephyrus G15 GA502IU-ES76 | |
| Asus ROG Zephyrus G15 GA502DU | |
| Digital Content Creation | |
| Razer Blade 15 RTX 2070 Super Max-Q | |
| Eluktronics RP-15 | |
| Asus ROG Zephyrus G15 GA502IU-ES76 | |
| Asus ROG Zephyrus Duo 15 GX550LXS | |
| Asus ROG Zephyrus G15 GA502DU | |
| MSI GS66 Stealth 10SE-045 | |
| Lenovo Legion 5 15IMH05H | |
| PCMark 8 | |
| Home Score Accelerated v2 | |
| Razer Blade 15 RTX 2070 Super Max-Q | |
| Eluktronics RP-15 | |
| Asus ROG Zephyrus G15 GA502IU-ES76 | |
| MSI GS66 Stealth 10SE-045 | |
| Lenovo Legion 5 15IMH05H | |
| Asus ROG Zephyrus Duo 15 GX550LXS | |
| Asus ROG Zephyrus G15 GA502DU | |
| Work Score Accelerated v2 | |
| Razer Blade 15 RTX 2070 Super Max-Q | |
| Eluktronics RP-15 | |
| MSI GS66 Stealth 10SE-045 | |
| Asus ROG Zephyrus G15 GA502IU-ES76 | |
| Lenovo Legion 5 15IMH05H | |
| Asus ROG Zephyrus G15 GA502DU | |
| Asus ROG Zephyrus Duo 15 GX550LXS | |
| PCMark 8 Home Score Accelerated v2 | 4913 poäng | |
| PCMark 8 Work Score Accelerated v2 | 5901 poäng | |
| PCMark 10 Score | 5291 poäng | |
Hjälp | ||
| DPC Latencies / LatencyMon - interrupt to process latency (max), Web, Youtube, Prime95 | |
| Asus ROG Zephyrus Duo 15 GX550LXS | |
| Razer Blade 15 RTX 2070 Super Max-Q | |
| MSI GS66 Stealth 10SE-045 | |
| Asus ROG Zephyrus G15 GA502IU-ES76 | |
| Lenovo Legion 5 15IMH05H | |
| Eluktronics RP-15 | |
* ... mindre är bättre
| Asus ROG Zephyrus G15 GA502IU-ES76 Intel SSD 660p 1TB SSDPEKNW010T8 | Asus ROG Zephyrus Duo 15 GX550LXS 2x Samsung PM981a MZVLB1T0HBLR (RAID 0) | Asus ROG Zephyrus G15 GA502DU Intel SSD 660p SSDPEKNW512G8 | Razer Blade 15 RTX 2070 Super Max-Q Samsung SSD PM981a MZVLB512HBJQ | Lenovo Legion 5 15IMH05H Samsung PM991 MZALQ512HALU | MSI GS66 Stealth 10SE-045 Samsung SSD PM981 MZVLB1T0HALR | |
|---|---|---|---|---|---|---|
| AS SSD | 60% | -20% | 56% | 1% | 72% | |
| Seq Read (MB/s) | 1197 | 2981 149% | 907 -24% | 1957 63% | 2012 68% | 2612 118% |
| Seq Write (MB/s) | 1637 | 2783 70% | 926 -43% | 2092 28% | 1261 -23% | 2368 45% |
| 4K Read (MB/s) | 56.3 | 43.98 -22% | 47.26 -16% | 50.2 -11% | 43.66 -22% | 51.1 -9% |
| 4K Write (MB/s) | 159 | 113.9 -28% | 98.7 -38% | 96.5 -39% | 109.3 -31% | 135.9 -15% |
| 4K-64 Read (MB/s) | 583 | 1519 161% | 321.5 -45% | 1594 173% | 851 46% | 1635 180% |
| 4K-64 Write (MB/s) | 838 | 1296 55% | 736 -12% | 2005 139% | 780 -7% | 1831 118% |
| Access Time Read * (ms) | 0.062 | 0.062 -0% | 0.064 -3% | 0.057 8% | 0.117 -89% | 0.042 32% |
| Access Time Write * (ms) | 0.128 | 0.033 74% | 0.045 65% | 0.112 12% | 0.036 72% | 0.028 78% |
| Score Read (Points) | 759 | 1861 145% | 459 -40% | 1840 142% | 1096 44% | 1947 157% |
| Score Write (Points) | 1160 | 1688 46% | 927 -20% | 2310 99% | 1016 -12% | 2204 90% |
| Score Total (Points) | 2350 | 4492 91% | 1641 -30% | 5103 117% | 2643 12% | 5138 119% |
| Copy ISO MB/s (MB/s) | 1376 | 2438 77% | 905 -34% | 1793 30% | 1481 8% | 2334 70% |
| Copy Program MB/s (MB/s) | 568 | 604 6% | 496.9 -13% | 573 1% | 467.5 -18% | 569 0% |
| Copy Game MB/s (MB/s) | 1180 | 1404 19% | 819 -31% | 1418 20% | 734 -38% | 1401 19% |
| CrystalDiskMark 5.2 / 6 | 35% | -33% | 21% | -14% | 16% | |
| Write 4K (MB/s) | 189.6 | 127.6 -33% | 132.2 -30% | 139.8 -26% | 145.4 -23% | 156.3 -18% |
| Read 4K (MB/s) | 61.7 | 48.4 -22% | 55.5 -10% | 48.62 -21% | 51.6 -16% | 47.65 -23% |
| Write Seq (MB/s) | 1730 | 2958 71% | 986 -43% | 2260 31% | 1007 -42% | 2374 37% |
| Read Seq (MB/s) | 1620 | 2984 84% | 1318 -19% | 2135 32% | 1145 -29% | 2045 26% |
| Write 4K Q32T1 (MB/s) | 474.2 | 472.7 0% | 220.3 -54% | 499.3 5% | 468.4 -1% | 431.3 -9% |
| Read 4K Q32T1 (MB/s) | 528 | 529 0% | 315.5 -40% | 552 5% | 528 0% | 509 -4% |
| Write Seq Q32T1 (MB/s) | 1795 | 3431 91% | 987 -45% | 2960 65% | 1381 -23% | 2385 33% |
| Read Seq Q32T1 (MB/s) | 1880 | 3536 88% | 1416 -25% | 3269 74% | 2291 22% | 3505 86% |
| Totalt genomsnitt (program/inställningar) | 48% /
51% | -27% /
-25% | 39% /
43% | -7% /
-5% | 44% /
51% |
* ... mindre är bättre

Kontinuerlig inläsning: DiskSpd Read Loop, Queue Depth 8
| 3DMark 06 Standard Score | 25384 poäng | |
| 3DMark 11 Performance | 17377 poäng | |
| 3DMark Cloud Gate Standard Score | 38220 poäng | |
| 3DMark Fire Strike Score | 12739 poäng | |
| 3DMark Time Spy Score | 5461 poäng | |
Hjälp | ||
| låg | med. | hög | ultra | |
|---|---|---|---|---|
| The Witcher 3 (2015) | 257.5 | 166.5 | 94.5 | 51.3 |
| Dota 2 Reborn (2015) | 119 | 112 | 106 | 103 |
| Final Fantasy XV Benchmark (2018) | 131 | 74.1 | 54.6 | |
| X-Plane 11.11 (2018) | 93.7 | 80.4 | 67.8 | |
| Shadow of the Tomb Raider (2018) | 113 | 85 | 75 | 67 |
| Metro Exodus (2019) | 129.5 | 66.5 | 49.1 | 38.3 |
| Borderlands 3 (2019) | 116.5 | 81.5 | 54.9 | 42.3 |
| Asus ROG Zephyrus G15 GA502IU-ES76 GeForce GTX 1660 Ti Max-Q, R7 4800HS, Intel SSD 660p 1TB SSDPEKNW010T8 | Asus ROG Zephyrus Duo 15 GX550LXS GeForce RTX 2080 Super Max-Q, i9-10980HK, 2x Samsung PM981a MZVLB1T0HBLR (RAID 0) | Asus ROG Zephyrus G15 GA502DU GeForce GTX 1660 Ti Max-Q, R7 3750H, Intel SSD 660p SSDPEKNW512G8 | Razer Blade 15 RTX 2070 Super Max-Q GeForce RTX 2070 Super Max-Q, i7-10875H, Samsung SSD PM981a MZVLB512HBJQ | Lenovo Legion 5 15IMH05H GeForce RTX 2060 Mobile, i5-10300H, Samsung PM991 MZALQ512HALU | MSI GS66 Stealth 10SE-045 GeForce RTX 2060 Mobile, i7-10750H, Samsung SSD PM981 MZVLB1T0HALR | Eluktronics RP-15 GeForce RTX 2060 Mobile, R7 4800H, Phison PM81000GPMQCN28BTF-E12S4 M.2 NVM SSD | |
|---|---|---|---|---|---|---|---|
| Noise | -12% | -7% | -0% | -3% | -9% | -3% | |
| av / miljö * (dB) | 26.3 | 30 -14% | 28 -6% | 27 -3% | 30.7 -17% | 25 5% | 28 -6% |
| Idle Minimum * (dB) | 26.7 | 33 -24% | 29.4 -10% | 27 -1% | 30.7 -15% | 29 -9% | 28 -5% |
| Idle Average * (dB) | 26.7 | 34 -27% | 31.9 -19% | 27 -1% | 30.7 -15% | 30 -12% | 28 -5% |
| Idle Maximum * (dB) | 31.9 | 35 -10% | 33 -3% | 27 15% | 30.7 4% | 40 -25% | 31.5 1% |
| Load Average * (dB) | 38.9 | 48 -23% | 41.2 -6% | 44.7 -15% | 36.6 6% | 51 -31% | 44 -13% |
| Witcher 3 ultra * (dB) | 51 | 48 6% | 53.8 -5% | 51.2 -0% | 47 8% | 48 6% | 48.8 4% |
| Load Maximum * (dB) | 54.9 | 49 11% | 55.7 -1% | 54 2% | 50.9 7% | 54 2% | 54.1 1% |
* ... mindre är bättre
Ljudnivå
| Låg belastning |
| 26.7 / 26.7 / 31.9 dB(A) |
| Hög belastning |
| 38.9 / 54.9 dB(A) |
 | ||
30 dB tyst 40 dB(A) hörbar 50 dB(A) högt ljud |
||
min: | ||
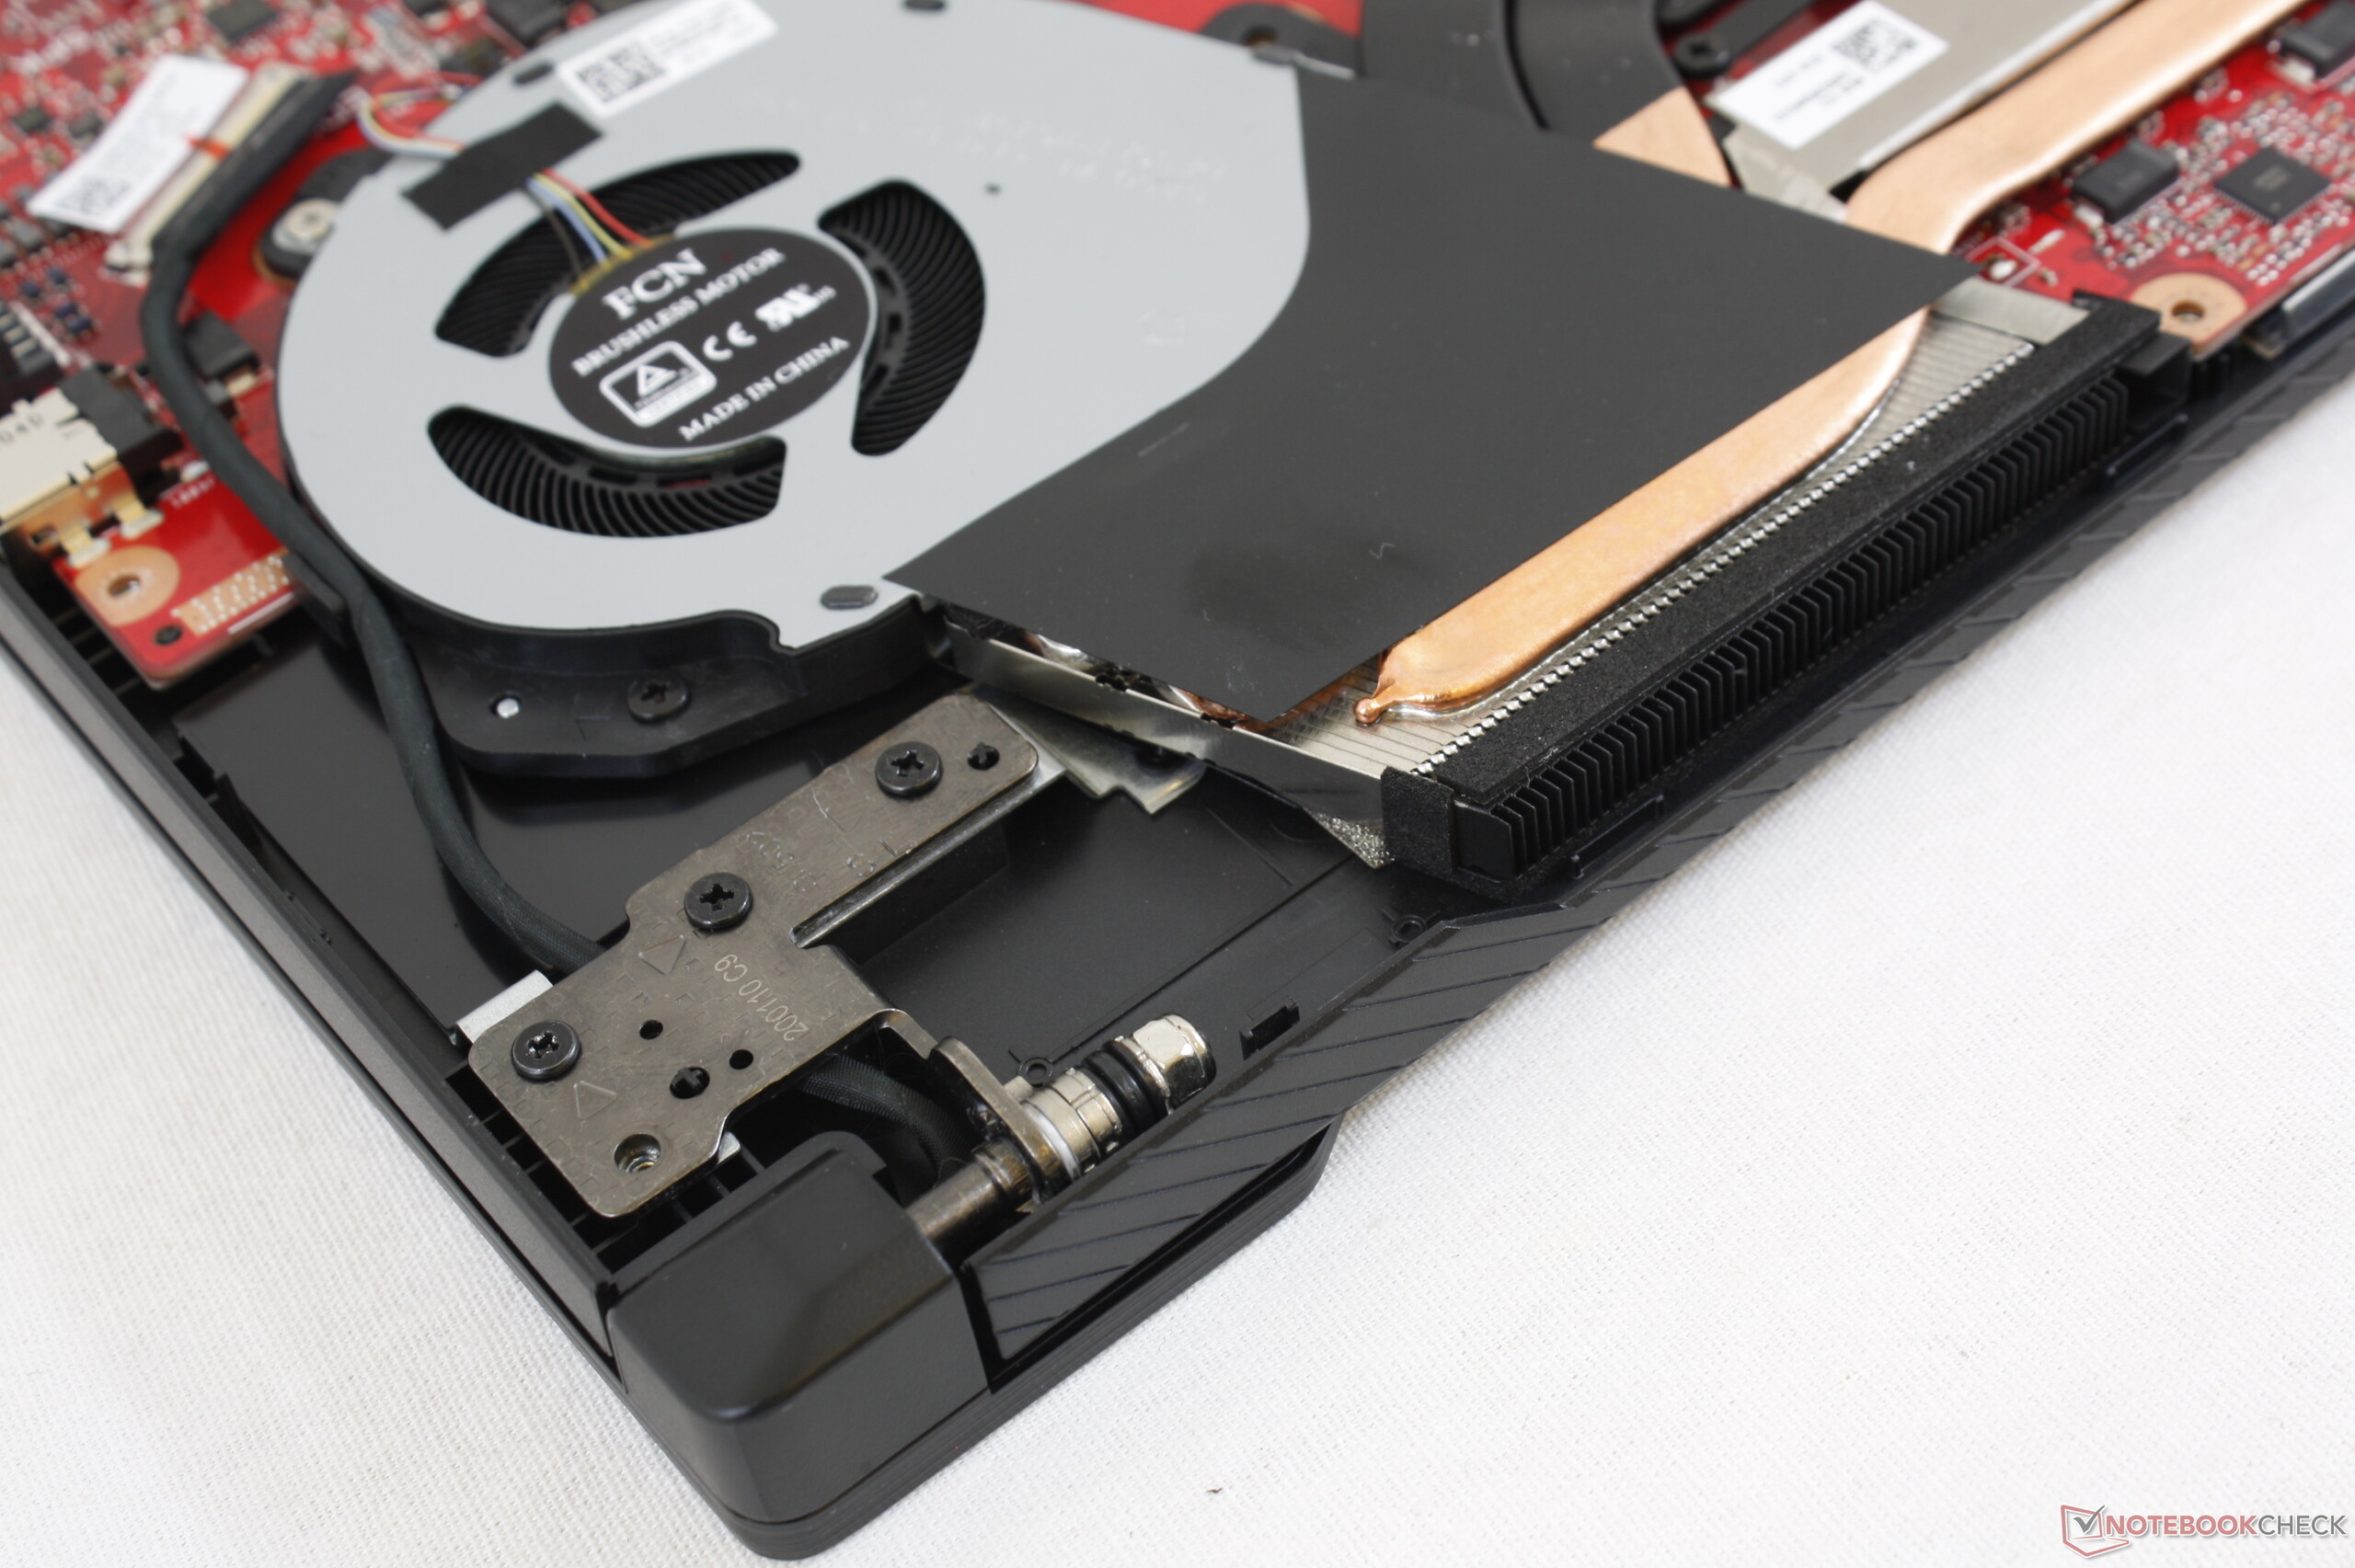
(-) Den maximala temperaturen på ovansidan är 52.2 °C / 126 F, jämfört med genomsnittet av 40.4 °C / 105 F , allt från 21.2 till 68.8 °C för klassen Gaming.
(-) Botten värms upp till maximalt 65 °C / 149 F, jämfört med genomsnittet av 43.2 °C / 110 F
(+) Vid tomgångsbruk är medeltemperaturen för ovansidan 27.2 °C / 81 F, jämfört med enhetsgenomsnittet på 33.9 °C / ### class_avg_f### F.
(±) När du spelar The Witcher 3 är medeltemperaturen för ovansidan 35.8 °C / 96 F, jämfört med enhetsgenomsnittet på 33.9 °C / ## #class_avg_f### F.
(+) Handledsstöden och pekplattan är kallare än hudtemperaturen med maximalt 25.4 °C / 77.7 F och är därför svala att ta på.
(+) Medeltemperaturen för handledsstödsområdet på liknande enheter var 28.8 °C / 83.8 F (+3.4 °C / 6.1 F).
Asus ROG Zephyrus G15 GA502IU-ES76 ljudanalys
(±) | högtalarljudstyrkan är genomsnittlig men bra (81 dB)
Bas 100 - 315 Hz
(±) | reducerad bas - i genomsnitt 5.9% lägre än medianen
(±) | linjäriteten för basen är genomsnittlig (11.4% delta till föregående frekvens)
Mellan 400 - 2000 Hz
(+) | balanserad mellan - endast 2.2% från medianen
(+) | mids är linjära (4% delta till föregående frekvens)
Högsta 2 - 16 kHz
(±) | högre toppar - i genomsnitt 6.5% högre än medianen
(+) | toppar är linjära (6.5% delta till föregående frekvens)
Totalt 100 - 16 000 Hz
(+) | det totala ljudet är linjärt (13.1% skillnad mot median)
Jämfört med samma klass
» 18% av alla testade enheter i den här klassen var bättre, 4% liknande, 78% sämre
» Den bästa hade ett delta på 6%, genomsnittet var 18%, sämst var 132%
Jämfört med alla testade enheter
» 13% av alla testade enheter var bättre, 3% liknande, 84% sämre
» Den bästa hade ett delta på 4%, genomsnittet var 24%, sämst var 134%
Apple MacBook 12 (Early 2016) 1.1 GHz ljudanalys
(+) | högtalare kan spela relativt högt (83.6 dB)
Bas 100 - 315 Hz
(±) | reducerad bas - i genomsnitt 11.3% lägre än medianen
(±) | linjäriteten för basen är genomsnittlig (14.2% delta till föregående frekvens)
Mellan 400 - 2000 Hz
(+) | balanserad mellan - endast 2.4% från medianen
(+) | mids är linjära (5.5% delta till föregående frekvens)
Högsta 2 - 16 kHz
(+) | balanserade toppar - endast 2% från medianen
(+) | toppar är linjära (4.5% delta till föregående frekvens)
Totalt 100 - 16 000 Hz
(+) | det totala ljudet är linjärt (10.2% skillnad mot median)
Jämfört med samma klass
» 7% av alla testade enheter i den här klassen var bättre, 2% liknande, 91% sämre
» Den bästa hade ett delta på 5%, genomsnittet var 18%, sämst var 53%
Jämfört med alla testade enheter
» 5% av alla testade enheter var bättre, 1% liknande, 94% sämre
» Den bästa hade ett delta på 4%, genomsnittet var 24%, sämst var 134%
| Av/Standby | |
| Låg belastning | |
| Hög belastning |
|
Förklaring:
min: | |
| Asus ROG Zephyrus G15 GA502IU-ES76 R7 4800HS, GeForce GTX 1660 Ti Max-Q, Intel SSD 660p 1TB SSDPEKNW010T8, IPS, 1920x1080, 15.6" | Asus ROG Zephyrus Duo 15 GX550LXS i9-10980HK, GeForce RTX 2080 Super Max-Q, 2x Samsung PM981a MZVLB1T0HBLR (RAID 0), IPS, 3840x2160, 15.6" | Asus ROG Zephyrus G15 GA502DU R7 3750H, GeForce GTX 1660 Ti Max-Q, Intel SSD 660p SSDPEKNW512G8, IPS, 1920x1080, 15.6" | Razer Blade 15 RTX 2070 Super Max-Q i7-10875H, GeForce RTX 2070 Super Max-Q, Samsung SSD PM981a MZVLB512HBJQ, IPS, 1920x1080, 15.6" | Lenovo Legion 5 15IMH05H i5-10300H, GeForce RTX 2060 Mobile, Samsung PM991 MZALQ512HALU, IPS, 1920x1080, 15.6" | MSI GS66 Stealth 10SE-045 i7-10750H, GeForce RTX 2060 Mobile, Samsung SSD PM981 MZVLB1T0HALR, IPS, 1920x1080, 15.6" | Eluktronics RP-15 R7 4800H, GeForce RTX 2060 Mobile, Phison PM81000GPMQCN28BTF-E12S4 M.2 NVM SSD, IPS, 1920x1080, 15.6" | |
|---|---|---|---|---|---|---|---|
| Power Consumption | -204% | -68% | -147% | -17% | -95% | -176% | |
| Idle Minimum * (Watt) | 5.1 | 23 -351% | 7.4 -45% | 14.3 -180% | 3.2 37% | 7 -37% | 21.7 -325% |
| Idle Average * (Watt) | 8.4 | 30 -257% | 8.6 -2% | 22.3 -165% | 8.3 1% | 18 -114% | 30.1 -258% |
| Idle Maximum * (Watt) | 9.1 | 39 -329% | 39.1 -330% | 36.9 -305% | 8.7 4% | 31 -241% | 35 -285% |
| Load Average * (Watt) | 55.1 | 156 -183% | 65.9 -20% | 118.4 -115% | 82 -49% | 107 -94% | 112.6 -104% |
| Witcher 3 ultra * (Watt) | 97.5 | 152 -56% | 106.9 -10% | 153.7 -58% | 151 -55% | 146 -50% | 134.4 -38% |
| Load Maximum * (Watt) | 140.2 | 208 -48% | 141.3 -1% | 220.8 -57% | 195 -39% | 186 -33% | 201.5 -44% |
* ... mindre är bättre
| Asus ROG Zephyrus G15 GA502IU-ES76 R7 4800HS, GeForce GTX 1660 Ti Max-Q, 76 Wh | Asus ROG Zephyrus Duo 15 GX550LXS i9-10980HK, GeForce RTX 2080 Super Max-Q, 90 Wh | Asus ROG Zephyrus G15 GA502DU R7 3750H, GeForce GTX 1660 Ti Max-Q, 76 Wh | Razer Blade 15 RTX 2070 Super Max-Q i7-10875H, GeForce RTX 2070 Super Max-Q, 80 Wh | Lenovo Legion 5 15IMH05H i5-10300H, GeForce RTX 2060 Mobile, 60 Wh | MSI GS66 Stealth 10SE-045 i7-10750H, GeForce RTX 2060 Mobile, 99.9 Wh | Eluktronics RP-15 R7 4800H, GeForce RTX 2060 Mobile, 46.7 Wh | |
|---|---|---|---|---|---|---|---|
| Batteridrifttid | -22% | 59% | 19% | 36% | 4% | -32% | |
| Reader / Idle (h) | 7.1 | 8 13% | 15.3 115% | 14.1 99% | 9 27% | ||
| WiFi v1.3 (h) | 5.3 | 3.1 -42% | 8 51% | 6.3 19% | 7.2 36% | 6.4 21% | 3.6 -32% |
| Load (h) | 1.9 | 1.2 -37% | 2.1 11% | 1.4 -26% | 1.2 -37% |
För
Emot

Läs den fullständiga versionen av den här recensionen på engelska här.
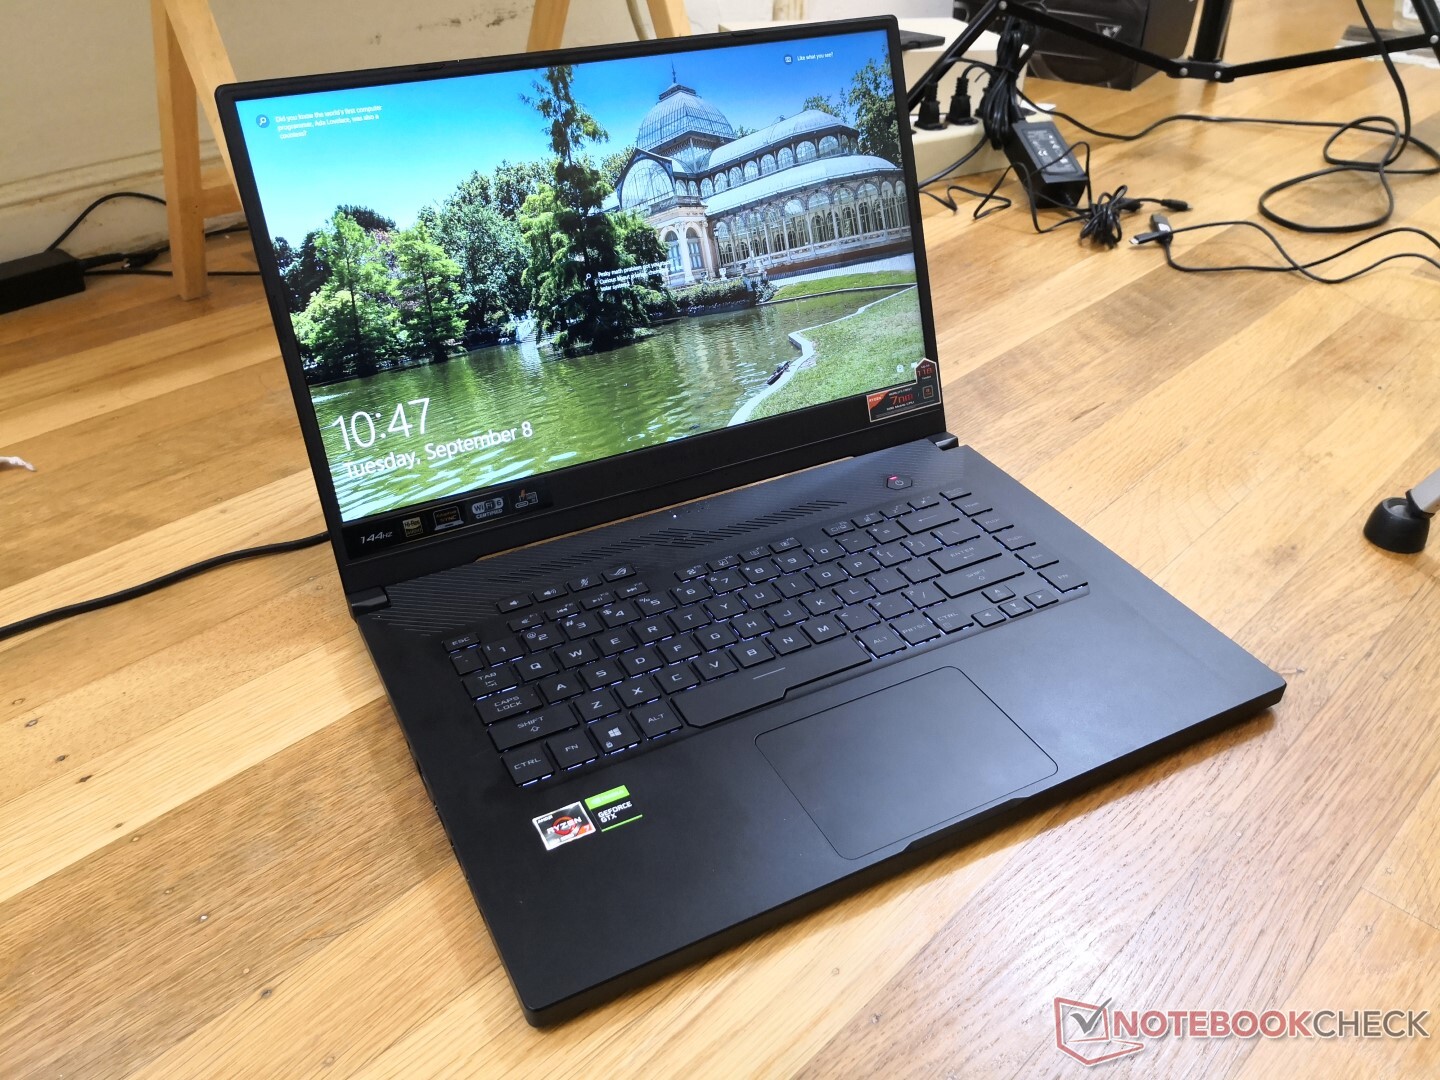
Det råder ingen tvekan om att Zephyrus G15 GA502IU är en stor förbättring i fråga om processorkraft jämfört med GA502DU. Tack vare kombinationen av en 7 nm Ryzen CPU och en GeForce Max-Q GPU är prestandan per watt fantastisk samtidigt som chassit är både litet och tilltalade för det här priset. Vid en jämförelse med andra billiga konkurrenter som Acer Nitro 5, MSI GL/GF-serierna, Dell G-serien eller Aorus G-serien, kommer Zephyrus G15 definitivt att stå ut.
De största nackdelarna med GA502IU är priset och skärmen. För 13.000 kronor är den dyrare än de flesta andra alternativ som har en GeForce GTX 1660 Ti GPU. Du betalar helt enkelt extra för en ny AMD CPU och ett tjusigt chassi, saker många andra billiga spellaptops saknar. Samtidigt blev vi en aning besvikna över 144 Hz-skärmens medelmåttiga färgomfång och responstider. Den lyxigare 240 Hz-konfigurationen verkar åtgärda detta, men den kräver också mer av plånboken. Trots detta är Zephyrus G15 GA502IU en bra budget-laptop från mittenskiktet, särskilt om du kan hitta den på rea.
Asus Zephyrus G15 GA502IU har utmärkt processorprestanda i ett tilltalande chassi, vilket är svårt att slå till det här priset. Grafikprestandan, tangentbordets återkoppling samt skärmens responstider och färgåtergivning var däremot lite av en besvikelse. Det är synd att en såpass bra processor inte används på särskilt många andra modeller just nu.
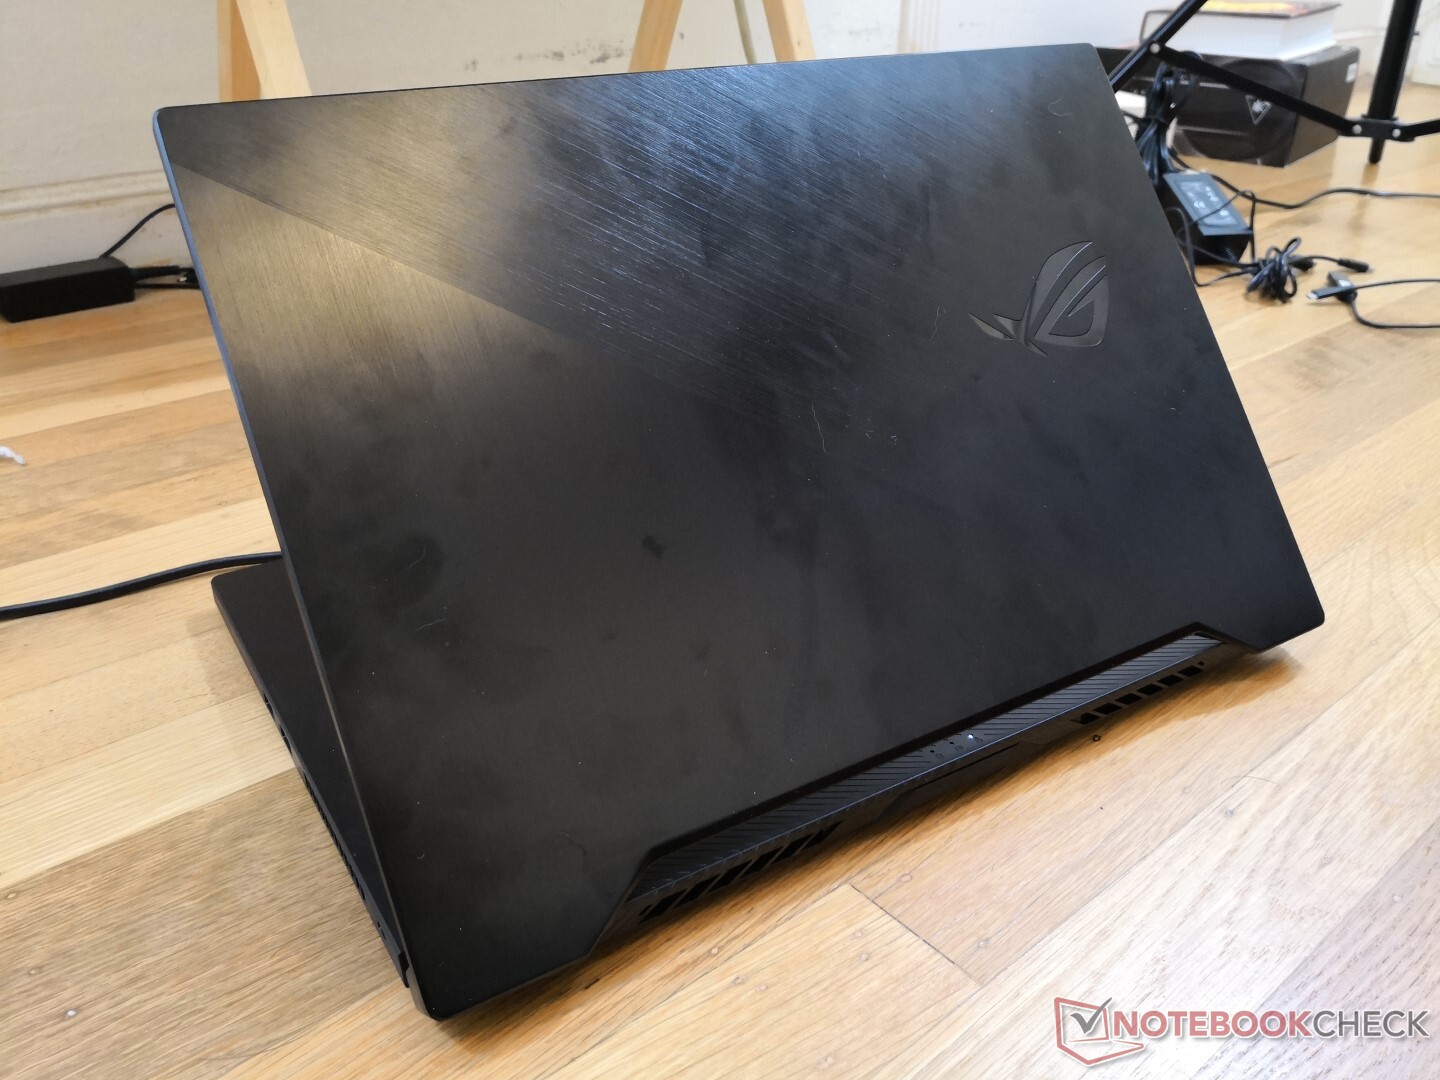
Asus ROG Zephyrus G15 GA502IU-ES76
- 09/10/2020 v7 (old)
Allen Ngo
Price comparison
