Test: Lenovo Legion 5 15IMH05H - Bra batteritid och utmärkt på att leverera sin styrka (Sammanfattning)
Gradering | Datum | Modell | Vikt | Höjd | Storlek | Upplösning | Pris |
|---|---|---|---|---|---|---|---|
| 83.3 % v7 (old) | 07/2020 | Lenovo Legion 5 15IMH05H i5-10300H, GeForce RTX 2060 Mobile | 2.5 kg | 26.1 mm | 15.60" | 1920x1080 | |
| 82.7 % v7 (old) | Asus TUF Gaming A15 FA506IV-HN172 R7 4800H, GeForce RTX 2060 Mobile | 2.2 kg | 24.9 mm | 15.60" | 1920x1080 | ||
| 83.7 % v7 (old) | 06/2020 | Dell G5 15 SE 5505 P89F R7 4800H, Radeon RX 5600M | 2.4 kg | 21.6 mm | 15.60" | 1920x1080 | |
| 78.8 % v7 (old) | 02/2020 | MSI Alpha 15 A3DDK-034 R7 3750H, Radeon RX 5500M | 2.3 kg | 27.5 mm | 15.60" | 1920x1080 |


| Networking | |
| iperf3 transmit AX12 | |
| Dell G5 15 SE 5505 P89F | |
| Genomsnitt Intel Wi-Fi 6 AX201 (49.8 - 1775, n=324) | |
| Asus TUF Gaming A15 FA506IV-HN172 | |
| MSI Alpha 15 A3DDK-034 | |
| Lenovo Legion 5 15IMH05H | |
| iperf3 receive AX12 | |
| Dell G5 15 SE 5505 P89F | |
| Genomsnitt Intel Wi-Fi 6 AX201 (136 - 1743, n=324) | |
| Lenovo Legion 5 15IMH05H | |
| MSI Alpha 15 A3DDK-034 | |
| Asus TUF Gaming A15 FA506IV-HN172 | |


| |||||||||||||||||||||||||
Distribution av ljusstyrkan: 77 %
Mitt på batteriet: 299 cd/m²
Kontrast: 1158:1 (Svärta: 0.26 cd/m²)
ΔE ColorChecker Calman: 5.12 | ∀{0.5-29.43 Ø4.71}
calibrated: 4.88
ΔE Greyscale Calman: 3.47 | ∀{0.09-98 Ø4.96}
57% sRGB (Argyll 1.6.3 3D)
37% AdobeRGB 1998 (Argyll 1.6.3 3D)
40.09% AdobeRGB 1998 (Argyll 3D)
57.8% sRGB (Argyll 3D)
38.8% Display P3 (Argyll 3D)
Gamma: 2.37
CCT: 7062 K
| Lenovo Legion 5 15IMH05H BOE CQ NV156FHM-NX1, IPS, 1920x1080, 15.6" | Asus TUF Gaming A15 FA506IV-HN172 LM156LF-2F01, IPS, 1920x1080, 15.6" | Dell G5 15 SE 5505 P89F BOE NV156FH, WVA, 1920x1080, 15.6" | MSI Alpha 15 A3DDK-034 AU Optronics B156HAN08.0 (AUO80ED), IPS, 1920x1080, 15.6" | Lenovo Legion Y540-15IRH BOE NV156FHM-N4G (BOE084D), IPS, 1920x1080, 15.6" | |
|---|---|---|---|---|---|
| Display | 0% | 59% | 65% | 63% | |
| Display P3 Coverage (%) | 38.8 | 38.92 0% | 63 62% | 66.4 71% | 64.5 66% |
| sRGB Coverage (%) | 57.8 | 58.5 1% | 90.1 56% | 91 57% | 91.6 58% |
| AdobeRGB 1998 Coverage (%) | 40.09 | 40.22 0% | 64.1 60% | 66.6 66% | 65.9 64% |
| Response Times | -36% | 29% | 56% | 54% | |
| Response Time Grey 50% / Grey 80% * (ms) | 26 ? | 34 ? -31% | 20.4 ? 22% | 7 ? 73% | 8.8 ? 66% |
| Response Time Black / White * (ms) | 17 ? | 24 ? -41% | 10.8 ? 36% | 10.4 ? 39% | 10 ? 41% |
| PWM Frequency (Hz) | 198.4 ? | ||||
| Screen | -4% | 18% | 14% | 20% | |
| Brightness middle (cd/m²) | 301 | 280 -7% | 292 -3% | 310 3% | 284 -6% |
| Brightness (cd/m²) | 277 | 254 -8% | 290 5% | 310 12% | 277 0% |
| Brightness Distribution (%) | 77 | 88 14% | 77 0% | 86 12% | 87 13% |
| Black Level * (cd/m²) | 0.26 | 0.15 42% | 0.27 -4% | 0.29 -12% | 0.3 -15% |
| Contrast (:1) | 1158 | 1867 61% | 1081 -7% | 1069 -8% | 947 -18% |
| Colorchecker dE 2000 * | 5.12 | 5.89 -15% | 3.99 22% | 4.78 7% | 3.53 31% |
| Colorchecker dE 2000 max. * | 8.86 | 19 -114% | 6.11 31% | 8.1 9% | 6.11 31% |
| Colorchecker dE 2000 calibrated * | 4.88 | 4.79 2% | 3.02 38% | 2.36 52% | 1.81 63% |
| Greyscale dE 2000 * | 3.47 | 4.08 -18% | 3.3 5% | 4.78 -38% | 3.56 -3% |
| Gamma | 2.37 93% | 2.33 94% | 2.25 98% | 2.43 91% | 2.47 89% |
| CCT | 7062 92% | 7303 89% | 7047 92% | 7739 84% | 7257 90% |
| Color Space (Percent of AdobeRGB 1998) (%) | 37 | 37 0% | 58.1 57% | 59 59% | 59 59% |
| Color Space (Percent of sRGB) (%) | 57 | 58 2% | 89.7 57% | 91 60% | 91 60% |
| Totalt genomsnitt (program/inställningar) | -13% /
-7% | 35% /
27% | 45% /
29% | 46% /
32% |
* ... mindre är bättre
Visa svarstider
| ↔ Svarstid svart till vitt | ||
|---|---|---|
| 17 ms ... stiga ↗ och falla ↘ kombinerat | ↗ 8 ms stiga | 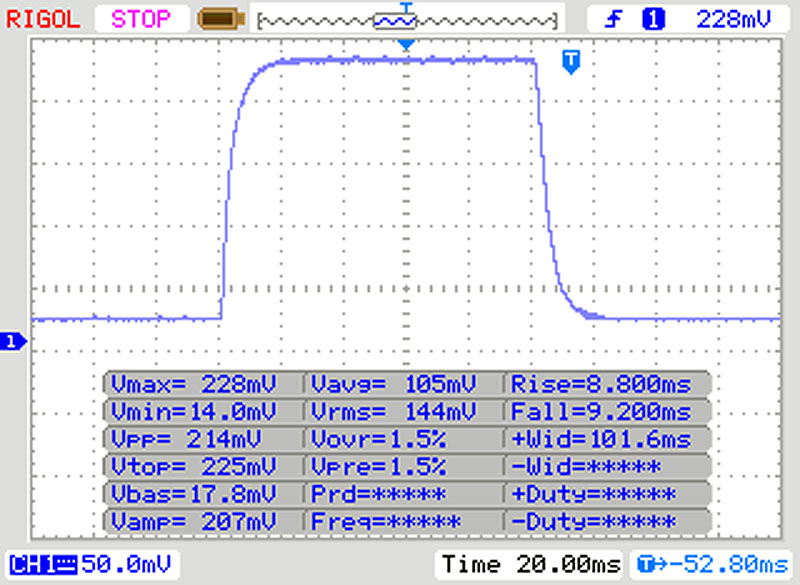 |
| ↘ 9 ms hösten | ||
| Skärmen visar bra svarsfrekvens i våra tester, men kan vara för långsam för konkurrenskraftiga spelare. I jämförelse sträcker sig alla testade enheter från 0.1 (minst) till 240 (maximalt) ms. » 39 % av alla enheter är bättre. Det betyder att den uppmätta svarstiden är bättre än genomsnittet av alla testade enheter (19.8 ms). | ||
| ↔ Svarstid 50 % grått till 80 % grått | ||
| 26 ms ... stiga ↗ och falla ↘ kombinerat | ↗ 12 ms stiga | 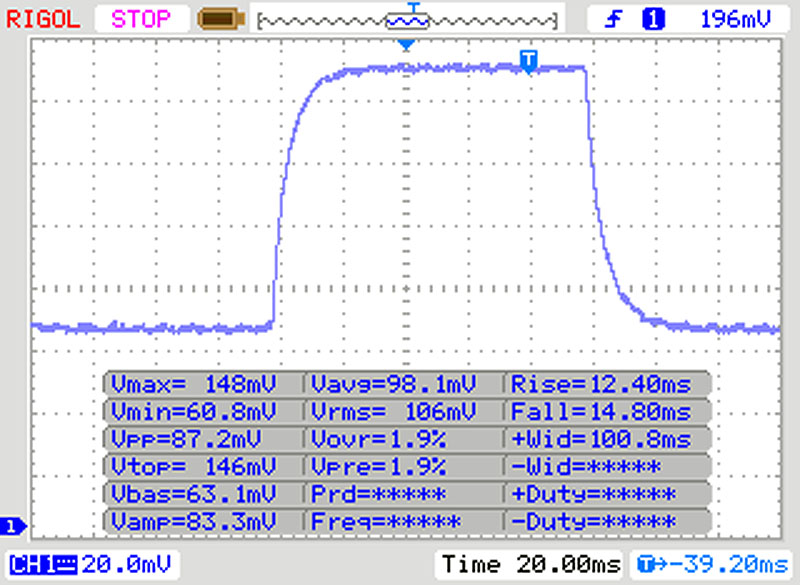 |
| ↘ 14 ms hösten | ||
| Skärmen visar relativt långsamma svarsfrekvenser i våra tester och kan vara för långsam för spelare. I jämförelse sträcker sig alla testade enheter från 0.165 (minst) till 636 (maximalt) ms. » 36 % av alla enheter är bättre. Det betyder att den uppmätta svarstiden är bättre än genomsnittet av alla testade enheter (30.9 ms). | ||
Skärmflimmer / PWM (Puls-Width Modulation)
| Skärmflimmer / PWM upptäcktes inte | 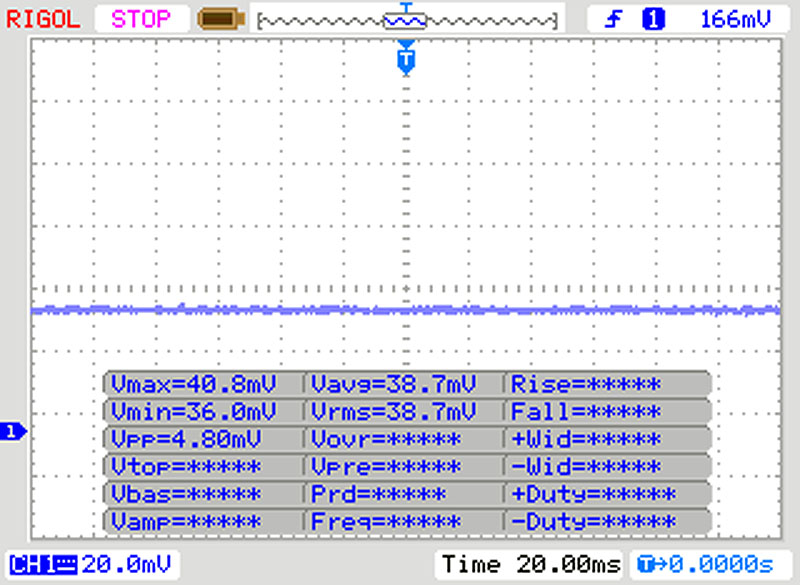 | ||
Som jämförelse: 52 % av alla testade enheter använder inte PWM för att dämpa skärmen. Om PWM upptäcktes mättes ett medelvärde av 7748 (minst: 5 - maximum: 343500) Hz. | |||
| Cinebench R15 | |
| CPU Single 64Bit | |
| Genomsnitt av klass Gaming (188.8 - 350, n=103, senaste 2 åren) | |
| Acer Nitro 5 AN517-52-77DS | |
| Lenovo Legion Y540-15IRH | |
| Dell G5 15 SE 5505 P89F | |
| Lenovo Legion 5 15IMH05H | |
| Asus TUF Gaming A15 FA506IV-HN172 | |
| Genomsnitt Intel Core i5-10300H (108 - 194, n=17) | |
| MSI Alpha 15 A3DDK-034 | |
| CPU Multi 64Bit | |
| Genomsnitt av klass Gaming (1578 - 6330, n=102, senaste 2 åren) | |
| Dell G5 15 SE 5505 P89F | |
| Asus TUF Gaming A15 FA506IV-HN172 | |
| Acer Nitro 5 AN517-52-77DS | |
| Lenovo Legion Y540-15IRH | |
| Lenovo Legion 5 15IMH05H | |
| Genomsnitt Intel Core i5-10300H (536 - 921, n=17) | |
| MSI Alpha 15 A3DDK-034 | |
| Blender - v2.79 BMW27 CPU | |
| Genomsnitt Intel Core i5-10300H (479 - 555, n=14) | |
| Lenovo Legion 5 15IMH05H | |
| Acer Nitro 5 AN517-52-77DS | |
| Dell G5 15 SE 5505 P89F | |
| Asus TUF Gaming A15 FA506IV-HN172 | |
| Genomsnitt av klass Gaming (79 - 330, n=101, senaste 2 åren) | |
| 7-Zip 18.03 | |
| 7z b 4 -mmt1 | |
| Genomsnitt av klass Gaming (4824 - 7436, n=102, senaste 2 åren) | |
| Acer Nitro 5 AN517-52-77DS | |
| Lenovo Legion 5 15IMH05H | |
| Genomsnitt Intel Core i5-10300H (2945 - 4956, n=14) | |
| Asus TUF Gaming A15 FA506IV-HN172 | |
| Dell G5 15 SE 5505 P89F | |
| 7z b 4 | |
| Genomsnitt av klass Gaming (33491 - 148086, n=102, senaste 2 åren) | |
| Dell G5 15 SE 5505 P89F | |
| Asus TUF Gaming A15 FA506IV-HN172 | |
| Acer Nitro 5 AN517-52-77DS | |
| Lenovo Legion 5 15IMH05H | |
| Genomsnitt Intel Core i5-10300H (15146 - 24841, n=14) | |
| Cinebench R20 | |
| CPU (Single Core) | |
| Genomsnitt av klass Gaming (622 - 913, n=103, senaste 2 åren) | |
| Asus TUF Gaming A15 FA506IV-HN172 | |
| Dell G5 15 SE 5505 P89F | |
| Acer Nitro 5 AN517-52-77DS | |
| Lenovo Legion 5 15IMH05H | |
| Genomsnitt Intel Core i5-10300H (312 - 470, n=15) | |
| MSI Alpha 15 A3DDK-034 | |
| CPU (Multi Core) | |
| Genomsnitt av klass Gaming (4029 - 16433, n=103, senaste 2 åren) | |
| Dell G5 15 SE 5505 P89F | |
| Asus TUF Gaming A15 FA506IV-HN172 | |
| Acer Nitro 5 AN517-52-77DS | |
| Lenovo Legion 5 15IMH05H | |
| Genomsnitt Intel Core i5-10300H (1397 - 2240, n=15) | |
| MSI Alpha 15 A3DDK-034 | |
| Geekbench 5.5 | |
| Single-Core | |
| Genomsnitt av klass Gaming (1403 - 2474, n=102, senaste 2 åren) | |
| Acer Nitro 5 AN517-52-77DS | |
| Lenovo Legion 5 15IMH05H | |
| Asus TUF Gaming A15 FA506IV-HN172 | |
| Genomsnitt Intel Core i5-10300H (703 - 1241, n=16) | |
| Dell G5 15 SE 5505 P89F | |
| MSI Alpha 15 A3DDK-034 | |
| Multi-Core | |
| Genomsnitt av klass Gaming (6460 - 28263, n=102, senaste 2 åren) | |
| Dell G5 15 SE 5505 P89F | |
| Acer Nitro 5 AN517-52-77DS | |
| Asus TUF Gaming A15 FA506IV-HN172 | |
| Lenovo Legion 5 15IMH05H | |
| Genomsnitt Intel Core i5-10300H (2783 - 4728, n=16) | |
| MSI Alpha 15 A3DDK-034 | |
| HWBOT x265 Benchmark v2.2 - 4k Preset | |
| Genomsnitt av klass Gaming (11.5 - 44.4, n=102, senaste 2 åren) | |
| Dell G5 15 SE 5505 P89F | |
| Asus TUF Gaming A15 FA506IV-HN172 | |
| Acer Nitro 5 AN517-52-77DS | |
| Lenovo Legion 5 15IMH05H | |
| Genomsnitt Intel Core i5-10300H (6.13 - 7.78, n=14) | |
| LibreOffice - 20 Documents To PDF | |
| Dell G5 15 SE 5505 P89F | |
| Genomsnitt Intel Core i5-10300H (23.9 - 94, n=14) | |
| Lenovo Legion 5 15IMH05H | |
| Acer Nitro 5 AN517-52-77DS | |
| Genomsnitt av klass Gaming (33.2 - 88.8, n=102, senaste 2 åren) | |
| Asus TUF Gaming A15 FA506IV-HN172 | |
| R Benchmark 2.5 - Overall mean | |
| Genomsnitt Intel Core i5-10300H (0.625 - 1.088, n=14) | |
| Lenovo Legion 5 15IMH05H | |
| Acer Nitro 5 AN517-52-77DS | |
| Asus TUF Gaming A15 FA506IV-HN172 | |
| Dell G5 15 SE 5505 P89F | |
| Genomsnitt av klass Gaming (0.3439 - 0.59, n=102, senaste 2 åren) | |
* ... mindre är bättre
| PCMark 8 Home Score Accelerated v2 | 3984 poäng | |
| PCMark 8 Creative Score Accelerated v2 | 3770 poäng | |
| PCMark 8 Work Score Accelerated v2 | 5319 poäng | |
| PCMark 10 Score | 4887 poäng | |
Hjälp | ||
| PCMark 8 | |
| Home Score Accelerated v2 | |
| Genomsnitt av klass Gaming (n=1senaste 2 åren) | |
| Lenovo Legion Y540-15IRH | |
| Dell G5 15 SE 5505 P89F | |
| Asus TUF Gaming A15 FA506IV-HN172 | |
| MSI Alpha 15 A3DDK-034 | |
| Lenovo Legion 5 15IMH05H | |
| Genomsnitt Intel Core i5-10300H, NVIDIA GeForce RTX 2060 Mobile (3702 - 3984, n=2) | |
| Acer Nitro 5 AN517-52-77DS | |
| Work Score Accelerated v2 | |
| Lenovo Legion Y540-15IRH | |
| Asus TUF Gaming A15 FA506IV-HN172 | |
| Acer Nitro 5 AN517-52-77DS | |
| Dell G5 15 SE 5505 P89F | |
| Lenovo Legion 5 15IMH05H | |
| Genomsnitt Intel Core i5-10300H, NVIDIA GeForce RTX 2060 Mobile (4986 - 5319, n=2) | |
| MSI Alpha 15 A3DDK-034 | |
| Genomsnitt av klass Gaming (n=1senaste 2 åren) | |
| DPC Latencies / LatencyMon - interrupt to process latency (max), Web, Youtube, Prime95 | |
| Dell G5 15 SE 5505 P89F | |
| Asus TUF Gaming A15 FA506IV-HN172 | |
| Lenovo Legion 5 15IMH05H | |
| Acer Nitro 5 AN517-52-77DS | |
* ... mindre är bättre

| Lenovo Legion 5 15IMH05H Samsung PM991 MZALQ512HALU | Asus TUF Gaming A15 FA506IV-HN172 Kingston OM8PCP3512F-AB | Dell G5 15 SE 5505 P89F Samsung PM991 MZ9LQ512HALU | MSI Alpha 15 A3DDK-034 Kingston RBUSNS8154P3512GJ | Genomsnitt Samsung PM991 MZALQ512HALU | |
|---|---|---|---|---|---|
| CrystalDiskMark 5.2 / 6 | 5% | 3% | -23% | 0% | |
| Write 4K (MB/s) | 145.4 | 219.8 51% | 142.1 -2% | 105.4 -28% | 129.5 ? -11% |
| Read 4K (MB/s) | 51.6 | 50.2 -3% | 46.43 -10% | 33.24 -36% | 45.1 ? -13% |
| Write Seq (MB/s) | 1007 | 979 -3% | 1108 10% | 1029 2% | 1172 ? 16% |
| Read Seq (MB/s) | 1145 | 1990 74% | 1622 42% | 1098 -4% | 1496 ? 31% |
| Write 4K Q32T1 (MB/s) | 468.4 | 516 10% | 467 0% | 322.1 -31% | 448 ? -4% |
| Read 4K Q32T1 (MB/s) | 528 | 298.3 -44% | 525 -1% | 352 -33% | 415 ? -21% |
| Write Seq Q32T1 (MB/s) | 1381 | 982 -29% | 1203 -13% | 1036 -25% | 1397 ? 1% |
| Read Seq Q32T1 (MB/s) | 2291 | 1907 -17% | 2288 0% | 1606 -30% | 2307 ? 1% |
| Write 4K Q8T8 (MB/s) | 981 | ||||
| Read 4K Q8T8 (MB/s) | 300.9 | ||||
| AS SSD | -7% | -13% | -20% | 3% | |
| Seq Read (MB/s) | 2012 | 1682 -16% | 1386 -31% | 1423 -29% | 1917 ? -5% |
| Seq Write (MB/s) | 1261 | 904 -28% | 1234 -2% | 958 -24% | 1061 ? -16% |
| 4K Read (MB/s) | 43.66 | 60.2 38% | 41.32 -5% | 33.2 -24% | 45.7 ? 5% |
| 4K Write (MB/s) | 109.3 | 164.8 51% | 128 17% | 80.7 -26% | 140.1 ? 28% |
| 4K-64 Read (MB/s) | 851 | 472.5 -44% | 854 0% | 816 -4% | 854 ? 0% |
| 4K-64 Write (MB/s) | 780 | 845 8% | 721 -8% | 708 -9% | 780 ? 0% |
| Access Time Read * (ms) | 0.117 | 0.087 26% | 0.098 16% | 0.1 15% | 0.1031 ? 12% |
| Access Time Write * (ms) | 0.036 | 0.02 44% | 0.095 -164% | 0.047 -31% | 0.03488 ? 3% |
| Score Read (Points) | 1096 | 701 -36% | 1034 -6% | 991 -10% | 1091 ? 0% |
| Score Write (Points) | 1016 | 1101 8% | 973 -4% | 885 -13% | 1027 ? 1% |
| Score Total (Points) | 2643 | 2143 -19% | 2536 -4% | 2365 -11% | 2643 ? 0% |
| Copy ISO MB/s (MB/s) | 1481 | 675 -54% | 1284 -13% | 1043 -30% | 1310 ? -12% |
| Copy Program MB/s (MB/s) | 467.5 | 248.4 -47% | 401.9 -14% | 252.7 -46% | 453 ? -3% |
| Copy Game MB/s (MB/s) | 734 | 535 -27% | 1013 38% | 483.6 -34% | 924 ? 26% |
| Totalt genomsnitt (program/inställningar) | -1% /
-3% | -5% /
-7% | -22% /
-21% | 2% /
2% |
* ... mindre är bättre
Dauerleistung Lesen: DiskSpd Read Loop, Queue Depth 8
| 3DMark 11 Performance | 17255 poäng | |
| 3DMark Ice Storm Standard Score | 178912 poäng | |
| 3DMark Cloud Gate Standard Score | 30548 poäng | |
| 3DMark Fire Strike Score | 13745 poäng | |
| 3DMark Time Spy Score | 5980 poäng | |
Hjälp | ||
| 3DMark 11 - 1280x720 Performance GPU | |
| Genomsnitt av klass Gaming (21841 - 80022, n=103, senaste 2 åren) | |
| Dell G5 15 SE 5505 P89F | |
| Lenovo Legion 5 15IMH05H | |
| Asus TUF Gaming A15 FA506IV-HN172 | |
| Genomsnitt NVIDIA GeForce RTX 2060 Mobile (19143 - 24662, n=40) | |
| Acer Nitro 5 AN517-52-77DS | |
| Lenovo Legion Y540-15IRH | |
| MSI Alpha 15 A3DDK-034 | |
| 3DMark | |
| 1280x720 Cloud Gate Standard Graphics | |
| Genomsnitt av klass Gaming (86886 - 223650, n=60, senaste 2 åren) | |
| Acer Nitro 5 AN517-52-77DS | |
| Lenovo Legion 5 15IMH05H | |
| Lenovo Legion Y540-15IRH | |
| Genomsnitt NVIDIA GeForce RTX 2060 Mobile (55324 - 116593, n=36) | |
| Dell G5 15 SE 5505 P89F | |
| Asus TUF Gaming A15 FA506IV-HN172 | |
| MSI Alpha 15 A3DDK-034 | |
| 1920x1080 Fire Strike Graphics | |
| Genomsnitt av klass Gaming (18629 - 62849, n=112, senaste 2 åren) | |
| Dell G5 15 SE 5505 P89F | |
| Genomsnitt NVIDIA GeForce RTX 2060 Mobile (14768 - 18358, n=43) | |
| Asus TUF Gaming A15 FA506IV-HN172 | |
| Acer Nitro 5 AN517-52-77DS | |
| Lenovo Legion 5 15IMH05H | |
| Lenovo Legion Y540-15IRH | |
| MSI Alpha 15 A3DDK-034 | |
| 2560x1440 Time Spy Graphics | |
| Genomsnitt av klass Gaming (6387 - 26212, n=112, senaste 2 åren) | |
| Dell G5 15 SE 5505 P89F | |
| Genomsnitt NVIDIA GeForce RTX 2060 Mobile (5660 - 6910, n=41) | |
| Lenovo Legion 5 15IMH05H | |
| Asus TUF Gaming A15 FA506IV-HN172 | |
| Acer Nitro 5 AN517-52-77DS | |
| MSI Alpha 15 A3DDK-034 | |
| The Witcher 3 - 1920x1080 Ultra Graphics & Postprocessing (HBAO+) | |
| Genomsnitt av klass Gaming (104.7 - 240, n=7, senaste 2 åren) | |
| Lenovo Legion 5 15IMH05H | |
| Dell G5 15 SE 5505 P89F | |
| Acer Nitro 5 AN517-52-77DS | |
| Genomsnitt NVIDIA GeForce RTX 2060 Mobile (50.6 - 74, n=40) | |
| Asus TUF Gaming A15 FA506IV-HN172 | |
| Lenovo Legion Y540-15IRH | |
| MSI Alpha 15 A3DDK-034 | |
| BioShock Infinite - 1920x1080 Ultra Preset, DX11 (DDOF) | |
| Lenovo Legion 5 15IMH05H | |
| Genomsnitt NVIDIA GeForce RTX 2060 Mobile (119 - 156, n=17) | |
| Acer Nitro 5 AN517-52-77DS | |
| Asus TUF Gaming A15 FA506IV-HN172 | |
| MSI Alpha 15 A3DDK-034 | |
| Shadow of the Tomb Raider - 1920x1080 Highest Preset AA:T | |
| Genomsnitt av klass Gaming (96 - 116, n=2, senaste 2 åren) | |
| Lenovo Legion 5 15IMH05H | |
| Genomsnitt NVIDIA GeForce RTX 2060 Mobile (54 - 86, n=22) | |
| Acer Nitro 5 AN517-52-77DS | |
| Dell G5 15 SE 5505 P89F | |
| Red Dead Redemption 2 - 1920x1080 High Settings | |
| Lenovo Legion 5 15IMH05H | |
| Genomsnitt NVIDIA GeForce RTX 2060 Mobile (50.7 - 56.2, n=5) | |
| Acer Nitro 5 AN517-52-77DS | |
| Far Cry 5 - 1920x1080 Ultra Preset AA:T | |
| Genomsnitt av klass Gaming (70 - 151, n=6, senaste 2 åren) | |
| Lenovo Legion 5 15IMH05H | |
| Genomsnitt NVIDIA GeForce RTX 2060 Mobile (76 - 90, n=9) | |
| Gears Tactics - 1920x1080 Ultra Preset | |
| Dell G5 15 SE 5505 P89F | |
| Lenovo Legion 5 15IMH05H | |
| Genomsnitt NVIDIA GeForce RTX 2060 Mobile (60.7 - 71.3, n=7) | |
| Acer Nitro 5 AN517-52-77DS | |
| låg | med. | hög | ultra | |
|---|---|---|---|---|
| BioShock Infinite (2013) | 349.9 | 315.9 | 288.8 | 144.4 |
| The Witcher 3 (2015) | 275.4 | 204.8 | 124.8 | 68.3 |
| Dota 2 Reborn (2015) | 140.9 | 128.9 | 118.8 | 113.1 |
| X-Plane 11.11 (2018) | 85.6 | 78.5 | 68.1 | |
| Far Cry 5 (2018) | 114 | 97 | 91 | 85 |
| Shadow of the Tomb Raider (2018) | 125 | 97 | 90 | 81 |
| Total War: Three Kingdoms (2019) | 215.3 | 108.3 | 71.7 | 50.6 |
| F1 2019 (2019) | 185 | 166 | 137 | 127 |
| Red Dead Redemption 2 (2019) | 117.9 | 81.6 | 55.1 | 35.1 |
| Doom Eternal (2020) | 204.9 | 140 | 126.9 | 126.1 |
| Gears Tactics (2020) | 228.8 | 151.8 | 99.3 | 68.1 |
Ljudnivå
| Låg belastning |
| 30.7 / 30.7 / 30.7 dB(A) |
| Hög belastning |
| 36.6 / 50.9 dB(A) |
 | ||
30 dB tyst 40 dB(A) hörbar 50 dB(A) högt ljud |
||
min: | ||
| Lenovo Legion 5 15IMH05H i5-10300H, GeForce RTX 2060 Mobile | Asus TUF Gaming A15 FA506IV-HN172 R7 4800H, GeForce RTX 2060 Mobile | Dell G5 15 SE 5505 P89F R7 4800H, Radeon RX 5600M | MSI Alpha 15 A3DDK-034 R7 3750H, Radeon RX 5500M | Lenovo Legion Y540-15IRH i7-9750H, GeForce RTX 2060 Mobile | Genomsnitt NVIDIA GeForce RTX 2060 Mobile | Genomsnitt av klass Gaming | |
|---|---|---|---|---|---|---|---|
| Noise | -0% | 7% | -20% | -5% | -2% | 4% | |
| av / miljö * (dB) | 30.7 | 30.2 2% | 28 9% | 29 6% | 30 2% | 27.9 ? 9% | 24.1 ? 21% |
| Idle Minimum * (dB) | 30.7 | 30.2 2% | 28 9% | 36 -17% | 30 2% | 29 ? 6% | 25.9 ? 16% |
| Idle Average * (dB) | 30.7 | 30.2 2% | 28 9% | 37 -21% | 32 -4% | 30 ? 2% | 27.4 ? 11% |
| Idle Maximum * (dB) | 30.7 | 30.2 2% | 28 9% | 46 -50% | 34 -11% | 33 ? -7% | 30.1 ? 2% |
| Load Average * (dB) | 36.6 | 40 -9% | 28 23% | 50 -37% | 44 -20% | 44 ? -20% | 43.7 ? -19% |
| Witcher 3 ultra * (dB) | 47 | 49 -4% | 50.6 -8% | 51 -9% | 48 -2% | ||
| Load Maximum * (dB) | 50.9 | 49 4% | 50.6 1% | 57 -12% | 52 -2% | 51.6 ? -1% | 54.3 ? -7% |
* ... mindre är bättre
(-) Den maximala temperaturen på ovansidan är 46.3 °C / 115 F, jämfört med genomsnittet av 40.4 °C / 105 F , allt från 21.2 till 68.8 °C för klassen Gaming.
(±) Botten värms upp till maximalt 44.4 °C / 112 F, jämfört med genomsnittet av 43.2 °C / 110 F
(+) Vid tomgångsbruk är medeltemperaturen för ovansidan 26.6 °C / 80 F, jämfört med enhetsgenomsnittet på 33.9 °C / ### class_avg_f### F.
(±) När du spelar The Witcher 3 är medeltemperaturen för ovansidan 34.6 °C / 94 F, jämfört med enhetsgenomsnittet på 33.9 °C / ## #class_avg_f### F.
(+) Handledsstöden och pekplattan är kallare än hudtemperaturen med maximalt 27 °C / 80.6 F och är därför svala att ta på.
(±) Medeltemperaturen för handledsstödsområdet på liknande enheter var 28.8 °C / 83.8 F (+1.8 °C / 3.2 F).
| Lenovo Legion 5 15IMH05H i5-10300H, GeForce RTX 2060 Mobile | Asus TUF Gaming A15 FA506IV-HN172 R7 4800H, GeForce RTX 2060 Mobile | Dell G5 15 SE 5505 P89F R7 4800H, Radeon RX 5600M | MSI Alpha 15 A3DDK-034 R7 3750H, Radeon RX 5500M | Lenovo Legion Y540-15IRH i7-9750H, GeForce RTX 2060 Mobile | Genomsnitt NVIDIA GeForce RTX 2060 Mobile | Genomsnitt av klass Gaming | |
|---|---|---|---|---|---|---|---|
| Heat | 1% | -12% | 2% | -27% | -11% | -8% | |
| Maximum Upper Side * (°C) | 46.3 | 42.9 7% | 53 -14% | 44 5% | 47 -2% | 47.2 ? -2% | 45.1 ? 3% |
| Maximum Bottom * (°C) | 44.4 | 49.9 -12% | 57.6 -30% | 49 -10% | 60 -35% | 52.7 ? -19% | 48.1 ? -8% |
| Idle Upper Side * (°C) | 28.1 | 27.8 1% | 27.4 2% | 26 7% | 37 -32% | 31 ? -10% | 31 ? -10% |
| Idle Bottom * (°C) | 29.4 | 27 8% | 31 -5% | 28 5% | 41 -39% | 32.9 ? -12% | 34.2 ? -16% |
* ... mindre är bättre
Lenovo Legion 5 15IMH05H ljudanalys
(-) | inte särskilt höga högtalare (65.2 dB)
Bas 100 - 315 Hz
(-) | nästan ingen bas - i genomsnitt 15.8% lägre än medianen
(±) | linjäriteten för basen är genomsnittlig (13.4% delta till föregående frekvens)
Mellan 400 - 2000 Hz
(+) | balanserad mellan - endast 3.9% från medianen
(+) | mids är linjära (3.4% delta till föregående frekvens)
Högsta 2 - 16 kHz
(+) | balanserade toppar - endast 2.2% från medianen
(+) | toppar är linjära (6.5% delta till föregående frekvens)
Totalt 100 - 16 000 Hz
(±) | linjäriteten för det totala ljudet är genomsnittlig (19.1% skillnad mot median)
Jämfört med samma klass
» 64% av alla testade enheter i den här klassen var bättre, 7% liknande, 28% sämre
» Den bästa hade ett delta på 6%, genomsnittet var 18%, sämst var 132%
Jämfört med alla testade enheter
» 46% av alla testade enheter var bättre, 7% liknande, 47% sämre
» Den bästa hade ett delta på 4%, genomsnittet var 23%, sämst var 134%
| Av/Standby | |
| Låg belastning | |
| Hög belastning |
|
Förklaring:
min: | |
| Lenovo Legion 5 15IMH05H i5-10300H, GeForce RTX 2060 Mobile | Asus TUF Gaming A15 FA506IV-HN172 R7 4800H, GeForce RTX 2060 Mobile | Dell G5 15 SE 5505 P89F R7 4800H, Radeon RX 5600M | MSI Alpha 15 A3DDK-034 R7 3750H, Radeon RX 5500M | Lenovo Legion Y540-15IRH i7-9750H, GeForce RTX 2060 Mobile | Genomsnitt NVIDIA GeForce RTX 2060 Mobile | Genomsnitt av klass Gaming | |
|---|---|---|---|---|---|---|---|
| Power Consumption | -24% | -26% | -114% | -132% | -113% | -138% | |
| Idle Minimum * (Watt) | 3.2 | 5.4 -69% | 6.5 -103% | 14 -338% | 15 -369% | 11.5 ? -259% | 13.1 ? -309% |
| Idle Average * (Watt) | 8.3 | 10 -20% | 10.6 -28% | 18 -117% | 20 -141% | 16.5 ? -99% | 19 ? -129% |
| Idle Maximum * (Watt) | 8.7 | 10.5 -21% | 11 -26% | 32 -268% | 33 -279% | 23.7 ? -172% | 24.6 ? -183% |
| Load Average * (Watt) | 82 | 135 -65% | 84.1 -3% | 64 22% | 88 -7% | 107.5 ? -31% | 111.3 ? -36% |
| Witcher 3 ultra * (Watt) | 151 | 144 5% | 152.9 -1% | 123 19% | 128 15% | ||
| Load Maximum * (Watt) | 195 | 147 25% | 180.4 7% | 193 1% | 213 -9% | 199.7 ? -2% | 260 ? -33% |
* ... mindre är bättre
| Lenovo Legion 5 15IMH05H i5-10300H, GeForce RTX 2060 Mobile, 60 Wh | Asus TUF Gaming A15 FA506IV-HN172 R7 4800H, GeForce RTX 2060 Mobile, 48 Wh | Dell G5 15 SE 5505 P89F R7 4800H, Radeon RX 5600M, 51 Wh | MSI Alpha 15 A3DDK-034 R7 3750H, Radeon RX 5500M, 51 Wh | Lenovo Legion Y540-15IRH i7-9750H, GeForce RTX 2060 Mobile, 57 Wh | Acer Nitro 5 AN517-52-77DS i7-10750H, GeForce RTX 2060 Mobile, 57.48 Wh | Genomsnitt av klass Gaming | |
|---|---|---|---|---|---|---|---|
| Batteridrifttid | -12% | -9% | -51% | -50% | -2% | -12% | |
| Reader / Idle (h) | 14.1 | 9.8 -30% | 11.2 -21% | 5.8 -59% | 3.9 -72% | 11 -22% | 7.84 ? -44% |
| H.264 (h) | 9.2 | 5.4 -41% | 3.9 -58% | 7.3 -21% | 8.27 ? -10% | ||
| WiFi v1.3 (h) | 7.2 | 6.2 -14% | 6.2 -14% | 4.1 -43% | 3.2 -56% | 6.6 -8% | 7.1 ? -1% |
| Load (h) | 1.4 | 1.9 36% | 1.5 7% | 0.8 -43% | 1.1 -21% | 2 43% | 1.496 ? 7% |
För
Emot
Läs den fullständiga versionen av den här recensionen på engelska här.
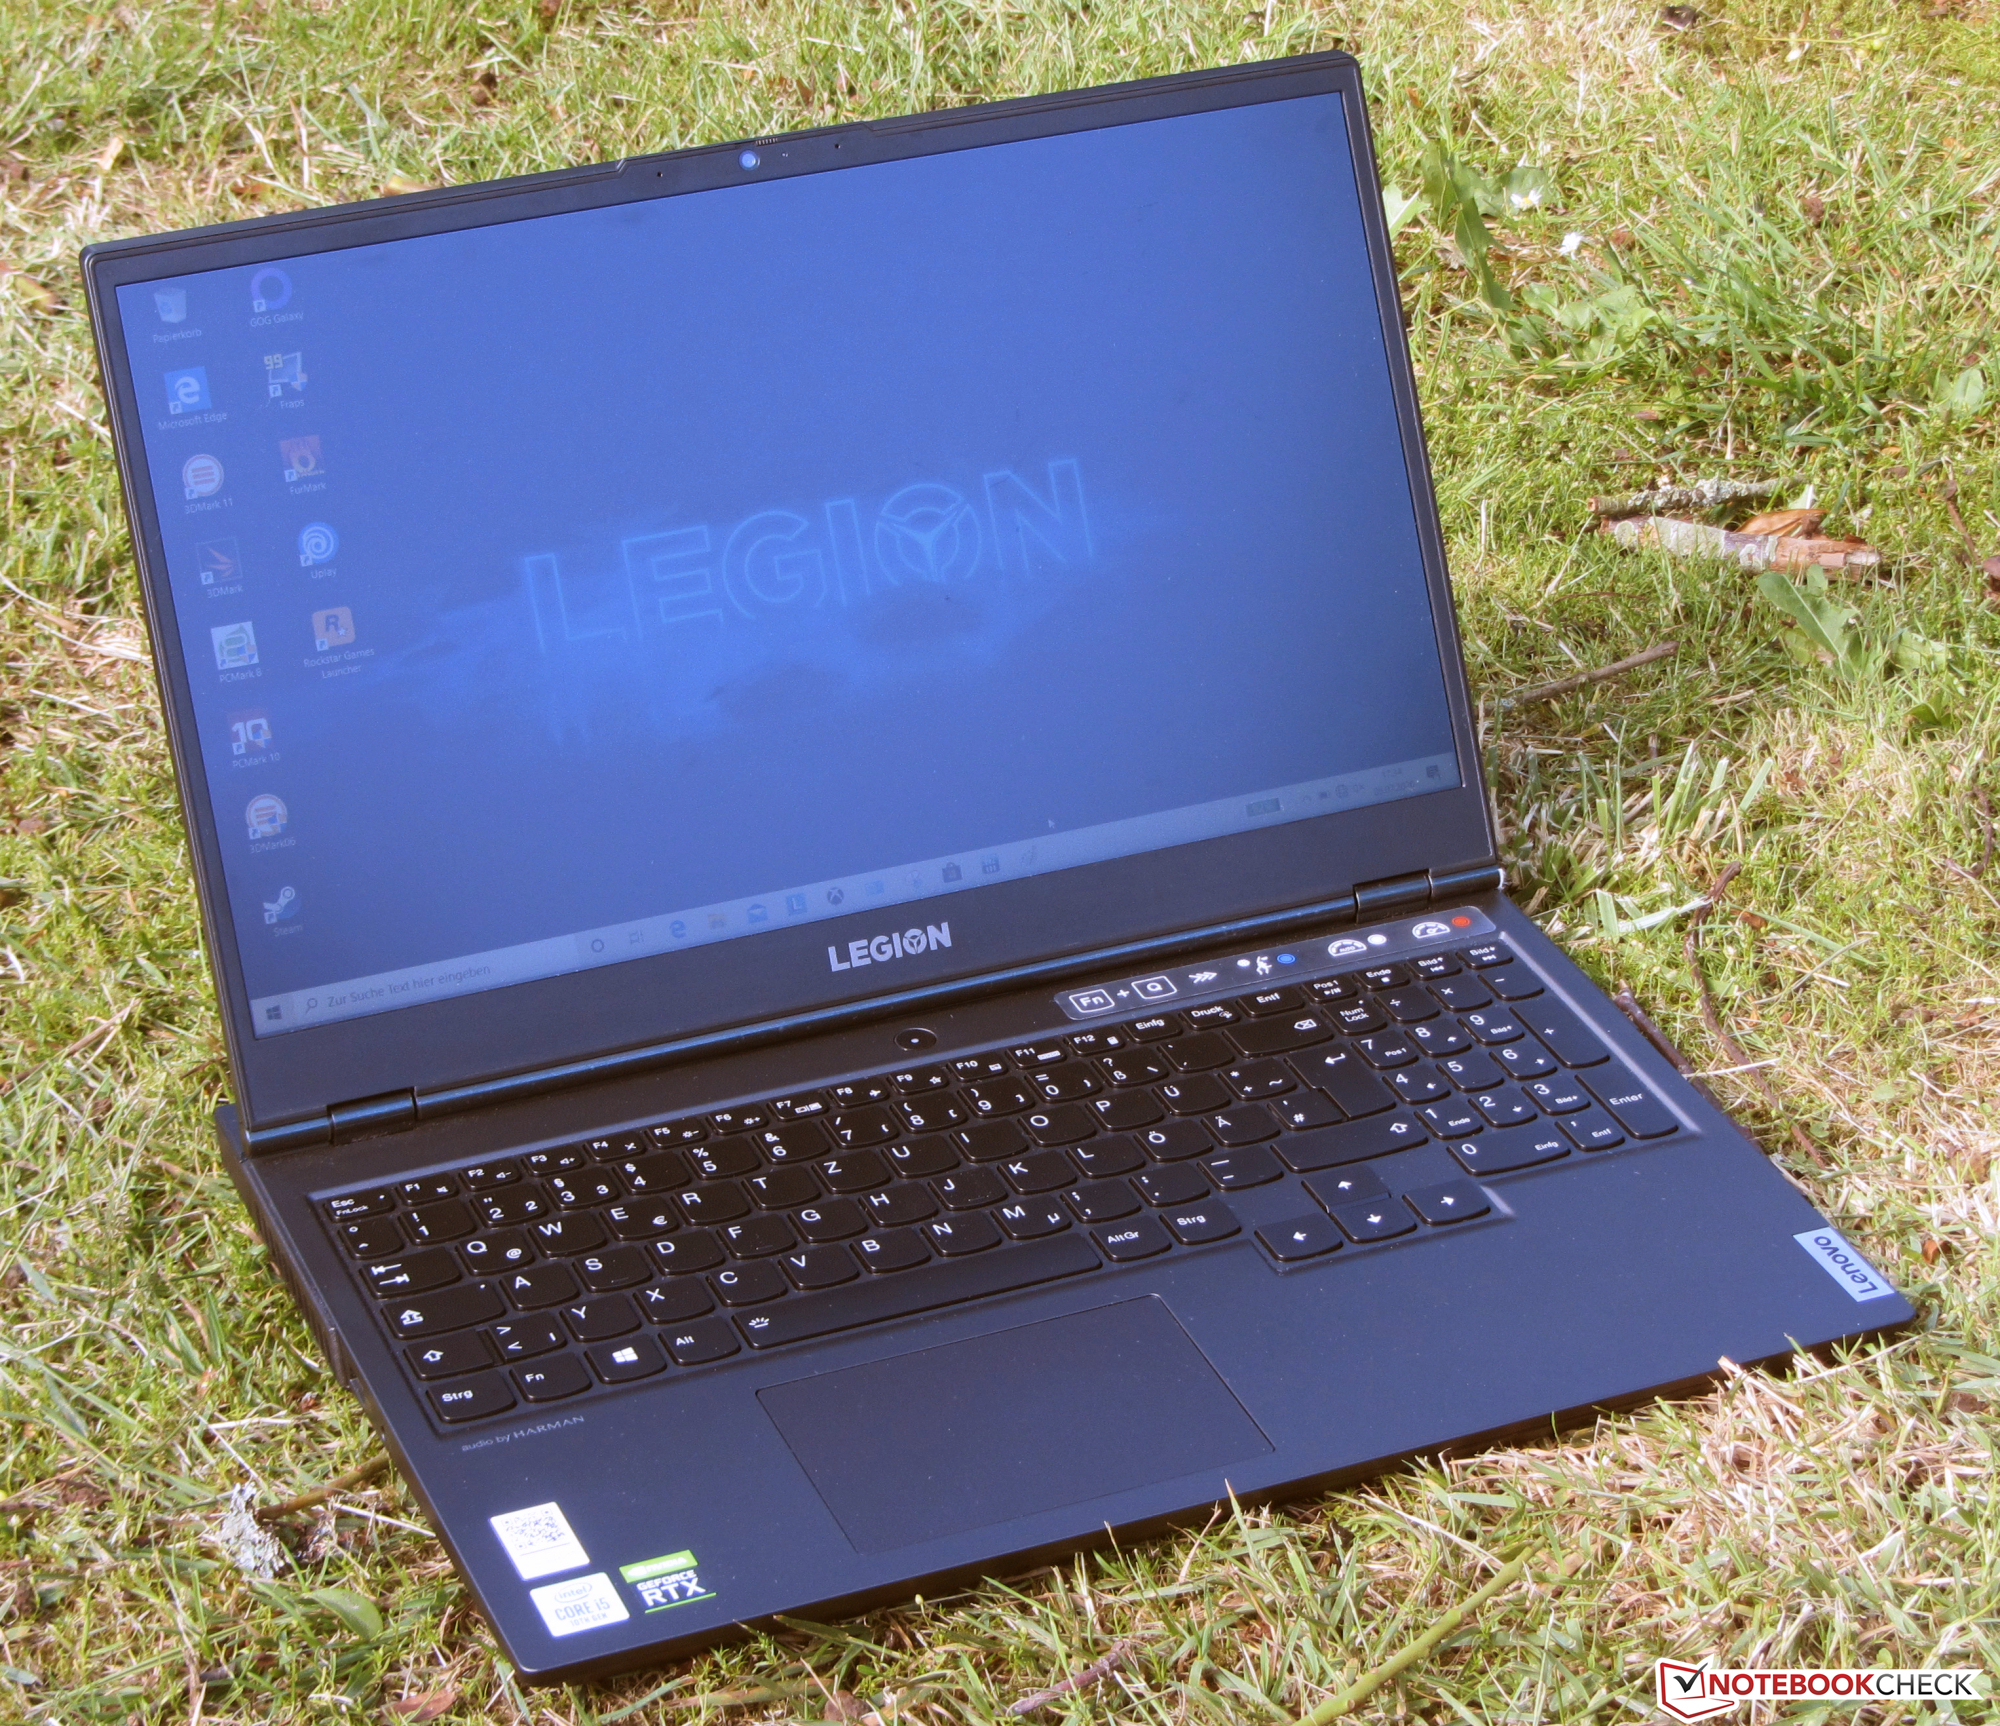
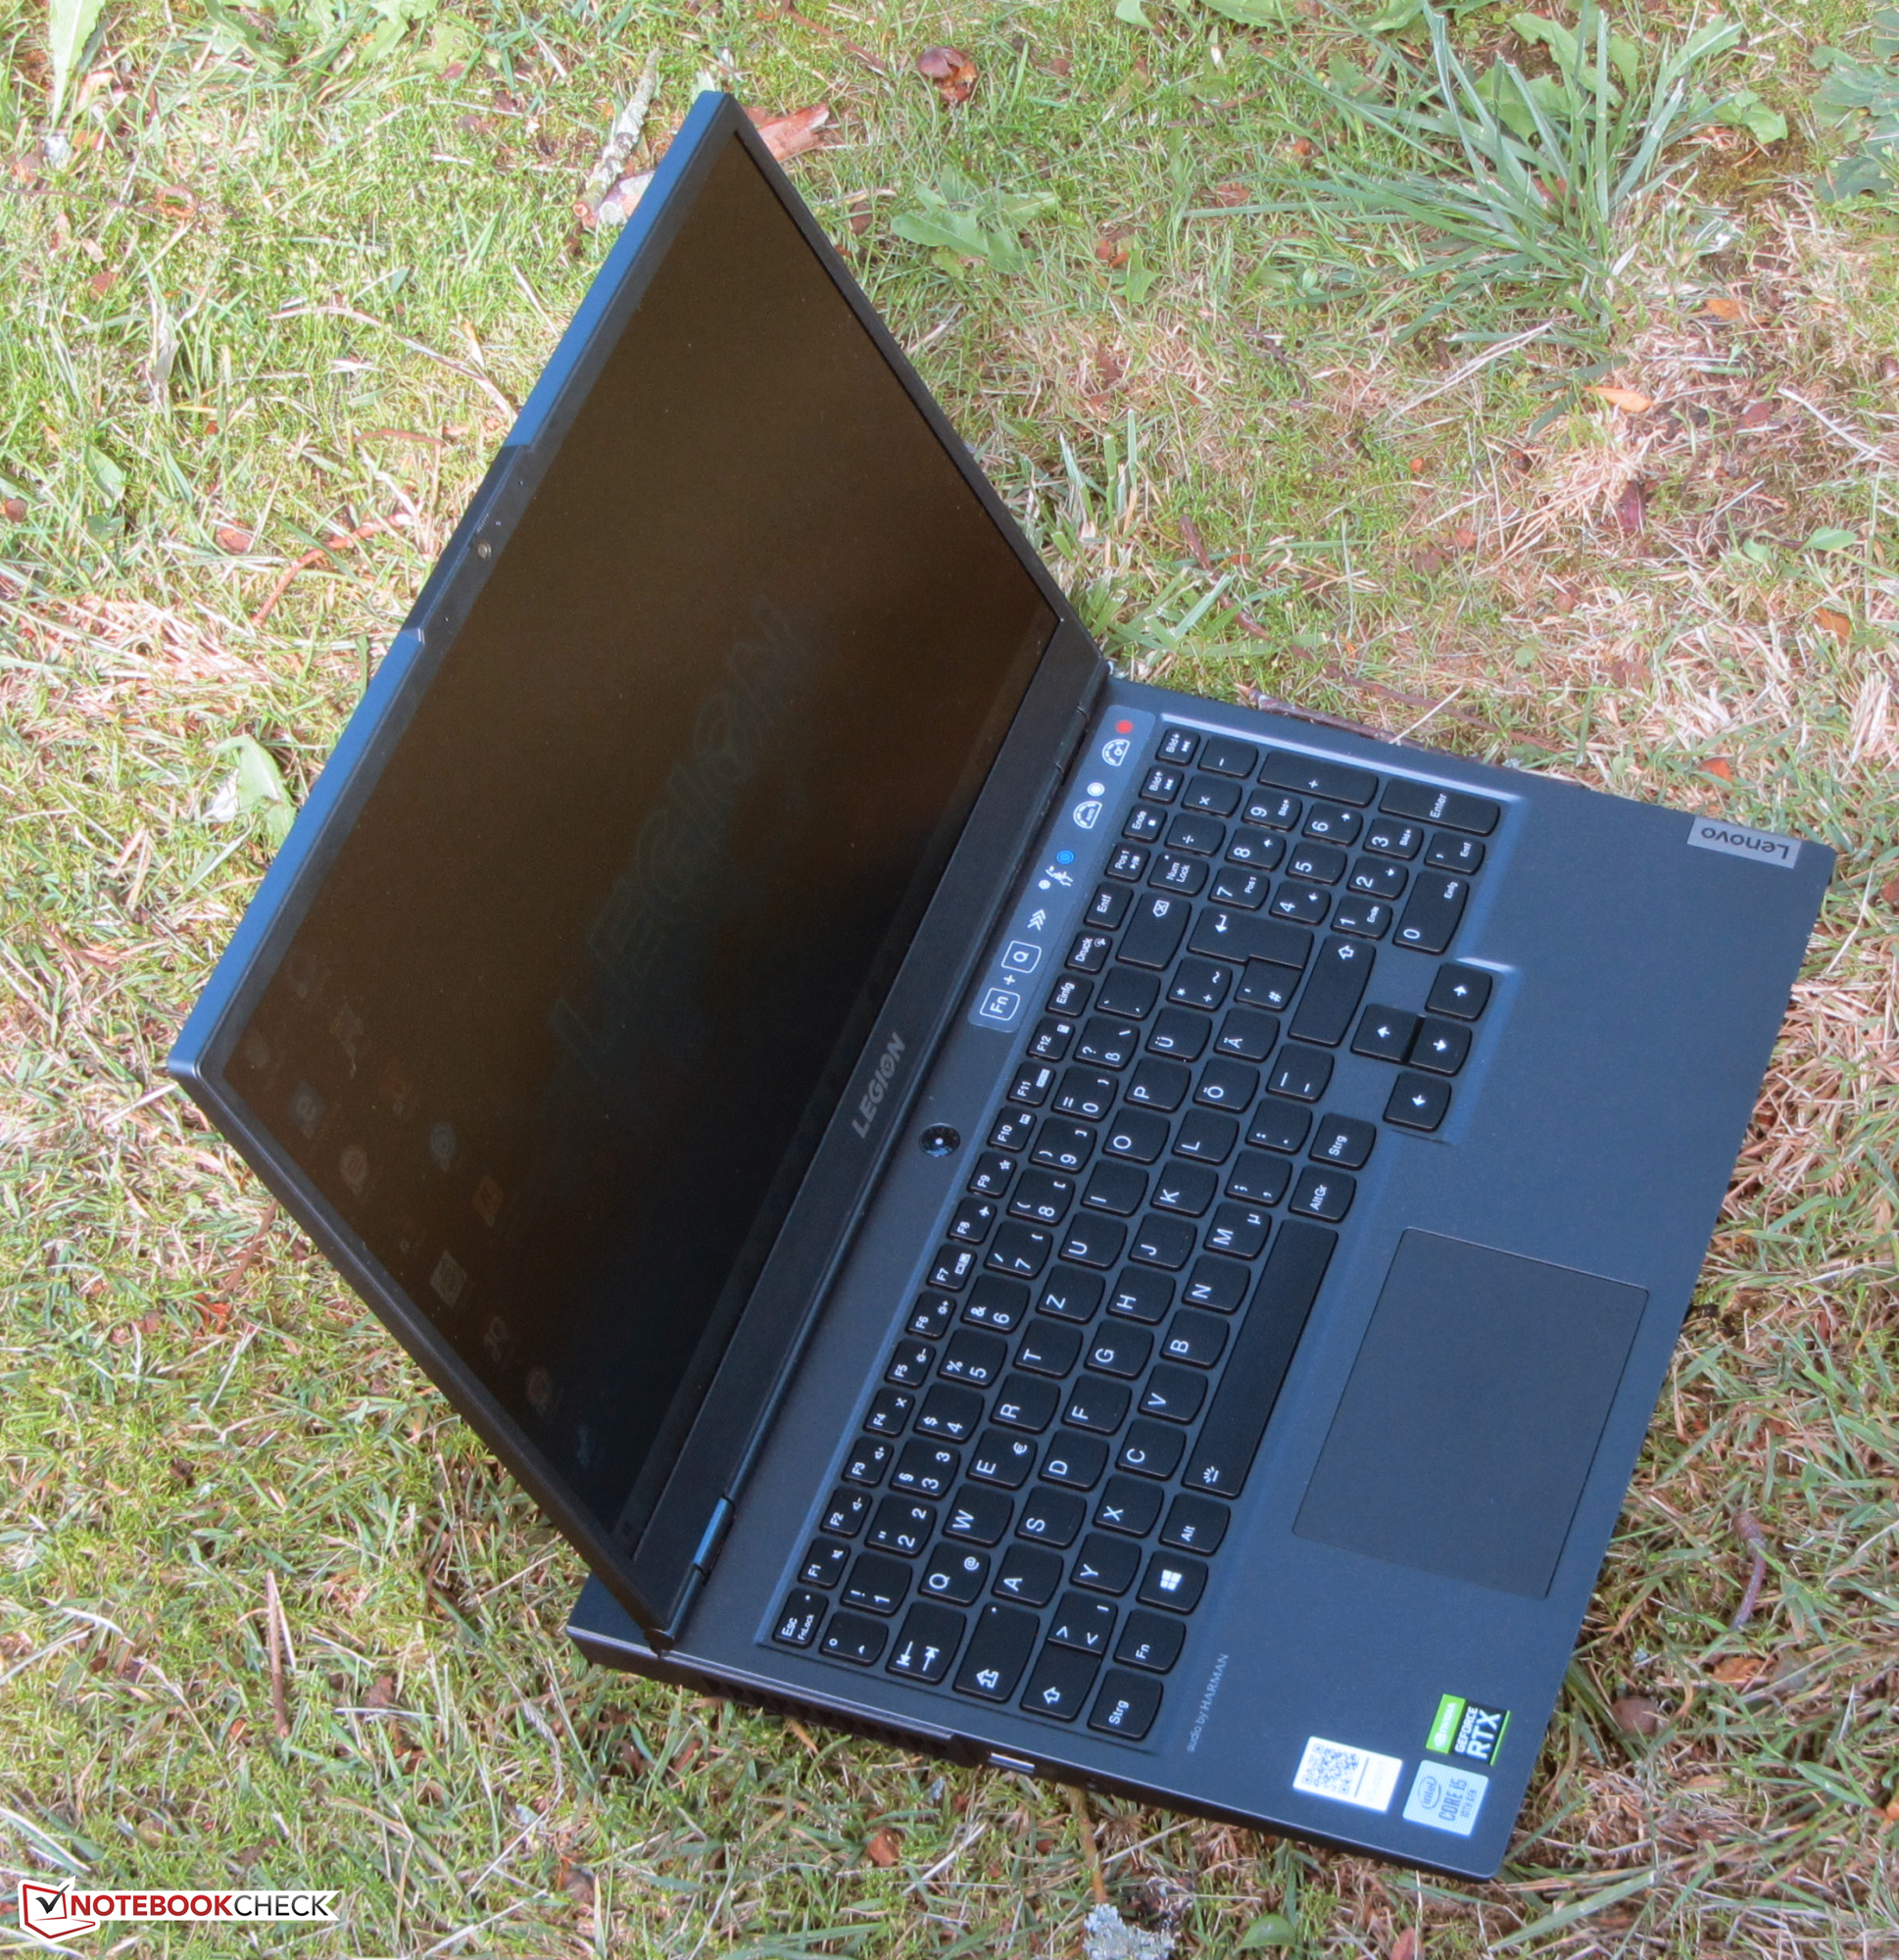
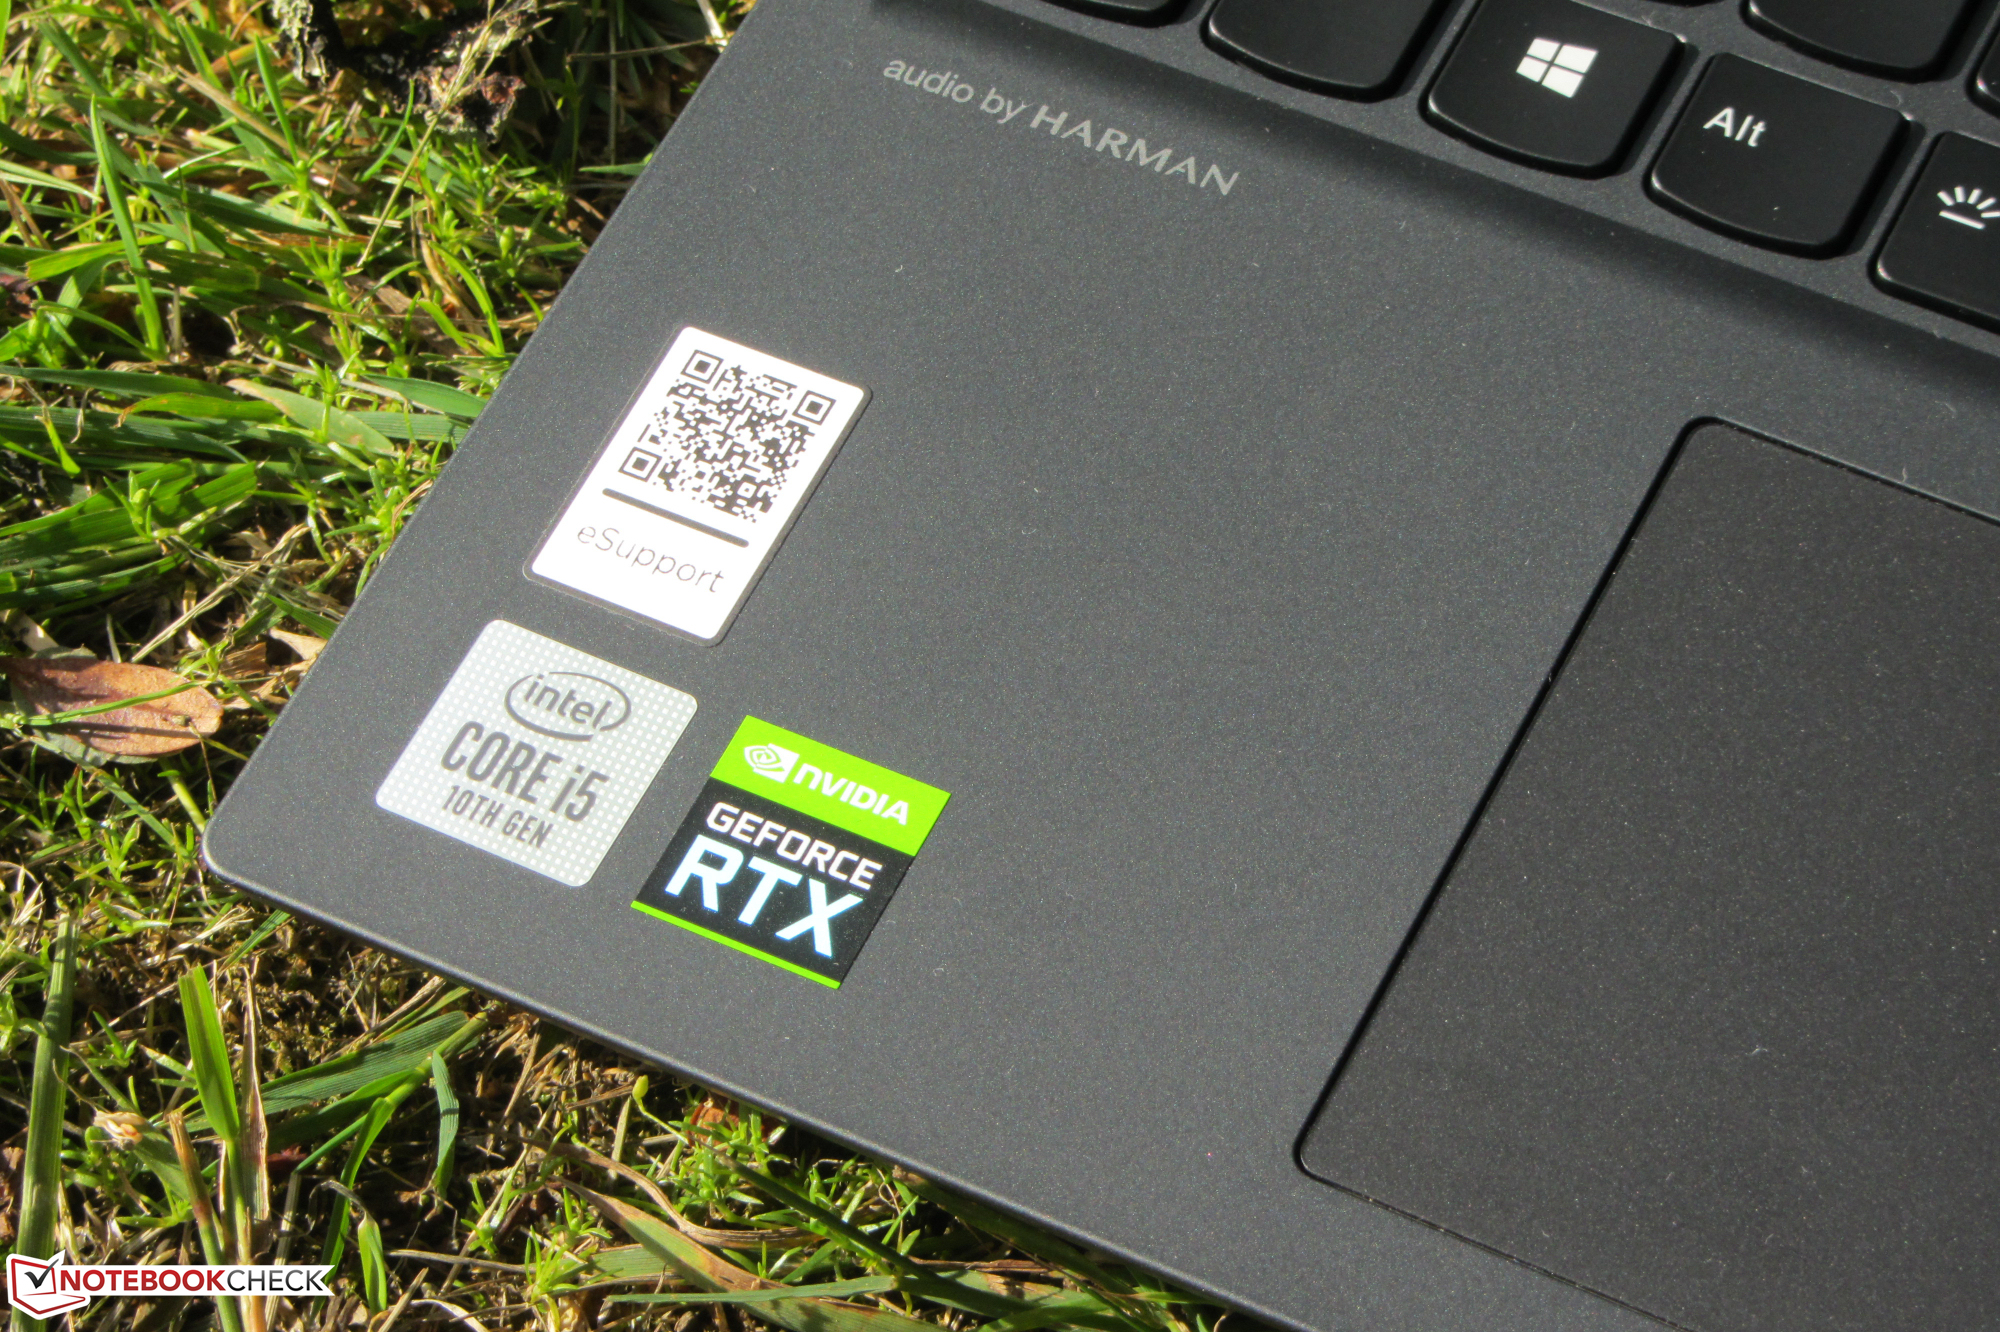
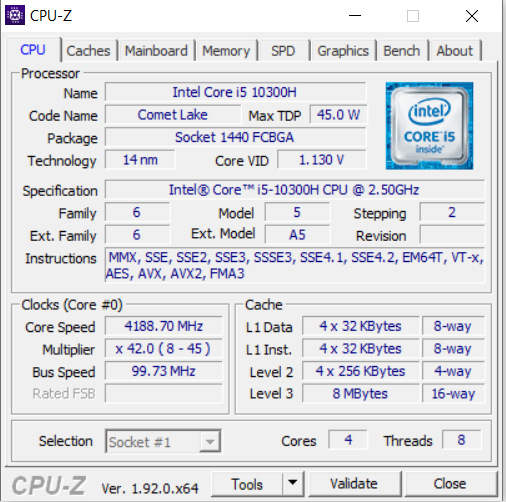
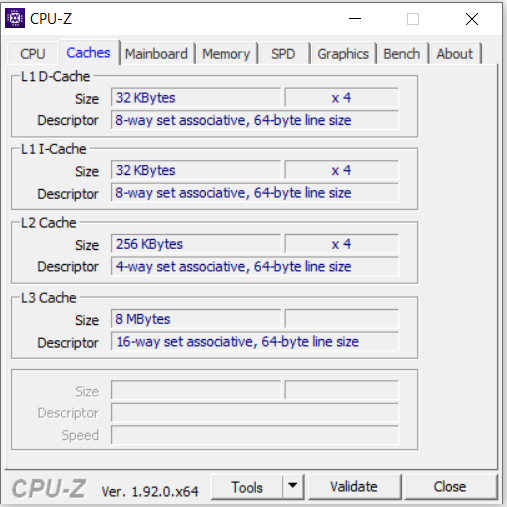
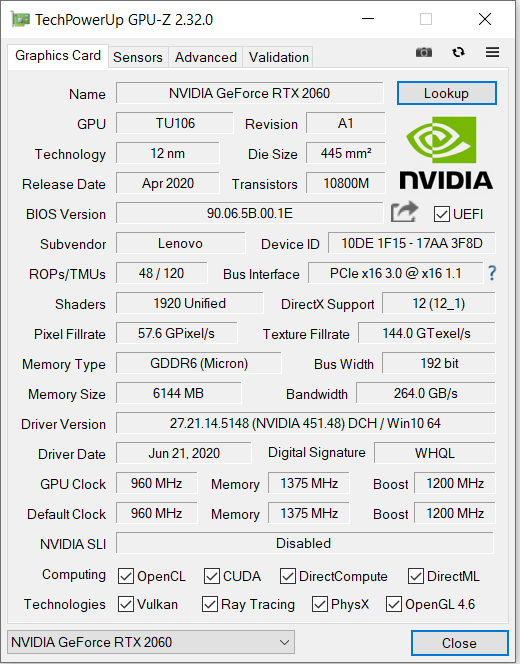
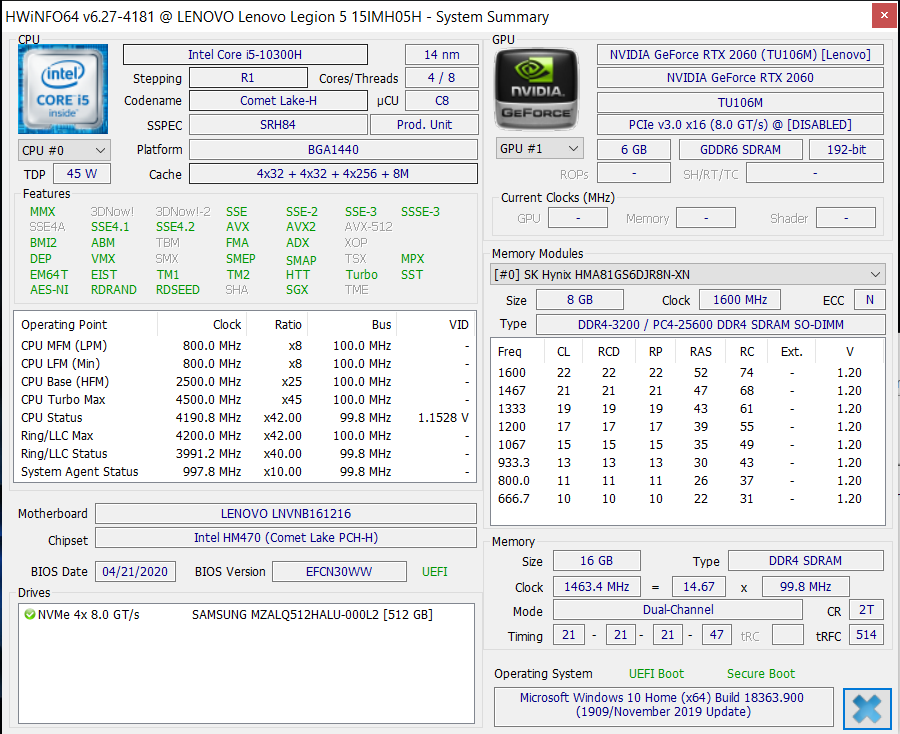
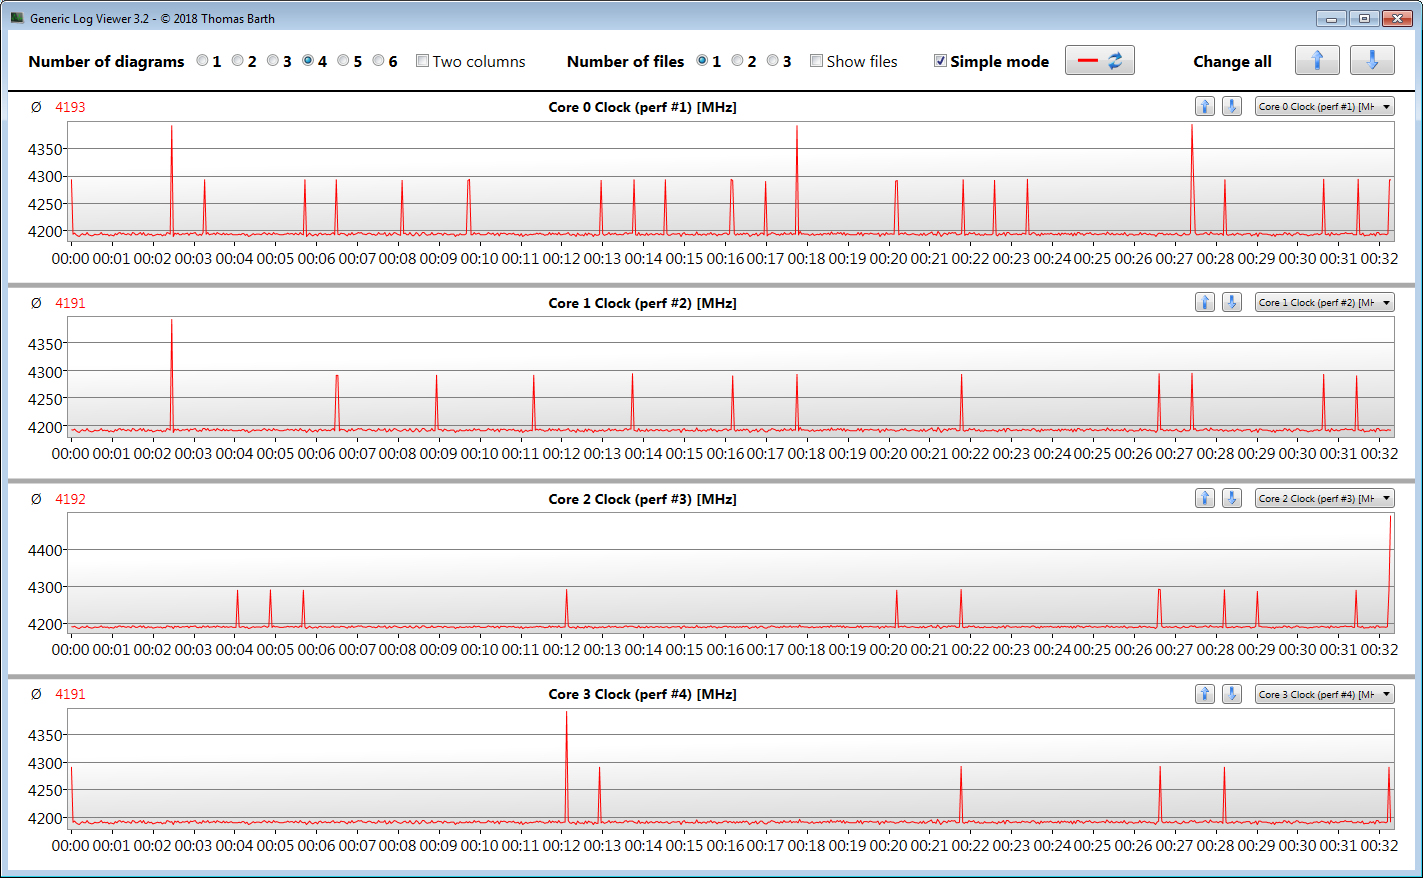
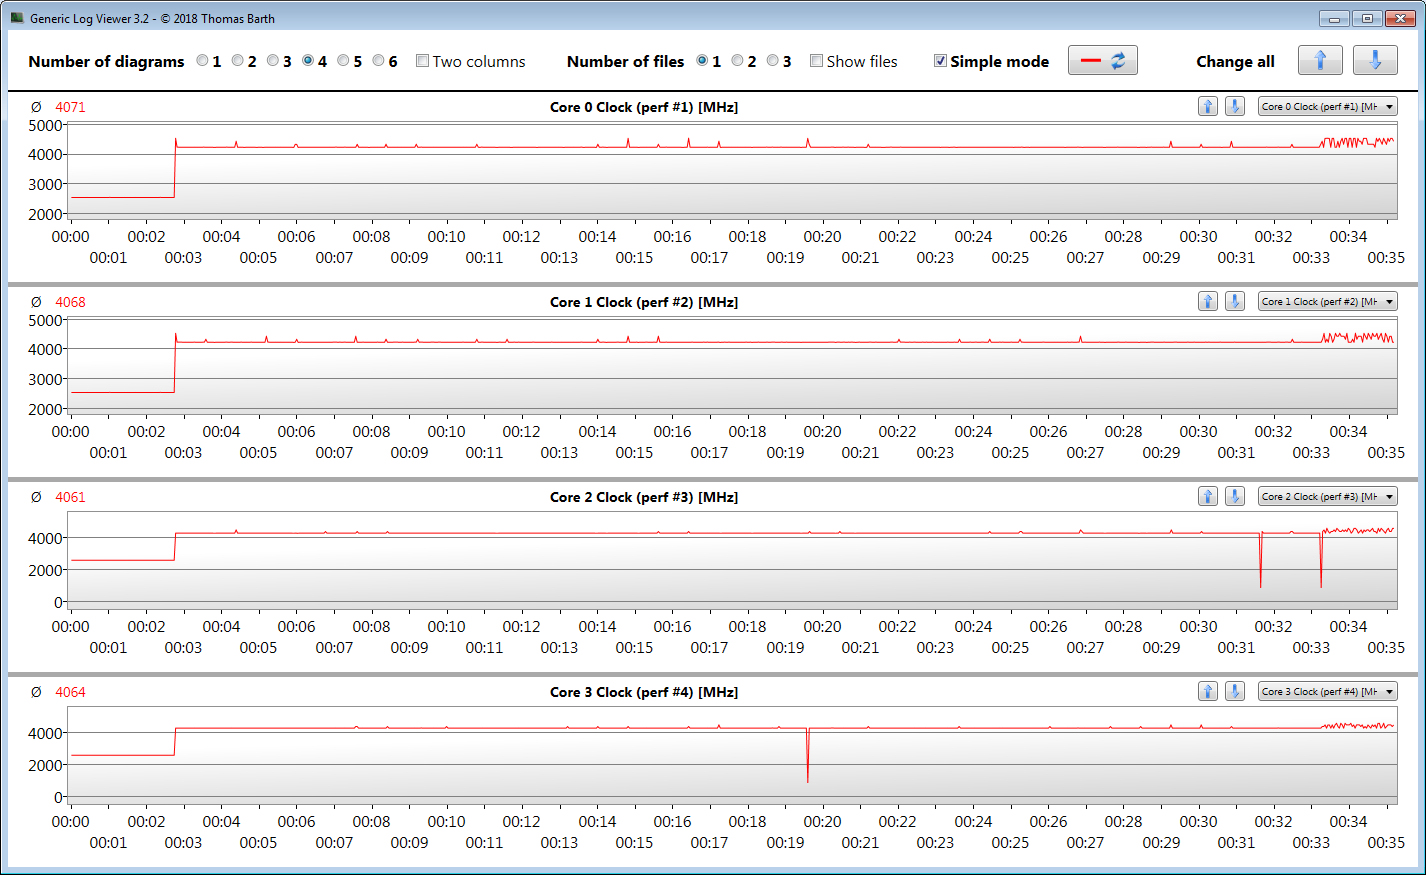
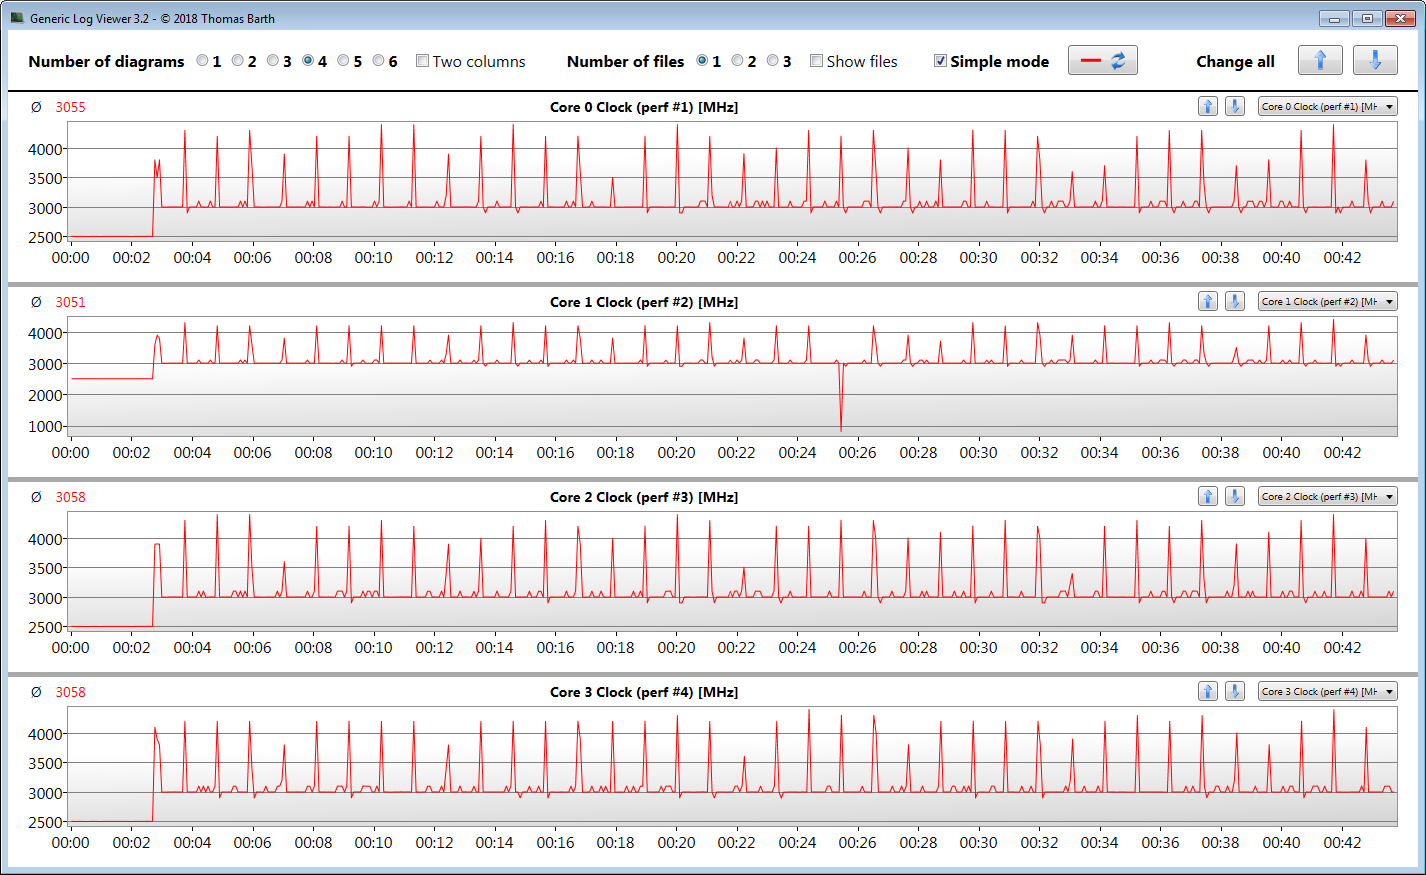
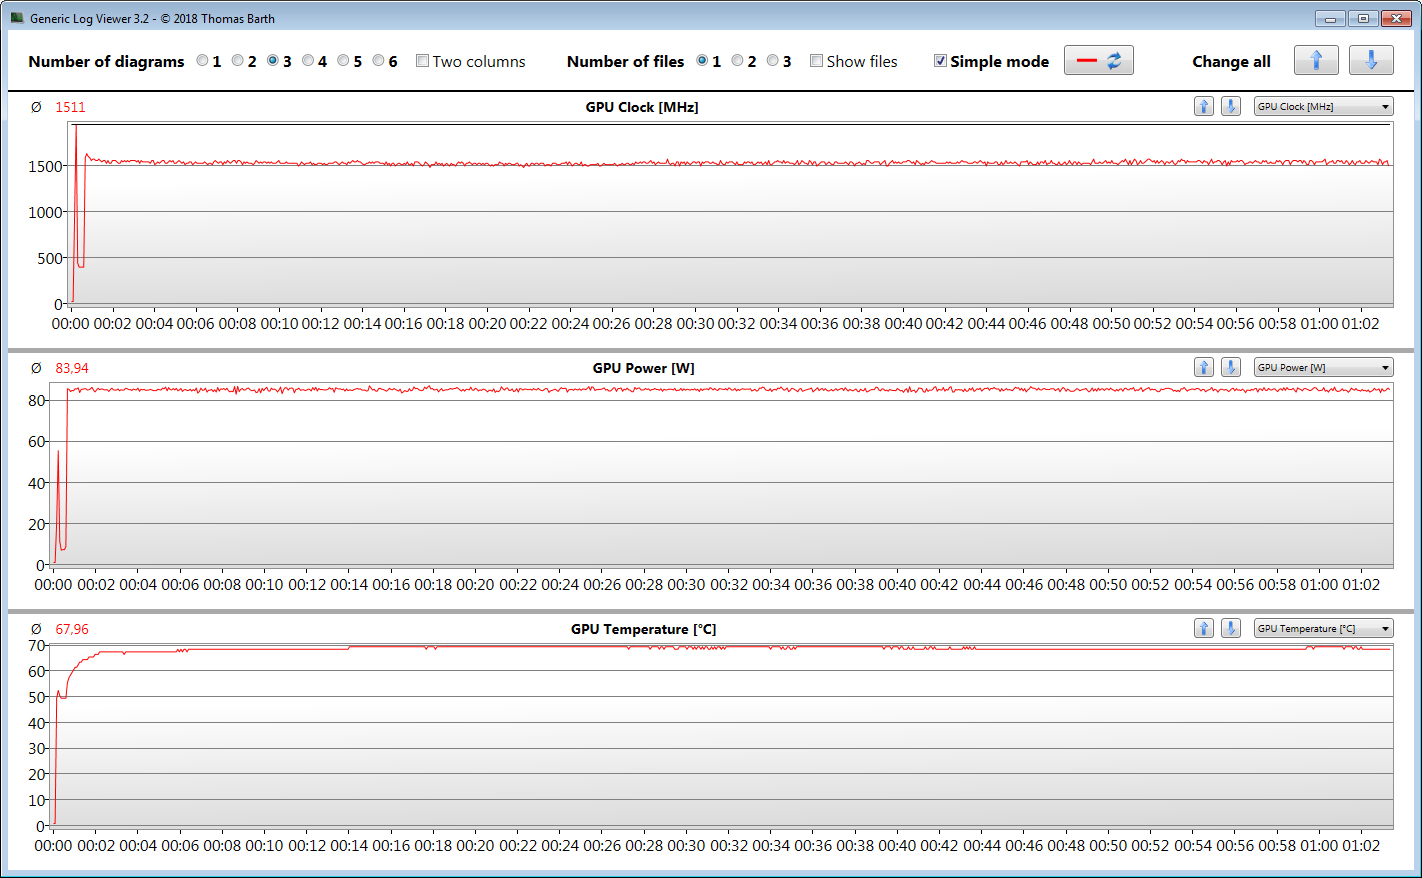
Med sin kombination av en Core-i5-10300H processor och ett GeForce-RTX-2060 grafikchip kan Lenovo Legion 5 visa alla moderna datorspel smidigt på sin 120 Hz-skärm. De flesta spelen går att spela i Full HD-upplösning med höga eller maximala grafikinställningar. Både CPU och GPU kan upprätthålla höga klockfrekvenser under längre stunder.
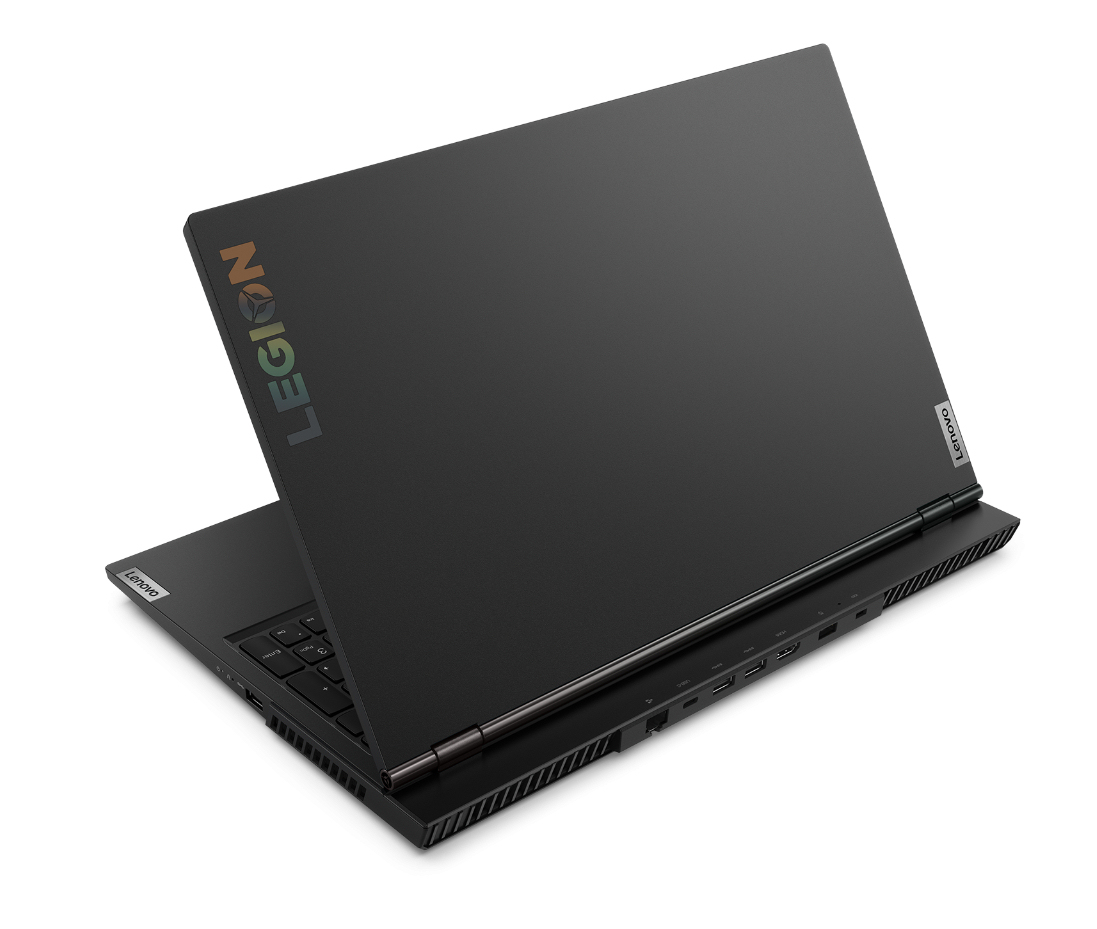
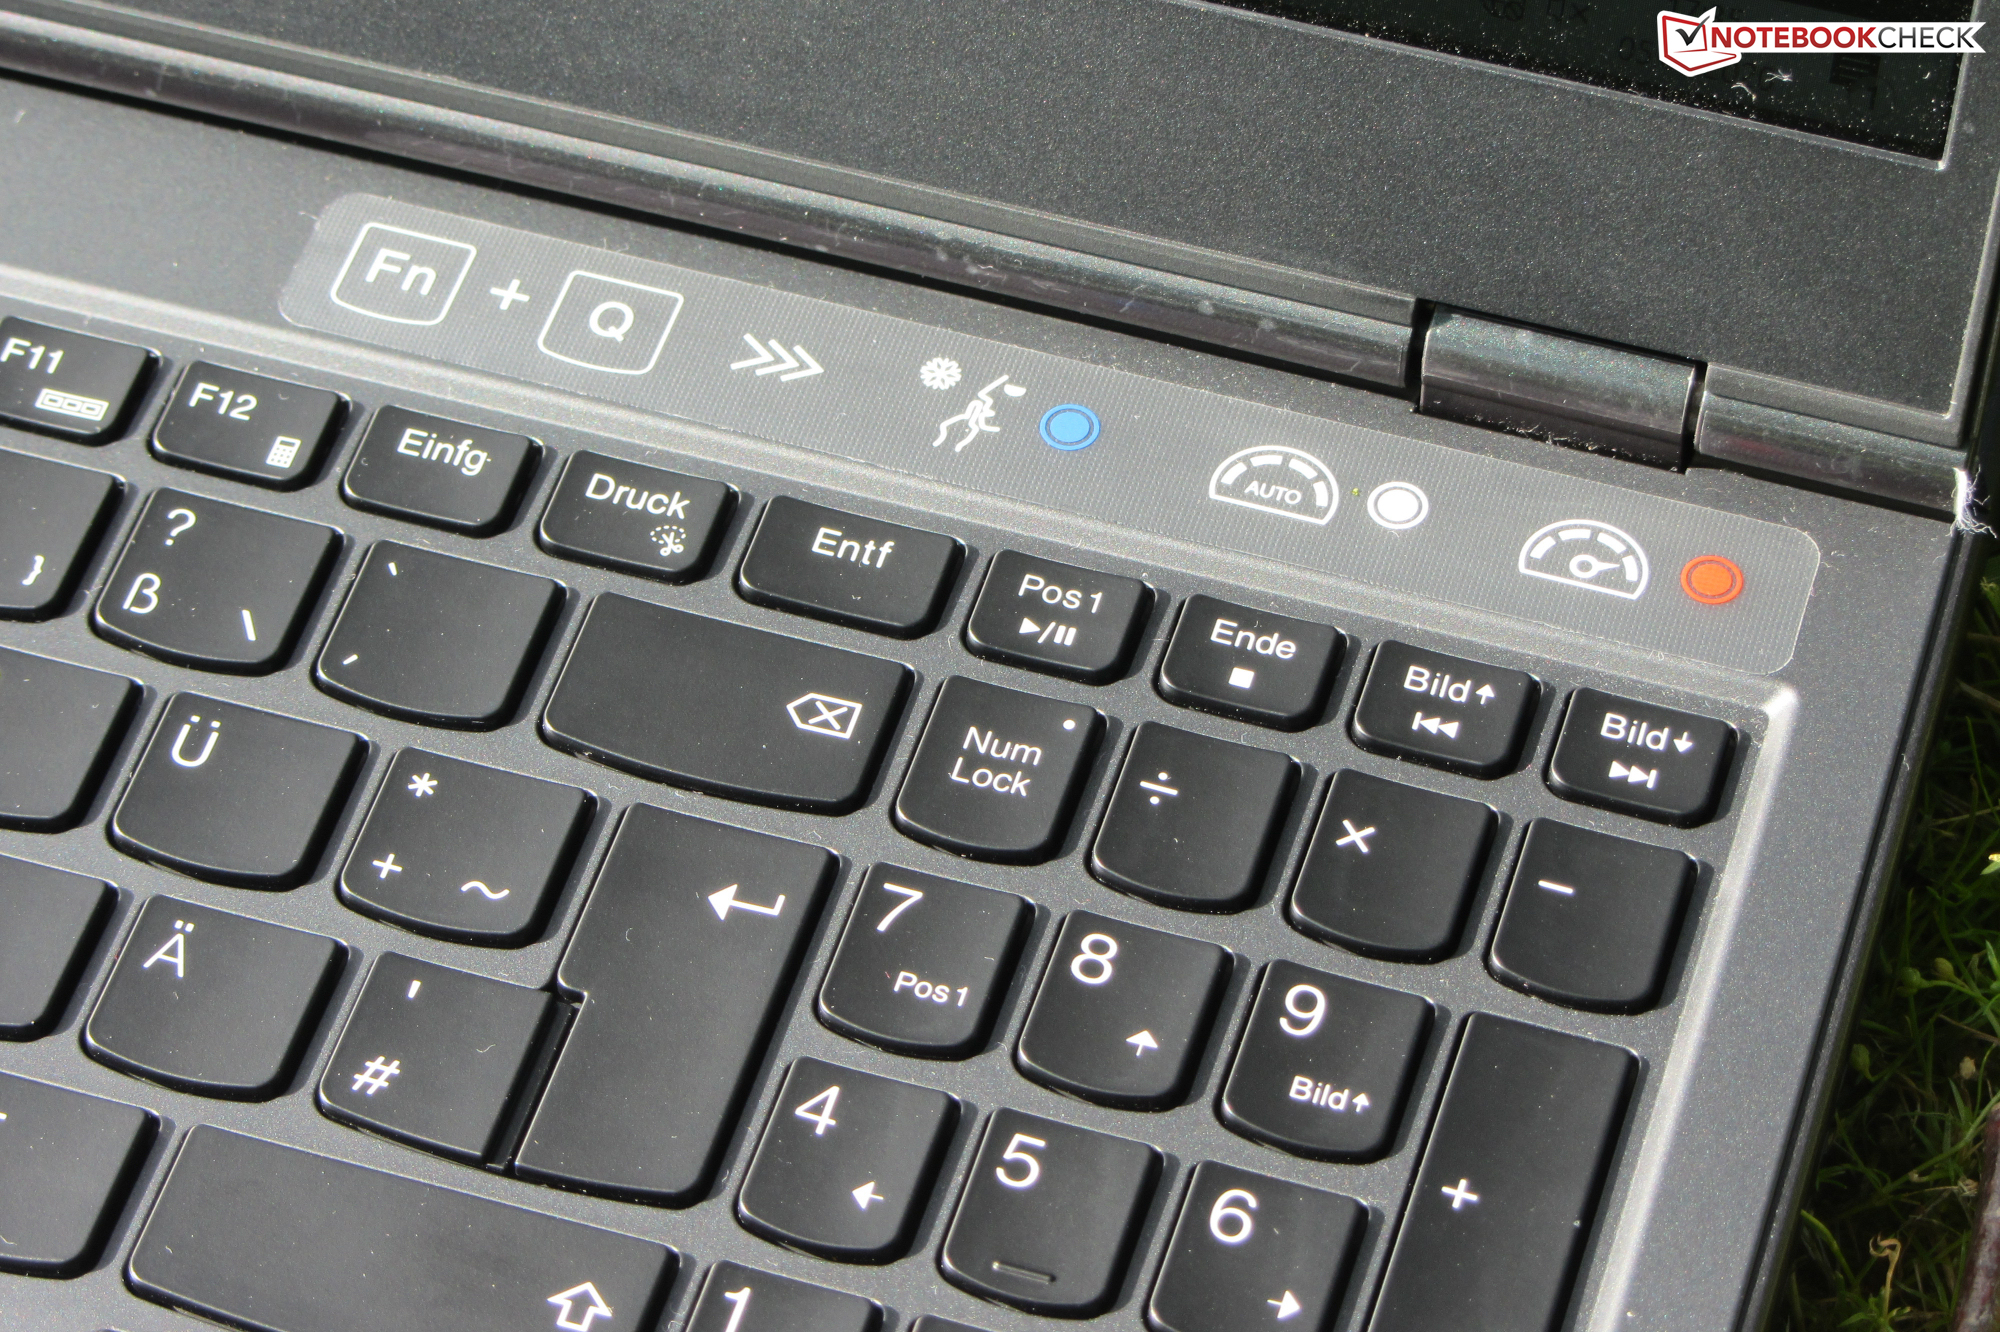
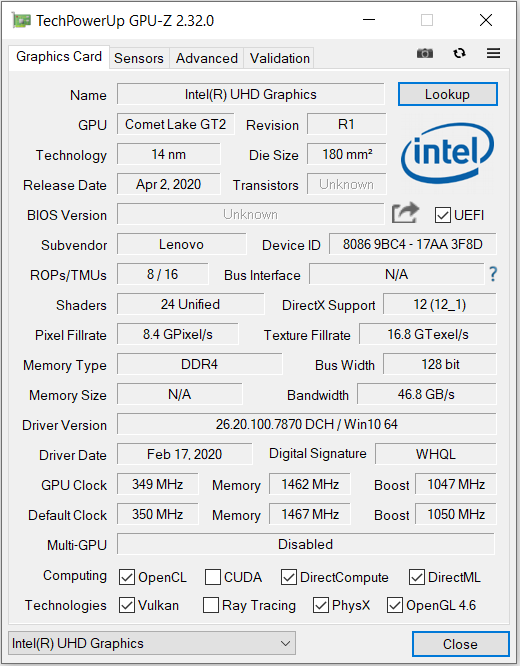
Legion 5 låter användaren slå på och av den integrerade GPU:n.
Den har en integrerad UHD Graphics 630 som kan aktiveras eller deaktiveras med en knapptryckning. Batteritiden är riktigt bra när iGPU:n är på, men den håller inte lika länge om den mer krävande GeForce RTX 2060 GPU:n arbetar.
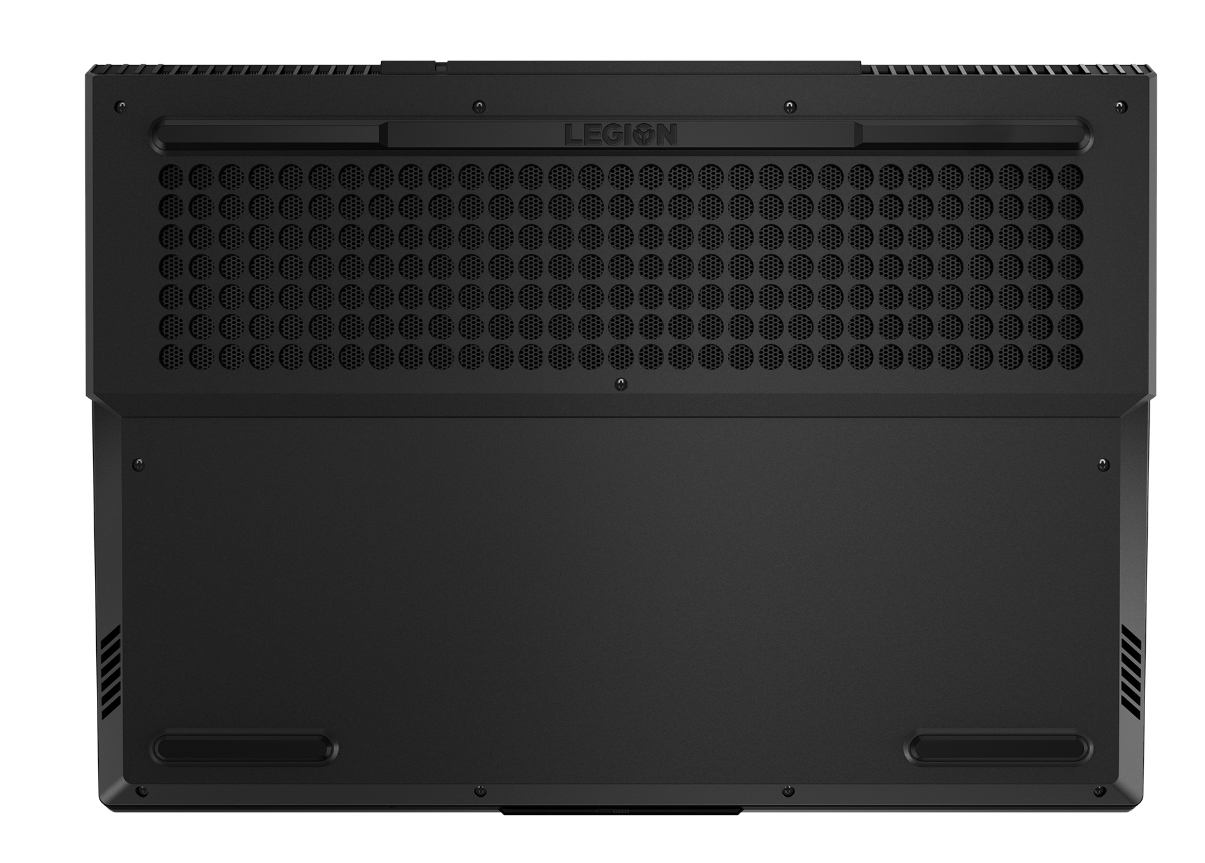
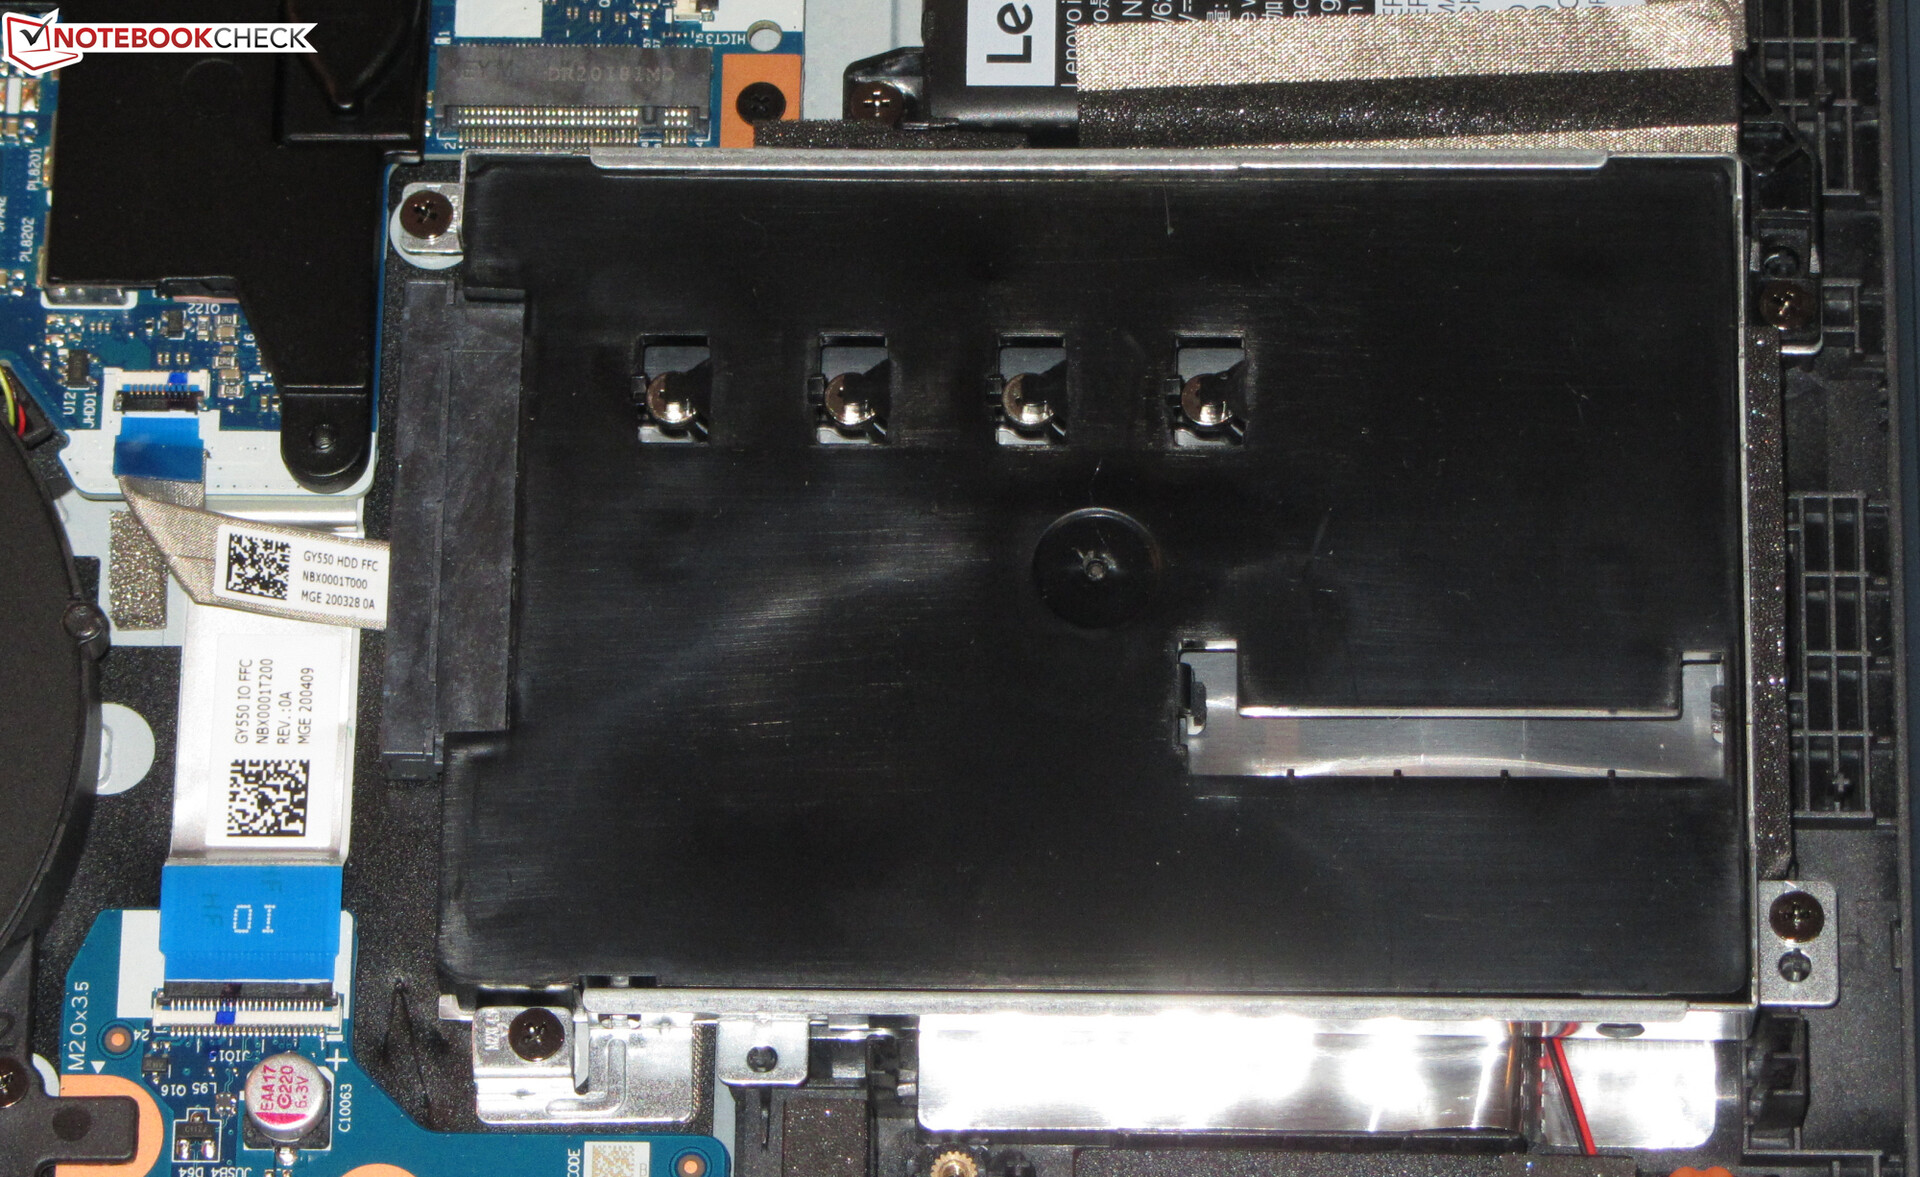
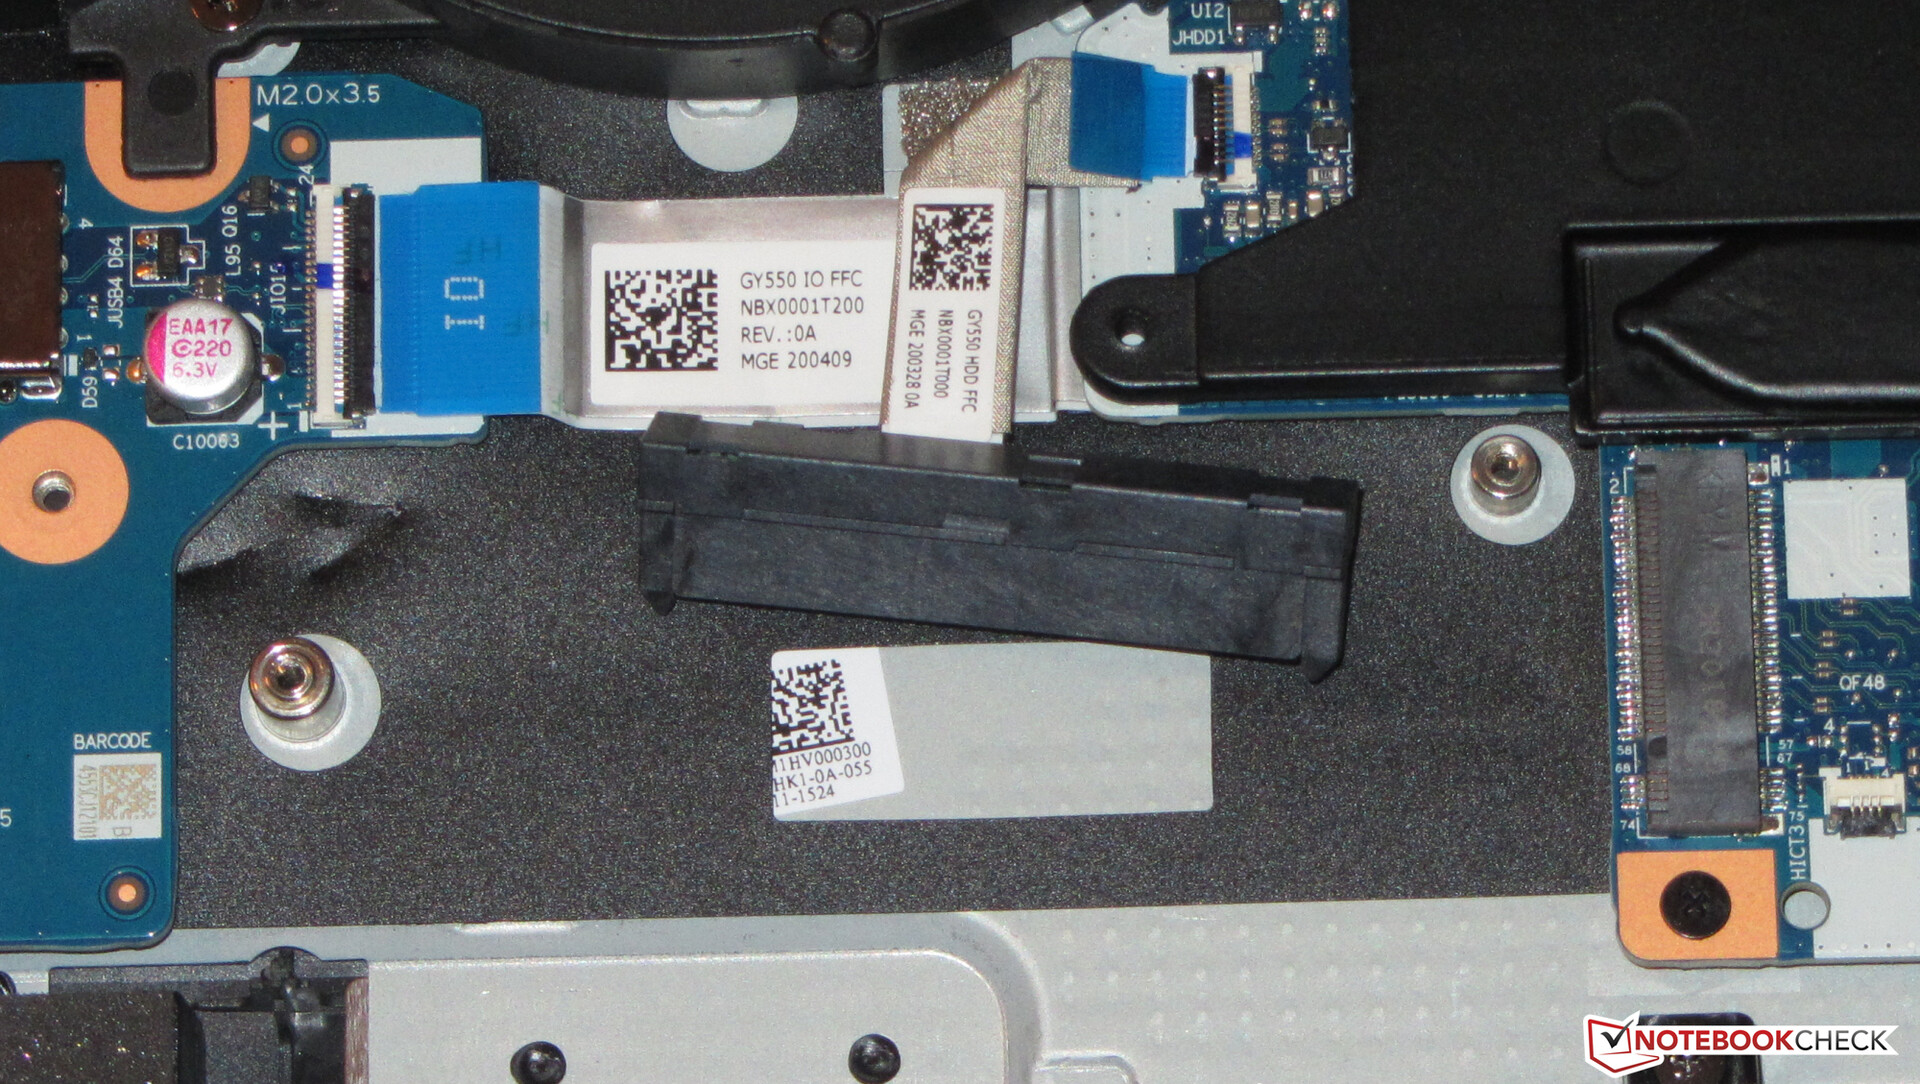
Skulle lagringen på den 512 GB stora SSD-enheten ta slut går det att utöka datorn med en 2.5 tums-enhet eller en andra NVMe SSD (M.2 2280). Att sätta i lagringsenheter kräver dock att man öppnar datorn eftersom den inte har någon servicelucka.
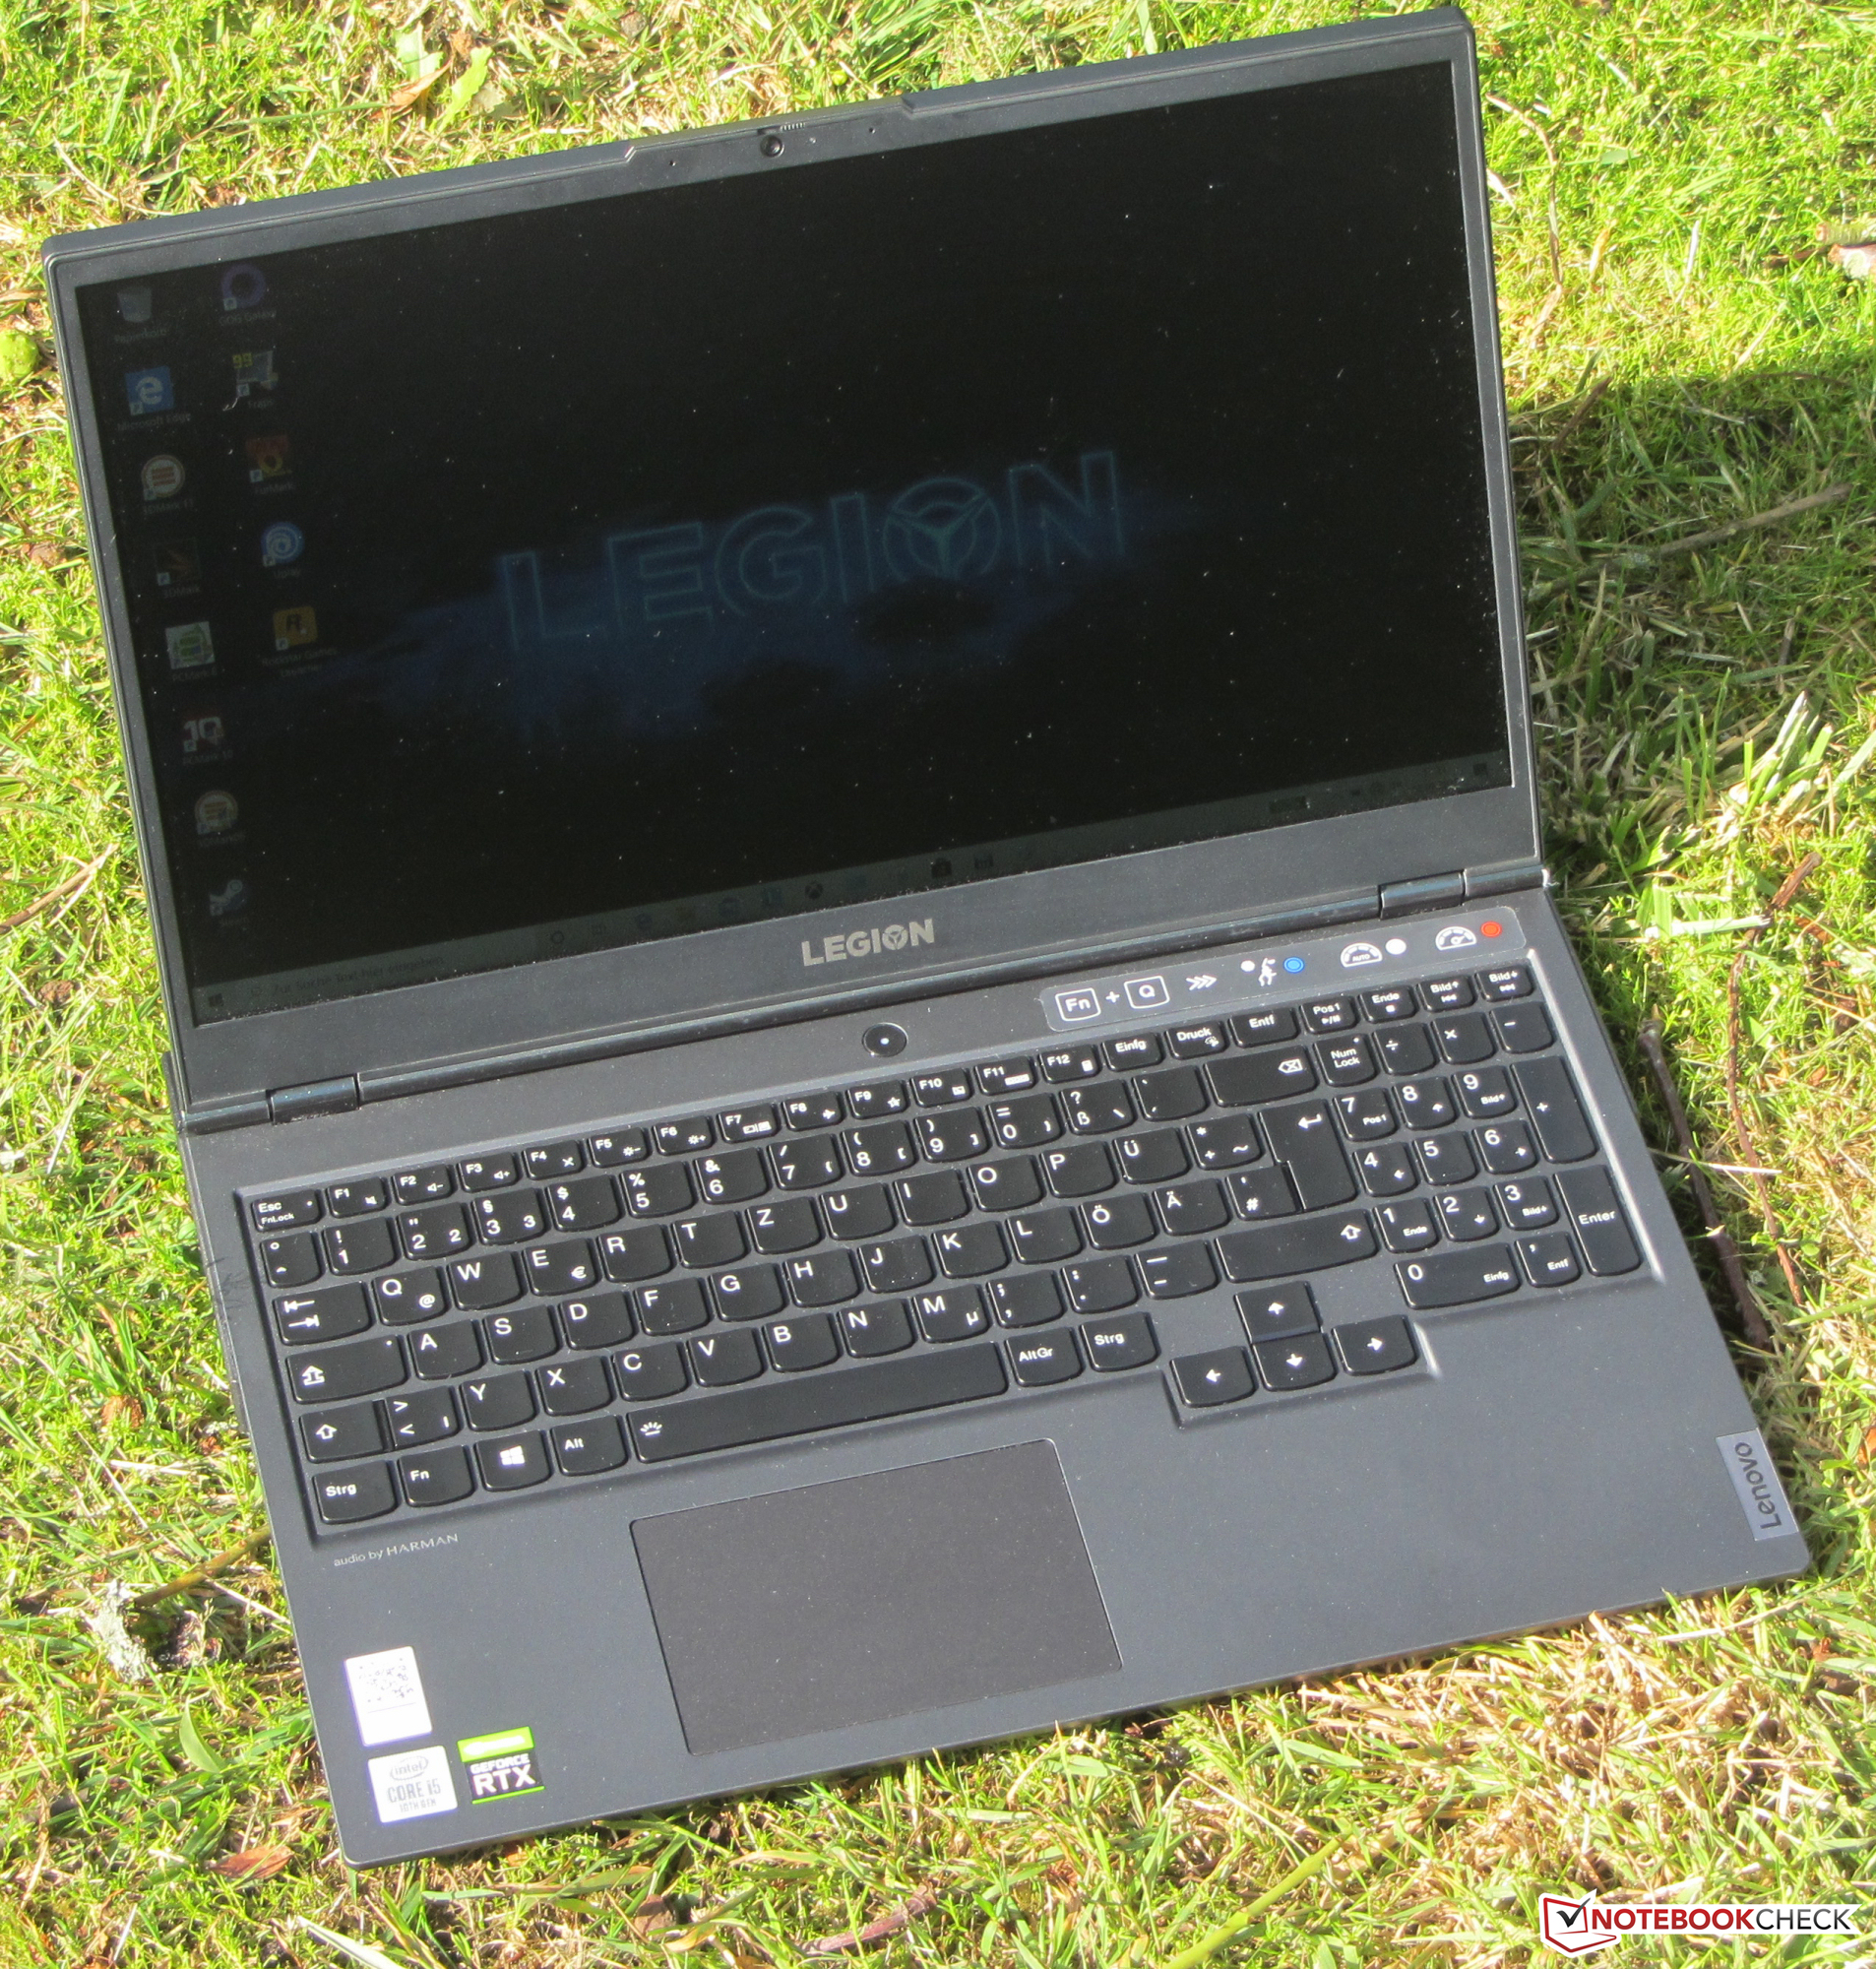
IPS-skärmen har Full HD-upplösning och stabila betraktningsvinklar, en matt yta, acceptabla responstider, ett bra kontrastförhållande och skapliga färger. Däremot är den maximala ljusstyrkan och färgomfånget båda för låga. Vi förväntar oss mer från en laptop för 12.500 kronor.
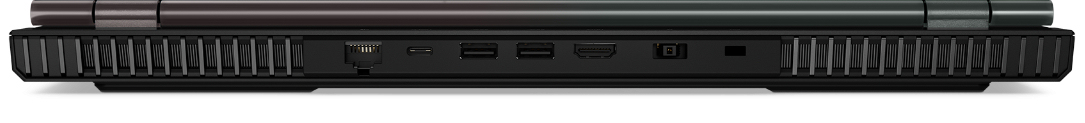
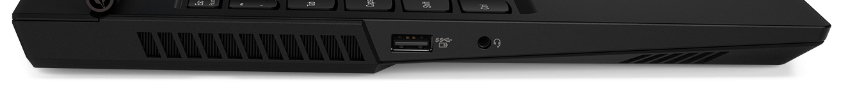
För det mesta har den ett bra portutbud, även om vi saknar en Thunderbolt 3-port. En sådan hade till exempel gjort det möjligt att ansluta en extern GPU. Legion har bara en Typ C USB 3.2 Gen 1-port, som dock stödjer DisplayPort genom USB C.
Lenovo Legion 5 15IMH05H
- 07/08/2020 v7 (old)
Sascha Mölck
Price comparison
