Test: Asus ZenBook 14 UX433F (i7-8565U) Laptop (Sammanfattning)
| SD Card Reader | |
| average JPG Copy Test (av. of 3 runs) | |
| HP Spectre x360 13-ae048ng (Toshiba Exceria Pro M501 microSDXC 64GB) | |
| Dell XPS 13 9370 i7 UHD (Toshiba Exceria Pro UHS-II) | |
| Asus Zenbook UX430UN (Toshiba Exceria Pro SDXC 64 GB UHS-II) | |
| Asus ZenBook 14 UX433FA (Toshiba Exceria Pro M501 microSDXC) | |
| maximum AS SSD Seq Read Test (1GB) | |
| Dell XPS 13 9370 i7 UHD (Toshiba Exceria Pro UHS-II) | |
| HP Spectre x360 13-ae048ng (Toshiba Exceria Pro M501 microSDXC 64GB) | |
| Asus Zenbook UX430UN (Toshiba Exceria Pro SDXC 64 GB UHS-II) | |
| Asus ZenBook 14 UX433FA (Toshiba Exceria Pro M501 microSDXC) | |
| Networking | |
| iperf3 transmit AX12 | |
| Asus ZenBook 14 UX433FA | |
| Huawei Matebook X Pro i5 | |
| Dell XPS 13 9370 i7 UHD | |
| Asus Zenbook UX430UN | |
| iperf3 receive AX12 | |
| Dell XPS 13 9370 i7 UHD | |
| Huawei Matebook X Pro i5 | |
| Asus Zenbook UX430UN | |
| Asus ZenBook 14 UX433FA | |
| |||||||||||||||||||||||||
Distribution av ljusstyrkan: 87 %
Mitt på batteriet: 332.8 cd/m²
Kontrast: 1148:1 (Svärta: 0.29 cd/m²)
ΔE ColorChecker Calman: 5.14 | ∀{0.5-29.43 Ø4.72}
calibrated: 3.61
ΔE Greyscale Calman: 8.8 | ∀{0.09-98 Ø4.97}
89.2% sRGB (Argyll 1.6.3 3D)
58.1% AdobeRGB 1998 (Argyll 1.6.3 3D)
65.1% AdobeRGB 1998 (Argyll 3D)
89.7% sRGB (Argyll 3D)
64.3% Display P3 (Argyll 3D)
Gamma: 2.33
CCT: 8227 K
| Asus ZenBook 14 UX433FA AU Optronics B140HAN03.2, IPS, 14", 1920x1080 | Apple MacBook Air 2018 APPA039, IPS, 13.3", 2560x1600 | Dell XPS 13 9370 i7 UHD ID: Sharp SHP148B, Name: LQ133D1, Dell P/N: 8XDHY, IPS, 13.3", 3840x2160 | Huawei Matebook X Pro i5 Tianma XM, IPS, 13.9", 3000x2000 | Lenovo Yoga C930-13IKB 81C4 AUO B139HAN03_0, IPS, 13.9", 1920x1080 | Asus Zenbook UX430UN NV140FHM-N62, BOE0718, IPS, 14", 1920x1080 | |
|---|---|---|---|---|---|---|
| Display | 6% | 8% | 4% | 0% | -3% | |
| Display P3 Coverage (%) | 64.3 | 67.8 5% | 68.9 7% | 65.9 2% | 62.7 -2% | 64.6 0% |
| sRGB Coverage (%) | 89.7 | 96.1 7% | 98.4 10% | 95.2 6% | 92.6 3% | 84.8 -5% |
| AdobeRGB 1998 Coverage (%) | 65.1 | 69.8 7% | 69.5 7% | 67.6 4% | 64.7 -1% | 62 -5% |
| Response Times | -9% | -80% | -5% | 3% | -37% | |
| Response Time Grey 50% / Grey 80% * (ms) | 39.6 ? | 39.6 ? -0% | 69.6 ? -76% | 40.4 ? -2% | 34.4 ? 13% | 43.6 ? -10% |
| Response Time Black / White * (ms) | 24 ? | 28 ? -17% | 44 ? -83% | 25.6 ? -7% | 25.6 ? -7% | 39.2 ? -63% |
| PWM Frequency (Hz) | 113600 ? | 3759 ? | 200 ? | |||
| Screen | 31% | 25% | 23% | -11% | 6% | |
| Brightness middle (cd/m²) | 332.8 | 320 -4% | 478.5 44% | 442.7 33% | 312 -6% | 310.4 -7% |
| Brightness (cd/m²) | 310 | 315 2% | 466 50% | 428 38% | 295 -5% | 303 -2% |
| Brightness Distribution (%) | 87 | 95 9% | 86 -1% | 84 -3% | 87 0% | 89 2% |
| Black Level * (cd/m²) | 0.29 | 0.29 -0% | 0.43 -48% | 0.31 -7% | 0.43 -48% | 0.31 -7% |
| Contrast (:1) | 1148 | 1103 -4% | 1113 -3% | 1428 24% | 726 -37% | 1001 -13% |
| Colorchecker dE 2000 * | 5.14 | 1.2 77% | 3.09 40% | 2.24 56% | 7.6 -48% | 4.07 21% |
| Colorchecker dE 2000 max. * | 11.88 | 3.2 73% | 5.94 50% | 7.19 39% | 15.06 -27% | 8.33 30% |
| Colorchecker dE 2000 calibrated * | 3.61 | 0.5 86% | 2.06 43% | 1.11 69% | 1.96 46% | 4.07 -13% |
| Greyscale dE 2000 * | 8.8 | 0.8 91% | 2.4 73% | 9.7 -10% | 8.8 -0% | 2.8 68% |
| Gamma | 2.33 94% | 2.2 100% | 2.063 107% | 1.42 155% | 2.01 109% | 2.217 99% |
| CCT | 8227 79% | 6548 99% | 6883 94% | 6227 104% | 6874 95% | 7033 92% |
| Color Space (Percent of AdobeRGB 1998) (%) | 58.1 | 62.1 7% | 69.47 20% | 61.6 6% | 59.1 2% | 55.3 -5% |
| Color Space (Percent of sRGB) (%) | 89.2 | 96 8% | 98.36 10% | 95 7% | 92.3 3% | 84.6 -5% |
| Totalt genomsnitt (program/inställningar) | 9% /
22% | -16% /
9% | 7% /
16% | -3% /
-7% | -11% /
-1% |
* ... mindre är bättre
Visa svarstider
| ↔ Svarstid svart till vitt | ||
|---|---|---|
| 24 ms ... stiga ↗ och falla ↘ kombinerat | ↗ 14.4 ms stiga | 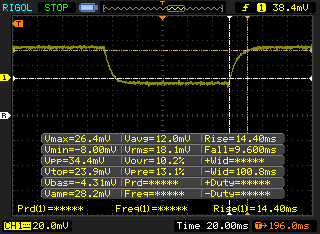 |
| ↘ 9.6 ms hösten | ||
| Skärmen visar bra svarsfrekvens i våra tester, men kan vara för långsam för konkurrenskraftiga spelare. I jämförelse sträcker sig alla testade enheter från 0.1 (minst) till 240 (maximalt) ms. » 54 % av alla enheter är bättre. Detta innebär att den uppmätta svarstiden är sämre än genomsnittet av alla testade enheter (19.8 ms). | ||
| ↔ Svarstid 50 % grått till 80 % grått | ||
| 39.6 ms ... stiga ↗ och falla ↘ kombinerat | ↗ 21.2 ms stiga | 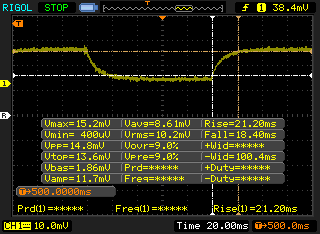 |
| ↘ 18.4 ms hösten | ||
| Skärmen visar långsamma svarsfrekvenser i våra tester och kommer att vara otillfredsställande för spelare. I jämförelse sträcker sig alla testade enheter från 0.165 (minst) till 636 (maximalt) ms. » 61 % av alla enheter är bättre. Detta innebär att den uppmätta svarstiden är sämre än genomsnittet av alla testade enheter (31 ms). | ||
Skärmflimmer / PWM (Puls-Width Modulation)
| Skärmflimmer / PWM upptäcktes inte | 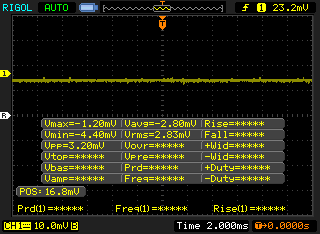 | ||
Som jämförelse: 52 % av alla testade enheter använder inte PWM för att dämpa skärmen. Om PWM upptäcktes mättes ett medelvärde av 7769 (minst: 5 - maximum: 343500) Hz. | |||
| Cinebench R15 | |
| CPU Single 64Bit | |
| Dell XPS 15 9575 i7-8705G | |
| Asus FX504GD | |
| Asus ZenBook 14 UX433FA | |
| Asus Zenbook UX430UN | |
| Microsoft Surface Pro 6, Core i7, 512 GB | |
| Apple MacBook Pro 13 2018 Touchbar i5 | |
| Dell XPS 13 9370 FHD i5 | |
| Asus ZenBook UX530UX-FY070T | |
| Lenovo Ideapad 720S-13ARR | |
| Apple MacBook Air 2018 | |
| Asus Zenbook 3 Deluxe UX490UA | |
| CPU Multi 64Bit | |
| Dell XPS 15 9575 i7-8705G | |
| Apple MacBook Pro 13 2018 Touchbar i5 | |
| Apple MacBook Pro 13 2018 Touchbar i5 | |
| Dell XPS 13 9370 FHD i5 | |
| Microsoft Surface Pro 6, Core i7, 512 GB | |
| Asus Zenbook UX430UN | |
| Asus ZenBook 14 UX433FA | |
| Asus FX504GD | |
| Lenovo Ideapad 720S-13ARR | |
| Asus Zenbook 3 Deluxe UX490UA | |
| Asus ZenBook UX530UX-FY070T | |
| Apple MacBook Air 2018 | |
| Cinebench R11.5 | |
| CPU Single 64Bit | |
| Asus ZenBook 14 UX433FA | |
| Dell XPS 15 9575 i7-8705G | |
| Asus FX504GD | |
| Asus Zenbook UX430UN | |
| CPU Multi 64Bit | |
| Dell XPS 15 9575 i7-8705G | |
| Asus ZenBook 14 UX433FA | |
| Asus Zenbook UX430UN | |
| Asus FX504GD | |
| Cinebench R10 | |
| Rendering Multiple CPUs 32Bit | |
| Dell XPS 15 9575 i7-8705G | |
| Asus FX504GD | |
| Asus ZenBook 14 UX433FA | |
| Asus Zenbook UX430UN | |
| Lenovo Ideapad 720S-13ARR | |
| Rendering Single 32Bit | |
| Asus ZenBook 14 UX433FA | |
| Asus FX504GD | |
| Asus Zenbook UX430UN | |
| Dell XPS 15 9575 i7-8705G | |
| Lenovo Ideapad 720S-13ARR | |
| wPrime 2.10 - 1024m | |
| Asus Zenbook UX430UN | |
| Asus ZenBook 14 UX433FA | |
| Asus FX504GD | |
| Dell XPS 15 9575 i7-8705G | |
* ... mindre är bättre
| PCMark 8 Home Score Accelerated v2 | 3285 poäng | |
| PCMark 8 Work Score Accelerated v2 | 4851 poäng | |
| PCMark 10 Score | 3736 poäng | |
Hjälp | ||
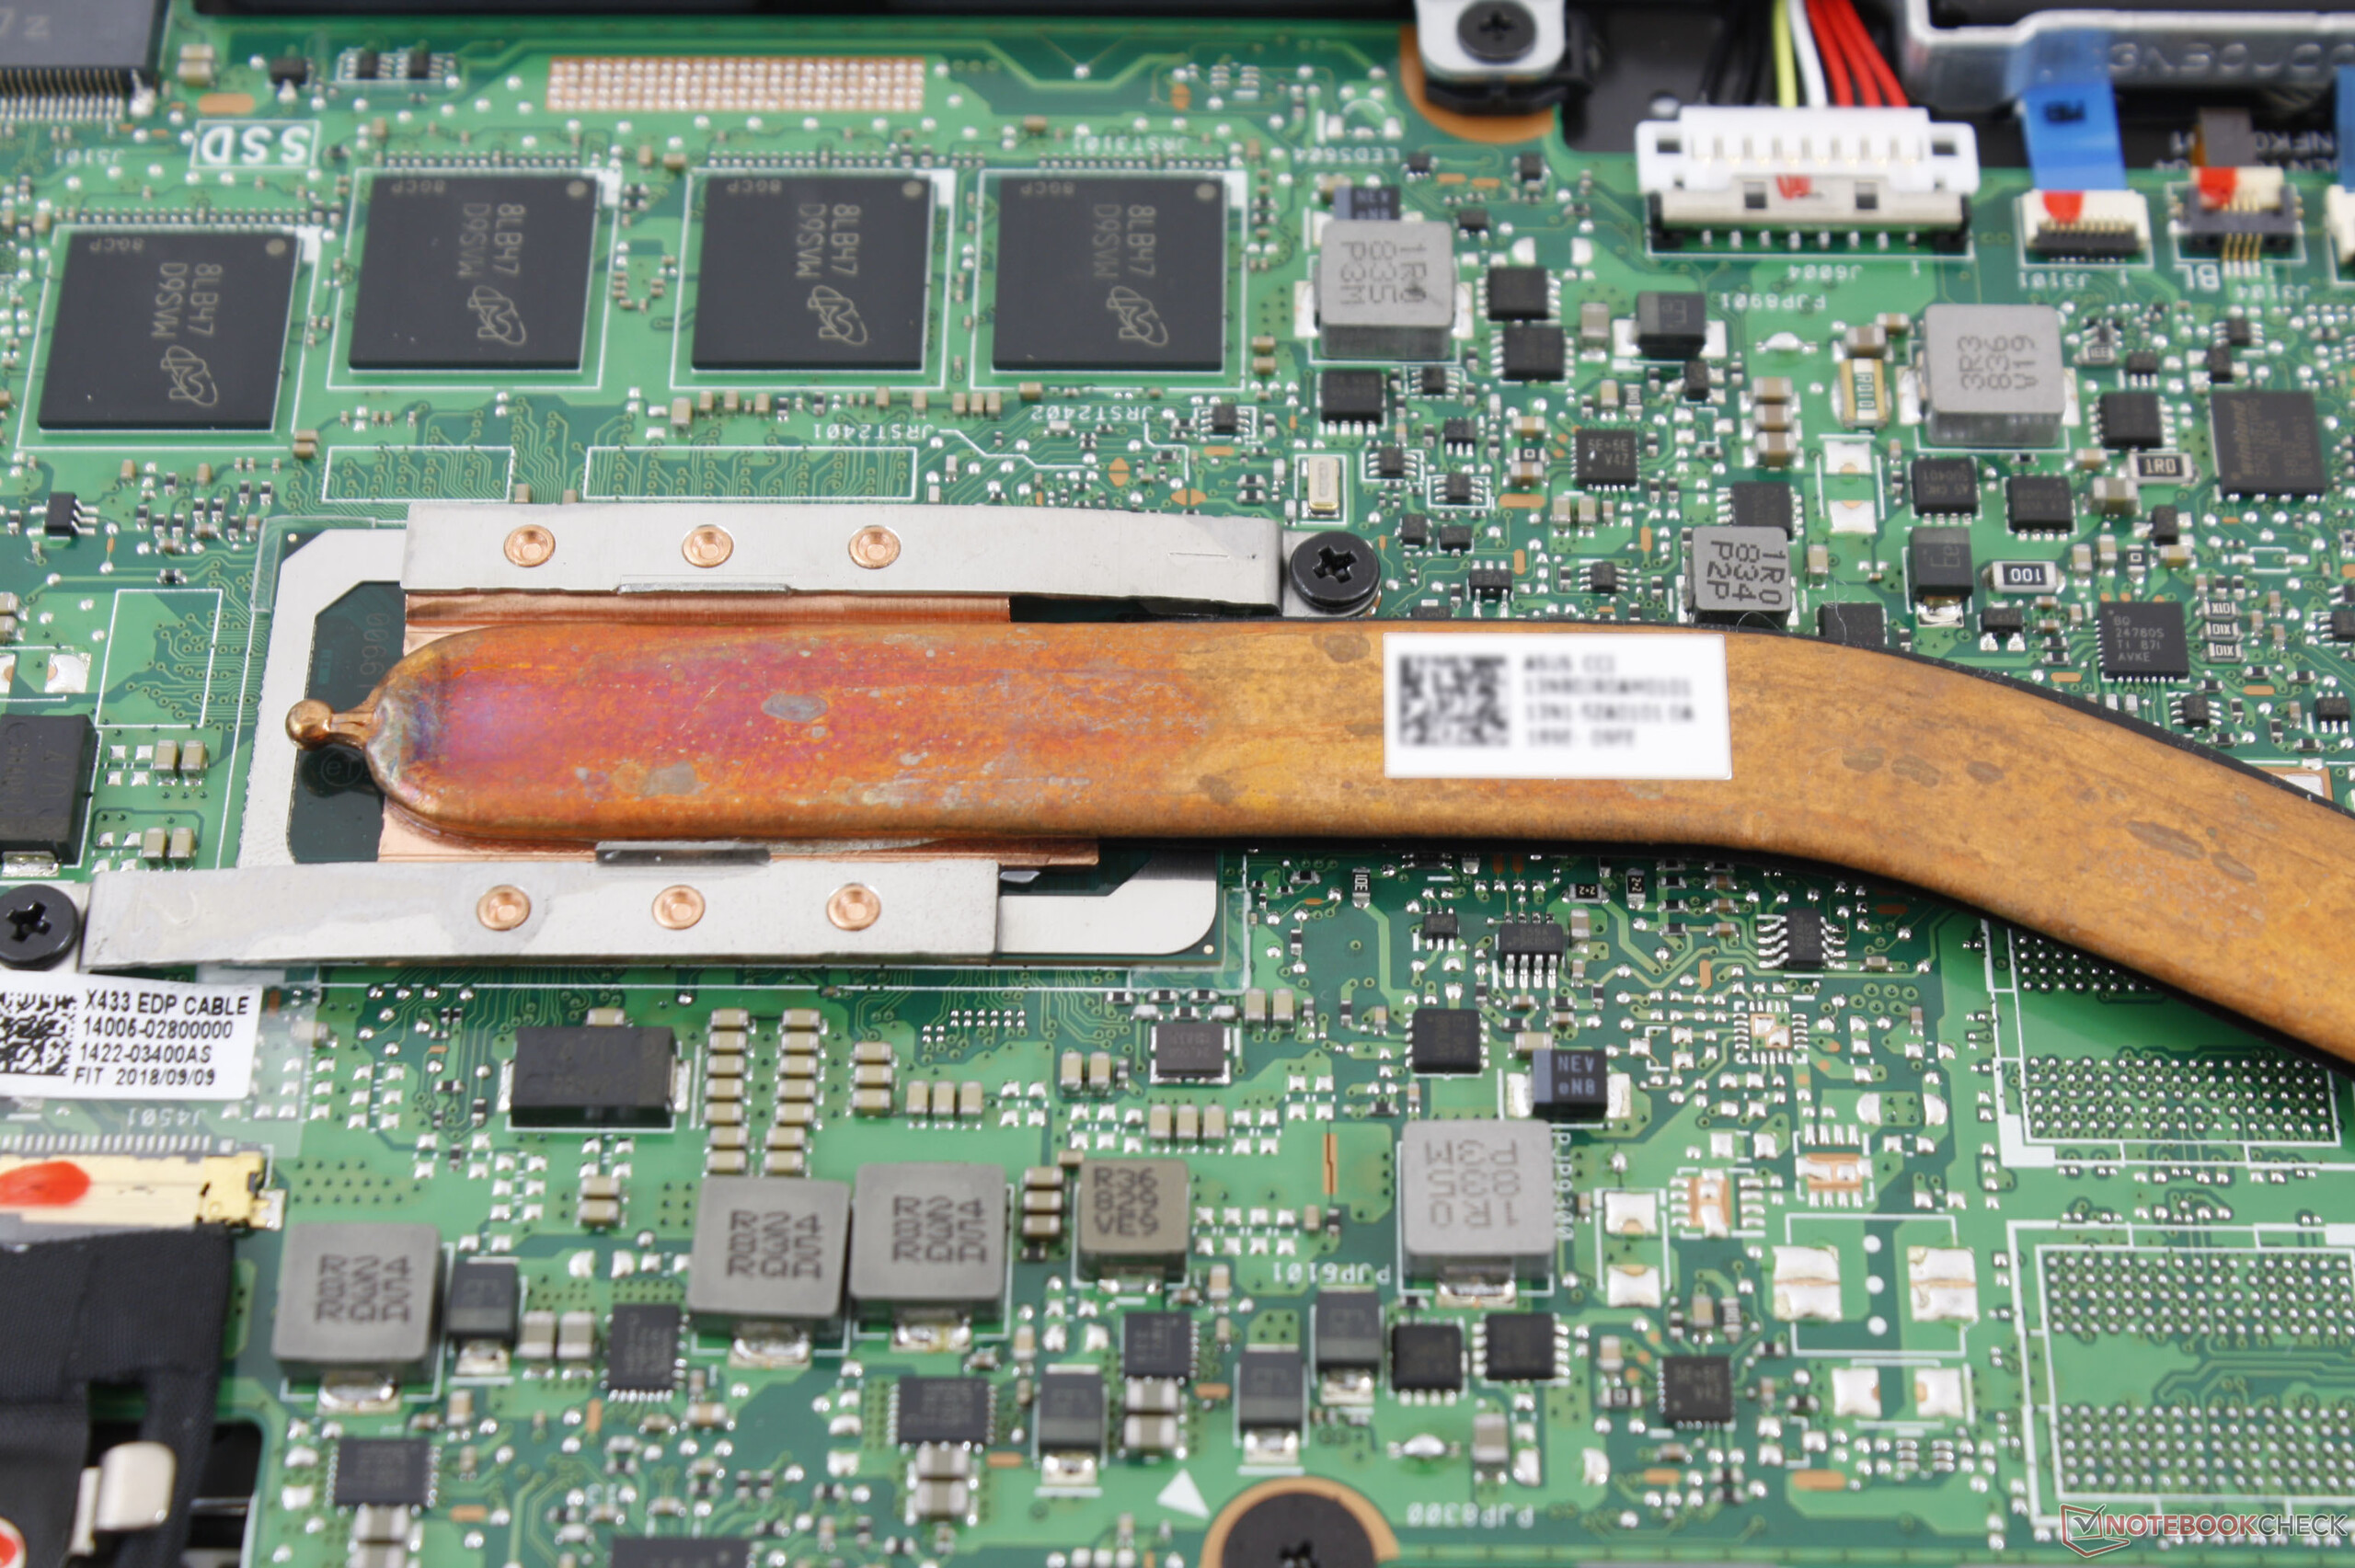
| Asus ZenBook 14 UX433FA WDC PC SN520 SDAPNUW-512G | Dell XPS 13 9370 i7 UHD Toshiba XG5 KXG50ZNV512G | Huawei Matebook X Pro i5 Samsung PM961 MZVLW256HEHP | Lenovo Yoga C930-13IKB 81C4 SK hynix PC401 HFS256GD9TNG | Asus Zenbook UX430UN SanDisk SD8SN8U512G1002 | HP Spectre x360 13-ae048ng Toshiba NVMe THNSN51T02DUK | |
|---|---|---|---|---|---|---|
| AS SSD | -22% | -4% | -192% | -70% | -570% | |
| Seq Read (MB/s) | 1201 | 2205 84% | 2416 101% | 1228 2% | 494.4 -59% | 1574 31% |
| Seq Write (MB/s) | 931 | 435.8 -53% | 1170 26% | 544 -42% | 300.3 -68% | 377.1 -59% |
| 4K Read (MB/s) | 40.25 | 29.36 -27% | 48.33 20% | 39.16 -3% | 25.39 -37% | 31.73 -21% |
| 4K Write (MB/s) | 111.5 | 107.4 -4% | 103.1 -8% | 106.5 -4% | 47.88 -57% | 1.73 -98% |
| 4K-64 Read (MB/s) | 916 | 678 -26% | 1039 13% | 466.4 -49% | 366 -60% | 115.6 -87% |
| 4K-64 Write (MB/s) | 871 | 444.8 -49% | 399.6 -54% | 305.1 -65% | 183.5 -79% | 2.09 -100% |
| Access Time Read * (ms) | 0.05 | 0.059 -18% | 0.058 -16% | 0.46 -820% | 0.089 -78% | 0.044 12% |
| Access Time Write * (ms) | 0.032 | 0.055 -72% | 0.036 -13% | 0.51 -1494% | 0.088 -175% | 2.391 -7372% |
| Score Read (Points) | 1076 | 926 -14% | 1329 24% | 628 -42% | 441 -59% | 305 -72% |
| Score Write (Points) | 1075 | 596 -45% | 620 -42% | 466 -57% | 261 -76% | 42 -96% |
| Score Total (Points) | 2696 | 1911 -29% | 2575 -4% | 1394 -48% | 926 -66% | 455 -83% |
| Copy ISO MB/s (MB/s) | 1153 | 585 -49% | 739 -36% | 628 -46% | 467.6 -59% | 1205 5% |
| Copy Program MB/s (MB/s) | 415.1 | 570 37% | 312.3 -25% | 540 30% | 270.5 -35% | 281.8 -32% |
| Copy Game MB/s (MB/s) | 930 | 503 -46% | 486.3 -48% | 533 -43% | 225.1 -76% | 856 -8% |
* ... mindre är bättre

| 3DMark 11 | |
| 1280x720 Performance GPU | |
| Dell XPS 15 9575 i7-8705G | |
| Asus FX504GD | |
| Asus ZenBook UX530UX-FY070T | |
| Asus Zenbook UX430UN | |
| Apple MacBook Pro 13 2018 Touchbar i5 | |
| Lenovo Ideapad 720S-13ARR | |
| Asus ZenBook 14 UX433FA | |
| Microsoft Surface Pro 6, Core i7, 512 GB | |
| Dell XPS 13 9370 i7 UHD | |
| Dell XPS 13 9370 FHD i5 | |
| Genomsnitt Intel UHD Graphics 620 (1144 - 3432, n=244) | |
| Asus Zenbook 3 Deluxe UX490UA | |
| Apple MacBook Air 2018 | |
| 1280x720 Performance Combined | |
| Dell XPS 15 9575 i7-8705G | |
| Asus FX504GD | |
| Asus ZenBook UX530UX-FY070T | |
| Asus Zenbook UX430UN | |
| Apple MacBook Pro 13 2018 Touchbar i5 | |
| Microsoft Surface Pro 6, Core i7, 512 GB | |
| Asus ZenBook 14 UX433FA | |
| Dell XPS 13 9370 i7 UHD | |
| Dell XPS 13 9370 FHD i5 | |
| Genomsnitt Intel UHD Graphics 620 (927 - 2505, n=244) | |
| Apple MacBook Air 2018 | |
| Asus Zenbook 3 Deluxe UX490UA | |
| Lenovo Ideapad 720S-13ARR | |
| 3DMark 06 Standard Score | 11207 poäng | |
| 3DMark Vantage P Result | 7761 poäng | |
| 3DMark 11 Performance | 2201 poäng | |
| 3DMark Ice Storm Standard Score | 64710 poäng | |
| 3DMark Cloud Gate Standard Score | 9469 poäng | |
| 3DMark Time Spy Score | 461 poäng | |
Hjälp | ||
| låg | med. | hög | ultra | |
|---|---|---|---|---|
| BioShock Infinite (2013) | 78.5 | 38.1 | 31.8 | 9.7 |
| Rise of the Tomb Raider (2016) | 22.8 | 13.7 | 7.2 | 5.7 |
| Rocket League (2017) | 71.4 | 32.9 | 21.1 |
| Asus ZenBook 14 UX433FA UHD Graphics 620, i7-8565U, WDC PC SN520 SDAPNUW-512G | Dell XPS 13 9370 i7 UHD UHD Graphics 620, i5-8550U, Toshiba XG5 KXG50ZNV512G | Huawei Matebook X Pro i5 GeForce MX150, i5-8250U, Samsung PM961 MZVLW256HEHP | Asus Zenbook UX430UN GeForce MX150, i5-8550U, SanDisk SD8SN8U512G1002 | Lenovo Yoga C930-13IKB 81C4 UHD Graphics 620, i5-8550U, SK hynix PC401 HFS256GD9TNG | HP Spectre x360 13-ae048ng UHD Graphics 620, i5-8550U, Toshiba NVMe THNSN51T02DUK | |
|---|---|---|---|---|---|---|
| Noise | 4% | 1% | -4% | 4% | 2% | |
| av / miljö * (dB) | 28.8 | 28 3% | 27.9 3% | 28.3 2% | 27.9 3% | 30.13 -5% |
| Idle Minimum * (dB) | 28.8 | 28 3% | 27.9 3% | 28.9 -0% | 27.9 3% | 30.13 -5% |
| Idle Average * (dB) | 28.8 | 28 3% | 27.9 3% | 30 -4% | 27.9 3% | 30 -4% |
| Idle Maximum * (dB) | 29.1 | 28 4% | 27.9 4% | 30.2 -4% | 29.3 -1% | 30.13 -4% |
| Load Average * (dB) | 36.1 | 32.5 10% | 36.2 -0% | 41.8 -16% | 32 11% | 33.4 7% |
| Load Maximum * (dB) | 41.2 | 42.2 -2% | 45.2 -10% | 42 -2% | 39.3 5% | 33 20% |
| Witcher 3 ultra * (dB) | 45 | 42 |
* ... mindre är bättre
Ljudnivå
| Låg belastning |
| 28.8 / 28.8 / 29.1 dB(A) |
| Hög belastning |
| 36.1 / 41.2 dB(A) |
 | ||
30 dB tyst 40 dB(A) hörbar 50 dB(A) högt ljud |
||
min: | ||
(±) Den maximala temperaturen på ovansidan är 42.4 °C / 108 F, jämfört med genomsnittet av 35.9 °C / 97 F , allt från 21.4 till 59 °C för klassen Subnotebook.
(±) Botten värms upp till maximalt 45 °C / 113 F, jämfört med genomsnittet av 39.2 °C / 103 F
(+) Vid tomgångsbruk är medeltemperaturen för ovansidan 28.5 °C / 83 F, jämfört med enhetsgenomsnittet på 30.8 °C / ### class_avg_f### F.
(+) Handledsstöden och pekplattan är kallare än hudtemperaturen med maximalt 31 °C / 87.8 F och är därför svala att ta på.
(-) Medeltemperaturen för handledsstödsområdet på liknande enheter var 28.2 °C / 82.8 F (-2.8 °C / -5 F).
Asus ZenBook 14 UX433FA ljudanalys
(±) | högtalarljudstyrkan är genomsnittlig men bra (75.8 dB)
Bas 100 - 315 Hz
(±) | reducerad bas - i genomsnitt 13.8% lägre än medianen
(±) | linjäriteten för basen är genomsnittlig (10.6% delta till föregående frekvens)
Mellan 400 - 2000 Hz
(+) | balanserad mellan - endast 3.4% från medianen
(+) | mids är linjära (4.8% delta till föregående frekvens)
Högsta 2 - 16 kHz
(±) | högre toppar - i genomsnitt 5.2% högre än medianen
(+) | toppar är linjära (6.1% delta till föregående frekvens)
Totalt 100 - 16 000 Hz
(±) | linjäriteten för det totala ljudet är genomsnittlig (16.1% skillnad mot median)
Jämfört med samma klass
» 39% av alla testade enheter i den här klassen var bättre, 4% liknande, 57% sämre
» Den bästa hade ett delta på 5%, genomsnittet var 18%, sämst var 53%
Jämfört med alla testade enheter
» 26% av alla testade enheter var bättre, 5% liknande, 69% sämre
» Den bästa hade ett delta på 4%, genomsnittet var 24%, sämst var 134%
Apple MacBook 12 (Early 2016) 1.1 GHz ljudanalys
(+) | högtalare kan spela relativt högt (83.6 dB)
Bas 100 - 315 Hz
(±) | reducerad bas - i genomsnitt 11.3% lägre än medianen
(±) | linjäriteten för basen är genomsnittlig (14.2% delta till föregående frekvens)
Mellan 400 - 2000 Hz
(+) | balanserad mellan - endast 2.4% från medianen
(+) | mids är linjära (5.5% delta till föregående frekvens)
Högsta 2 - 16 kHz
(+) | balanserade toppar - endast 2% från medianen
(+) | toppar är linjära (4.5% delta till föregående frekvens)
Totalt 100 - 16 000 Hz
(+) | det totala ljudet är linjärt (10.2% skillnad mot median)
Jämfört med samma klass
» 7% av alla testade enheter i den här klassen var bättre, 2% liknande, 91% sämre
» Den bästa hade ett delta på 5%, genomsnittet var 18%, sämst var 53%
Jämfört med alla testade enheter
» 5% av alla testade enheter var bättre, 1% liknande, 94% sämre
» Den bästa hade ett delta på 4%, genomsnittet var 24%, sämst var 134%
| Av/Standby | |
| Låg belastning | |
| Hög belastning |
|
Förklaring:
min: | |
| Asus ZenBook 14 UX433FA i7-8565U, UHD Graphics 620, WDC PC SN520 SDAPNUW-512G, IPS, 1920x1080, 14" | Dell XPS 13 9370 i7 UHD i5-8550U, UHD Graphics 620, Toshiba XG5 KXG50ZNV512G, IPS, 3840x2160, 13.3" | Huawei Matebook X Pro i5 i5-8250U, GeForce MX150, Samsung PM961 MZVLW256HEHP, IPS, 3000x2000, 13.9" | Lenovo Yoga C930-13IKB 81C4 i5-8550U, UHD Graphics 620, SK hynix PC401 HFS256GD9TNG, IPS, 1920x1080, 13.9" | Asus Zenbook UX430UN i5-8550U, GeForce MX150, SanDisk SD8SN8U512G1002, IPS, 1920x1080, 14" | HP Spectre x360 13-ae048ng i5-8550U, UHD Graphics 620, Toshiba NVMe THNSN51T02DUK, IPS, 1920x1080, 13.3" | |
|---|---|---|---|---|---|---|
| Power Consumption | -18% | -26% | -21% | -1% | 12% | |
| Idle Minimum * (Watt) | 3.9 | 5 -28% | 3.5 10% | 3.4 13% | 3 23% | 3.2 18% |
| Idle Average * (Watt) | 5.9 | 8.3 -41% | 8.9 -51% | 7.5 -27% | 5.8 2% | 6 -2% |
| Idle Maximum * (Watt) | 8.8 | 8.8 -0% | 12.3 -40% | 11.8 -34% | 6.2 30% | 9.2 -5% |
| Load Average * (Watt) | 41.7 | 46.4 -11% | 54.2 -30% | 47.7 -14% | 54.1 -30% | 29.5 29% |
| Load Maximum * (Watt) | 44 | 48.6 -10% | 52.1 -18% | 63.2 -44% | 56.4 -28% | 35.6 19% |
| Witcher 3 ultra * (Watt) | 42.4 | 45.9 |
* ... mindre är bättre
| Asus ZenBook 14 UX433FA i7-8565U, UHD Graphics 620, 50 Wh | Apple MacBook Air 2018 i5-8210Y, UHD Graphics 617, 50.3 Wh | Dell XPS 13 9370 i7 UHD i5-8550U, UHD Graphics 620, 52 Wh | Huawei Matebook X Pro i5 i5-8250U, GeForce MX150, 57.4 Wh | Lenovo Yoga C930-13IKB 81C4 i5-8550U, UHD Graphics 620, 60 Wh | Asus Zenbook UX430UN i5-8550U, GeForce MX150, 50 Wh | HP Spectre x360 13-ae048ng i5-8550U, UHD Graphics 620, 60 Wh | |
|---|---|---|---|---|---|---|---|
| Batteridrifttid | -14% | -33% | -12% | 6% | -24% | -16% | |
| Reader / Idle (h) | 19.1 | 13.7 -28% | 20.7 8% | 17.3 -9% | |||
| WiFi v1.3 (h) | 10.5 | 11.1 6% | 7.8 -26% | 9.3 -11% | 11.1 6% | 9.3 -11% | 8.8 -16% |
| Load (h) | 3.3 | 2.2 -33% | 1.8 -45% | 2.2 -33% | 1.6 -52% | 2.8 -15% |
För
Emot
Läs den fullständiga versionen av den här recensionen på engelska här.
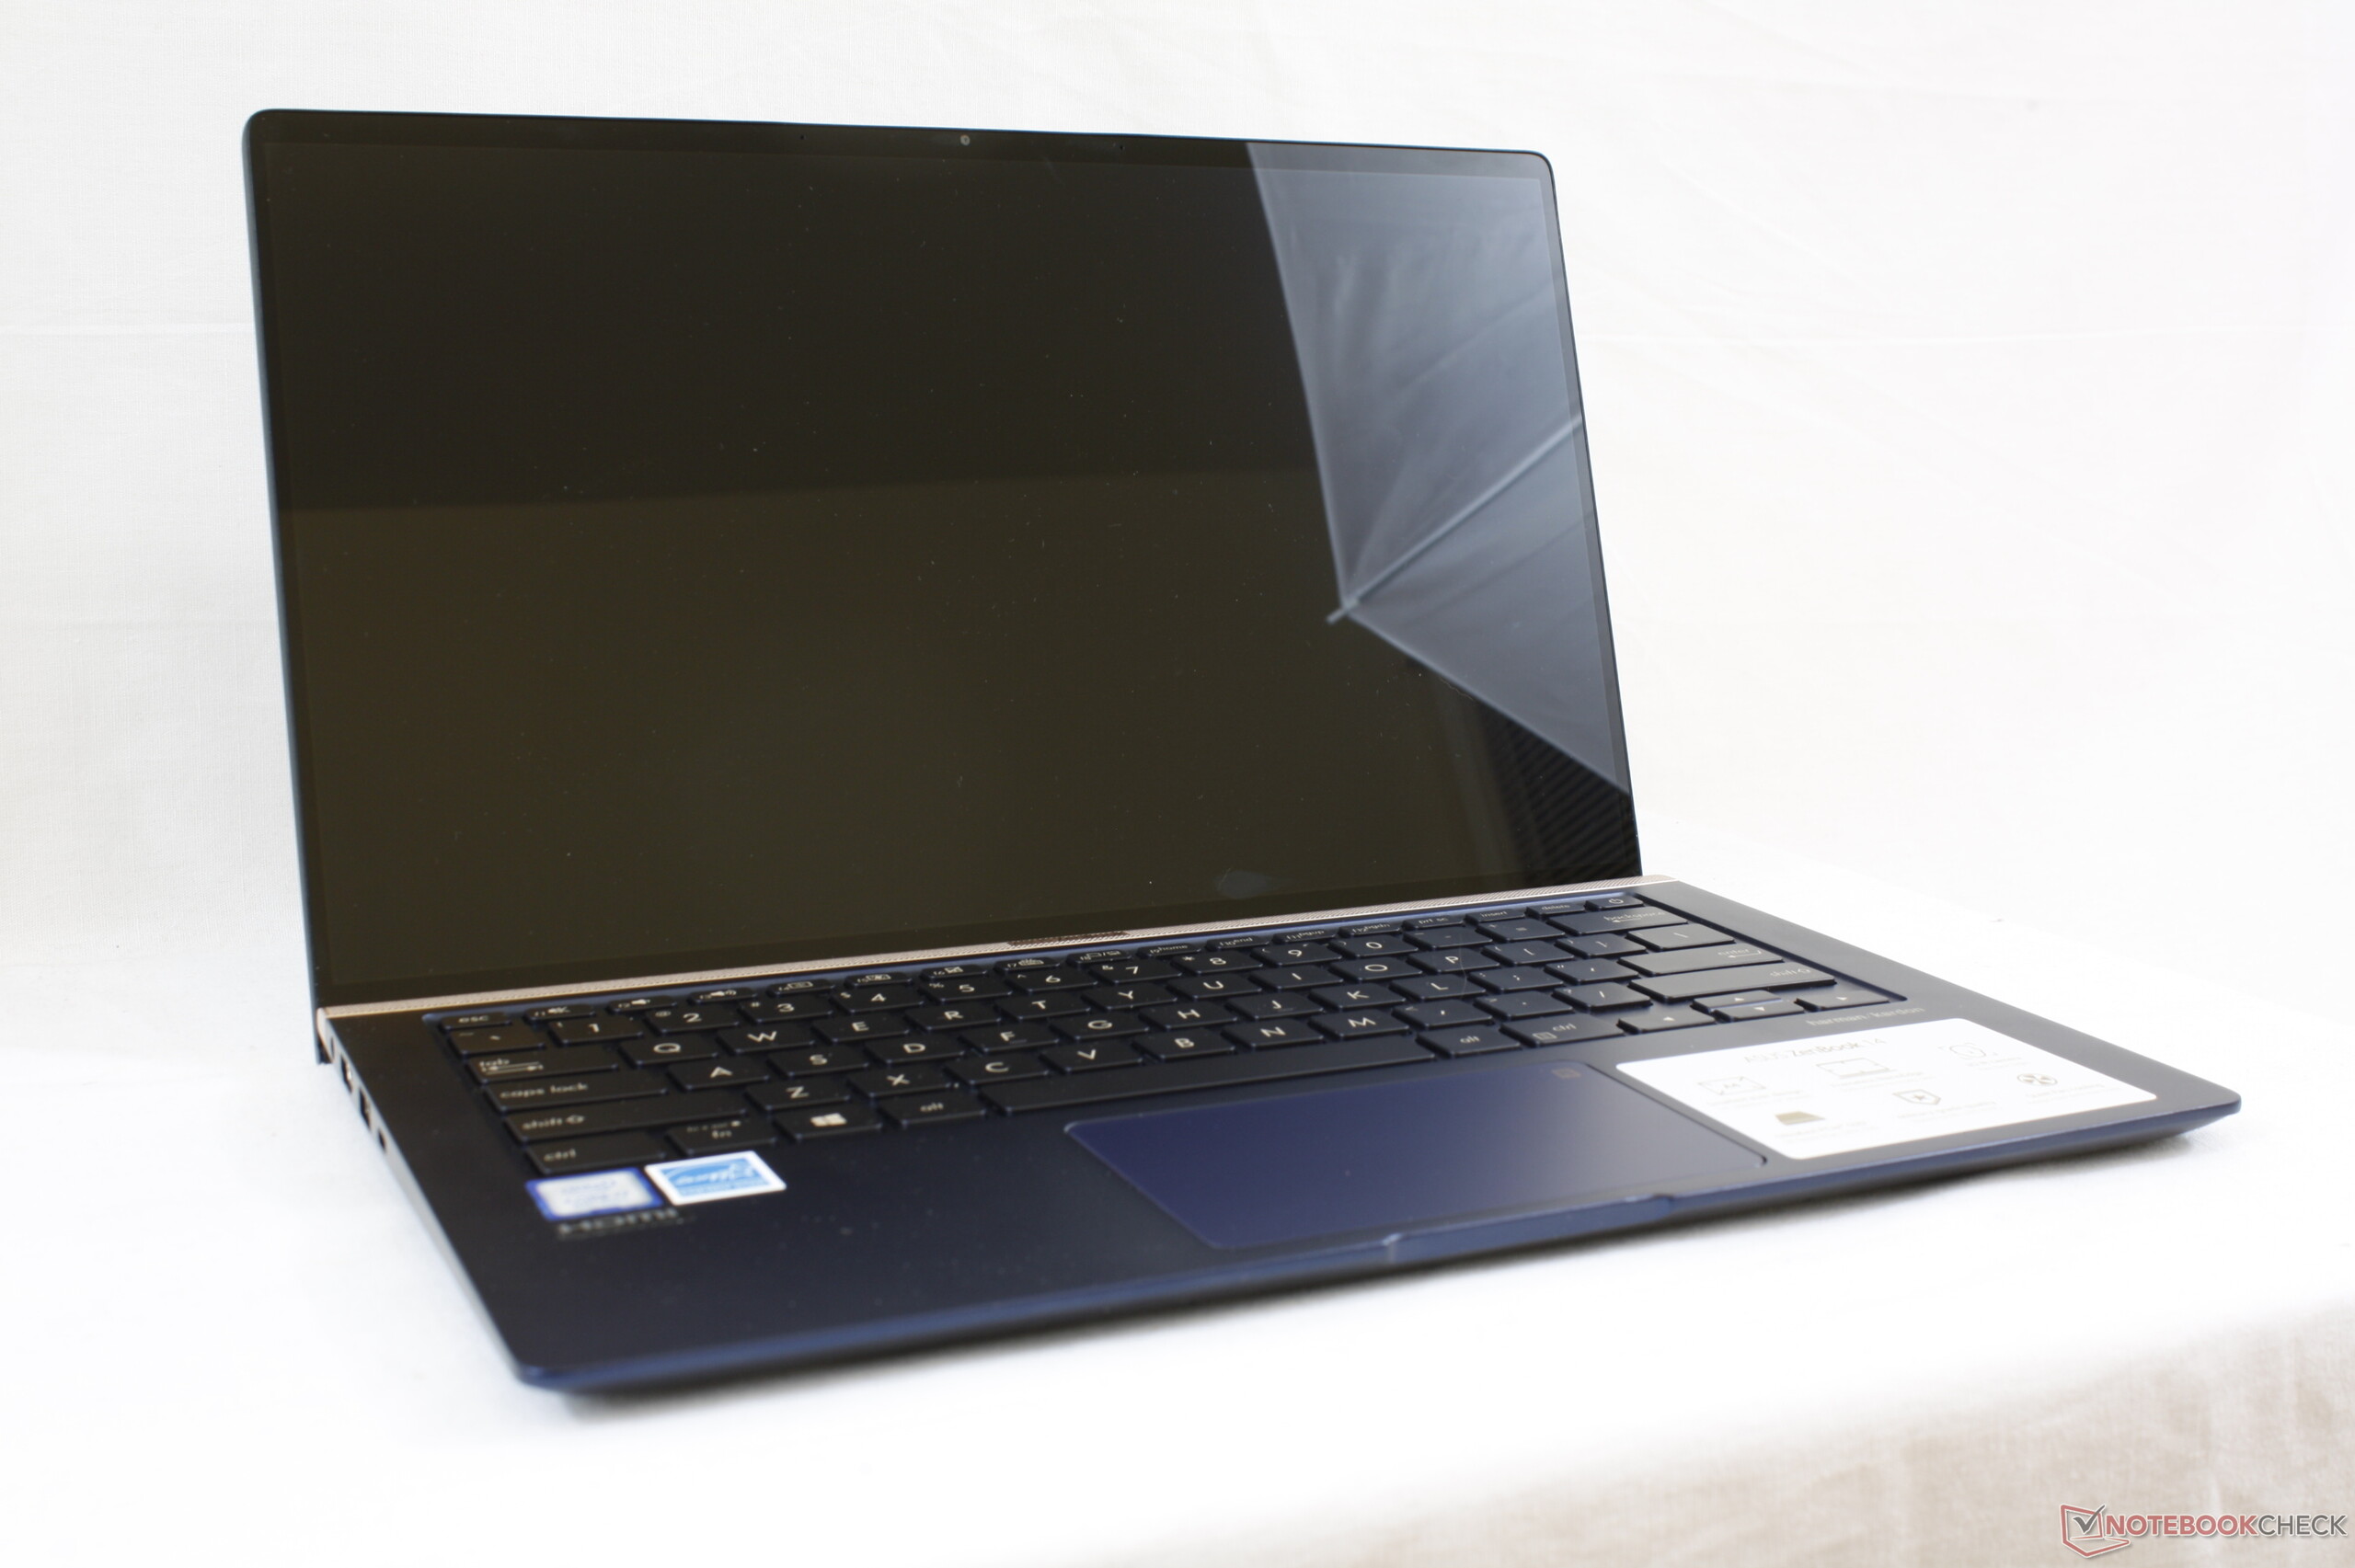
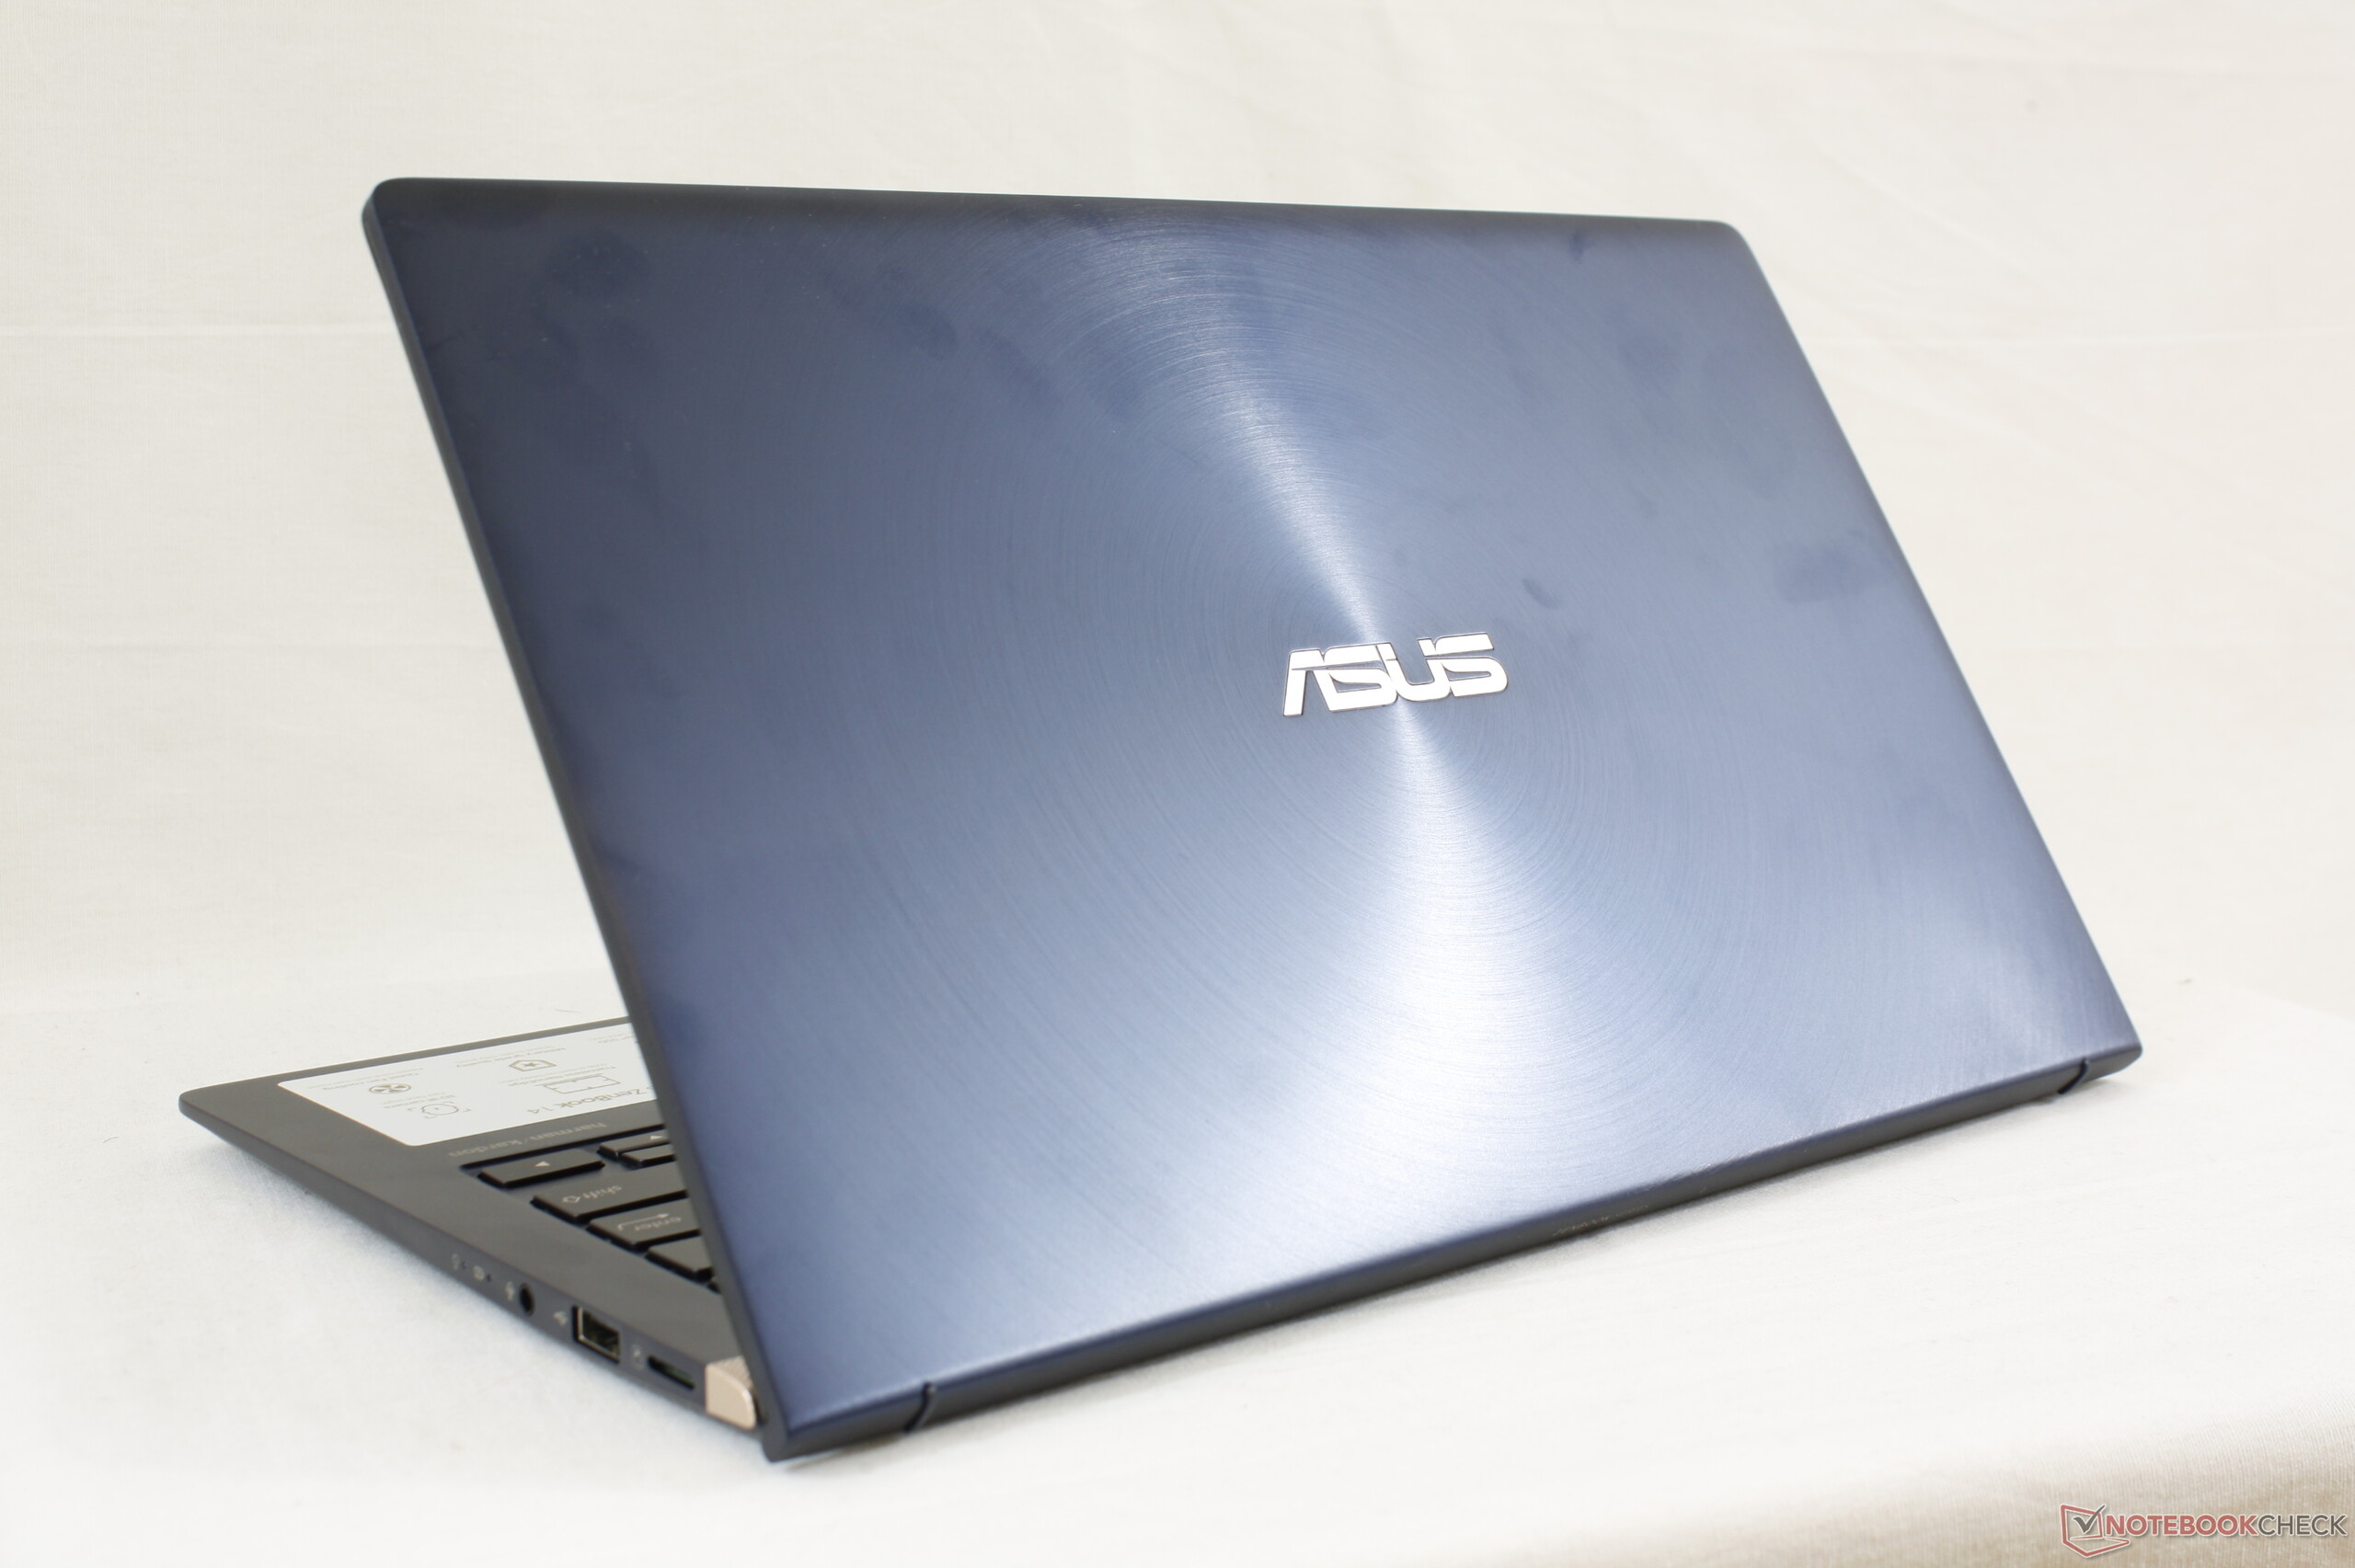
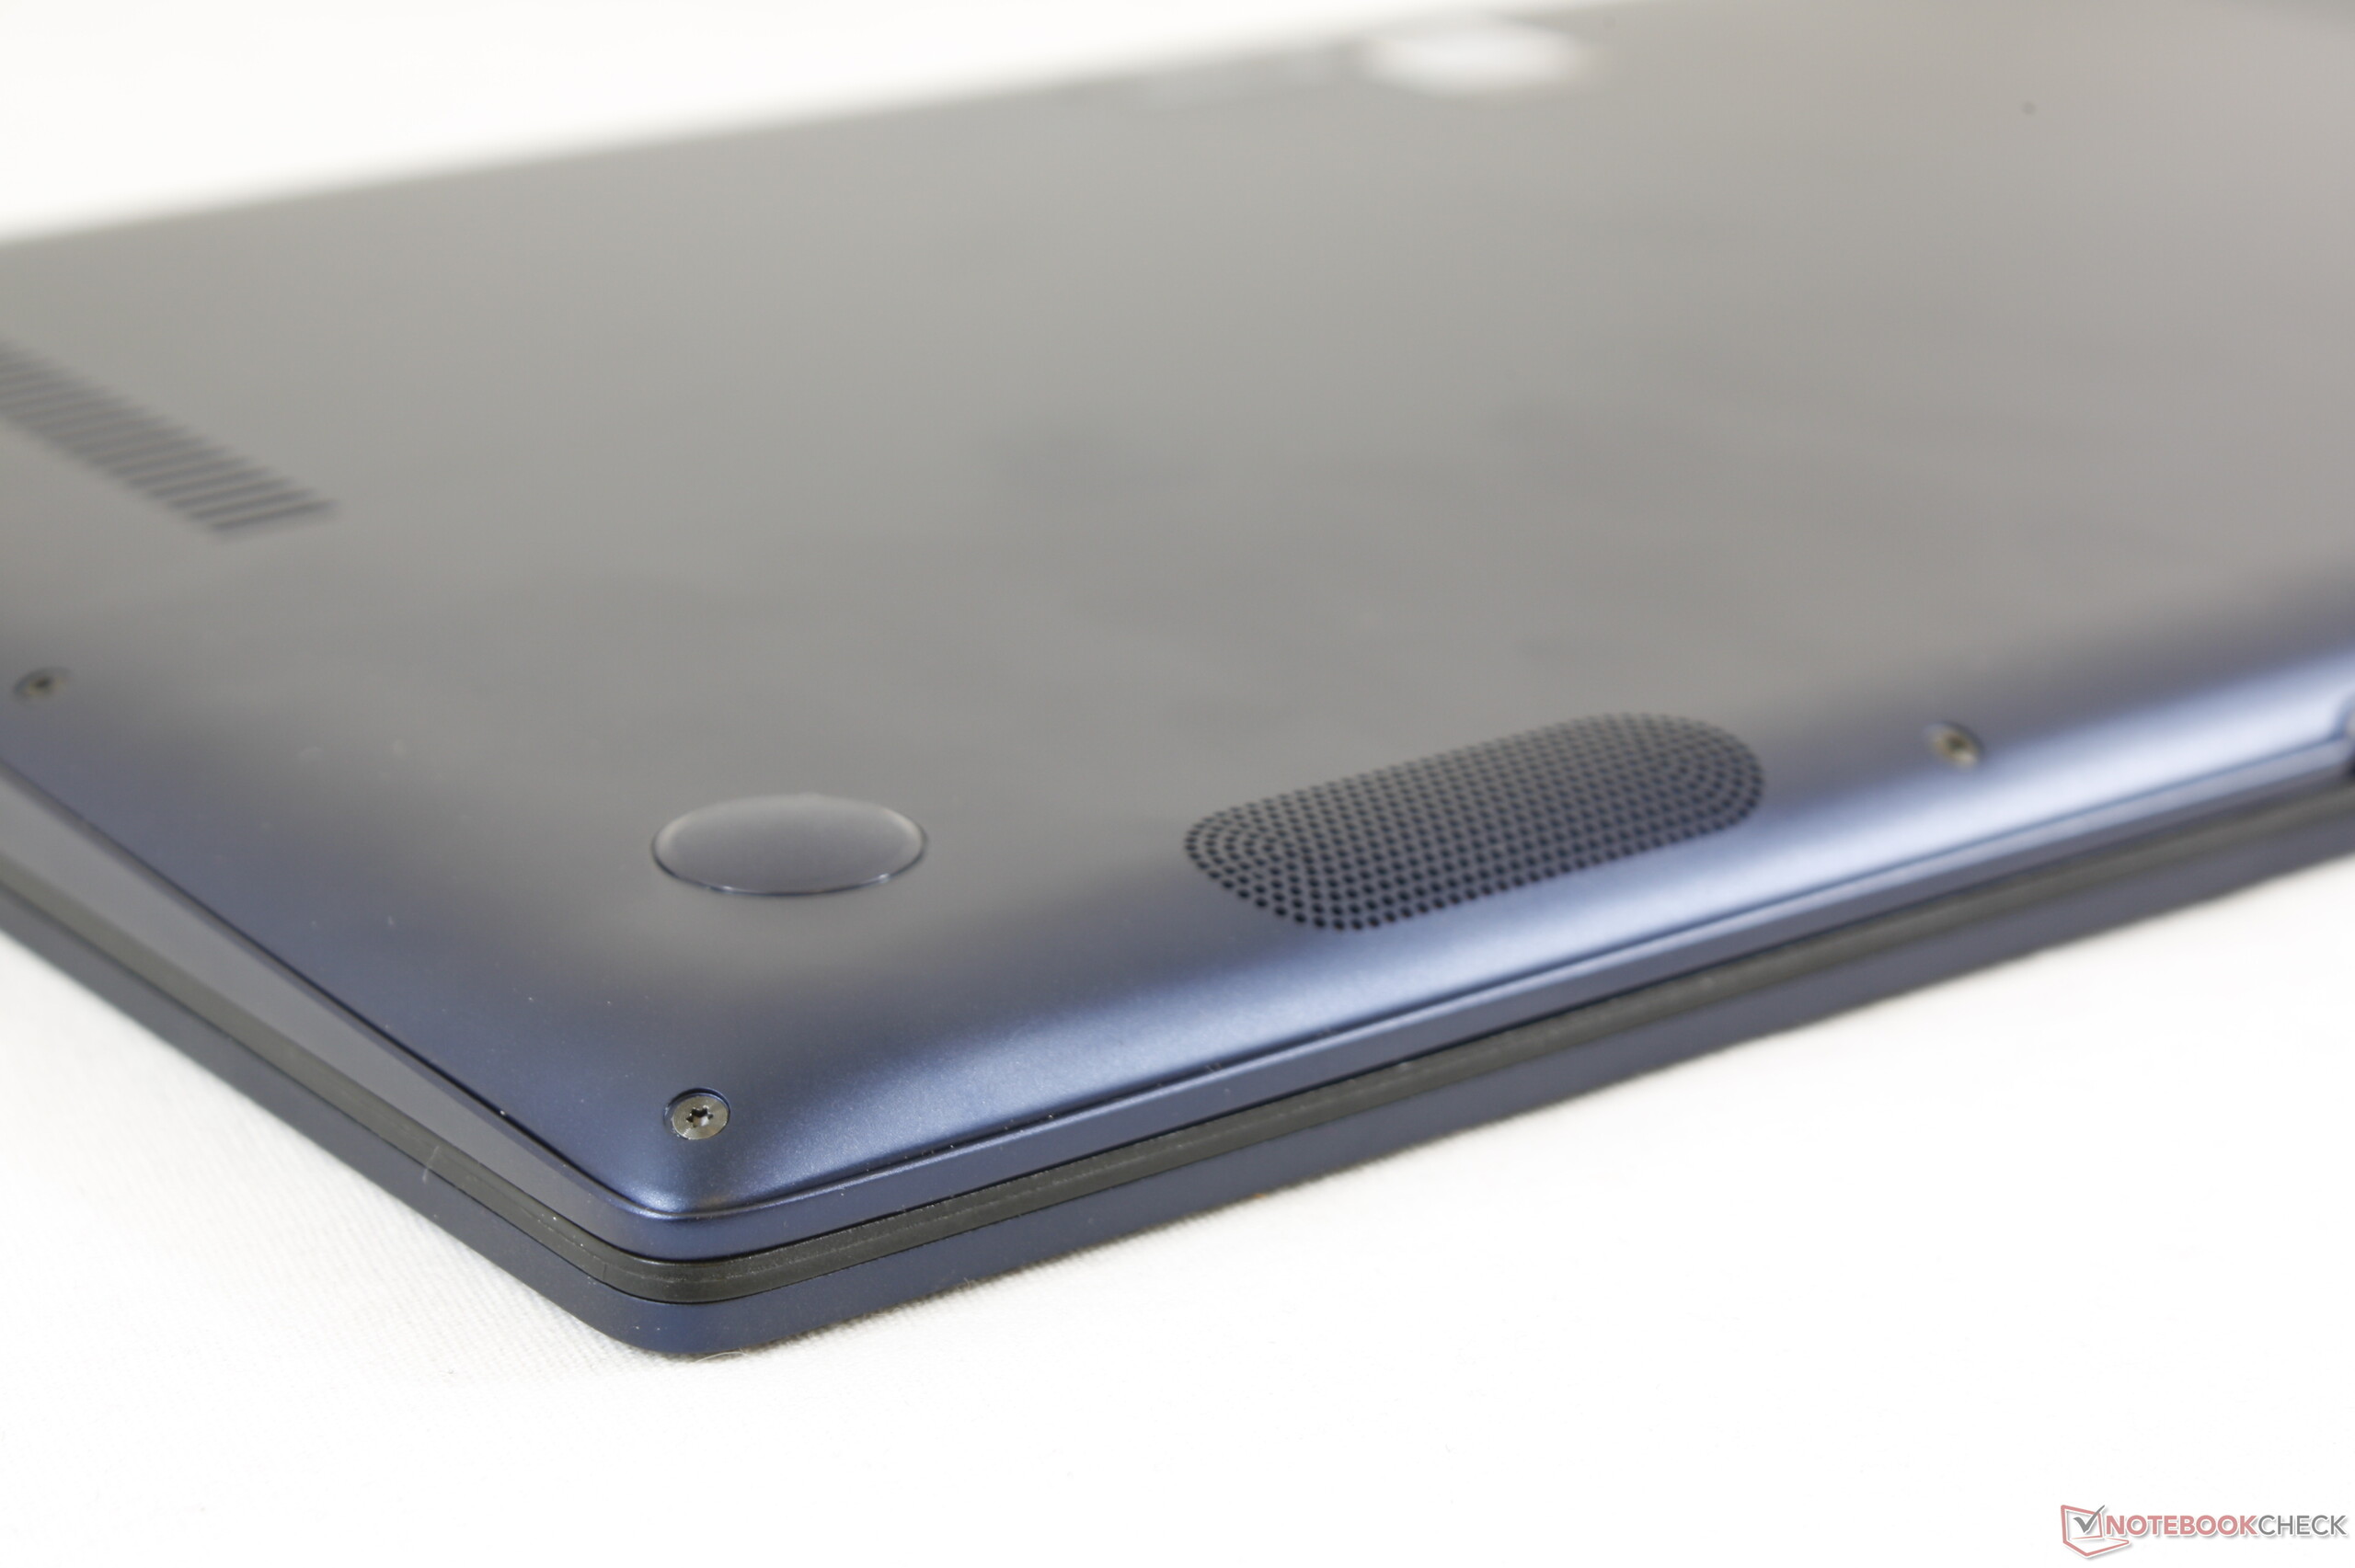
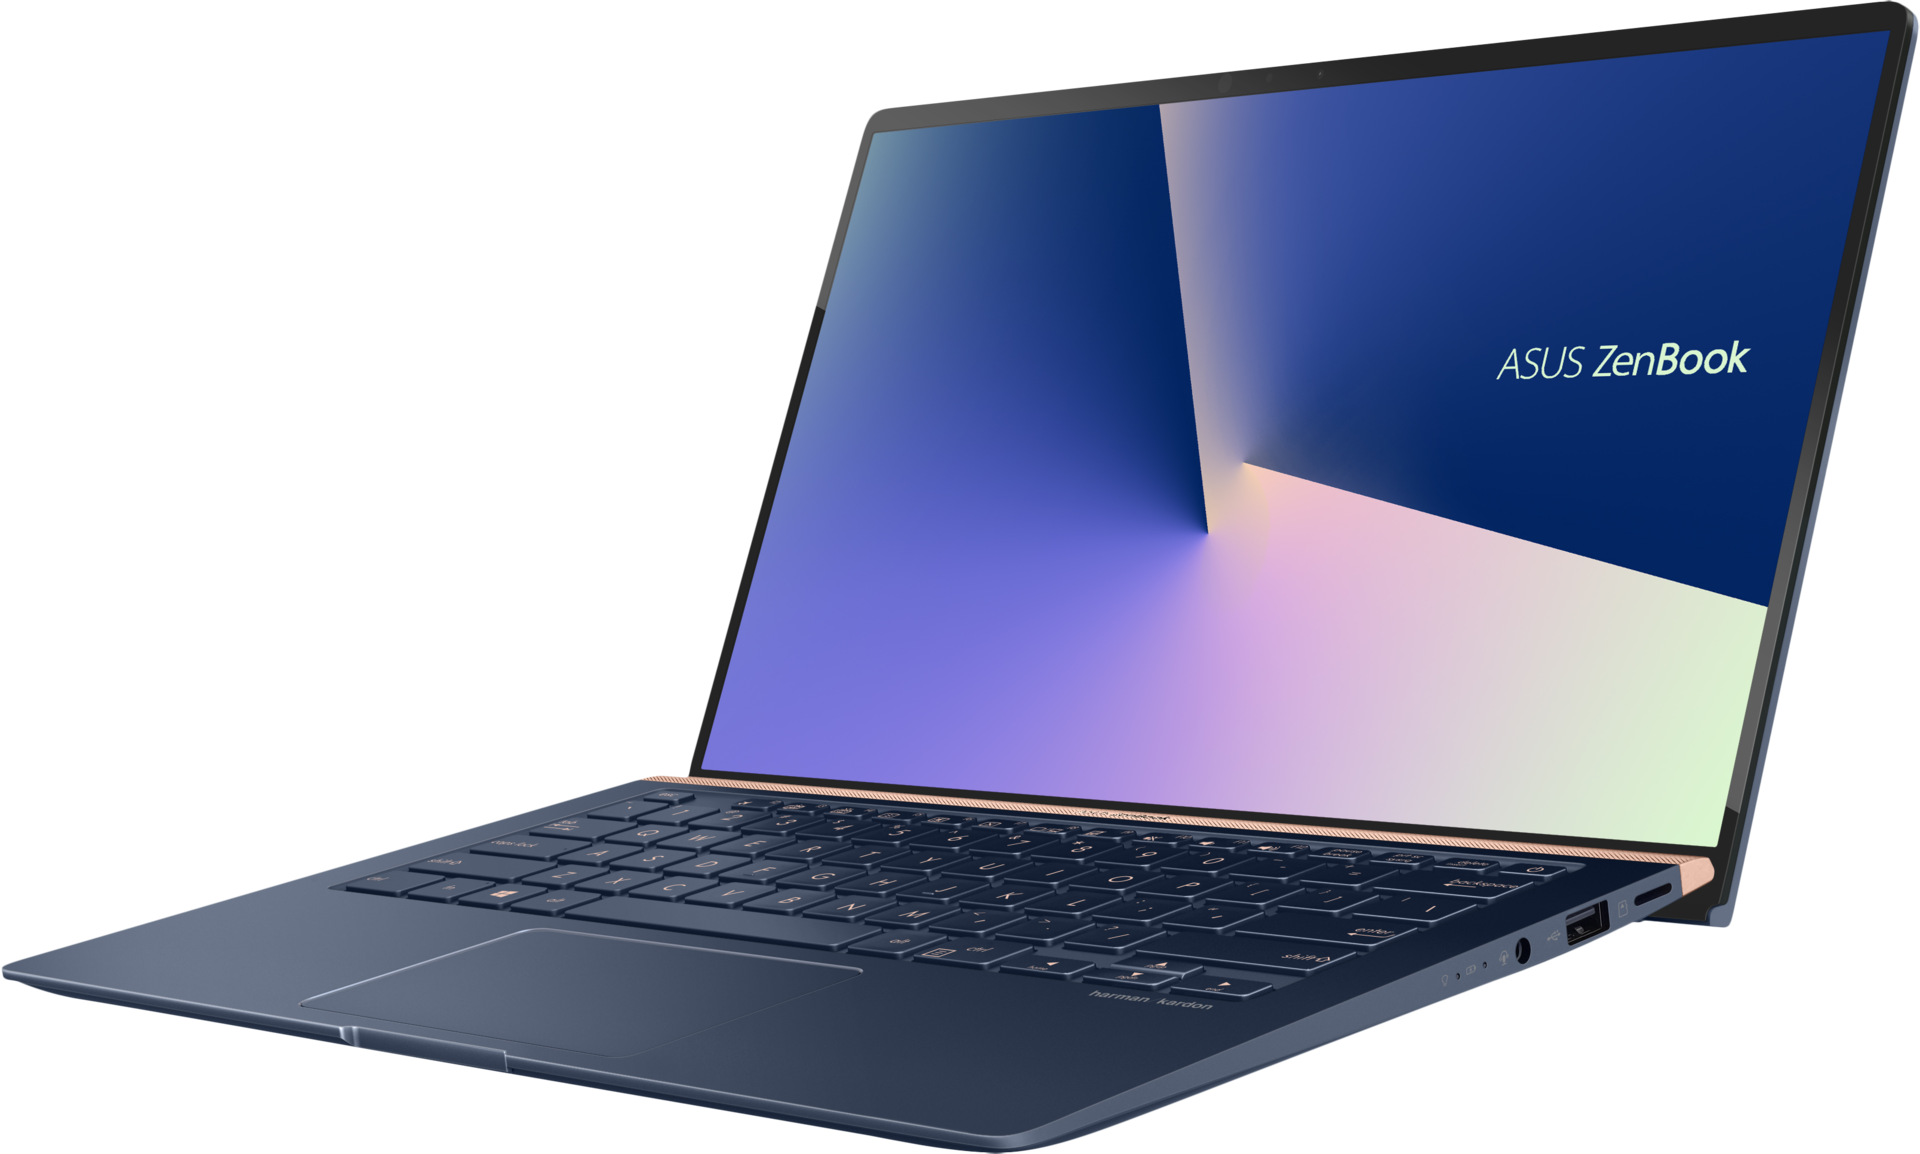
Ultrabook-marknaden har växt stadigt i fråga om tillgängliga alternativ och det blir svårare och svårare för tillverkare att stå ut från mängden. Men trots detta har Asus lyckats överraska oss med unika funktioner som UX580 ScreenPad och den nu fyrsidiga NanoEdge-infattningen som ger UX433 ett riktigt litet fotavtryck för en enhet med en skärm på 14 tum. Den nya designen är visuellt unik och känns "Zenbook" samtidigt som den förbättrar stabiliteten och anslutbarheten jämfört med förra generationens modell. Det är samma evolutionära uppgradering vi kommit att förvänta oss, men med definierande drag som är både tjusiga och ergonomiska.
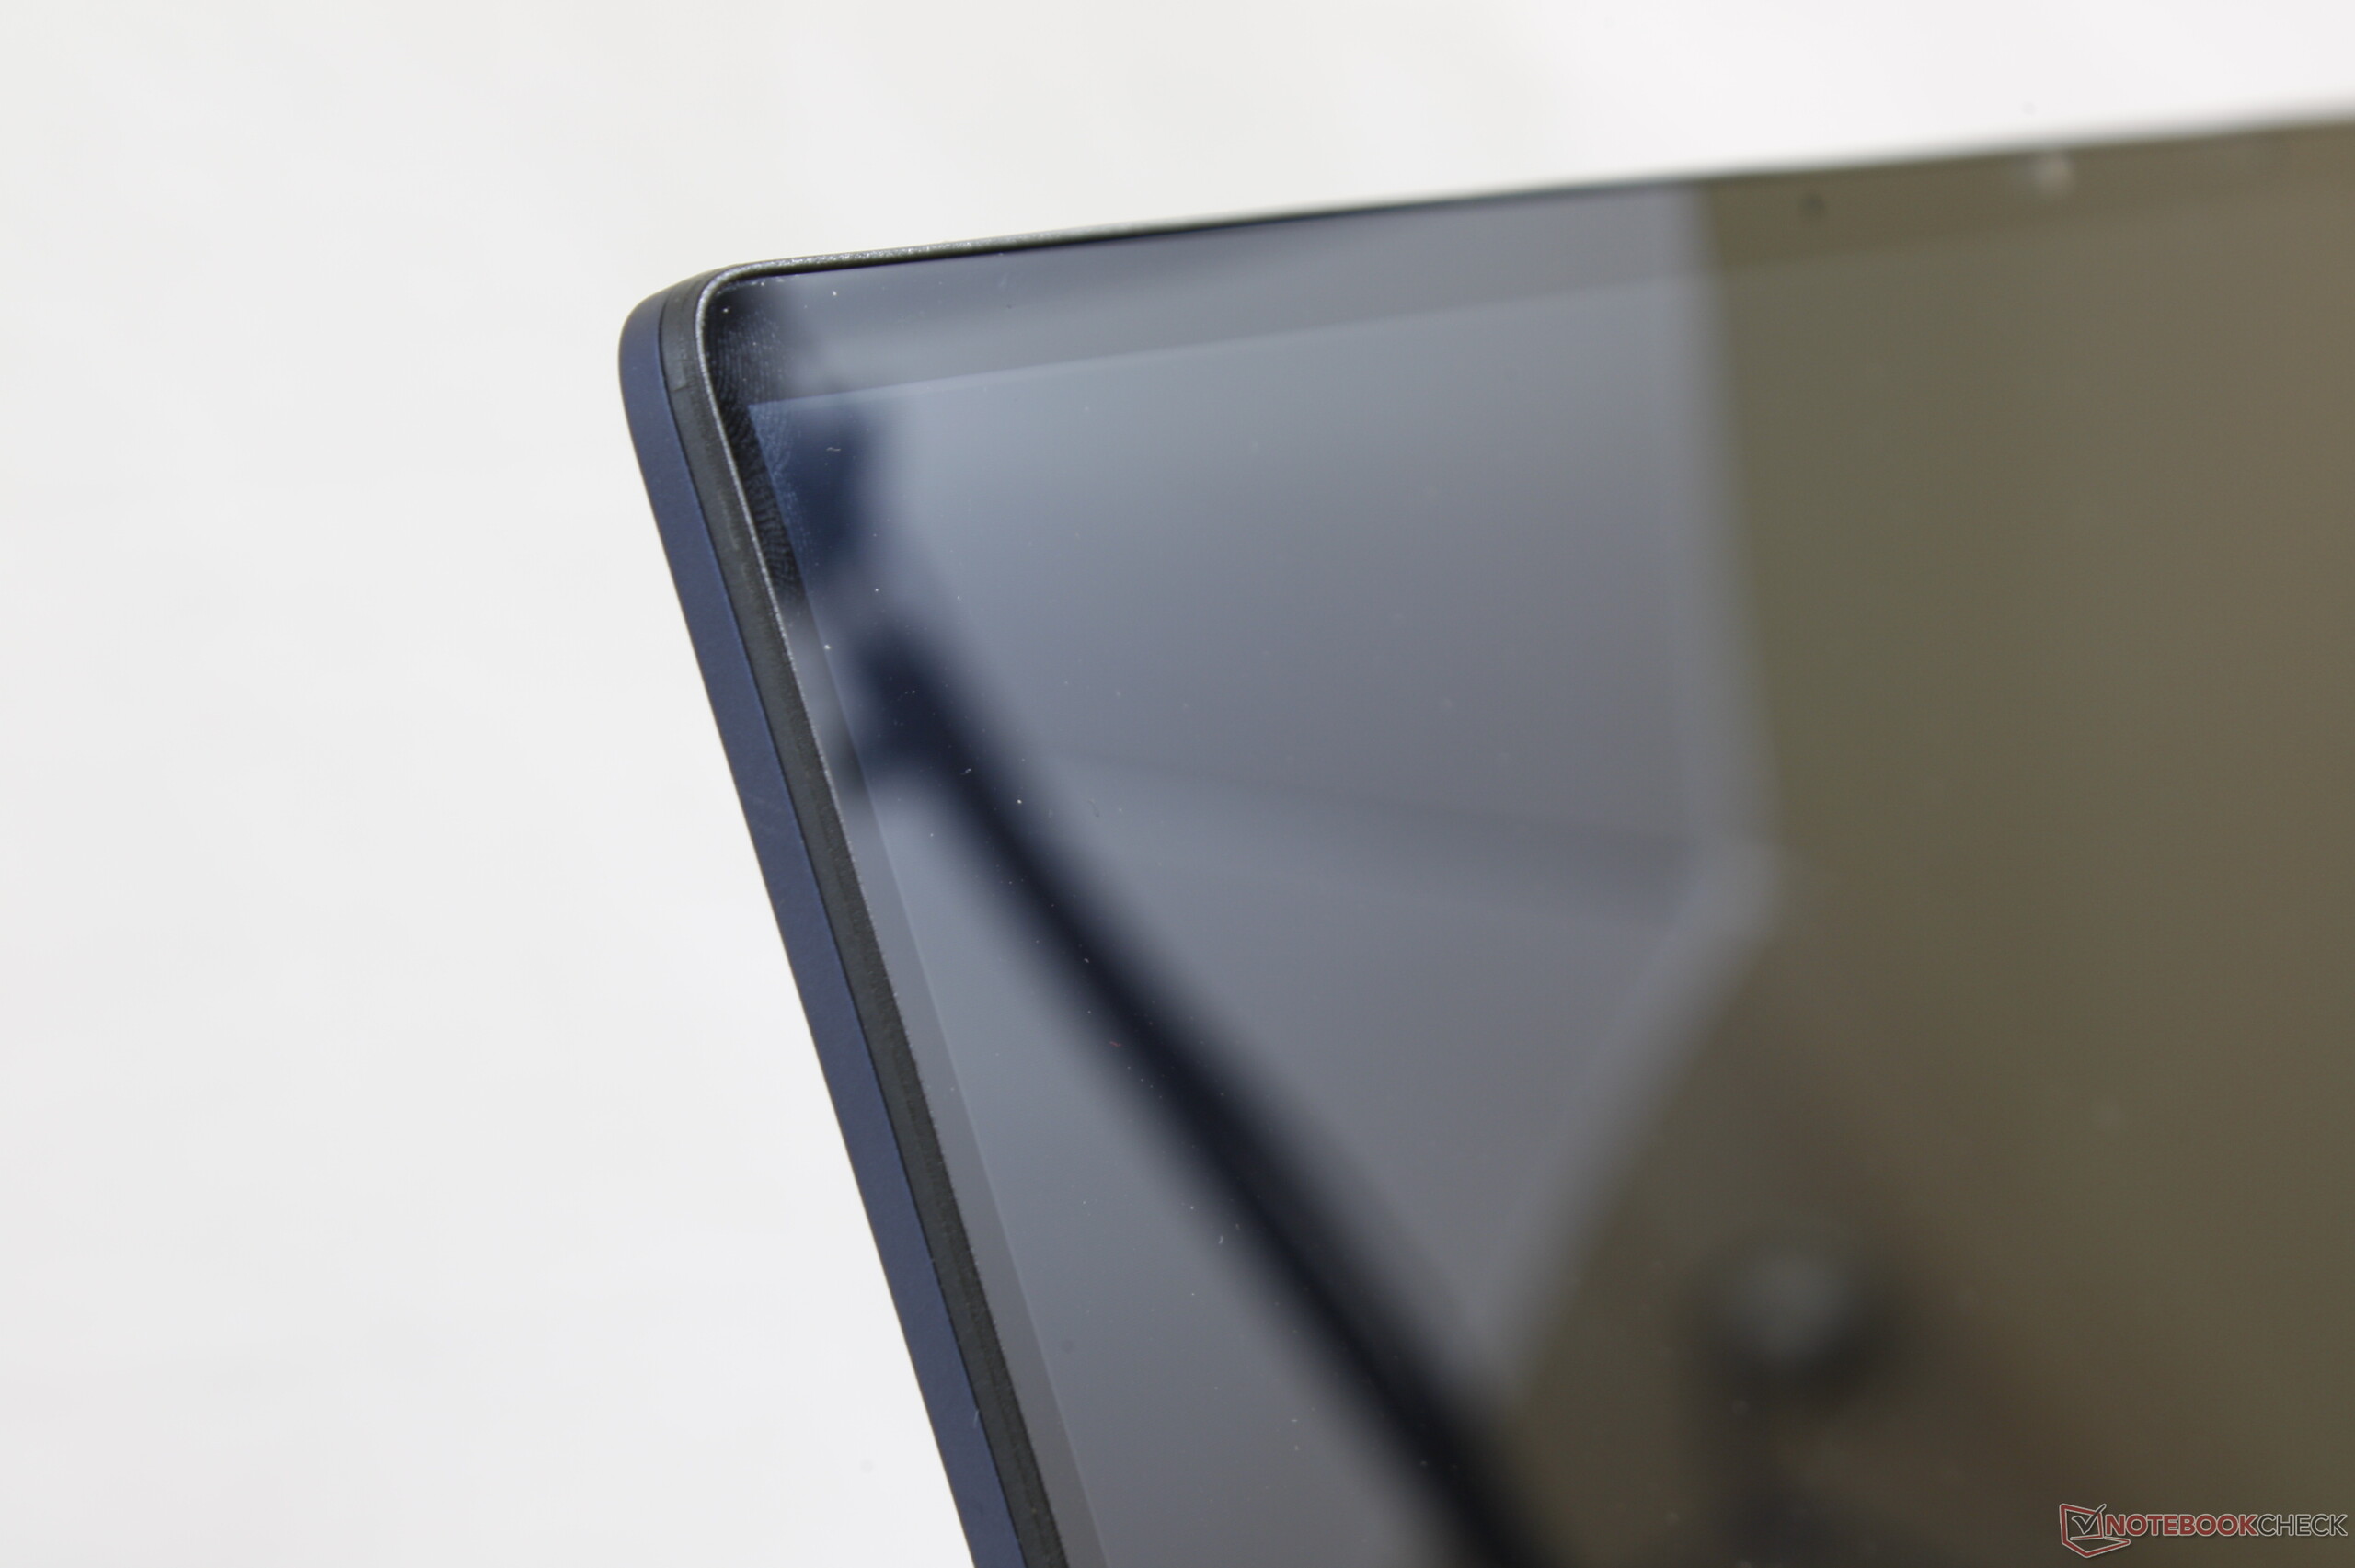
Vi uppskattade särskilt att UX433 inkluderar alternativ för både en antireflexbehandlad matt skärm samt en blank skärm. En SKU med GeForce MX150 kommer också att finnas. De flesta Ultrabook-modeller har bara blanka skärmar och är begränsade till långsammare integrerad Intel-grafik.
UX433:s svagaste sida är CPU-prestandan. Det är inte hastigheten som besviker utan att ökningen som Whiskey Lake-U ger utöver 8:e generationens Kaby Lake-R är så marginell att de flesta användare troligen inte ens kommer att märka den. Detta känner Asus också till, då den officiella produktsidan för UX433 jämför Whiskey Lake-U med 7:e generationens Kaby Lake istället för 8:e generationens Kaby Lake-R för att kunna göra reklam för en större ökning i CPU-prestanda. Vi kan inte låta bli att känna att systemet kunde ha varit billigare och precis lika snabbt om det istället hade kommit med en i7-8550U eller en i5-8250U.
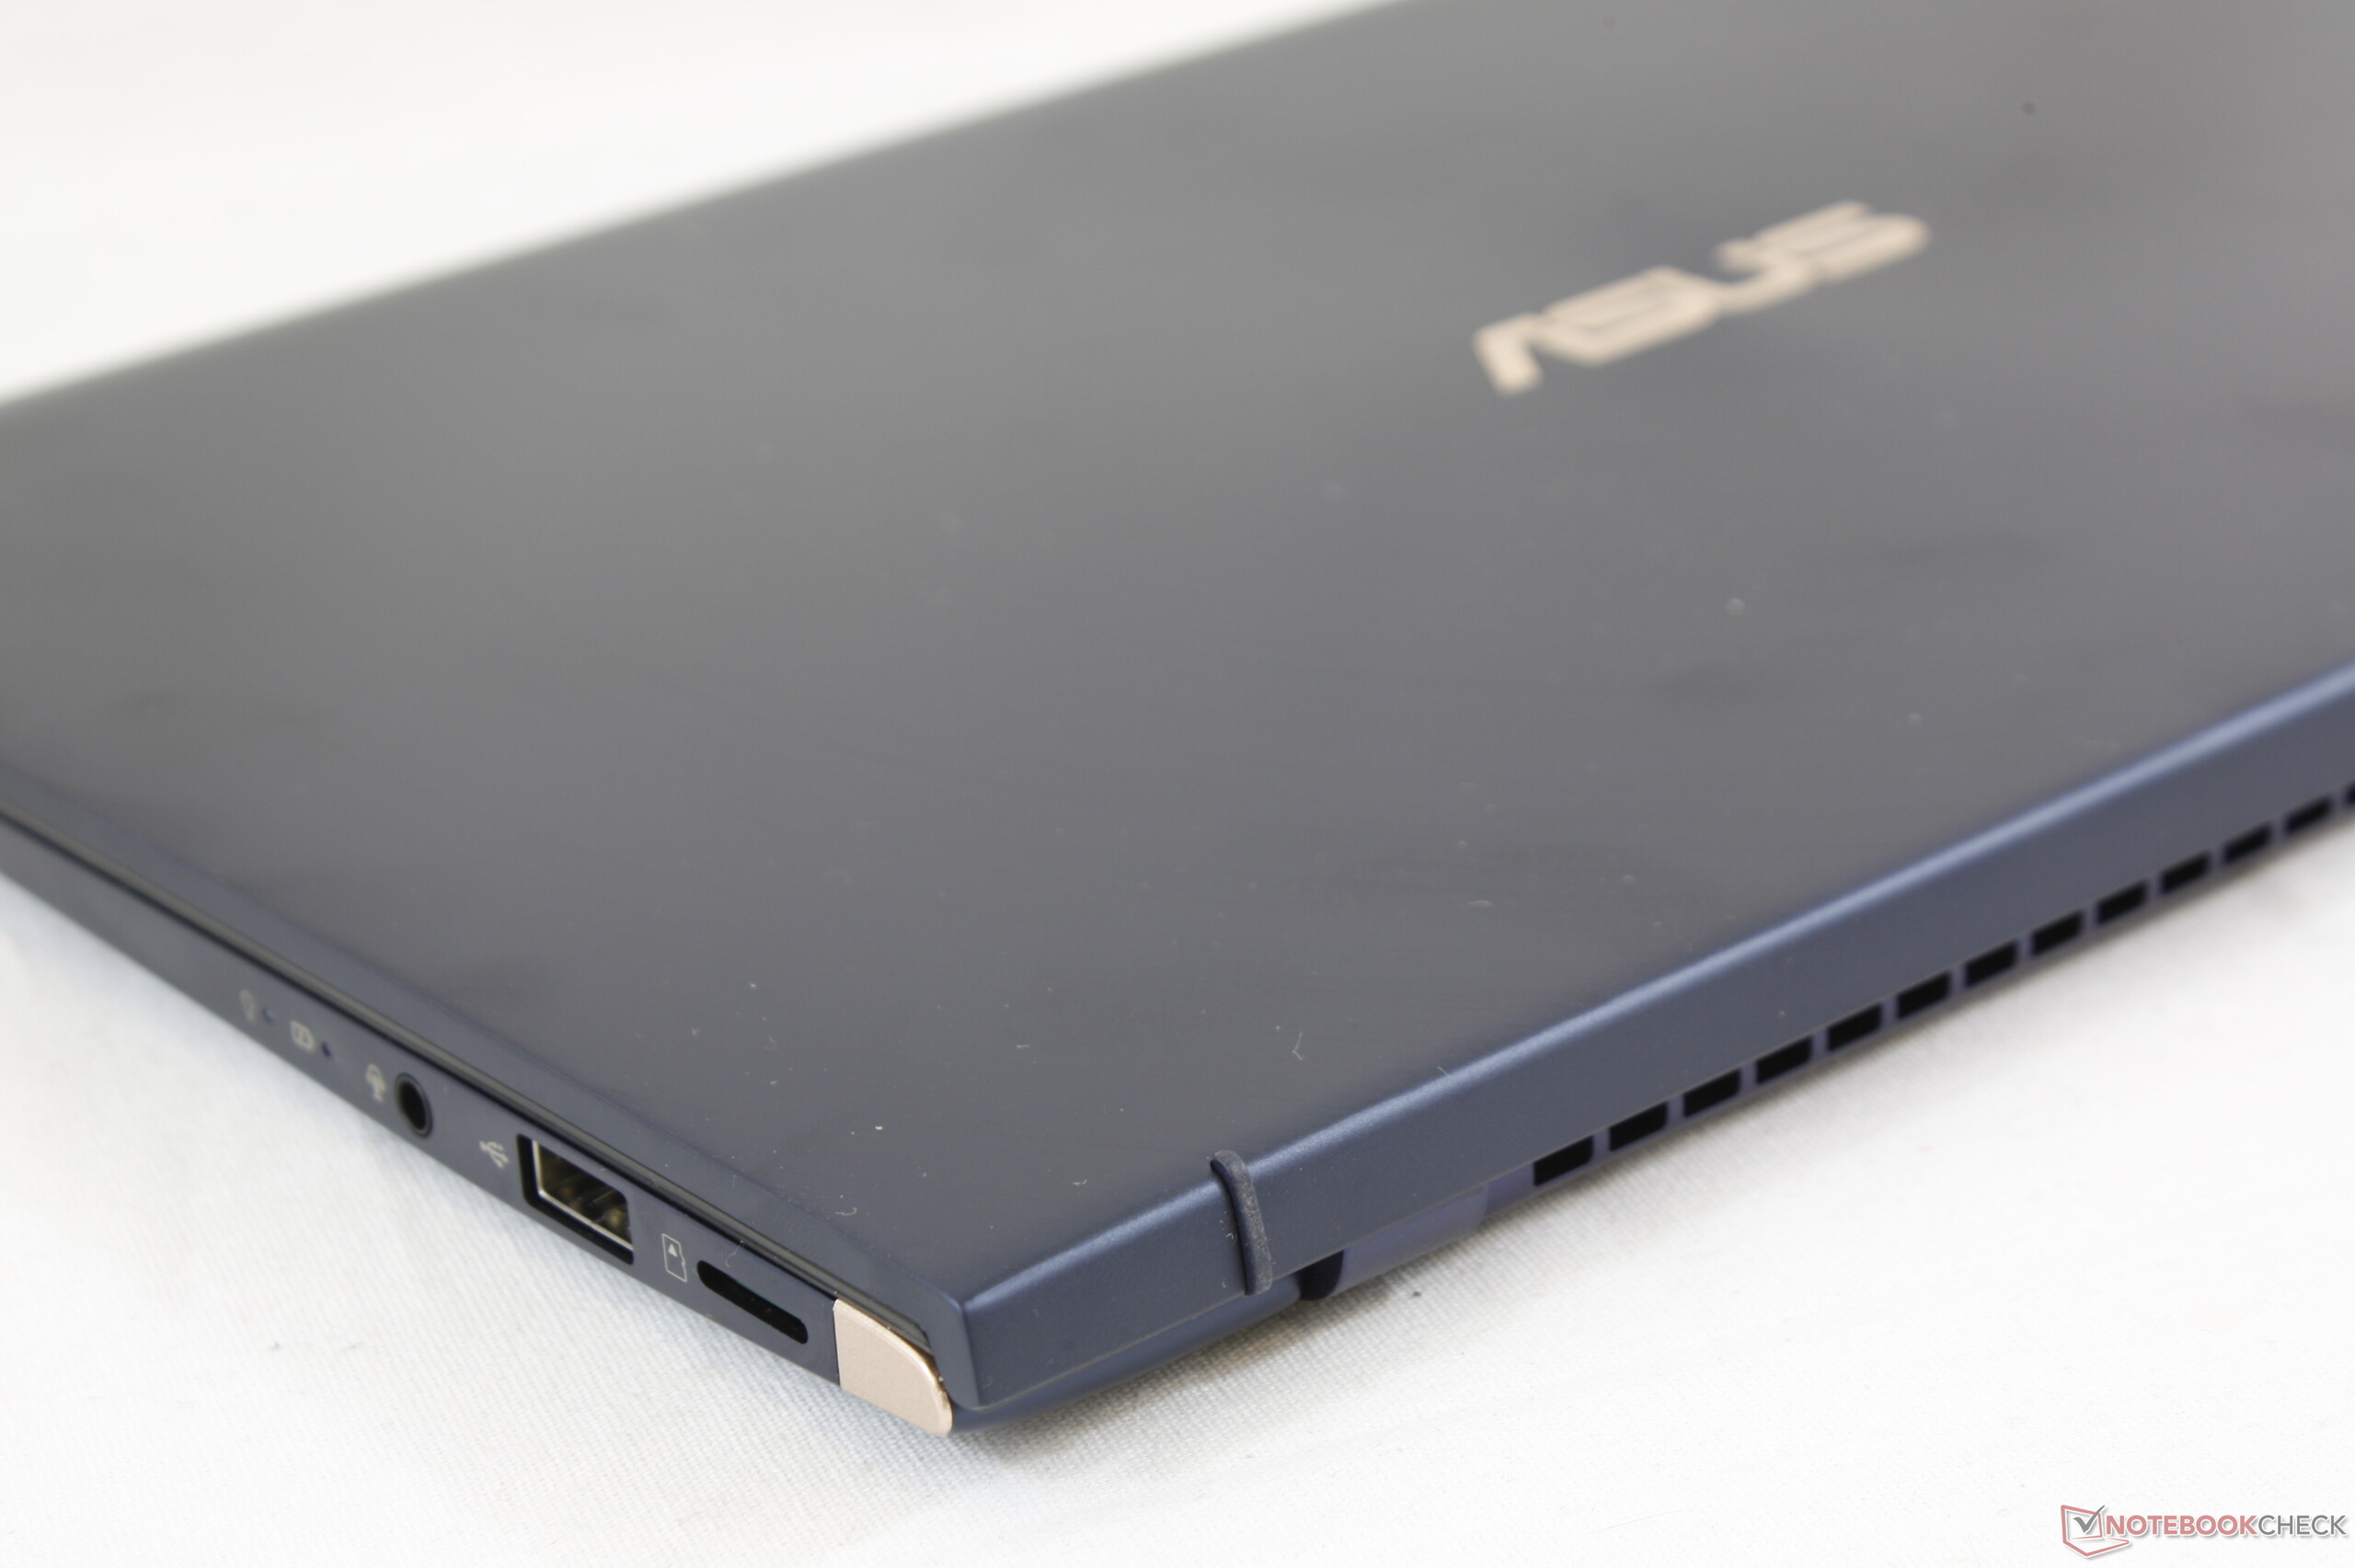
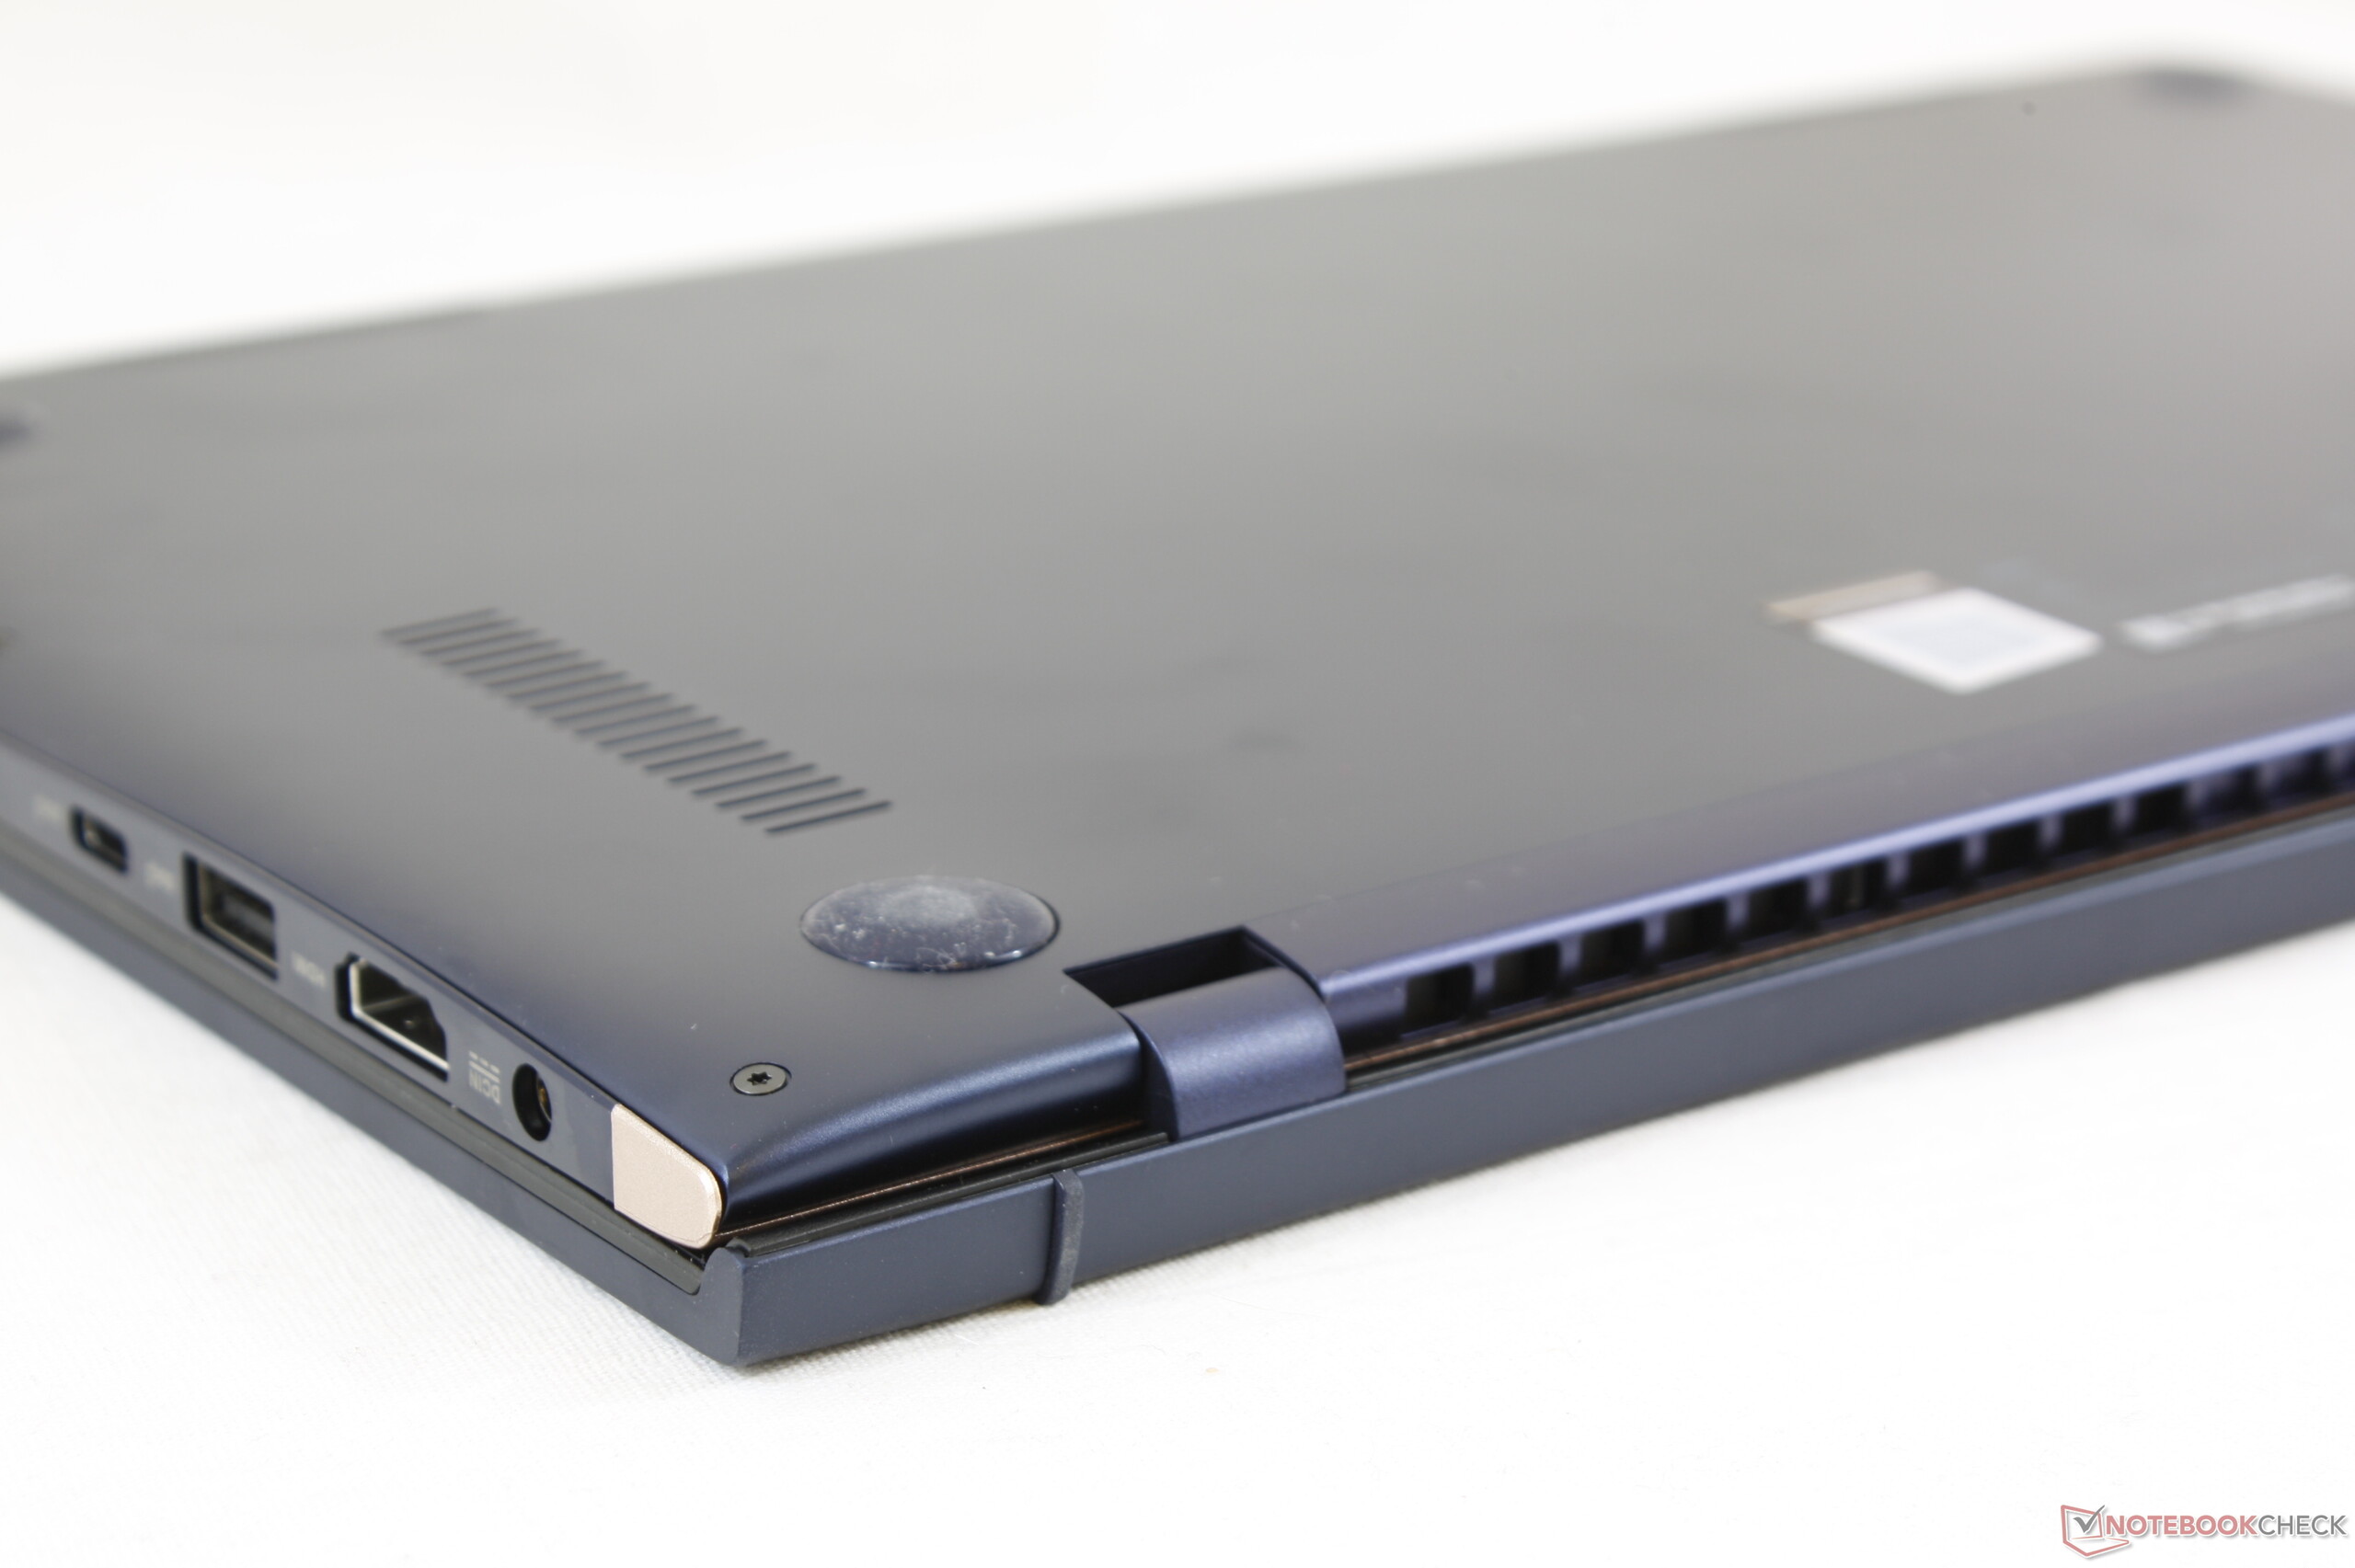
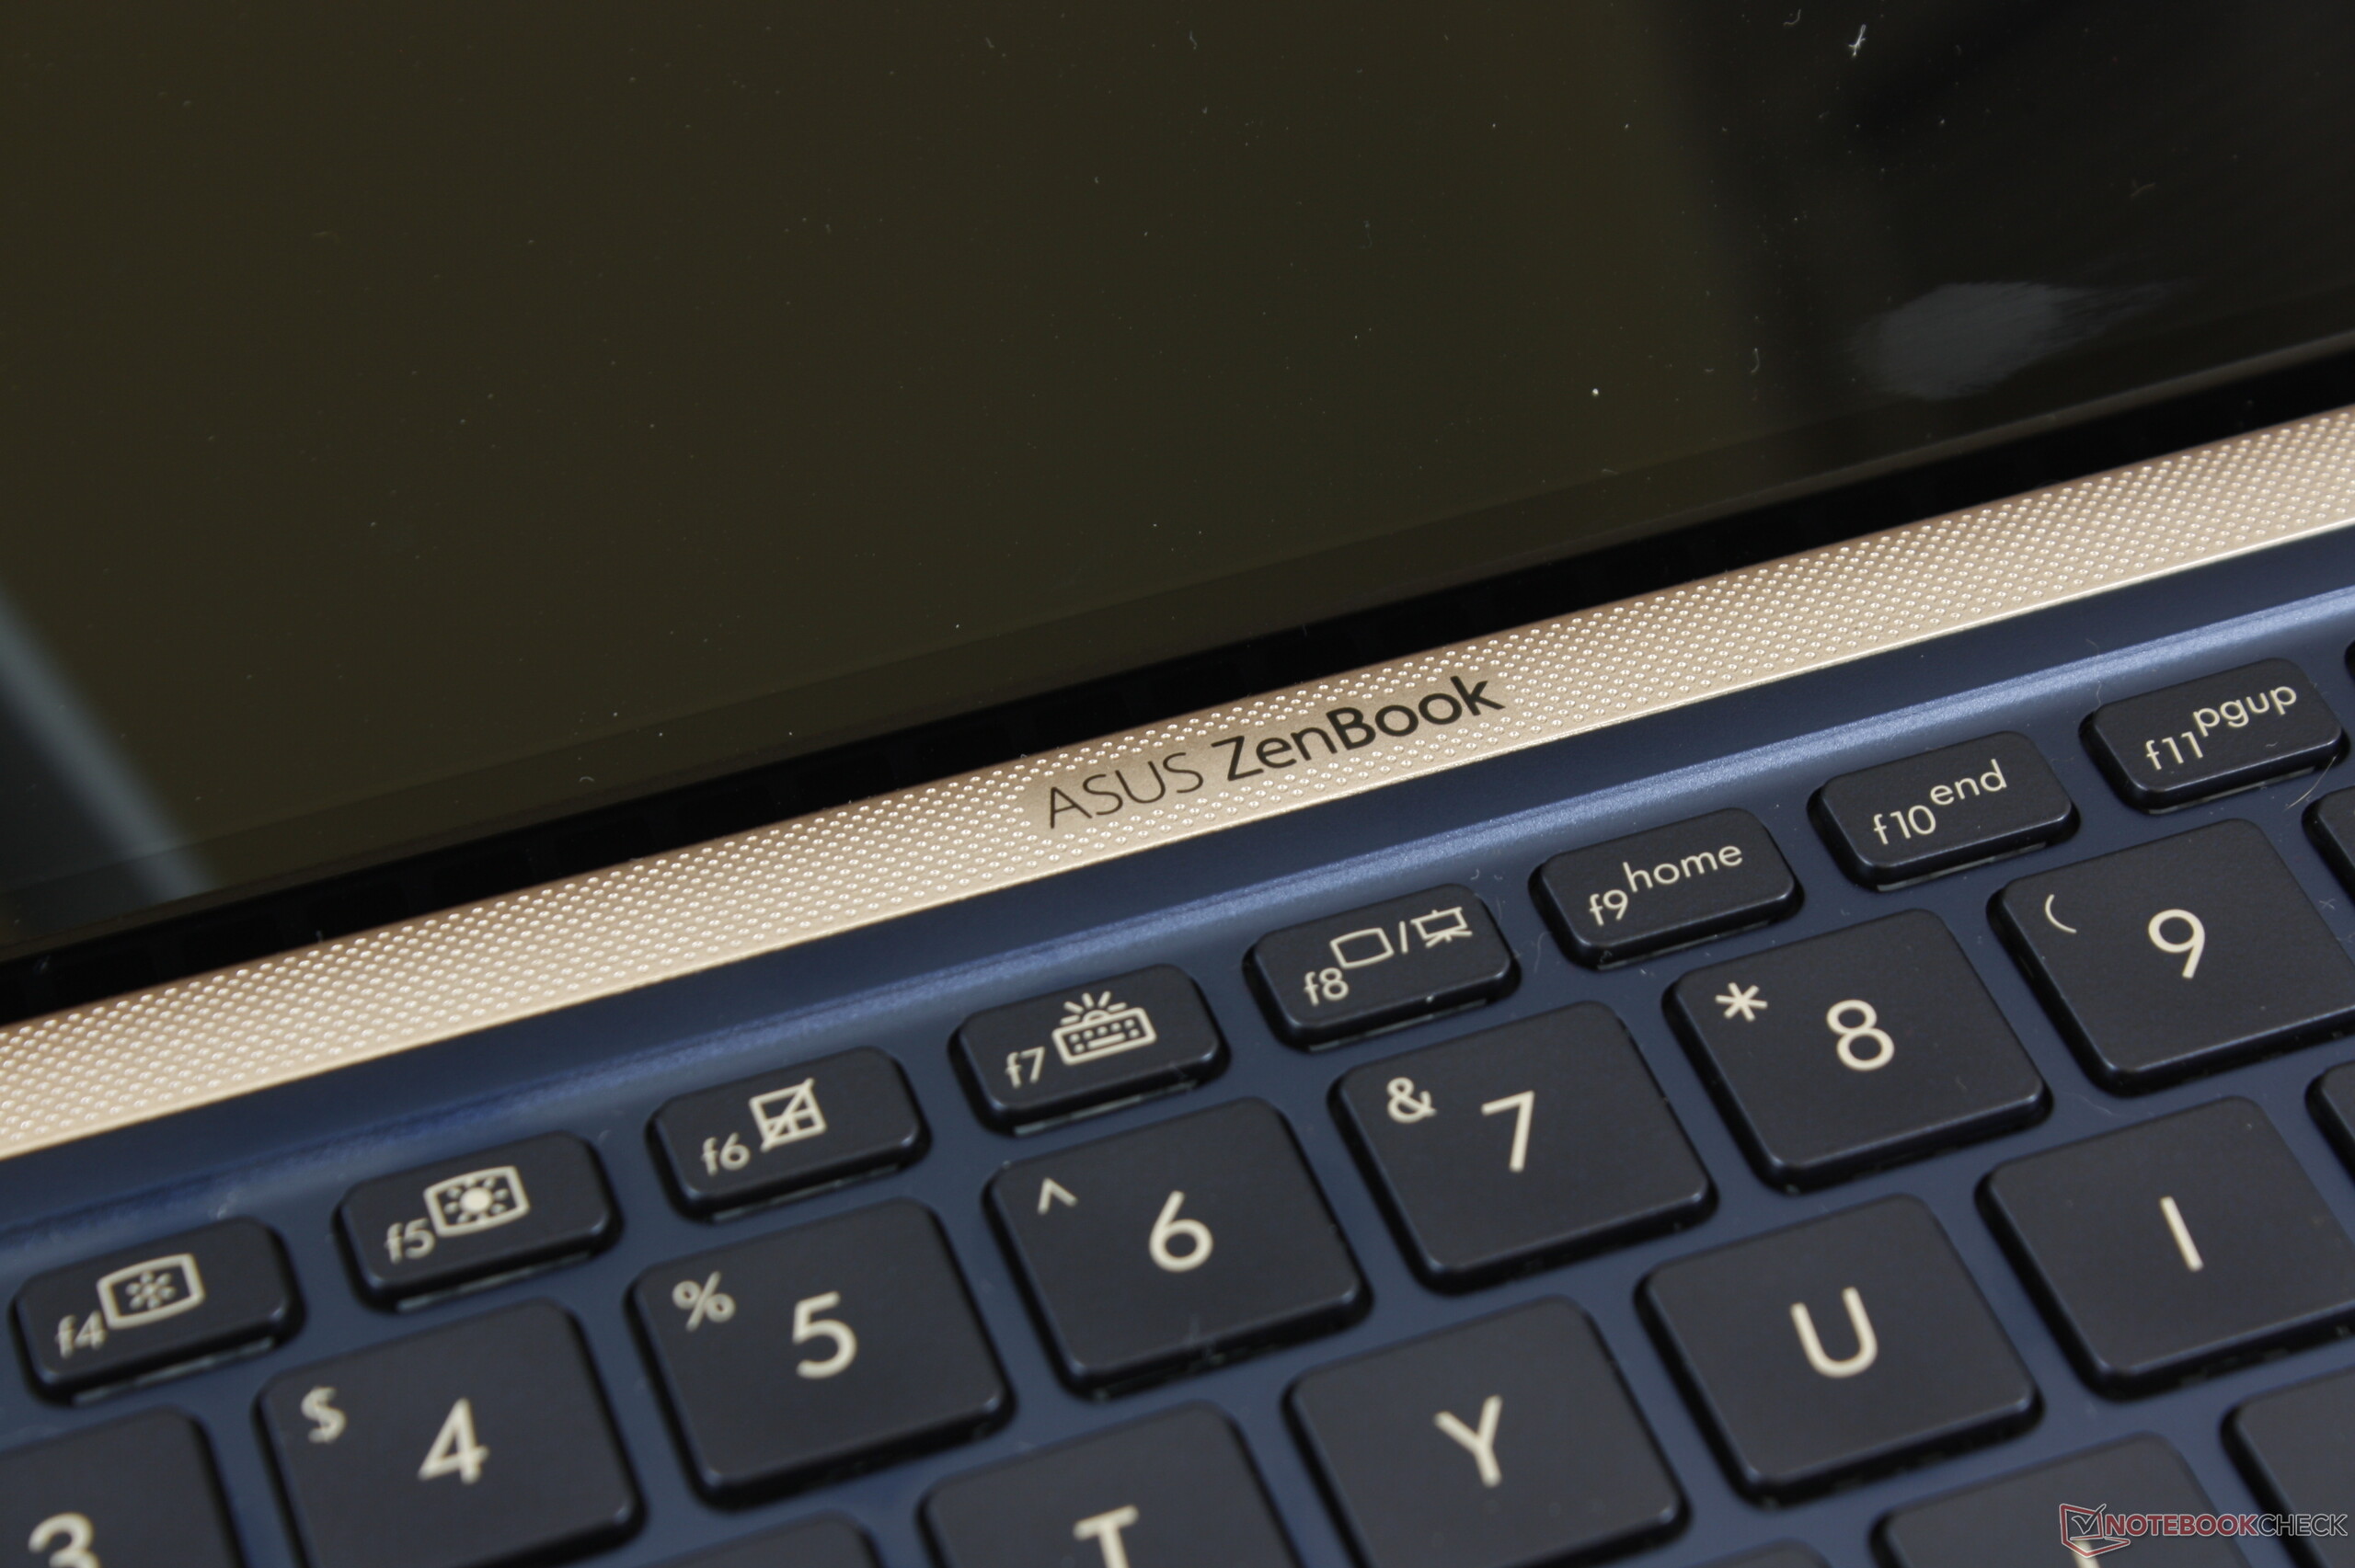
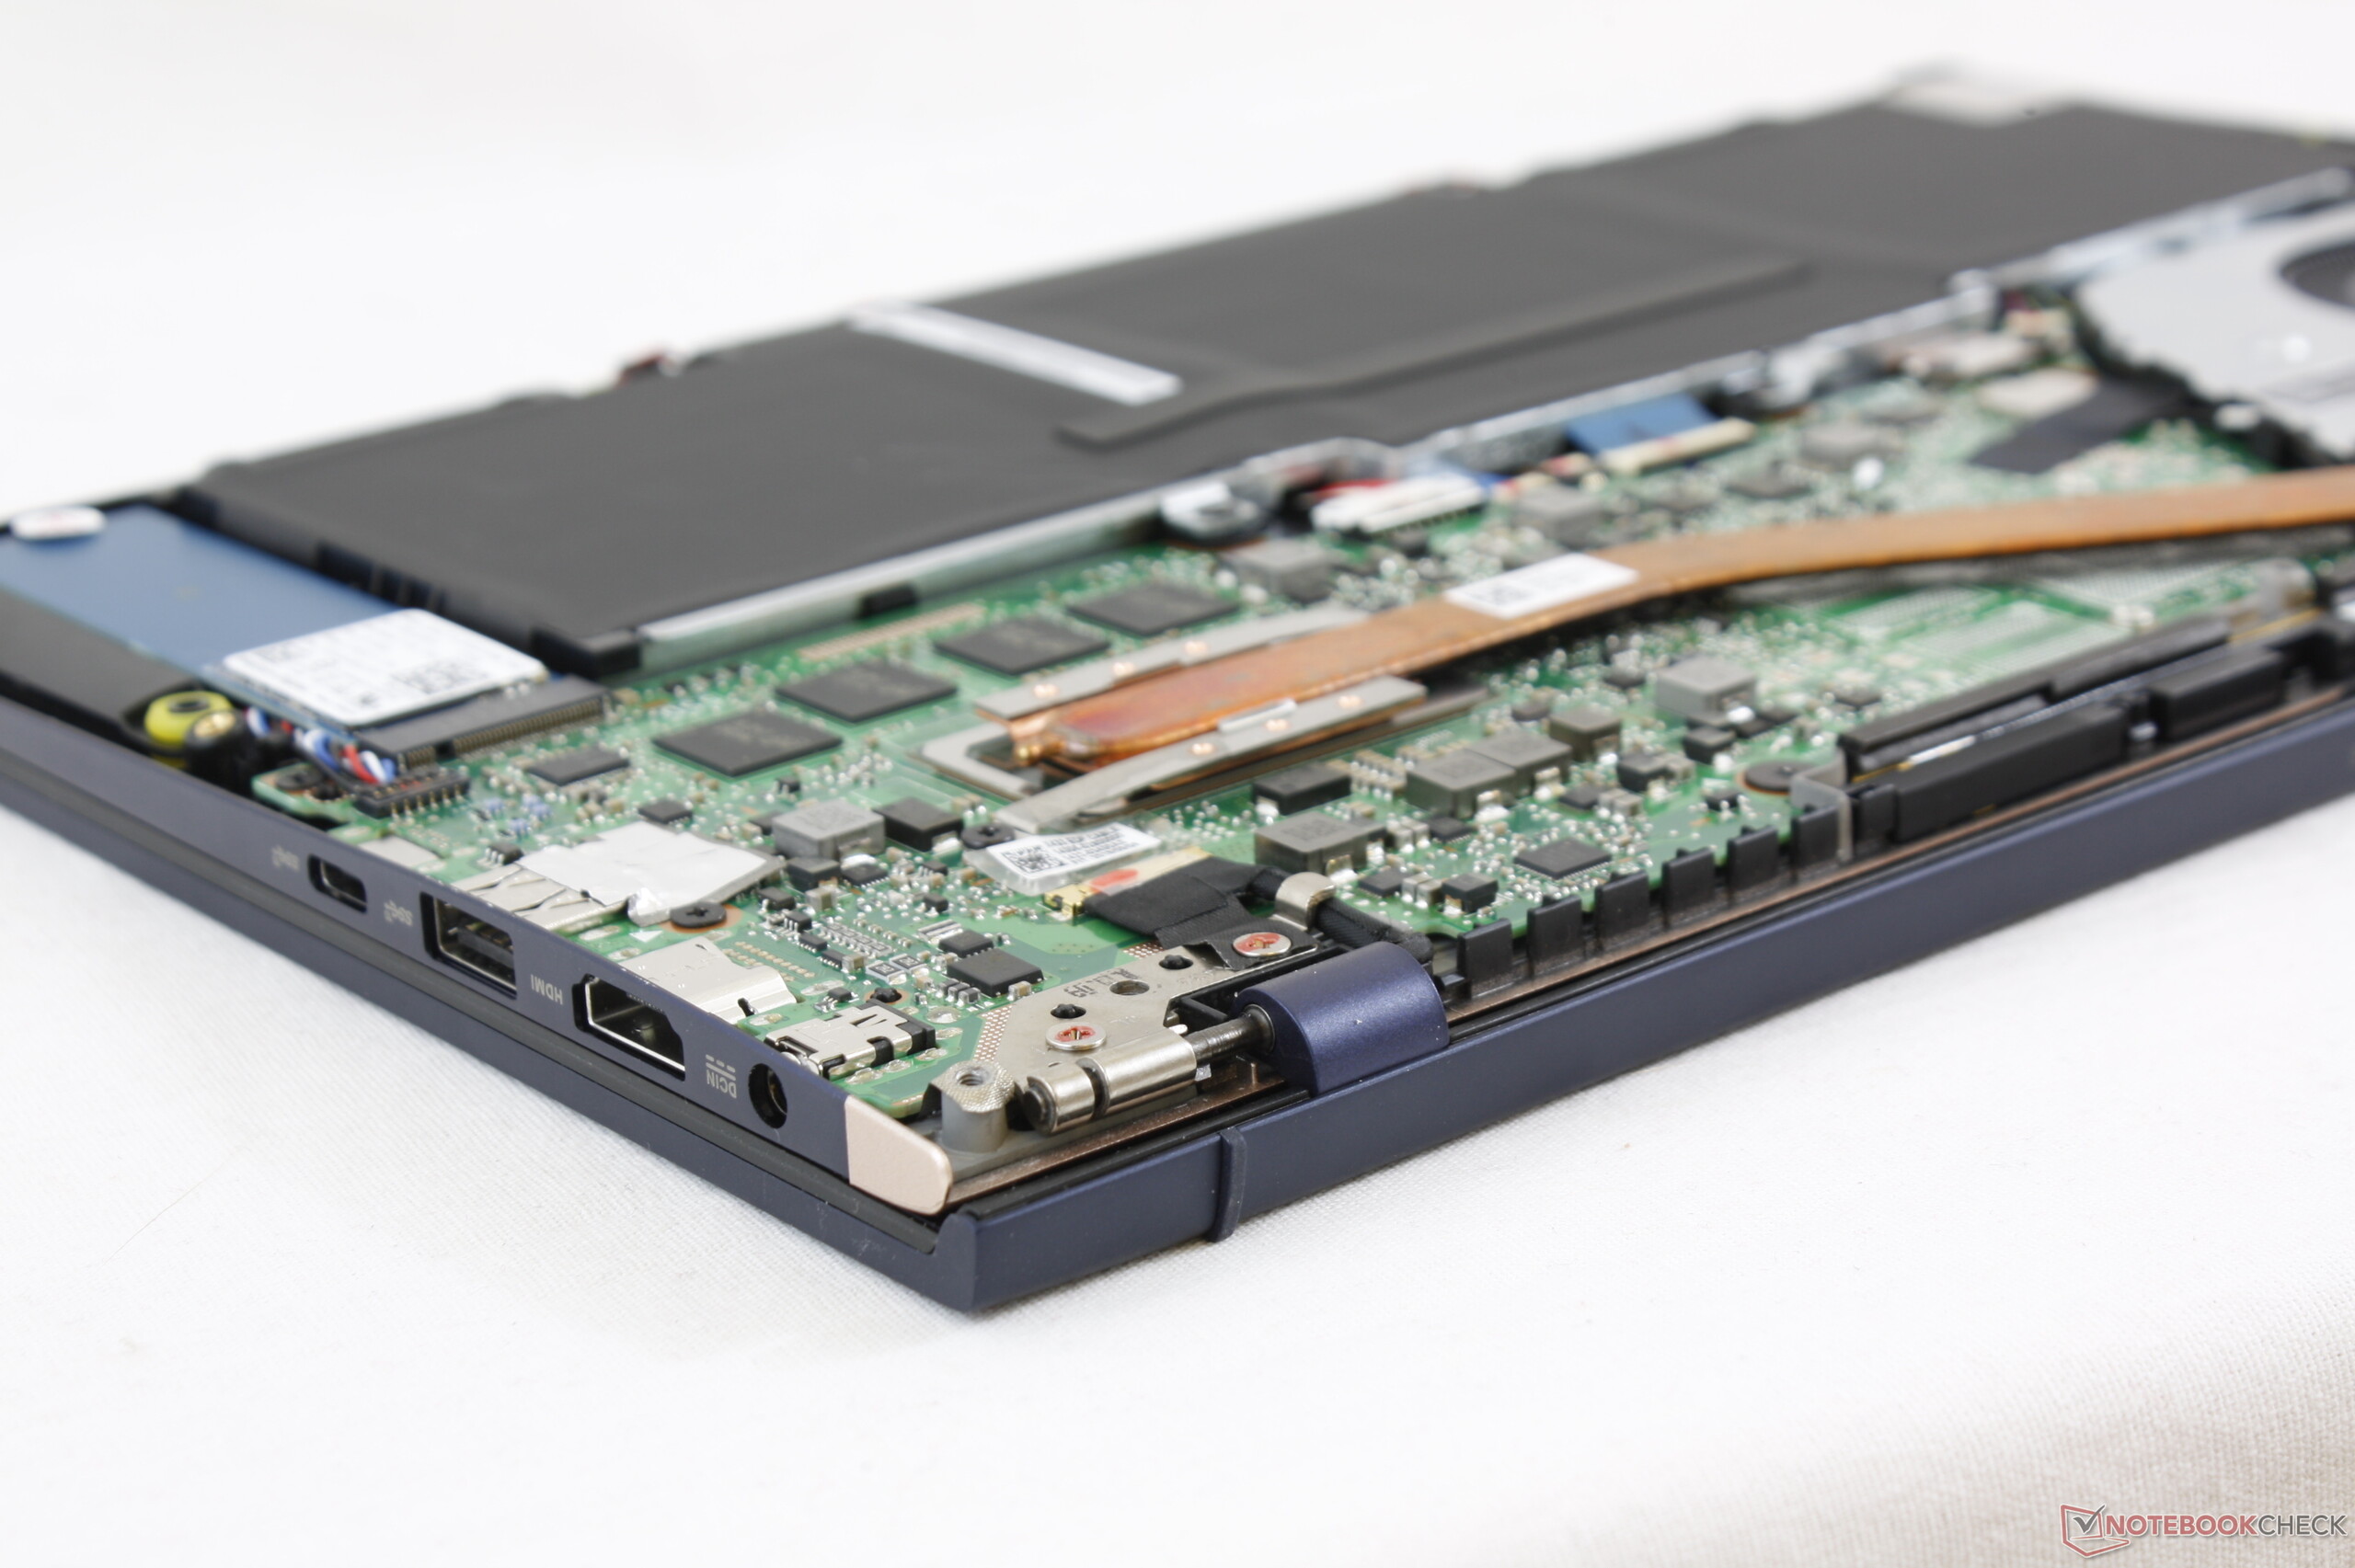
Till kommande revideringar hoppas vi på att se Thunderbolt 3 och en mer ljusstark skärm så att den bättre kan tävla med populära alternativ som XPS 13, MateBook X Pro, MacBook Pro 13, Samsung NP900 och andra som ger bättre synlighet utomhus. Asus bör även göra sig av med den propretiära AC-adapterporten och istället använda mer mångsidig USB Typ C-laddning. Haptisk återkoppling för det virtuella numeriska tangentbordet, en fingeravtrycksläsare och ett spillsäkert tangentbord är bara några av de saknade funktioner som tillverkaren kan tänkas vilja åtgärda för att göra UX433 ännu mer prisvärd.
En uppgradering både visuellt och kvalitetsmässigt jämfört med förra generationens UX430. Systemet känns starkt för sin storlek även om det ger avkall på en del funktioner som finns på de flesta andra ultrabook-modeller i samma prisskikt. Ökningen i CPU-prestanda som kommer av Whiskey Lake-U kommer vara mycket större för den som byter upp sig från en laptop som är minst två, tre år gammal.
Asus ZenBook 14 UX433FA
- 11/20/2018 v6 (old)
Allen Ngo
Price comparison
