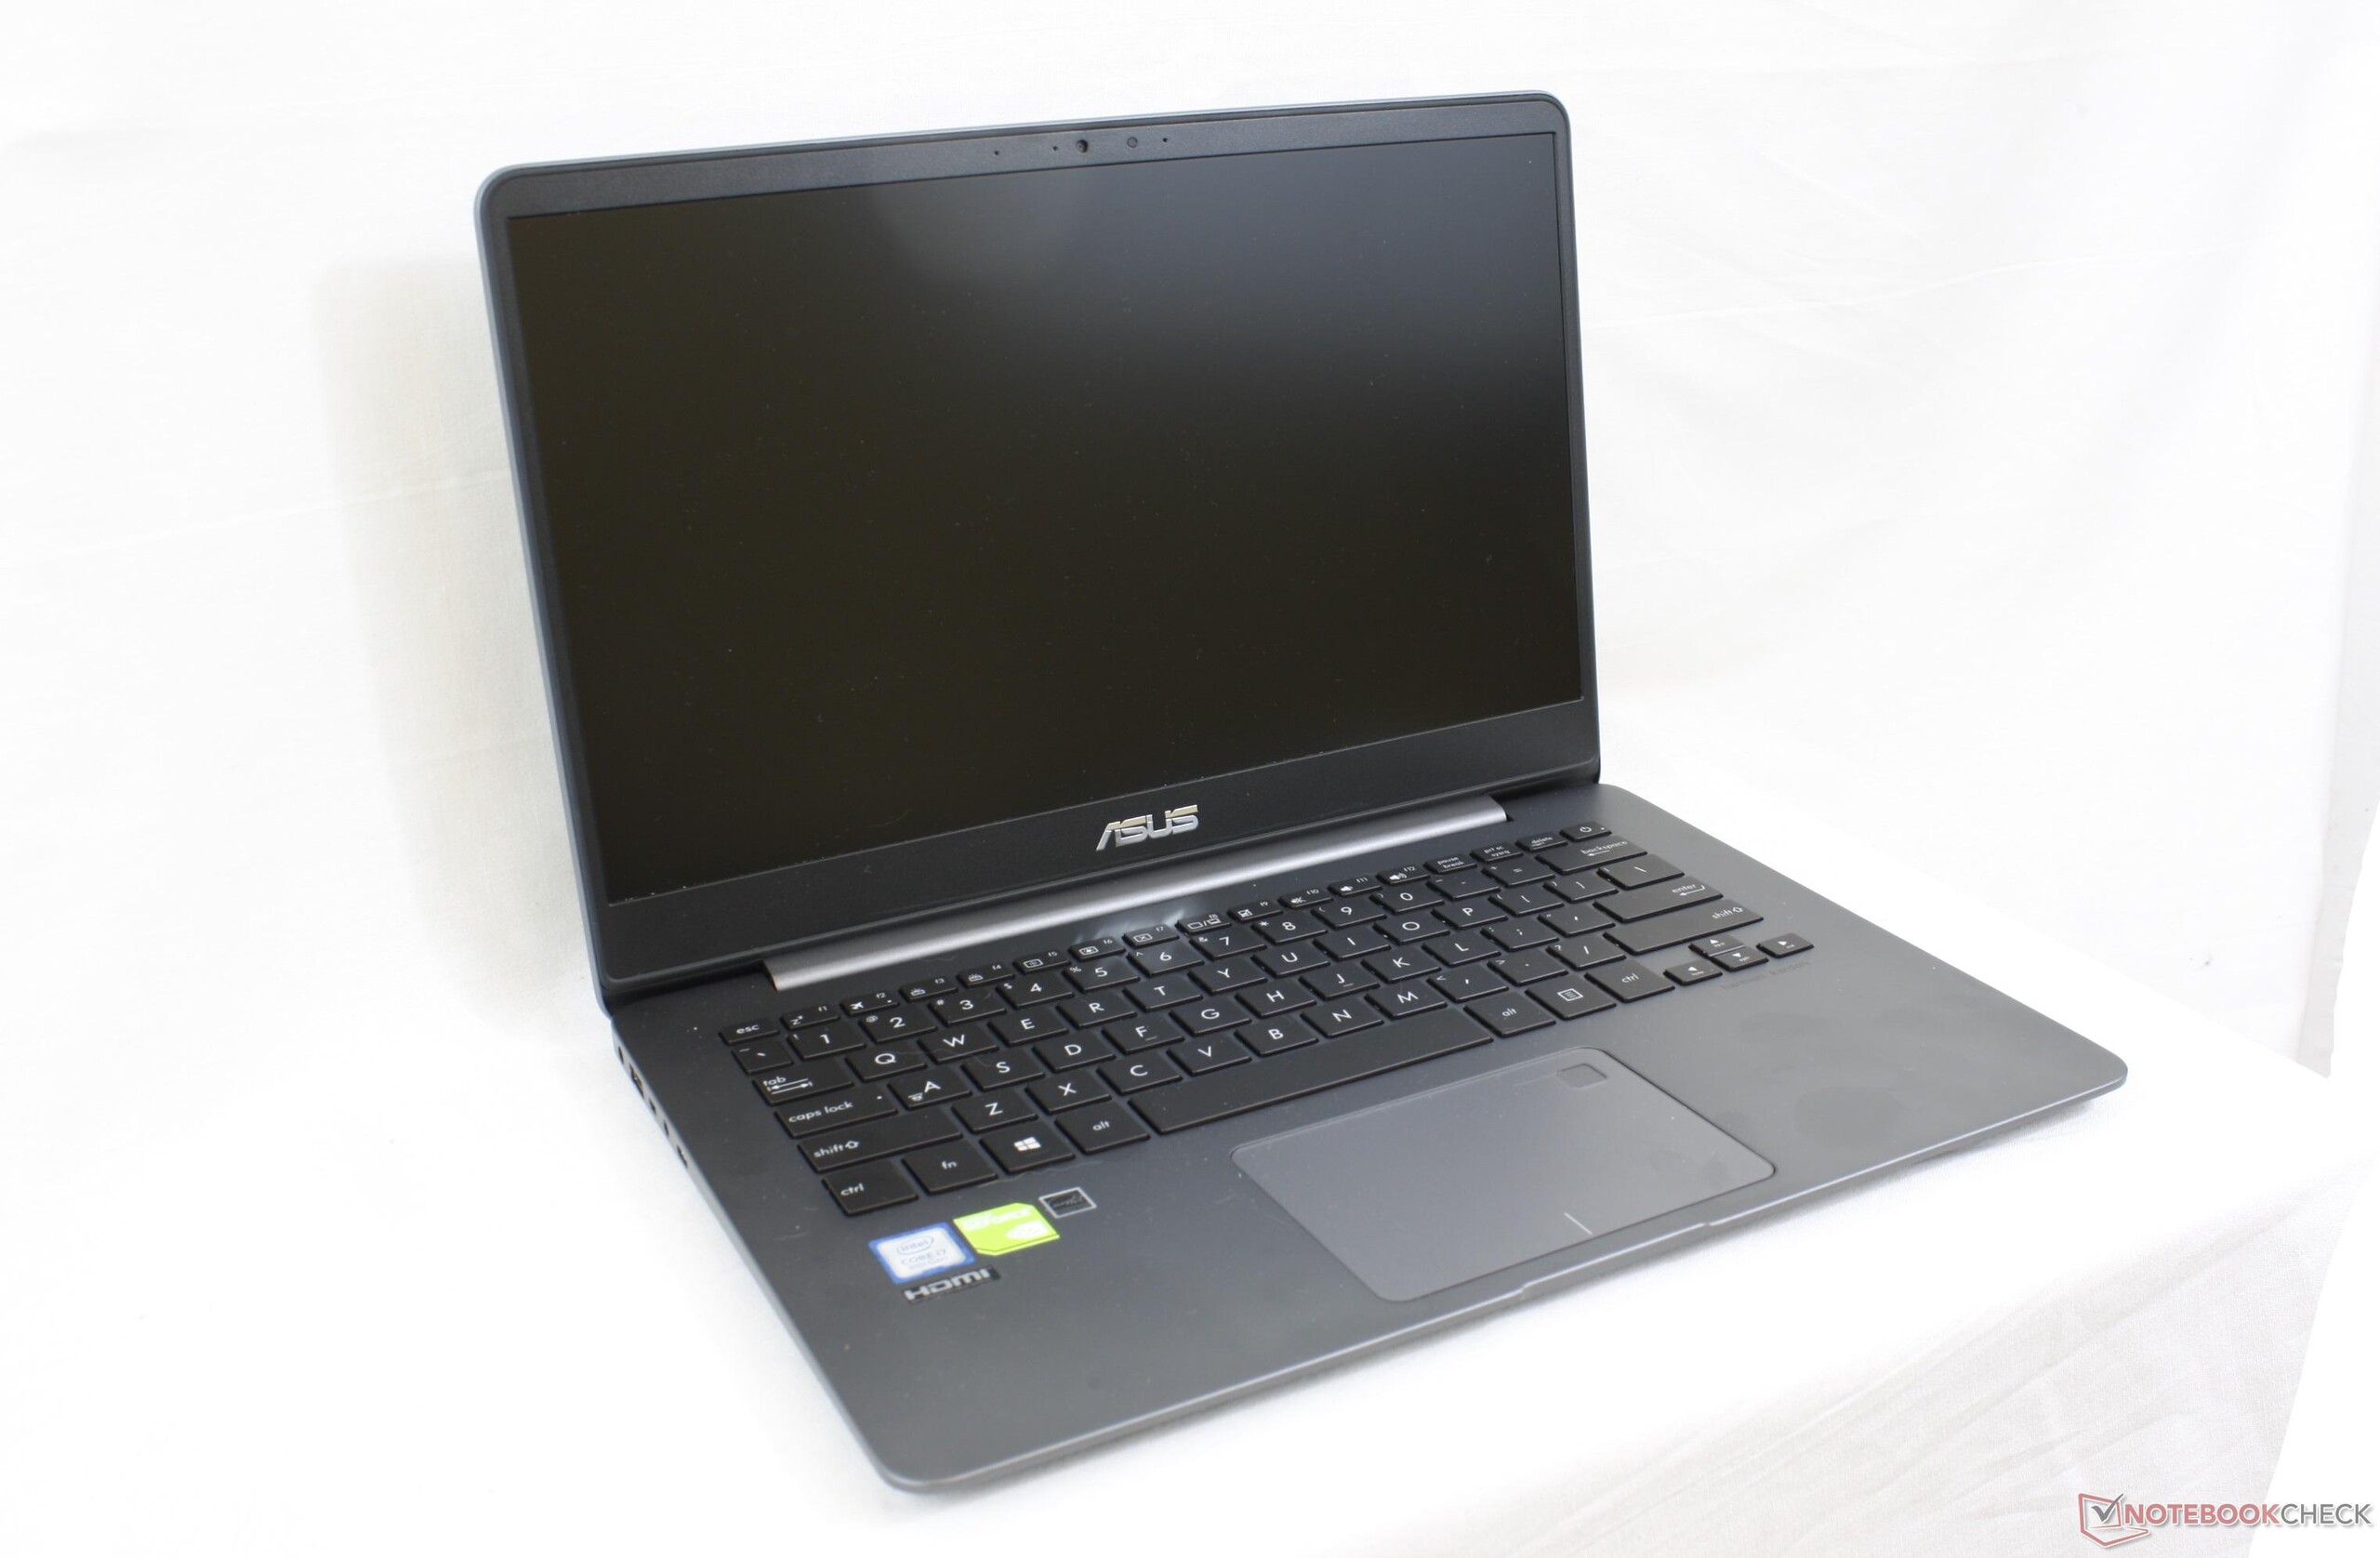
Test: Asus ZenBook UX430UN (i7-8550U, GeForce MX150) Laptop (Sammanfattning)
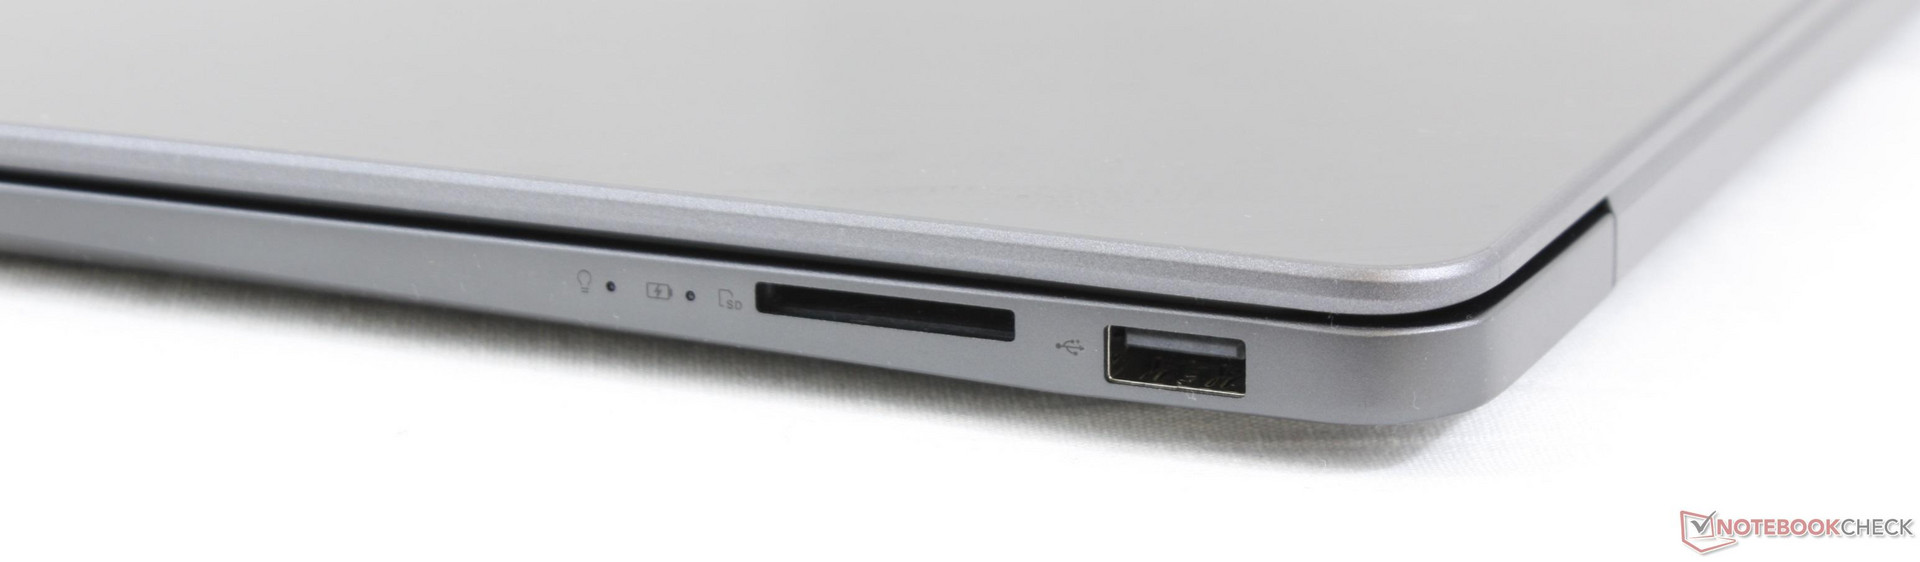
| SD Card Reader | |
| average JPG Copy Test (av. of 3 runs) | |
| Dell XPS 13 9370 i5 UHD (Toshiba Exceria Pro M501 64 GB UHS-II) | |
| Samsung Notebook 9 NP900X5T-X01US (Toshiba Exceria Pro M501 UHS-II) | |
| Asus Zenbook UX430UN (Toshiba Exceria Pro SDXC 64 GB UHS-II) | |
| maximum AS SSD Seq Read Test (1GB) | |
| Dell XPS 13 9370 i5 UHD (Toshiba Exceria Pro M501 64 GB UHS-II) | |
| Samsung Notebook 9 NP900X5T-X01US (Toshiba Exceria Pro M501 UHS-II) | |
| Asus Zenbook UX430UN (Toshiba Exceria Pro SDXC 64 GB UHS-II) | |
| Networking | |
| iperf3 transmit AX12 | |
| Dell XPS 13 9370 i5 UHD | |
| Samsung Notebook 9 NP900X5T-X01US | |
| Asus Zenbook UX430UN | |
| iperf3 receive AX12 | |
| Samsung Notebook 9 NP900X5T-X01US | |
| Asus Zenbook UX430UN | |
| Dell XPS 13 9370 i5 UHD | |
| |||||||||||||||||||||||||
Distribution av ljusstyrkan: 89 %
Mitt på batteriet: 310.4 cd/m²
Kontrast: 1001:1 (Svärta: 0.31 cd/m²)
ΔE ColorChecker Calman: 4.07 | ∀{0.5-29.43 Ø4.71}
calibrated: 4.07
ΔE Greyscale Calman: 2.8 | ∀{0.09-98 Ø4.96}
84.6% sRGB (Argyll 1.6.3 3D)
55.3% AdobeRGB 1998 (Argyll 1.6.3 3D)
62% AdobeRGB 1998 (Argyll 3D)
84.8% sRGB (Argyll 3D)
64.6% Display P3 (Argyll 3D)
Gamma: 2.217
CCT: 7033 K
| Asus Zenbook UX430UN NV140FHM-N62, BOE0718, IPS, 14", 1920x1080 | Dell XPS 13 9370 i5 UHD ID: Sharp SHP148B, Name: LQ133D1, Dell P/N: 8XDHY, IPS, 13.3", 3840x2160 | Samsung Notebook 9 NP900X5T-X01US ID: BOE06E8, Name: BOE HF NV150FHB-N31, IPS, 15", 1920x1080 | Asus Zenbook 3 Deluxe UX490UA AU Optronics AUO383D / B140HAN03.8, IPS, 14", 1920x1080 | Huawei MateBook X Chi Mei CMN8201 / P130ZDZ-EF1, , 13.3", 2160x1440 | Microsoft Surface Laptop i5 ID: MEI96A2, Name: Panasonic VVX14T092N00, IPS, 13.5", 2256x1504 | |
|---|---|---|---|---|---|---|
| Display | 12% | 8% | -3% | 8% | 9% | |
| Display P3 Coverage (%) | 64.6 | 68.9 7% | 65.2 1% | 58.7 -9% | 65.8 2% | 67.8 5% |
| sRGB Coverage (%) | 84.8 | 98.4 16% | 97.4 15% | 86.9 2% | 96.2 13% | 94.3 11% |
| AdobeRGB 1998 Coverage (%) | 62 | 69.5 12% | 66.8 8% | 59.9 -3% | 66.8 8% | 69.5 12% |
| Response Times | -30% | 9% | 37% | 32% | -6% | |
| Response Time Grey 50% / Grey 80% * (ms) | 43.6 ? | 67.2 ? -54% | 46 ? -6% | 24 ? 45% | 33 ? 24% | 50.8 ? -17% |
| Response Time Black / White * (ms) | 39.2 ? | 41.6 ? -6% | 29.6 ? 24% | 28 ? 29% | 24 ? 39% | 37.2 ? 5% |
| PWM Frequency (Hz) | 200 ? | 2500 ? | 2976 ? | |||
| Screen | 11% | -2% | 2% | 20% | 23% | |
| Brightness middle (cd/m²) | 310.4 | 496.4 60% | 558.2 80% | 337 9% | 408 31% | 384.2 24% |
| Brightness (cd/m²) | 303 | 469 55% | 528 74% | 295 -3% | 395 30% | 378 25% |
| Brightness Distribution (%) | 89 | 84 -6% | 92 3% | 81 -9% | 88 -1% | 90 1% |
| Black Level * (cd/m²) | 0.31 | 0.5 -61% | 0.46 -48% | 0.21 32% | 0.45 -45% | 0.36 -16% |
| Contrast (:1) | 1001 | 993 -1% | 1213 21% | 1605 60% | 907 -9% | 1067 7% |
| Colorchecker dE 2000 * | 4.07 | 2.9 29% | 4.41 -8% | 4.89 -20% | 1.55 62% | 1.8 56% |
| Colorchecker dE 2000 max. * | 8.33 | 5.26 37% | 10.91 -31% | 8.43 -1% | 2.19 74% | 4.2 50% |
| Colorchecker dE 2000 calibrated * | 4.07 | |||||
| Greyscale dE 2000 * | 2.8 | 3.9 -39% | 6.6 -136% | 4.28 -53% | 1.91 32% | 1.2 57% |
| Gamma | 2.217 99% | 2.066 106% | 2.19 100% | 2.25 98% | 2.34 94% | 2.21 100% |
| CCT | 7033 92% | 7169 91% | 7615 85% | 7352 88% | 6491 100% | 6708 97% |
| Color Space (Percent of AdobeRGB 1998) (%) | 55.3 | 63.9 16% | 61.3 11% | 56 1% | 61 10% | 63.7 15% |
| Color Space (Percent of sRGB) (%) | 84.6 | 98.2 16% | 97.2 15% | 87 3% | 96 13% | 94.2 11% |
| Totalt genomsnitt (program/inställningar) | -2% /
5% | 5% /
2% | 12% /
6% | 20% /
19% | 9% /
16% |
* ... mindre är bättre
Visa svarstider
| ↔ Svarstid svart till vitt | ||
|---|---|---|
| 39.2 ms ... stiga ↗ och falla ↘ kombinerat | ↗ 22.8 ms stiga | 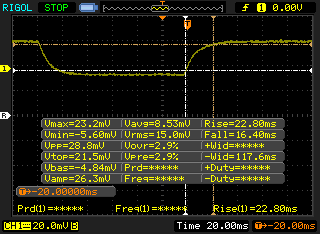 |
| ↘ 16.4 ms hösten | ||
| Skärmen visar långsamma svarsfrekvenser i våra tester och kommer att vara otillfredsställande för spelare. I jämförelse sträcker sig alla testade enheter från 0.1 (minst) till 240 (maximalt) ms. » 97 % av alla enheter är bättre. Detta innebär att den uppmätta svarstiden är sämre än genomsnittet av alla testade enheter (19.8 ms). | ||
| ↔ Svarstid 50 % grått till 80 % grått | ||
| 43.6 ms ... stiga ↗ och falla ↘ kombinerat | ↗ 24.4 ms stiga | 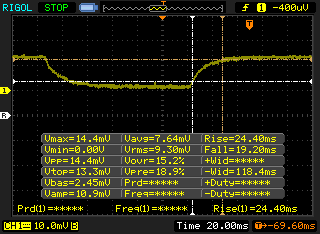 |
| ↘ 19.2 ms hösten | ||
| Skärmen visar långsamma svarsfrekvenser i våra tester och kommer att vara otillfredsställande för spelare. I jämförelse sträcker sig alla testade enheter från 0.165 (minst) till 636 (maximalt) ms. » 73 % av alla enheter är bättre. Detta innebär att den uppmätta svarstiden är sämre än genomsnittet av alla testade enheter (31 ms). | ||
Skärmflimmer / PWM (Puls-Width Modulation)
| Skärmflimmer / PWM upptäckt | 200 Hz | ≤ 99 % ljusstyrka inställning | 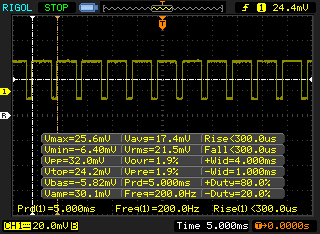 |
Displayens bakgrundsbelysning flimrar vid 200 Hz (i värsta fall, t.ex. med PWM) Flimrande upptäckt vid en ljusstyrkeinställning på 99 % och lägre. Det ska inte finnas något flimmer eller PWM över denna ljusstyrkeinställning. Frekvensen för 200 Hz är relativt låg, så känsliga användare kommer sannolikt att märka flimmer och uppleva ansträngda ögon vid den angivna ljusstyrkeinställningen och nedan. Som jämförelse: 52 % av alla testade enheter använder inte PWM för att dämpa skärmen. Om PWM upptäcktes mättes ett medelvärde av 7754 (minst: 5 - maximum: 343500) Hz. | |||
| Cinebench R15 | |
| CPU Single 64Bit | |
| Eurocom Tornado F5 Killer Edition | |
| Asus Zenbook UX430UN | |
| Genomsnitt Intel Core i7-8550U (108 - 172, n=76) | |
| Samsung Notebook 9 NP900X5T-X01US | |
| Lenovo ThinkPad T480s-20L8S02D00 | |
| Asus Strix GL703VM-DB74 | |
| Asus ZenBook UX530UX-FY070T | |
| Alienware 13 R3 (i5-7300HQ, GTX 1050 Ti) | |
| Lenovo Ideapad 720S-13ARR | |
| Asus Zenbook UX310UQ-GL011T | |
| Lenovo IdeaPad 320s-14IKB | |
| Asus ASUSPRO Essential P2520LA-XO0167H | |
| CPU Multi 64Bit | |
| Lenovo ThinkPad T480s-20L8S02D00 | |
| Lenovo ThinkPad T480s-20L8S02D00 | |
| Asus Strix GL703VM-DB74 | |
| Eurocom Tornado F5 Killer Edition | |
| Asus Zenbook UX430UN | |
| Genomsnitt Intel Core i7-8550U (301 - 761, n=78) | |
| Samsung Notebook 9 NP900X5T-X01US | |
| Lenovo Ideapad 720S-13ARR | |
| Alienware 13 R3 (i5-7300HQ, GTX 1050 Ti) | |
| Lenovo IdeaPad 320s-14IKB | |
| Asus Zenbook UX310UQ-GL011T | |
| Asus ZenBook UX530UX-FY070T | |
| Asus ASUSPRO Essential P2520LA-XO0167H | |
| Cinebench R11.5 | |
| CPU Single 64Bit | |
| Eurocom Tornado F5 Killer Edition | |
| Samsung Notebook 9 NP900X5T-X01US | |
| Genomsnitt Intel Core i7-8550U (1.43 - 1.95, n=32) | |
| Asus Zenbook UX430UN | |
| Asus Strix GL703VM-DB74 | |
| Asus Zenbook UX310UQ-GL011T | |
| Asus ASUSPRO Essential P2520LA-XO0167H | |
| CPU Multi 64Bit | |
| Eurocom Tornado F5 Killer Edition | |
| Asus Strix GL703VM-DB74 | |
| Asus Zenbook UX430UN | |
| Genomsnitt Intel Core i7-8550U (4.38 - 8.56, n=32) | |
| Samsung Notebook 9 NP900X5T-X01US | |
| Asus Zenbook UX310UQ-GL011T | |
| Asus ASUSPRO Essential P2520LA-XO0167H | |
| Cinebench R10 | |
| Rendering Multiple CPUs 32Bit | |
| Eurocom Tornado F5 Killer Edition | |
| Asus Strix GL703VM-DB74 | |
| Asus Zenbook UX430UN | |
| Genomsnitt Intel Core i7-8550U (11694 - 24180, n=31) | |
| Samsung Notebook 9 NP900X5T-X01US | |
| Lenovo IdeaPad 320s-14IKB | |
| Asus Zenbook UX310UQ-GL011T | |
| Asus ASUSPRO Essential P2520LA-XO0167H | |
| Rendering Single 32Bit | |
| Eurocom Tornado F5 Killer Edition | |
| Asus Zenbook UX430UN | |
| Samsung Notebook 9 NP900X5T-X01US | |
| Genomsnitt Intel Core i7-8550U (4202 - 8211, n=31) | |
| Asus Strix GL703VM-DB74 | |
| Lenovo IdeaPad 320s-14IKB | |
| Asus Zenbook UX310UQ-GL011T | |
| Asus ASUSPRO Essential P2520LA-XO0167H | |
| wPrime 2.10 - 1024m | |
| Genomsnitt Intel Core i7-8550U (258 - 435, n=11) | |
| Samsung Notebook 9 NP900X5T-X01US | |
| Asus Zenbook UX430UN | |
| Eurocom Tornado F5 Killer Edition | |
| Asus Strix GL703VM-DB74 | |
* ... mindre är bättre
| PCMark 8 | |
| Home Score Accelerated v2 | |
| Samsung Notebook 9 NP900X5T-X01US | |
| Asus Zenbook UX430UN | |
| Genomsnitt Intel Core i7-8550U, NVIDIA GeForce MX150 (3145 - 4130, n=21) | |
| Asus Zenbook 3 Deluxe UX490UA | |
| Dell XPS 13 9370 i5 UHD | |
| Work Score Accelerated v2 | |
| Samsung Notebook 9 NP900X5T-X01US | |
| Genomsnitt Intel Core i7-8550U, NVIDIA GeForce MX150 (4063 - 5228, n=20) | |
| Asus Zenbook UX430UN | |
| Asus Zenbook 3 Deluxe UX490UA | |
| Dell XPS 13 9370 i5 UHD | |
| Creative Score Accelerated v2 | |
| Samsung Notebook 9 NP900X5T-X01US | |
| Asus Zenbook UX430UN | |
| Genomsnitt Intel Core i7-8550U, NVIDIA GeForce MX150 (4643 - 5550, n=9) | |
| Dell XPS 13 9370 i5 UHD | |
| PCMark 10 - Score | |
| Samsung Notebook 9 NP900X5T-X01US | |
| Asus Zenbook UX430UN | |
| Dell XPS 13 9370 i5 UHD | |
| Genomsnitt Intel Core i7-8550U, NVIDIA GeForce MX150 (3056 - 4106, n=19) | |
| Asus Zenbook 3 Deluxe UX490UA | |
| PCMark 8 Home Score Accelerated v2 | 3792 poäng | |
| PCMark 8 Creative Score Accelerated v2 | 5153 poäng | |
| PCMark 8 Work Score Accelerated v2 | 4732 poäng | |
| PCMark 10 Score | 3858 poäng | |
Hjälp | ||
| Asus Zenbook UX430UN SanDisk SD8SN8U512G1002 | Dell XPS 13 9370 i5 UHD Toshiba XG5 KXG50ZNV256G | Samsung Notebook 9 NP900X5T-X01US Samsung PM961 MZVLW256HEHP | Asus Zenbook 3 Deluxe UX490UA Micron 1100 MTFDDAV256TBN | Asus ZenBook 13 UX331UN SK Hynix HFS256G39TND-N210A | Microsoft Surface Laptop i5 Toshiba THNSN0128GTYA | |
|---|---|---|---|---|---|---|
| AS SSD | 131% | 184% | 15% | -16% | -74% | |
| Copy Game MB/s (MB/s) | 225.1 | 291.4 29% | 1058 370% | 154.1 -32% | 80.5 -64% | |
| Copy Program MB/s (MB/s) | 270.5 | 207 -23% | 479.5 77% | 129.7 -52% | 62.7 -77% | |
| Copy ISO MB/s (MB/s) | 467.6 | 357.4 -24% | 1751 274% | 192.4 -59% | 87.1 -81% | |
| Score Total (Points) | 926 | 2437 163% | 2646 186% | 855 -8% | 991 7% | 309 -67% |
| Score Write (Points) | 261 | 1135 335% | 628 141% | 382 46% | 323 24% | 86 -67% |
| Score Read (Points) | 441 | 894 103% | 1367 210% | 308 -30% | 445 1% | 157 -64% |
| Access Time Write * (ms) | 0.088 | 0.038 57% | 0.032 64% | 0.056 36% | 0.23 -161% | 0.369 -319% |
| Access Time Read * (ms) | 0.089 | 0.063 29% | 0.054 39% | 0.09 -1% | 0.09 -1% | 0.128 -44% |
| 4K-64 Write (MB/s) | 183.5 | 937 411% | 392.6 114% | 257.5 40% | 233.1 27% | 35.48 -81% |
| 4K-64 Read (MB/s) | 366 | 657 80% | 1085 196% | 234.5 -36% | 368.4 1% | 80.4 -78% |
| 4K Write (MB/s) | 47.88 | 107.2 124% | 115 140% | 77.2 61% | 68.9 44% | 39.07 -18% |
| 4K Read (MB/s) | 25.39 | 33.81 33% | 48.71 92% | 24.89 -2% | 27.98 10% | 20.15 -21% |
| Seq Write (MB/s) | 300.3 | 907 202% | 1206 302% | 470 57% | 213.7 -29% | 117.2 -61% |
| Seq Read (MB/s) | 494.4 | 2037 312% | 2337 373% | 487.2 -1% | 483.7 -2% | 561 13% |
* ... mindre är bättre

| 3DMark | |
| 1280x720 Cloud Gate Standard Graphics | |
| Genomsnitt av klass Multimedia (16765 - 143501, n=32, senaste 2 åren) | |
| Dell Inspiron 15 7000 7577 | |
| Asus Zenbook UX510UW-CN044T | |
| Acer Aspire E5-575G-549D | |
| MSI PL62 MX150 7700HQ | |
| Genomsnitt NVIDIA GeForce MX150 (16227 - 22183, n=43) | |
| Asus Zenbook UX430UN | |
| Apple MacBook Pro 13 2017 | |
| Microsoft Surface Pro (2017) i7 | |
| Asus VivoBook S410UQ-NH74 | |
| Dell Latitude 5590 | |
| Lenovo Ideapad 720S-13ARR | |
| 1920x1080 Fire Strike Graphics | |
| Genomsnitt av klass Multimedia (2328 - 48907, n=58, senaste 2 åren) | |
| Dell Inspiron 15 7000 7577 | |
| Asus Zenbook UX510UW-CN044T | |
| MSI PL62 MX150 7700HQ | |
| Acer Aspire E5-575G-549D | |
| Genomsnitt NVIDIA GeForce MX150 (2323 - 3739, n=44) | |
| Asus Zenbook UX430UN | |
| Asus VivoBook S410UQ-NH74 | |
| Apple MacBook Pro 13 2017 | |
| Microsoft Surface Pro (2017) i7 | |
| Lenovo Ideapad 720S-13ARR | |
| Dell Latitude 5590 | |
| 3DMark 11 | |
| 1280x720 Performance GPU | |
| Genomsnitt av klass Multimedia (3749 - 60002, n=55, senaste 2 åren) | |
| Dell Inspiron 15 7000 7577 | |
| Asus Zenbook UX510UW-CN044T | |
| MSI PL62 MX150 7700HQ | |
| Acer Aspire E5-575G-549D | |
| Genomsnitt NVIDIA GeForce MX150 (2796 - 4905, n=47) | |
| Asus Zenbook UX430UN | |
| Asus VivoBook S410UQ-NH74 | |
| Microsoft Surface Pro (2017) i7 | |
| Apple MacBook Pro 13 2017 | |
| Lenovo Ideapad 720S-13ARR | |
| Dell Latitude 5590 | |
| 1280x720 Performance Combined | |
| Genomsnitt av klass Multimedia (2326 - 26308, n=55, senaste 2 åren) | |
| Dell Inspiron 15 7000 7577 | |
| Asus Zenbook UX510UW-CN044T | |
| MSI PL62 MX150 7700HQ | |
| Acer Aspire E5-575G-549D | |
| Genomsnitt NVIDIA GeForce MX150 (2820 - 4421, n=46) | |
| Asus Zenbook UX430UN | |
| Asus VivoBook S410UQ-NH74 | |
| Apple MacBook Pro 13 2017 | |
| Microsoft Surface Pro (2017) i7 | |
| Dell Latitude 5590 | |
| Lenovo Ideapad 720S-13ARR | |
| 3DMark 11 Performance | 4160 poäng | |
| 3DMark Ice Storm Standard Score | 44383 poäng | |
| 3DMark Cloud Gate Standard Score | 12367 poäng | |
| 3DMark Fire Strike Score | 2874 poäng | |
| 3DMark Fire Strike Extreme Score | 1437 poäng | |
Hjälp | ||
| låg | med. | hög | ultra | |
|---|---|---|---|---|
| BioShock Infinite (2013) | 141.4 | 77.2 | 66.9 | 28.9 |
| Metro: Last Light (2013) | 85.7 | 61.4 | 36.4 | 21.6 |
| Thief (2014) | 61 | 35.8 | 30.2 | 16.7 |
| The Witcher 3 (2015) | 32 | |||
| Batman: Arkham Knight (2015) | 41 | 36 | 16 | |
| Metal Gear Solid V (2015) | 60 | 60 | 34 | 24 |
| Fallout 4 (2015) | 51 | 35.7 | 19.2 | 14.9 |
| Rise of the Tomb Raider (2016) | 44.9 | 31.7 | 16.4 | 14.8 |
| Ashes of the Singularity (2016) | 25.7 | 15 | 12.8 | |
| Overwatch (2016) | 121.2 | 75.4 | 38.2 | 32.4 |
| Final Fantasy XV Benchmark (2018) | 25.4 | 12.6 | 7 |
Ljudnivå
| Låg belastning |
| 28.9 / 30 / 30.2 dB(A) |
| Hög belastning |
| 41.8 / 42 dB(A) |
 | ||
30 dB tyst 40 dB(A) hörbar 50 dB(A) högt ljud |
||
min: | ||
| Asus Zenbook UX430UN GeForce MX150, i5-8550U, SanDisk SD8SN8U512G1002 | Dell XPS 13 9370 i5 UHD UHD Graphics 620, i5-8250U, Toshiba XG5 KXG50ZNV256G | Samsung Notebook 9 NP900X5T-X01US GeForce MX150, i5-8550U, Samsung PM961 MZVLW256HEHP | Asus Zenbook 3 Deluxe UX490UA HD Graphics 620, i5-7200U, Micron 1100 MTFDDAV256TBN | Lenovo Yoga 920-13IKB-80Y7 UHD Graphics 620, i5-8550U, Samsung PM961 MZVLW256HEHP | Apple MacBook Pro 15 2017 (2.9 GHz, 560) Radeon Pro 560, i7-7820HQ | |
|---|---|---|---|---|---|---|
| Noise | 6% | 1% | 3% | 7% | 1% | |
| av / miljö * (dB) | 28.3 | 29 -2% | 29.6 -5% | 30.2 -7% | 28 1% | 30.8 -9% |
| Idle Minimum * (dB) | 28.9 | 29 -0% | 29.6 -2% | 30.2 -4% | 28 3% | 31 -7% |
| Idle Average * (dB) | 30 | 29 3% | 29.6 1% | 30.2 -1% | 28.8 4% | 31 -3% |
| Idle Maximum * (dB) | 30.2 | 29 4% | 30.3 -0% | 31.2 -3% | 30.3 -0% | 31 -3% |
| Load Average * (dB) | 41.8 | 32 23% | 40 4% | 35.7 15% | 34.5 17% | 31.3 25% |
| Witcher 3 ultra * (dB) | 42 | 40 5% | ||||
| Load Maximum * (dB) | 42 | 40.1 5% | 40 5% | 34.2 19% | 34.3 18% | 41.8 -0% |
* ... mindre är bättre
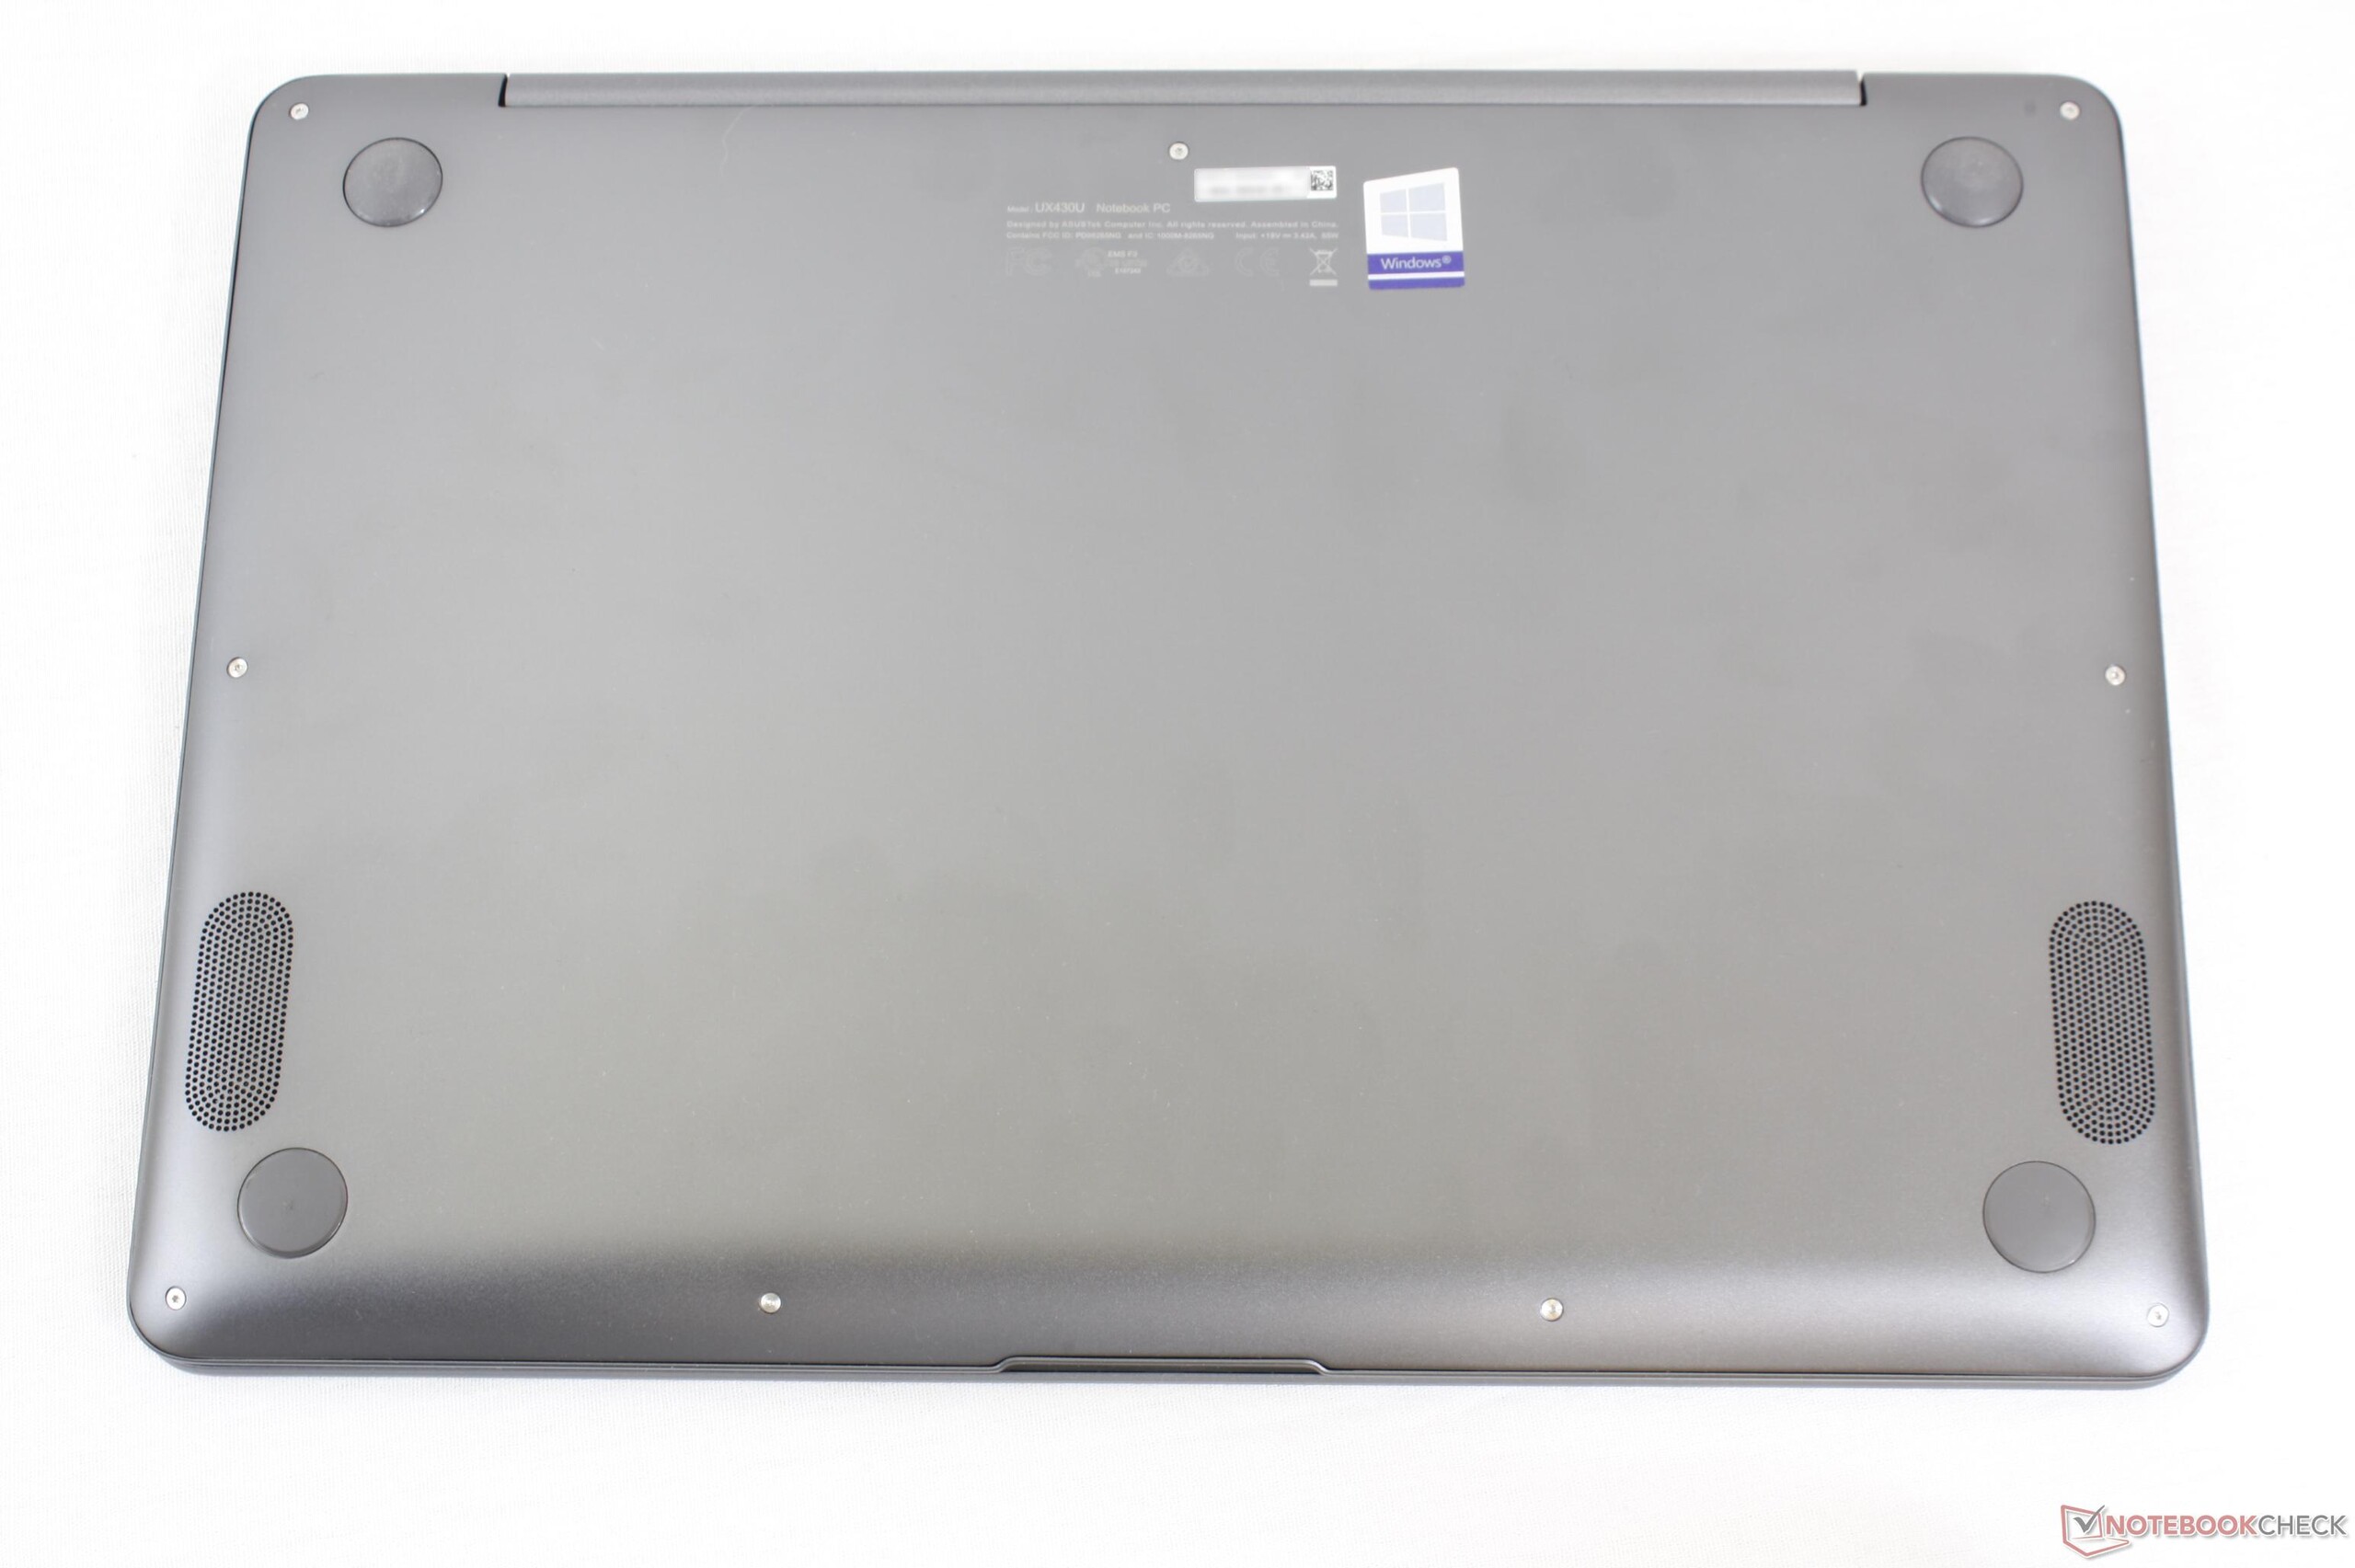
(±) Den maximala temperaturen på ovansidan är 43.6 °C / 110 F, jämfört med genomsnittet av 36.8 °C / 98 F , allt från 21 till 71 °C för klassen Multimedia.
(±) Botten värms upp till maximalt 44 °C / 111 F, jämfört med genomsnittet av 39.1 °C / 102 F
(+) Vid tomgångsbruk är medeltemperaturen för ovansidan 21.5 °C / 71 F, jämfört med enhetsgenomsnittet på 31.3 °C / ### class_avg_f### F.
(+) När du spelar The Witcher 3 är medeltemperaturen för ovansidan 31.1 °C / 88 F, jämfört med enhetsgenomsnittet på 31.3 °C / ## #class_avg_f### F.
(+) Handledsstöden och pekplattan är kallare än hudtemperaturen med maximalt 30.6 °C / 87.1 F och är därför svala att ta på.
(±) Medeltemperaturen för handledsstödsområdet på liknande enheter var 28.7 °C / 83.7 F (-1.9 °C / -3.4 F).
Asus Zenbook UX430UN ljudanalys
(-) | inte särskilt höga högtalare (64.5 dB)
Bas 100 - 315 Hz
(-) | nästan ingen bas - i genomsnitt 21.3% lägre än medianen
(±) | linjäriteten för basen är genomsnittlig (12.6% delta till föregående frekvens)
Mellan 400 - 2000 Hz
(+) | balanserad mellan - endast 3.4% från medianen
(+) | mids är linjära (4.2% delta till föregående frekvens)
Högsta 2 - 16 kHz
(+) | balanserade toppar - endast 3.3% från medianen
(±) | linjäriteten för toppar är genomsnittlig (9.3% delta till föregående frekvens)
Totalt 100 - 16 000 Hz
(±) | linjäriteten för det totala ljudet är genomsnittlig (25.1% skillnad mot median)
Jämfört med samma klass
» 89% av alla testade enheter i den här klassen var bättre, 3% liknande, 8% sämre
» Den bästa hade ett delta på 5%, genomsnittet var 17%, sämst var 45%
Jämfört med alla testade enheter
» 77% av alla testade enheter var bättre, 5% liknande, 18% sämre
» Den bästa hade ett delta på 4%, genomsnittet var 23%, sämst var 134%
Apple MacBook 12 (Early 2016) 1.1 GHz ljudanalys
(+) | högtalare kan spela relativt högt (83.6 dB)
Bas 100 - 315 Hz
(±) | reducerad bas - i genomsnitt 11.3% lägre än medianen
(±) | linjäriteten för basen är genomsnittlig (14.2% delta till föregående frekvens)
Mellan 400 - 2000 Hz
(+) | balanserad mellan - endast 2.4% från medianen
(+) | mids är linjära (5.5% delta till föregående frekvens)
Högsta 2 - 16 kHz
(+) | balanserade toppar - endast 2% från medianen
(+) | toppar är linjära (4.5% delta till föregående frekvens)
Totalt 100 - 16 000 Hz
(+) | det totala ljudet är linjärt (10.2% skillnad mot median)
Jämfört med samma klass
» 7% av alla testade enheter i den här klassen var bättre, 2% liknande, 90% sämre
» Den bästa hade ett delta på 5%, genomsnittet var 18%, sämst var 53%
Jämfört med alla testade enheter
» 5% av alla testade enheter var bättre, 1% liknande, 94% sämre
» Den bästa hade ett delta på 4%, genomsnittet var 23%, sämst var 134%
| Av/Standby | |
| Låg belastning | |
| Hög belastning |
|
Förklaring:
min: | |
| Asus Zenbook UX430UN i5-8550U, GeForce MX150, SanDisk SD8SN8U512G1002, IPS, 1920x1080, 14" | Dell XPS 13 9370 i5 UHD i5-8250U, UHD Graphics 620, Toshiba XG5 KXG50ZNV256G, IPS, 3840x2160, 13.3" | Samsung Notebook 9 NP900X5T-X01US i5-8550U, GeForce MX150, Samsung PM961 MZVLW256HEHP, IPS, 1920x1080, 15" | Asus Zenbook 3 Deluxe UX490UA i5-7200U, HD Graphics 620, Micron 1100 MTFDDAV256TBN, IPS, 1920x1080, 14" | Huawei MateBook X i5-7200U, HD Graphics 620, LITEON CB1-SD256, , 2160x1440, 13.3" | Microsoft Surface Laptop i5 i5-7200U, HD Graphics 620, Toshiba THNSN0128GTYA, IPS, 2256x1504, 13.5" | Asus ZenBook 13 UX331UN i5-8550U, GeForce MX150, SK Hynix HFS256G39TND-N210A, IPS, 1920x1080, 13.3" | |
|---|---|---|---|---|---|---|---|
| Power Consumption | -17% | -42% | 8% | -34% | 11% | 13% | |
| Idle Minimum * (Watt) | 3 | 4.3 -43% | 3.5 -17% | 3.3 -10% | 4.6 -53% | 3.2 -7% | 2.2 27% |
| Idle Average * (Watt) | 5.8 | 8 -38% | 11.3 -95% | 6.1 -5% | 11 -90% | 6.5 -12% | 5 14% |
| Idle Maximum * (Watt) | 6.2 | 8.1 -31% | 14.2 -129% | 10.1 -63% | 12 -94% | 6.8 -10% | 8 -29% |
| Load Average * (Watt) | 54.1 | 46.6 14% | 53.3 1% | 24.6 55% | 39.5 27% | 28.2 48% | 33 39% |
| Witcher 3 ultra * (Watt) | 45.9 | 50.6 -10% | |||||
| Load Maximum * (Watt) | 56.4 | 49.8 12% | 56.2 -0% | 22 61% | 34.6 39% | 36 36% | 49.4 12% |
* ... mindre är bättre
| Asus Zenbook UX430UN i5-8550U, GeForce MX150, 50 Wh | Dell XPS 13 9370 i5 UHD i5-8250U, UHD Graphics 620, 52 Wh | Samsung Notebook 9 NP900X5T-X01US i5-8550U, GeForce MX150, 75 Wh | Asus Zenbook 3 Deluxe UX490UA i5-7200U, HD Graphics 620, 46 Wh | Huawei MateBook X i5-7200U, HD Graphics 620, 40 Wh | Microsoft Surface Laptop i5 i5-7200U, HD Graphics 620, 45 Wh | |
|---|---|---|---|---|---|---|
| Batteridrifttid | -10% | 40% | 21% | -7% | 23% | |
| Reader / Idle (h) | 17.3 | 14.5 -16% | 30.2 75% | 17.2 -1% | 8.5 -51% | 22.5 30% |
| WiFi v1.3 (h) | 9.3 | 6.8 -27% | 10.6 14% | 9.4 1% | 5.6 -40% | 10 8% |
| Load (h) | 1.6 | 1.8 13% | 2.1 31% | 2.6 63% | 2.7 69% | 2.1 31% |
För
Emot
Läs den fullständiga versionen av den här recensionen på engelska här.
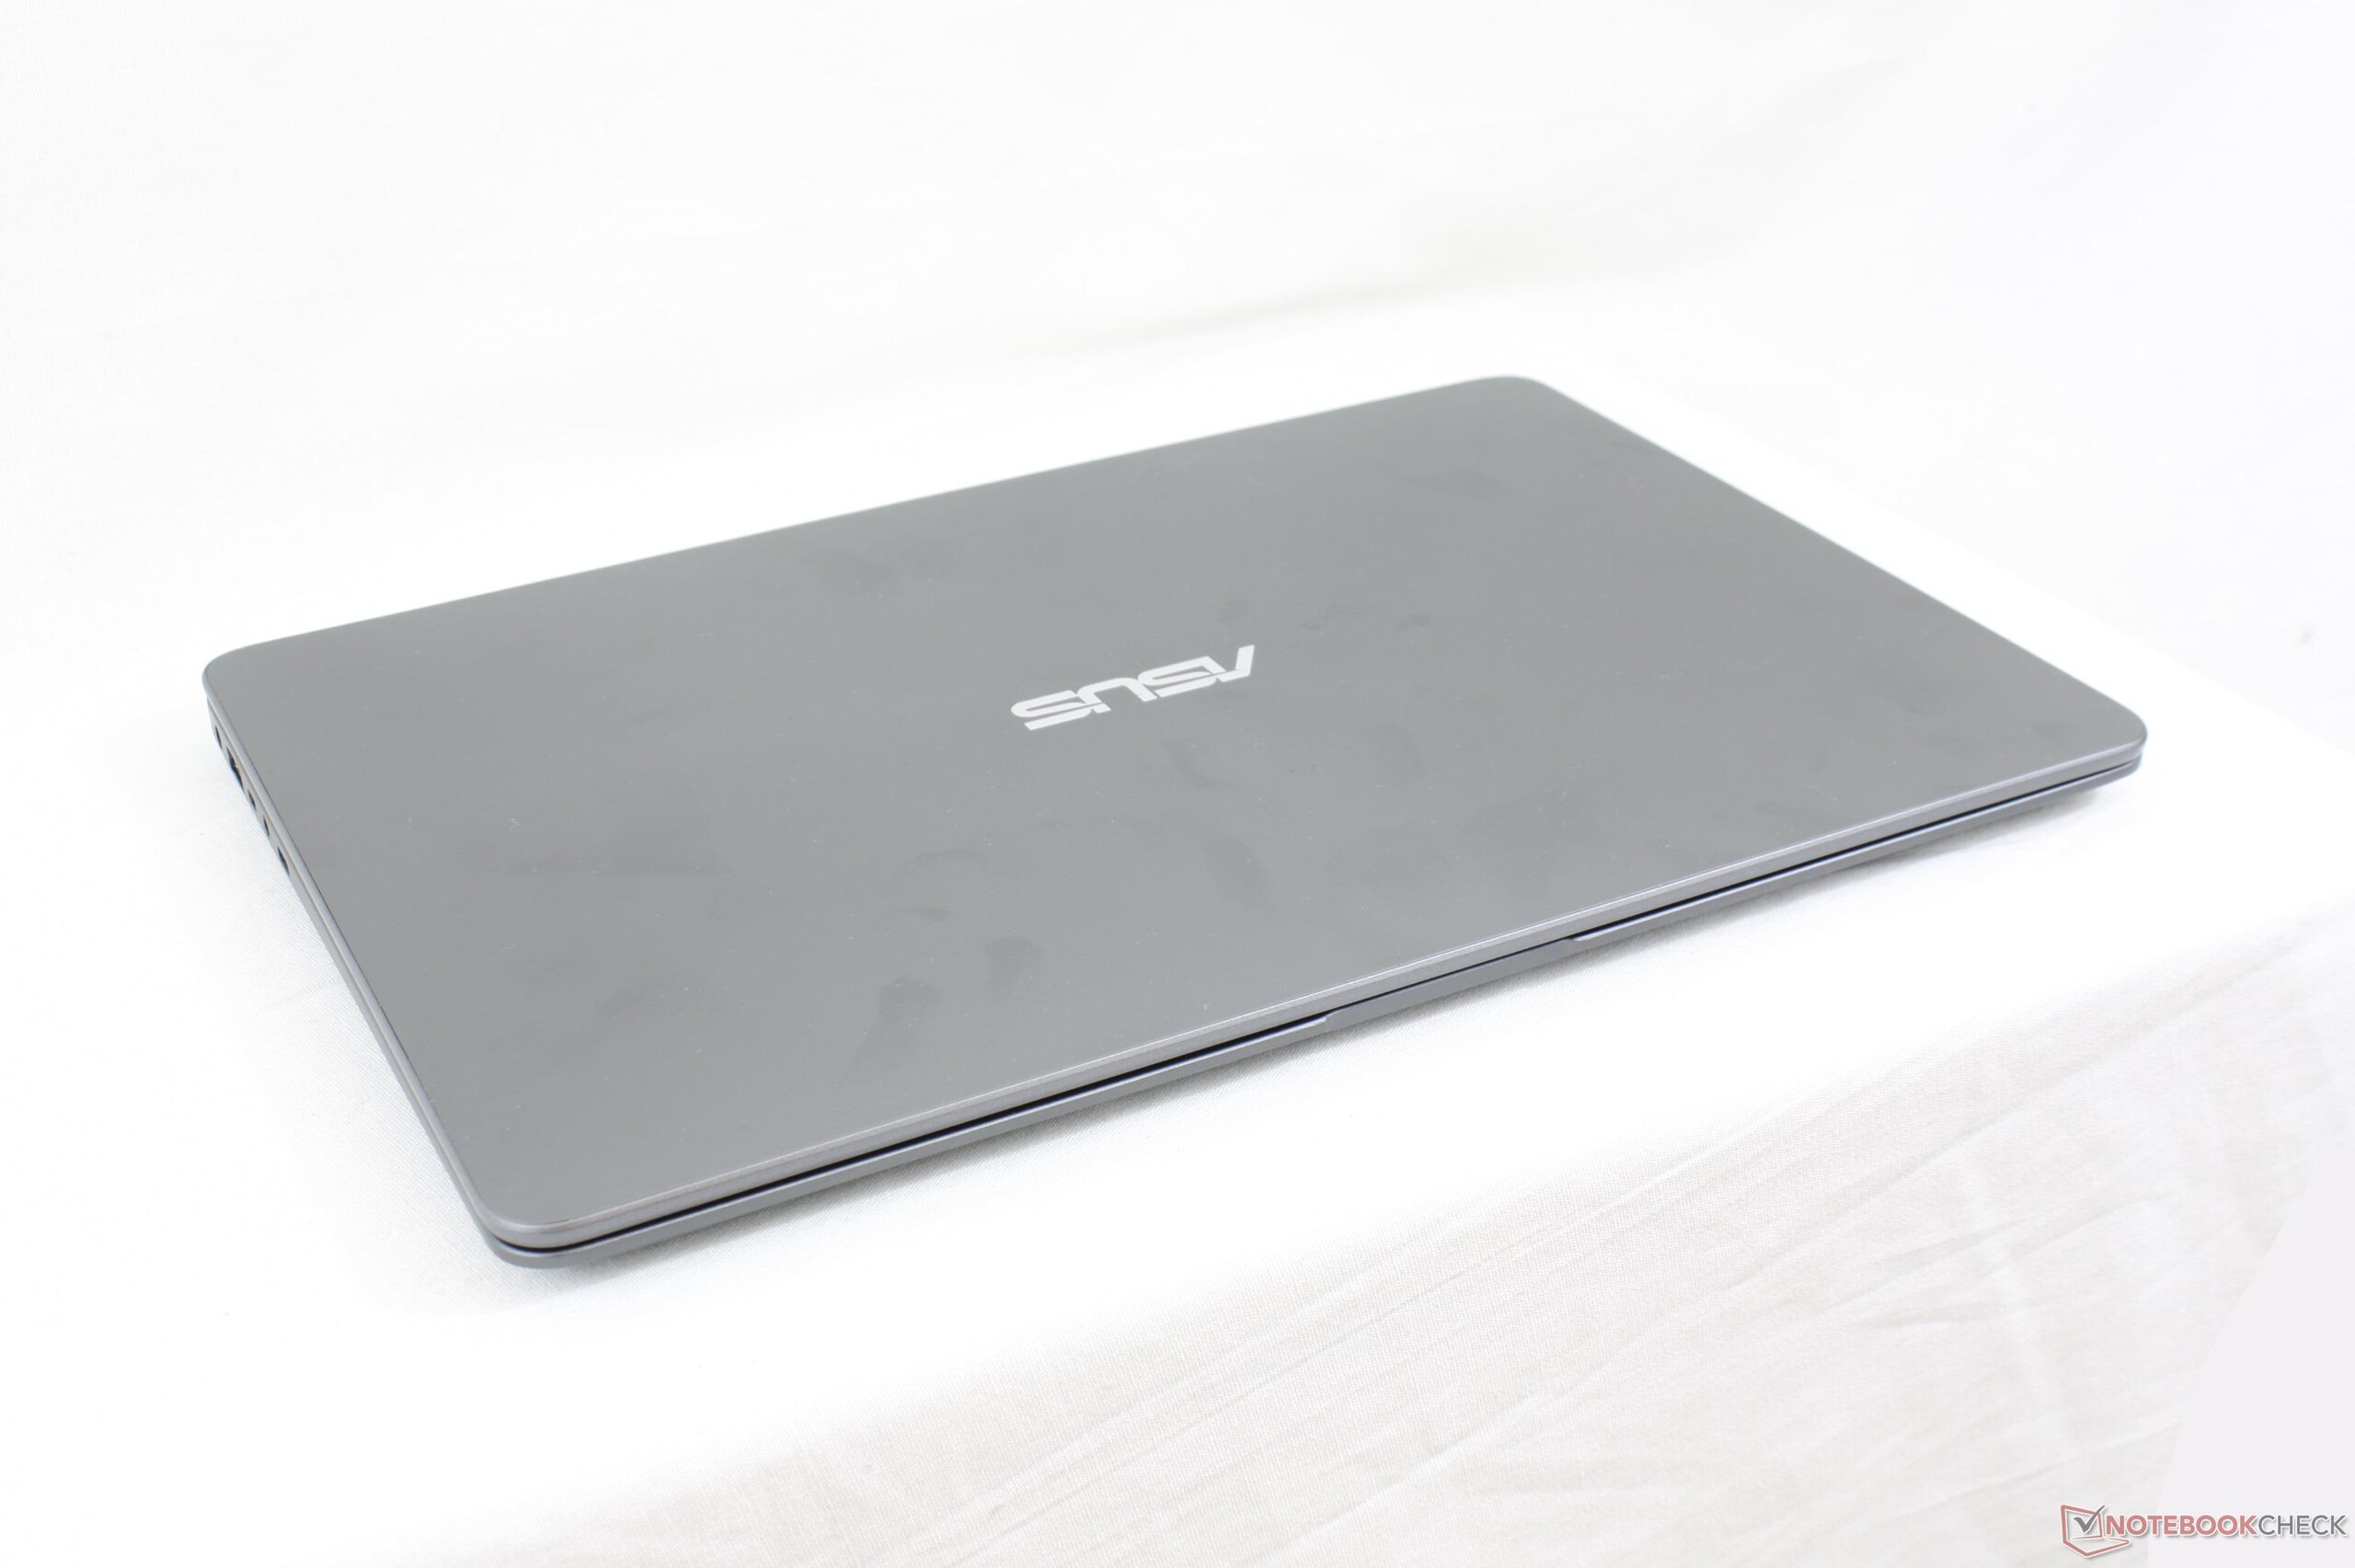
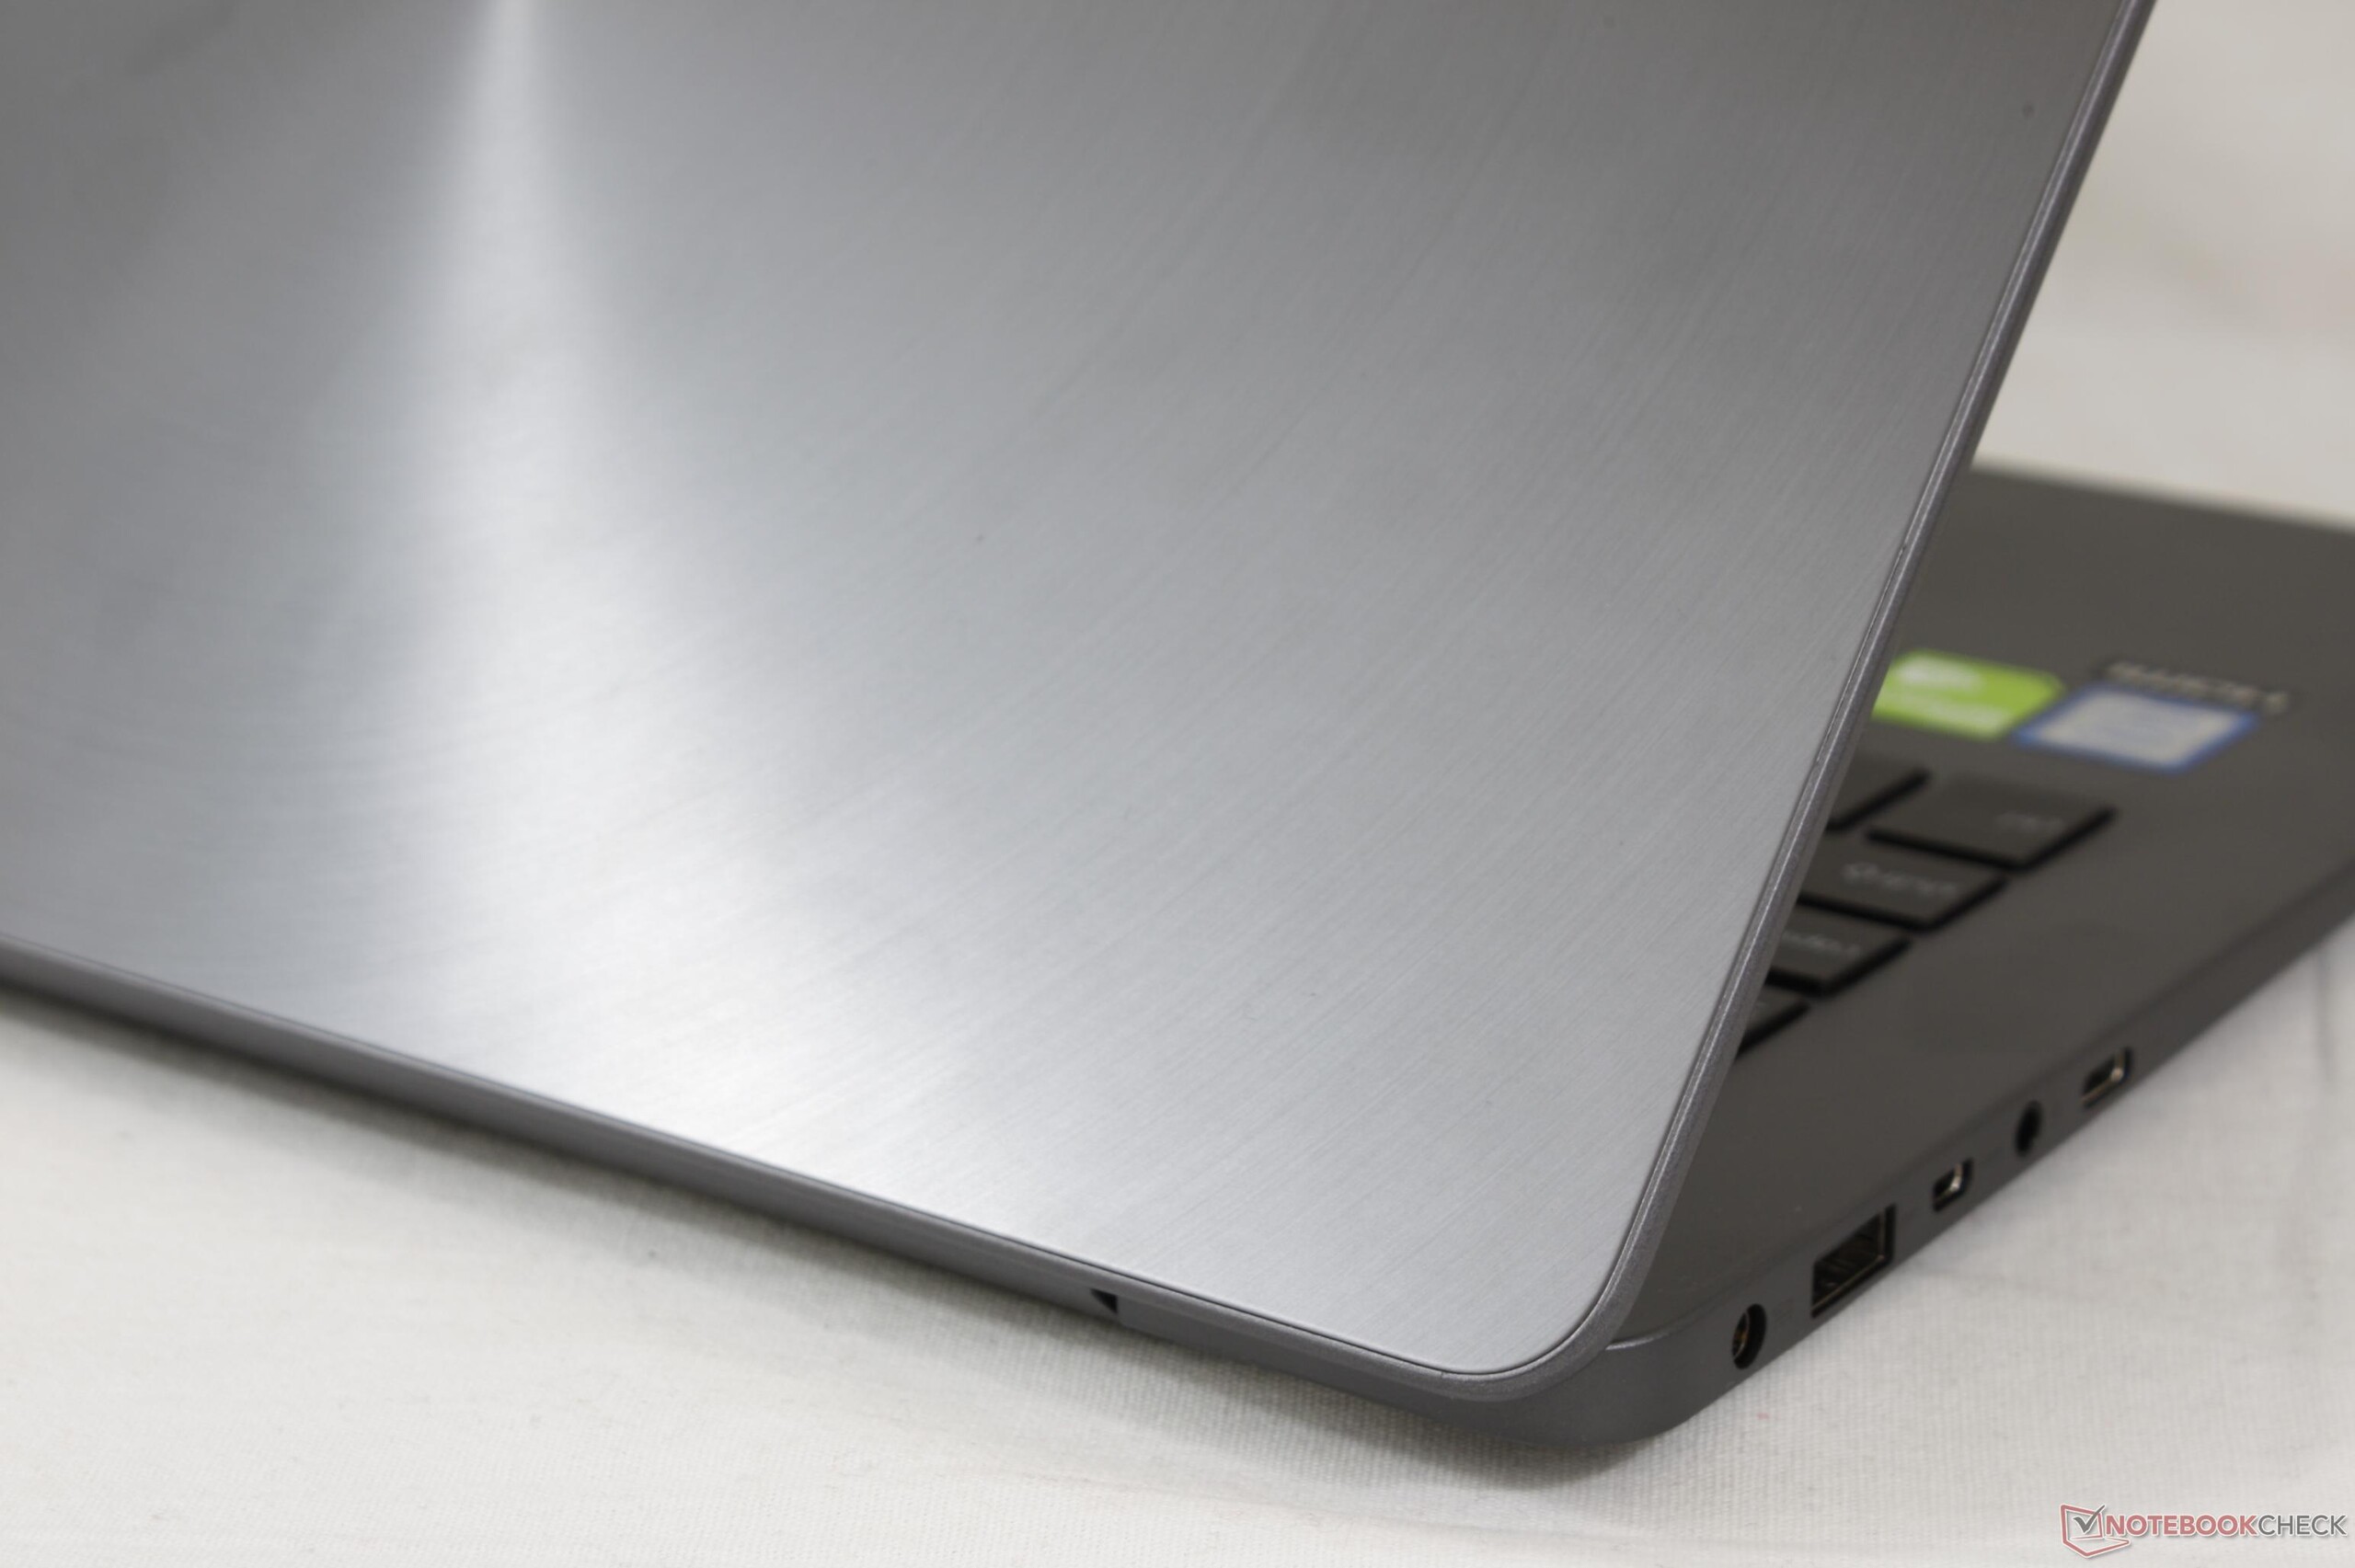
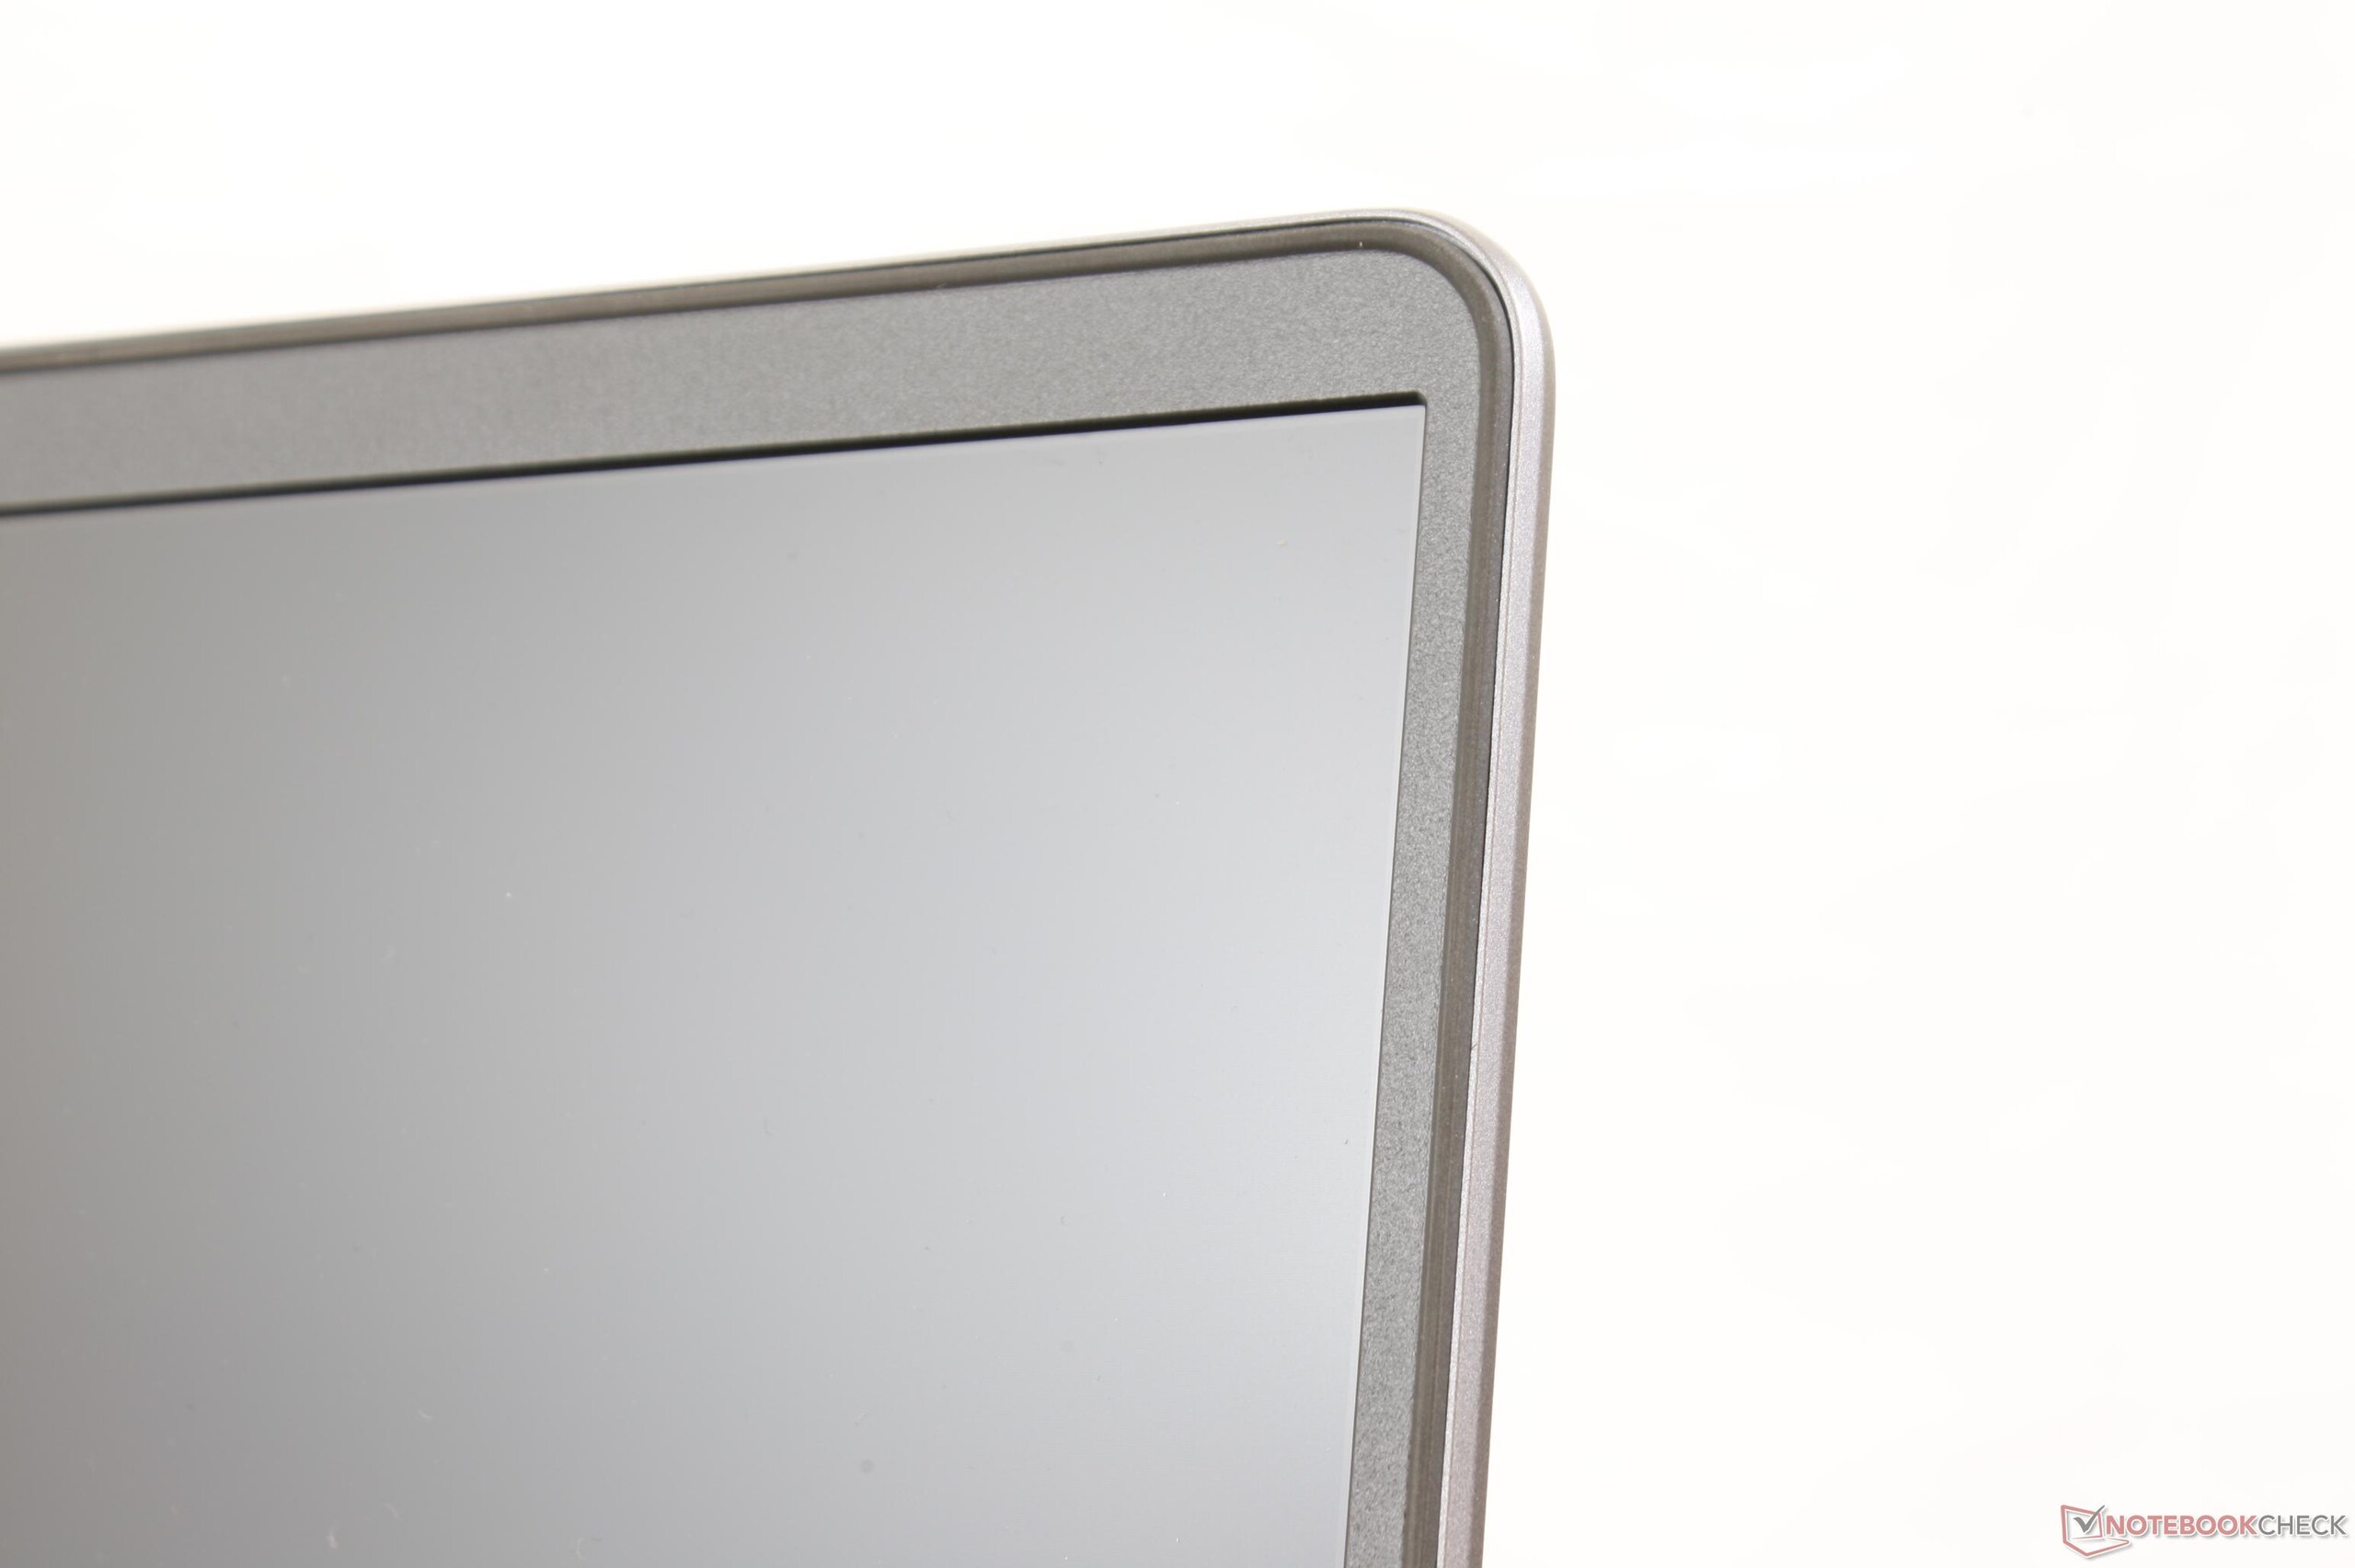
Fördelarna överväger inte den längre listan över nackdelar på UX430. Dom få framstående funktionerna är den skarpa matta skärmen och den tunna designen, men nästan allt annat är medelmåttigt eller icke anmärkningsvärt som bäst. Ljusstyrkan är svagare än konkurrerande Ultrabook-modeller, chassit böjer sig jämförelsevis mer, styrplattan är mjuk och tangentbordsknapparna kunde varit fastare. När vi dyker djupare in i hårdvaran känns det som en besvikelse att hitta spoltjut och en strypt GPU som inte ens kan upprätthålla sin basklockfrekvens under längre tid.
Den huvudsakliga fördelen med UX430UN är priset på ca 10 000 kronor. Dess specifikationer är imponerande med en 8:e generationens Core i7 CPU, 16 GB RAM, 520 GB SSD och till och med dedikerad GeForce Pascal-grafik. Ett system med jämförbara specifikationer såsom Samsung NP900X5T eller Spectre x360 15 säljs för tusentals kronor mer per styck och till och med XPS 13 börjar på ca 8 000 kronor med bara en bråkdel av dom grundläggande specifikationerna. Från det perspektivet kan UX430UN anses vara riktigt prisvärd för sin prestanda, så länge man känner till den långa listan av nackdelar.
Utmärkta specifikationer för ett utmärkt pris. Den faktiska hårdvaran kunde dock ha förbättrats på nästan alla punkter för att bättre kunna tävla i det femsiffriga prisspannet. I framtida uppdateringar hoppas vi på att se en robustare design och en ljusare skärm för förbättrad användbarhet utomhus.
Asus Zenbook UX430UN
- 03/23/2018 v6 (old)
Allen Ngo
Price comparison
