Test: Apple MacBook Pro 13 2020 - Den enklare Pro-modellen får också högre prestanda med M1 (Sammanfattning)
Testgrupp
Gradering | Datum | Modell | Vikt | Höjd | Storlek | Upplösning | Pris |
|---|---|---|---|---|---|---|---|
| 91.1 % v7 (old) | 12/2020 | Apple MacBook Pro 13 Late 2020 M1 Entry (8 / 256 GB) M1, M1 8-Core GPU | 1.4 kg | 15.6 mm | 13.30" | 2560x1600 | |
| 92.1 % v7 (old) | 06/2020 | Apple MacBook Pro 13 2020 2GHz i5 10th-Gen i5-1038NG7, Iris Plus Graphics G7 (Ice Lake 64 EU) | 1.4 kg | 15.6 mm | 13.30" | 2560x1600 | |
| 90.6 % v7 (old) | 02/2020 | Apple MacBook Pro 13 2019 2TB3 i5-8257U, Iris Plus Graphics 645 | 1.4 kg | 14.9 mm | 13.30" | 2560x1600 | |
| 91.1 % v7 (old) | 12/2020 | Apple MacBook Air 2020 M1 Entry M1, M1 7-Core GPU | 1.3 kg | 16.1 mm | 13.30" | 2560x1600 | |
| 88.1 % v7 (old) | 12/2020 | Dell XPS 13 9310 Core i7 FHD i7-1165G7, Iris Xe G7 96EUs | 1.3 kg | 14.8 mm | 13.40" | 1920x1200 | |
| 87.4 % v7 (old) | 06/2020 | Huawei MateBook X Pro 2020 i7 i7-10510U, GeForce MX250 | 1.3 kg | 14.6 mm | 13.90" | 3000x2000 | |
| 86.6 % v7 (old) | 12/2020 | Razer Book 13 FHD i7-1165G7, Iris Xe G7 96EUs | 1.4 kg | 15.15 mm | 13.40" | 1920x1200 |

 M1 8-Core GPU, M1, Apple SSD AP0256")
 M1 8-Core GPU, M1, Apple SSD AP0256")
| |||||||||||||||||||||||||
Distribution av ljusstyrkan: 94 %
Mitt på batteriet: 510 cd/m²
Kontrast: 1759:1 (Svärta: 0.29 cd/m²)
ΔE ColorChecker Calman: 1.3 | ∀{0.5-29.43 Ø4.71}
ΔE Greyscale Calman: 2 | ∀{0.09-98 Ø4.96}
100% sRGB (Argyll 1.6.3 3D)
88.3% AdobeRGB 1998 (Argyll 1.6.3 3D)
Gamma: 2.23
CCT: 6933 K
| Apple MacBook Pro 13 Late 2020 M1 Entry (8 / 256 GB) IPS, 2560x1600, 13.3" | Apple MacBook Pro 13 2020 2TB3 i5 2560x1600, 13.3" | Apple MacBook Air 2020 M1 Entry IPS, 2560x1600, 13.3" | Apple MacBook Pro 13 2020 2GHz i5 10th-Gen APPA03D, IPS, 2560x1600, 13.3" | Dell XPS 13 9310 Core i7 FHD Sharp LQ134N1, IPS, 1920x1200, 13.4" | Dell XPS 13 9310 Core i7 4K Sharp LQ134R1, IPS, 3840x2400, 13.4" | Razer Book 13 FHD Sharp LQ134N1JW48, IPS, 1920x1200, 13.4" | |
|---|---|---|---|---|---|---|---|
| Display | |||||||
| Display P3 Coverage (%) | 98.6 | 98.8 | 70.9 | 80.2 | 70.1 | ||
| sRGB Coverage (%) | 100 | 99.9 | 99.1 | 100 | 99.3 | ||
| AdobeRGB 1998 Coverage (%) | 85.9 | 86.4 | 72.9 | 78.9 | 71.6 | ||
| Response Times | -37% | 16% | -13% | -20% | -42% | -36% | |
| Response Time Grey 50% / Grey 80% * (ms) | 48 ? | 35.2 ? 27% | 31 ? 35% | 46 ? 4% | 52 ? -8% | 59.2 ? -23% | 56.8 ? -18% |
| Response Time Black / White * (ms) | 25.2 ? | 50.4 ? -100% | 26.1 ? -4% | 32.4 ? -29% | 33.2 ? -32% | 40.4 ? -60% | 38.8 ? -54% |
| PWM Frequency (Hz) | 122000 ? | 116300 ? | 118000 ? | 113600 ? | 2475 ? | 2137 ? | 2475 ? |
| Screen | -4% | -9% | -7% | -50% | -28% | 1% | |
| Brightness middle (cd/m²) | 510 | 508 0% | 417 -18% | 512 0% | 543.3 7% | 508.7 0% | 545.3 7% |
| Brightness (cd/m²) | 491 | 502 2% | 395 -20% | 491 0% | 524 7% | 479 -2% | 507 3% |
| Brightness Distribution (%) | 94 | 92 -2% | 91 -3% | 91 -3% | 92 -2% | 84 -11% | 88 -6% |
| Black Level * (cd/m²) | 0.29 | 0.4 -38% | 0.39 -34% | 0.32 -10% | 0.38 -31% | 0.3 -3% | 0.31 -7% |
| Contrast (:1) | 1759 | 1270 -28% | 1069 -39% | 1600 -9% | 1430 -19% | 1696 -4% | 1759 0% |
| Colorchecker dE 2000 * | 1.3 | 1.4 -8% | 1.12 14% | 1.7 -31% | 3.02 -132% | 2.72 -109% | 1.39 -7% |
| Colorchecker dE 2000 max. * | 3 | 2.5 17% | 2.71 10% | 3.4 -13% | 7.61 -154% | 4.7 -57% | 2.61 13% |
| Greyscale dE 2000 * | 2 | 1.7 15% | 1.7 15% | 1.9 5% | 5 -150% | 3.4 -70% | 1.3 35% |
| Gamma | 2.23 99% | 2.22 99% | 2207 0% | 2.19 100% | 2.02 109% | 2.11 104% | 2.2 100% |
| CCT | 6933 94% | 6861 95% | 6870 95% | 6817 95% | 6550 99% | 6245 104% | 6476 100% |
| Color Space (Percent of AdobeRGB 1998) (%) | 88.3 | 88.3 0% | 77.4 -12% | 66.8 -24% | 70.7 -20% | 65.9 -25% | |
| Color Space (Percent of sRGB) (%) | 100 | 100 0% | 99.9 0% | 99.6 0% | 100 0% | 99.6 0% | |
| Colorchecker dE 2000 calibrated * | 0.77 | 1 | 1.23 | 1.92 | 2.72 | ||
| Totalt genomsnitt (program/inställningar) | -21% /
-10% | 4% /
-4% | -10% /
-8% | -35% /
-45% | -35% /
-30% | -18% /
-5% |
* ... mindre är bättre
Visa svarstider
| ↔ Svarstid svart till vitt | ||
|---|---|---|
| 25.2 ms ... stiga ↗ och falla ↘ kombinerat | ↗ 8.4 ms stiga | 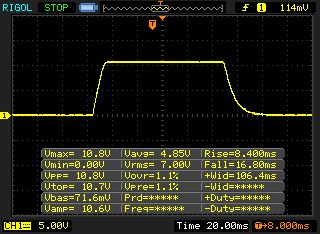 |
| ↘ 16.8 ms hösten | ||
| Skärmen visar relativt långsamma svarsfrekvenser i våra tester och kan vara för långsam för spelare. I jämförelse sträcker sig alla testade enheter från 0.1 (minst) till 240 (maximalt) ms. » 61 % av alla enheter är bättre. Detta innebär att den uppmätta svarstiden är sämre än genomsnittet av alla testade enheter (19.8 ms). | ||
| ↔ Svarstid 50 % grått till 80 % grått | ||
| 48 ms ... stiga ↗ och falla ↘ kombinerat | ↗ 18.8 ms stiga | 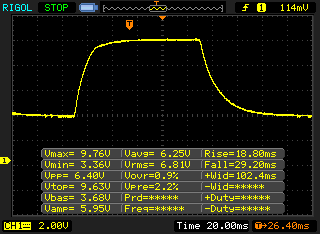 |
| ↘ 29.2 ms hösten | ||
| Skärmen visar långsamma svarsfrekvenser i våra tester och kommer att vara otillfredsställande för spelare. I jämförelse sträcker sig alla testade enheter från 0.165 (minst) till 636 (maximalt) ms. » 82 % av alla enheter är bättre. Detta innebär att den uppmätta svarstiden är sämre än genomsnittet av alla testade enheter (31 ms). | ||
Skärmflimmer / PWM (Puls-Width Modulation)
| Skärmflimmer / PWM upptäckt | 122000 Hz | ≤ 49 % ljusstyrka inställning | 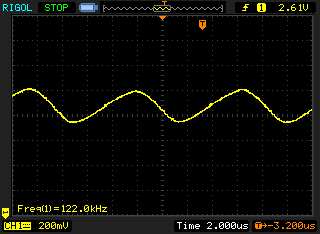 |
Displayens bakgrundsbelysning flimrar vid 122000 Hz (i värsta fall, t.ex. med PWM) Flimrande upptäckt vid en ljusstyrkeinställning på 49 % och lägre. Det ska inte finnas något flimmer eller PWM över denna ljusstyrkeinställning. Frekvensen för 122000 Hz är ganska hög, så de flesta användare som är känsliga för PWM bör inte märka något flimmer. Som jämförelse: 52 % av alla testade enheter använder inte PWM för att dämpa skärmen. Om PWM upptäcktes mättes ett medelvärde av 7757 (minst: 5 - maximum: 343500) Hz. | |||
| Cinebench R23 | |
| Single Core | |
| AMD Ryzen 9 5950X | |
| AMD Ryzen 5 5600X | |
| Apple MacBook Pro 13 Late 2020 M1 Entry (8 / 256 GB) | |
| Apple MacBook Air 2020 M1 Entry | |
| Dell XPS 13 9310 Core i7 4K | |
| Schenker Vision 15 | |
| Schenker XMG Core 17 Comet Lake | |
| Lenovo Yoga Slim 7-14ARE | |
| Lenovo Yoga Slim 7 14ARE05 82A20008GE | |
| Apple MacBook Pro 16 2019 i9 5500M | |
| Apple MacBook Pro 15 2018 (2.6 GHz, 560X) | |
| Apple MacBook Pro 13 2020 2TB3 i5 | |
| Multi Core | |
| AMD Ryzen 9 5950X | |
| AMD Ryzen 5 5600X | |
| Lenovo Yoga Slim 7-14ARE | |
| Apple MacBook Pro 16 2019 i9 5500M | |
| Apple MacBook Pro 16 2019 i9 5500M | |
| Apple MacBook Pro 13 Late 2020 M1 Entry (8 / 256 GB) | |
| Schenker XMG Core 17 Comet Lake | |
| Lenovo Yoga Slim 7 14ARE05 82A20008GE | |
| Apple MacBook Air 2020 M1 Entry | |
| Razer Book 13 FHD | |
| Apple MacBook Pro 15 2018 (2.6 GHz, 560X) | |
| Dell XPS 13 9310 Core i7 4K | |
| Schenker Vision 15 | |
| Apple MacBook Pro 13 2020 2TB3 i5 | |
Cinebench R15: CPU Single 64Bit | CPU Multi 64Bit
Blender: v2.79 BMW27 CPU
7-Zip 18.03: 7z b 4 -mmt1 | 7z b 4
Geekbench 5.5: Single-Core | Multi-Core
HWBOT x265 Benchmark v2.2: 4k Preset
LibreOffice : 20 Documents To PDF
R Benchmark 2.5: Overall mean
| Cinebench R20 / CPU (Single Core) | |
| Genomsnitt av klass Subnotebook (128 - 832, n=57, senaste 2 åren) | |
| AMD Ryzen 9 5950X | |
| AMD Ryzen 5 5600X | |
| Razer Book 13 FHD | |
| Dell XPS 13 9310 Core i7 4K | |
| Dell XPS 13 9310 Core i7 FHD | |
| Schenker Vision 15 | |
| Schenker XMG Core 17 Comet Lake | |
| Lenovo Yoga Slim 7-14ARE | |
| Lenovo Yoga Slim 7 14ARE05 82A20008GE | |
| Apple MacBook Pro 16 2019 i9 5500M | |
| Apple MacBook Pro 16 2019 i9 5500M | |
| Apple MacBook Pro 15 2018 (2.6 GHz, 560X) | |
| Apple MacBook Pro 15 2018 (2.6 GHz, 560X) | |
| Apple MacBook Pro 13 2020 2GHz i5 10th-Gen | |
| Apple MacBook Pro 13 Late 2020 M1 Entry (8 / 256 GB) | |
| Huawei MateBook X Pro 2020 i7 | |
| Genomsnitt Apple M1 (401 - 406, n=4) | |
| Apple MacBook Air 2020 M1 Entry | |
| Apple MacBook Pro 13 2020 2TB3 i5 | |
| Apple MacBook Pro 13 2019 2TB3 | |
| Cinebench R20 / CPU (Multi Core) | |
| AMD Ryzen 9 5950X | |
| Genomsnitt av klass Subnotebook (579 - 8541, n=57, senaste 2 åren) | |
| AMD Ryzen 5 5600X | |
| Apple MacBook Pro 16 2019 i9 5500M | |
| Apple MacBook Pro 16 2019 i9 5500M | |
| Lenovo Yoga Slim 7-14ARE | |
| Lenovo Yoga Slim 7 14ARE05 82A20008GE | |
| Schenker XMG Core 17 Comet Lake | |
| Apple MacBook Pro 15 2018 (2.6 GHz, 560X) | |
| Apple MacBook Pro 15 2018 (2.6 GHz, 560X) | |
| Razer Book 13 FHD | |
| Apple MacBook Pro 13 Late 2020 M1 Entry (8 / 256 GB) | |
| Genomsnitt Apple M1 (1863 - 2109, n=4) | |
| Schenker Vision 15 | |
| Apple MacBook Pro 13 2020 2GHz i5 10th-Gen | |
| Dell XPS 13 9310 Core i7 4K | |
| Dell XPS 13 9310 Core i7 FHD | |
| Apple MacBook Air 2020 M1 Entry | |
| Apple MacBook Pro 13 2020 2TB3 i5 | |
| Apple MacBook Pro 13 2019 2TB3 | |
| Huawei MateBook X Pro 2020 i7 | |
| Cinebench R15 / CPU Single 64Bit | |
| AMD Ryzen 9 5950X | |
| Genomsnitt av klass Subnotebook (72.4 - 322, n=57, senaste 2 åren) | |
| AMD Ryzen 5 5600X | |
| Schenker Vision 15 | |
| Razer Book 13 FHD | |
| Dell XPS 13 9310 Core i7 FHD | |
| Dell XPS 13 9310 Core i7 4K | |
| Schenker XMG Core 17 Comet Lake | |
| Apple MacBook Pro 13 Late 2020 M1 Entry (8 / 256 GB) | |
| Apple MacBook Air 2020 M1 Entry | |
| Genomsnitt Apple M1 (206 - 208, n=3) | |
| Apple MacBook Pro 16 2019 i9 5500M | |
| Apple MacBook Pro 16 2019 i9 5500M | |
| Lenovo Yoga Slim 7-14ARE | |
| Lenovo Yoga Slim 7 14ARE05 82A20008GE | |
| Apple MacBook Pro 15 2018 (2.6 GHz, 560X) | |
| Huawei MateBook X Pro 2020 i7 | |
| Apple MacBook Pro 13 2020 2GHz i5 10th-Gen | |
| Apple MacBook Pro 13 2019 2TB3 | |
| Apple MacBook Pro 13 2020 2TB3 i5 | |
| Cinebench R15 / CPU Multi 64Bit | |
| AMD Ryzen 9 5950X | |
| Genomsnitt av klass Subnotebook (327 - 3345, n=57, senaste 2 åren) | |
| AMD Ryzen 5 5600X | |
| Lenovo Yoga Slim 7-14ARE | |
| Apple MacBook Pro 16 2019 i9 5500M | |
| Apple MacBook Pro 16 2019 i9 5500M | |
| Schenker XMG Core 17 Comet Lake | |
| Lenovo Yoga Slim 7 14ARE05 82A20008GE | |
| Apple MacBook Pro 13 Late 2020 M1 Entry (8 / 256 GB) | |
| Apple MacBook Pro 15 2018 (2.6 GHz, 560X) | |
| Apple MacBook Pro 15 2018 (2.6 GHz, 560X) | |
| Apple MacBook Pro 15 2018 (2.6 GHz, 560X) | |
| Apple MacBook Pro 15 2018 (2.6 GHz, 560X) | |
| Genomsnitt Apple M1 (1020 - 1087, n=4) | |
| Schenker Vision 15 | |
| Apple MacBook Air 2020 M1 Entry | |
| Razer Book 13 FHD | |
| Dell XPS 13 9310 Core i7 FHD | |
| Dell XPS 13 9310 Core i7 4K | |
| Apple MacBook Pro 13 2020 2GHz i5 10th-Gen | |
| Apple MacBook Pro 13 2019 2TB3 | |
| Apple MacBook Pro 13 2020 2TB3 i5 | |
| Huawei MateBook X Pro 2020 i7 | |
| Blender / v2.79 BMW27 CPU | |
| Huawei MateBook X Pro 2020 i7 | |
| Apple MacBook Pro 13 2019 2TB3 | |
| Apple MacBook Air 2020 M1 Entry | |
| Dell XPS 13 9310 Core i7 4K | |
| Dell XPS 13 9310 Core i7 FHD | |
| Genomsnitt Apple M1 (412 - 710, n=2) | |
| Schenker Vision 15 | |
| Razer Book 13 FHD | |
| Apple MacBook Pro 15 2018 (2.6 GHz, 560X) | |
| Lenovo Yoga Slim 7 14ARE05 82A20008GE | |
| Genomsnitt av klass Subnotebook (159 - 2271, n=58, senaste 2 åren) | |
| Schenker XMG Core 17 Comet Lake | |
| Apple MacBook Pro 16 2019 i9 5500M | |
| Lenovo Yoga Slim 7-14ARE | |
| AMD Ryzen 5 5600X | |
| AMD Ryzen 9 5950X | |
| Apple MacBook Pro 13 2020 2GHz i5 10th-Gen | |
| 7-Zip 18.03 / 7z b 4 -mmt1 | |
| AMD Ryzen 9 5950X | |
| AMD Ryzen 5 5600X | |
| Genomsnitt av klass Subnotebook (2643 - 6699, n=59, senaste 2 åren) | |
| Apple MacBook Air 2020 M1 Entry | |
| Genomsnitt Apple M1 (n=1) | |
| Schenker XMG Core 17 Comet Lake | |
| Razer Book 13 FHD | |
| Dell XPS 13 9310 Core i7 FHD | |
| Schenker Vision 15 | |
| Dell XPS 13 9310 Core i7 4K | |
| Apple MacBook Pro 16 2019 i9 5500M | |
| Huawei MateBook X Pro 2020 i7 | |
| Apple MacBook Pro 15 2018 (2.6 GHz, 560X) | |
| Lenovo Yoga Slim 7-14ARE | |
| Lenovo Yoga Slim 7 14ARE05 82A20008GE | |
| Apple MacBook Pro 13 2020 2GHz i5 10th-Gen | |
| Apple MacBook Pro 13 2019 2TB3 | |
| 7-Zip 18.03 / 7z b 4 | |
| AMD Ryzen 9 5950X | |
| AMD Ryzen 5 5600X | |
| Lenovo Yoga Slim 7-14ARE | |
| Genomsnitt av klass Subnotebook (11668 - 77867, n=57, senaste 2 åren) | |
| Apple MacBook Pro 16 2019 i9 5500M | |
| Schenker XMG Core 17 Comet Lake | |
| Apple MacBook Air 2020 M1 Entry | |
| Genomsnitt Apple M1 (n=1) | |
| Lenovo Yoga Slim 7 14ARE05 82A20008GE | |
| Apple MacBook Pro 15 2018 (2.6 GHz, 560X) | |
| Razer Book 13 FHD | |
| Schenker Vision 15 | |
| Dell XPS 13 9310 Core i7 FHD | |
| Dell XPS 13 9310 Core i7 4K | |
| Apple MacBook Pro 13 2019 2TB3 | |
| Apple MacBook Pro 13 2020 2GHz i5 10th-Gen | |
| Huawei MateBook X Pro 2020 i7 | |
| Geekbench 5.5 / Single-Core | |
| Genomsnitt av klass Subnotebook (726 - 2224, n=48, senaste 2 åren) | |
| Apple MacBook Pro 13 Late 2020 M1 Entry (8 / 256 GB) | |
| Genomsnitt Apple M1 (1710 - 1745, n=9) | |
| Apple MacBook Air 2020 M1 Entry | |
| AMD Ryzen 9 5950X | |
| AMD Ryzen 5 5600X | |
| Razer Book 13 FHD | |
| Schenker Vision 15 | |
| Dell XPS 13 9310 Core i7 FHD | |
| Dell XPS 13 9310 Core i7 4K | |
| Schenker XMG Core 17 Comet Lake | |
| Apple MacBook Pro 13 2020 2GHz i5 10th-Gen | |
| Lenovo Yoga Slim 7-14ARE | |
| Lenovo Yoga Slim 7-14ARE | |
| Apple MacBook Pro 15 2018 (2.6 GHz, 560X) | |
| Lenovo Yoga Slim 7 14ARE05 82A20008GE | |
| Apple MacBook Pro 16 2019 i9 5500M | |
| Huawei MateBook X Pro 2020 i7 | |
| Apple MacBook Pro 13 2020 2TB3 i5 | |
| Geekbench 5.5 / Multi-Core | |
| AMD Ryzen 9 5950X | |
| Genomsnitt av klass Subnotebook (2557 - 17218, n=48, senaste 2 åren) | |
| AMD Ryzen 5 5600X | |
| Apple MacBook Pro 13 Late 2020 M1 Entry (8 / 256 GB) | |
| Apple MacBook Air 2020 M1 Entry | |
| Genomsnitt Apple M1 (7034 - 7710, n=9) | |
| Apple MacBook Pro 16 2019 i9 5500M | |
| Lenovo Yoga Slim 7-14ARE | |
| Lenovo Yoga Slim 7-14ARE | |
| Schenker XMG Core 17 Comet Lake | |
| Lenovo Yoga Slim 7 14ARE05 82A20008GE | |
| Schenker Vision 15 | |
| Razer Book 13 FHD | |
| Dell XPS 13 9310 Core i7 4K | |
| Dell XPS 13 9310 Core i7 FHD | |
| Apple MacBook Pro 15 2018 (2.6 GHz, 560X) | |
| Apple MacBook Pro 13 2020 2GHz i5 10th-Gen | |
| Apple MacBook Pro 13 2020 2TB3 i5 | |
| Huawei MateBook X Pro 2020 i7 | |
| HWBOT x265 Benchmark v2.2 / 4k Preset | |
| AMD Ryzen 9 5950X | |
| AMD Ryzen 5 5600X | |
| Genomsnitt av klass Subnotebook (0.97 - 25.1, n=57, senaste 2 åren) | |
| Lenovo Yoga Slim 7-14ARE | |
| Apple MacBook Pro 16 2019 i9 5500M | |
| Schenker XMG Core 17 Comet Lake | |
| Lenovo Yoga Slim 7 14ARE05 82A20008GE | |
| Razer Book 13 FHD | |
| Schenker Vision 15 | |
| Apple MacBook Pro 15 2018 (2.6 GHz, 560X) | |
| Apple MacBook Pro 13 2020 2GHz i5 10th-Gen | |
| Dell XPS 13 9310 Core i7 FHD | |
| Dell XPS 13 9310 Core i7 4K | |
| Apple MacBook Pro 13 2019 2TB3 | |
| Huawei MateBook X Pro 2020 i7 | |
| LibreOffice / 20 Documents To PDF | |
| Apple MacBook Pro 15 2018 (2.6 GHz, 560X) | |
| Apple MacBook Pro 13 2020 2GHz i5 10th-Gen | |
| Lenovo Yoga Slim 7 14ARE05 82A20008GE | |
| Apple MacBook Pro 16 2019 i9 5500M | |
| Apple MacBook Pro 16 2019 i9 5500M | |
| Lenovo Yoga Slim 7-14ARE | |
| Genomsnitt av klass Subnotebook (39.9 - 220, n=56, senaste 2 åren) | |
| Huawei MateBook X Pro 2020 i7 | |
| Schenker XMG Core 17 Comet Lake | |
| Razer Book 13 FHD | |
| Dell XPS 13 9310 Core i7 4K | |
| Dell XPS 13 9310 Core i7 FHD | |
| AMD Ryzen 9 5950X | |
| Schenker Vision 15 | |
| AMD Ryzen 5 5600X | |
| Genomsnitt Apple M1 (n=1) | |
| Apple MacBook Air 2020 M1 Entry | |
| R Benchmark 2.5 / Overall mean | |
| Apple MacBook Air 2020 M1 Entry | |
| Genomsnitt Apple M1 (n=1) | |
| Apple MacBook Pro 15 2018 (2.6 GHz, 560X) | |
| Apple MacBook Pro 15 2018 (2.6 GHz, 560X) | |
| Apple MacBook Pro 13 2020 2GHz i5 10th-Gen | |
| Apple MacBook Pro 16 2019 i9 5500M | |
| Apple MacBook Pro 16 2019 i9 5500M | |
| Huawei MateBook X Pro 2020 i7 | |
| Lenovo Yoga Slim 7 14ARE05 82A20008GE | |
| Lenovo Yoga Slim 7-14ARE | |
| Dell XPS 13 9310 Core i7 4K | |
| Dell XPS 13 9310 Core i7 FHD | |
| Schenker XMG Core 17 Comet Lake | |
| Schenker Vision 15 | |
| Razer Book 13 FHD | |
| Genomsnitt av klass Subnotebook (0.4024 - 1.456, n=58, senaste 2 åren) | |
| AMD Ryzen 5 5600X | |
| AMD Ryzen 9 5950X | |
Cinebench R15: CPU Single 64Bit | CPU Multi 64Bit
Blender: v2.79 BMW27 CPU
7-Zip 18.03: 7z b 4 -mmt1 | 7z b 4
Geekbench 5.5: Single-Core | Multi-Core
HWBOT x265 Benchmark v2.2: 4k Preset
LibreOffice : 20 Documents To PDF
R Benchmark 2.5: Overall mean
* ... mindre är bättre
* ... mindre är bättre
| 3DMark - Wild Life Unlimited Score | |
| KFA2 GeForce GTX 1650 EX One Click Plus | |
| Schenker XMG Core 17 Comet Lake | |
| Genomsnitt Apple M1 8-Core GPU (17731 - 18326, n=7) | |
| Apple MacBook Pro 13 Late 2020 M1 Entry (8 / 256 GB) | |
| Apple MacBook Air Late 2020 (M1, 8 Core GPU, 8 GB RAM) | |
| Apple MacBook Air 2020 M1 Entry | |
| Genomsnitt av klass Subnotebook (9158 - 24827, n=3, senaste 2 åren) | |
| Asus VivoBook S15 S533EQ-BQ002T | |
| Apple iPad Air 4 2020 | |
| Samsung Galaxy Book Flex 15-NP950 | |
| Lenovo Yoga Slim 7 14ARE05 82A20008GE | |
| Dell Latitude 15 3510 NK2MC | |
| Geekbench 5.5 | |
| Metal Score | |
| Apple MacBook Pro 13 Late 2020 M1 Entry (8 / 256 GB) | |
| Genomsnitt Apple M1 8-Core GPU (20411 - 21951, n=6) | |
| Apple MacBook Air Late 2020 (M1, 8 Core GPU, 8 GB RAM) | |
| Apple MacBook Air 2020 M1 Entry | |
| Apple iPad Air 4 2020 | |
| Apple MacBook Pro 13 2020 2TB3 i5 | |
| OpenCL Score | |
| KFA2 GeForce GTX 1650 EX One Click Plus | |
| Schenker XMG Core 17 Comet Lake | |
| Genomsnitt av klass Subnotebook (14920 - 55177, n=46, senaste 2 åren) | |
| Schenker Vision 15 | |
| Apple MacBook Pro 13 Late 2020 M1 Entry (8 / 256 GB) | |
| Dell XPS 13 9310 Core i7 4K | |
| Genomsnitt Apple M1 8-Core GPU (18352 - 19323, n=3) | |
| Razer Book 13 FHD | |
| Dell XPS 13 9310 Core i7 FHD | |
| Apple MacBook Air Late 2020 (M1, 8 Core GPU, 8 GB RAM) | |
| Apple MacBook Air 2020 M1 Entry | |
| Asus VivoBook S15 S533EQ-BQ002T | |
| Lenovo Yoga Slim 7-14ARE | |
| Lenovo Yoga Slim 7-14ARE | |
| Lenovo Yoga Slim 7 14ARE05 82A20008GE | |
| Samsung Galaxy Book Flex 15-NP950 | |
| Apple MacBook Pro 13 2020 2TB3 i5 | |
| Dell Latitude 15 3510 NK2MC | |
| låg | med. | hög | ultra | |
|---|---|---|---|---|
| Shadow of the Tomb Raider (2018) | 66 | 25 | 23 | |
| Total War: Three Kingdoms (2019) | 93.4 | 33 | 20.6 | |
| Borderlands 3 (2019) | 30.4 | 20.3 |
Ljudnivå
| Låg belastning |
| 29.2 / 29.2 / 29.2 dB(A) |
| Hög belastning |
| 32.1 / 41.9 dB(A) |
 | ||
30 dB tyst 40 dB(A) hörbar 50 dB(A) högt ljud |
||
min: | ||
| Apple MacBook Pro 13 Late 2020 M1 Entry (8 / 256 GB) M1 8-Core GPU, M1, Apple SSD AP0256 | Apple MacBook Pro 13 2020 2TB3 i5 Iris Plus Graphics 645, i5-8257U, Apple SSD AP0512 | Apple MacBook Pro 13 2020 2GHz i5 10th-Gen Iris Plus Graphics G7 (Ice Lake 64 EU), i5-1038NG7, Apple SSD SM0512F | Dell XPS 13 9310 Core i7 FHD Iris Xe G7 96EUs, i7-1165G7, Micron 2300 512GB MTFDHBA512TDV | Huawei MateBook X Pro 2020 i7 GeForce MX250, i7-10510U, Samsung PM981a MZVLB1T0HBLR | Razer Book 13 FHD Iris Xe G7 96EUs, i7-1165G7, Samsung SSD PM981a MZVLB256HBHQ | |
|---|---|---|---|---|---|---|
| Noise | 0% | -2% | 13% | -3% | 6% | |
| av / miljö * (dB) | 29.2 | 29.2 -0% | 29.6 -1% | 25.7 12% | 29.6 -1% | 27 8% |
| Idle Minimum * (dB) | 29.2 | 29.2 -0% | 29.6 -1% | 25.7 12% | 29.6 -1% | 27 8% |
| Idle Average * (dB) | 29.2 | 29.2 -0% | 29.6 -1% | 25.7 12% | 29.6 -1% | 27 8% |
| Idle Maximum * (dB) | 29.2 | 29.2 -0% | 29.6 -1% | 25.9 11% | 30.3 -4% | 27.1 7% |
| Load Average * (dB) | 32.1 | 32.9 -2% | 34.4 -7% | 26.2 18% | 38 -18% | 29 10% |
| Load Maximum * (dB) | 41.9 | 40.8 3% | 42.1 -0% | 36.6 13% | 38 9% | 44.8 -7% |
| Witcher 3 ultra * (dB) | 36.1 | 36.5 | 38 | 33.3 |
* ... mindre är bättre
(±) Den maximala temperaturen på ovansidan är 41 °C / 106 F, jämfört med genomsnittet av 35.9 °C / 97 F , allt från 21.4 till 59 °C för klassen Subnotebook.
(±) Botten värms upp till maximalt 40.4 °C / 105 F, jämfört med genomsnittet av 39.2 °C / 103 F
(+) Vid tomgångsbruk är medeltemperaturen för ovansidan 23.3 °C / 74 F, jämfört med enhetsgenomsnittet på 30.8 °C / ### class_avg_f### F.
(+) Handledsstöden och pekplattan är kallare än hudtemperaturen med maximalt 31 °C / 87.8 F och är därför svala att ta på.
(-) Medeltemperaturen för handledsstödsområdet på liknande enheter var 28.2 °C / 82.8 F (-2.8 °C / -5 F).
Apple MacBook Pro 13 Late 2020 M1 Entry (8 / 256 GB) ljudanalys
(±) | högtalarljudstyrkan är genomsnittlig men bra (77.5 dB)
Bas 100 - 315 Hz
(±) | reducerad bas - i genomsnitt 8.7% lägre än medianen
(±) | linjäriteten för basen är genomsnittlig (8.6% delta till föregående frekvens)
Mellan 400 - 2000 Hz
(+) | balanserad mellan - endast 4.2% från medianen
(+) | mids är linjära (4.2% delta till föregående frekvens)
Högsta 2 - 16 kHz
(+) | balanserade toppar - endast 1.2% från medianen
(+) | toppar är linjära (4% delta till föregående frekvens)
Totalt 100 - 16 000 Hz
(+) | det totala ljudet är linjärt (12.9% skillnad mot median)
Jämfört med samma klass
» 20% av alla testade enheter i den här klassen var bättre, 5% liknande, 75% sämre
» Den bästa hade ett delta på 5%, genomsnittet var 18%, sämst var 53%
Jämfört med alla testade enheter
» 12% av alla testade enheter var bättre, 3% liknande, 85% sämre
» Den bästa hade ett delta på 4%, genomsnittet var 23%, sämst var 134%
Apple MacBook Pro 13 2020 2TB3 i5 ljudanalys
(±) | högtalarljudstyrkan är genomsnittlig men bra (77.6 dB)
Bas 100 - 315 Hz
(±) | reducerad bas - i genomsnitt 7.7% lägre än medianen
(±) | linjäriteten för basen är genomsnittlig (7.8% delta till föregående frekvens)
Mellan 400 - 2000 Hz
(+) | balanserad mellan - endast 4.8% från medianen
(+) | mids är linjära (2.7% delta till föregående frekvens)
Högsta 2 - 16 kHz
(+) | balanserade toppar - endast 1.5% från medianen
(+) | toppar är linjära (4.9% delta till föregående frekvens)
Totalt 100 - 16 000 Hz
(+) | det totala ljudet är linjärt (12.9% skillnad mot median)
Jämfört med samma klass
» 12% av alla testade enheter i den här klassen var bättre, 3% liknande, 85% sämre
» Den bästa hade ett delta på 4%, genomsnittet var 23%, sämst var 134%
Jämfört med alla testade enheter
» 12% av alla testade enheter var bättre, 3% liknande, 85% sämre
» Den bästa hade ett delta på 4%, genomsnittet var 23%, sämst var 134%
| Av/Standby | |
| Låg belastning | |
| Hög belastning |
|
Förklaring:
min: | |
| Apple MacBook Pro 13 Late 2020 M1 Entry (8 / 256 GB) M1, M1 8-Core GPU, Apple SSD AP0256, IPS, 2560x1600, 13.3" | Apple MacBook Air 2020 M1 Entry M1, M1 7-Core GPU, Apple SSD AP0256Q, IPS, 2560x1600, 13.3" | Apple MacBook Pro 13 2020 2TB3 i5 i5-8257U, Iris Plus Graphics 645, Apple SSD AP0512, , 2560x1600, 13.3" | Apple MacBook Pro 13 2020 2GHz i5 10th-Gen i5-1038NG7, Iris Plus Graphics G7 (Ice Lake 64 EU), Apple SSD SM0512F, IPS, 2560x1600, 13.3" | Dell XPS 13 9310 Core i7 FHD i7-1165G7, Iris Xe G7 96EUs, Micron 2300 512GB MTFDHBA512TDV, IPS, 1920x1200, 13.4" | Huawei MateBook X Pro 2020 i7 i7-10510U, GeForce MX250, Samsung PM981a MZVLB1T0HBLR, LTPS, 3000x2000, 13.9" | Razer Book 13 FHD i7-1165G7, Iris Xe G7 96EUs, Samsung SSD PM981a MZVLB256HBHQ, IPS, 1920x1200, 13.4" | Genomsnitt Apple M1 8-Core GPU | Genomsnitt av klass Subnotebook | |
|---|---|---|---|---|---|---|---|---|---|
| Power Consumption | 8% | -34% | -64% | -30% | -74% | -27% | -50% | -43% | |
| Idle Minimum * (Watt) | 1.67 | 1.9 -14% | 2.3 -38% | 3.8 -128% | 3.9 -134% | 4.3 -157% | 3.3 -98% | 3.34 ? -100% | 3.76 ? -125% |
| Idle Average * (Watt) | 6.7 | 6.4 4% | 7.9 -18% | 8.6 -28% | 5.9 12% | 8.5 -27% | 6.4 4% | 14.6 ? -118% | 6.54 ? 2% |
| Idle Maximum * (Watt) | 7.4 | 7 5% | 8.6 -16% | 10.3 -39% | 6.3 15% | 12 -62% | 7 5% | 13.3 ? -80% | 7.89 ? -7% |
| Load Average * (Watt) | 28 | 25 11% | 46 -64% | 52.1 -86% | 39.7 -42% | 54.8 -96% | 37.3 -33% | 23 ? 18% | 42 ? -50% |
| Load Maximum * (Watt) | 47.5 | 30.3 36% | 64 -35% | 65.2 -37% | 47.5 -0% | 61.5 -29% | 53.7 -13% | 33.2 ? 30% | 64.8 ? -36% |
| Witcher 3 ultra * (Watt) | 48.2 | 34.8 | 47.1 | 36.4 |
* ... mindre är bättre
| Apple MacBook Pro 13 Late 2020 M1 Entry (8 / 256 GB) M1, M1 8-Core GPU, 58.2 Wh | Apple MacBook Air 2020 M1 Entry M1, M1 7-Core GPU, 49.9 Wh | Apple MacBook Pro 13 2020 2TB3 i5 i5-8257U, Iris Plus Graphics 645, Wh | Apple MacBook Pro 13 2020 2GHz i5 10th-Gen i5-1038NG7, Iris Plus Graphics G7 (Ice Lake 64 EU), 58 Wh | Dell XPS 13 9310 Core i7 FHD i7-1165G7, Iris Xe G7 96EUs, 52 Wh | Huawei MateBook X Pro 2020 i7 i7-10510U, GeForce MX250, 57.4 Wh | Razer Book 13 FHD i7-1165G7, Iris Xe G7 96EUs, 55 Wh | Genomsnitt av klass Subnotebook | |
|---|---|---|---|---|---|---|---|---|
| Batteridrifttid | ||||||||
| WiFi v1.3 (h) | 20.4 | 16 -22% | 13.4 -34% | 12.1 -41% | 11 -46% | 10.4 -49% | 14.8 -27% | 14 ? -31% |
För
Emot
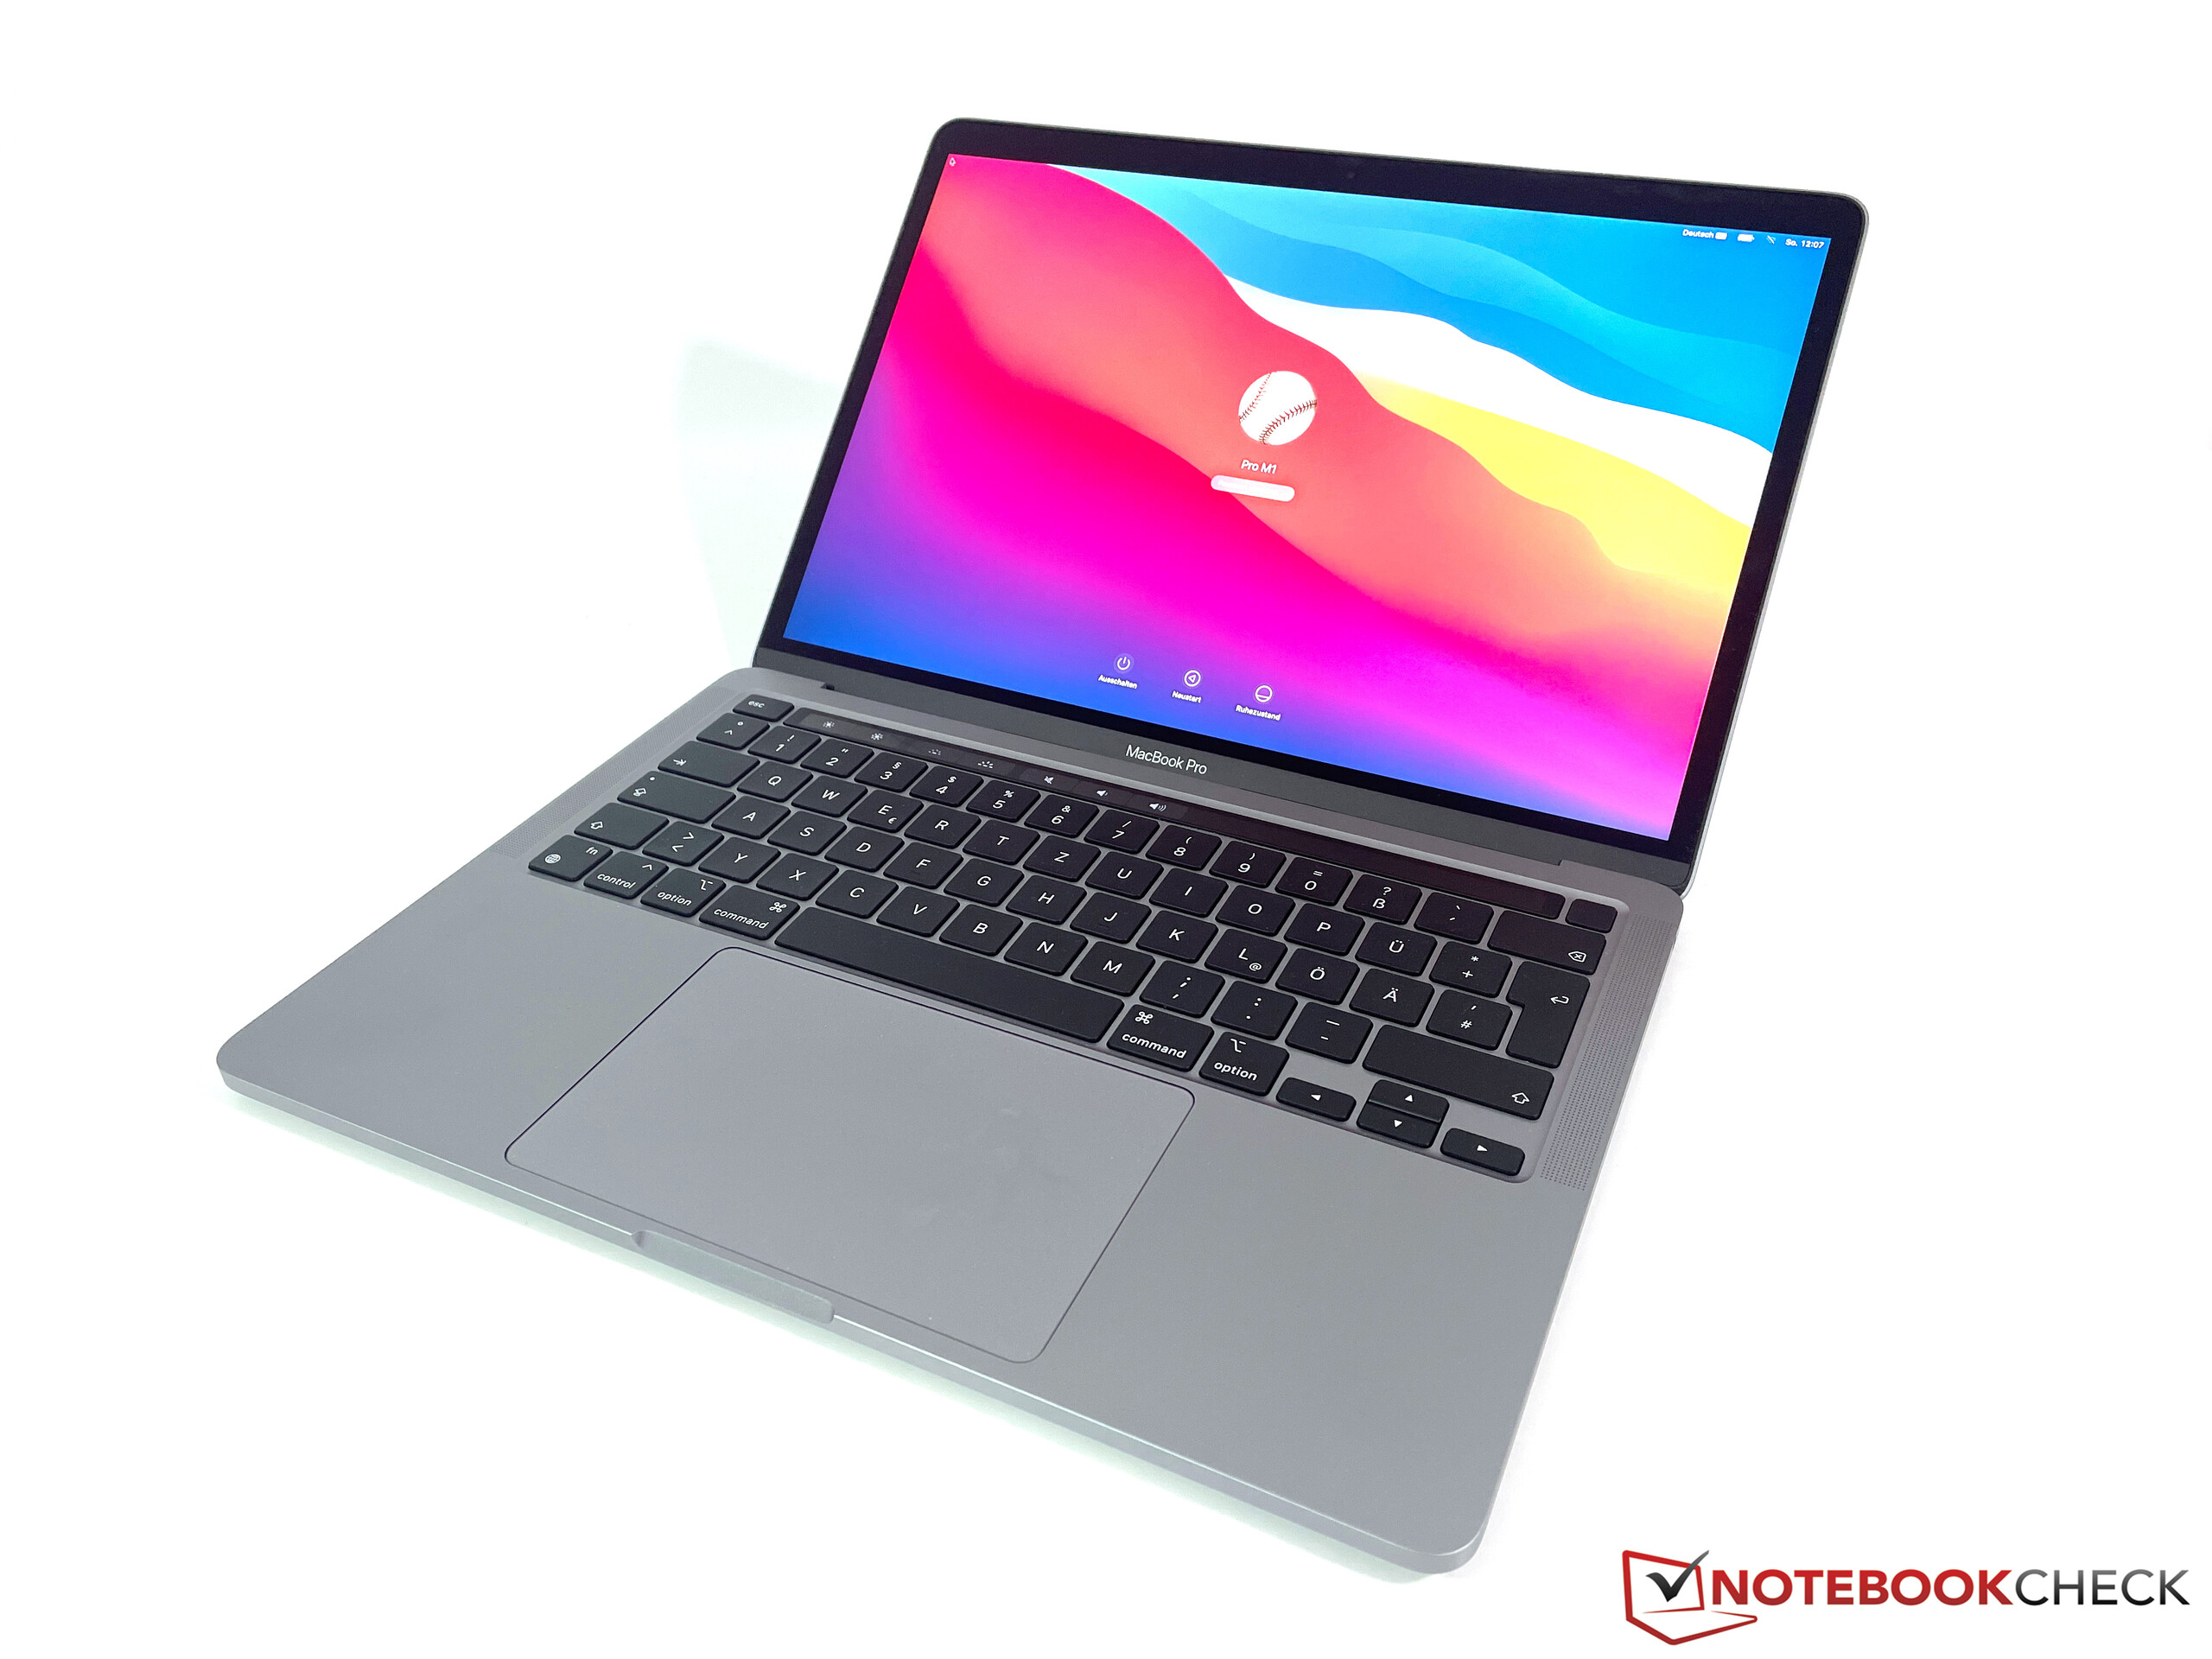
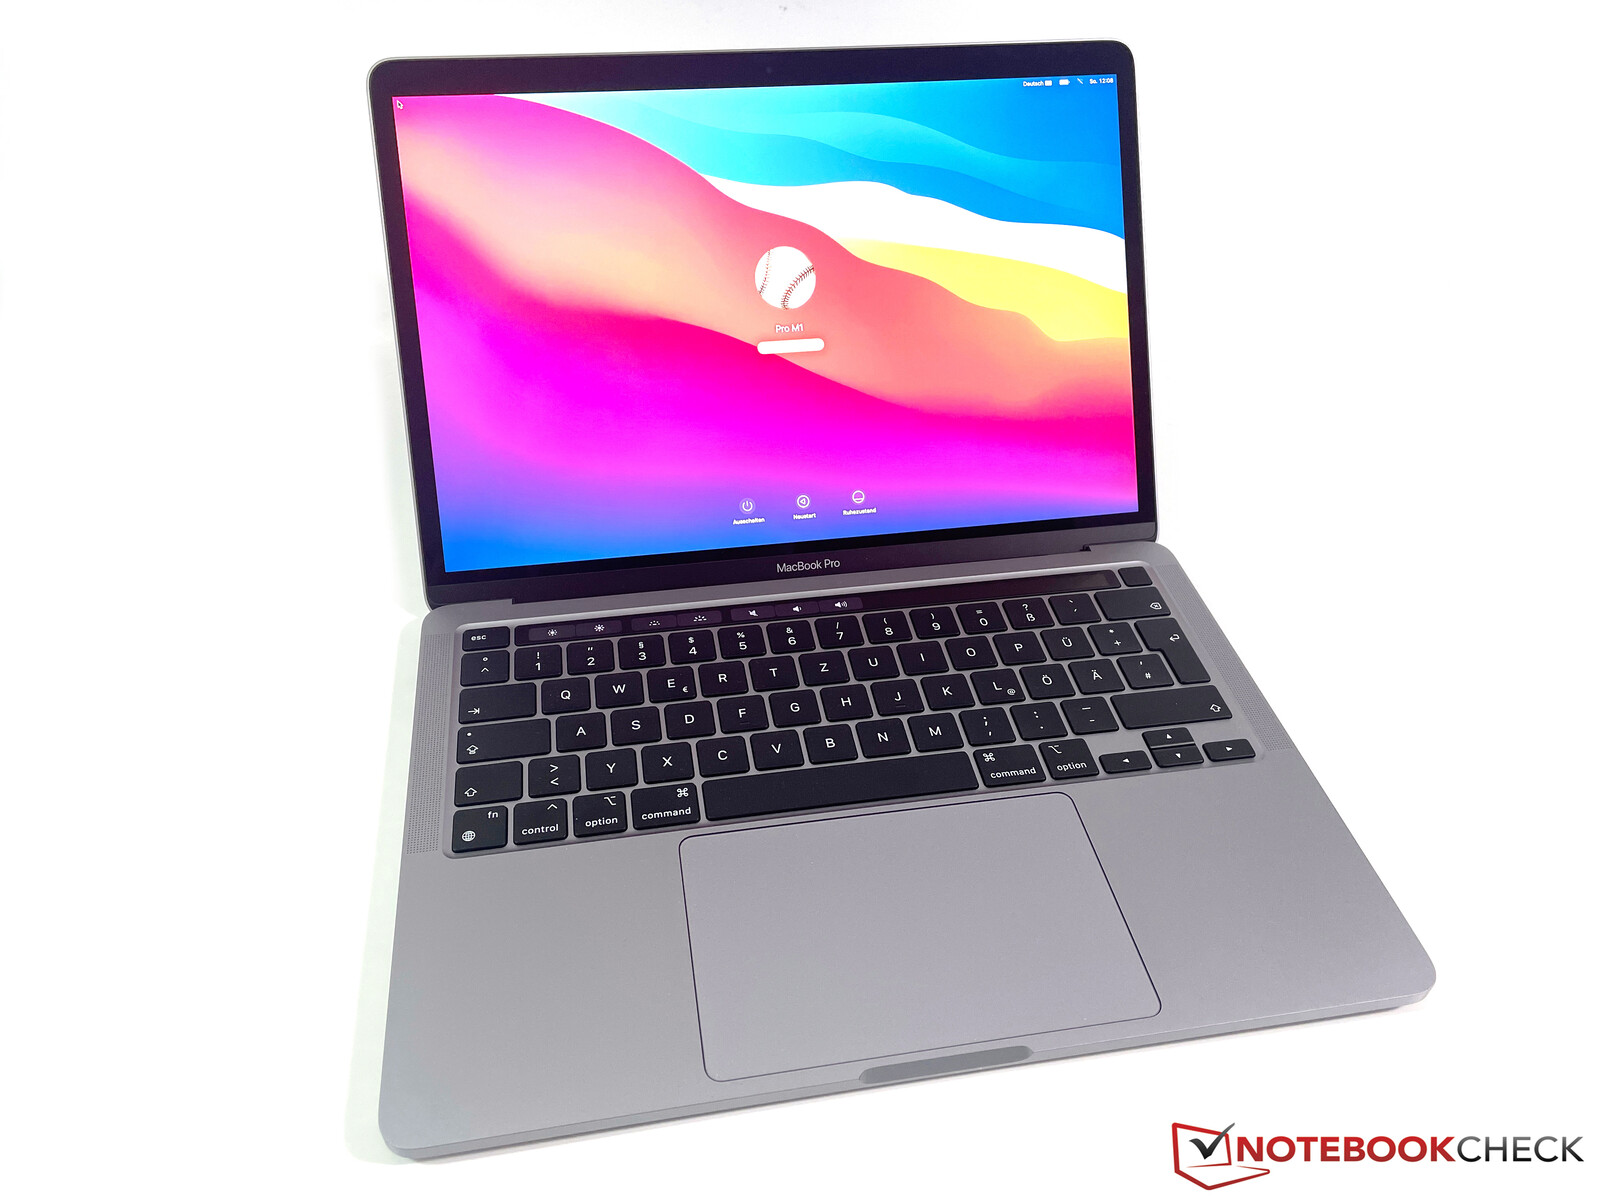
Omdöme - MBP 13 är väldigt bra, men den rättfärdigar inte sitt höga pris jämfört med Air
Läs den fullständiga versionen av den här recensionen på engelska här.
Det är ganska lätt att sammanfatta vårt omdöme för nya MacBook Pro 13 med M1-processorn: Den bygger vidare på tidigare versioners styrkor och den nya processorn förbättrar en del saker som prestanda, batteritid och fläktens ljudnivå i vardagssituationer. Men det finns också en del brister som få portar och långsamma WiFi 6-hastigheter. Totalt sett är det ändå en av de bästa mobila enheterna på marknaden.
Problemet uppstår när vi jämför den med MacBook Air. Tack vare M1-uppdateringen är Air mycket kraftigare än innan och i praktiken märks det egentligen inte någon skillnad mellan de två enheterna. MacBook Pro 13 har bara nytta av sin fläkt vid ihållande belastning, men det känns inte som en viktig aspekt för målgruppen. Prestandatappet Air råkar ut för i jämförelse är heller inte särskilt stort (runt 12% i Cinebench R23).
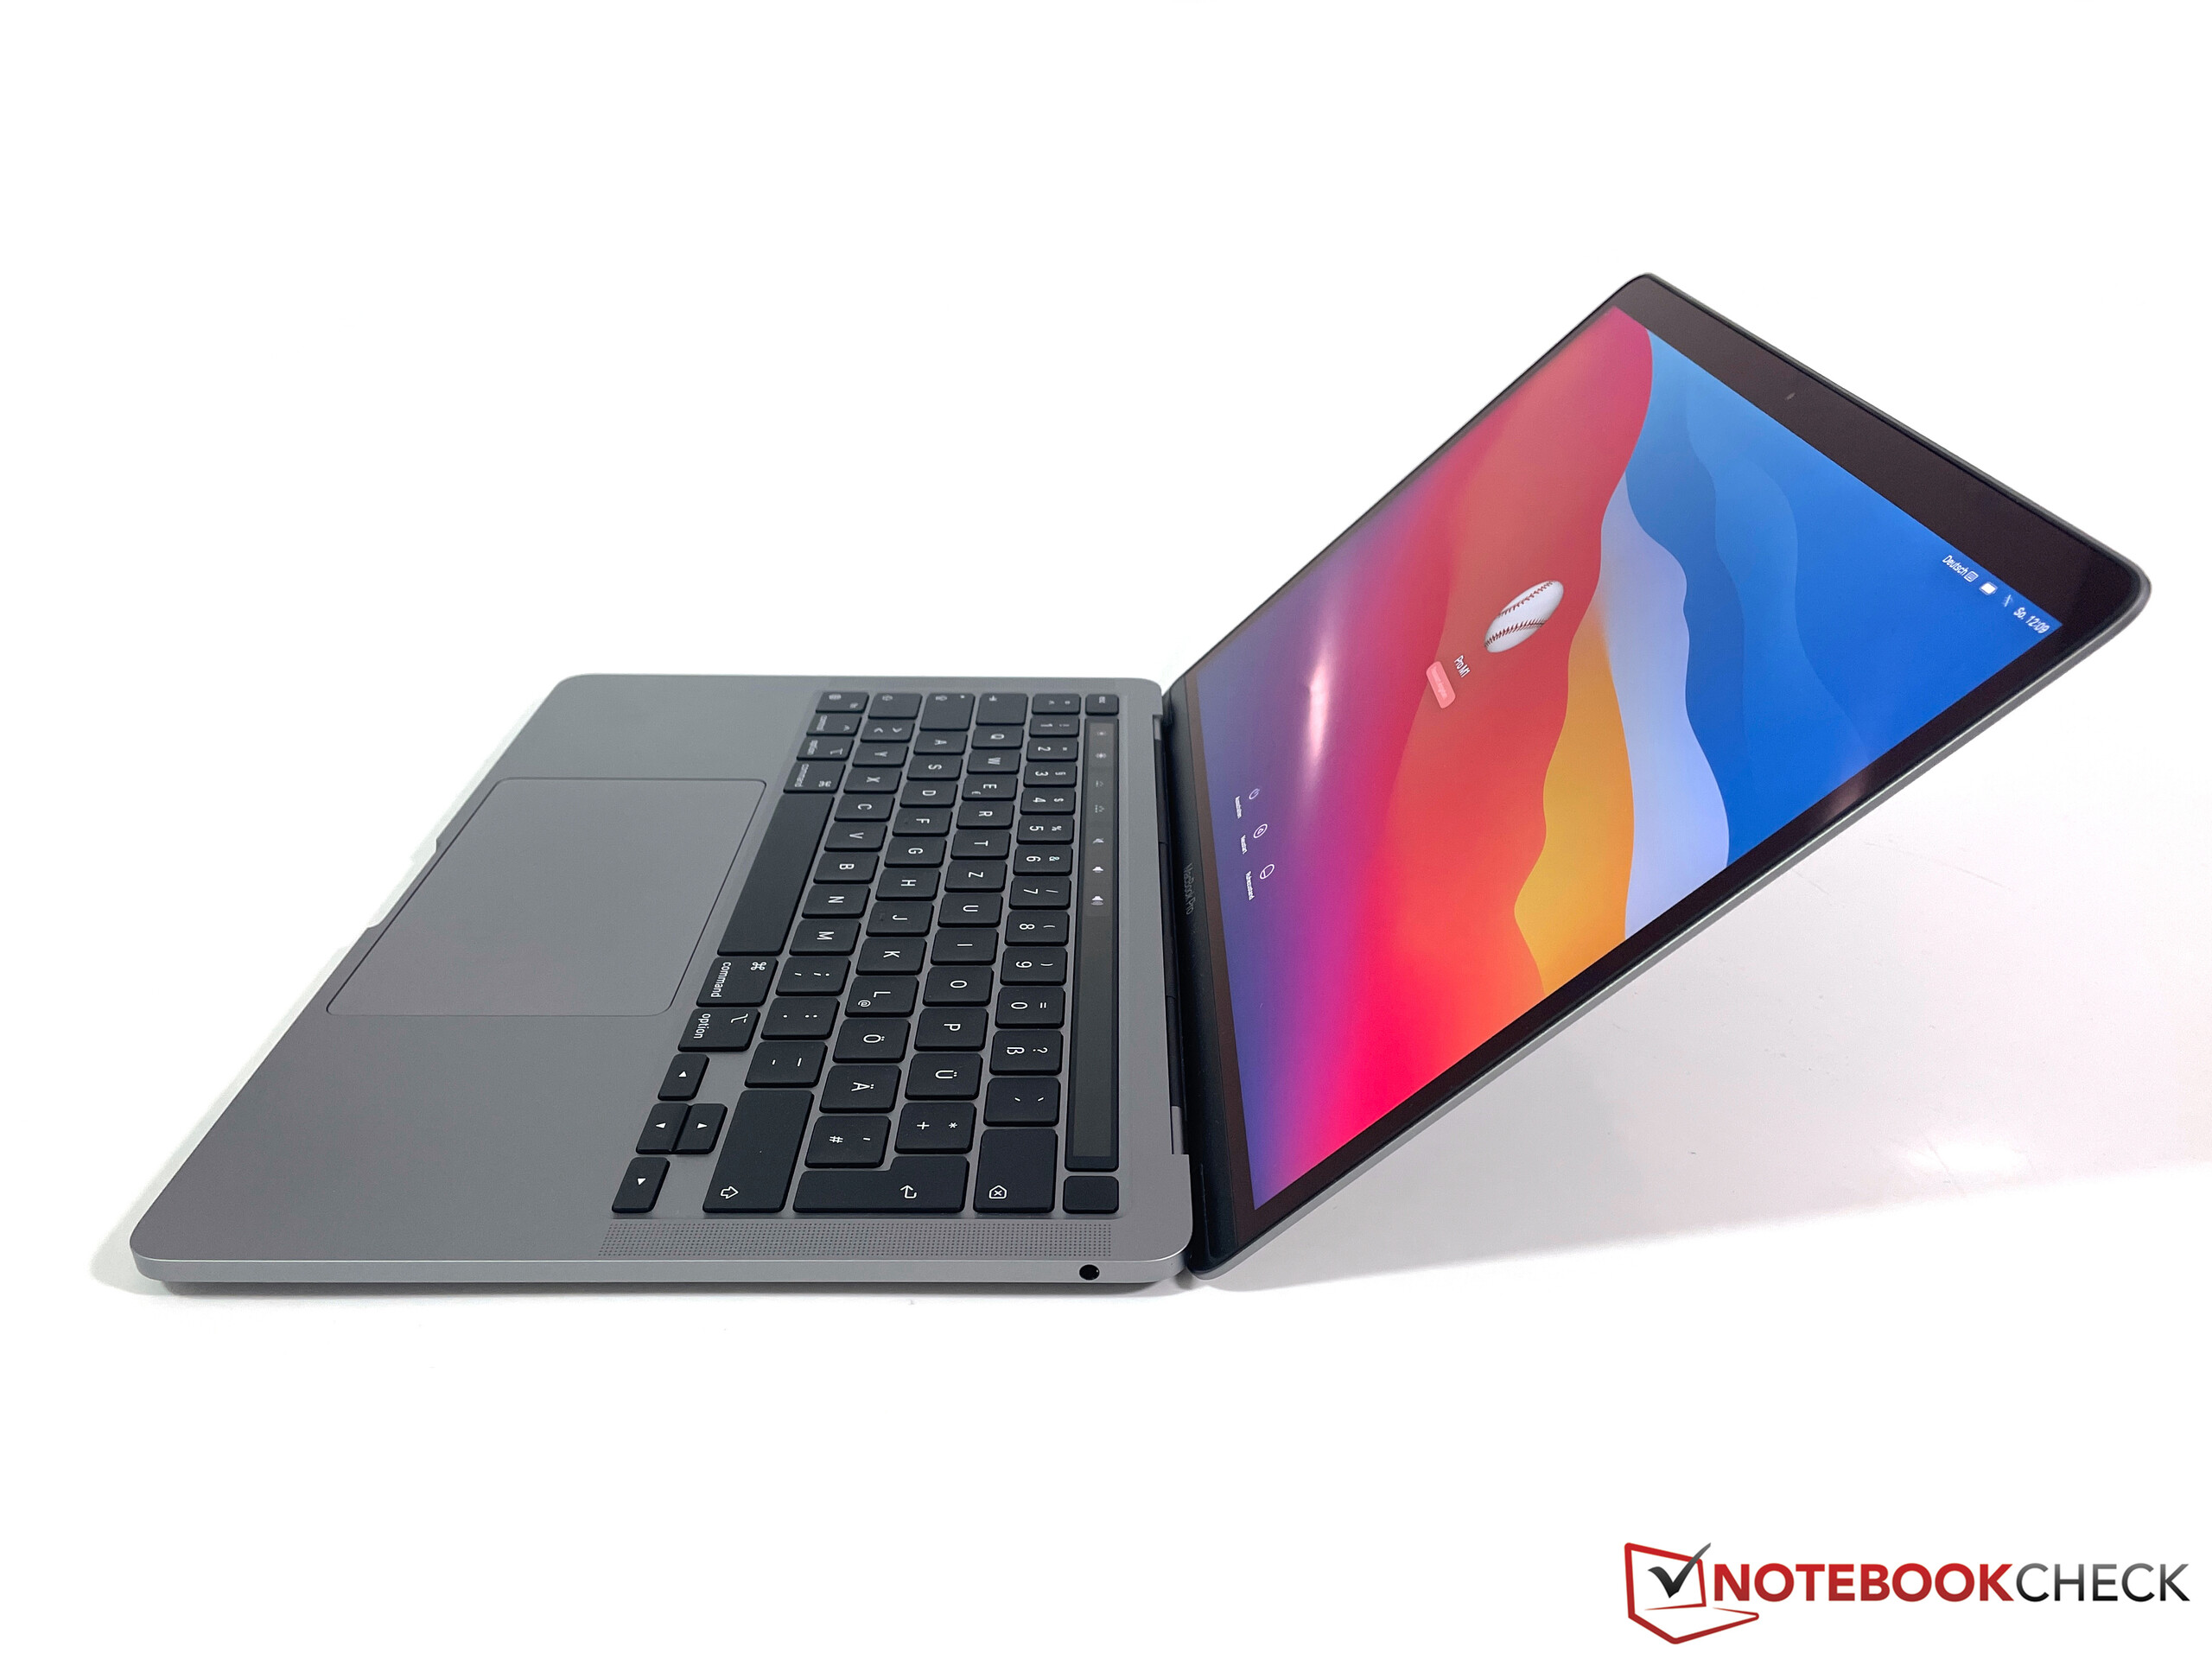
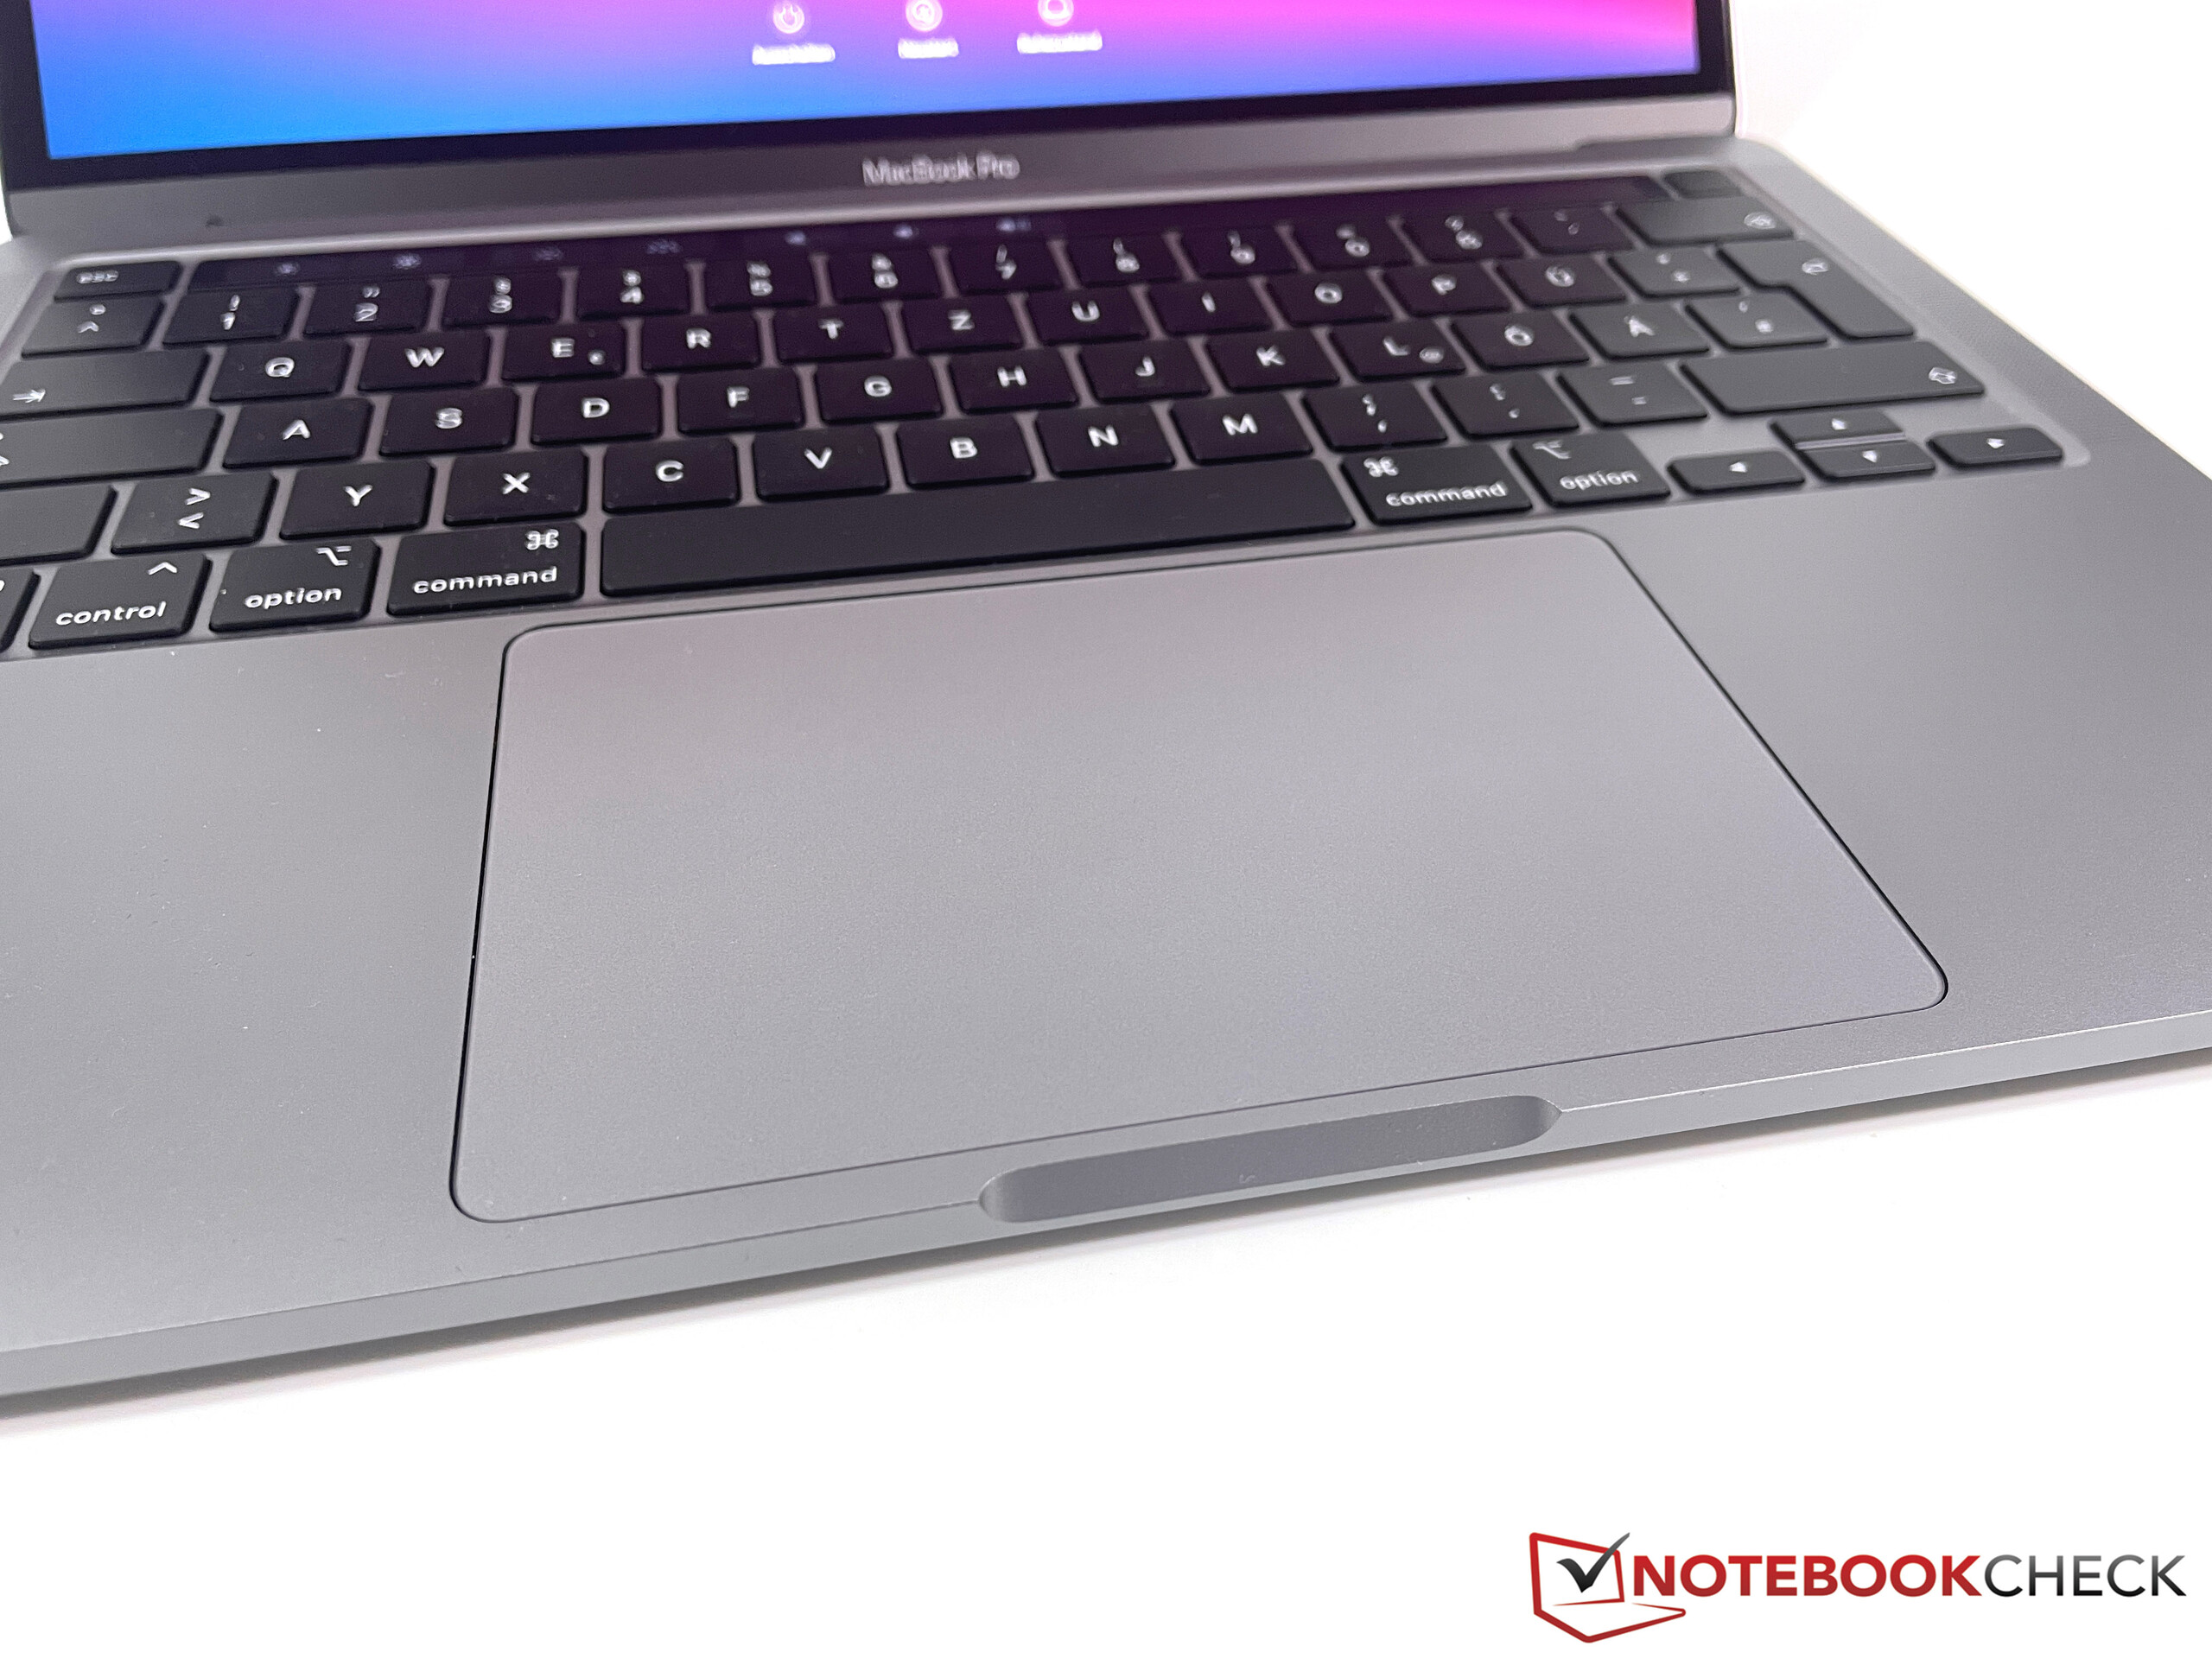
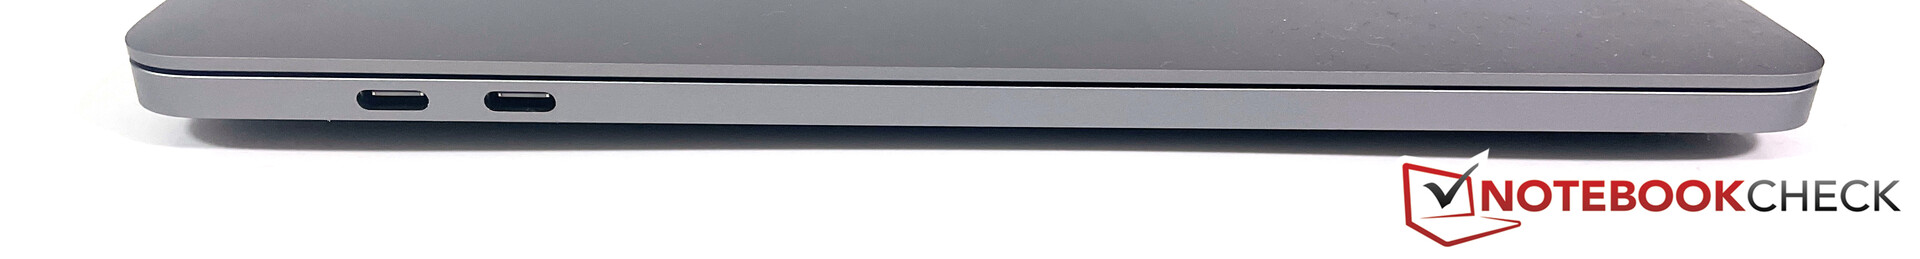
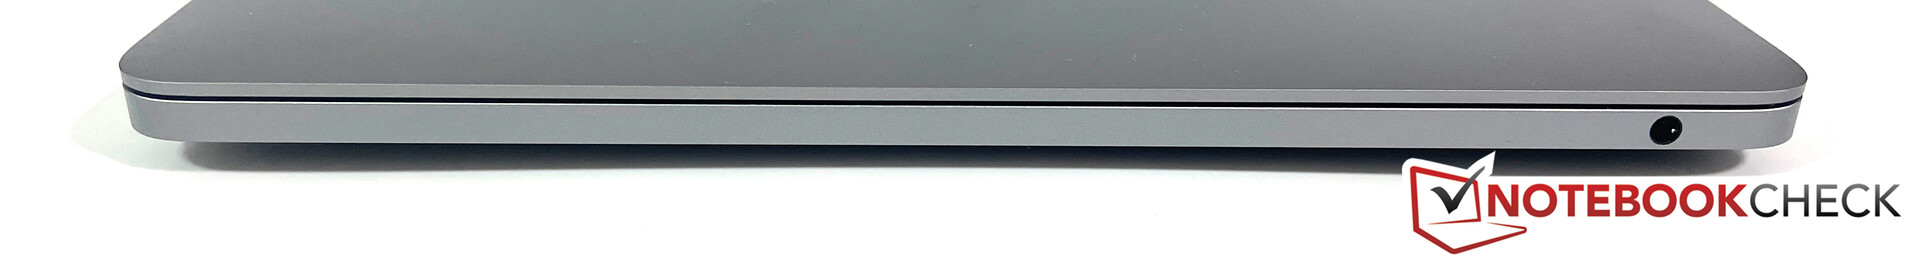
Air har också minskat avståndet när det kommer till skärmen. Den är fortfarande lite mörkare än på Pro (400 mot 500 nits), men nu har Air också stöd för det bredare färgomfånget P3. Båda enheterna har samma anslutningsmöjligheter. Pro har bättre batteritid tack vare ett större batteri, men på grund av det är den också tyngre. Den enda större skillnaden är att MacBook Pro 13 har Touch Bar. Man får själv avgöra huruvida det är positivt eller negativt. I ärlighetens namn känns Touch Bar fortfarande mest som en gimmick trots att det gått flera år och enkla funktioner som att justera skärmens ljusstyrka eller högtalarljudet kräver oftast flera inmatningar. Personligen föredrar vi de fysiska F-knapparna på MacBook Air.
MacBook Pro 13 drar stor nytta av den nya M1-processorn och är onekligen en av de bättre subnotebook-modellerna du kan få tag på. Däremot saknar vi "Pro"-funktionerna jämfört med nya MacBook Air. De båda modellerna ligger extremt nära varandra vid vardagsbruk, så vi föredrar onekligen den inte lika dyra MacBook Air.
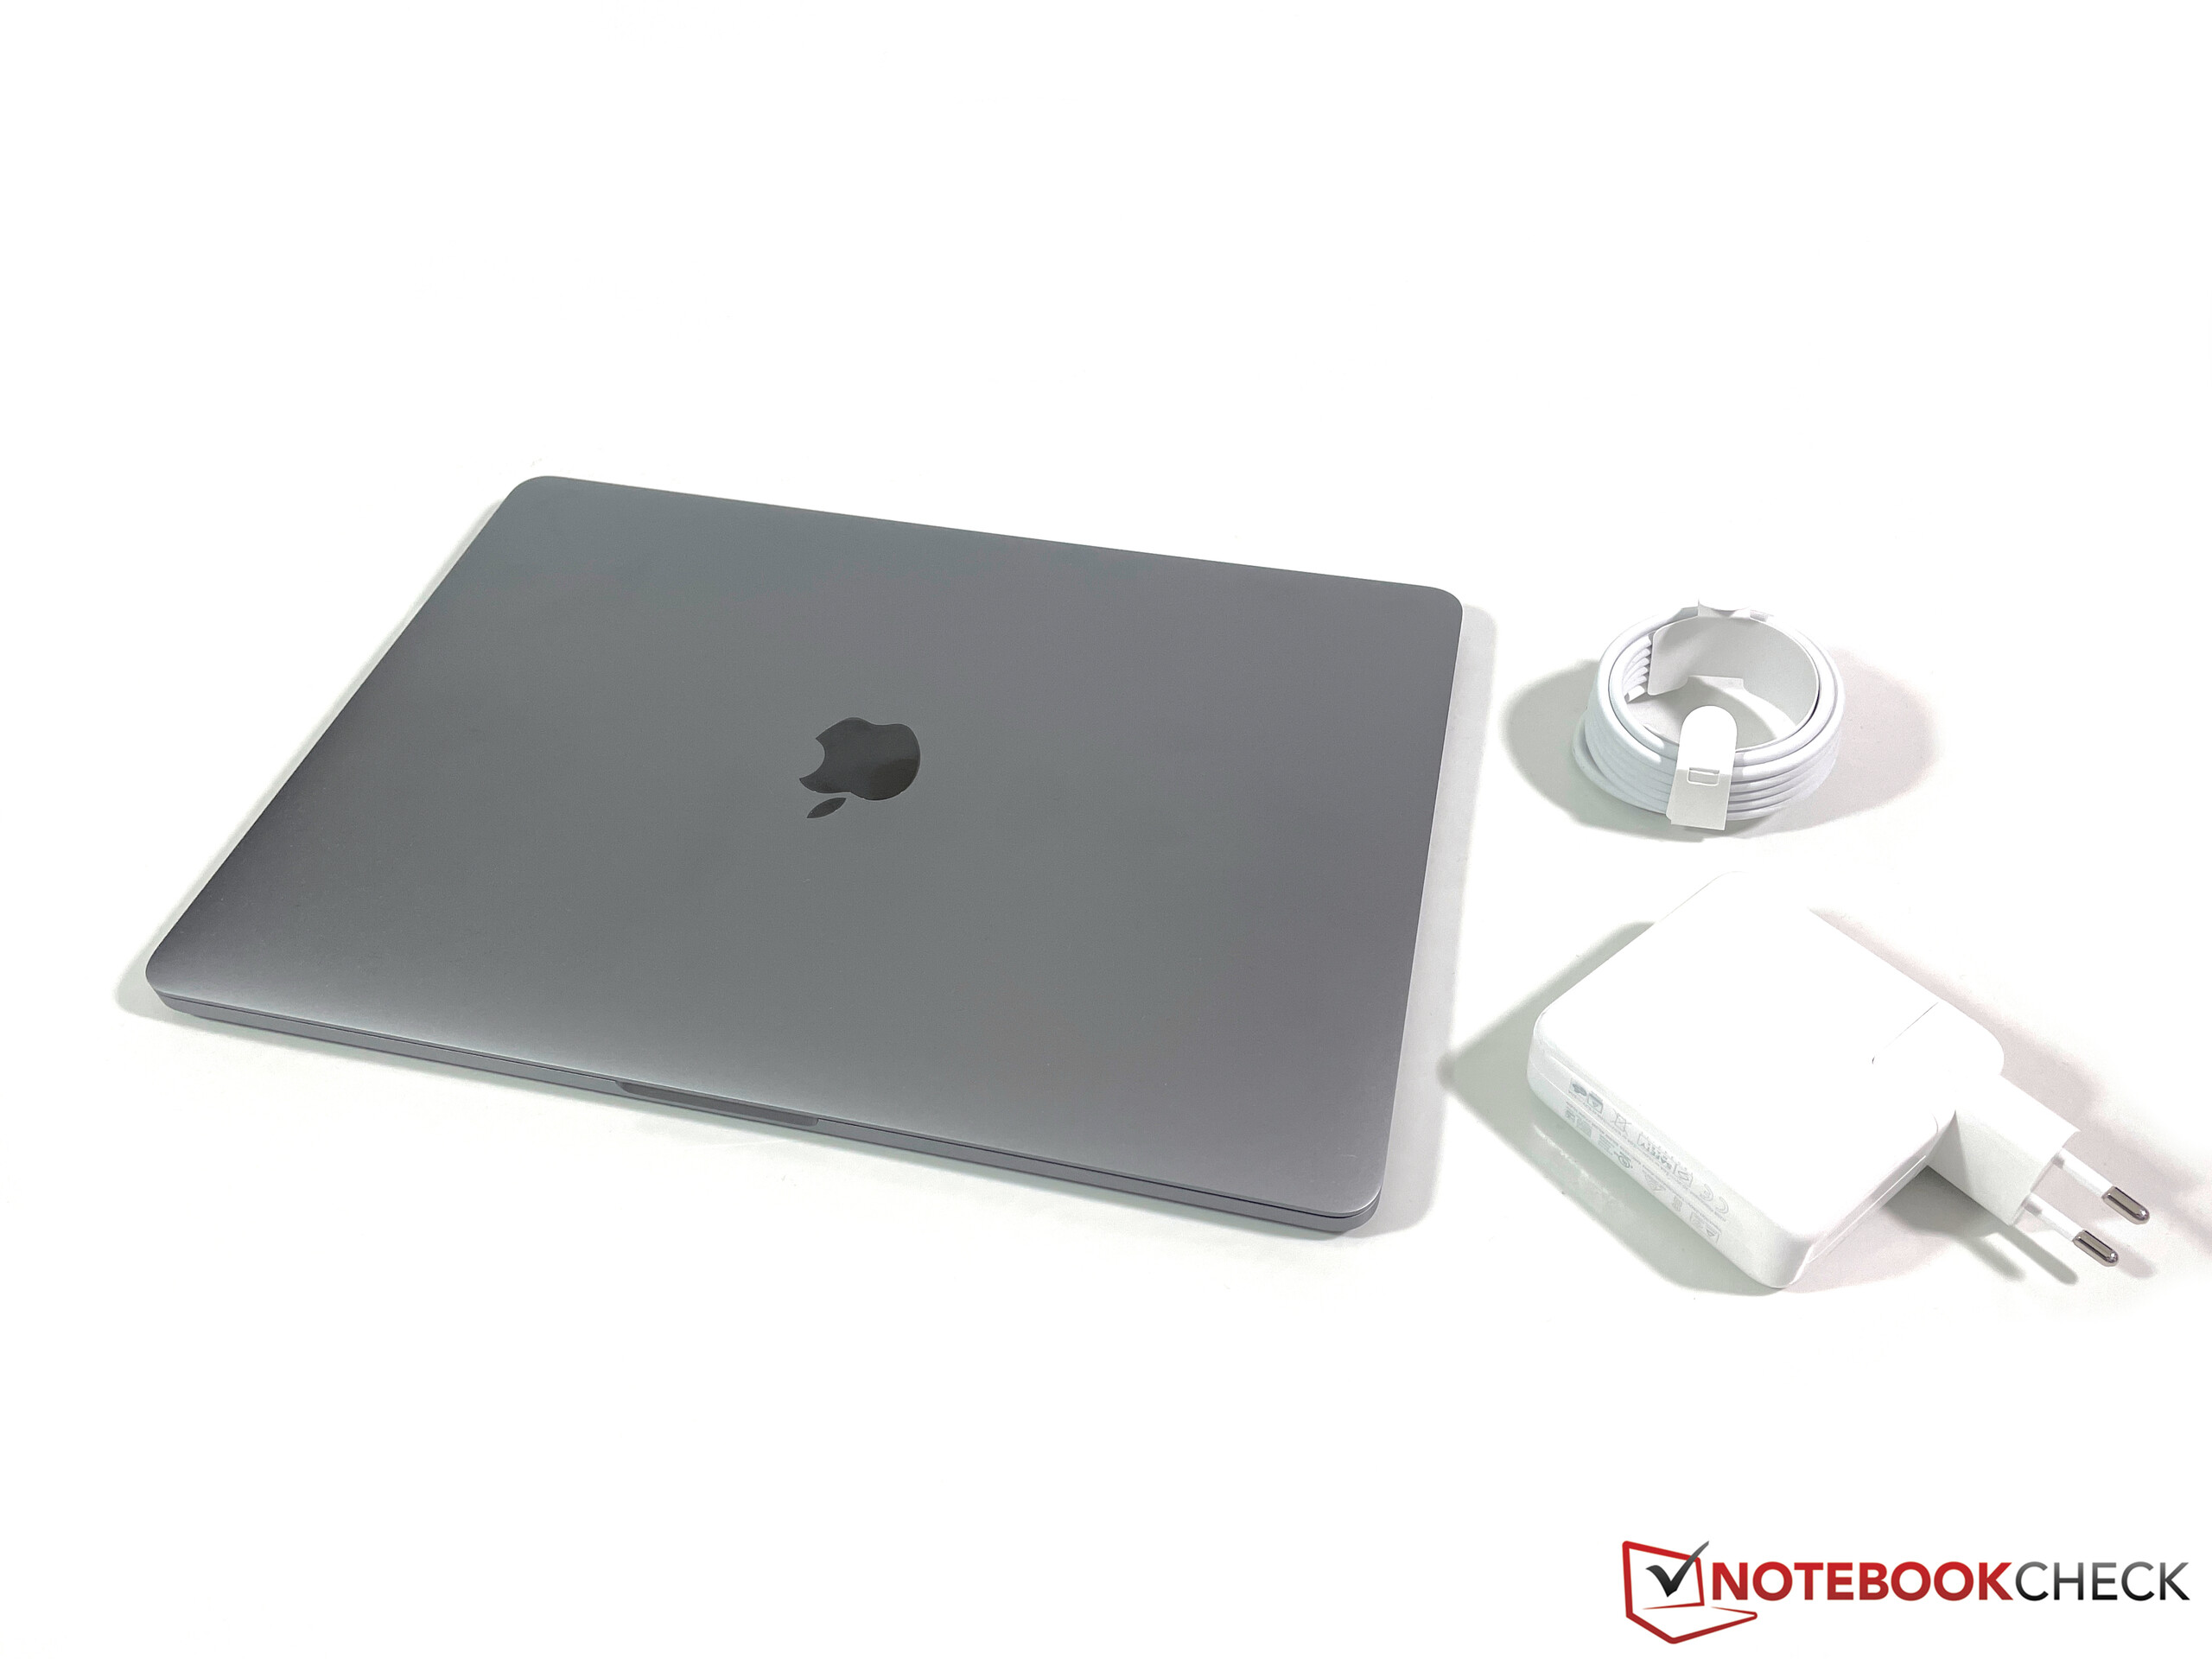
MacBook Pro 13 börjar på 13.000 kronor med en SSD-enhet på 256 GB. Med en SSD på 512 GB kostar den 15.000 kronor. MacBook Air med den snabbare 8-kärniga GPU:n och en SSD på 512 GB kostar 12.500 kronor, vilket är ett mycket bättre pris i förhållande till prestandan.
Generellt sett känns nya MacBook Pro 13 M1 som en ologisk utfyllnadsprodukt. Vi kan inte se några större anledningar att välja Pro framför nya Air. Vi misstänker att Apple snart kommer sluta med instegsversionen av MacBook Pro 13 och istället bara sälja en enda (dyrare) MacBook Pro 13 (eller kanske en MacBook Pro 14) med en kraftigare M1X-processor.
Apple MacBook Pro 13 Late 2020 M1 Entry (8 / 256 GB)
- 12/18/2020 v7 (old)
Andreas Osthoff
Price comparison
