Test: Dell XPS 13 9310 4K - Core i7-1165G7 vs. Core i7-1185G7 (Sammanfattning)
Testgrupp
Gradering | Datum | Modell | Vikt | Höjd | Storlek | Upplösning | Pris |
|---|---|---|---|---|---|---|---|
| 87.4 % v7 (old) | 12/2020 | Dell XPS 13 9310 Core i7 4K i7-1185G7, Iris Xe G7 96EUs | 1.3 kg | 14.8 mm | 13.40" | 3840x2400 | |
| 85.1 % v7 (old) | Asus Zenbook S UX393JA i7-1065G7, Iris Plus Graphics G7 (Ice Lake 64 EU) | 1.4 kg | 15.7 mm | 13.90" | 3300x2200 | ||
| 87.4 % v7 (old) | 06/2020 | Huawei MateBook X Pro 2020 i7 i7-10510U, GeForce MX250 | 1.3 kg | 14.6 mm | 13.90" | 3000x2000 | |
| 88.9 % v7 (old) | 03/2020 | Dell XPS 13 9300 Core i7-1065G7 i7-1065G7, Iris Plus Graphics G7 (Ice Lake 64 EU) | 1.2 kg | 14.8 mm | 13.40" | 1920x1200 | |
| 85.3 % v7 (old) | 08/2020 | Lenovo Yoga Slim 7-14ARE R7 4800U, Vega 8 | 1.4 kg | 14.9 mm | 14.00" | 1920x1080 | |
| 88.4 % v7 (old) | 01/2020 | HP Spectre x360 13-aw0013dx i7-1065G7, Iris Plus Graphics G7 (Ice Lake 64 EU) | 1.2 kg | 16.9 mm | 13.30" | 1920x1080 |

| SD Card Reader | |
| average JPG Copy Test (av. of 3 runs) | |
| Dell XPS 13 9310 Core i7 4K (Toshiba Exceria Pro M501 32 GB UHS-II) | |
| HP Spectre x360 13-aw0013dx (Toshiba Exceria Pro M501 microSDXC 64GB) | |
| Dell XPS 13 9300 Core i7-1065G7 (Toshiba Exceria Pro M501 64 GB UHS-II) | |
| Asus Zenbook S UX393JA (Toshiba Exceria Pro M501 64 GB UHS-II) | |
| Lenovo Yoga Slim 7-14ARE (Toshiba Exceria Pro M501 64 GB UHS-II) | |
| maximum AS SSD Seq Read Test (1GB) | |
| Dell XPS 13 9310 Core i7 4K (Toshiba Exceria Pro M501 32 GB UHS-II) | |
| Dell XPS 13 9300 Core i7-1065G7 (Toshiba Exceria Pro M501 64 GB UHS-II) | |
| HP Spectre x360 13-aw0013dx (Toshiba Exceria Pro M501 microSDXC 64GB) | |
| Lenovo Yoga Slim 7-14ARE (Toshiba Exceria Pro M501 64 GB UHS-II) | |
| Asus Zenbook S UX393JA (Toshiba Exceria Pro M501 64 GB UHS-II) | |
| Networking | |
| iperf3 transmit AX12 | |
| Lenovo Yoga Slim 7-14ARE | |
| Dell XPS 13 9310 Core i7 4K | |
| Huawei MateBook X Pro 2020 i7 | |
| Dell XPS 13 9300 Core i7-1065G7 | |
| Asus Zenbook S UX393JA | |
| iperf3 receive AX12 | |
| Dell XPS 13 9310 Core i7 4K | |
| Asus Zenbook S UX393JA | |
| Dell XPS 13 9300 Core i7-1065G7 | |
| Lenovo Yoga Slim 7-14ARE | |
| Huawei MateBook X Pro 2020 i7 | |


| |||||||||||||||||||||||||
Distribution av ljusstyrkan: 84 %
Mitt på batteriet: 508.7 cd/m²
Kontrast: 1696:1 (Svärta: 0.3 cd/m²)
ΔE ColorChecker Calman: 2.72 | ∀{0.5-29.43 Ø4.71}
calibrated: 1.92
ΔE Greyscale Calman: 3.4 | ∀{0.09-98 Ø4.96}
100% sRGB (Argyll 1.6.3 3D)
70.7% AdobeRGB 1998 (Argyll 1.6.3 3D)
78.9% AdobeRGB 1998 (Argyll 3D)
100% sRGB (Argyll 3D)
80.2% Display P3 (Argyll 3D)
Gamma: 2.11
CCT: 6245 K
| Dell XPS 13 9310 Core i7 4K Sharp LQ134R1, IPS, 13.4", 3840x2400 | Asus Zenbook S UX393JA AU Optronics B139KAN01.0, IPS, 13.9", 3300x2200 | Huawei MateBook X Pro 2020 i7 JDI LPM139M422A, LTPS, 13.9", 3000x2000 | Dell XPS 13 9300 Core i7-1065G7 Sharp LQ134N1, IPS, 13.4", 1920x1200 | Lenovo Yoga Slim 7-14ARE AU Optronics B140HAN06.8, IPS, 14", 1920x1080 | HP Spectre x360 13-aw0013dx AU Optronics AUO5E2D, IPS, 13.3", 1920x1080 | |
|---|---|---|---|---|---|---|
| Display | 11% | -10% | -11% | -7% | -8% | |
| Display P3 Coverage (%) | 80.2 | 97.7 22% | 66.6 -17% | 66.3 -17% | 71.7 -11% | 69.6 -13% |
| sRGB Coverage (%) | 100 | 99.8 0% | 99.4 -1% | 97.3 -3% | 99.3 -1% | 98.9 -1% |
| AdobeRGB 1998 Coverage (%) | 78.9 | 87.9 11% | 68.6 -13% | 68.5 -13% | 72.9 -8% | 71.5 -9% |
| Response Times | 5% | 20% | 17% | 25% | 3% | |
| Response Time Grey 50% / Grey 80% * (ms) | 59.2 ? | 56.4 ? 5% | 49.6 ? 16% | 50 ? 16% | 45.6 ? 23% | 60.8 ? -3% |
| Response Time Black / White * (ms) | 40.4 ? | 38.8 ? 4% | 30.8 ? 24% | 33.2 ? 18% | 29.6 ? 27% | 36.8 ? 9% |
| PWM Frequency (Hz) | 2137 ? | 29070 ? | 2500 ? | |||
| Screen | -15% | 18% | -11% | -17% | -23% | |
| Brightness middle (cd/m²) | 508.7 | 444.1 -13% | 557 9% | 607.6 19% | 399.6 -21% | 447.4 -12% |
| Brightness (cd/m²) | 479 | 423 -12% | 532 11% | 595 24% | 385 -20% | 420 -12% |
| Brightness Distribution (%) | 84 | 89 6% | 87 4% | 96 14% | 89 6% | 85 1% |
| Black Level * (cd/m²) | 0.3 | 0.37 -23% | 0.33 -10% | 0.4 -33% | 0.37 -23% | 0.31 -3% |
| Contrast (:1) | 1696 | 1200 -29% | 1688 0% | 1519 -10% | 1080 -36% | 1443 -15% |
| Colorchecker dE 2000 * | 2.72 | 2.94 -8% | 1.4 49% | 3.23 -19% | 3.2 -18% | 4.23 -56% |
| Colorchecker dE 2000 max. * | 4.7 | 7.37 -57% | 2.5 47% | 8.67 -84% | 6.44 -37% | 9.34 -99% |
| Colorchecker dE 2000 calibrated * | 1.92 | 3.05 -59% | 0.7 64% | 1.01 47% | 1.73 10% | 1.32 31% |
| Greyscale dE 2000 * | 3.4 | 2.9 15% | 2 41% | 5.5 -62% | 4.7 -38% | 6.1 -79% |
| Gamma | 2.11 104% | 2.1 105% | 2.14 103% | 2.12 104% | 2.21 100% | 2.11 104% |
| CCT | 6245 104% | 6766 96% | 6689 97% | 6413 101% | 7184 90% | 6136 106% |
| Color Space (Percent of AdobeRGB 1998) (%) | 70.7 | 78.2 11% | 62.5 -12% | 63 -11% | 66.3 -6% | 64.8 -8% |
| Color Space (Percent of sRGB) (%) | 100 | 99.8 0% | 99.5 0% | 97.5 -2% | 99.5 0% | 98.9 -1% |
| Totalt genomsnitt (program/inställningar) | 0% /
-8% | 9% /
13% | -2% /
-7% | 0% /
-10% | -9% /
-17% |
* ... mindre är bättre
Visa svarstider
| ↔ Svarstid svart till vitt | ||
|---|---|---|
| 40.4 ms ... stiga ↗ och falla ↘ kombinerat | ↗ 22.4 ms stiga | 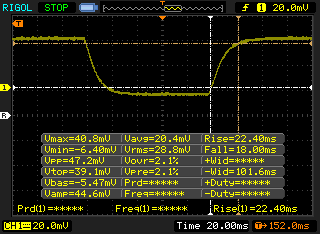 |
| ↘ 18 ms hösten | ||
| Skärmen visar långsamma svarsfrekvenser i våra tester och kommer att vara otillfredsställande för spelare. I jämförelse sträcker sig alla testade enheter från 0.1 (minst) till 240 (maximalt) ms. » 98 % av alla enheter är bättre. Detta innebär att den uppmätta svarstiden är sämre än genomsnittet av alla testade enheter (19.8 ms). | ||
| ↔ Svarstid 50 % grått till 80 % grått | ||
| 59.2 ms ... stiga ↗ och falla ↘ kombinerat | ↗ 30 ms stiga | 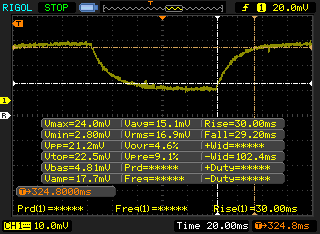 |
| ↘ 29.2 ms hösten | ||
| Skärmen visar långsamma svarsfrekvenser i våra tester och kommer att vara otillfredsställande för spelare. I jämförelse sträcker sig alla testade enheter från 0.165 (minst) till 636 (maximalt) ms. » 95 % av alla enheter är bättre. Detta innebär att den uppmätta svarstiden är sämre än genomsnittet av alla testade enheter (30.9 ms). | ||
Skärmflimmer / PWM (Puls-Width Modulation)
| Skärmflimmer / PWM upptäckt | 2137 Hz | ≤ 31 % ljusstyrka inställning | 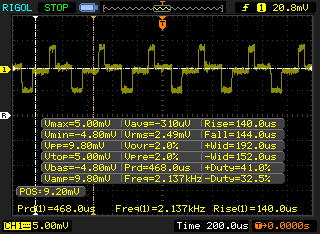 |
Displayens bakgrundsbelysning flimrar vid 2137 Hz (i värsta fall, t.ex. med PWM) Flimrande upptäckt vid en ljusstyrkeinställning på 31 % och lägre. Det ska inte finnas något flimmer eller PWM över denna ljusstyrkeinställning. Frekvensen för 2137 Hz är ganska hög, så de flesta användare som är känsliga för PWM bör inte märka något flimmer. Som jämförelse: 52 % av alla testade enheter använder inte PWM för att dämpa skärmen. Om PWM upptäcktes mättes ett medelvärde av 7744 (minst: 5 - maximum: 343500) Hz. | |||
Cinebench R15: CPU Multi 64Bit | CPU Single 64Bit
Blender: v2.79 BMW27 CPU
7-Zip 18.03: 7z b 4 -mmt1 | 7z b 4
Geekbench 5.5: Single-Core | Multi-Core
HWBOT x265 Benchmark v2.2: 4k Preset
LibreOffice : 20 Documents To PDF
R Benchmark 2.5: Overall mean
| Cinebench R20 / CPU (Multi Core) | |
| Lenovo Yoga Slim 7-14ARE | |
| Lenovo Yoga Slim 7 14ARE05 82A20008GE | |
| Dell XPS 13 7390 Core i7-10710U | |
| Razer Book 13 FHD | |
| HP Envy x360 13-ay0010nr | |
| Genomsnitt Intel Core i7-1185G7 (1425 - 2493, n=28) | |
| Dell XPS 13 9310 Core i7 4K | |
| Dell XPS 13 9310 Core i7 FHD | |
| Dell XPS 13 9300 Core i7-1065G7 | |
| HP Spectre x360 13-aw0013dx | |
| Asus Zenbook S UX393JA | |
| Dell XPS 13 9300 4K UHD | |
| Huawei MateBook X Pro 2020 i7 | |
| Lenovo ThinkPad P43s-20RH001FGE | |
| Cinebench R20 / CPU (Single Core) | |
| Razer Book 13 FHD | |
| Dell XPS 13 9310 Core i7 4K | |
| Dell XPS 13 9310 Core i7 FHD | |
| Genomsnitt Intel Core i7-1185G7 (489 - 593, n=28) | |
| Lenovo Yoga Slim 7-14ARE | |
| Lenovo Yoga Slim 7 14ARE05 82A20008GE | |
| Dell XPS 13 7390 Core i7-10710U | |
| Dell XPS 13 9300 Core i7-1065G7 | |
| Dell XPS 13 9300 4K UHD | |
| Asus Zenbook S UX393JA | |
| HP Envy x360 13-ay0010nr | |
| Huawei MateBook X Pro 2020 i7 | |
| HP Spectre x360 13-aw0013dx | |
| Lenovo ThinkPad P43s-20RH001FGE | |
| Cinebench R15 / CPU Multi 64Bit | |
| Lenovo Yoga Slim 7-14ARE | |
| Lenovo Yoga Slim 7 14ARE05 82A20008GE | |
| Dell XPS 13 7390 Core i7-10710U | |
| Razer Book 13 FHD | |
| Dell XPS 13 9310 Core i7 FHD | |
| Dell XPS 13 9310 Core i7 4K | |
| Genomsnitt Intel Core i7-1185G7 (617 - 1066, n=32) | |
| HP Envy x360 13-ay0010nr | |
| Dell XPS 13 9300 4K UHD | |
| Dell XPS 13 9300 Core i7-1065G7 | |
| Dell XPS 13 9380 2019 | |
| HP Spectre x360 13-aw0013dx | |
| Asus Zenbook S UX393JA | |
| Huawei MateBook X Pro 2020 i7 | |
| Lenovo ThinkPad P43s-20RH001FGE | |
| Cinebench R15 / CPU Single 64Bit | |
| Razer Book 13 FHD | |
| Dell XPS 13 9310 Core i7 FHD | |
| Dell XPS 13 9310 Core i7 4K | |
| Genomsnitt Intel Core i7-1185G7 (168 - 230, n=27) | |
| Lenovo Yoga Slim 7-14ARE | |
| Dell XPS 13 9300 4K UHD | |
| Dell XPS 13 7390 Core i7-10710U | |
| Dell XPS 13 9300 Core i7-1065G7 | |
| Asus Zenbook S UX393JA | |
| HP Spectre x360 13-aw0013dx | |
| Lenovo Yoga Slim 7 14ARE05 82A20008GE | |
| HP Envy x360 13-ay0010nr | |
| Huawei MateBook X Pro 2020 i7 | |
| Lenovo ThinkPad P43s-20RH001FGE | |
| Dell XPS 13 9380 2019 | |
| Blender / v2.79 BMW27 CPU | |
| Huawei MateBook X Pro 2020 i7 | |
| Asus Zenbook S UX393JA | |
| Lenovo ThinkPad P43s-20RH001FGE | |
| Dell XPS 13 9300 4K UHD | |
| Dell XPS 13 9310 Core i7 4K | |
| Dell XPS 13 9310 Core i7 FHD | |
| HP Envy x360 13-ay0010nr | |
| Genomsnitt Intel Core i7-1185G7 (478 - 745, n=28) | |
| Dell XPS 13 7390 Core i7-10710U | |
| Razer Book 13 FHD | |
| Lenovo Yoga Slim 7 14ARE05 82A20008GE | |
| Lenovo Yoga Slim 7-14ARE | |
| 7-Zip 18.03 / 7z b 4 -mmt1 | |
| Razer Book 13 FHD | |
| Dell XPS 13 9310 Core i7 FHD | |
| Genomsnitt Intel Core i7-1185G7 (3678 - 5507, n=27) | |
| Dell XPS 13 9310 Core i7 4K | |
| Lenovo ThinkPad P43s-20RH001FGE | |
| Huawei MateBook X Pro 2020 i7 | |
| Dell XPS 13 9300 4K UHD | |
| Lenovo Yoga Slim 7-14ARE | |
| Asus Zenbook S UX393JA | |
| Dell XPS 13 7390 Core i7-10710U | |
| Lenovo Yoga Slim 7 14ARE05 82A20008GE | |
| HP Envy x360 13-ay0010nr | |
| 7-Zip 18.03 / 7z b 4 | |
| Lenovo Yoga Slim 7-14ARE | |
| Lenovo Yoga Slim 7 14ARE05 82A20008GE | |
| Razer Book 13 FHD | |
| Dell XPS 13 7390 Core i7-10710U | |
| Genomsnitt Intel Core i7-1185G7 (18812 - 27693, n=27) | |
| HP Envy x360 13-ay0010nr | |
| Dell XPS 13 9300 4K UHD | |
| Dell XPS 13 9310 Core i7 FHD | |
| Dell XPS 13 9310 Core i7 4K | |
| Lenovo ThinkPad P43s-20RH001FGE | |
| Asus Zenbook S UX393JA | |
| Huawei MateBook X Pro 2020 i7 | |
| Geekbench 5.5 / Single-Core | |
| Razer Book 13 FHD | |
| Dell XPS 13 9310 Core i7 FHD | |
| Dell XPS 13 9310 Core i7 4K | |
| Genomsnitt Intel Core i7-1185G7 (1398 - 1626, n=21) | |
| Asus Zenbook S UX393JA | |
| Dell XPS 13 9300 4K UHD | |
| Lenovo Yoga Slim 7-14ARE | |
| Lenovo Yoga Slim 7-14ARE | |
| Lenovo Yoga Slim 7 14ARE05 82A20008GE | |
| HP Envy x360 13-ay0010nr | |
| Huawei MateBook X Pro 2020 i7 | |
| Geekbench 5.5 / Multi-Core | |
| Lenovo Yoga Slim 7-14ARE | |
| Lenovo Yoga Slim 7-14ARE | |
| Lenovo Yoga Slim 7 14ARE05 82A20008GE | |
| Razer Book 13 FHD | |
| Dell XPS 13 9310 Core i7 4K | |
| Dell XPS 13 9310 Core i7 FHD | |
| Genomsnitt Intel Core i7-1185G7 (4620 - 5944, n=21) | |
| Dell XPS 13 9300 4K UHD | |
| Asus Zenbook S UX393JA | |
| HP Envy x360 13-ay0010nr | |
| Huawei MateBook X Pro 2020 i7 | |
| HWBOT x265 Benchmark v2.2 / 4k Preset | |
| Lenovo Yoga Slim 7-14ARE | |
| Lenovo Yoga Slim 7 14ARE05 82A20008GE | |
| Razer Book 13 FHD | |
| HP Envy x360 13-ay0010nr | |
| Genomsnitt Intel Core i7-1185G7 (5.02 - 8.13, n=27) | |
| Dell XPS 13 9300 4K UHD | |
| Dell XPS 13 7390 Core i7-10710U | |
| Dell XPS 13 9310 Core i7 FHD | |
| Dell XPS 13 9310 Core i7 4K | |
| Lenovo ThinkPad P43s-20RH001FGE | |
| Asus Zenbook S UX393JA | |
| Huawei MateBook X Pro 2020 i7 | |
| LibreOffice / 20 Documents To PDF | |
| Dell XPS 13 9300 4K UHD | |
| Lenovo Yoga Slim 7 14ARE05 82A20008GE | |
| HP Envy x360 13-ay0010nr | |
| Lenovo Yoga Slim 7-14ARE | |
| Huawei MateBook X Pro 2020 i7 | |
| Genomsnitt Intel Core i7-1185G7 (41.3 - 61.7, n=26) | |
| Razer Book 13 FHD | |
| Asus Zenbook S UX393JA | |
| Dell XPS 13 9310 Core i7 4K | |
| Dell XPS 13 9310 Core i7 FHD | |
| R Benchmark 2.5 / Overall mean | |
| Dell XPS 13 9300 4K UHD | |
| Asus Zenbook S UX393JA | |
| Huawei MateBook X Pro 2020 i7 | |
| HP Envy x360 13-ay0010nr | |
| Lenovo Yoga Slim 7 14ARE05 82A20008GE | |
| Lenovo Yoga Slim 7-14ARE | |
| Dell XPS 13 9310 Core i7 4K | |
| Dell XPS 13 9310 Core i7 FHD | |
| Genomsnitt Intel Core i7-1185G7 (0.55 - 0.615, n=27) | |
| Razer Book 13 FHD | |
Cinebench R15: CPU Multi 64Bit | CPU Single 64Bit
Blender: v2.79 BMW27 CPU
7-Zip 18.03: 7z b 4 -mmt1 | 7z b 4
Geekbench 5.5: Single-Core | Multi-Core
HWBOT x265 Benchmark v2.2: 4k Preset
LibreOffice : 20 Documents To PDF
R Benchmark 2.5: Overall mean
* ... mindre är bättre
| PCMark 8 Home Score Accelerated v2 | 3765 poäng | |
| PCMark 8 Work Score Accelerated v2 | 2493 poäng | |
| PCMark 10 Score | 4872 poäng | |
Hjälp | ||
| DPC Latencies / LatencyMon - interrupt to process latency (max), Web, Youtube, Prime95 | |
| Dell XPS 13 9300 Core i7-1065G7 | |
| Asus Zenbook S UX393JA | |
| Lenovo Yoga Slim 7-14ARE | |
| Dell XPS 13 9310 Core i7 4K | |
| Dell XPS 13 9310 Core i7 FHD | |
* ... mindre är bättre
| Dell XPS 13 9310 Core i7 4K Micron 2300 512GB MTFDHBA512TDV | Asus Zenbook S UX393JA Intel SSD 660p 1TB SSDPEKNW010T8 | Huawei MateBook X Pro 2020 i7 Samsung PM981a MZVLB1T0HBLR | Dell XPS 13 9300 Core i7-1065G7 Intel SSDPEMKF512G8 NVMe SSD | Lenovo Yoga Slim 7-14ARE Samsung SSD PM981a MZVLB512HBJQ | HP Spectre x360 13-aw0013dx Intel Optane Memory H10 with Solid State Storage 32GB + 512GB HBRPEKNX0202A(L/H) | |
|---|---|---|---|---|---|---|
| AS SSD | -16% | 45% | -21% | 23% | -36% | |
| Seq Read (MB/s) | 2144 | 1405 -34% | 2737 28% | 1956 -9% | 1658 -23% | 1039 -52% |
| Seq Write (MB/s) | 1389 | 1062 -24% | 2530 82% | 1227 -12% | 2464 77% | 310.1 -78% |
| 4K Read (MB/s) | 49.77 | 50.8 2% | 54 8% | 63 27% | 59.5 20% | 76 53% |
| 4K Write (MB/s) | 105 | 124.9 19% | 152.5 45% | 156.6 49% | 128.6 22% | 118 12% |
| 4K-64 Read (MB/s) | 855 | 590 -31% | 2011 135% | 475.6 -44% | 1576 84% | 371.8 -57% |
| 4K-64 Write (MB/s) | 1660 | 840 -49% | 1260 -24% | 539 -68% | 1986 20% | 469.5 -72% |
| Access Time Read * (ms) | 0.058 | 0.041 29% | 0.066 -14% | 0.042 28% | 0.049 16% | 0.067 -16% |
| Access Time Write * (ms) | 0.272 | 0.118 57% | 0.024 91% | 0.105 61% | 0.087 68% | 0.138 49% |
| Score Read (Points) | 1119 | 781 -30% | 2339 109% | 734 -34% | 1802 61% | 552 -51% |
| Score Write (Points) | 1904 | 1071 -44% | 1666 -12% | 818 -57% | 2361 24% | 618 -68% |
| Score Total (Points) | 3570 | 2251 -37% | 5191 45% | 1915 -46% | 5133 44% | 1448 -59% |
| Copy ISO MB/s (MB/s) | 1929 | 1459 -24% | 1022 -47% | 1588 -18% | 764 -60% | |
| Copy Program MB/s (MB/s) | 1012 | 600 -41% | 302.8 -70% | 550 -46% | 465.8 -54% | |
| Copy Game MB/s (MB/s) | 1737 | 1411 -19% | 491.4 -72% | 1329 -23% | 764 -56% | |
| CrystalDiskMark 5.2 / 6 | -6% | 24% | 27% | 35% | 6% | |
| Write 4K (MB/s) | 86 | 129.5 51% | 165.6 93% | 186.8 117% | 146.1 70% | 112.6 31% |
| Read 4K (MB/s) | 40.11 | 54 35% | 50.2 25% | 71.4 78% | 47.18 18% | 131 227% |
| Write Seq (MB/s) | 1738 | 1265 -27% | 1905 10% | 1203 -31% | 2896 67% | 458.9 -74% |
| Read Seq (MB/s) | 1553 | 1410 -9% | 1669 7% | 2600 67% | 2754 77% | 1355 -13% |
| Write 4K Q32T1 (MB/s) | 454.9 | 420.3 -8% | 474.6 4% | 514 13% | 425.8 -6% | 341.3 -25% |
| Read 4K Q32T1 (MB/s) | 385.4 | 357.7 -7% | 508 32% | 570 48% | 514 33% | 320.6 -17% |
| Write Seq Q32T1 (MB/s) | 2784 | 1799 -35% | 3007 8% | 786 -72% | 2989 7% | 1219 -56% |
| Read Seq Q32T1 (MB/s) | 3217 | 1616 -50% | 3556 11% | 2947 -8% | 3568 11% | 2462 -23% |
| Totalt genomsnitt (program/inställningar) | -11% /
-13% | 35% /
36% | 3% /
-4% | 29% /
27% | -15% /
-21% |
* ... mindre är bättre

DiskSpd Read Loop, Queue Depth 8
| 3DMark 11 | |
| 1280x720 Performance GPU | |
| Dell XPS 15 9500 Core i7 4K UHD | |
| Razer Book 13 FHD | |
| Dell XPS 13 9310 Core i7 FHD | |
| Genomsnitt Intel Iris Xe Graphics G7 96EUs (2867 - 7676, n=209) | |
| Lenovo Yoga Slim 7-14ARE | |
| Dell XPS 13 9310 Core i7 4K | |
| HP Envy 13-ba0001ng | |
| Dell XPS 13 9300 Core i7-1065G7 | |
| Lenovo IdeaPad S540-13ARE-82DL000YGE | |
| Dell XPS 13 9300 4K UHD | |
| Huawei MateBook X Pro 2020 i7 | |
| Dell XPS 13 7390 Core i7-10710U | |
| Dell XPS 13 9380 2019 | |
| 1280x720 Performance Combined | |
| Dell XPS 15 9500 Core i7 4K UHD | |
| Razer Book 13 FHD | |
| Genomsnitt Intel Iris Xe Graphics G7 96EUs (1926 - 7661, n=208) | |
| Dell XPS 13 9310 Core i7 4K | |
| HP Envy 13-ba0001ng | |
| Lenovo Yoga Slim 7-14ARE | |
| Dell XPS 13 9300 Core i7-1065G7 | |
| Dell XPS 13 9310 Core i7 FHD | |
| Huawei MateBook X Pro 2020 i7 | |
| Lenovo IdeaPad S540-13ARE-82DL000YGE | |
| Dell XPS 13 9300 4K UHD | |
| Dell XPS 13 7390 Core i7-10710U | |
| Dell XPS 13 9380 2019 | |
| 3DMark 11 Performance | 5461 poäng | |
| 3DMark Cloud Gate Standard Score | 15779 poäng | |
| 3DMark Fire Strike Score | 4821 poäng | |
| 3DMark Time Spy Score | 1749 poäng | |
Hjälp | ||
| Final Fantasy XV Benchmark | |
| 1280x720 Lite Quality | |
| Razer Book 13 FHD | |
| Genomsnitt Intel Iris Xe Graphics G7 96EUs (14.9 - 56.5, n=189) | |
| Lenovo Yoga Slim 7-14ARE | |
| Dell XPS 13 9310 Core i7 FHD | |
| Dell XPS 13 9310 Core i7 4K | |
| Lenovo IdeaPad S540-13ARE-82DL000YGE | |
| Asus Zenbook S UX393JA | |
| 1920x1080 Standard Quality | |
| Razer Book 13 FHD | |
| Genomsnitt Intel Iris Xe Graphics G7 96EUs (10.5 - 31.2, n=185) | |
| Dell XPS 13 9310 Core i7 FHD | |
| Lenovo Yoga Slim 7-14ARE | |
| Dell XPS 13 9310 Core i7 4K | |
| Lenovo IdeaPad S540-13ARE-82DL000YGE | |
| Asus Zenbook S UX393JA | |
| 1920x1080 High Quality | |
| Razer Book 13 FHD | |
| Genomsnitt Intel Iris Xe Graphics G7 96EUs (8.15 - 27.8, n=178) | |
| Dell XPS 13 9310 Core i7 FHD | |
| Dell XPS 13 9310 Core i7 4K | |
| Lenovo Yoga Slim 7-14ARE | |
| Lenovo IdeaPad S540-13ARE-82DL000YGE | |
| Asus Zenbook S UX393JA | |
| GTA V | |
| 1024x768 Lowest Settings possible | |
| Lenovo Yoga Slim 7-14ARE | |
| Razer Book 13 FHD | |
| Genomsnitt Intel Iris Xe Graphics G7 96EUs (52 - 166.4, n=168) | |
| Dell XPS 13 9310 Core i7 FHD | |
| Dell XPS 13 9310 Core i7 4K | |
| 1920x1080 Lowest Settings possible | |
| Genomsnitt Intel Iris Xe Graphics G7 96EUs (34.7 - 132.1, n=141) | |
| Dell XPS 13 9310 Core i7 FHD | |
| Razer Book 13 FHD | |
| Lenovo Yoga Slim 7-14ARE | |
| Dell XPS 13 9310 Core i7 4K | |
| 1920x1080 Normal/Off AF:4x | |
| Lenovo Yoga Slim 7-14ARE | |
| Dell XPS 13 9310 Core i7 FHD | |
| Genomsnitt Intel Iris Xe Graphics G7 96EUs (20 - 119.3, n=142) | |
| Razer Book 13 FHD | |
| Dell XPS 13 9310 Core i7 4K | |
| 1920x1080 High/On (Advanced Graphics Off) AA:2xMSAA + FX AF:8x | |
| Lenovo Yoga Slim 7-14ARE | |
| Razer Book 13 FHD | |
| Dell XPS 13 9310 Core i7 FHD | |
| Genomsnitt Intel Iris Xe Graphics G7 96EUs (9.39 - 51.6, n=162) | |
| Dell XPS 13 9310 Core i7 4K | |
| 1920x1080 Highest AA:4xMSAA + FX AF:16x | |
| Razer Book 13 FHD | |
| Lenovo Yoga Slim 7-14ARE | |
| Dell XPS 13 9310 Core i7 FHD | |
| Dell XPS 13 9310 Core i7 4K | |
| Genomsnitt Intel Iris Xe Graphics G7 96EUs (4.13 - 22.9, n=156) | |
| låg | med. | hög | ultra | QHD | 4K | |
|---|---|---|---|---|---|---|
| GTA V (2015) | 80.8 | 64.6 | 20.5 | 9.75 | ||
| The Witcher 3 (2015) | 107 | 61.9 | 34.5 | 15.3 | ||
| Dota 2 Reborn (2015) | 80.7 | 51.4 | 38.2 | 38.6 | 20 | |
| Final Fantasy XV Benchmark (2018) | 31.3 | 18.8 | 14.6 | 11.4 | 7.54 | |
| X-Plane 11.11 (2018) | 26 | 27.8 | 31.8 | 14.9 |
| Dell XPS 13 9310 Core i7 4K Iris Xe G7 96EUs, i7-1185G7, Micron 2300 512GB MTFDHBA512TDV | Asus Zenbook S UX393JA Iris Plus Graphics G7 (Ice Lake 64 EU), i7-1065G7, Intel SSD 660p 1TB SSDPEKNW010T8 | Huawei MateBook X Pro 2020 i7 GeForce MX250, i7-10510U, Samsung PM981a MZVLB1T0HBLR | Dell XPS 13 9300 Core i7-1065G7 Iris Plus Graphics G7 (Ice Lake 64 EU), i7-1065G7, Intel SSDPEMKF512G8 NVMe SSD | Lenovo Yoga Slim 7-14ARE Vega 8, R7 4800U, Samsung SSD PM981a MZVLB512HBJQ | HP Spectre x360 13-aw0013dx Iris Plus Graphics G7 (Ice Lake 64 EU), i7-1065G7, Intel Optane Memory H10 with Solid State Storage 32GB + 512GB HBRPEKNX0202A(L/H) | |
|---|---|---|---|---|---|---|
| Noise | -10% | -12% | -7% | 0% | -2% | |
| av / miljö * (dB) | 27.7 | 26.9 3% | 29.6 -7% | 28.3 -2% | 26.3 5% | 28.5 -3% |
| Idle Minimum * (dB) | 27.8 | 26.9 3% | 29.6 -6% | 28.3 -2% | 26.5 5% | 28.5 -3% |
| Idle Average * (dB) | 27.8 | 29 -4% | 29.6 -6% | 28.3 -2% | 26.5 5% | 28.5 -3% |
| Idle Maximum * (dB) | 27.8 | 31.1 -12% | 30.3 -9% | 28.3 -2% | 26.5 5% | 28.5 -3% |
| Load Average * (dB) | 27.9 | 37.7 -35% | 38 -36% | 32.5 -16% | 31.8 -14% | 28.5 -2% |
| Witcher 3 ultra * (dB) | 32.8 | 40.2 -23% | 38 -16% | 39.3 -20% | 35.9 -9% | 35.3 -8% |
| Load Maximum * (dB) | 37 | 38.1 -3% | 38 -3% | 39.3 -6% | 35.9 3% | 35.3 5% |
* ... mindre är bättre
Ljudnivå
| Låg belastning |
| 27.8 / 27.8 / 27.8 dB(A) |
| Hög belastning |
| 27.9 / 37 dB(A) |
 | ||
30 dB tyst 40 dB(A) hörbar 50 dB(A) högt ljud |
||
min: | ||
(-) Den maximala temperaturen på ovansidan är 47 °C / 117 F, jämfört med genomsnittet av 35.9 °C / 97 F , allt från 21.4 till 59 °C för klassen Subnotebook.
(±) Botten värms upp till maximalt 45 °C / 113 F, jämfört med genomsnittet av 39.2 °C / 103 F
(+) Vid tomgångsbruk är medeltemperaturen för ovansidan 26.1 °C / 79 F, jämfört med enhetsgenomsnittet på 30.8 °C / ### class_avg_f### F.
(±) När du spelar The Witcher 3 är medeltemperaturen för ovansidan 34.4 °C / 94 F, jämfört med enhetsgenomsnittet på 30.8 °C / ## #class_avg_f### F.
(+) Handledsstöden och pekplattan är kallare än hudtemperaturen med maximalt 28.8 °C / 83.8 F och är därför svala att ta på.
(±) Medeltemperaturen för handledsstödsområdet på liknande enheter var 28.2 °C / 82.8 F (-0.6 °C / -1 F).
Dell XPS 13 9310 Core i7 4K ljudanalys
(+) | högtalare kan spela relativt högt (84.6 dB)
Bas 100 - 315 Hz
(±) | reducerad bas - i genomsnitt 13.1% lägre än medianen
(±) | linjäriteten för basen är genomsnittlig (11.1% delta till föregående frekvens)
Mellan 400 - 2000 Hz
(+) | balanserad mellan - endast 4.3% från medianen
(+) | mids är linjära (4.2% delta till föregående frekvens)
Högsta 2 - 16 kHz
(+) | balanserade toppar - endast 1.5% från medianen
(+) | toppar är linjära (3.8% delta till föregående frekvens)
Totalt 100 - 16 000 Hz
(+) | det totala ljudet är linjärt (10.9% skillnad mot median)
Jämfört med samma klass
» 10% av alla testade enheter i den här klassen var bättre, 3% liknande, 87% sämre
» Den bästa hade ett delta på 5%, genomsnittet var 18%, sämst var 53%
Jämfört med alla testade enheter
» 6% av alla testade enheter var bättre, 2% liknande, 92% sämre
» Den bästa hade ett delta på 4%, genomsnittet var 23%, sämst var 134%
Apple MacBook 12 (Early 2016) 1.1 GHz ljudanalys
(+) | högtalare kan spela relativt högt (83.6 dB)
Bas 100 - 315 Hz
(±) | reducerad bas - i genomsnitt 11.3% lägre än medianen
(±) | linjäriteten för basen är genomsnittlig (14.2% delta till föregående frekvens)
Mellan 400 - 2000 Hz
(+) | balanserad mellan - endast 2.4% från medianen
(+) | mids är linjära (5.5% delta till föregående frekvens)
Högsta 2 - 16 kHz
(+) | balanserade toppar - endast 2% från medianen
(+) | toppar är linjära (4.5% delta till föregående frekvens)
Totalt 100 - 16 000 Hz
(+) | det totala ljudet är linjärt (10.2% skillnad mot median)
Jämfört med samma klass
» 7% av alla testade enheter i den här klassen var bättre, 2% liknande, 90% sämre
» Den bästa hade ett delta på 5%, genomsnittet var 18%, sämst var 53%
Jämfört med alla testade enheter
» 5% av alla testade enheter var bättre, 1% liknande, 94% sämre
» Den bästa hade ett delta på 4%, genomsnittet var 23%, sämst var 134%
| Av/Standby | |
| Låg belastning | |
| Hög belastning |
|
Förklaring:
min: | |
| Dell XPS 13 9310 Core i7 4K i7-1185G7, Iris Xe G7 96EUs, Micron 2300 512GB MTFDHBA512TDV, IPS, 3840x2400, 13.4" | Asus Zenbook S UX393JA i7-1065G7, Iris Plus Graphics G7 (Ice Lake 64 EU), Intel SSD 660p 1TB SSDPEKNW010T8, IPS, 3300x2200, 13.9" | Huawei MateBook X Pro 2020 i7 i7-10510U, GeForce MX250, Samsung PM981a MZVLB1T0HBLR, LTPS, 3000x2000, 13.9" | Dell XPS 13 9300 Core i7-1065G7 i7-1065G7, Iris Plus Graphics G7 (Ice Lake 64 EU), Intel SSDPEMKF512G8 NVMe SSD, IPS, 1920x1200, 13.4" | Lenovo Yoga Slim 7-14ARE R7 4800U, Vega 8, Samsung SSD PM981a MZVLB512HBJQ, IPS, 1920x1080, 14" | HP Spectre x360 13-aw0013dx i7-1065G7, Iris Plus Graphics G7 (Ice Lake 64 EU), Intel Optane Memory H10 with Solid State Storage 32GB + 512GB HBRPEKNX0202A(L/H), IPS, 1920x1080, 13.3" | |
|---|---|---|---|---|---|---|
| Power Consumption | 3% | -17% | 12% | 0% | 17% | |
| Idle Minimum * (Watt) | 4.3 | 4.1 5% | 4.3 -0% | 4.2 2% | 4 7% | 3.9 9% |
| Idle Average * (Watt) | 8.3 | 7.5 10% | 8.5 -2% | 6.9 17% | 6.3 24% | 6.3 24% |
| Idle Maximum * (Watt) | 8.8 | 8.5 3% | 12 -36% | 7.5 15% | 7.7 12% | 6.8 23% |
| Load Average * (Watt) | 46.2 | 36.8 20% | 54.8 -19% | 33.3 28% | 48.3 -5% | 32.6 29% |
| Witcher 3 ultra * (Watt) | 42.2 | 39.2 7% | 47.1 -12% | 37.1 12% | 49 -16% | 25.6 39% |
| Load Maximum * (Watt) | 47.3 | 61.6 -30% | 61.5 -30% | 48.4 -2% | 57.6 -22% | 59 -25% |
* ... mindre är bättre
| Dell XPS 13 9310 Core i7 4K i7-1185G7, Iris Xe G7 96EUs, 52 Wh | Asus Zenbook S UX393JA i7-1065G7, Iris Plus Graphics G7 (Ice Lake 64 EU), 67 Wh | Huawei MateBook X Pro 2020 i7 i7-10510U, GeForce MX250, 57.4 Wh | Dell XPS 13 9300 Core i7-1065G7 i7-1065G7, Iris Plus Graphics G7 (Ice Lake 64 EU), 52 Wh | Lenovo Yoga Slim 7-14ARE R7 4800U, Vega 8, 61 Wh | HP Spectre x360 13-aw0013dx i7-1065G7, Iris Plus Graphics G7 (Ice Lake 64 EU), 60 Wh | |
|---|---|---|---|---|---|---|
| Batteridrifttid | 15% | 44% | 76% | 43% | 38% | |
| WiFi v1.3 (h) | 7.2 | 8.3 15% | 10.4 44% | 12.7 76% | 10.3 43% | 9.9 38% |
| Reader / Idle (h) | 38.4 | 27.1 | 37.1 | |||
| Load (h) | 2.7 | 2.4 | 1.3 | 2.7 |
För
Emot
Läs den fullständiga versionen av den här recensionen på engelska här.
Från ett prestandaperspektiv är inte Core i7-1185G7 särskilt mycket av en uppgradering jämfört med Core i7-1165G7 och vi rekommenderar därför att du sparar några kronor och väljer Core i7-1165G7. Pengarna du sparar kan du istället lägga på uppgraderingar som gör större skillnad såsom mer RAM eller lagring, eller kanske på en mer högupplöst 4K-skärm. Med en 4K-skärm blir dock batteritiden några timmar kortare än på FHD-alternativet, vilket tyvärr är priset man får betala för tätare pixlar.
Hade vi kunnat ändra en sak på XPS 13 9310 hade det varit ett alternativ för mer stabila klockfrekvenser i High Performance-läget. De varierande klockfrekvenserna fungerar bra för att maximera den genomsnittliga CPU-prestandan om kyllösningen är en begränsande faktor, men prestandaskillnaderna som detta resulterar i kan vara till nackdel för viss mjukvara.
Det är mer värt att investera i ytterligare RAM eller lagring alternativt i en högupplöst 4K-skärm än att välja Core i7-1185G7, då prestandafördelarna jämfört med Core i7-1165G7 är små som bäst.
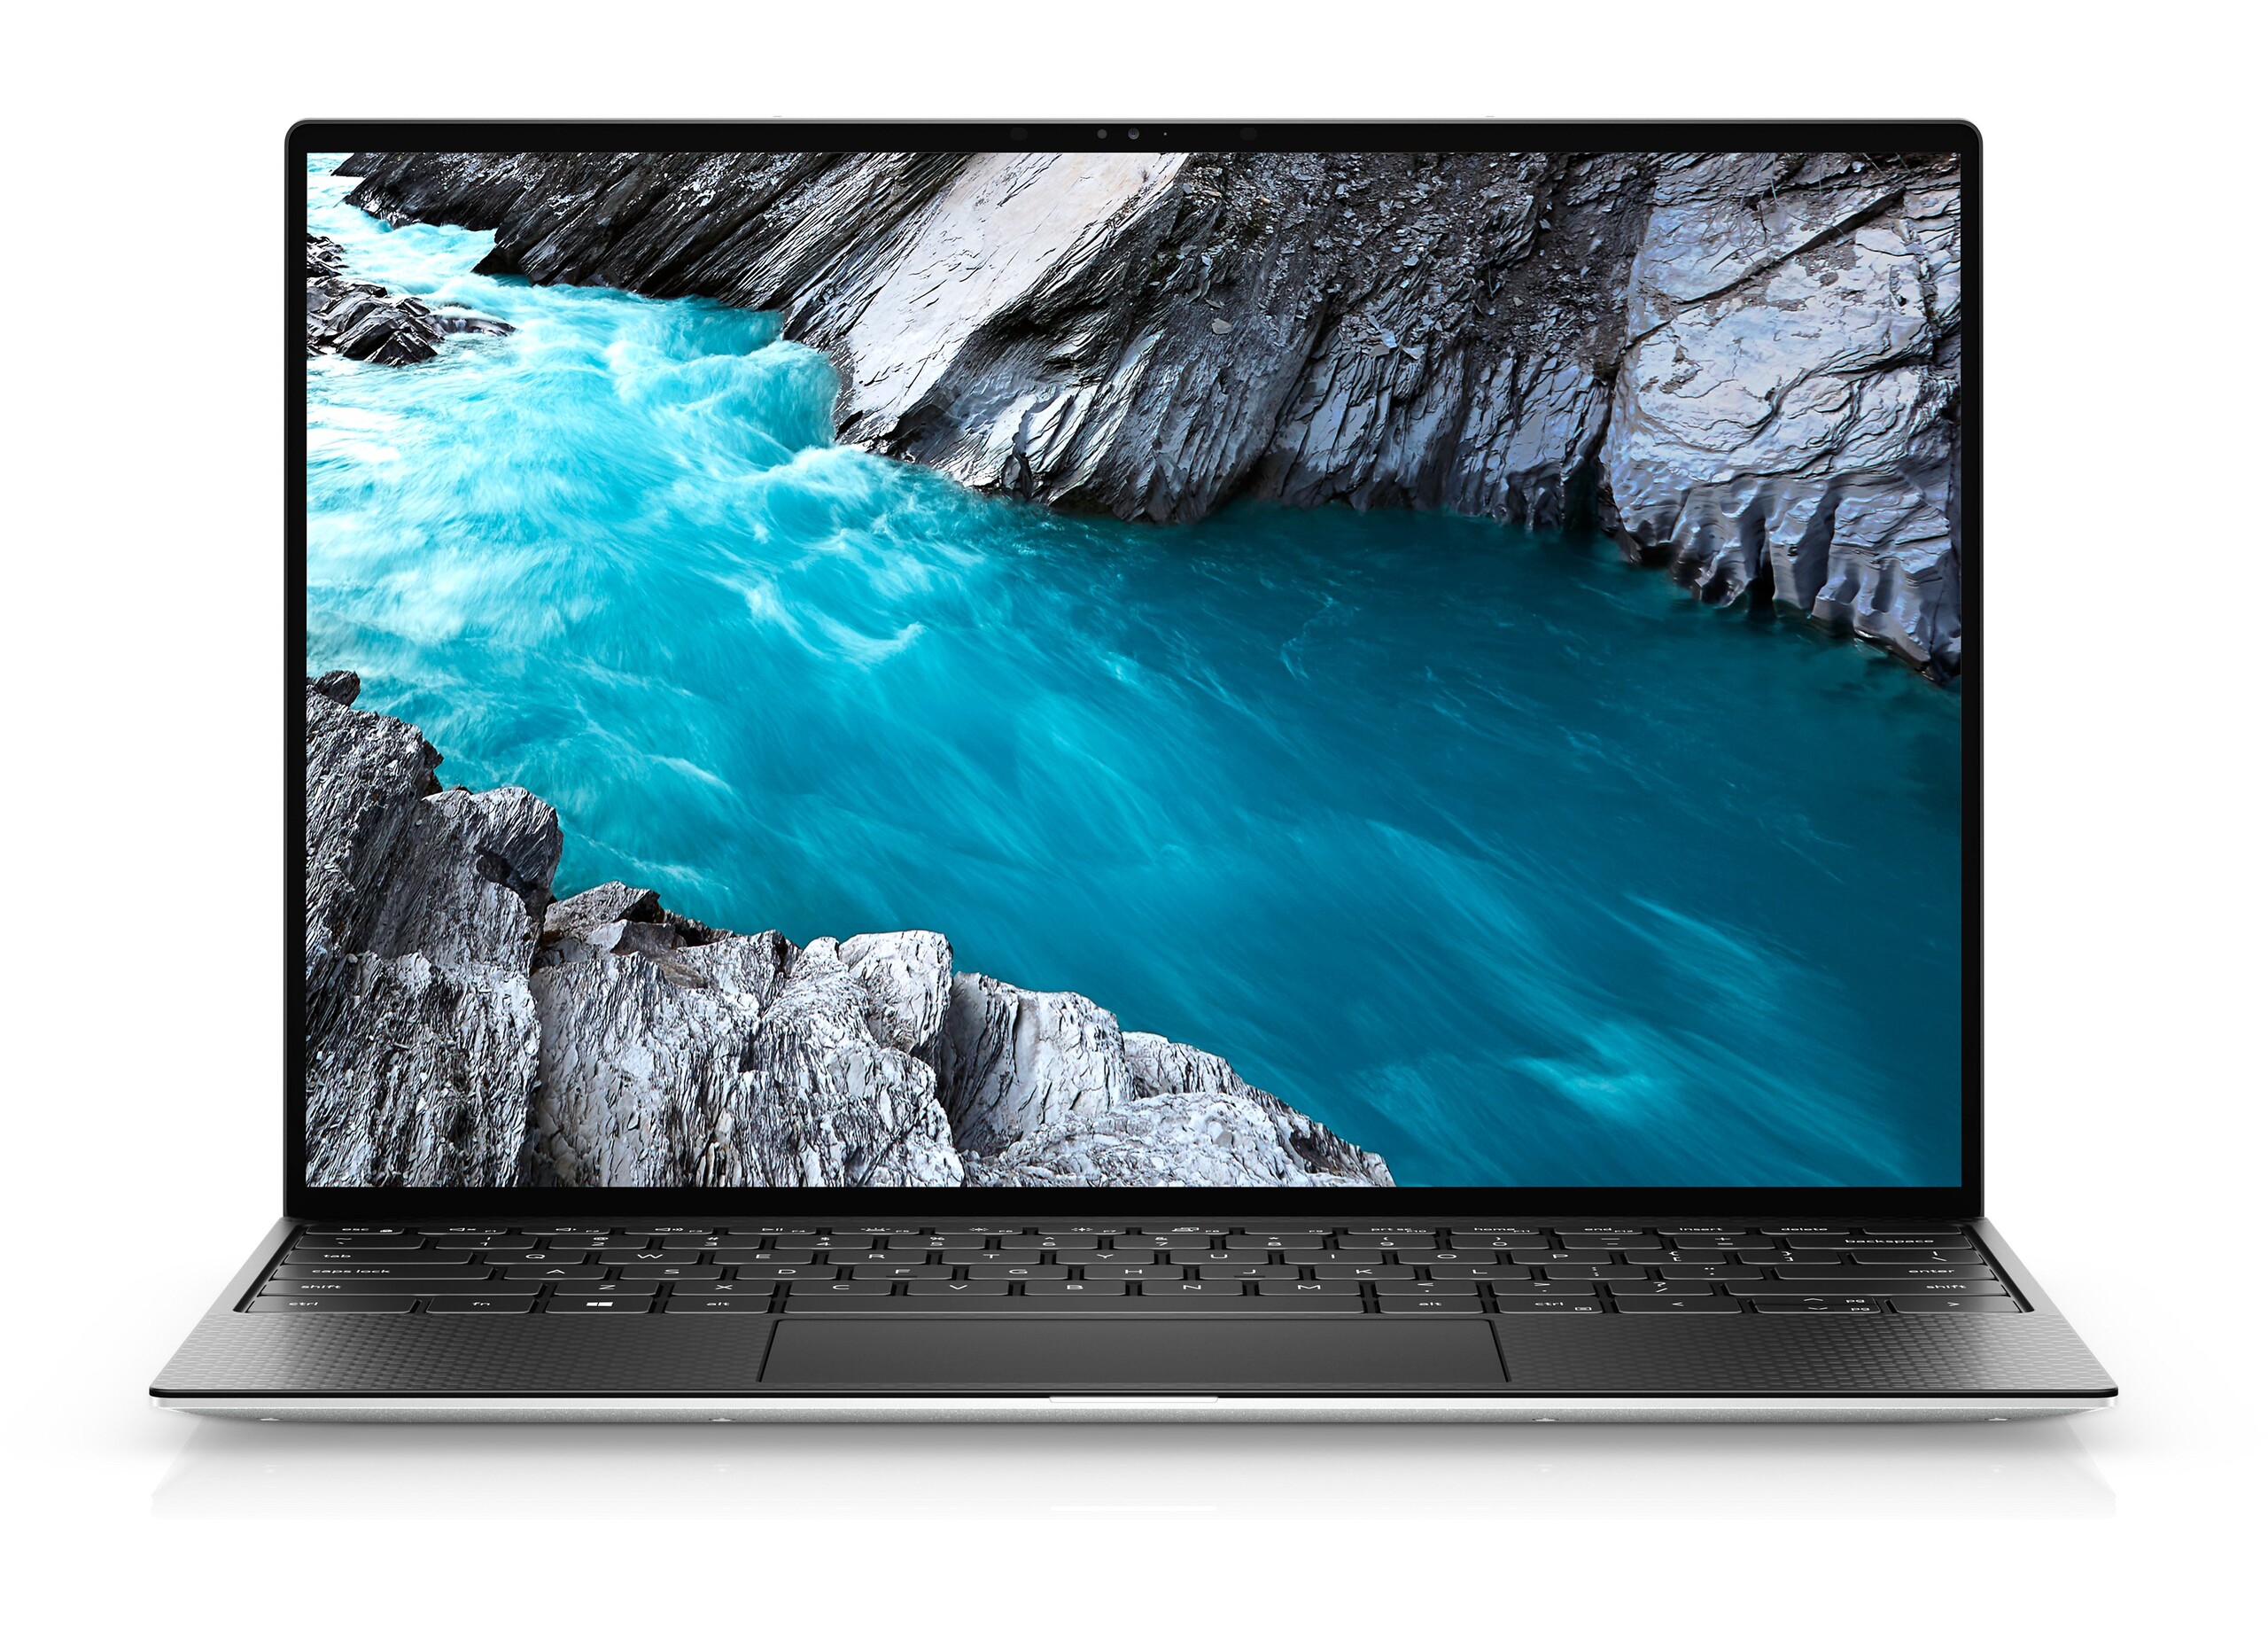
Dell XPS 13 9310 Core i7 4K
- 05/31/2021 v7 (old)
Allen Ngo
Price comparison
