Test: Apple MacBook Air 2020 M1 Entry: Apples M1 CPU sätter Intel och AMD på plats (Sammanfattning)
Testgrupp
Gradering | Datum | Modell | Vikt | Höjd | Storlek | Upplösning | Pris |
|---|---|---|---|---|---|---|---|
| 91.1 % v7 (old) | 12/2020 | Apple MacBook Air 2020 M1 Entry M1, M1 7-Core GPU | 1.3 kg | 16.1 mm | 13.30" | 2560x1600 | |
| 88.1 % v7 (old) | 12/2020 | Dell XPS 13 9310 Core i7 FHD i7-1165G7, Iris Xe G7 96EUs | 1.3 kg | 14.8 mm | 13.40" | 1920x1200 | |
| 87.9 % v7 (old) | 02/2021 | Lenovo ThinkPad X13 Yoga 20SX0004GE i7-10510U, UHD Graphics 620 | 1.3 kg | 15.95 mm | 13.30" | 1920x1080 | |
| 88.8 % v7 (old) | 10/2019 | Lenovo ThinkPad X395 R3 PRO 3300U, Vega 6 | 1.3 kg | 16.9 mm | 13.30" | 1920x1080 | |
| 89.5 % v7 (old) | Lenovo ThinkPad X13-20UGS00800 R7 PRO 4750U, Vega 7 | 1.3 kg | 16.9 mm | 13.30" | 1920x1080 | ||
| 90.7 % v7 (old) | 11/2020 | Apple iPad Air 4 2020 A14, A14 Bionic GPU | 458 g | 6.1 mm | 10.90" | 2360x1640 | |
| 89.3 % v7 (old) | 05/2020 | Apple iPad Pro 12.9 2020 A12Z Bionic, A12Z Bionic GPU | 641 g | 5.9 mm | 12.90" | 2732x2048 | |
| 85.4 % v7 (old) | 10/2019 | Apple iPad 7 2019 A10 Fusion, A10 Fusion GPU | 483 g | 7.5 mm | 10.20" | 2160x1620 |


| |||||||||||||||||||||||||
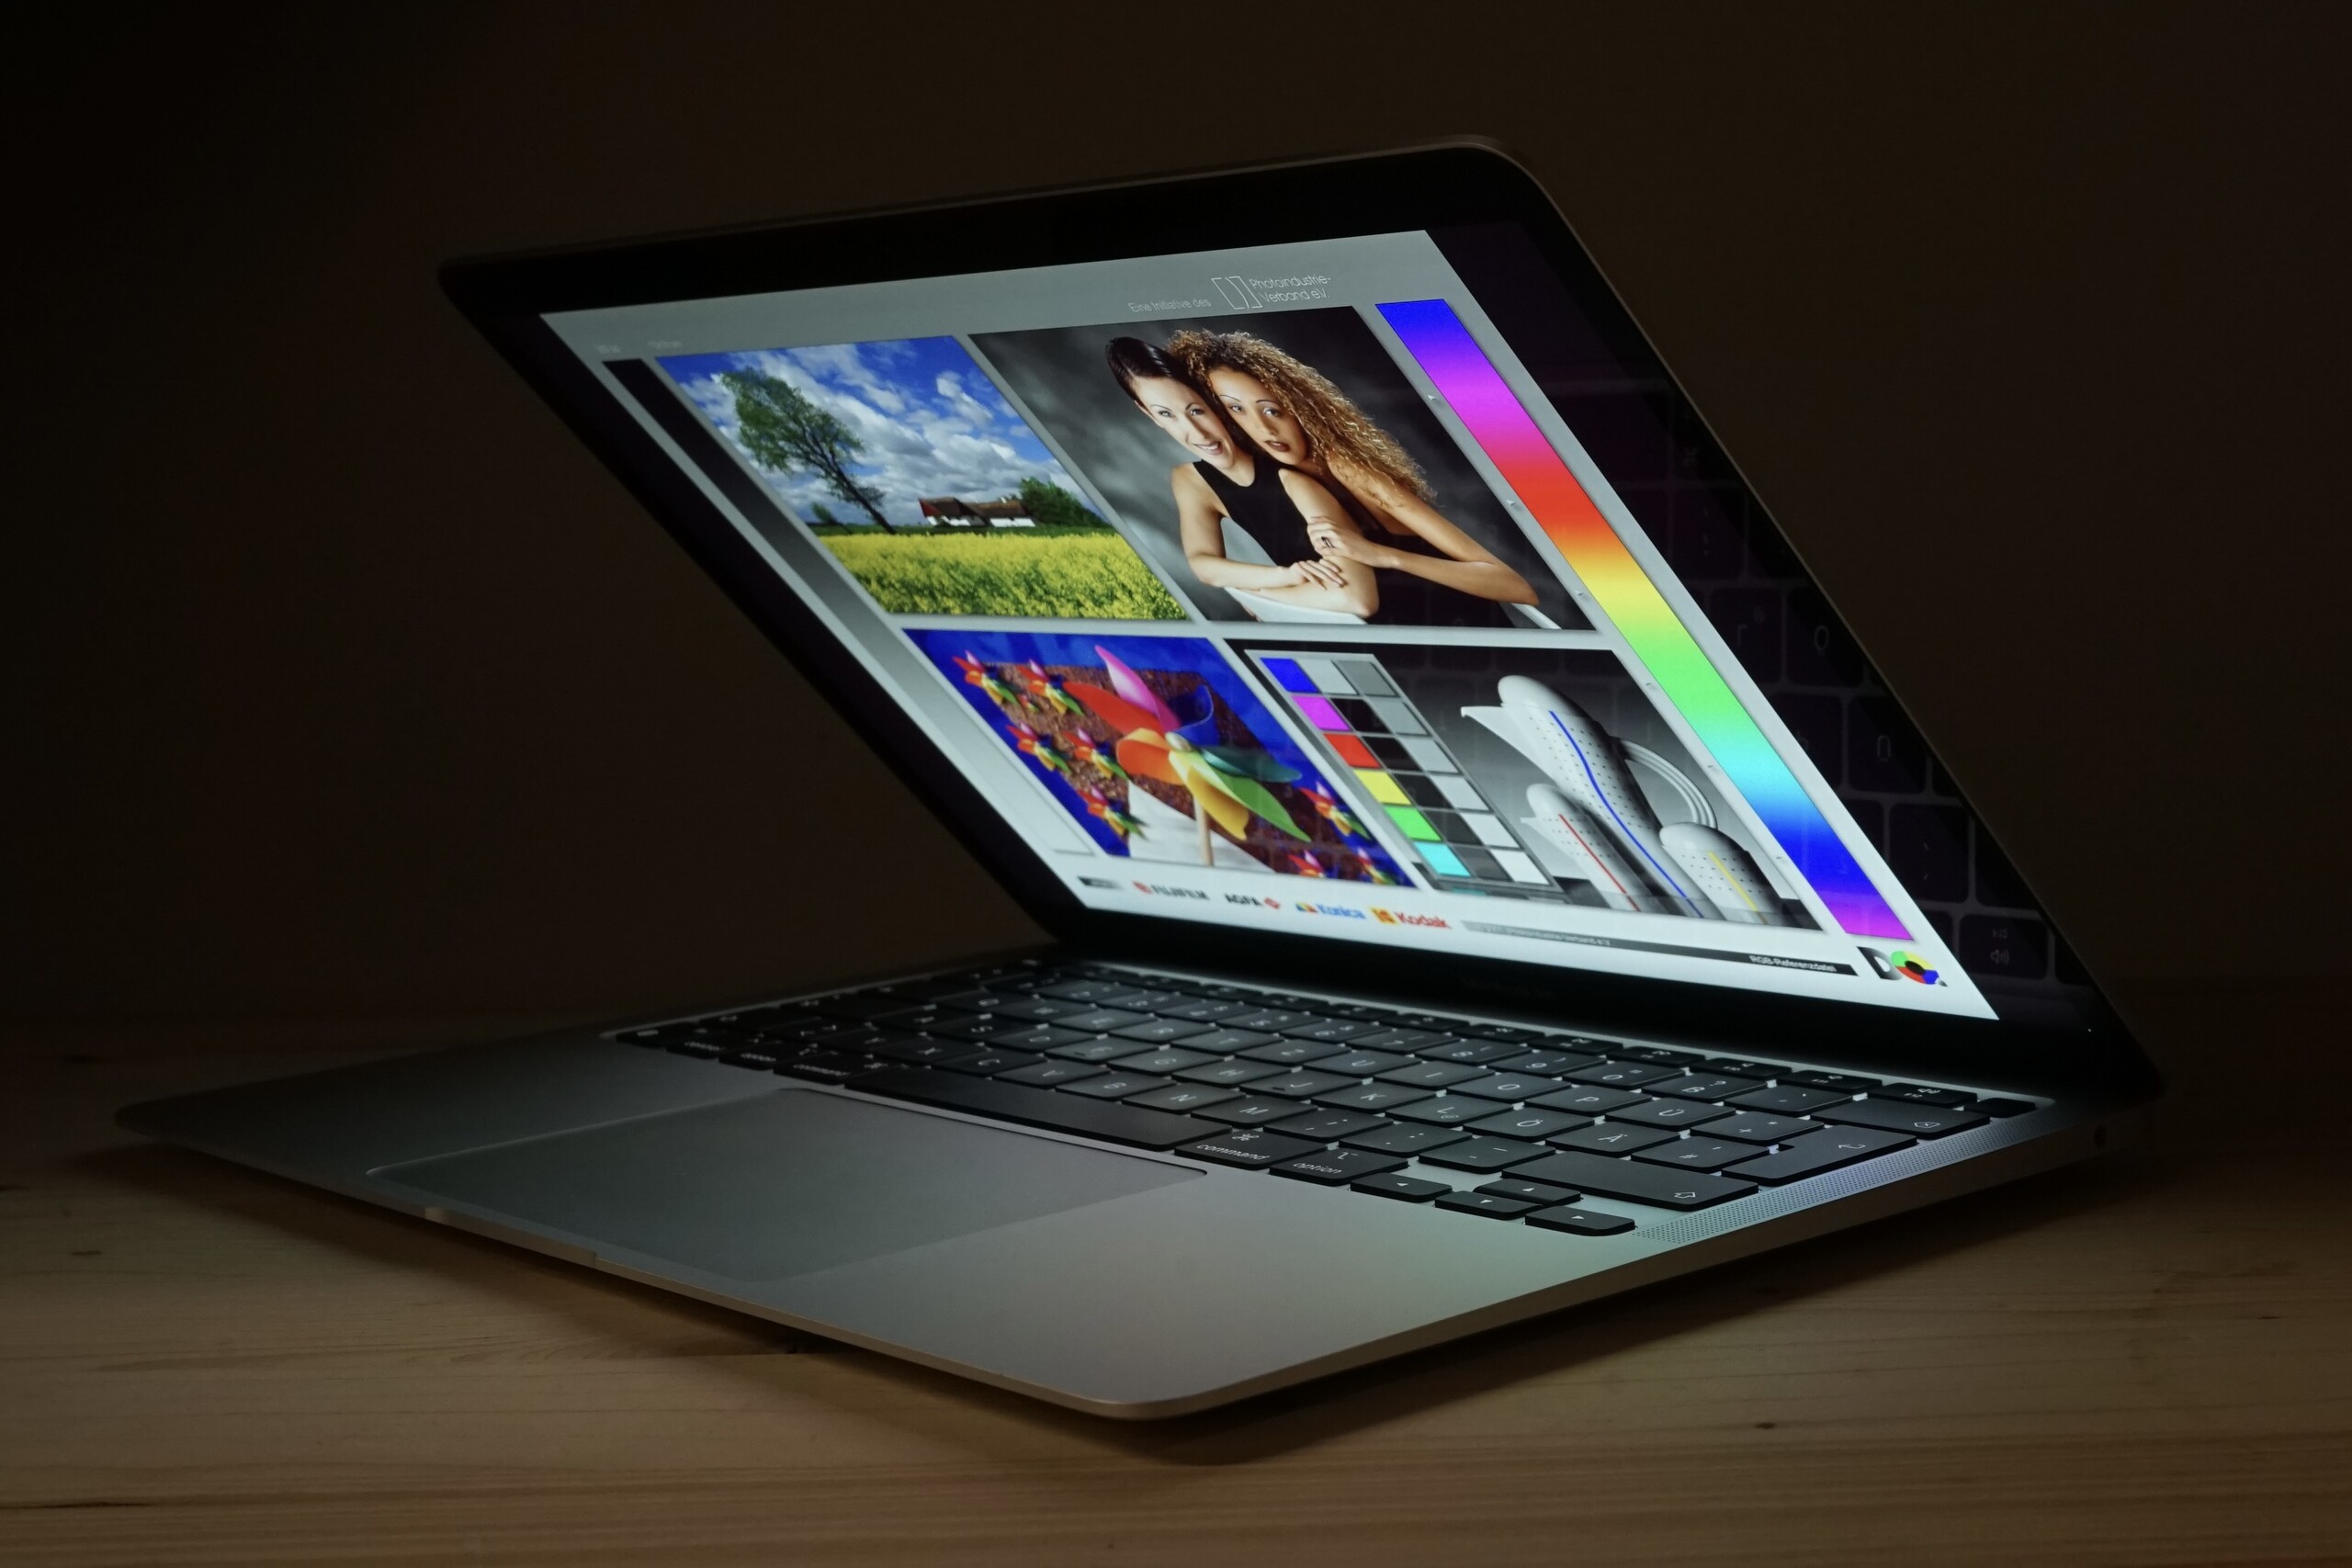
Distribution av ljusstyrkan: 91 %
Mitt på batteriet: 417 cd/m²
Kontrast: 1069:1 (Svärta: 0.39 cd/m²)
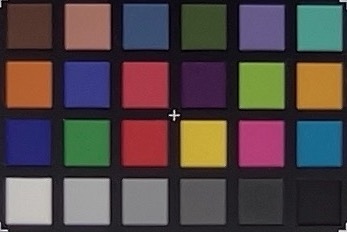
ΔE ColorChecker Calman: 1.12 | ∀{0.5-29.43 Ø4.73}
calibrated: 0.77
ΔE Greyscale Calman: 1.7 | ∀{0.09-98 Ø4.97}
99.8% sRGB (Calman 2D)
85.9% AdobeRGB 1998 (Argyll 3D)
100% sRGB (Argyll 3D)
98.6% Display P3 (Argyll 3D)
Gamma: 2207
CCT: 6870 K
| Apple MacBook Air 2020 M1 Entry IPS, 2560x1600, 13.3" | Dell XPS 13 9310 Core i7 FHD Sharp LQ134N1, IPS, 1920x1200, 13.4" | Lenovo ThinkPad X13 Yoga 20SX0004GE N133HCG-GR3, IPS, 1920x1080, 13.3" | Lenovo ThinkPad X395 LP133WF7-SPB1, IPS, 1920x1080, 13.3" | Lenovo ThinkPad X13-20UGS00800 B133HAK01.1, IPS LED, 1920x1080, 13.3" | Apple iPad Air 4 2020 IPS, 2360x1640, 10.9" | Apple iPad Pro 12.9 2020 Liquid Retina Display, IPS, 2732x2048, 12.9" | Apple iPad 7 2019 IPS, 2160x1620, 10.2" | |
|---|---|---|---|---|---|---|---|---|
| Display | -15% | -18% | -21% | -21% | ||||
| Display P3 Coverage (%) | 98.6 | 70.9 -28% | 67.2 -32% | 64.1 -35% | 64.8 -34% | |||
| sRGB Coverage (%) | 100 | 99.1 -1% | 98.1 -2% | 95.2 -5% | 95.6 -4% | |||
| AdobeRGB 1998 Coverage (%) | 85.9 | 72.9 -15% | 69 -20% | 65.8 -23% | 65.7 -24% | |||
| Response Times | -48% | -44% | -50% | -49% | -25% | -22% | 4% | |
| Response Time Grey 50% / Grey 80% * (ms) | 31 ? | 52 ? -68% | 56 ? -81% | 55 ? -77% | 56.8 ? -83% | 46.8 ? -51% | 46.8 ? -51% | 38 ? -23% |
| Response Time Black / White * (ms) | 26.1 ? | 33.2 ? -27% | 28 ? -7% | 32 ? -23% | 30 ? -15% | 25.6 ? 2% | 24.4 ? 7% | 18 ? 31% |
| PWM Frequency (Hz) | 118000 ? | 2475 ? | 58820 ? | |||||
| Screen | -56% | -12% | -46% | -110% | 3% | 10% | 11% | |
| Brightness middle (cd/m²) | 417 | 543.3 30% | 401 -4% | 356 -15% | 331 -21% | 509 22% | 625 50% | 499 20% |
| Brightness (cd/m²) | 395 | 524 33% | 383 -3% | 336 -15% | 315 -20% | 486 23% | 599 52% | 470 19% |
| Brightness Distribution (%) | 91 | 92 1% | 91 0% | 88 -3% | 90 -1% | 93 2% | 87 -4% | 87 -4% |
| Black Level * (cd/m²) | 0.39 | 0.38 3% | 0.16 59% | 0.16 59% | 0.21 46% | 0.39 -0% | 0.47 -21% | 0.49 -26% |
| Contrast (:1) | 1069 | 1430 34% | 2506 134% | 2225 108% | 1576 47% | 1305 22% | 1330 24% | 1018 -5% |
| Colorchecker dE 2000 * | 1.12 | 3.02 -170% | 2.6 -132% | 3.6 -221% | 6.1 -445% | 1.3 -16% | 1.3 -16% | 0.97 13% |
| Colorchecker dE 2000 max. * | 2.71 | 7.61 -181% | 4.2 -55% | 5.5 -103% | 10 -269% | 2.8 -3% | 2.7 -0% | 1.98 27% |
| Colorchecker dE 2000 calibrated * | 0.77 | 1.23 -60% | 0.9 -17% | 1.11 -44% | 1.2 -56% | |||
| Greyscale dE 2000 * | 1.7 | 5 -194% | 3.3 -94% | 4.7 -176% | 6.3 -271% | 2.2 -29% | 1.8 -6% | 0.9 47% |
| Gamma | 2207 0% | 2.02 109% | 2.01 109% | 2.92 75% | 2.77 79% | 2.21 100% | 2.23 99% | 2.135 103% |
| CCT | 6870 95% | 6550 99% | 6076 107% | 6222 104% | 6938 94% | 6833 95% | 6765 96% | 6571 99% |
| Color Space (Percent of AdobeRGB 1998) (%) | 66.8 | 62.7 | 61 | 60.7 | 99.3 | |||
| Color Space (Percent of sRGB) (%) | 99.6 | 98.1 | 96 | 95.4 | ||||
| Totalt genomsnitt (program/inställningar) | -40% /
-46% | -25% /
-18% | -39% /
-41% | -60% /
-82% | -11% /
-3% | -6% /
4% | 8% /
10% |
* ... mindre är bättre
Visa svarstider
| ↔ Svarstid svart till vitt | ||
|---|---|---|
| 26.1 ms ... stiga ↗ och falla ↘ kombinerat | ↗ 14.9 ms stiga | |
| ↘ 11.2 ms hösten | ||
| Skärmen visar relativt långsamma svarsfrekvenser i våra tester och kan vara för långsam för spelare. I jämförelse sträcker sig alla testade enheter från 0.1 (minst) till 240 (maximalt) ms. » 65 % av alla enheter är bättre. Detta innebär att den uppmätta svarstiden är sämre än genomsnittet av alla testade enheter (19.9 ms). | ||
| ↔ Svarstid 50 % grått till 80 % grått | ||
| 31 ms ... stiga ↗ och falla ↘ kombinerat | ↗ 14 ms stiga | |
| ↘ 17 ms hösten | ||
| Skärmen visar långsamma svarsfrekvenser i våra tester och kommer att vara otillfredsställande för spelare. I jämförelse sträcker sig alla testade enheter från 0.165 (minst) till 636 (maximalt) ms. » 42 % av alla enheter är bättre. Det betyder att den uppmätta svarstiden liknar genomsnittet av alla testade enheter (31.1 ms). | ||
Skärmflimmer / PWM (Puls-Width Modulation)
| Skärmflimmer / PWM upptäckt | 118000 Hz | ≤ 49 % ljusstyrka inställning |  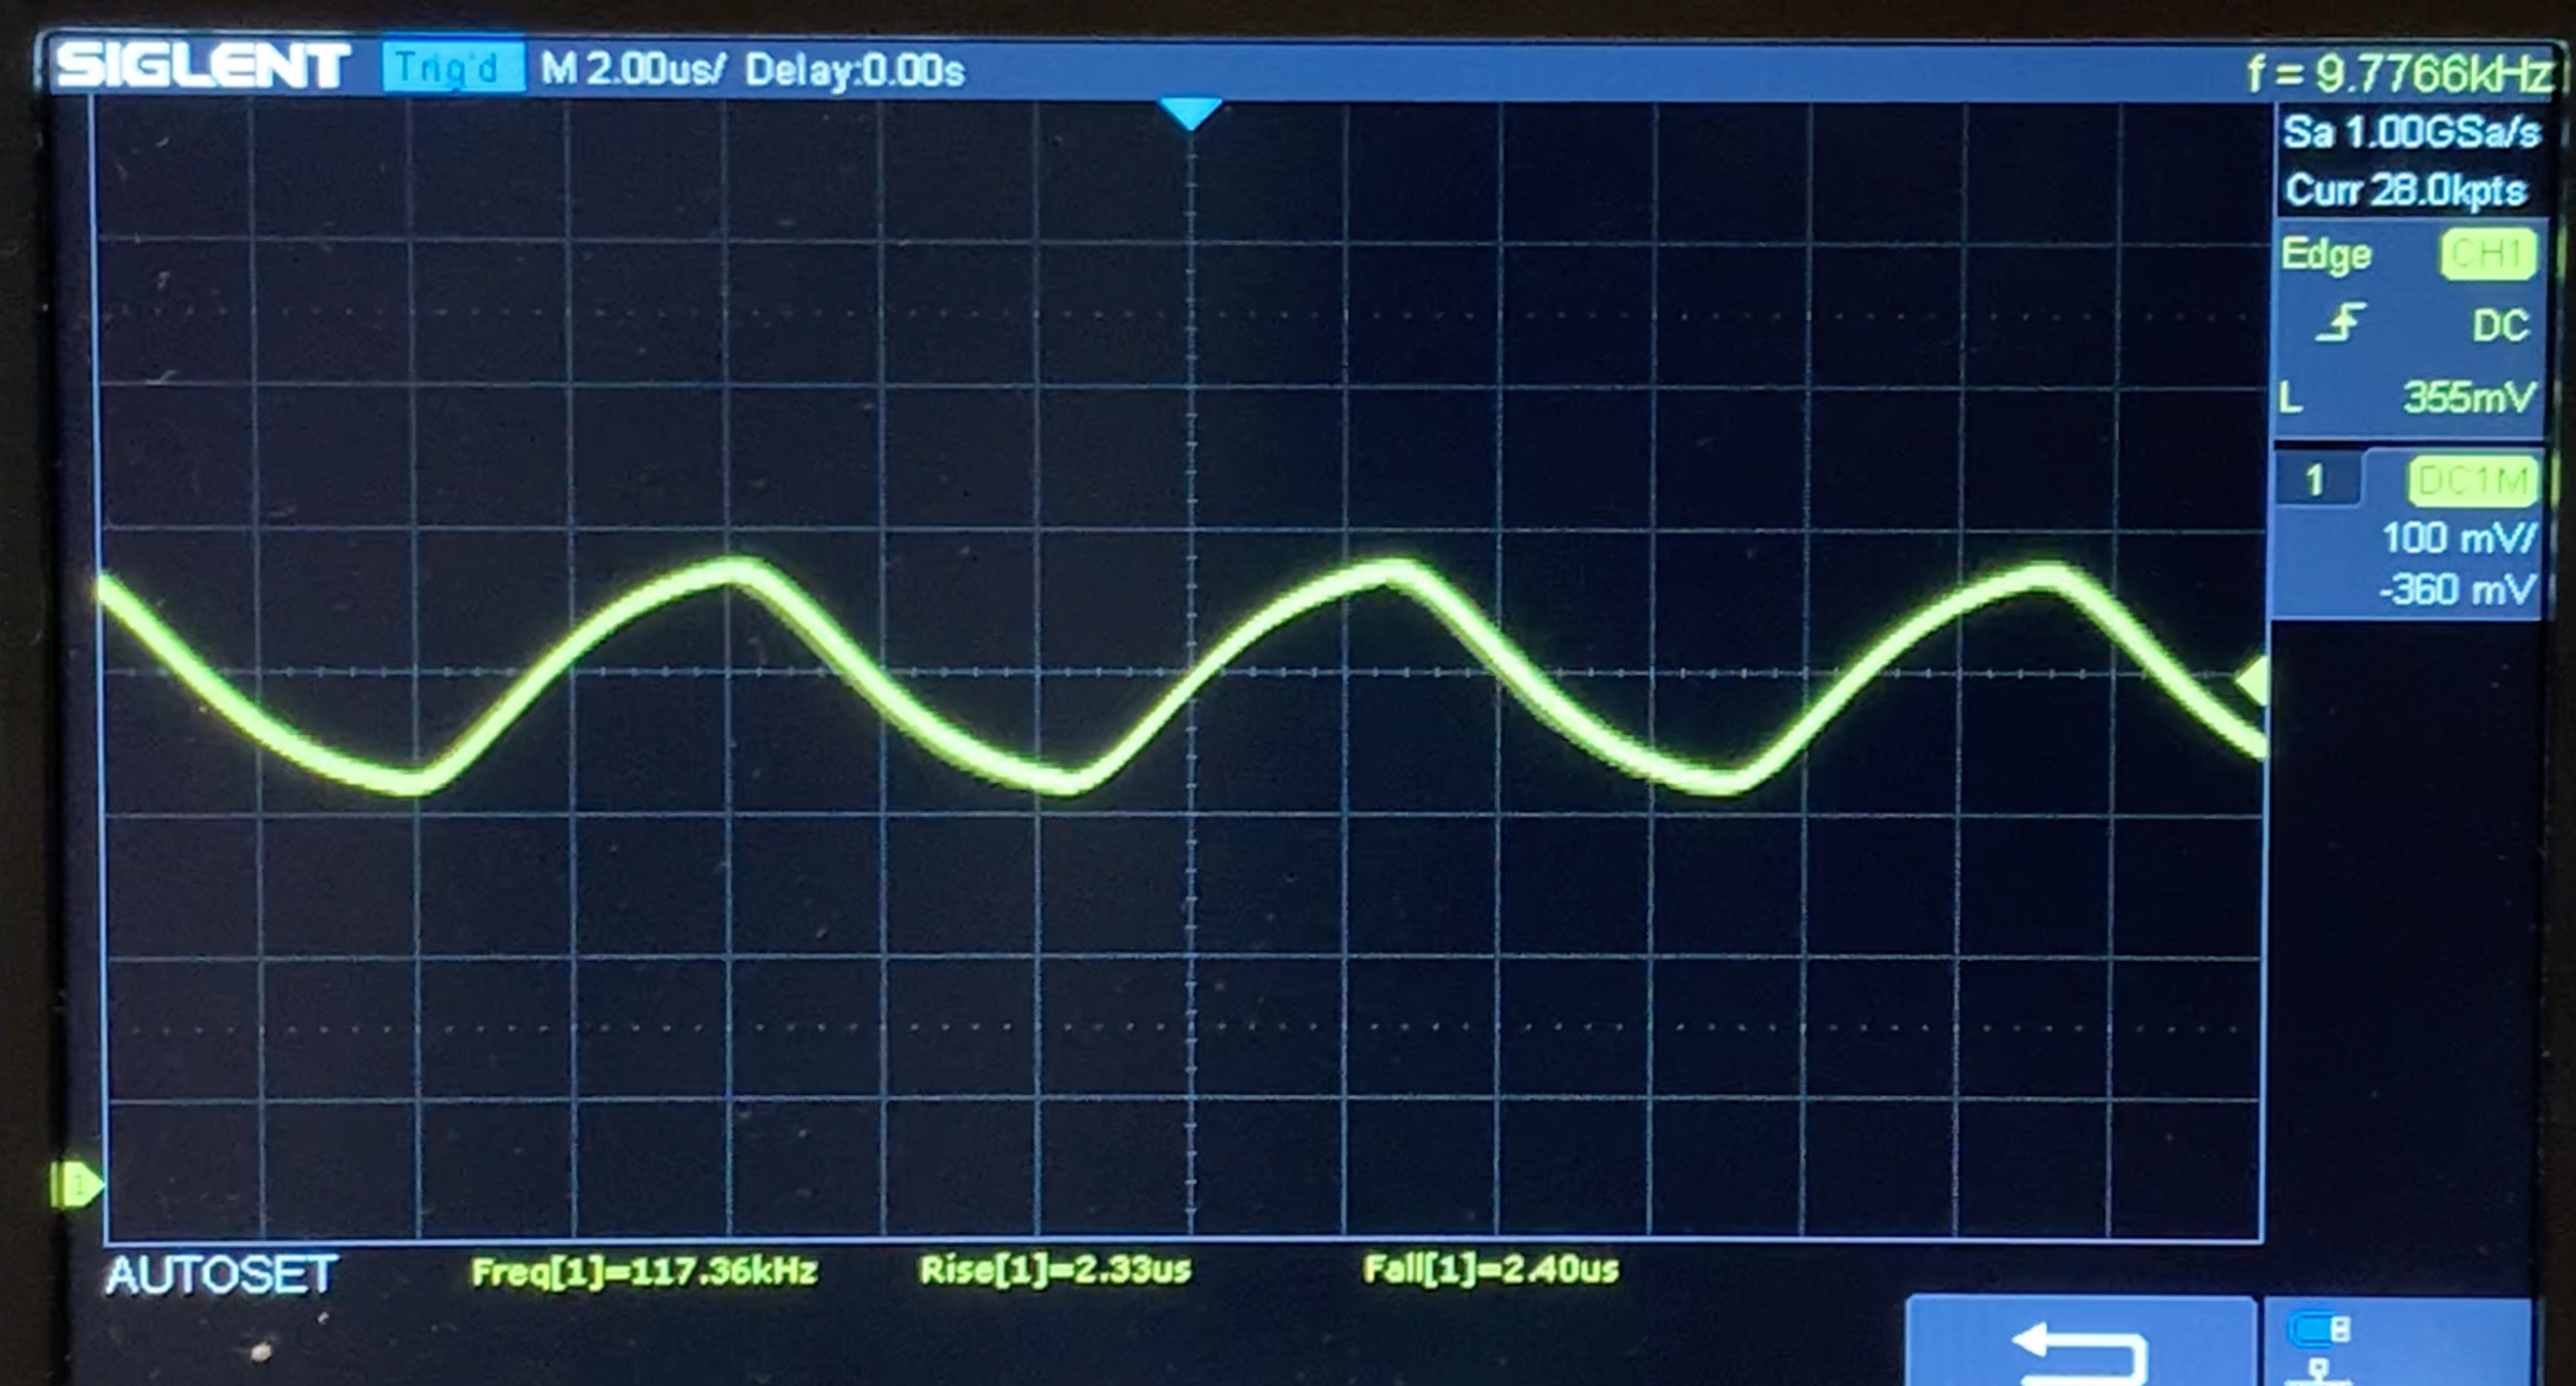 |
| ≤ 155 cd/m² ljusstyrka | |||
Displayens bakgrundsbelysning flimrar vid 118000 Hz (i värsta fall, t.ex. med PWM) Flimrande upptäckt vid en ljusstyrkeinställning på 49 % (155 cd/m²) och lägre. Det ska inte finnas något flimmer eller PWM över denna ljusstyrkeinställning. Frekvensen för 118000 Hz är ganska hög, så de flesta användare som är känsliga för PWM bör inte märka något flimmer. Flimrande inträffar även vid hög ljusstyrka och kan ha en effekt på användaren under daglig användning. Som jämförelse: 52 % av alla testade enheter använder inte PWM för att dämpa skärmen. Om PWM upptäcktes mättes ett medelvärde av 7794 (minst: 5 - maximum: 343500) Hz. | |||
Cinebench R15 loop (emulerad i Rosetta 2)
Cinebench R23 loop (native)
Cinebench R20: CPU (Single Core) | CPU (Multi Core)
Cinebench R15: CPU Single 64Bit | CPU Multi 64Bit
Blender: v2.79 BMW27 CPU
7-Zip 18.03: 7z b 4 -mmt1 | 7z b 4
Geekbench 5.5: Single-Core | Multi-Core
R Benchmark 2.5: Overall mean
| Performance rating | |
| Genomsnitt av klass Subnotebook | |
| Genomsnitt Apple M1 | |
| Intel Reference Design Laptop 28W -2! | |
| Lenovo ThinkPad X13-20UGS00800 | |
| Apple MacBook Air 2020 M1 Entry | |
| Razer Blade Stealth i7-1165G7 GTX 1650 Ti Max-Q | |
| Dell XPS 13 9310 Core i7 FHD | |
| Lenovo ThinkPad X13 Yoga 20SX0004GE | |
| Apple MacBook Air 2020 i5 | |
| Apple MacBook Air 2020 i3 | |
| Cinebench R20 / CPU (Single Core) | |
| Genomsnitt av klass Subnotebook (128 - 832, n=57, senaste 2 åren) | |
| Intel Reference Design Laptop 28W | |
| Razer Blade Stealth i7-1165G7 GTX 1650 Ti Max-Q | |
| Dell XPS 13 9310 Core i7 FHD | |
| Lenovo ThinkPad X13-20UGS00800 | |
| Lenovo ThinkPad X13 Yoga 20SX0004GE | |
| Genomsnitt Apple M1 (401 - 406, n=4) | |
| Apple MacBook Air 2020 M1 Entry | |
| Apple MacBook Air 2020 i5 | |
| Apple MacBook Air 2020 i5 | |
| Apple MacBook Air 2020 i3 | |
| Cinebench R20 / CPU (Multi Core) | |
| Genomsnitt av klass Subnotebook (579 - 8541, n=57, senaste 2 åren) | |
| Lenovo ThinkPad X13-20UGS00800 | |
| Intel Reference Design Laptop 28W | |
| Genomsnitt Apple M1 (1863 - 2109, n=4) | |
| Razer Blade Stealth i7-1165G7 GTX 1650 Ti Max-Q | |
| Dell XPS 13 9310 Core i7 FHD | |
| Apple MacBook Air 2020 M1 Entry | |
| Lenovo ThinkPad X13 Yoga 20SX0004GE | |
| Apple MacBook Air 2020 i5 | |
| Apple MacBook Air 2020 i5 | |
| Apple MacBook Air 2020 i3 | |
| Cinebench R15 / CPU Single 64Bit | |
| Genomsnitt av klass Subnotebook (72.4 - 322, n=57, senaste 2 åren) | |
| Intel Reference Design Laptop 28W | |
| Razer Blade Stealth i7-1165G7 GTX 1650 Ti Max-Q | |
| Dell XPS 13 9310 Core i7 FHD | |
| Apple MacBook Air 2020 M1 Entry | |
| Genomsnitt Apple M1 (206 - 208, n=3) | |
| Lenovo ThinkPad X13-20UGS00800 | |
| Lenovo ThinkPad X13 Yoga 20SX0004GE | |
| Apple MacBook Air 2020 i3 | |
| Apple MacBook Air 2020 i5 | |
| Cinebench R15 / CPU Multi 64Bit | |
| Genomsnitt av klass Subnotebook (327 - 3345, n=57, senaste 2 åren) | |
| Lenovo ThinkPad X13-20UGS00800 | |
| Genomsnitt Apple M1 (1020 - 1087, n=4) | |
| Apple MacBook Air 2020 M1 Entry | |
| Intel Reference Design Laptop 28W | |
| Intel Reference Design Laptop 28W | |
| Dell XPS 13 9310 Core i7 FHD | |
| Razer Blade Stealth i7-1165G7 GTX 1650 Ti Max-Q | |
| Lenovo ThinkPad X13 Yoga 20SX0004GE | |
| Apple MacBook Air 2020 i5 | |
| Apple MacBook Air 2020 i3 | |
| Blender / v2.79 BMW27 CPU | |
| Apple MacBook Air 2020 i3 | |
| Apple MacBook Air 2020 i5 | |
| Lenovo ThinkPad X13 Yoga 20SX0004GE | |
| Apple MacBook Air 2020 M1 Entry | |
| Dell XPS 13 9310 Core i7 FHD | |
| Razer Blade Stealth i7-1165G7 GTX 1650 Ti Max-Q | |
| Genomsnitt Apple M1 (412 - 710, n=2) | |
| Intel Reference Design Laptop 28W | |
| Lenovo ThinkPad X13-20UGS00800 | |
| Genomsnitt av klass Subnotebook (159 - 2271, n=58, senaste 2 åren) | |
| 7-Zip 18.03 / 7z b 4 -mmt1 | |
| Genomsnitt av klass Subnotebook (2643 - 6699, n=59, senaste 2 åren) | |
| Apple MacBook Air 2020 M1 Entry | |
| Genomsnitt Apple M1 (n=1) | |
| Intel Reference Design Laptop 28W | |
| Dell XPS 13 9310 Core i7 FHD | |
| Razer Blade Stealth i7-1165G7 GTX 1650 Ti Max-Q | |
| Lenovo ThinkPad X13 Yoga 20SX0004GE | |
| Lenovo ThinkPad X13-20UGS00800 | |
| Apple MacBook Air 2020 i5 | |
| Apple MacBook Air 2020 i3 | |
| 7-Zip 18.03 / 7z b 4 | |
| Genomsnitt av klass Subnotebook (11668 - 77867, n=57, senaste 2 åren) | |
| Lenovo ThinkPad X13-20UGS00800 | |
| Apple MacBook Air 2020 M1 Entry | |
| Genomsnitt Apple M1 (n=1) | |
| Intel Reference Design Laptop 28W | |
| Razer Blade Stealth i7-1165G7 GTX 1650 Ti Max-Q | |
| Dell XPS 13 9310 Core i7 FHD | |
| Lenovo ThinkPad X13 Yoga 20SX0004GE | |
| Apple MacBook Air 2020 i5 | |
| Apple MacBook Air 2020 i3 | |
| Geekbench 5.5 / Single-Core | |
| Genomsnitt av klass Subnotebook (726 - 2224, n=48, senaste 2 åren) | |
| Genomsnitt Apple M1 (1710 - 1745, n=9) | |
| Apple MacBook Air 2020 M1 Entry | |
| Razer Blade Stealth i7-1165G7 GTX 1650 Ti Max-Q | |
| Dell XPS 13 9310 Core i7 FHD | |
| Lenovo ThinkPad X13 Yoga 20SX0004GE | |
| Apple MacBook Air 2020 i5 | |
| Apple MacBook Air 2020 i5 | |
| Lenovo ThinkPad X13-20UGS00800 | |
| Apple MacBook Air 2020 i3 | |
| Geekbench 5.5 / Multi-Core | |
| Genomsnitt av klass Subnotebook (2557 - 17218, n=48, senaste 2 åren) | |
| Apple MacBook Air 2020 M1 Entry | |
| Genomsnitt Apple M1 (7034 - 7710, n=9) | |
| Dell XPS 13 9310 Core i7 FHD | |
| Lenovo ThinkPad X13-20UGS00800 | |
| Razer Blade Stealth i7-1165G7 GTX 1650 Ti Max-Q | |
| Lenovo ThinkPad X13 Yoga 20SX0004GE | |
| Apple MacBook Air 2020 i5 | |
| Apple MacBook Air 2020 i5 | |
| Apple MacBook Air 2020 i3 | |
| R Benchmark 2.5 / Overall mean | |
| Apple MacBook Air 2020 i5 | |
| Apple MacBook Air 2020 i5 | |
| Apple MacBook Air 2020 i3 | |
| Apple MacBook Air 2020 M1 Entry | |
| Genomsnitt Apple M1 (n=1) | |
| Lenovo ThinkPad X13 Yoga 20SX0004GE | |
| Lenovo ThinkPad X13-20UGS00800 | |
| Dell XPS 13 9310 Core i7 FHD | |
| Intel Reference Design Laptop 28W | |
| Razer Blade Stealth i7-1165G7 GTX 1650 Ti Max-Q | |
| Genomsnitt av klass Subnotebook (0.4024 - 1.456, n=58, senaste 2 åren) | |
* ... mindre är bättre
| WebXPRT 3 - Overall | |
| Genomsnitt av klass Subnotebook (156 - 530, n=56, senaste 2 åren) | |
| Apple MacBook Air 2020 M1 Entry | |
| Apple MacBook Air 2020 M1 Entry | |
| AMD Radeon RX 6800 XT | |
| Intel Reference Design Laptop 28W | |
| Intel Reference Design Laptop 15W | |
| MSI Prestige 14 Evo A11M-056US | |
| Dell XPS 13 9310 Core i7 FHD | |
| Lenovo Yoga Slim 7-14ARE | |
| Lenovo ThinkPad X13-20UGS00800 | |
| Apple iPad Air 4 2020 | |
| Apple iPad Pro 12.9 2020 | |
| Samsung Galaxy Book S | |
| Apple iPad 7 2019 | |
| Mozilla Kraken 1.1 - Total | |
| Samsung Galaxy Book S | |
| Apple iPad 7 2019 | |
| Lenovo ThinkPad X13 Yoga 20SX0004GE | |
| Lenovo Yoga Slim 7-14ARE | |
| Lenovo ThinkPad X13-20UGS00800 | |
| Apple iPad Pro 12.9 2020 | |
| Dell XPS 13 9310 Core i7 FHD | |
| MSI Prestige 14 Evo A11M-056US | |
| Intel Reference Design Laptop 15W | |
| AMD Radeon RX 6800 XT | |
| Apple MacBook Air 2020 M1 Entry | |
| Apple MacBook Air 2020 M1 Entry | |
| Genomsnitt av klass Subnotebook (234 - 1104, n=61, senaste 2 åren) | |
| Apple iPad Air 4 2020 | |
| Octane V2 - Total Score | |
| Genomsnitt av klass Subnotebook (35801 - 142020, n=29, senaste 2 åren) | |
| Apple MacBook Air 2020 M1 Entry | |
| Apple MacBook Air 2020 M1 Entry | |
| MSI Prestige 14 Evo A11M-056US | |
| Apple iPad Air 4 2020 | |
| Lenovo ThinkPad X13-20UGS00800 | |
| Apple iPad Pro 12.9 2020 | |
| Lenovo Yoga Slim 7-14ARE | |
| Samsung Galaxy Book S | |
| Apple iPad 7 2019 | |
| Speedometer 2.0 - Result 2.0 | |
| Genomsnitt av klass Subnotebook (110 - 793, n=27, senaste 2 åren) | |
| Apple MacBook Air 2020 M1 Entry | |
| Apple MacBook Air 2020 M1 Entry | |
| Apple iPad Air 4 2020 | |
| MSI Prestige 14 Evo A11M-056US | |
| Apple iPad Pro 12.9 2020 | |
| Apple iPad 7 2019 | |
| Samsung Galaxy Book S | |
| Jetstream 2 - 2.0 Total | |
| Genomsnitt av klass Subnotebook (117 - 476, n=29, senaste 2 åren) | |
| Apple MacBook Air 2020 M1 Entry | |
| Apple MacBook Air 2020 M1 Entry | |
| MSI Prestige 14 Evo A11M-056US | |
| Apple iPad Air 4 2020 | |
| Lenovo ThinkPad X13-20UGS00800 | |
| Apple iPad Pro 12.9 2020 | |
| Apple iPad 7 2019 | |
| Samsung Galaxy Book S | |
| Youtube - 2160p60 CPU Load | |
| Apple MacBook Air 2020 M1 Entry (5) | |
| Genomsnitt av klass Subnotebook (1 - 27, n=42, senaste 2 åren) | |
| Lenovo ThinkPad X13-20UGS00800 (68, 2) | |
| Lenovo Yoga Slim 7-14ARE (66) | |
| Dell XPS 13 9310 Core i7 FHD (31, 2) | |
* ... mindre är bättre
| låg | med. | hög | ultra | QHD | 4K | |
|---|---|---|---|---|---|---|
| Batman: Arkham City (2011) | 86 | 47 | ||||
| Counter-Strike: GO (2012) | 109 | 69 | 44.4 | |||
| Deus Ex Mankind Divided (2016) | 47.6 | 35.3 | 19 | |||
| Civilization 6 (2016) | 80.3 | 30.1 | 27 | 15.8 | ||
| Warhammer 40.000: Dawn of War III (2017) | 43.9 | 32.5 | ||||
| F1 2017 (2017) | 60 | 54 | 43 | |||
| Shadow of the Tomb Raider (2018) | 65 | 22 | ||||
| Total War: Three Kingdoms (2019) | 95 små grafiska problem (smog not perfect) | 26 små grafiska problem (smog not perfect) | 17 små grafiska problem | |||
| Borderlands 3 (2019) | 45.2 | 28 | 17.7 | |||
| Hearthstone (2020) | 58 | |||||
| Cyberpunk 2077 (2023) | 17.8 |
(±) Den maximala temperaturen på ovansidan är 44 °C / 111 F, jämfört med genomsnittet av 35.9 °C / 97 F , allt från 21.4 till 59 °C för klassen Subnotebook.
(±) Botten värms upp till maximalt 44 °C / 111 F, jämfört med genomsnittet av 39.2 °C / 103 F
(+) Vid tomgångsbruk är medeltemperaturen för ovansidan 25.8 °C / 78 F, jämfört med enhetsgenomsnittet på 30.8 °C / ### class_avg_f### F.
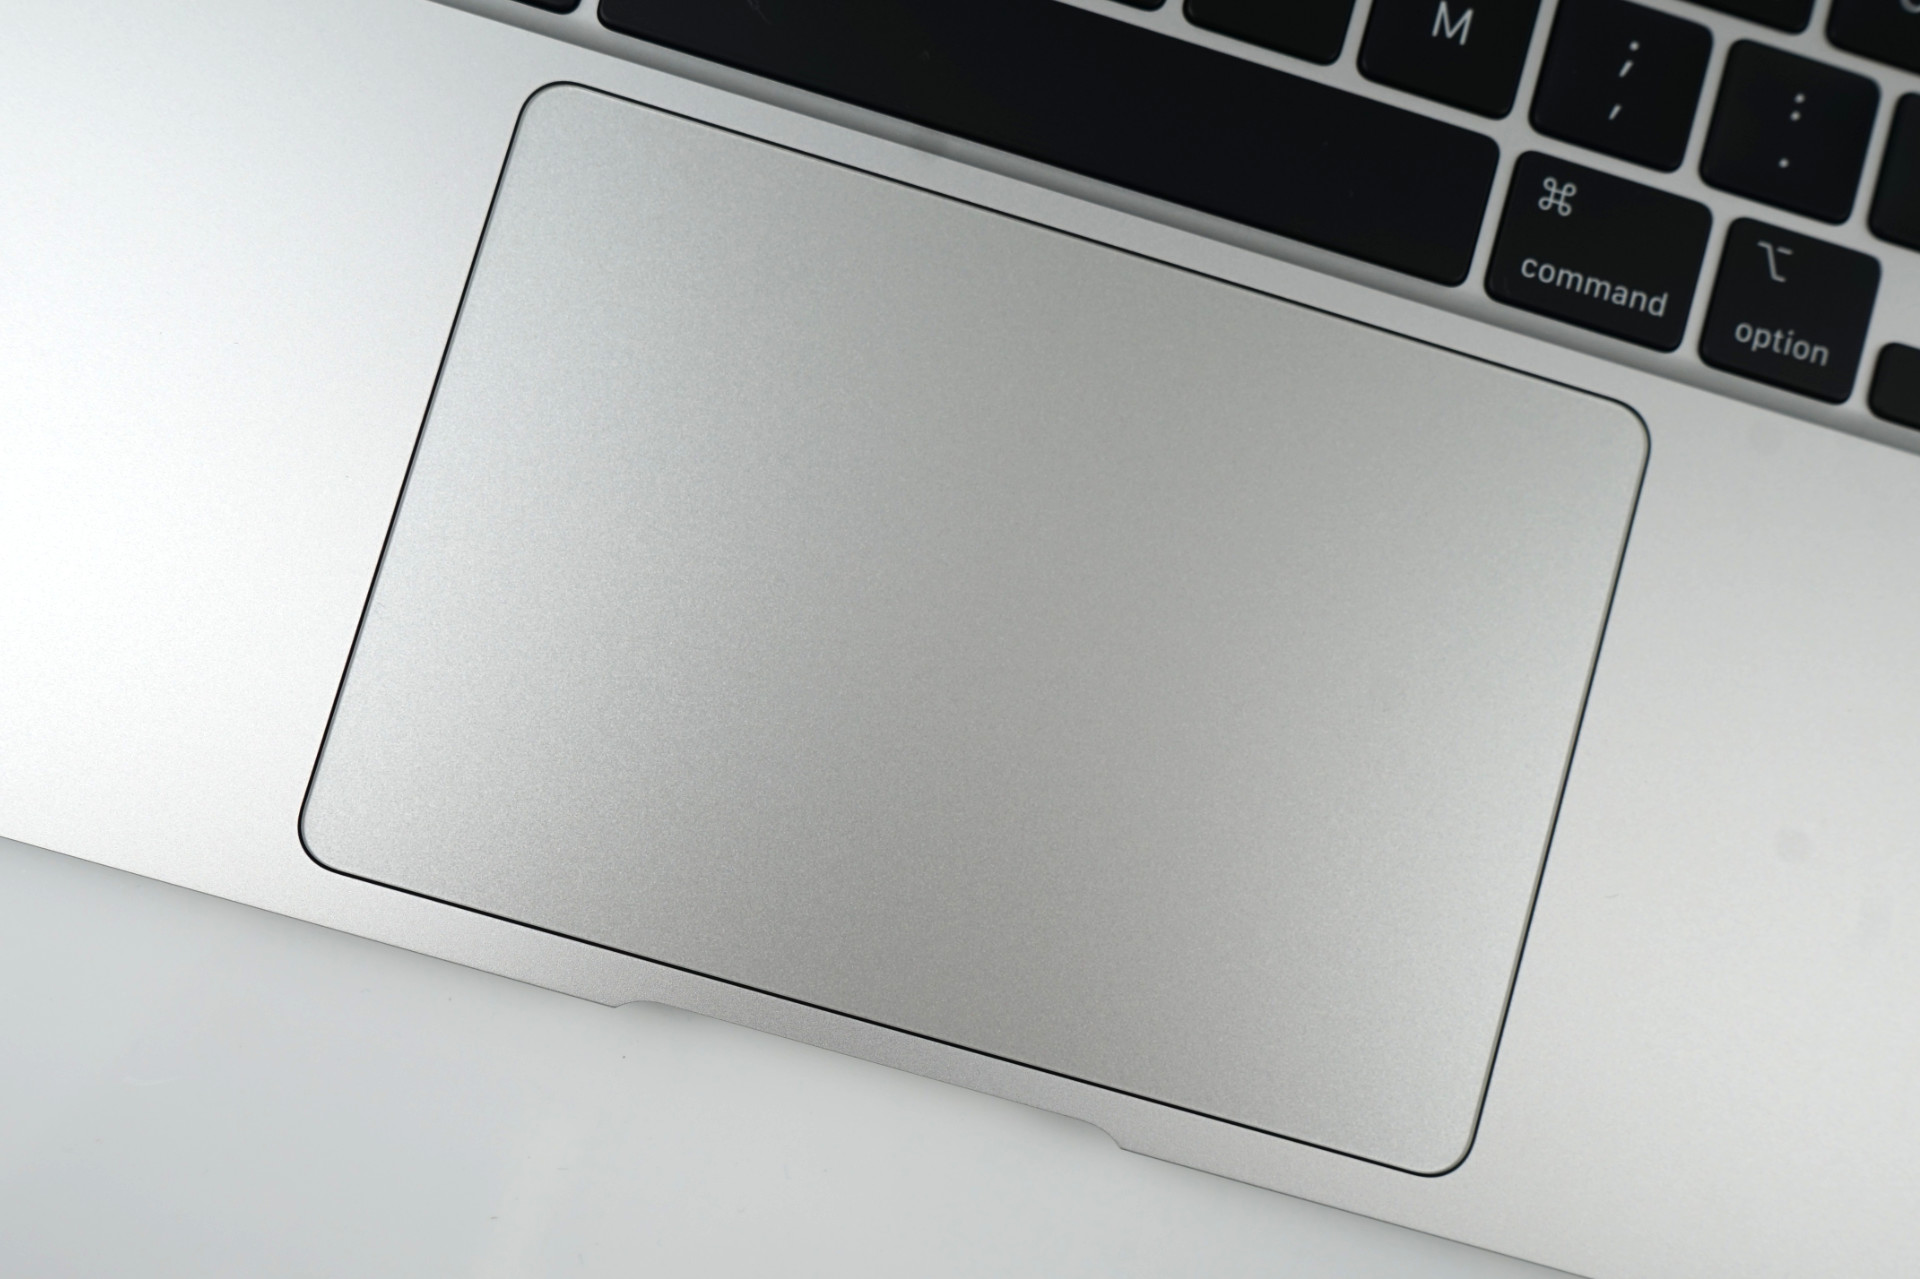
(+) Handledsstöden och pekplattan når maximal hudtemperatur (32 °C / 89.6 F) och är därför inte varma.
(-) Medeltemperaturen för handledsstödsområdet på liknande enheter var 28.2 °C / 82.8 F (-3.8 °C / -6.8 F).
Apple MacBook Air 2020 M1 Entry ljudanalys
(±) | högtalarljudstyrkan är genomsnittlig men bra (79.6 dB)
Bas 100 - 315 Hz
(±) | reducerad bas - i genomsnitt 7.1% lägre än medianen
(±) | linjäriteten för basen är genomsnittlig (9.5% delta till föregående frekvens)
Mellan 400 - 2000 Hz
(+) | balanserad mellan - endast 2.2% från medianen
(+) | mids är linjära (5.3% delta till föregående frekvens)
Högsta 2 - 16 kHz
(+) | balanserade toppar - endast 2.3% från medianen
(+) | toppar är linjära (4% delta till föregående frekvens)
Totalt 100 - 16 000 Hz
(+) | det totala ljudet är linjärt (8.7% skillnad mot median)
Jämfört med samma klass
» 3% av alla testade enheter i den här klassen var bättre, 1% liknande, 96% sämre
» Den bästa hade ett delta på 5%, genomsnittet var 18%, sämst var 53%
Jämfört med alla testade enheter
» 3% av alla testade enheter var bättre, 1% liknande, 97% sämre
» Den bästa hade ett delta på 4%, genomsnittet var 24%, sämst var 134%
Apple MacBook 12 (Early 2016) 1.1 GHz ljudanalys
(+) | högtalare kan spela relativt högt (83.6 dB)
Bas 100 - 315 Hz
(±) | reducerad bas - i genomsnitt 11.3% lägre än medianen
(±) | linjäriteten för basen är genomsnittlig (14.2% delta till föregående frekvens)
Mellan 400 - 2000 Hz
(+) | balanserad mellan - endast 2.4% från medianen
(+) | mids är linjära (5.5% delta till föregående frekvens)
Högsta 2 - 16 kHz
(+) | balanserade toppar - endast 2% från medianen
(+) | toppar är linjära (4.5% delta till föregående frekvens)
Totalt 100 - 16 000 Hz
(+) | det totala ljudet är linjärt (10.2% skillnad mot median)
Jämfört med samma klass
» 7% av alla testade enheter i den här klassen var bättre, 2% liknande, 91% sämre
» Den bästa hade ett delta på 5%, genomsnittet var 18%, sämst var 53%
Jämfört med alla testade enheter
» 5% av alla testade enheter var bättre, 1% liknande, 94% sämre
» Den bästa hade ett delta på 4%, genomsnittet var 24%, sämst var 134%
| Av/Standby | |
| Låg belastning | |
| Hög belastning |
|
Förklaring:
min: | |
| Apple MacBook Air 2020 M1 Entry M1, M1 7-Core GPU, Apple SSD AP0256Q, IPS, 2560x1600, 13.3" | Samsung Galaxy Book S Intel i5-L16G7, UHD Graphics G7 (Lakefield GT2 64 EU), 256 GB UFS 3.0 Flash, IPS, 1920x1080, 13.3" | Samsung Galaxy Book S SD 8cx, Adreno 680, 256 GB NVMe, IPS, 1920x1080, 13.3" | Acer Swift 3 SF313-52-71Y7 i7-1065G7, Iris Plus Graphics G7 (Ice Lake 64 EU), Intel SSD 660p 1TB SSDPEKNW010T8, IPS, 2256x1504, 13.5" | Dell XPS 13 9310 Core i7 FHD i7-1165G7, Iris Xe G7 96EUs, Micron 2300 512GB MTFDHBA512TDV, IPS, 1920x1200, 13.4" | Genomsnitt av klass Subnotebook | |
|---|---|---|---|---|---|---|
| Power Consumption | 16% | 33% | 9% | -41% | -60% | |
| Idle Minimum * (Watt) | 1.9 | 2.5 -32% | 1.61 15% | 1.8 5% | 3.9 -105% | 3.82 ? -101% |
| Idle Average * (Watt) | 6.4 | 4.8 25% | 4.3 33% | 4.6 28% | 5.9 8% | 6.61 ? -3% |
| Idle Maximum * (Watt) | 7 | 6 14% | 5 29% | 6.1 13% | 6.3 10% | 7.99 ? -14% |
| Load Average * (Watt) | 25 | 14.9 40% | 13.2 47% | 27.4 -10% | 39.7 -59% | 41.9 ? -68% |
| Load Maximum * (Watt) | 30.3 | 20.1 34% | 18.3 40% | 27 11% | 47.5 -57% | 64.1 ? -112% |
| Witcher 3 ultra * (Watt) | 34.8 |
* ... mindre är bättre
| Apple MacBook Air 2020 M1 Entry M1, M1 7-Core GPU, 49.9 Wh | Dell XPS 13 9310 Core i7 FHD i7-1165G7, Iris Xe G7 96EUs, 52 Wh | Lenovo ThinkPad X13 Yoga 20SX0004GE i7-10510U, UHD Graphics 620, 50 Wh | Lenovo ThinkPad X395 R3 PRO 3300U, Vega 6, 48 Wh | Lenovo ThinkPad X13-20UGS00800 R7 PRO 4750U, Vega 7, 48 Wh | Apple iPad Air 4 2020 A14, A14 Bionic GPU, 28.6 Wh | Apple iPad Pro 12.9 2020 A12Z Bionic, A12Z Bionic GPU, 36.71 Wh | Apple iPad 7 2019 A10 Fusion, A10 Fusion GPU, 32.4 Wh | Apple MacBook Air 2020 i5 i5-1030NG7, Iris Plus Graphics G7 (Ice Lake 64 EU), 49.9 Wh | Genomsnitt av klass Subnotebook | |
|---|---|---|---|---|---|---|---|---|---|---|
| Batteridrifttid | ||||||||||
| WiFi v1.3 (h) | 16 | 11 -31% | 8.2 -49% | 10.9 -32% | 8.7 -46% | 11.7 -27% | 15.1 -6% | 11.8 -26% | 10.3 -36% | 14 ? -12% |
För
Emot
Läs den fullständiga versionen av den här recensionen på engelska här.
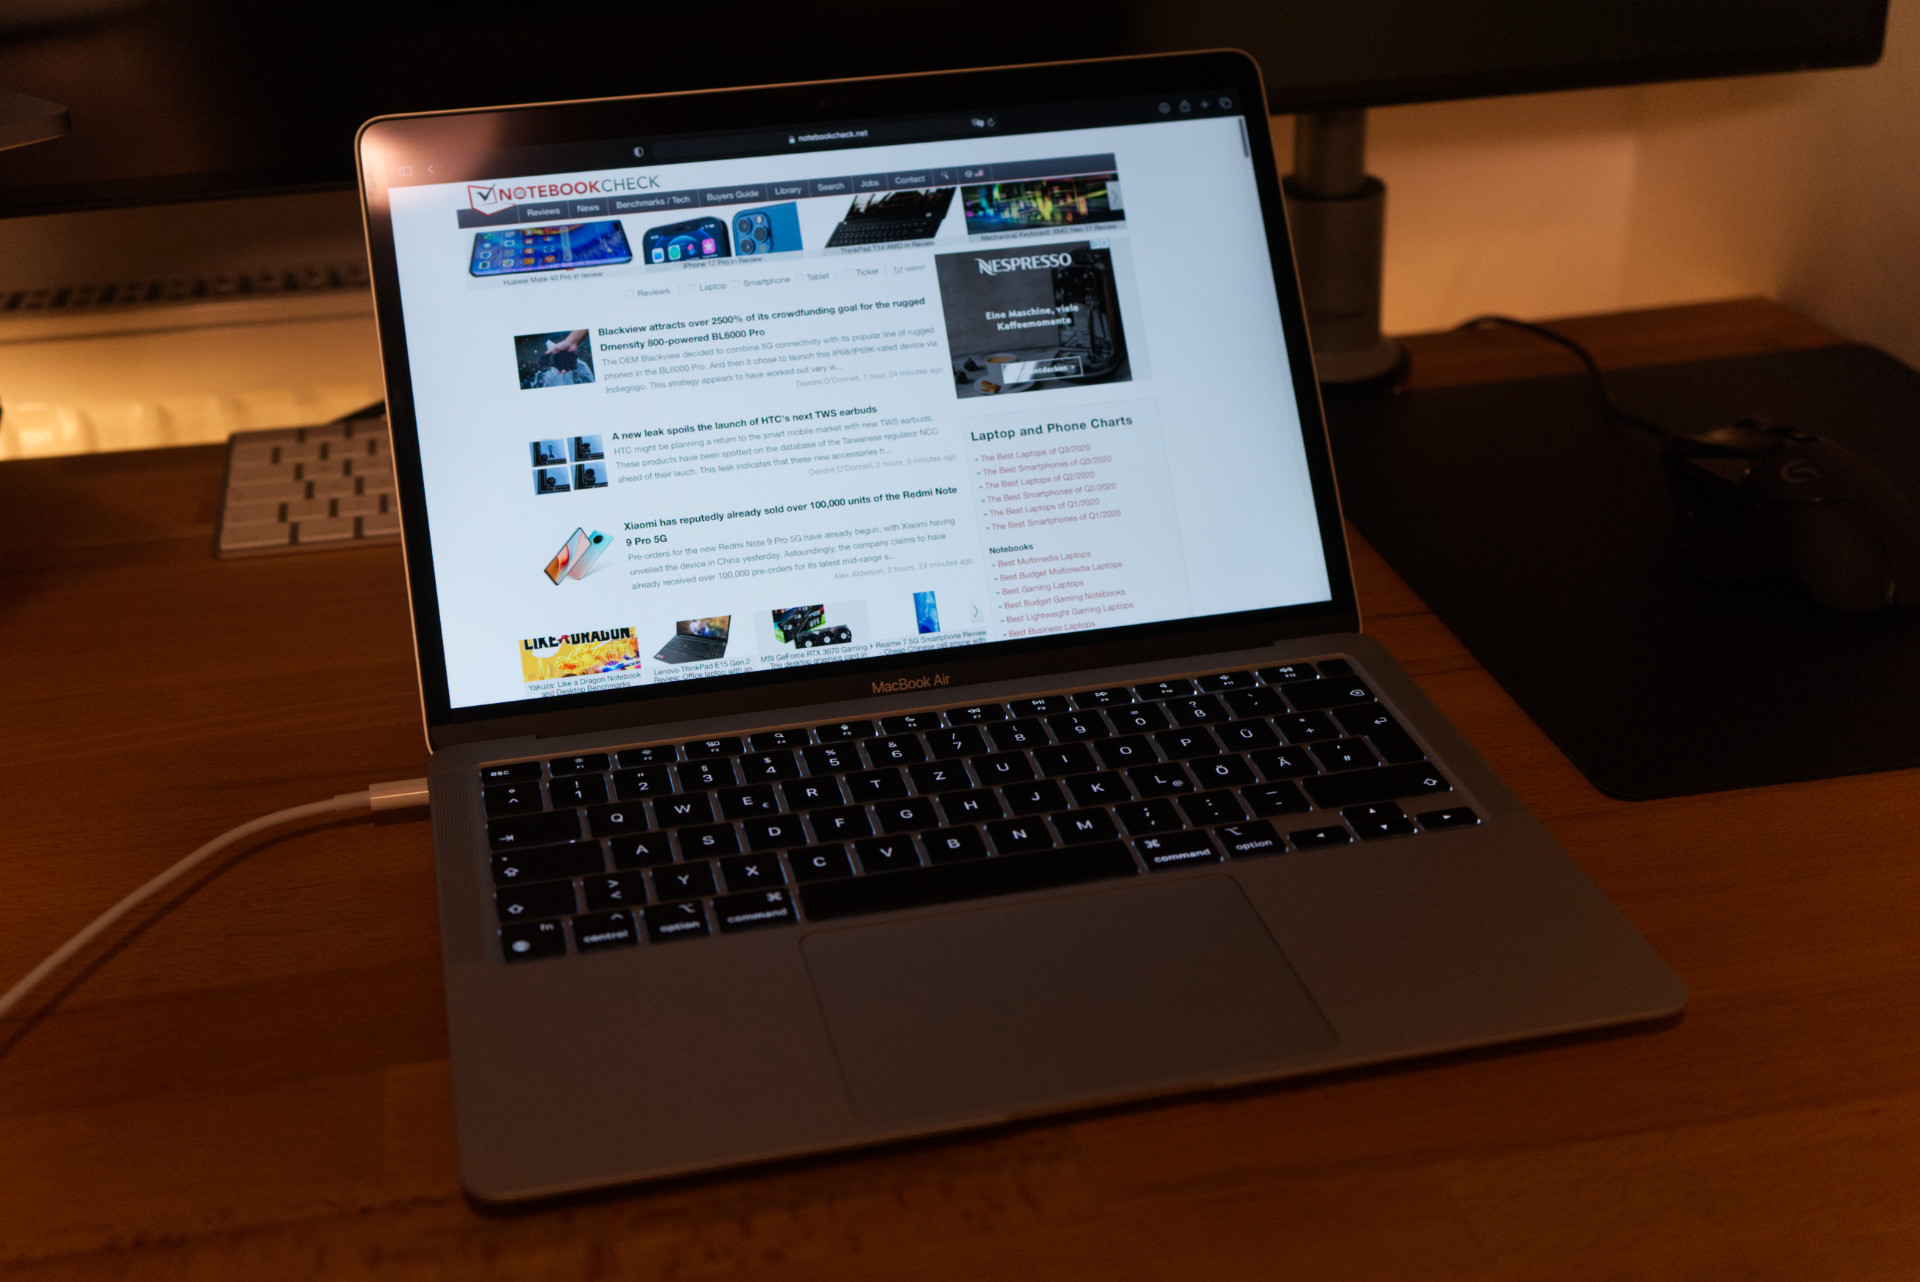
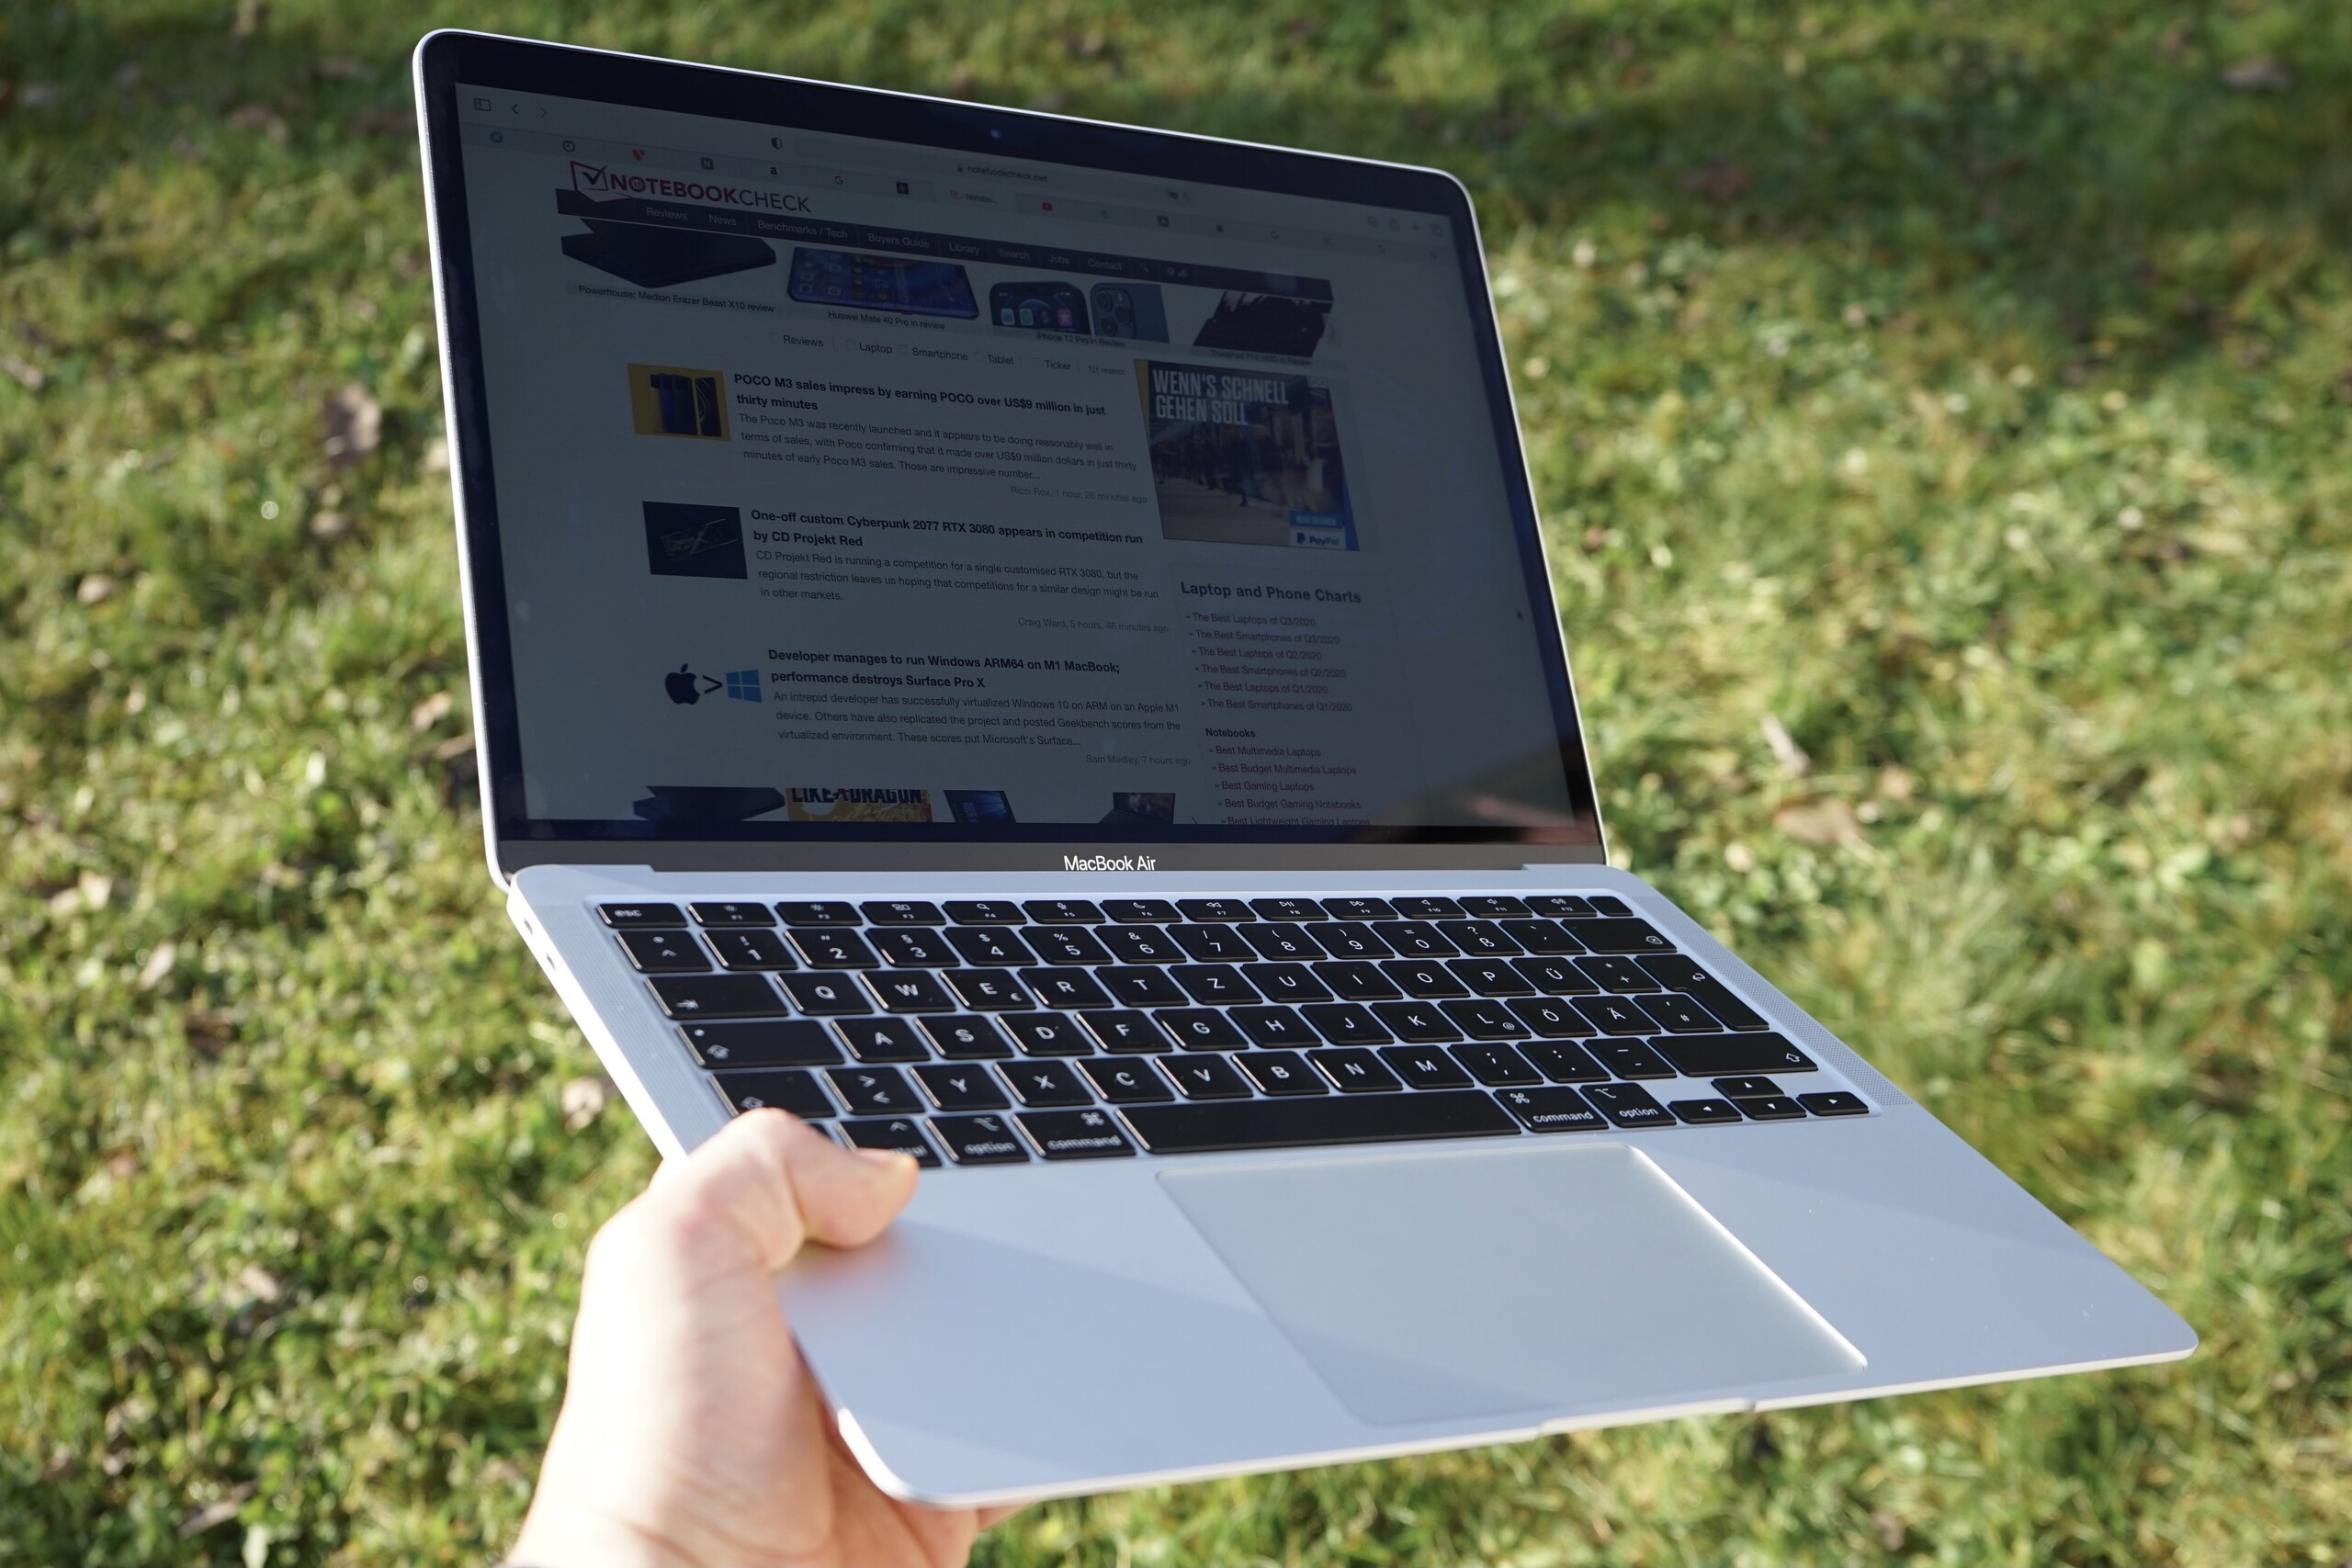
Den nya M1-processorn, baserad på ARM-arkitekturen, gör en imponerande debut i MacBook Air. I fråga om ren teoretisk prestanda hamnar den före jämförbara processorer från Intel och AMD, både i fråga om CPU- och GPU-prestanda. Och detta är instegsversionen av Air. Den passiva kylningen påverkar knappt prestandan överhuvudtaget; grafikprestandan sjunker inte med tiden och endast vid krävande uppgifter kan processorn tappa i prestanda efter några minuter. Men en skillnad på 11% är också inom rimliga gränser. Vidare kan vi försäkra att det inte är någon fara med yttemperaturerna även om det blir väldigt varmt på insidan, vilket är typiskt för Apple. En stor fördel med att den saknar fläkt är att den inte låter något alls, vilket är perfekt för tysta miljöer. Nya Apple M1 har också en positiv inverkan på batteritiden. Med sina energibesparande kärnor kan den spara mycket energi i vårt WLAN-batteritest och står sig en hel arbetsdag med maximal skärmljusstyrka.
Men bytet till Apples egna chip kommer inte bara med fördelar. Många äldre program måste köras genom Rosetta 2-emuleringen och tappar därmed betydligt i prestanda. Emuleringen är dock tillräckligt snabb för att ibland ge oss bättre resultat än vi fick med den gamla instegsprocessorn från Intel. Däremot fungerar inte allt perfekt ännu. Från ryckiga gränssnitt till längre laddningstider och till och med program som kraschar: det finns många problem att lösa. Så du får hoppas på nyskrivna versioner av programmen gjorda för den här hårdvaran alternativt på uppdateringar från Apple. Man bör kolla upp i förväg om program man använder kan råka ut för problem och ifall det i så fall finns alternativ. Begränsningar i programutbudet balanseras däremot av ett flertal nya iOS-appar som går att köra utan problem tack vare ARM-chippet.
Apples nya processorer firar en framgångsrik debut i MacBook Air. Allt eftersom mjukvaran mognar kommer nog ingen i framtiden sakna Intel-chip i sin Mac.
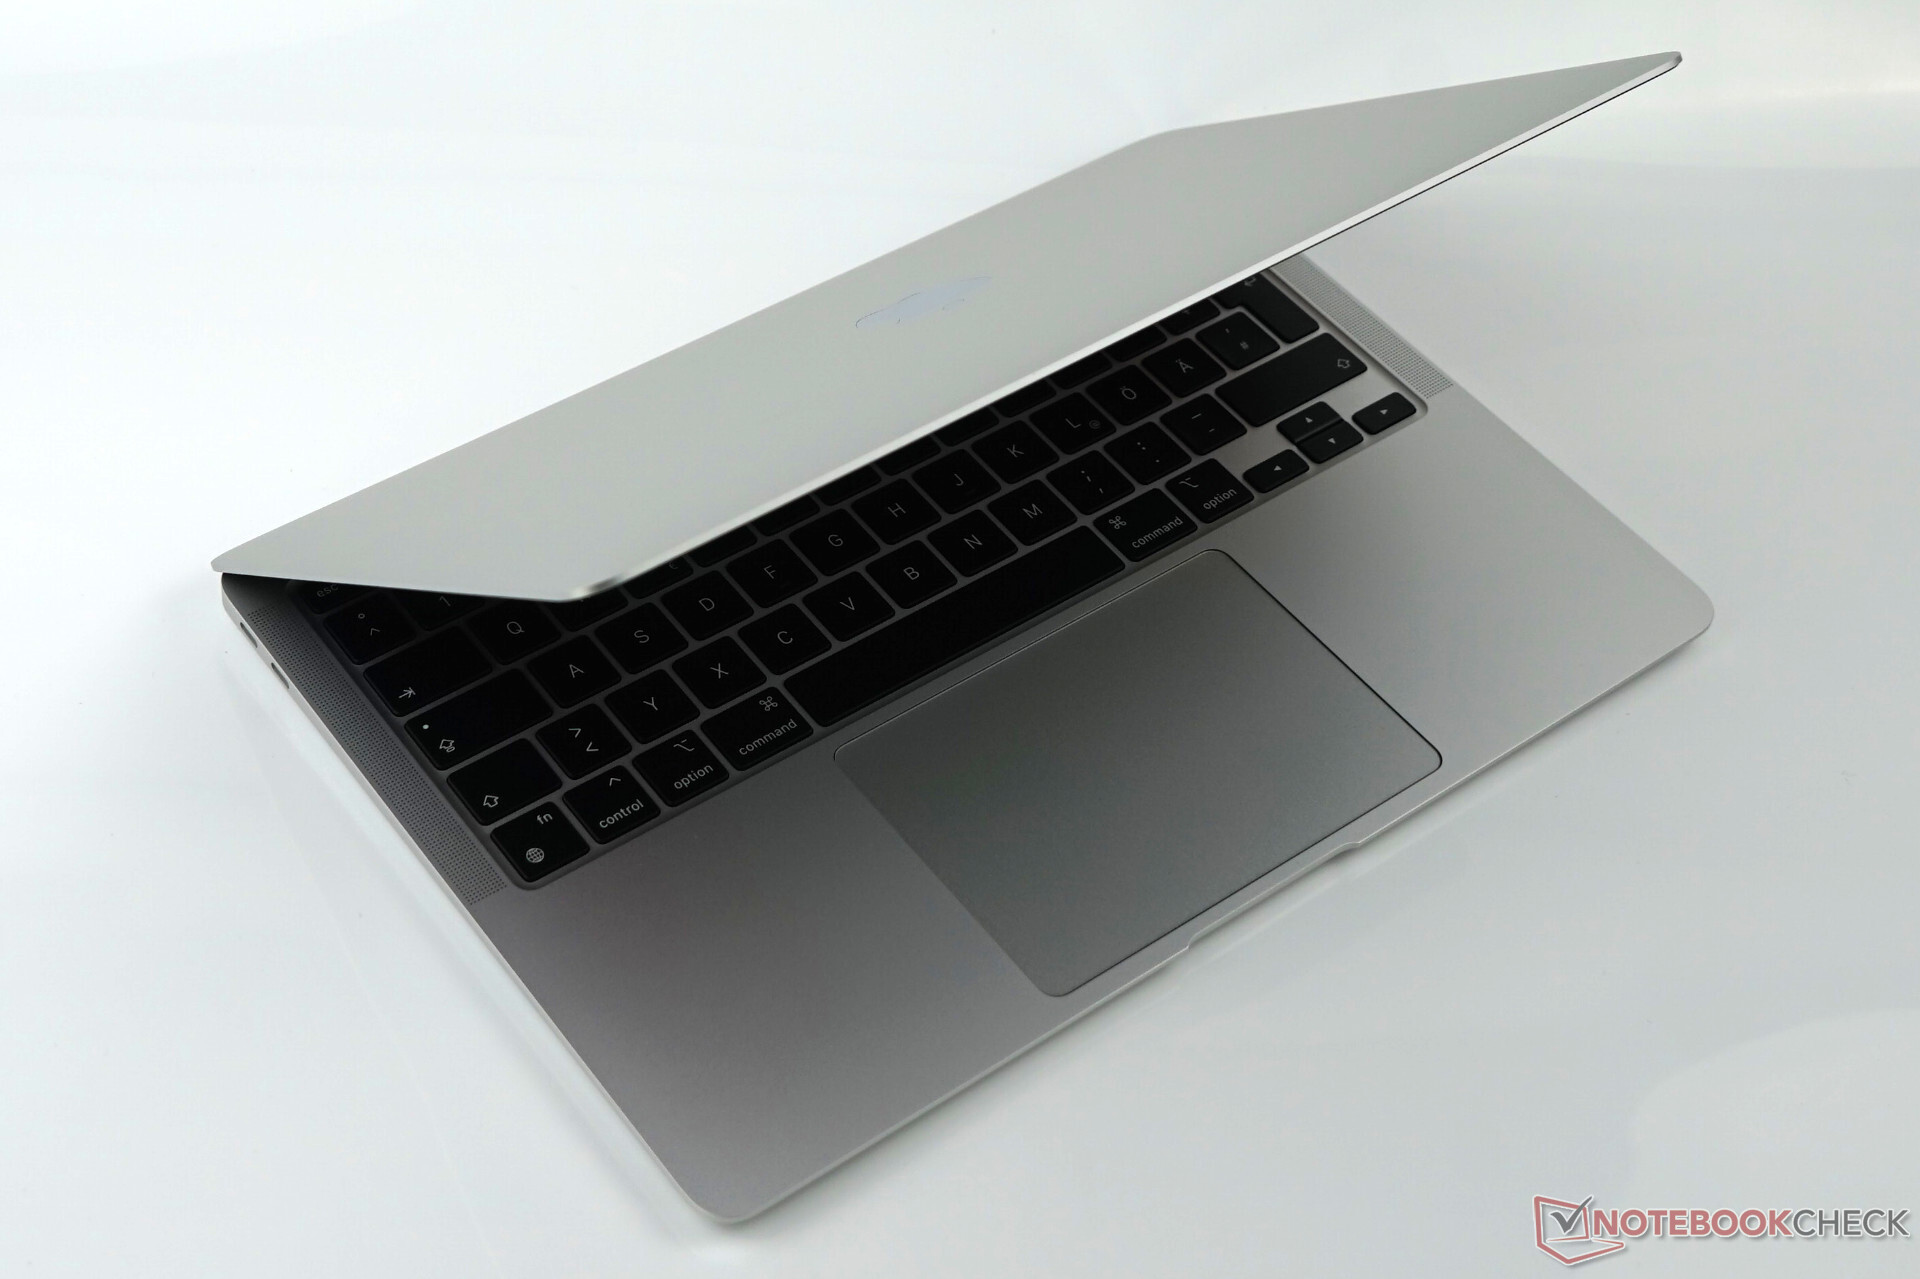
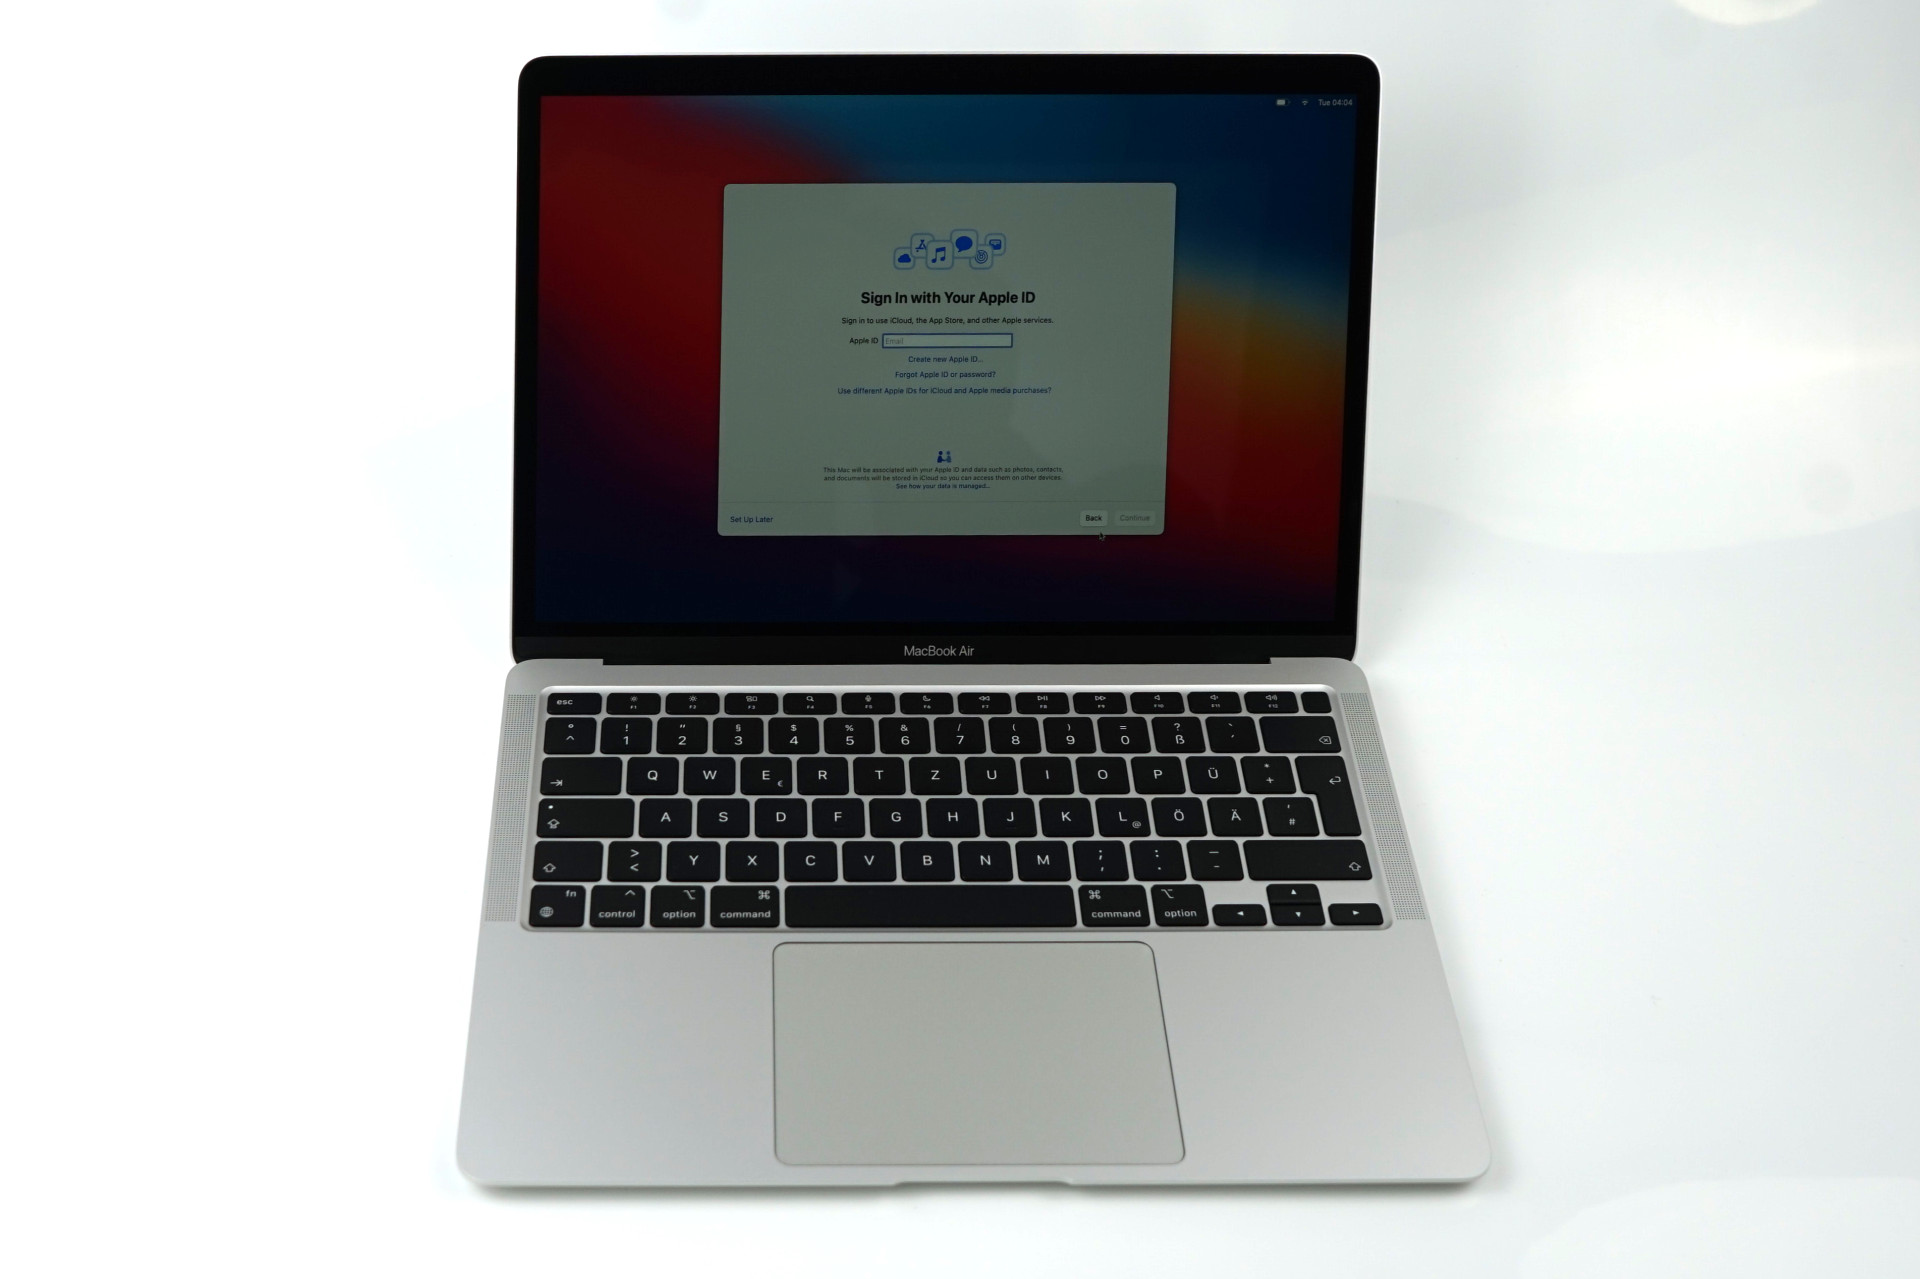
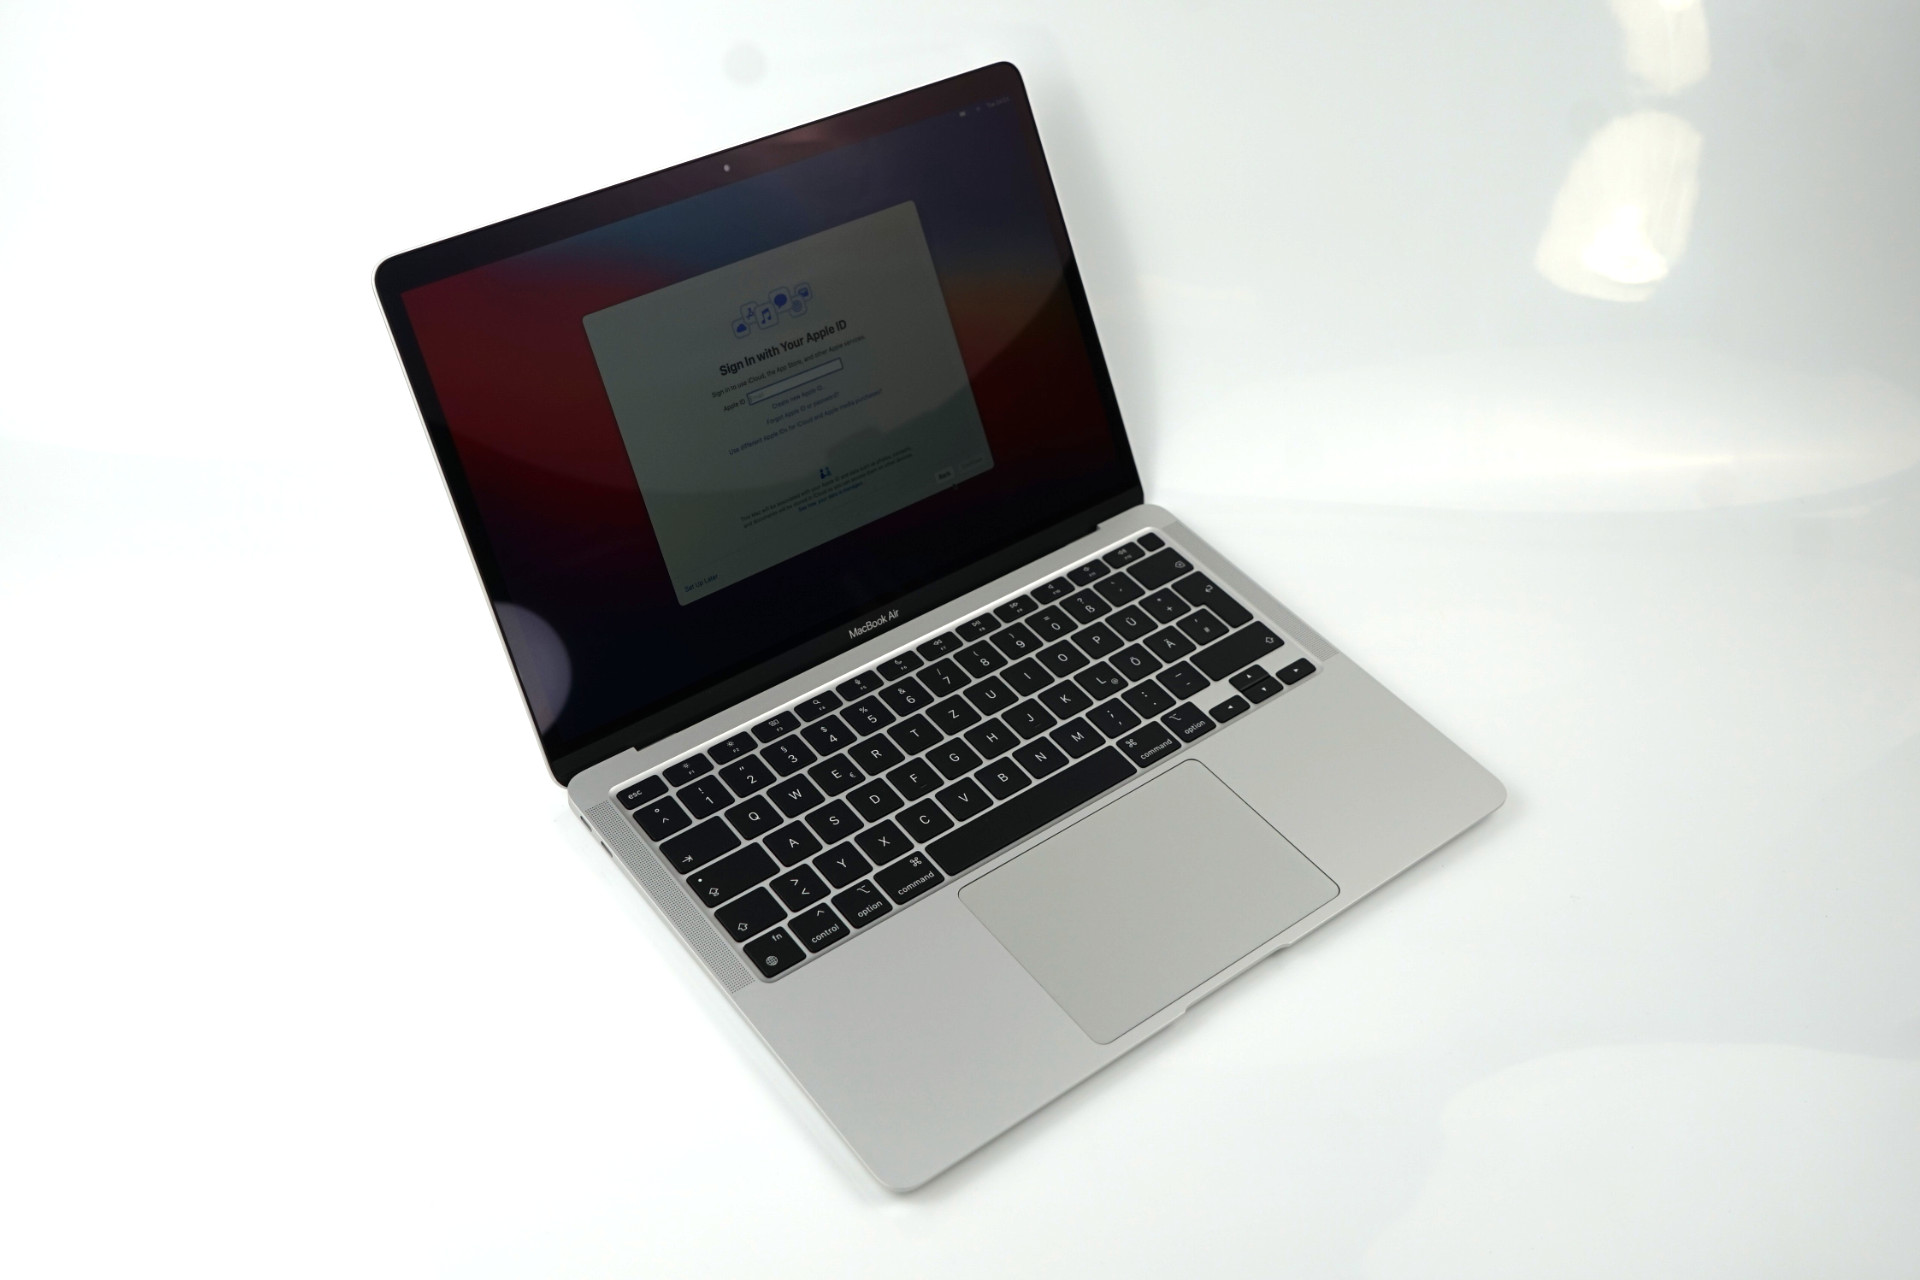
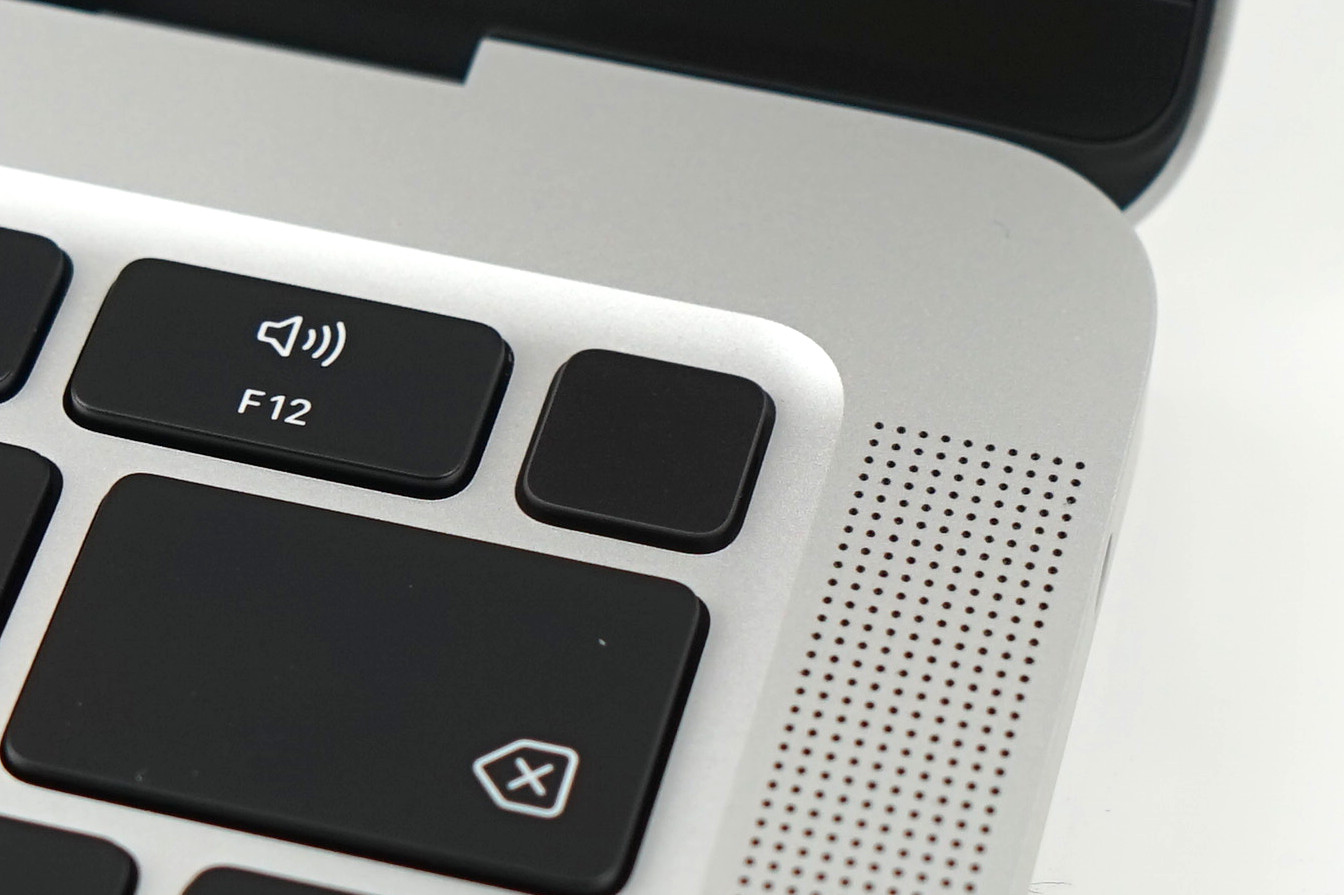
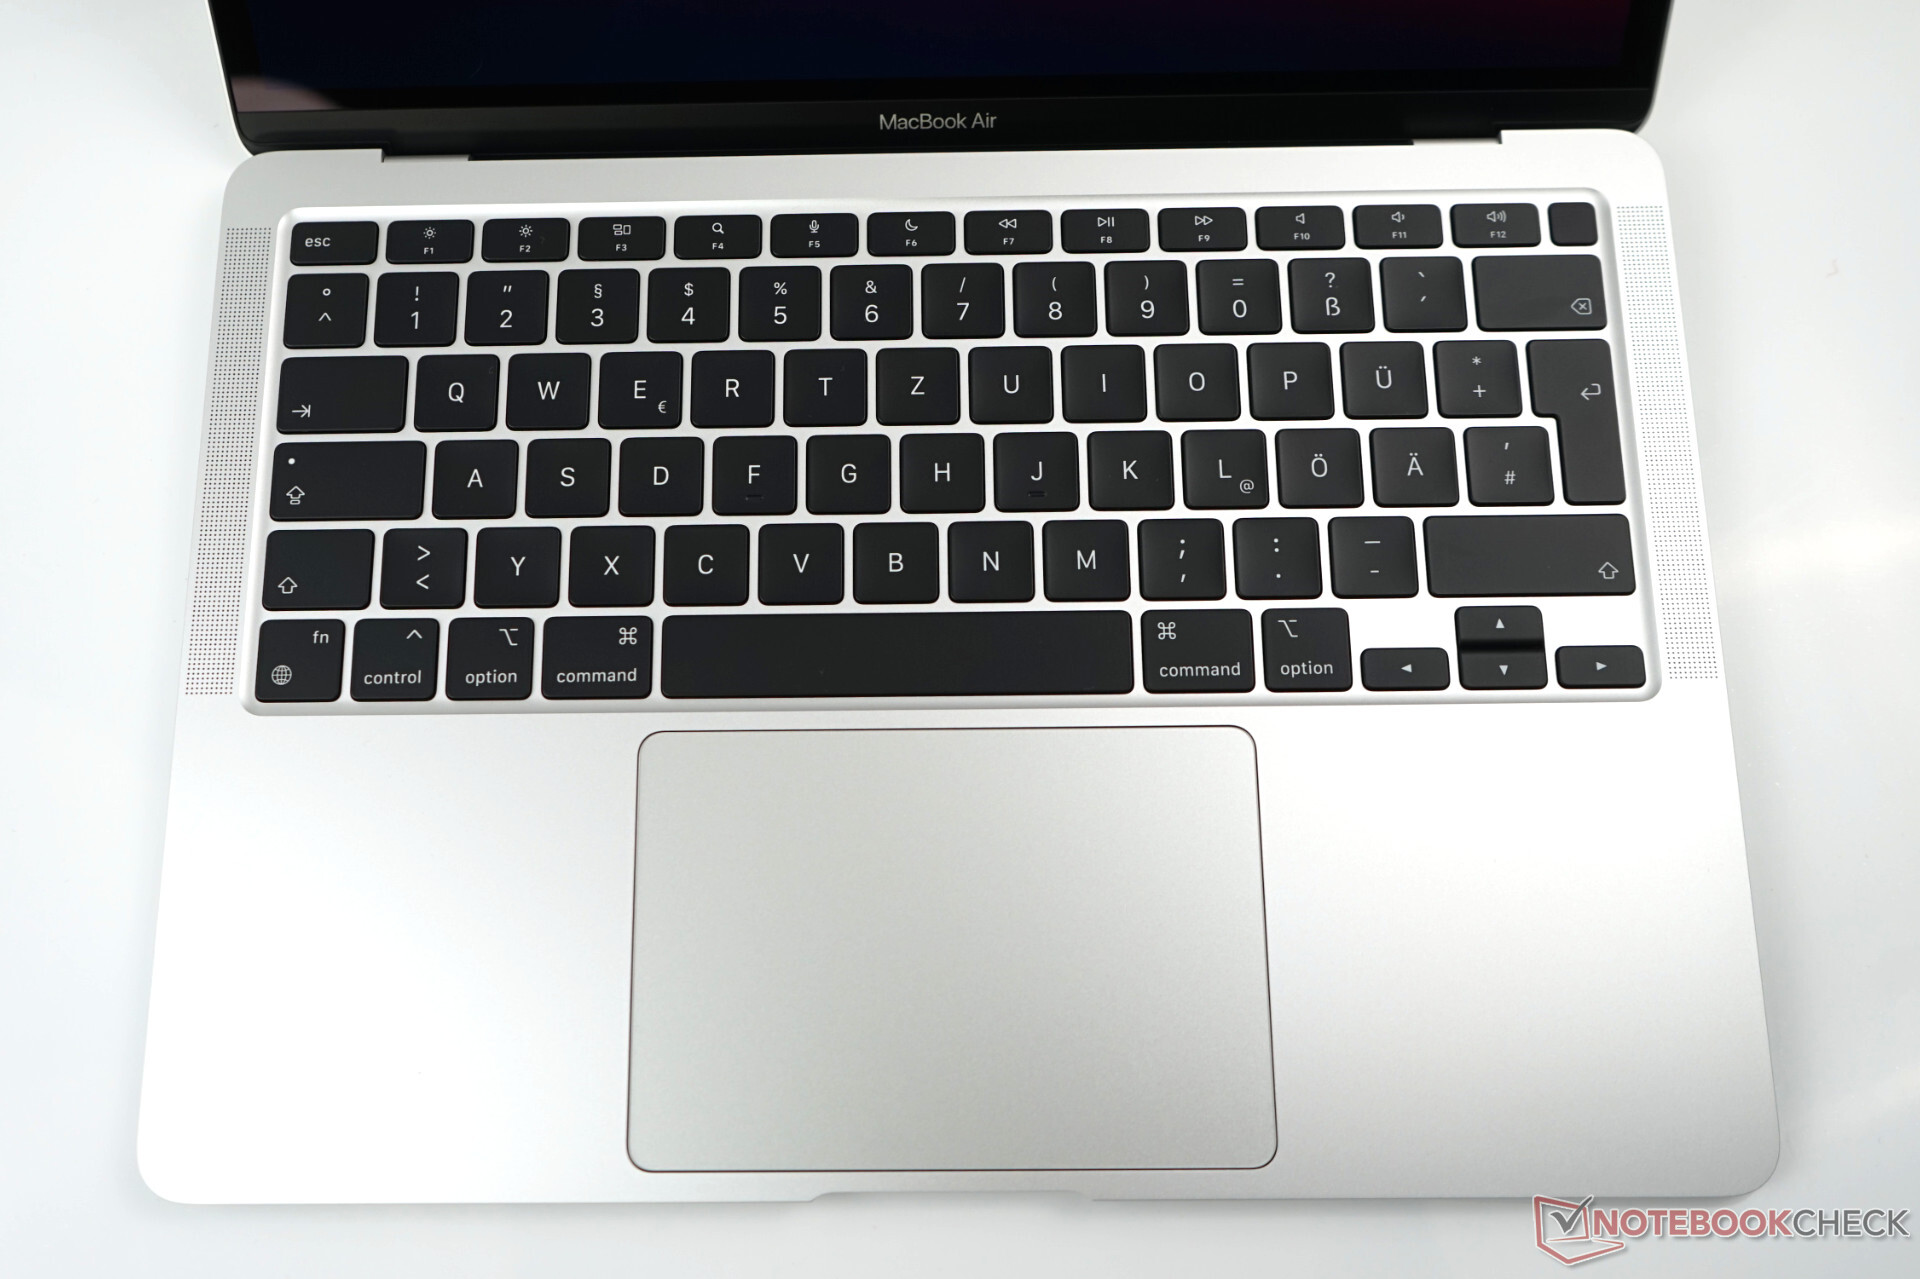
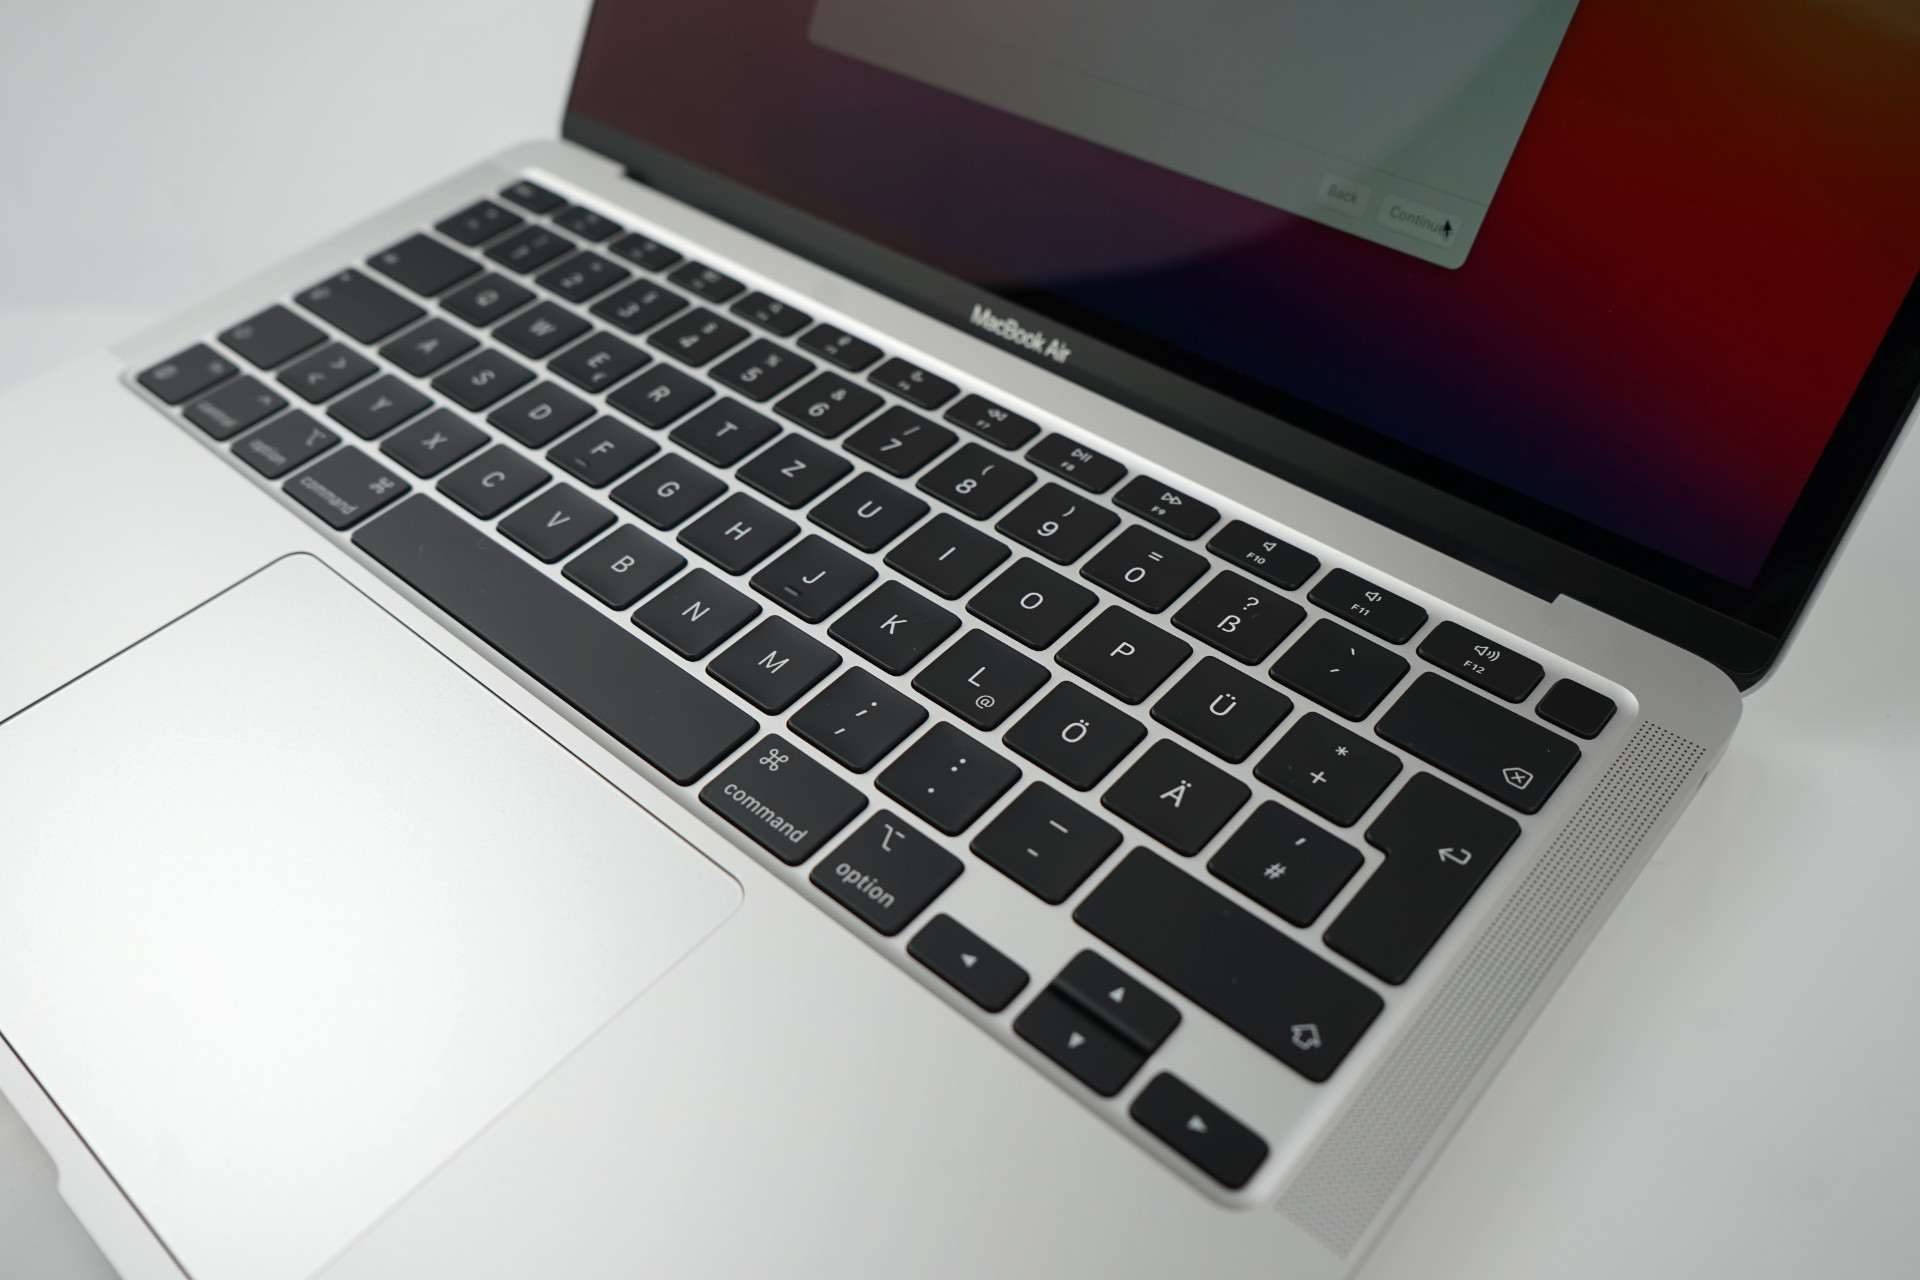
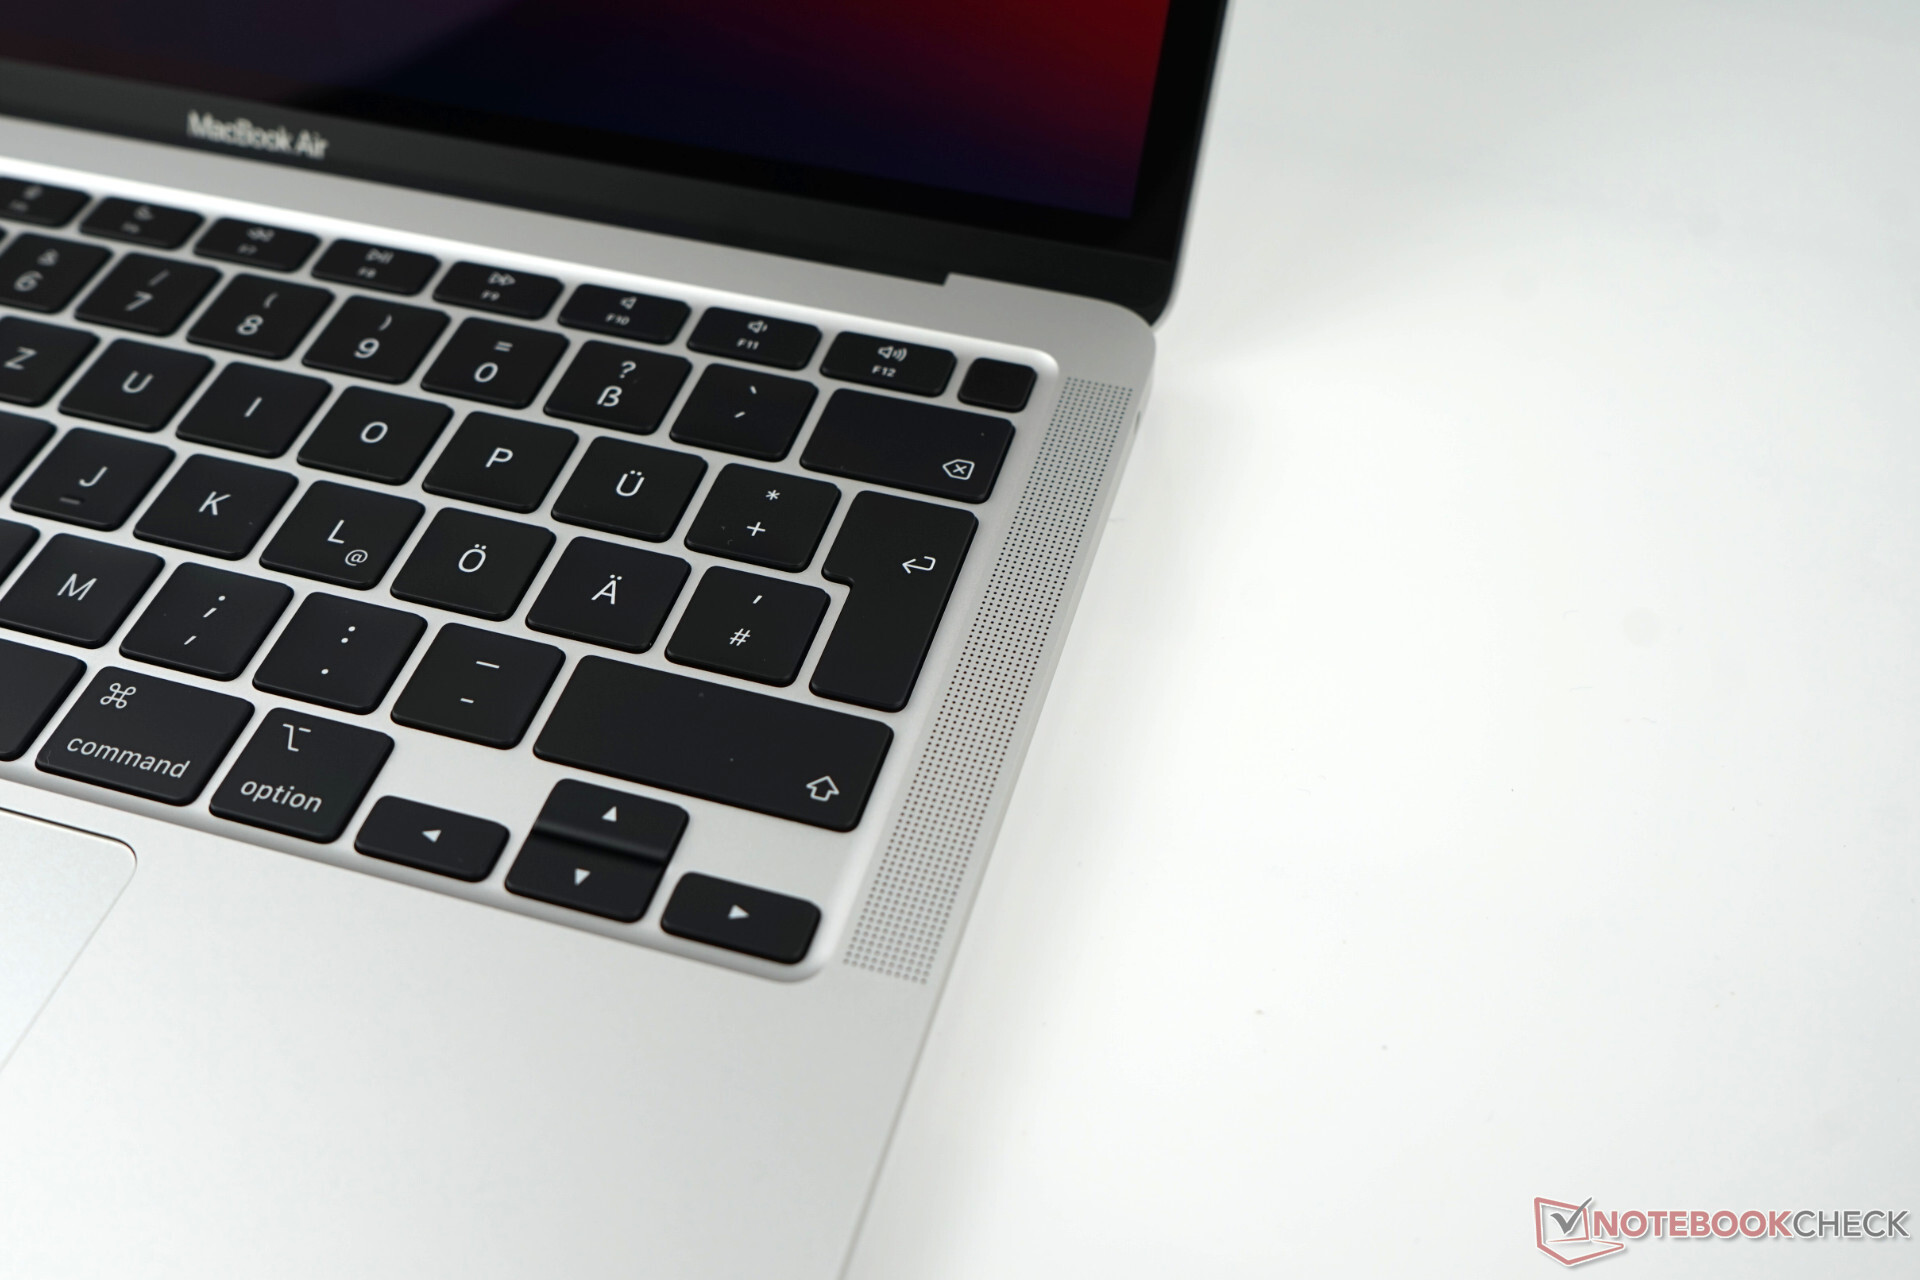
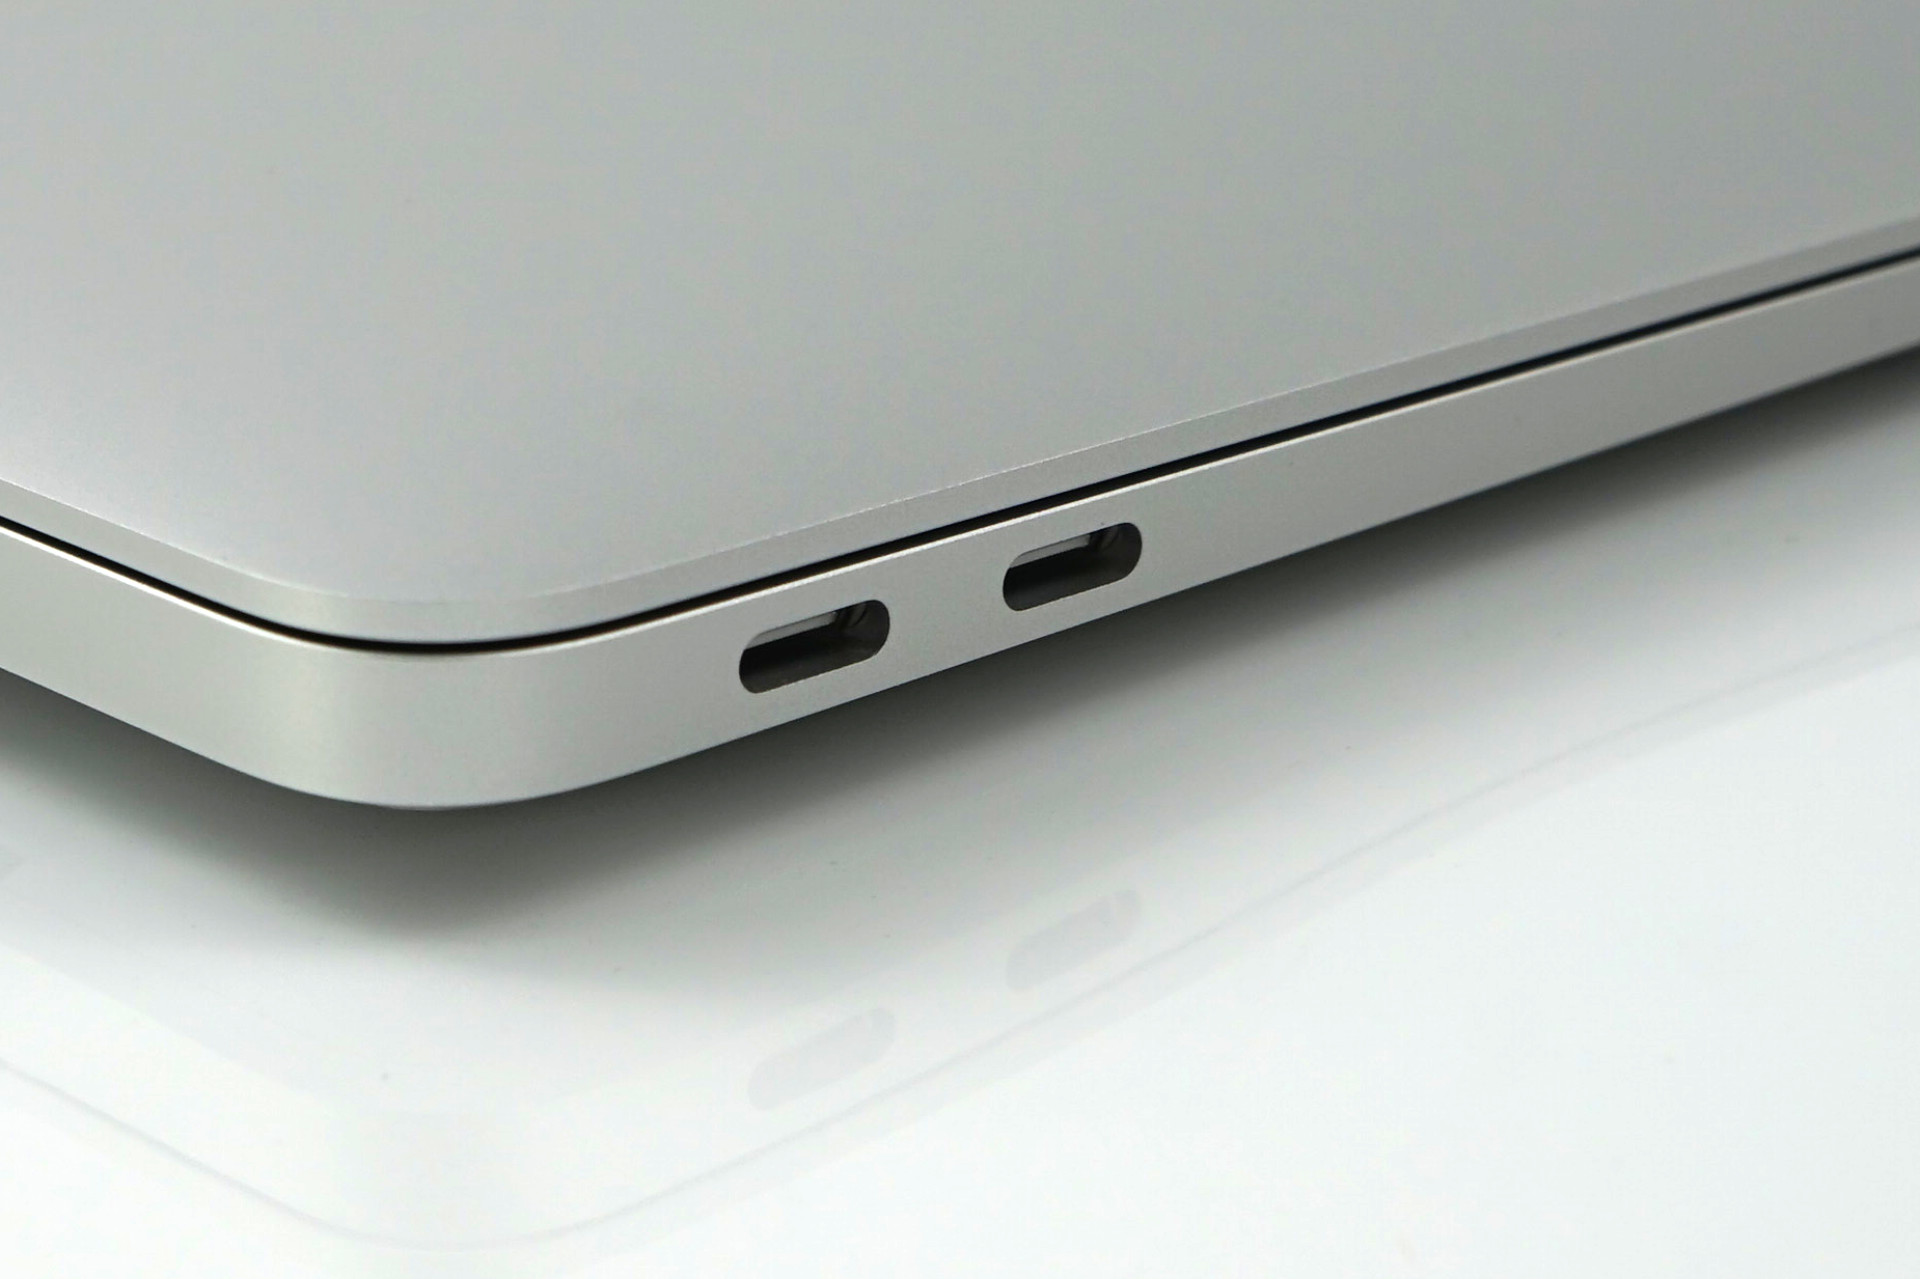
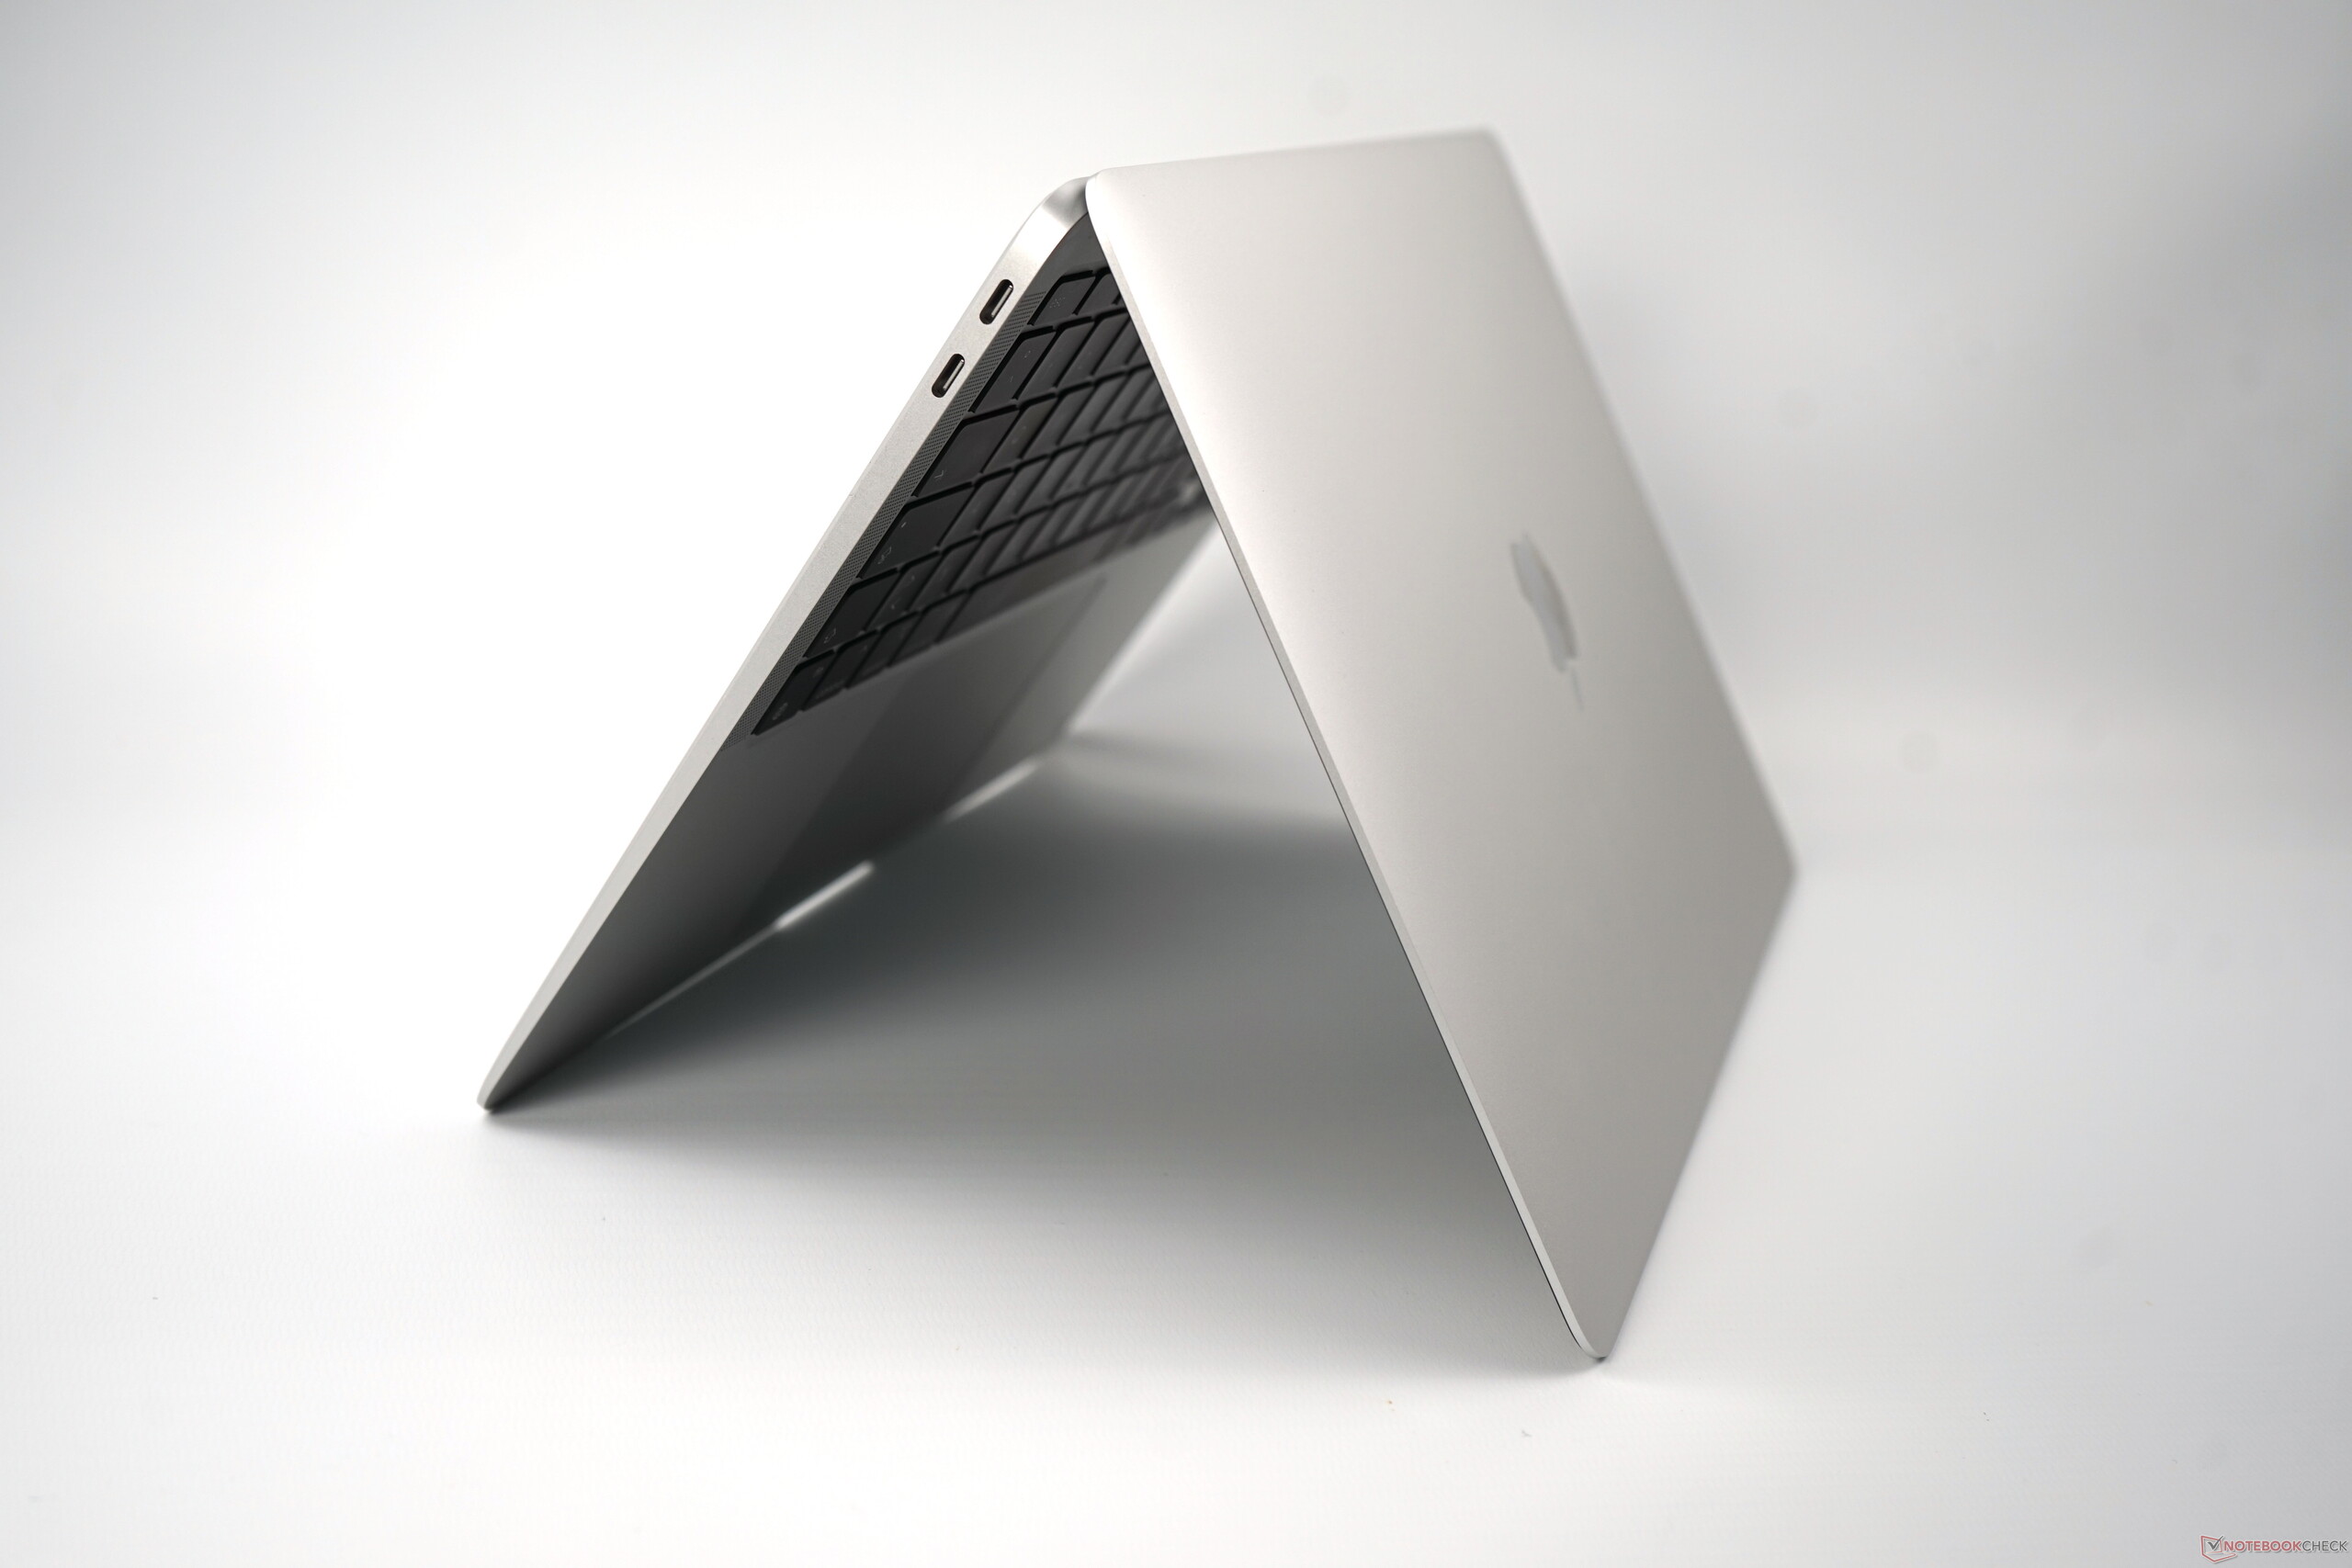
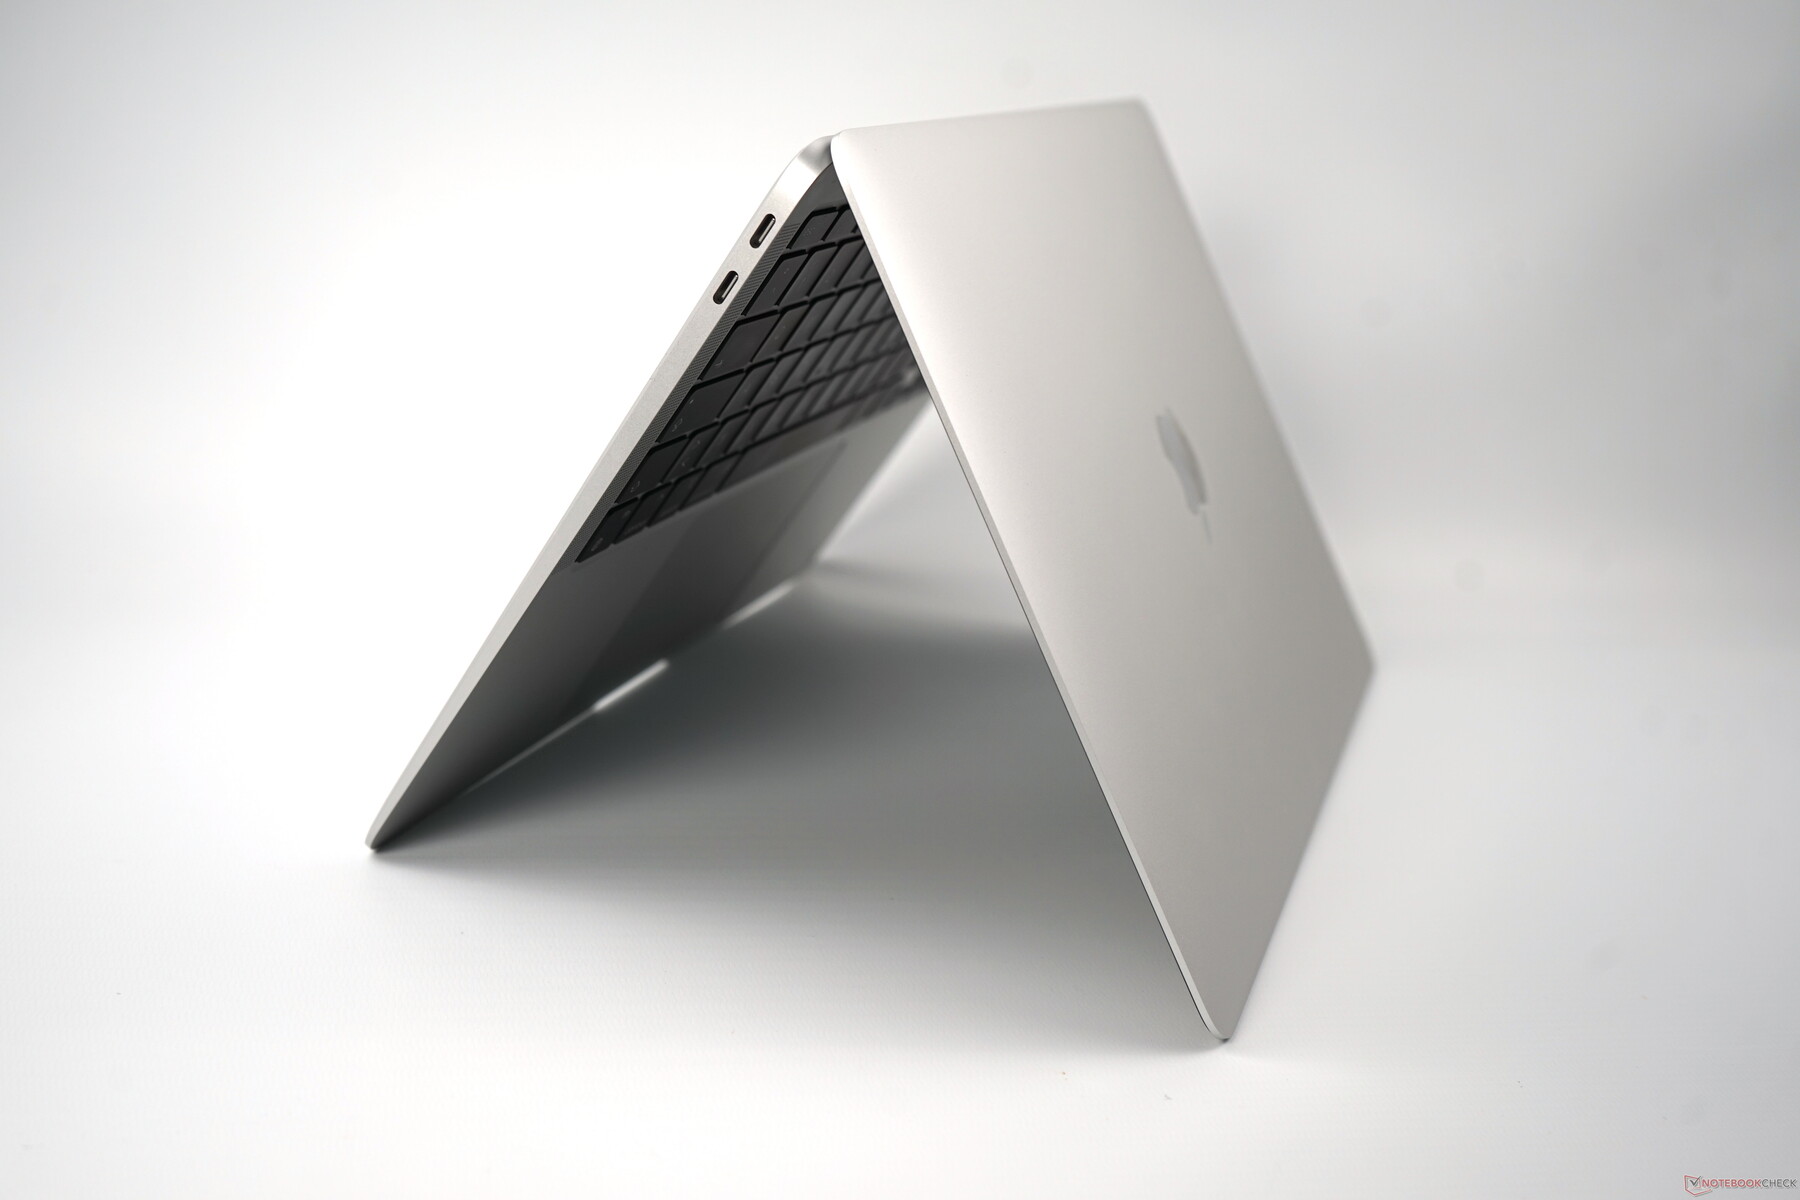
Höljet och skärmen är i princip oförändrade. Vi hade åtminstone gärna sett en tryckkänslig skärm - särskilt med tanke på iOS-kompatibiliteten, och smalare skärminfattning. I övrigt finns det ingen anledning att klaga på höljet, inmatningsenheterna eller högtalarna.
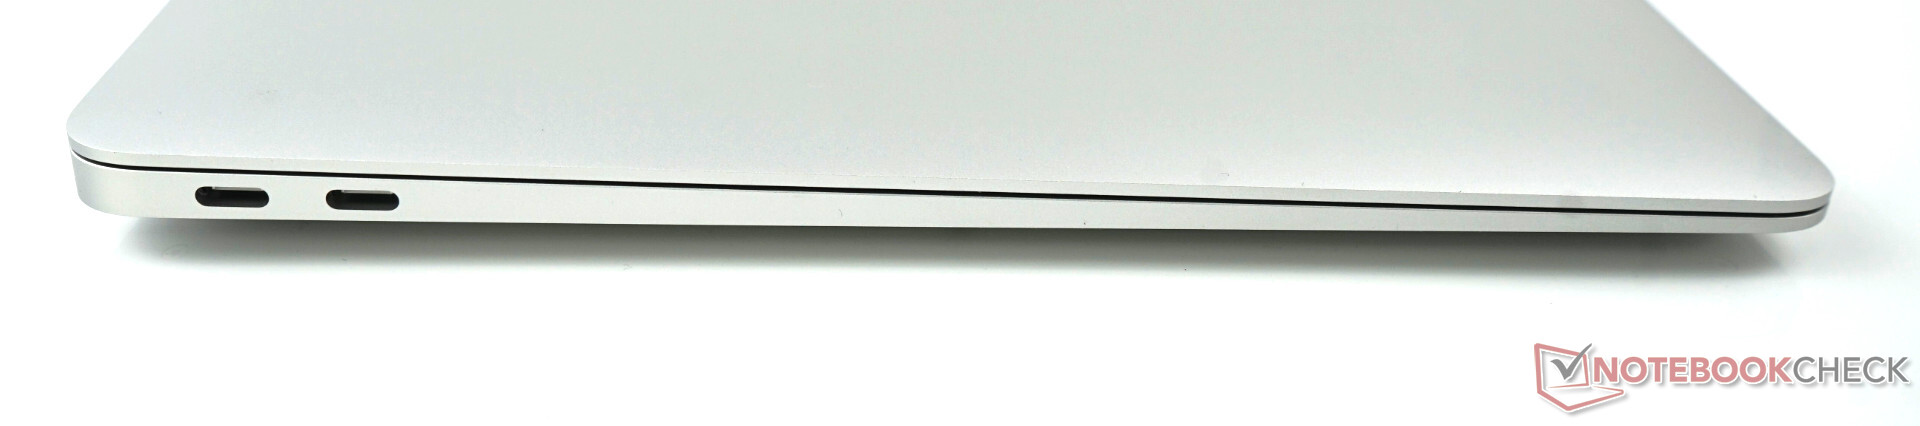
I fråga om pris är instegsnivån särskilt intressant, detta eftersom det alltid brukar finnas bra erbjudanden från olika tillverkare där. Den extra kostnaden för en åttakärnig GPU och 16 GB RAM är inte direkt prisvärda och prispåslaget för ytterligare lagring är väldigt högt. Att betala extra för en MacBook Pro 13 med aktiv kylning är också bara värt det för ett fåtal användare. Aktiv kylning, ett större batteri, en lite mer ljusstark skärm och en Touchbar är egentligen bara viktigt för en liten mängd människor. Mer avancerade användare borde dessutom vänta på M1X i de mer kraftfulla modellerna, där man också kan hoppas på fler än 2 TB3-portar.
Nya MacBook Air med ett M1-chip går redan att få tag på för runt 11.000 kronor från Amazon (gratis frakt) eller från andra ställen.
Apple MacBook Air 2020 M1 Entry
- 12/18/2020 v7 (old)
Klaus Hinum
Price comparison
