Test: Apple iPad Air 4 (2020) - Air-plattan närmar sig Pro-modellen (Sammanfattning)
Gradering | Datum | Modell | Vikt | Höjd | Storlek | Upplösning | Pris |
|---|---|---|---|---|---|---|---|
| 90.7 % v7 (old) | 11/2020 | Apple iPad Air 4 2020 A14, A14 Bionic GPU | 458 g | 6.1 mm | 10.90" | 2360x1640 | |
| 87.5 % v7 (old) | 04/2019 | Apple iPad Air 3 2019 A12 Bionic, A12 Bionic GPU | 456 g | 6.1 mm | 10.50" | 2224x1668 | |
| 88 % v7 (old) | 10/2020 | Apple iPad 10.2 2020 A12 Bionic, A12 Bionic GPU | 495 g | 7.5 mm | 10.20" | 2160x1620 | |
| 90.4 % v7 (old) | 04/2020 | Apple iPad Pro 11 2020 A12Z Bionic, A12Z Bionic GPU | 471 g | 5.9 mm | 11.00" | 2388x1668 | |
| 90.1 % v7 (old) | 10/2020 | Samsung Galaxy Tab S7 SD 865+ (Plus), Adreno 650 | 500 g | 6.3 mm | 11.00" | 2560x1600 | |
| 88.4 % v7 (old) | 08/2020 | Huawei MatePad Pro 10.8 Kirin 990, Mali-G76 MP16 | 460 g | 7.2 mm | 10.80" | 2560x1600 |
Bildjämförelse
Välj en scen och navigera inom den första bilden. Ett klick ändrar positionen på pekskärmar. Ett klick på den inzoomade bilden öppnar originalet i ett nytt fönster. Den första bilden visar det skalade fotografiet av testanordningen.
Wide angleWide angleZoom (5x)Low light


| |||||||||||||||||||||||||
Distribution av ljusstyrkan: 93 %
Mitt på batteriet: 509 cd/m²
Kontrast: 1305:1 (Svärta: 0.39 cd/m²)
ΔE ColorChecker Calman: 1.3 | ∀{0.5-29.43 Ø4.72}
ΔE Greyscale Calman: 2.2 | ∀{0.09-98 Ø4.97}
99.3% AdobeRGB 1998 (Argyll 1.6.3 3D)
Gamma: 2.21
CCT: 6833 K
| Apple iPad Air 4 2020 IPS, 2360x1640, 10.9" | Apple iPad Air 3 2019 IPS, 2224x1668, 10.5" | Apple iPad 10.2 2020 IPS, 2160x1620, 10.2" | Apple iPad Pro 11 2020 IPS, 2388x1668, 11" | Samsung Galaxy Tab S7 LTPS, 2560x1600, 11" | Huawei MatePad Pro 10.8 IPS, 2560x1600, 10.8" | |
|---|---|---|---|---|---|---|
| Screen | -15% | -34% | 21% | -16% | -29% | |
| Brightness middle (cd/m²) | 509 | 515 1% | 477 -6% | 617 21% | 554 9% | 606 19% |
| Brightness (cd/m²) | 486 | 483 -1% | 452 -7% | 585 20% | 535 10% | 579 19% |
| Brightness Distribution (%) | 93 | 90 -3% | 86 -8% | 84 -10% | 91 -2% | 89 -4% |
| Black Level * (cd/m²) | 0.39 | 0.41 -5% | 0.5 -28% | 0.36 8% | 0.33 15% | 0.32 18% |
| Contrast (:1) | 1305 | 1256 -4% | 954 -27% | 1714 31% | 1679 29% | 1894 45% |
| Colorchecker dE 2000 * | 1.3 | 1.6 -23% | 2.2 -69% | 0.94 28% | 2.1 -62% | 2.9 -123% |
| Colorchecker dE 2000 max. * | 2.8 | 4.4 -57% | 5 -79% | 1.87 33% | 7.1 -154% | 6 -114% |
| Greyscale dE 2000 * | 2.2 | 2.8 -27% | 3.3 -50% | 1.4 36% | 1.6 27% | 4.3 -95% |
| Gamma | 2.21 100% | 2.21 100% | 2.23 99% | 2.156 102% | 2.32 95% | 2.22 99% |
| CCT | 6833 95% | 6944 94% | 7019 93% | 6733 97% | 6623 98% | 7272 89% |
| Color Space (Percent of AdobeRGB 1998) (%) | 99.3 |
* ... mindre är bättre
Skärmflimmer / PWM (Puls-Width Modulation)
| Skärmflimmer / PWM upptäcktes inte | 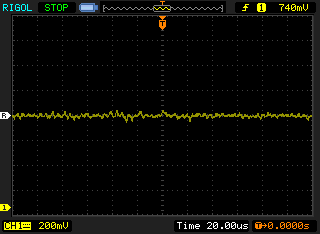 | ||
Som jämförelse: 52 % av alla testade enheter använder inte PWM för att dämpa skärmen. Om PWM upptäcktes mättes ett medelvärde av 7763 (minst: 5 - maximum: 343500) Hz. | |||
Visa svarstider
| ↔ Svarstid svart till vitt | ||
|---|---|---|
| 25.6 ms ... stiga ↗ och falla ↘ kombinerat | ↗ 12.4 ms stiga | 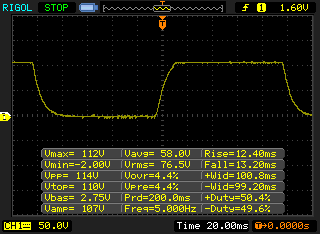 |
| ↘ 13.2 ms hösten | ||
| Skärmen visar relativt långsamma svarsfrekvenser i våra tester och kan vara för långsam för spelare. I jämförelse sträcker sig alla testade enheter från 0.1 (minst) till 240 (maximalt) ms. » 61 % av alla enheter är bättre. Detta innebär att den uppmätta svarstiden är sämre än genomsnittet av alla testade enheter (19.8 ms). | ||
| ↔ Svarstid 50 % grått till 80 % grått | ||
| 46.8 ms ... stiga ↗ och falla ↘ kombinerat | ↗ 23.6 ms stiga | 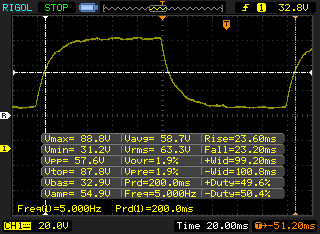 |
| ↘ 23.2 ms hösten | ||
| Skärmen visar långsamma svarsfrekvenser i våra tester och kommer att vara otillfredsställande för spelare. I jämförelse sträcker sig alla testade enheter från 0.165 (minst) till 636 (maximalt) ms. » 81 % av alla enheter är bättre. Detta innebär att den uppmätta svarstiden är sämre än genomsnittet av alla testade enheter (31 ms). | ||
| Jetstream 2 - 2.0 Total | |
| Apple iPad Air 4 2020 (Safari Mobile 14) | |
| Genomsnitt Apple A14 Bionic (158.2 - 178.9, n=6) | |
| Genomsnitt av klass Tablet (35.8 - 395, n=56, senaste 2 åren) | |
| Apple iPad Pro 11 2020 (Safari 14.1) | |
| Apple iPad Pro 11 2020 (Chrome 80) | |
| Apple iPad 10.2 2020 (Safari Mobile 14) | |
| Apple iPad Air 3 2019 (Safari Mobile 12) | |
| Samsung Galaxy Tab S7 (Chrome86) | |
| Huawei MatePad Pro 10.8 (Huawei Browser V10.1.2) | |
| JetStream 1.1 - 1.1 Total | |
| Apple iPad Air 4 2020 (Safari Mobile 14) | |
| Genomsnitt Apple A14 Bionic (305 - 376, n=5) | |
| Apple iPad Pro 11 2020 (Chrome 80) | |
| Apple iPad 10.2 2020 (Safari Mobile 14) | |
| Samsung Galaxy Tab S7 (Chrome86) | |
| Huawei MatePad Pro 10.8 (Huawei Browser V10.1.2) | |
| WebXPRT 3 - Overall | |
| Genomsnitt av klass Tablet (108 - 480, n=10, senaste 2 åren) | |
| Genomsnitt Apple A14 Bionic (191 - 214, n=6) | |
| Apple iPad Air 4 2020 (Safari Mobile 14) | |
| Apple iPad Pro 11 2020 (Safari 14.1) | |
| Apple iPad Pro 11 2020 (Chrome 80) | |
| Apple iPad 10.2 2020 (Safari Mobile 14) | |
| Apple iPad Air 3 2019 (Safari Mobile 12) | |
| Samsung Galaxy Tab S7 (Chrome86) | |
| Huawei MatePad Pro 10.8 (Huawei Browser V10.1.2) | |
| Speedometer 2.0 - Result 2.0 | |
| Genomsnitt av klass Tablet (2.59 - 790, n=36, senaste 2 åren) | |
| Genomsnitt Apple A14 Bionic (188 - 272, n=6) | |
| Apple iPad Air 4 2020 (Safari Mobile 14) | |
| Apple iPad Pro 11 2020 (Safari 14.1) | |
| Apple iPad 10.2 2020 (Safari Mobile 14) | |
| Apple iPad Air 3 2019 (Safari Mobile 12) | |
| Samsung Galaxy Tab S7 (Chrome86) | |
| Huawei MatePad Pro 10.8 (Huawei Browser V10.1.2) | |
| Octane V2 - Total Score | |
| Apple iPad Air 4 2020 (Safari Mobile 14) | |
| Genomsnitt Apple A14 Bionic (55710 - 59963, n=6) | |
| Genomsnitt av klass Tablet (763 - 138481, n=71, senaste 2 åren) | |
| Apple iPad Pro 11 2020 (Safari 14.1) | |
| Apple iPad Pro 11 2020 (Chrome 80) | |
| Apple iPad Air 3 2019 (Safari Mobile 12) | |
| Apple iPad 10.2 2020 (Safari Mobile 14) | |
| Samsung Galaxy Tab S7 (Chrome86) | |
| Huawei MatePad Pro 10.8 (Huawei Browser V10.1.2) | |
| Mozilla Kraken 1.1 - Total | |
| Huawei MatePad Pro 10.8 (Huawei Browser V10.1.2) | |
| Genomsnitt av klass Tablet (243 - 27101, n=65, senaste 2 åren) | |
| Samsung Galaxy Tab S7 (Chrome86) | |
| Apple iPad 10.2 2020 (Safari Mobile 14) | |
| Apple iPad Pro 11 2020 (Chrome 80) | |
| Apple iPad Air 3 2019 (Safari Mobile 12) | |
| Genomsnitt Apple A14 Bionic (460 - 547, n=6) | |
| Apple iPad Air 4 2020 (Safari Mobile 14) | |
* ... mindre är bättre
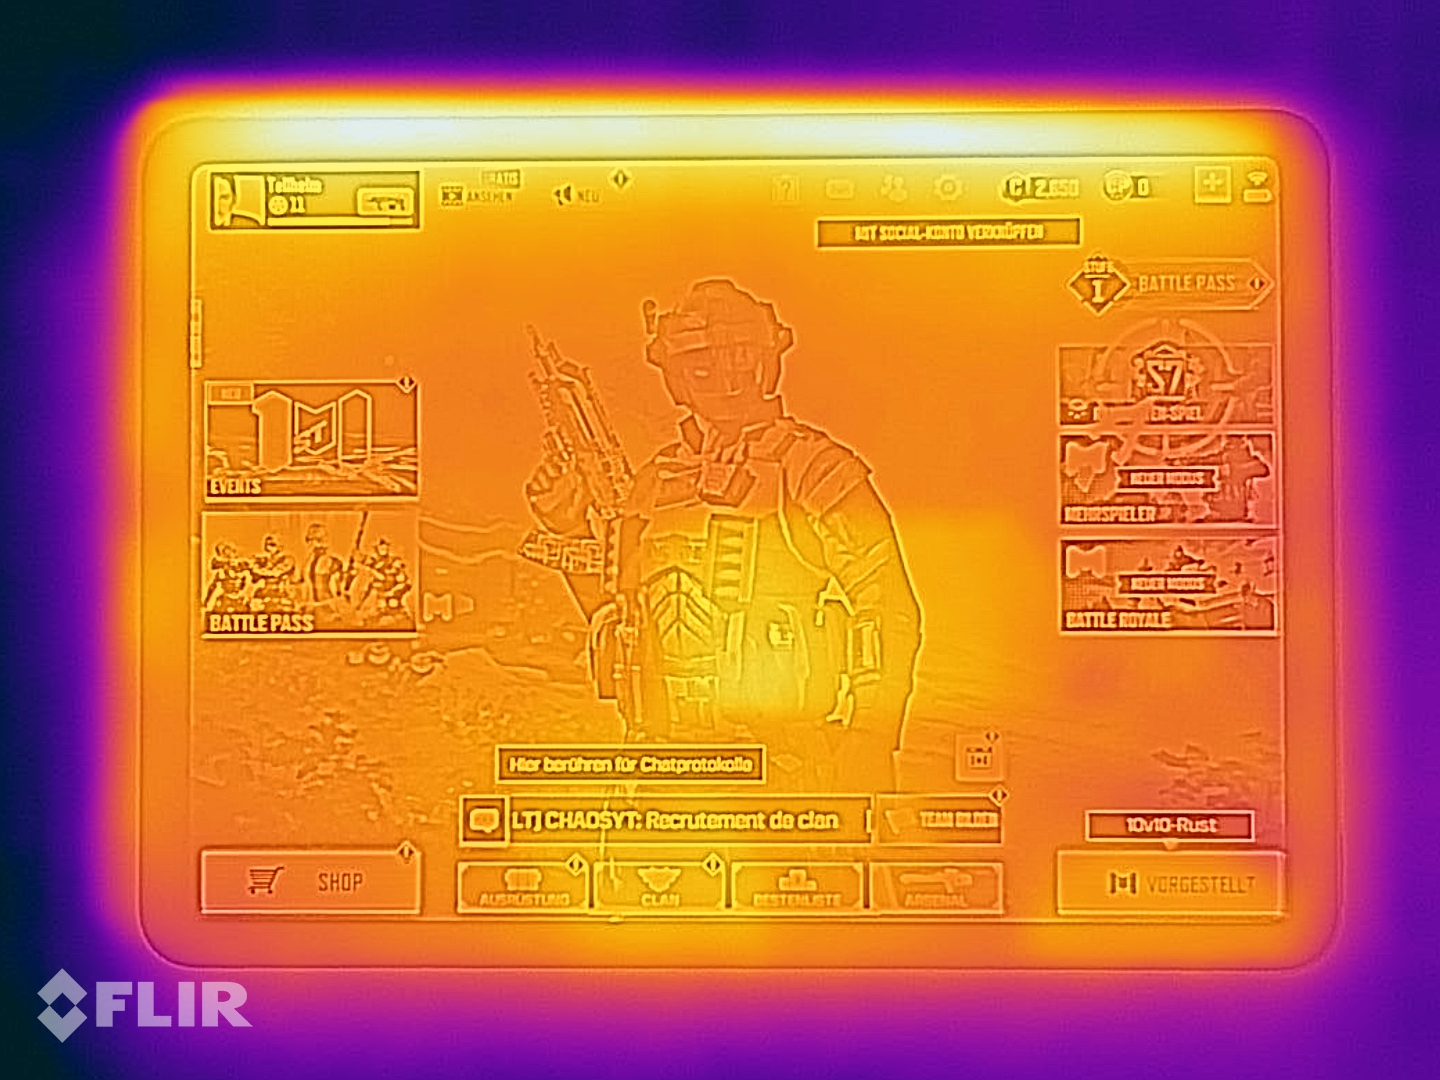
(+) Den maximala temperaturen på ovansidan är 34.4 °C / 94 F, jämfört med genomsnittet av 33.6 °C / 92 F , allt från 20.7 till 53.2 °C för klassen Tablet.
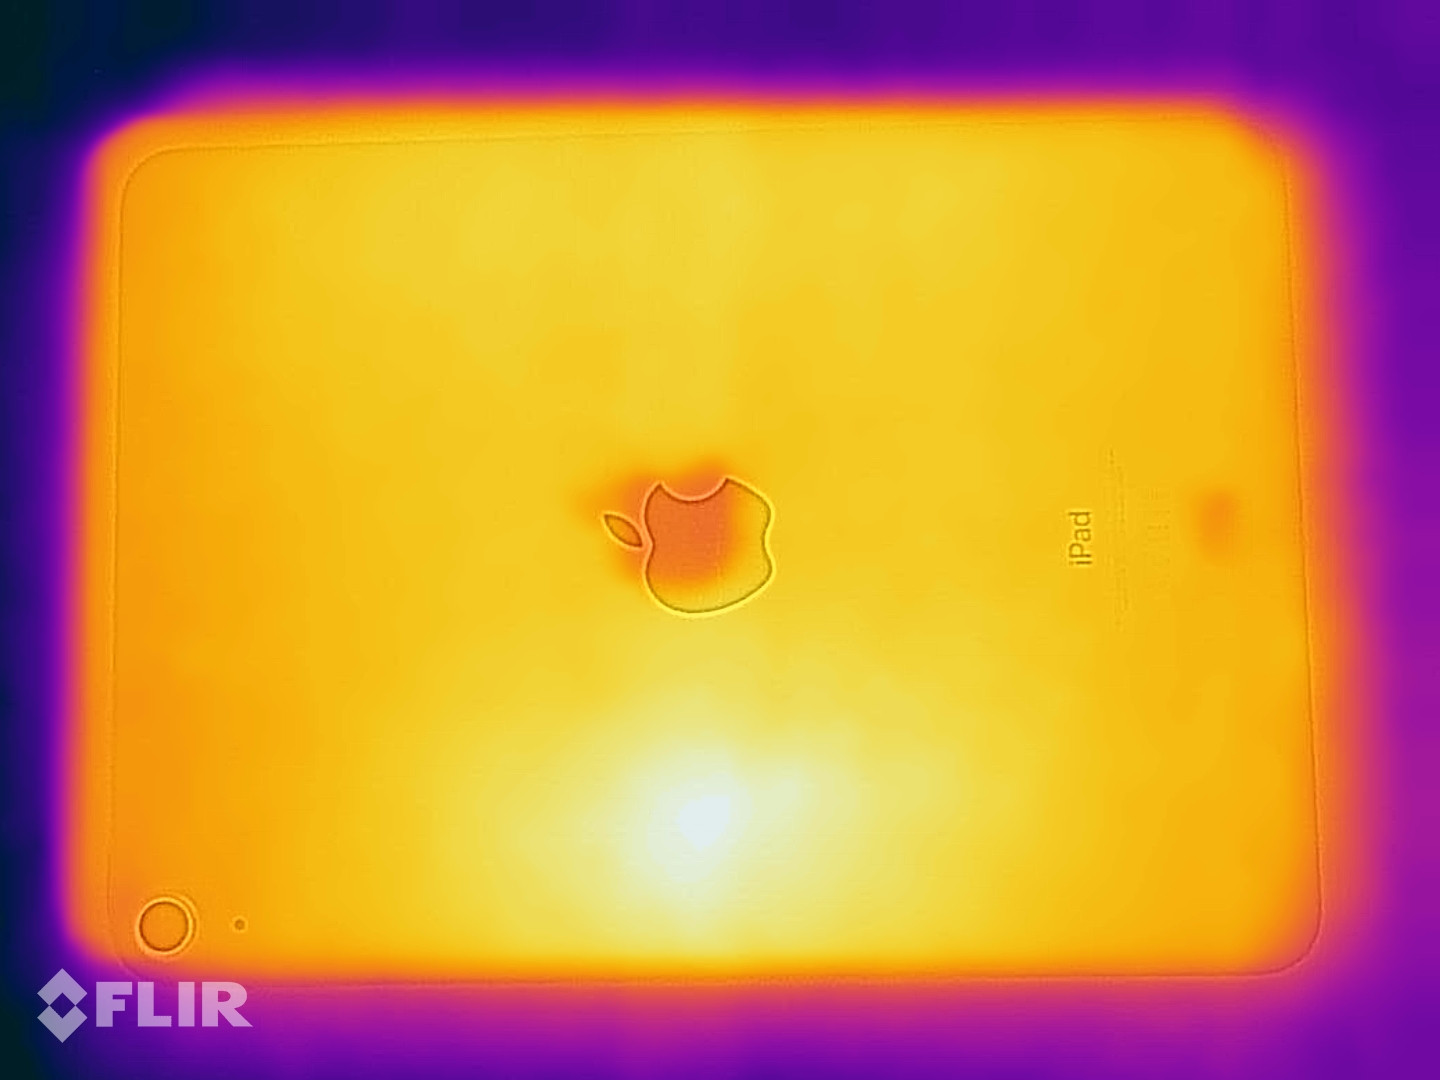
(+) Botten värms upp till maximalt 30.5 °C / 87 F, jämfört med genomsnittet av 33.2 °C / 92 F
(+) Vid tomgångsbruk är medeltemperaturen för ovansidan 29.7 °C / 85 F, jämfört med enhetsgenomsnittet på 30 °C / ### class_avg_f### F.
Apple iPad Air 4 2020 ljudanalys
(+) | högtalare kan spela relativt högt (86.3 dB)
Bas 100 - 315 Hz
(±) | reducerad bas - i genomsnitt 14.2% lägre än medianen
(±) | linjäriteten för basen är genomsnittlig (12.2% delta till föregående frekvens)
Mellan 400 - 2000 Hz
(+) | balanserad mellan - endast 3.8% från medianen
(+) | mids är linjära (3.8% delta till föregående frekvens)
Högsta 2 - 16 kHz
(±) | högre toppar - i genomsnitt 5.3% högre än medianen
(+) | toppar är linjära (4.9% delta till föregående frekvens)
Totalt 100 - 16 000 Hz
(+) | det totala ljudet är linjärt (12.9% skillnad mot median)
Jämfört med samma klass
» 21% av alla testade enheter i den här klassen var bättre, 4% liknande, 75% sämre
» Den bästa hade ett delta på 7%, genomsnittet var 20%, sämst var 129%
Jämfört med alla testade enheter
» 12% av alla testade enheter var bättre, 3% liknande, 85% sämre
» Den bästa hade ett delta på 4%, genomsnittet var 24%, sämst var 134%
Apple iPad 10.2 2020 ljudanalys
(+) | högtalare kan spela relativt högt (93.1 dB)
Bas 100 - 315 Hz
(-) | nästan ingen bas - i genomsnitt 17.3% lägre än medianen
(+) | basen är linjär (4.1% delta till föregående frekvens)
Mellan 400 - 2000 Hz
(±) | reducerade mids - i genomsnitt 5.6% lägre än median
(+) | mids är linjära (4.2% delta till föregående frekvens)
Högsta 2 - 16 kHz
(±) | högre toppar - i genomsnitt 7.1% högre än medianen
(+) | toppar är linjära (6.9% delta till föregående frekvens)
Totalt 100 - 16 000 Hz
(±) | linjäriteten för det totala ljudet är genomsnittlig (15.8% skillnad mot median)
Jämfört med samma klass
» 35% av alla testade enheter i den här klassen var bättre, 5% liknande, 60% sämre
» Den bästa hade ett delta på 7%, genomsnittet var 20%, sämst var 129%
Jämfört med alla testade enheter
» 24% av alla testade enheter var bättre, 5% liknande, 71% sämre
» Den bästa hade ett delta på 4%, genomsnittet var 24%, sämst var 134%
| Av/Standby | |
| Låg belastning | |
| Hög belastning |
|
Förklaring:
min: | |
| Apple iPad Air 4 2020 mAh | Apple iPad Air 3 2019 8134 mAh | Apple iPad 10.2 2020 8827 mAh | Apple iPad Pro 11 2020 7538 mAh | Samsung Galaxy Tab S7 8000 mAh | Huawei MatePad Pro 10.8 7250 mAh | |
|---|---|---|---|---|---|---|
| Power Consumption | -2% | -5% | -6% | 19% | 13% | |
| Idle Minimum * (Watt) | 1.3 | 2.18 -68% | 2.12 -63% | 1.3 -0% | 1.16 11% | 1.98 -52% |
| Idle Average * (Watt) | 7.89 | 6.4 19% | 6.43 19% | 3.5 56% | 4.42 44% | 5.66 28% |
| Idle Maximum * (Watt) | 7.91 | 6.43 19% | 6.69 15% | 5.6 29% | 4.43 44% | 5.69 28% |
| Load Average * (Watt) | 9.28 | 7.48 19% | 8.17 12% | 12.5 -35% | 8.86 5% | 6.96 25% |
| Load Maximum * (Watt) | 10.78 | 10.65 1% | 11.84 -10% | 19.2 -78% | 11.6 -8% | 6.98 35% |
* ... mindre är bättre
| Apple iPad Air 4 2020 mAh | Apple iPad Air 3 2019 8134 mAh | Apple iPad 10.2 2020 8827 mAh | Apple iPad Pro 11 2020 7538 mAh | Samsung Galaxy Tab S7 8000 mAh | Huawei MatePad Pro 10.8 7250 mAh | |
|---|---|---|---|---|---|---|
| Batteridrifttid | -16% | 6% | 4% | 0% | 4% | |
| Reader / Idle (h) | 34 | 25 -26% | 37.4 10% | 33.4 -2% | 32.7 -4% | 31.3 -8% |
| H.264 (h) | 11.2 | 11.4 2% | 15.6 39% | 15.6 39% | 14.8 32% | 15.2 36% |
| WiFi v1.3 (h) | 11.7 | 12.3 5% | 13 11% | 15 28% | 13.5 15% | 14.9 27% |
| Load (h) | 6.5 | 3.6 -45% | 4 -38% | 3.3 -49% | 3.7 -43% | 3.9 -40% |
För
Emot
Omdöme - Utförlig uppgradering av Air

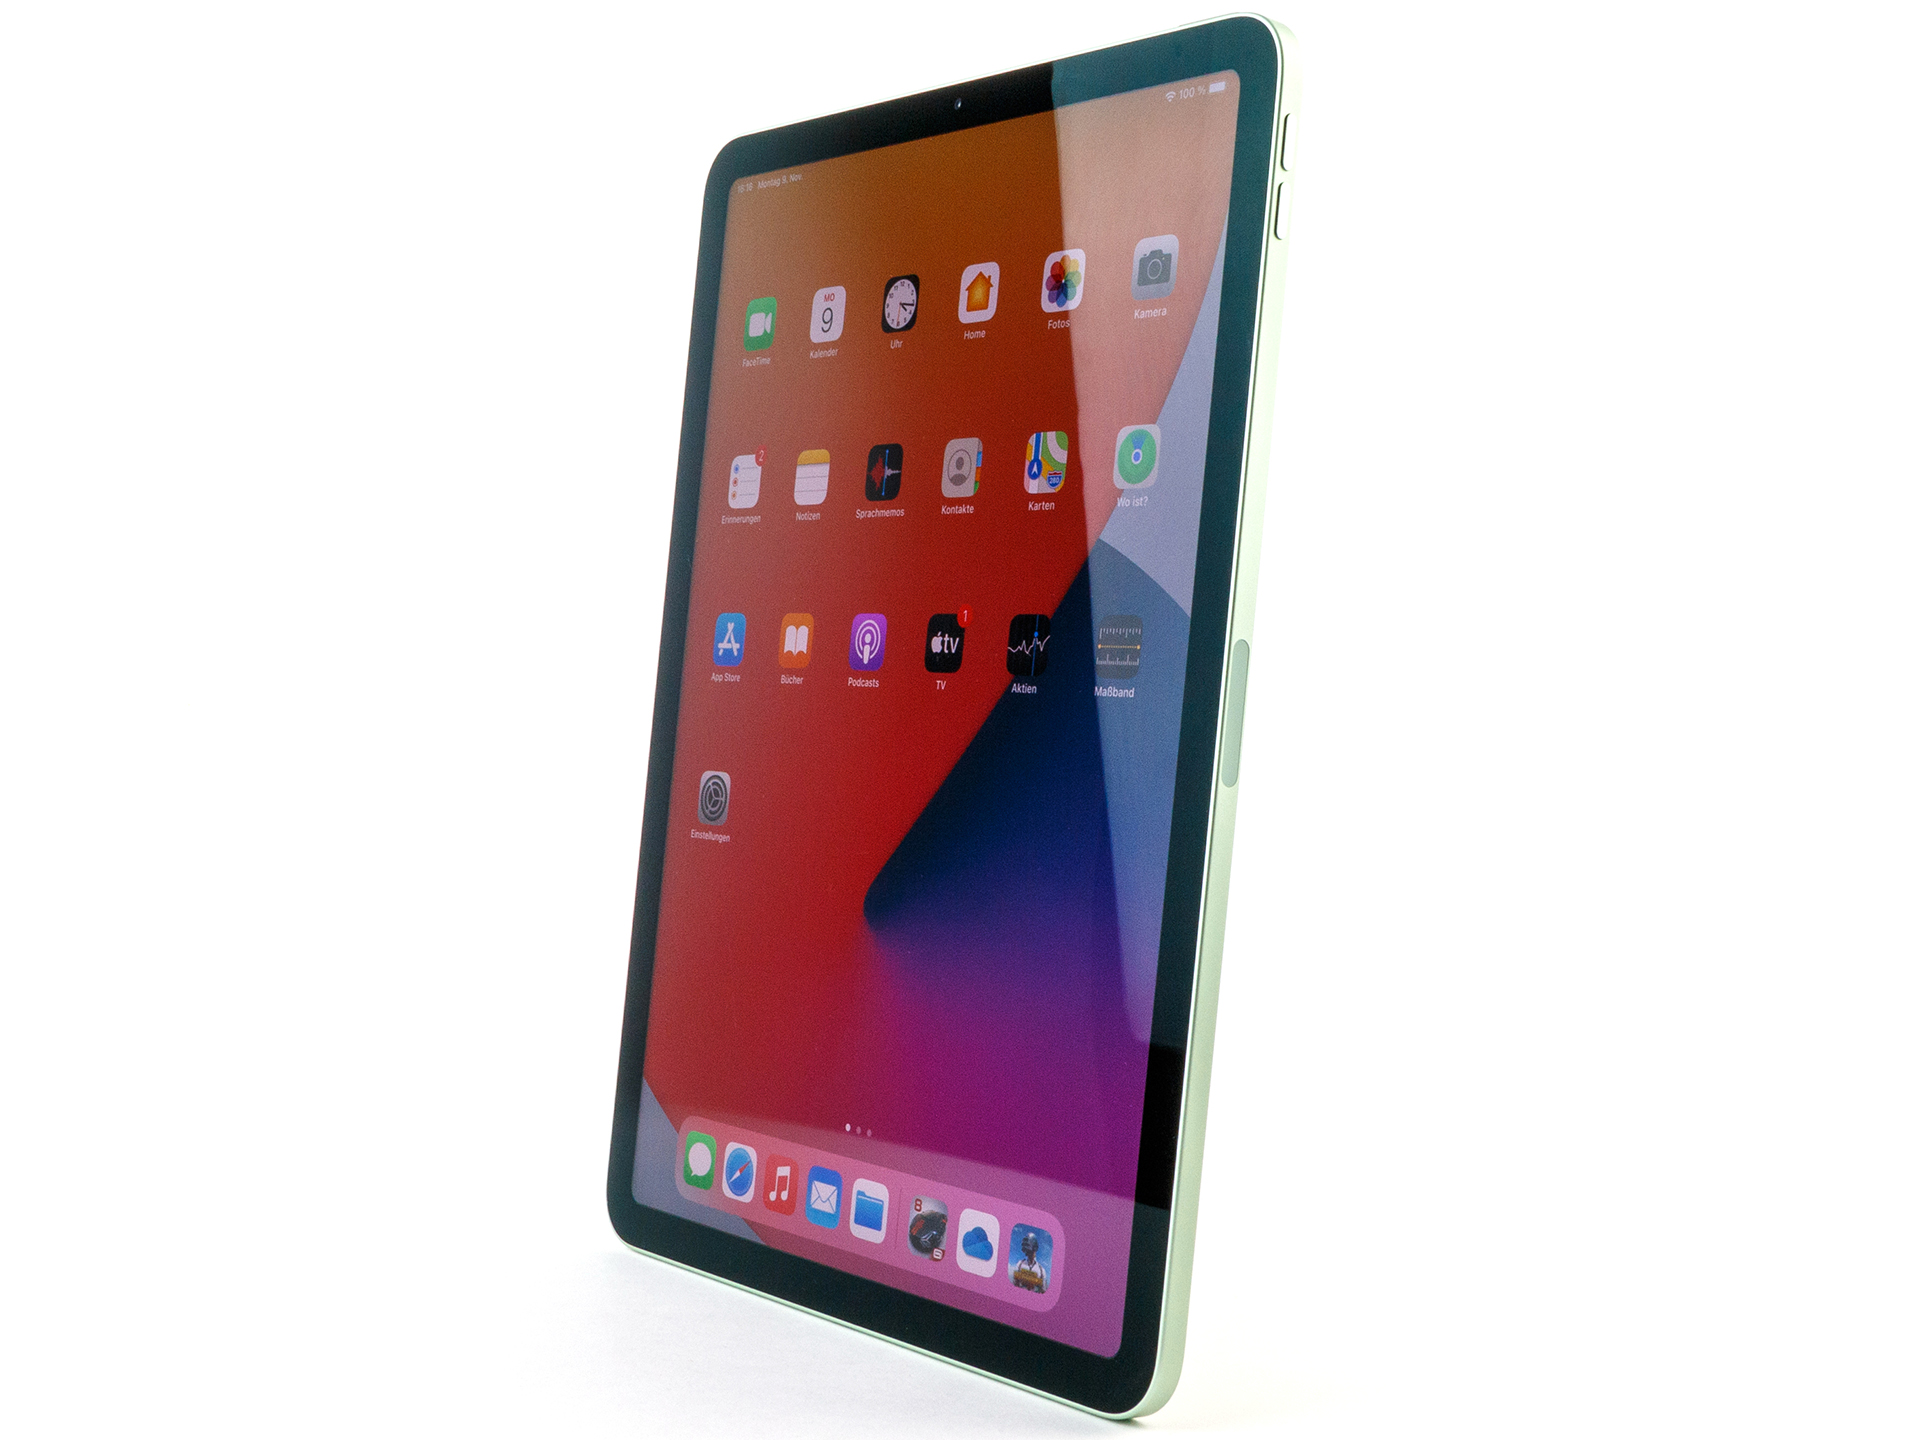
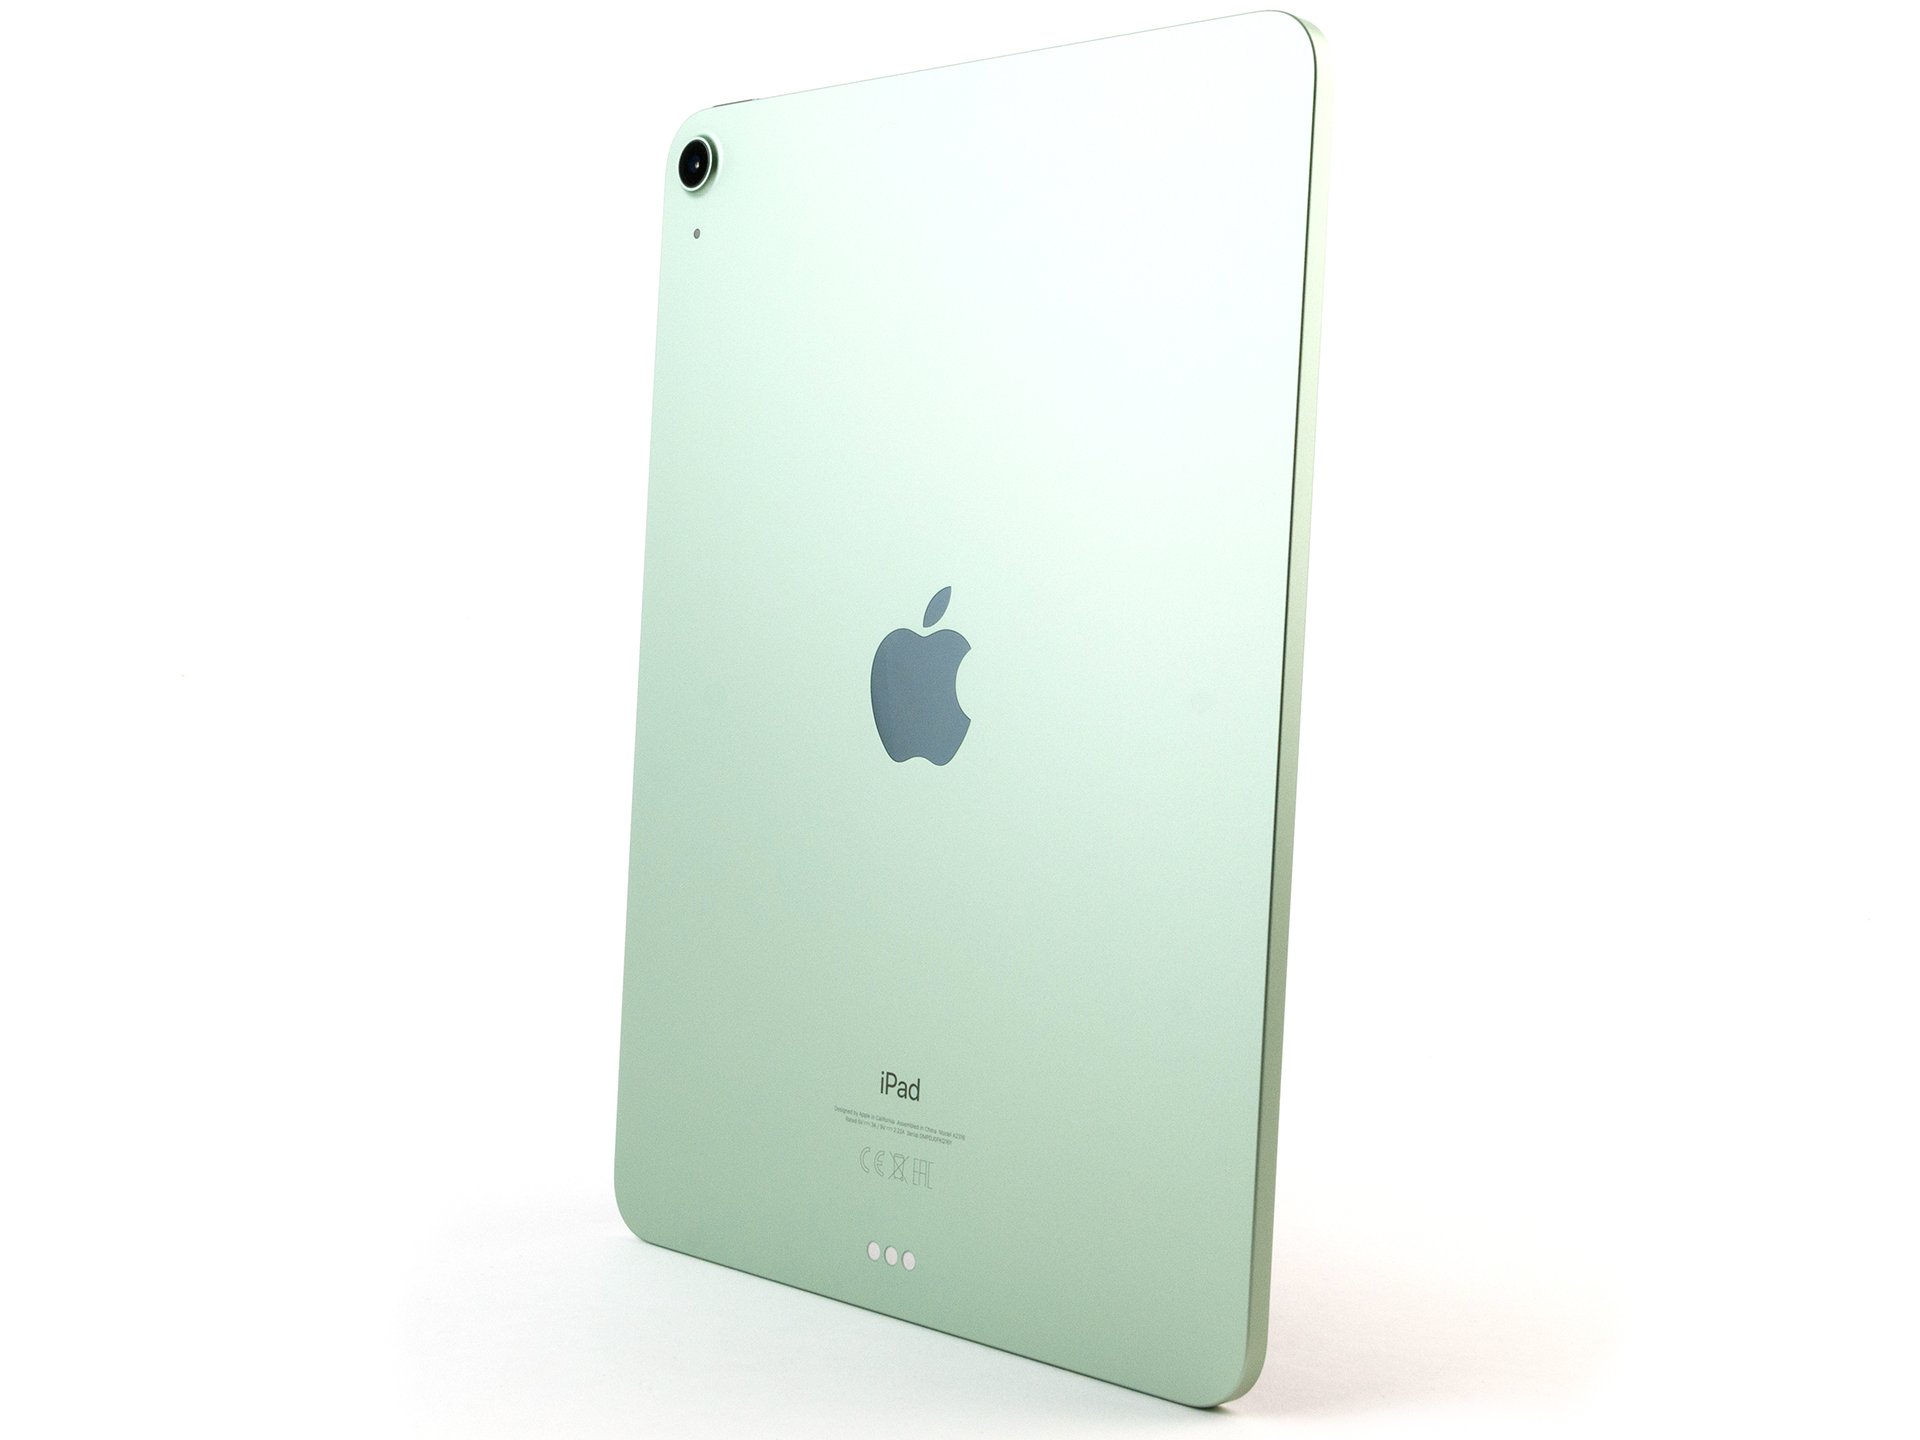
Även 2020 års modell av iPad Air kommer fortsatt placera sig mellan iPad 8 och iPad Pro 11, men den ser nu mer ut som Pro-modellen. Detta märks inte bara på den nya designen utan också på att tillbehör som Magic Keyboard eller Pencil 2 går att använda på båda modellerna.
4:e generationen av iPad Air är en utförlig uppgradering och den närmar sig Pro-modellerna.
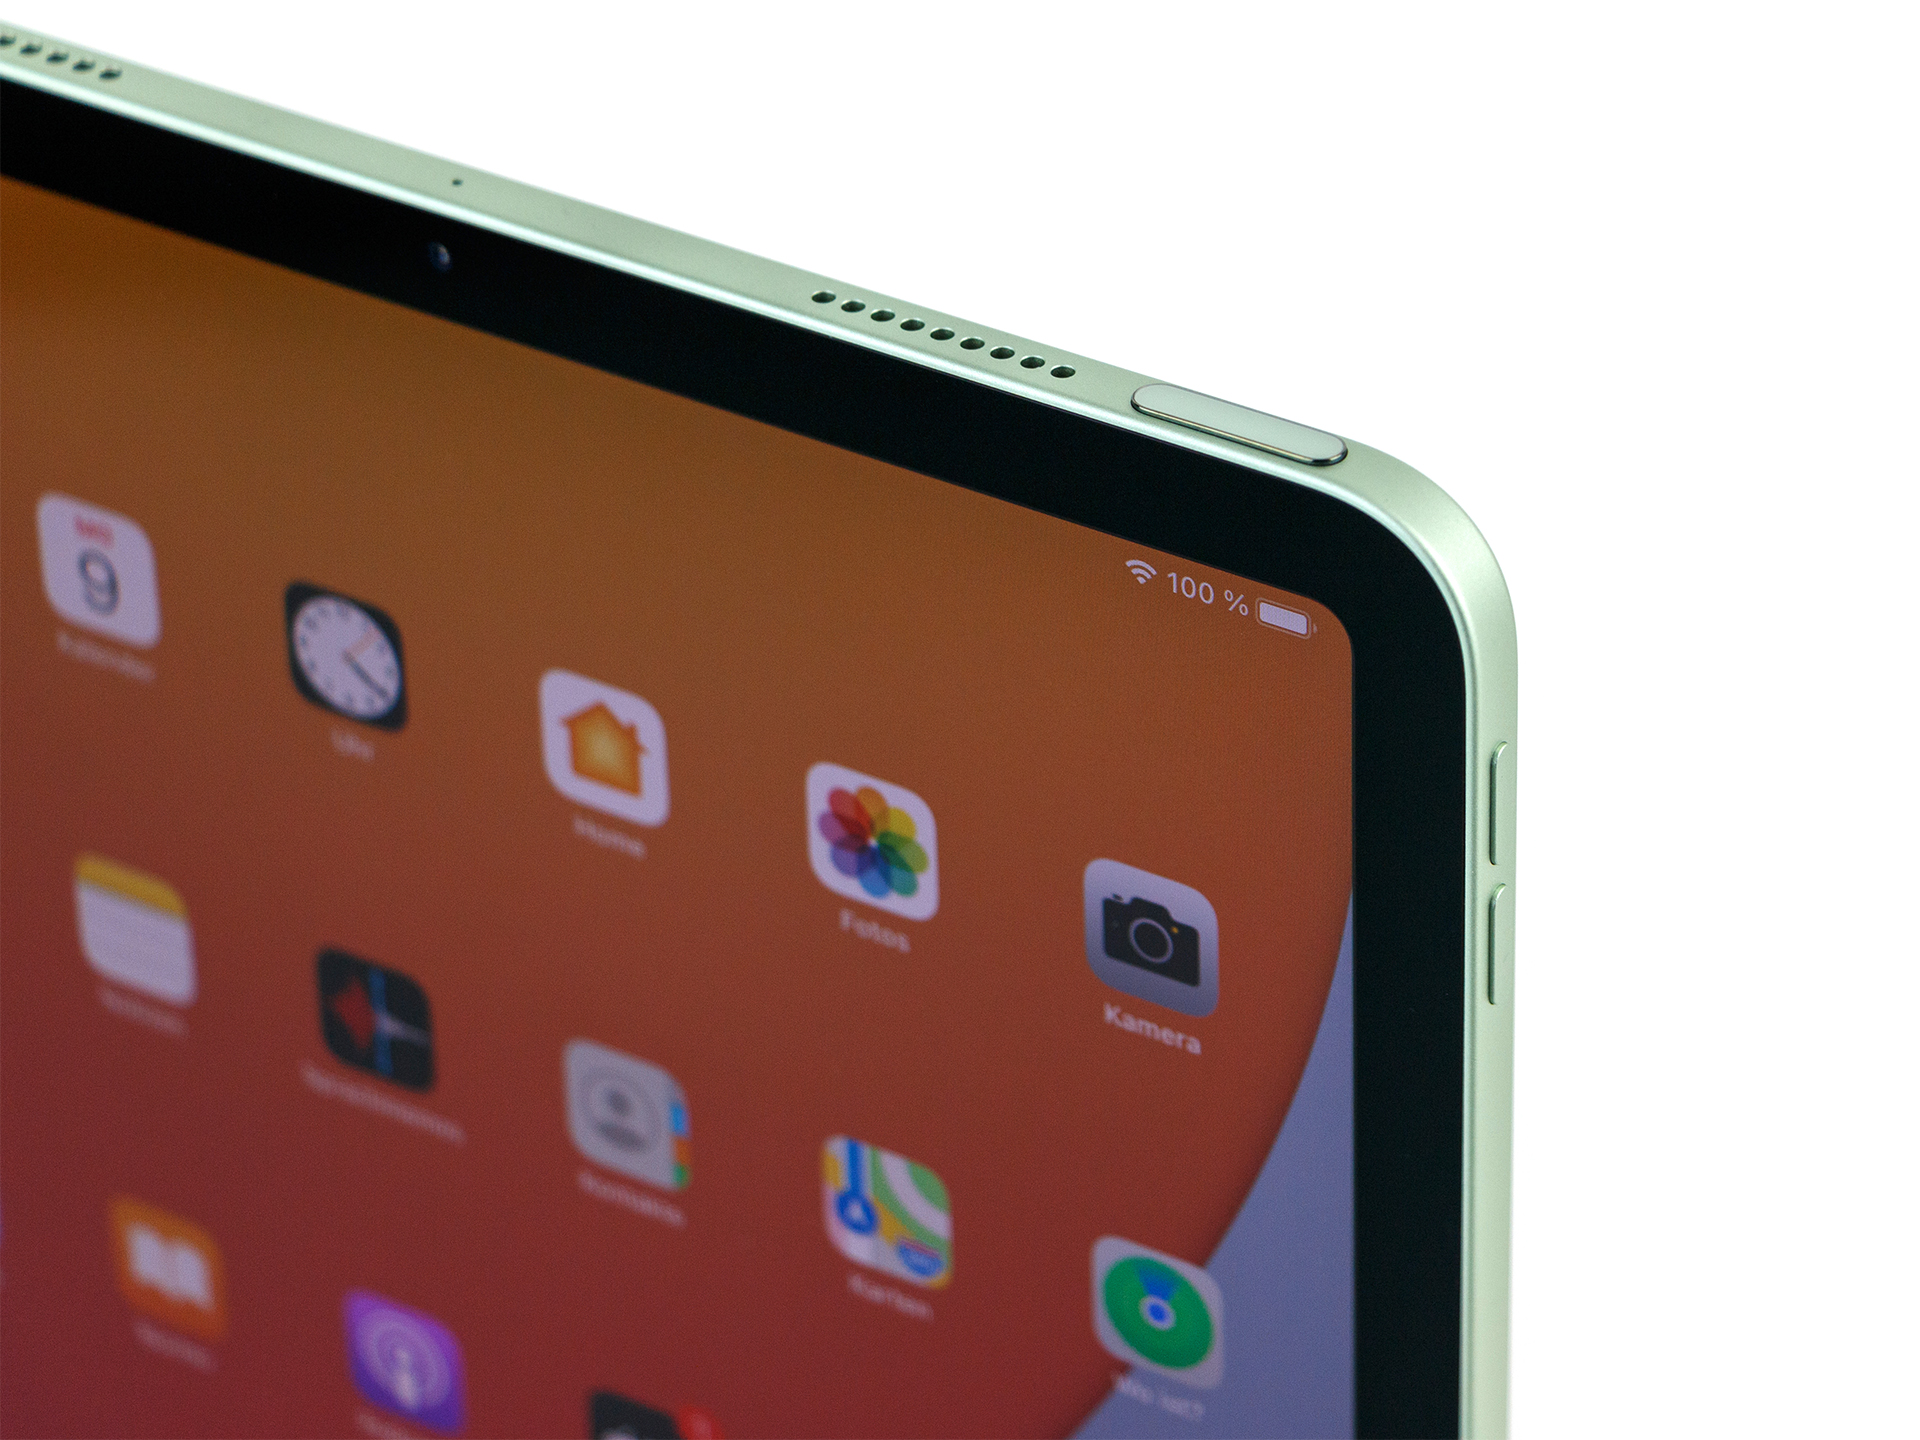
Det finns ett flertal nyheter jämfört med den föregående modellen. Utöver den senaste A14-processorn har den nu 4 GB minne, en större skärm, USB-C 3.2 och en aningen bättre kamera med stöd för inspelning av 4K-video. Touch ID är nu inbyggt i startknappen, vilket inte påverkar funktionens pålitlighet på något sätt.
iPad Pro är bättre och har mer RAM, en kraftigare SoC och en 120 Hz-skärm, så det är inte alls tänkt att iPad Air ska ersätta den, men Apple har valt lite andra skiljelinjer. Men för många är iPad Air 4 inte bara ett billigare alternativ utan också ett mer logiskt sådant. Den har mer än tillräckligt med prestanda för alla områden och passar till och med bra för att redigera bilder och video.
Apple iPad Air 4 2020
- 11/13/2020 v7 (old)
Daniel Schmidt
Price comparison
